Submitted:
07 July 2025
Posted:
07 July 2025
You are already at the latest version
Abstract
(1) Background: Groundwater quality in tropical wetlands remains poorly studied. Los Pantanos de Villa, a key wetland located on Peru's desert coast, is recognized as a Protected Natural Area and a Ramsar site that faces ongoing threats. This study aimed to assess groundwater contamination in the wetland using microbiological (Escherichia coli, total and fecal coliforms) and physicochemical parameters, as well as water quality indices (WQIs); (2) Methods: In 2023 annual sampling was conducted at 12 locations (4 test pits and 8 piezometers), during the high recharge season (March) and low recharge season (September). Parameters were compared to national (Peru) and international (U.S.) standards. Two WQIs—the Canadian Council of the Ministry of the Environment (CCME) and the National Sanitation Foundation (NSF)—were applied; (3) Results: Microbiological contamination levels were dangerously high at all sampling sites. Physicochemical parameters exceeded permissible limits in at least one season. The CCME-WQI classified 100% of samples as having poor quality, and the NSF-WQI classified 75% as poor and 25% as medium quality; (4) Conclusions: Groundwater in the Pantanos de Villa wetland exceeds national and international contamination thresholds. Microbiological pollution is particularly concerning. WQIs confirm a degraded state.
Keywords:
protected natural area
; groundwater
; water quality
; wetland
1. Introduction
Wetlands are the most productive ecosystems in the world and host an important diversity of species [1]. They provide important ecosystem services and carbon sinks, which are relevant for mitigating the effects of climate change, improving water quality, and conserving biodiversity [2,3]. Despite this, wetlands are often subject to anthropogenic impacts, such as urbanization, agriculture and drainage [2,4], which directly affect the quality of water resources and cause their degradation.
At the Latin American level, studies on water resources tend to focus on surface water sources, such as rivers and lakes, and groundwater studies are not given the same priority [5]. Likewise, due to geographical diversity, these studies are complicated to carry out in certain areas [6]. In Peru, coastal wetlands represent a reservoir of freshwater and a constant recharge of aquifers [5,7], and these environments form a biological corridor and host very important biodiversity [8].
A notable wetland within the study area is the Pantanos de Villa Natural Protected Area, which was incorporated into the National System of Protected Areas by the Peruvian state in 2006 as a wildlife refuge [9]. In a similar manner, the urban ecosystem in question is overseen by the Municipal Authority of Los Pantanos de Villa (PROHVILLA). The international importance of this wetland has been underscored by its designation as a RAMSAR site in 1997 [10]. However, this wetland is located within the metropolitan area of Lima and is surrounded by urban areas. Consequently, it is subject to persistent anthropogenic pressure, which can have detrimental effects on water resources and the ecosystem. The present study evaluated the groundwater quality of the Pantanos de Villa NPA, considering both microbiological and physicochemical indicators.
2. Materials and Methods
2.1. Study Area
This research was conducted in the coastal wetland of Los Pantanos de Villa (12°12 'S, 076°59'W) and its buffer zone (Figure 1) located in Lima, Peru. This wetland was classified as a Natural Protected Area (NPA) by Resolution No. 358-2001-INRENA. The buffer zone is characterized by being adjacent to the NPA and being under special protection (RP N°169-2016-SERNANP). The wetland has an area of 263.27 ha [11].
The wetland is characterized as a hydromorphic ecosystem and its importance is due to its biological diversity and water resources, as well as its high scientific and cultural value [12]. In terms of geomorphology, the wetland has a minimum altitude of 1 meters above sea level (m.a.s.l.) and a maximum altitude of 5 m.a.s.l., since it is in the lower part of the hydrogeographic basin of the Rimac River valley. The climate is typical of the Peruvian coastal desert, with average annual temperatures between 17.2 and 23.0 °C, relative humidity between 84.4 and 99%, and low rainfall. The area surrounding the wetland is used for urban, industrial and service activities [10,13].
2.2. Sample Method
The sample set included 12 sampling points, 6 of which were situated within the wetland environment and 6 in the surrounding area. The sampling points comprised 4 pits and 8 piezometers, as illustrated in Figure 1. The coding was based on the hydrographic network formed by the piezometers owned by PROHVILLA. Sampling was conducted in two stations in the year 2022, considering that a higher water recharge occurs in the month of March (summer) and there is lower water recharge in September (winter) [14]. The U.S. Geological Survey methodology was employed in the National Field Manual for the purpose of groundwater quality sampling The National Field Manual of the U.S. Geological Survey methodology was employed for groundwater quality sampling [15].
The collection of groundwater samples was executed through the implementation of two distinct methodologies. The initial approach entailed the utilization of the PROHVILLA operational piezometers. The samples were extracted using a bailer (Figure 2). This method involves extracting the sample three times to minimize disturbance of the water column [16]. The second phase of the experiment involved the construction of 4 pits, with dimensions of approximately 1 x 1 x 1 meters. Two of these pits were positioned within the confines of the wetland, while the remaining two were situated in the external environment. Subsequent to the creation of the test pits, with the prescribed depth, a bailer was utilized to extract the groundwater sample. After extraction of the sample, the extracted soil was deposited at the place of origin [15].
To determine groundwater quality, an in situ evaluation of physicochemical parameters, such as pH, total suspended solids (TSS), electrical conductivity (EC) and temperature, was first performed using a Hanna Model HI 98311 Multiparameter. An ex situ evaluation was then performed for microbiological (Escherichia coli, total coliforms and fecal coliforms) and physicochemical parameters (total phosphorus, nitrates NO3-, chemical oxygen demand [COD], biochemical oxygen demand [BOD] oils and fats). These samples were sent to the laboratory R-LAB S.A.C., certified by INACAL (Lima-Peru).
The parameters were analyzed by comparison with the Environmental Water Quality Standards of the Peruvian Regulations, hereinafter referred to as EQS - Water, of category 4: Conservation of the Aquatic Environment, subcategory E1: Lagoons and lakes, which includes natural surface water bodies that are part of fragile ecosystems, NPAs and/or buffer zones, and that have characteristics that require an additional level of protection [17]. This national regulation was used as a reference, as Peru does not have a specific regulation for groundwater. Likewise, it was decided to use a complementary international standard from the United States, which is the Groundwater Quality Standards 15A NCAC 2L .0202. [18].
2.3. Water Quality Index
In order to comprehensively assess the groundwater quality, the calculation of the Water Quality Index (WQI) of Peru was carried out by the National Water Authority [19]. This index follows the methodology of the WQI of the Canadian Council of the Ministry of the Environment (CCME). The purpose of establishing the methodology for calculating the WQI is to express the condition or state of water quality based on established ranges.
The index establishes a rating by comparing the monitoring results that do not meet the Environmental Quality Standards (EQS), the number of parameters that exceed EQS-Water and the magnitude of the exceedance [20]. The established rating ranges from poor to excellent (Table 1).
The other WQI used for the evaluation was that established by the National Sanitation Foundation (NSF) of the United States. This index was calculated using the ICATEST software, in which the parameter data are entered, and the index is calculated based on the weighting factor generated by the software. It also has its own interpretation with established colors and values (Table 2).
2.4. Data Analysis
Statistical analysis was performed considering two groups: the buffer zone (outside the wetland) versus the interior of the Pantanos de Villa wetland, as well as the winter versus the summer season. The variable analyzed was the quality of the groundwater, considering microbiological and physicochemical parameters. To verify the normal distribution of the data, the Shapiro-Wilk test was performed, which was not fulfilled for the physicochemical and microbiological data, and thus, the non-parametric Mann-Whitney U test was applied. IBM SPSS Statistics v.26 software was used for all the data analyses.
3. Results
3.1. Physicochemical Parameters
The pH value obtained was an average of 7.29 (summer - winter), with values within the ranges of the EQS - Water and the international standards for groundwater in the United States [18]. As for temperature, the values were also obtained according to Peruvian standards, with an average of 21.49°C (ranging from 19.80 - 24.20°C). Regarding oils and fats, an average (summer - winter) of 16.88 mg/L was obtained (ranging from <1.6 to 30.6 mg/L). Three sampling points outside the wetland (P52, P48 and C4) and two points inside the wetland (C2 and P25) exceeded the limits of the national regulations.
Another parameter evaluated was total phosphorus, with which 75% of the points evaluated inside and outside the wetland exceed the EQS - Water. Of the 25% that did not exceed the regulations, one point was located inside the NPA (C3V) and two were outside (C4V and P52I) (Figure 3 a and b). For the nitrate parameter, 50% of the sampling points inside the NPA exceeded the national standard of 13 mg/L (Peru) and the international standard of 10 mg/L (USA), while outside the wetland, 66.6% of the total exceeded the standard (Figure 3 c and d). Regarding EC, 100% of the points exceeded the national regulations, both inside and outside the NPA. This is due to the characteristics of the location of the wetland, which is a coastal ecosystem adjacent to the sea.
When analyzing the COD parameter, all the values exceeded the EQS - water. The sampling point with the highest value (C2) was 1853.3 mg/L located inside the wetland and near the Genesis Lagoon (Figure 4 a and b). For TSS, all the points exceeded national and international (U.S.) regulations. The sampling point with the highest concentration was C1, located within the wetland adjacent to the Marvilla Lagoon (Figure 4 c and d). The BOD results showed that all sampling points, inside and outside the NPA in the summer and winter seasons, exceeded the EQS water value, and the highest value was found inside the NPA (C2V) in the summer season (966 mg/L). This point is located adjacent to the Genesis Lagoon (Figure 4 e and f).
3.2. Microbiological Parameters
For total coliforms, a value of 50 most probable number per 100 milliliters (MPN/100 mL) is established for EQS-water (Peru) and 100 MPN/100 mL for U.S. standards. The analysis showed that all the groundwater points evaluated in the wetland, except for one (P25V), exceeded the national and international environmental quality standards. A particular case was the summer sampling point (C2V), located within the NPA, where the highest value of 13,000.000 MPN/100 mL was found (Figure 5). Similarly, the behavior of the two outlier points with a higher concentration was observed.
According to the results obtained for fecal coliforms, within the NPA, 42% of the points evaluated exceeded the EQS - Water and 75% exceeded the international standards (U.S.). Outside the NPA, 50% of the points evaluated exceeded the national standard and 83% exceeded the international standard (U.S.). In the case of E. coli, 67% of the total points evaluated within the NPA exceeded the EQS - Water. One of the points (P25) that did not exceed the standards was found in both seasons with values of 1.8 MPN/100 mL (Figure 6). Outside the NPA, all of the points evaluated exceed the national standard.
Likewise, analysis according to the direction of the water flow was carried out, from the starting zone, outside the wetland, where the water enters the wetland, and where the watercourse reaches the Pacific Ocean. The highest total coliform values were found inside the NPA (Figure 7), with these concentrations decreasing at points P25 and P50. Similarly, the highest concentrations of fecal coliforms were observed within the NPA at points C1 and C2. Finally, the highest and lowest concentrations of E. coli were recorded within the NPA. This shows the absence of a defined pattern in the microbiological contamination of the watercourse, although sampling points with critical values were identified at C1 and C2, within the NPA, where the microbiological parameters analyzed exceeded both national and international water quality standards.
Statistical analysis of the data, performed using the non-parametric Mann-Whitney U test, showed that none of the physicochemical and microbiological parameters presented significant differences (p < 0.05) between the areas inside and outside the wetland. Both total and fecal coliforms and E. coli concentrations were elevated in both sites. Similarly, COD and BOD parameters showed high mean values in both areas. EC and TSS, which are expected to be elevated due to the nature of the wetland and its direct relationship with the ocean, also showed elevated levels inside and outside. The lack of significant differences suggests that the contamination is similar inside and outside the NPA.
The same test was carried out to evaluate the physicochemical and microbiological parameters by season (summer-winter). As a result, only the BOD showed a significant difference (p < 0.05) according to the sampling season. The average value was lower in the summer than in the winter. It should be noted that the other parameters, such as microbiological parameters, had different high, albeit non-significant, averages in both sampling seasons, (Figure 8).
3.3. Water Quality Index (Peru)
Based on the CCME, the WQI - Peru indicated "poor quality" groundwater at all 12 sampling points inside and outside the wetland, and in both the summer and winter seasons (Table 3). The water quality would did not meet the conservation objectives of Peruvian regulations and is threatened.
3.4. National Sanitation Foundation Water Quality Index (U.S.)
The result of the NSF-WQI was similar to that of the WQI-Peru, with nine sampling points presenting "poor quality", while three sampling points (C3, C4 and P25) had "medium quality". These latter three sampling points were very close to each other, have similar physical characteristics and show a better quality according to NSF-WQI compared to the other points evaluated (Table 3).
4. Discussion
4.1. Evaluation of Physicochemical Parameters
Regarding the physiochemical parameters evaluated, pH and temperature levels were found to be in accordance with both national and international standards. These findings were consistent with the results reported in the study by Puma et al. in 2022 [21]. However, oils and fats were found to exceed the national regulations (EQS-water) in three sampling points located outside the NPA. As low temperatures prevail during the winter months, water solubility is diminished. This phenomenon leads to the accumulation of substances at the surface of the water, forming layers that can exceed regulatory limits. Excessive accumulation of these substances poses a threat to aquatic ecosystems, potentially causing harm to aquatic life [22].
The total phosphorus levels measured at all sampling points exceeded the limits established by Peruvian regulations during at least one of the periods evaluated. A particularly notable increase in total phosphorus was observed during the winter months, which may be attributed to the contribution of water recharge, a factor that has been shown to favor increased concentrations of this element. Conversely, the application of detergents as a source of phosphorus outside the wetland has been demonstrated to elevate the trophic status of the water resource. This occurs because these compounds are ultimately deposited in the lagoons of the ecosystem [23]. Similarly, nitrates in groundwater typically show low concentrations; however, these levels may be increased by anthropogenic activities, such as agriculture, domestic and industrial effluents, and the use of detergents in washing activities in the channels external to the wetland [23,24].
The EC of the water samples collected from the Pantanos de Villa site exceeded the national standard at all sampling points. This is attributable to the geographical location of the Pantanos de Villa, which is a coastal wetland adjacent to the sea. The higher salinity content of the soil and water at this location is reflected in the results [25]. This has been documented in a comparable manner in the coastal wetland of Ventanilla (Lima), where values that surpass the EQS - Water benchmark have been observed [26].
With regard to the BOD, all the sampling points exceeded the Peruvian standard at both stations. The available organic matter is a factor that generates an increase in BOD concentrations. The reason for this is that high concentrations require more oxygen for its decomposition, thereby increasing BOD [2]. With respect to COD, point C2, situated in proximity to the Genesis lagoon, exhibited the most elevated value (1,853.3 mg/L). These values exhibited a substantial increase in comparison with the study conducted in the wetland by Puma et al. in 2022 [21].
The TSS concentrations at all the sampling points exceeded the established standards, exhibiting a direct correlation with EC. The relationship between EC and TSS concentrations is such that an increase in EC results in an increase in TSS concentration. This can be attributed to the presence of salts and minerals in the groundwater, which is a common occurrence in arid regions [27]. In the Poza la Arenilla Wetland (Lima), the maximum surface water value recorded was 171.2 mg/L [23], whereas within the NPA, Pantanos de Villa exhibited a maximum value of 7335.3 mg/L. This increase could be attributed to the filtration of waste from homes with silos and horse feces, which can raise the levels of solids in the water [28].
4.2. Evaluation of Microbiological Parameters
The elevated levels of total coliforms observed suggest a nutrient-rich source that sustains the bacterial community. This may be associated with the proximity of residences to wetland channels and the absence of septic system utilization, which has a detrimental effect on groundwater quality [29]. Regarding fecal coliforms, 75% of the sampling points did not comply with the established regulations, with the highest recorded values found in proximity to the Marvilla Lagoon, where avian and mammalian feces may contribute to their proliferation [30].
Concurrently, 58% of the points presented levels exceeding the established limits for E. coli, a bacterium that is characteristic of the intestinal microflora and can be transported from the soil surface to the groundwater [21]. The elevated levels of coliform bacteria observed in the vicinity of lagoons (C1 and C2) can be attributed to the presence of wetland gulls. It has been reported that these birds excrete substantial quantities of coliform bacteria in their feces, thereby serving as a significant source of contamination for surface and groundwater bodies [31]. Furthermore, in certain locations, such as C1, the presence of equines has been observed to potentially impact water quality. This is attributed to the fact that equine feces have been found to contribute to the presence of total and fecal coliforms in the soil and water table [32]. As posited by Solarte et al. in 2006, these three microbiological parameters are interrelated in nature, as they are derived from human and animal feces, as well as from wastewater and water bodies exposed to fecal contamination [33].
4.3. Water Quality Indexes (WQI)
The findings of this study indicate the presence of a critical situation in the Pantanos de Villa wetlands, with the Peruvian WQI rating groundwater quality as "Poor" at all the points evaluated. In contrast, the United States WQI (NSF) classified 75% of the points evaluated as "Poor" and the remaining points as "Medium. The findings, both within and outside the NPA, underscore the deterioration of groundwater quality and its implications for the ecosystem. Conversely, surface water quality in Laguna Marvilla was classified as "Regular," exhibiting a lesser degree of impact from horse excreta and the biological activity of the ecosystem [34]. At the regional level, studies in the Santay wetland (Guayaquil, Ecuador) within a protected area indicated between "good" and "acceptable" water quality [35], suggesting that concentrations of total coliforms, fecal coliforms, and E. coli have a significant impact on WQIs. Consequently, the variability in water quality can be influenced by both anthropogenic factors and natural processes, underscoring the necessity of monitoring and management [36].
Author Contributions
Conceptualization, V.M., T.P and D.R.; methodology, V.M and T.P.; software, V.M. and T.P.; validation, V.M., T.P. and D.R.; formal analysis, V.M. and T.P.; investigation, V.M. and T.P.; resources, V.M. and T.P.; data curation, V.M.; writing—original draft preparation, V.M.; writing—review and editing, V.M.; visualization, V.M.; supervision, D.R.; project administration, V.M., T.P. and D.R.; funding acquisition, V.M. and T.P. All authors have read and agreed to the published version of the manuscript.
Funding
This research was funded by Beca Cabieses contract 010-DGIDI-CIENTIFICA-2022. APC was funded by Universidad Científica del Sur, Lima, Perú.
Data Availability Statement
All relevant data are contained within this paper.
Conflicts of Interest
The authors declare no conflicts of interest.
Abbreviations
The following abbreviations are used in this manuscript:
| NPA | Natural Protected Area |
| TSS | Total Suspended Solids |
| EC | Electrical Conductivity |
| COD | Chemical Oxygen Demand |
| BOD | Biochemical Oxygen Demand |
| EQS | Environmental Quality Standards |
| m.a.s.l. | meters above sea level |
| PROHVILLA | Municipal Authority of Los Pantanos de Villa |
| WQI | Water Quality Index |
| NSF | National Sanitation Foundation |
| CCME | Canadian Council of the Ministry of the Environment |
References
- López-Saut, E.; Rodríguez-Estrella, R.; Chávez-Ramírez, F. ¿Son las grullas indicadoras de la riqueza de especies de aves acuáticas en humedales en el Altiplano Mexicano? Acta Zool. Mex. 2014, 30(2). [CrossRef]
- Mitsch, W. J.; Gosselink, J. G. Wetlands, 5th ed.; John Wiley & Sons, Inc.: Hoboken, 2015.
- Ramsar. Perspectiva Mundial sobre los Humedales: Estado de los Humedales del Mundo y sus Servicios a las Personas; Secretaría de la Convención de Ramsar: Gland, Suiza, 2018. Available online: ramsar_gwo_spanish_web.pdf.
- Davis, S. Wetland Plants: Biology and Ecology. Ecol. Eng. 2003, 19 (5), 351–352. [CrossRef]
- Aponte, H. Humedales de la Costa Central del Perú: Un Diagnóstico de los Humedales de Santa Rosa, Laguna El Paraíso y Albufera de Medio Mundo [PDF]; 2017.
- Soto, R. Groundwater Resources in the Amazon Basin: A Survey in Colombia, Bolivia, and Peru. Water 2018, 10 (7), 840.
- Rodríguez Vásquez, M. I. Variación de Humedales Costeros e Irrigaciones Agrícolas: El Caso de la Albúfera de Medio Mundo y el Área Agrícola de Huaura; Tesis de Licenciatura, Pontificia Universidad Católica del Perú, 2017.
- Quiñonez, A. S.; Hernández, F. Uso de hábitat y estado de conservación de las aves en el humedal El Paraíso, Lima, Perú. Rev. Peru. Biol. 2017, 24 (2). [CrossRef]
- Servicio Nacional de Áreas Naturales Protegidas por el Estado. Prevención, tratamiento y monitoreo de conflictos socioambientales en áreas naturales protegidas de administración nacional; 2016. Available online: https://spda.org.pe/wp-content/uploads/2024/02/Prevencion-tratamiento-y-monitoreo-de-conflictos-en-ANP-Baja.pdf.
- Ramsar. Los Pantanos de Villa. Ficha informativa Ramsar; 2023. Available online: chrome-extension://efaidnbmnnnibpcajpcglclefindmkaj/https://rsis.ramsar.org/RISapp/files/RISrep/PE884RIS_2307_es.pdf.
- Municipalidad Metropolitana de Lima. Por el que se aprueba el plan de prevención y reducción de riesgos de desastres de los Pantanos de Villa 2022–2024; 2022.
- INGEMMET. Evaluación, ordenación y Plan de Manejo Ambiental para el desarrollo integral de los Pantanos de Villa; 1991.
- Arana, L. L. Refugio de Vida Silvestre los Pantanos de Villa como socioecosistema desde una metodología socioeco-lógica. Rev. Inst. Investig. Fac. Minas Metal. Cienc. Geogr. 2022, 25 (49). [CrossRef]
- Instituto Geológico, Minero y Metalúrgico - INGEMMET. Estudio hidrogeológico del refugio de vida silvestre de los Pantanos de Villa (RVSPV) Chorrillos - Lima; INGEMMET: Lima, 2019.
- United States Geological Survey. National Field Manual for the Collection of Water-Quality Data: Collection of Water Samples; In Techniques of Water-Resources Investigations; USGS: Reston, VA, 2006.
- Gomo, M.; Vermeulen, D.; Lourens, P. Groundwater Sampling: Flow-Through Bailer Passive Method Versus Conventional Purge Method. Nat. Resour. Res. 2018, 27 (1). [CrossRef]
- Ministerio del Ambiente. Decreto Supremo N.° 004-2017-MINAM, que aprueba los Estándares de Calidad Ambiental (ECA) para Agua; Ministerio del Ambiente: Lima, 2017.
- North Carolina Environmental Quality. Groundwater Quality Standards; North Carolina Environmental Quality: 2022.
- Autoridad Nacional del Agua. Metodología para la Determinación del Índice de Calidad de Agua ICA-PE, Aplicado a los Cuerpos de Agua Continentales Superficiales; Autoridad Nacional del Agua: 2018..
- Canadian Council of Ministers of the Environment. Canadian Water Quality Guidelines for the Protection of Aquatic Life: CCME Water Quality; Canadian Council of Ministers of the Environment: 2001.
- Puma-Quispe, A.; Zavaleta-Muñoz, P. J.; Palma-Ventura, T. F.; García-Medina, V. M. Evaluación de la calidad del agua subterránea en un sector de la Zona de Reglamentación Especial de Los Pantanos de Villa. Rev. South Sustainability 2022, 3 (2). [CrossRef]
- Vallejo, A. Niveles de contaminación en el litoral sur de la Bahía de Talara por aceites-grasas y metales pesados. [Tesis para optar el título de Máster en Gestión y Auditorías Ambientales, Facultad de Ingeniería, Universidad de Piura, Piura, Perú]. 2010.
- Sánchez, A. H. S. Restauración de los canales eutrofizados de abastecimiento de agua a los Pantanos de Villa. [Tesis de Doctorado, Pontificia Universidad Católica del Perú]. 2020.
- Álvarez, C. C. Determinación analítica de detergentes en las aguas de los Pantanos de Villa. [Tesis para optar el título de Licenciado en Química, Pontificia Universidad Católica del Perú], 2016.
- Cabrejos Bermejo, J. R. Evoluciones del nivel estático y conductividad eléctrica del agua subterránea del valle Chancay-Lambayeque, periodo 1996–2014. TZHOECOEN 2018, 10 (1), 148–162. [CrossRef]
- Canales Cuadros, H.; Cabrera Carranza, C.; Arana Maestre, J. Macroinvertebrados acuáticos y calidad de agua en el Área de Conservación Regional Humedales de Ventanilla, Callao. Rev. Inst. Investig. Fac. Minas Metal. Cienc. Geogr. 2022, 25 (49). [CrossRef]
- Escobal Pérez, L.; Chávez Horna, G.; Roncal Rabanal, M. Efficiency of the Vegetal Tissue of Armatocereus rauhii subsp. balsasensis (F. Ritter) Ostolaza and Espostoa mirabilis F. Ritter (Cactaceae) in the Removal of Total Suspended Solids in the Water for Human Consumption of the District of Balzas - Amazonas. Arnaldoa 2020, 27 (1), 157–167. [CrossRef]
- Rivera, M. A. O.; Barahona, W. E. C.; Costales, J. H. N.; Lalvay, X. A. L.; Guachichullca, E. J. R. La Calidad de las Aguas Residuales Domésticas. Polo del Conocimiento: Revista científico-profesional 2021, 6 (3), 228–245.
- Rodríguez, R.; Retamozo-Chavez, R.; Aponte, H.; Valdivia, E. Evaluación Microbiológica de un Cuerpo de Agua del ACR Humedales de Ventanilla (Callao, Perú) y su Importancia para la Salud Pública Local. Rev. Ecol. Apl. 2017, 16 (1). [CrossRef]
- Fajardo Vidal, N. S. Evaluación de la Calidad Microbiológica y Fisicoquímica de las Aguas en el Área de Conservación Regional Humedales de Ventanilla, Región Callao, Perú; Tesis de Magíster en Ciencias Ambientales, Universidad Nacional Mayor de San Marcos, 2018.
- Lu, J.; Santo Domingo, J. W.; Lamendella, R.; Edge, T.; Hill, S. Phylogenetic Diversity and Molecular Detection of Bacteria in Gull Feces. Appl. Environ. Microbiol. 2008, 74 (13), 3969–3976. [CrossRef]
- Pauta, G.; Vázquez, G.; Abril, A.; Torres, C.; Sari, M. L.; Vera, A. P. Indicadores Bacteriológicos de Contaminación Fecal en los Ríos de Cuenca, Ecuador. Rev. Maskana 2020, 11 (2), 46–57. [CrossRef]
- Solarte, Y.; Peña, M.; Madera, C. Transmisión de Protozoarios Patógenos a Través del Agua para Consumo Humano. Colomb. Méd. 2006, 37 (1), 74–82.
- Huamán-Vilca, S.; Espinoza, M.; Paredes Vite, M.; Changanaqui, D. Evaluación de la Calidad del Agua de la Laguna Marvilla en los Pantanos de Villa (Lima, Perú). South Sustainability 2020, 1 (2). [CrossRef]
- Ramírez, C.; Ortega, L. Evaluación de la Calidad del Agua en el Humedal de Santay: Un Enfoque en Áreas Protegidas. J. Environ. Stud. 2020, 15 (4), 89–102.
- MINAGRI. Metodología para la Determinación del Índice de Calidad de Agua de los Recursos Hídricos Superficiales en el Perú ICA-PE [Archivo PDF]. 2018.
Figure 1.
Map of groundwater quality sampling points inside and outside the Pantanos de Villa wetland, Lima, Peru.
Figure 1.
Map of groundwater quality sampling points inside and outside the Pantanos de Villa wetland, Lima, Peru.
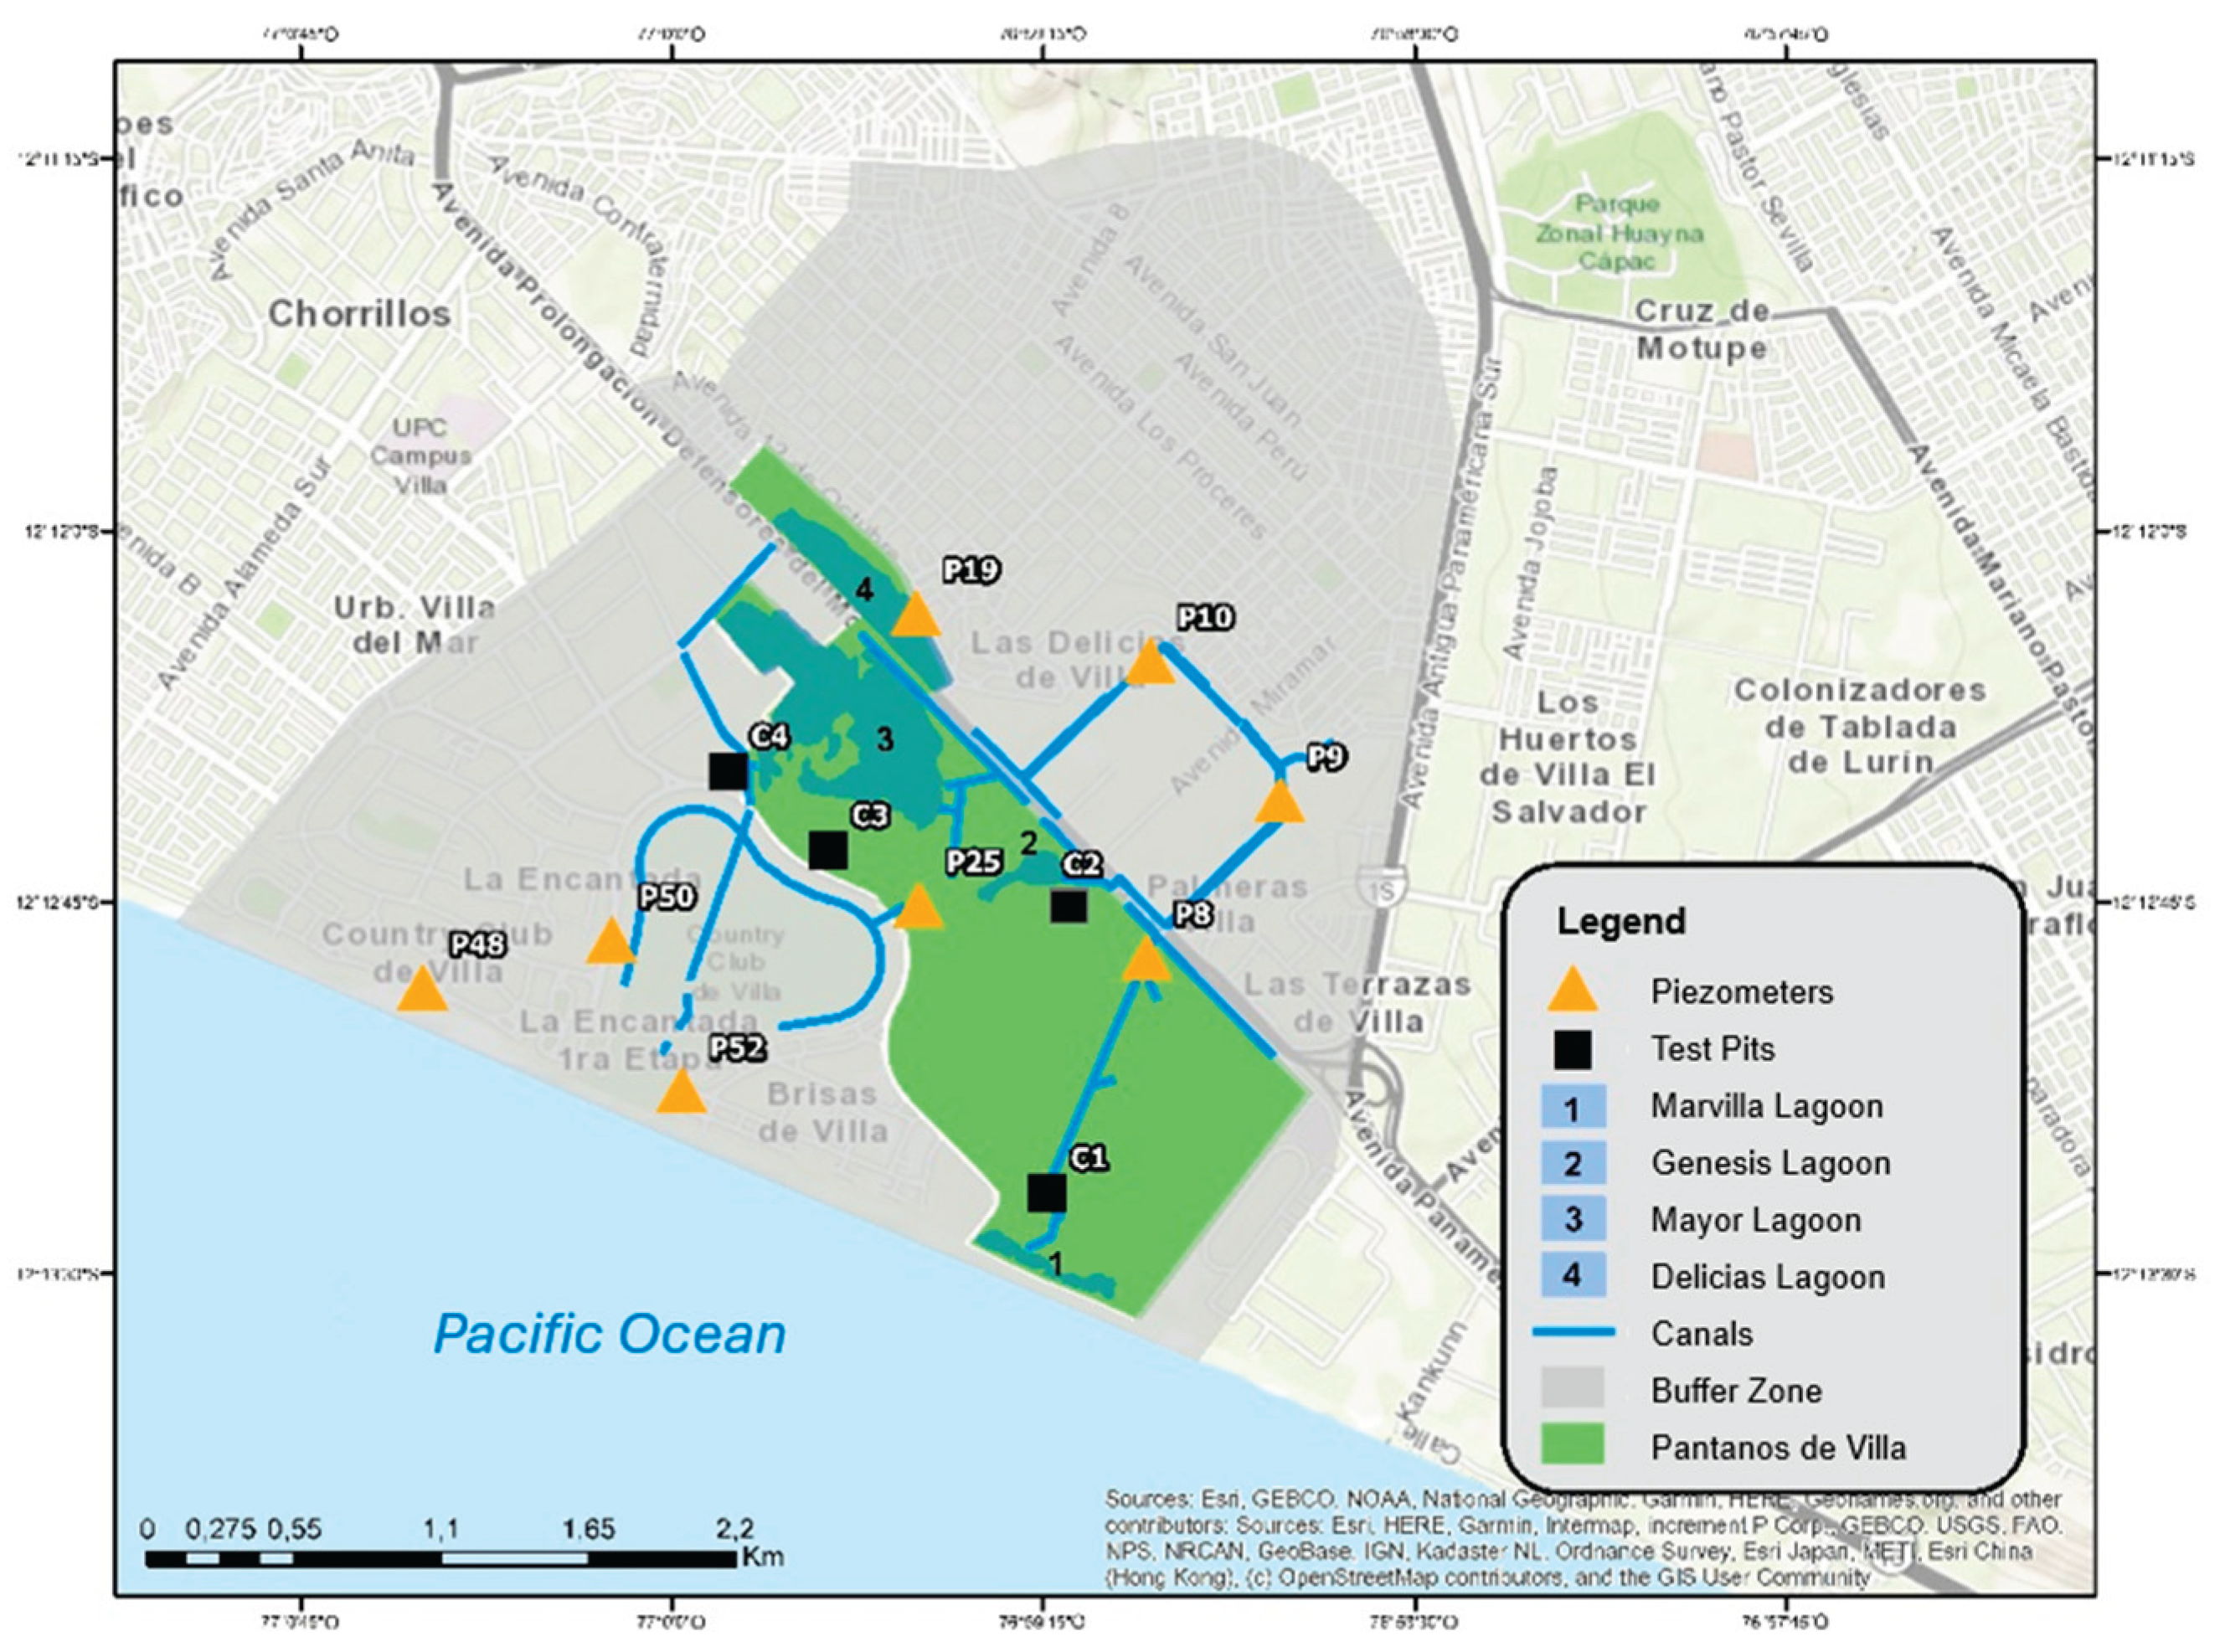
Figure 2.
Surface water of the Pantanos de Villa wetland (A) and groundwater (B).
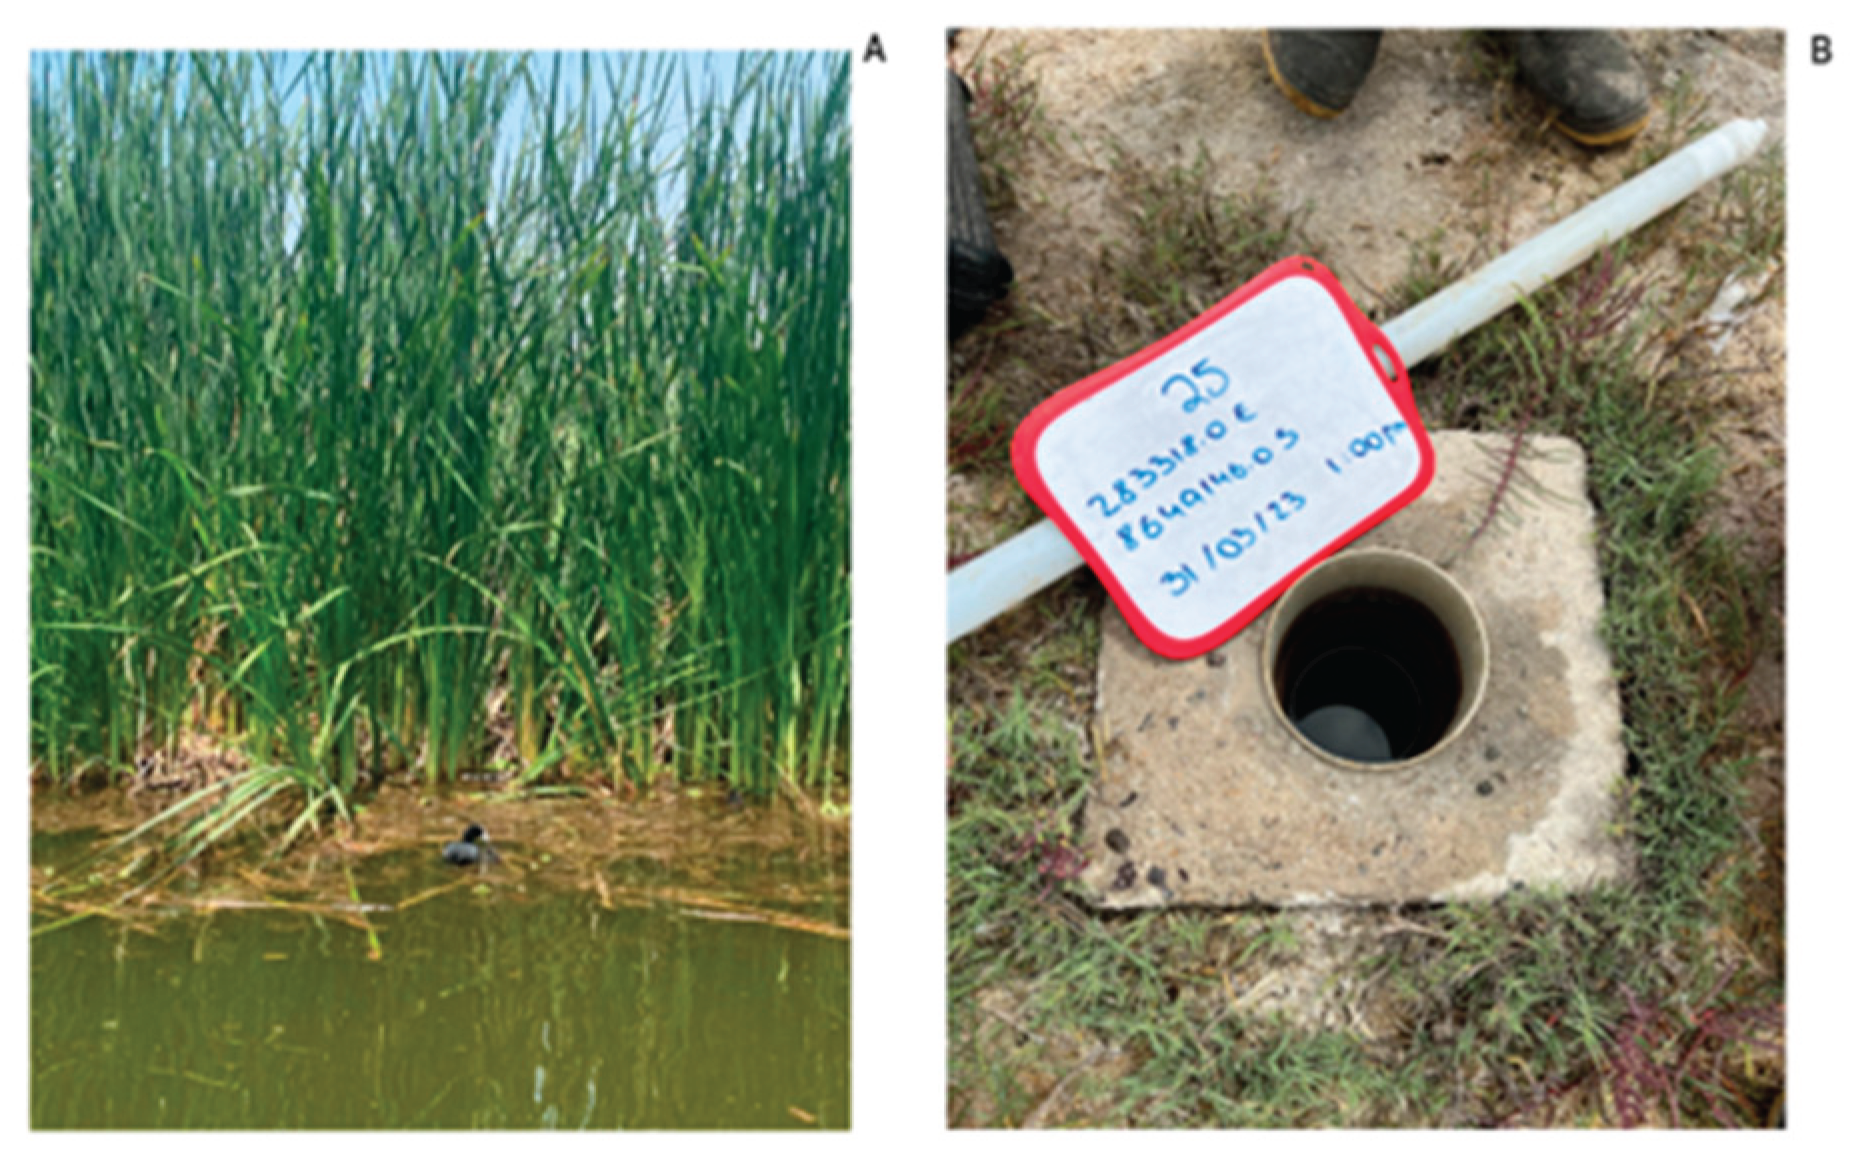
Figure 3.
Comparison of physicochemical parameters inside and outside the wetland (NPA) (a) total phosphorus (mg/L) inside the NPA and (b) outside the NPA. (c) nitrates (mg/L) inside the NPA and (d) outside the NPA.
Figure 3.
Comparison of physicochemical parameters inside and outside the wetland (NPA) (a) total phosphorus (mg/L) inside the NPA and (b) outside the NPA. (c) nitrates (mg/L) inside the NPA and (d) outside the NPA.
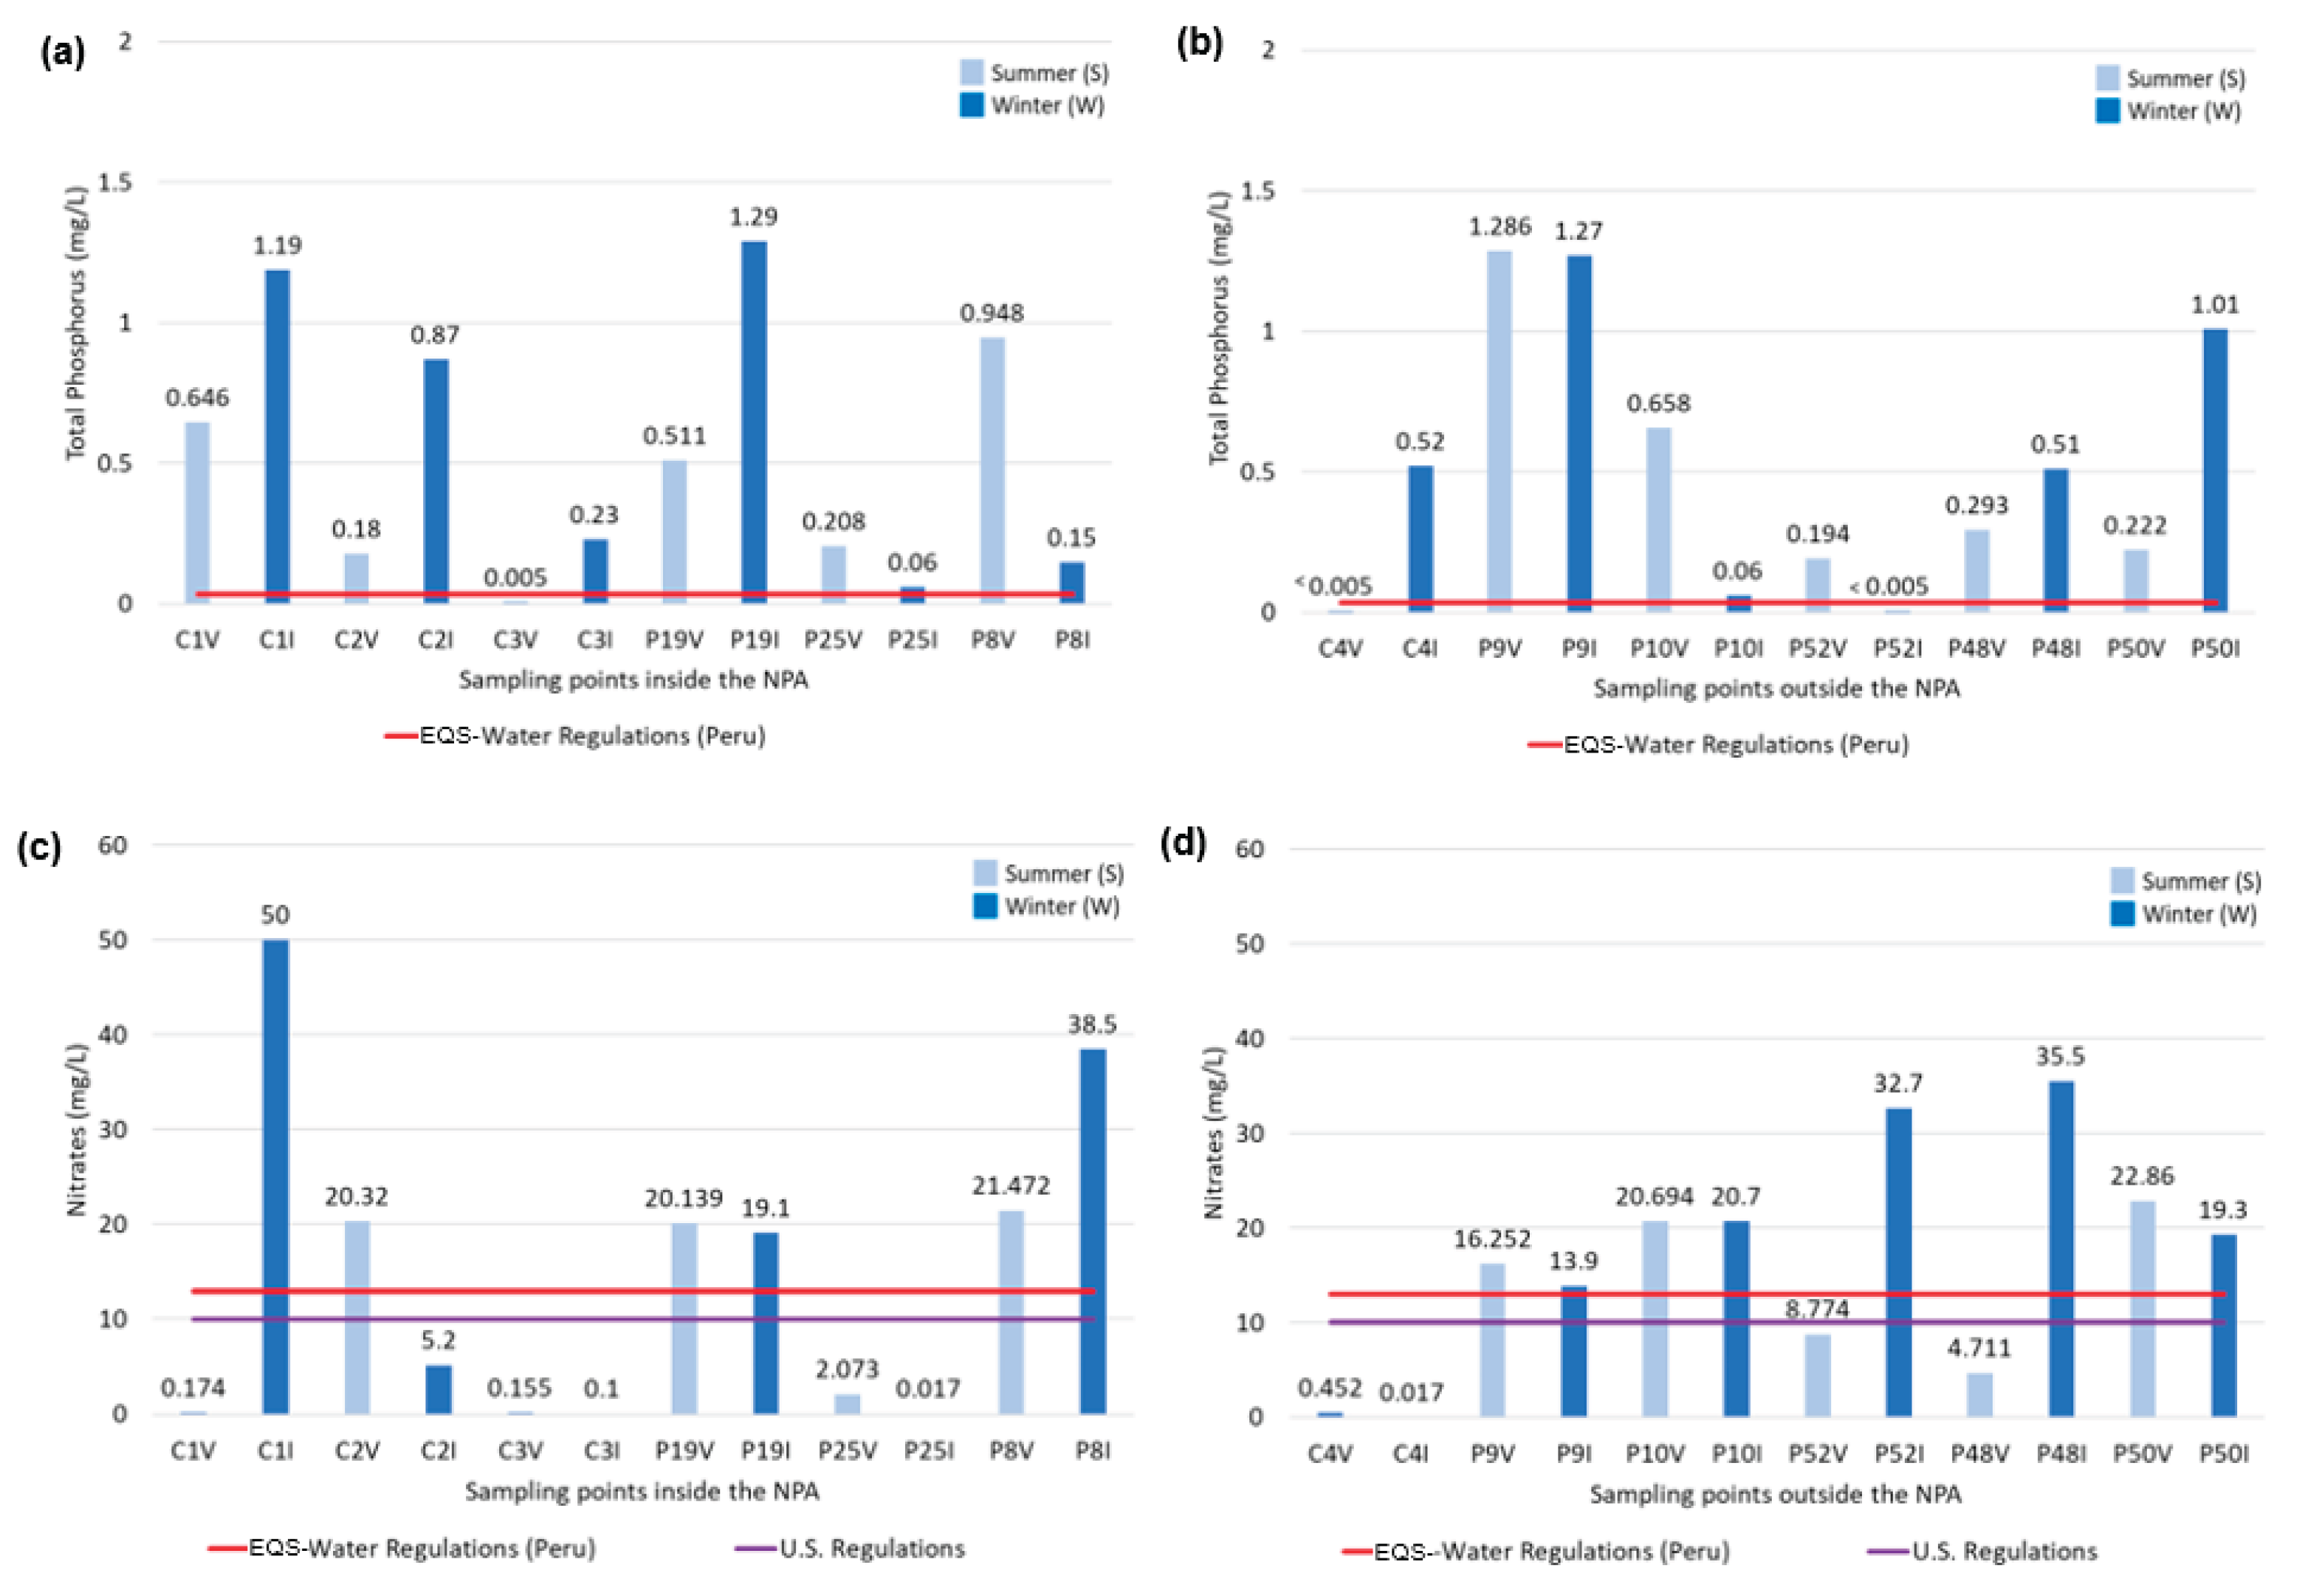
Figure 4.
Comparison of physicochemical parameters inside and outside the wetland (a) COD (mg/L) inside the NPA and (b) COD outside the NPA. (c) TSS (mg/L) inside the NPA and (d) TSS outside the NPA. (e) BOD (mg/L) inside the NPA and (f) BOD5 outside the NPA.
Figure 4.
Comparison of physicochemical parameters inside and outside the wetland (a) COD (mg/L) inside the NPA and (b) COD outside the NPA. (c) TSS (mg/L) inside the NPA and (d) TSS outside the NPA. (e) BOD (mg/L) inside the NPA and (f) BOD5 outside the NPA.
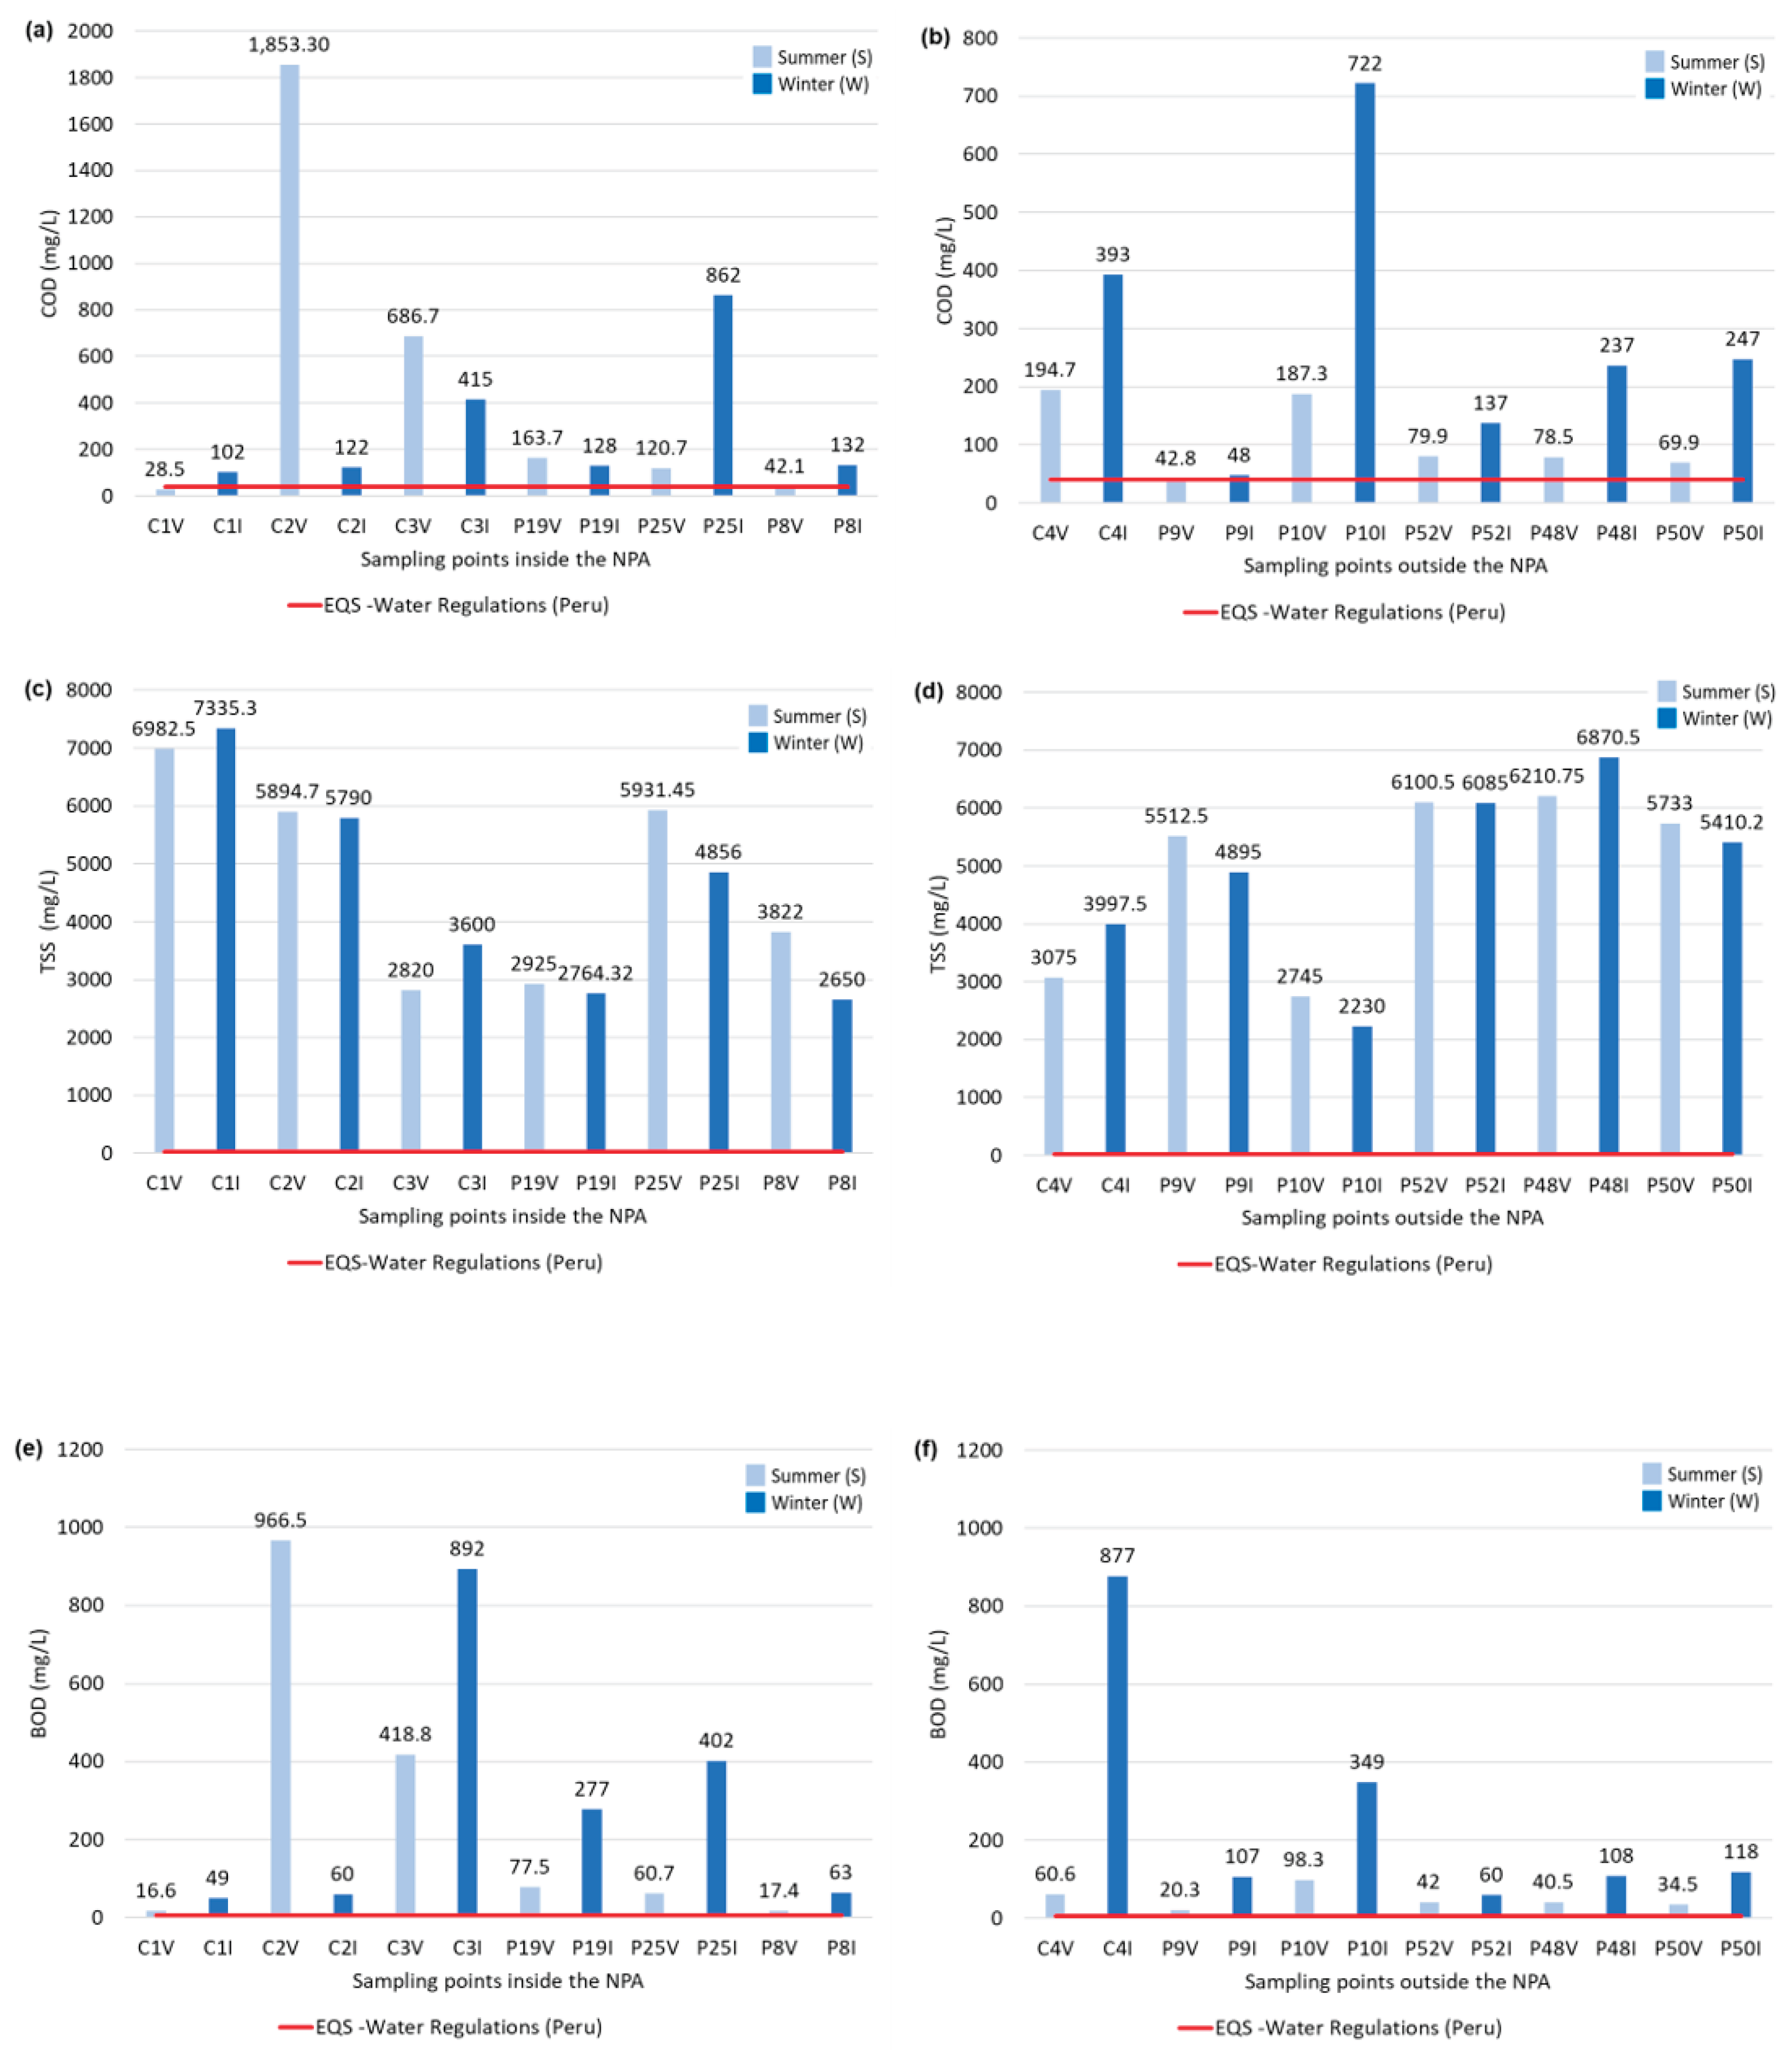
Figure 5.
Total coliforms evaluated in groundwater during the summer and winter of 2023, inside and outside the Pantanos de Villa Wetland.
Figure 5.
Total coliforms evaluated in groundwater during the summer and winter of 2023, inside and outside the Pantanos de Villa Wetland.
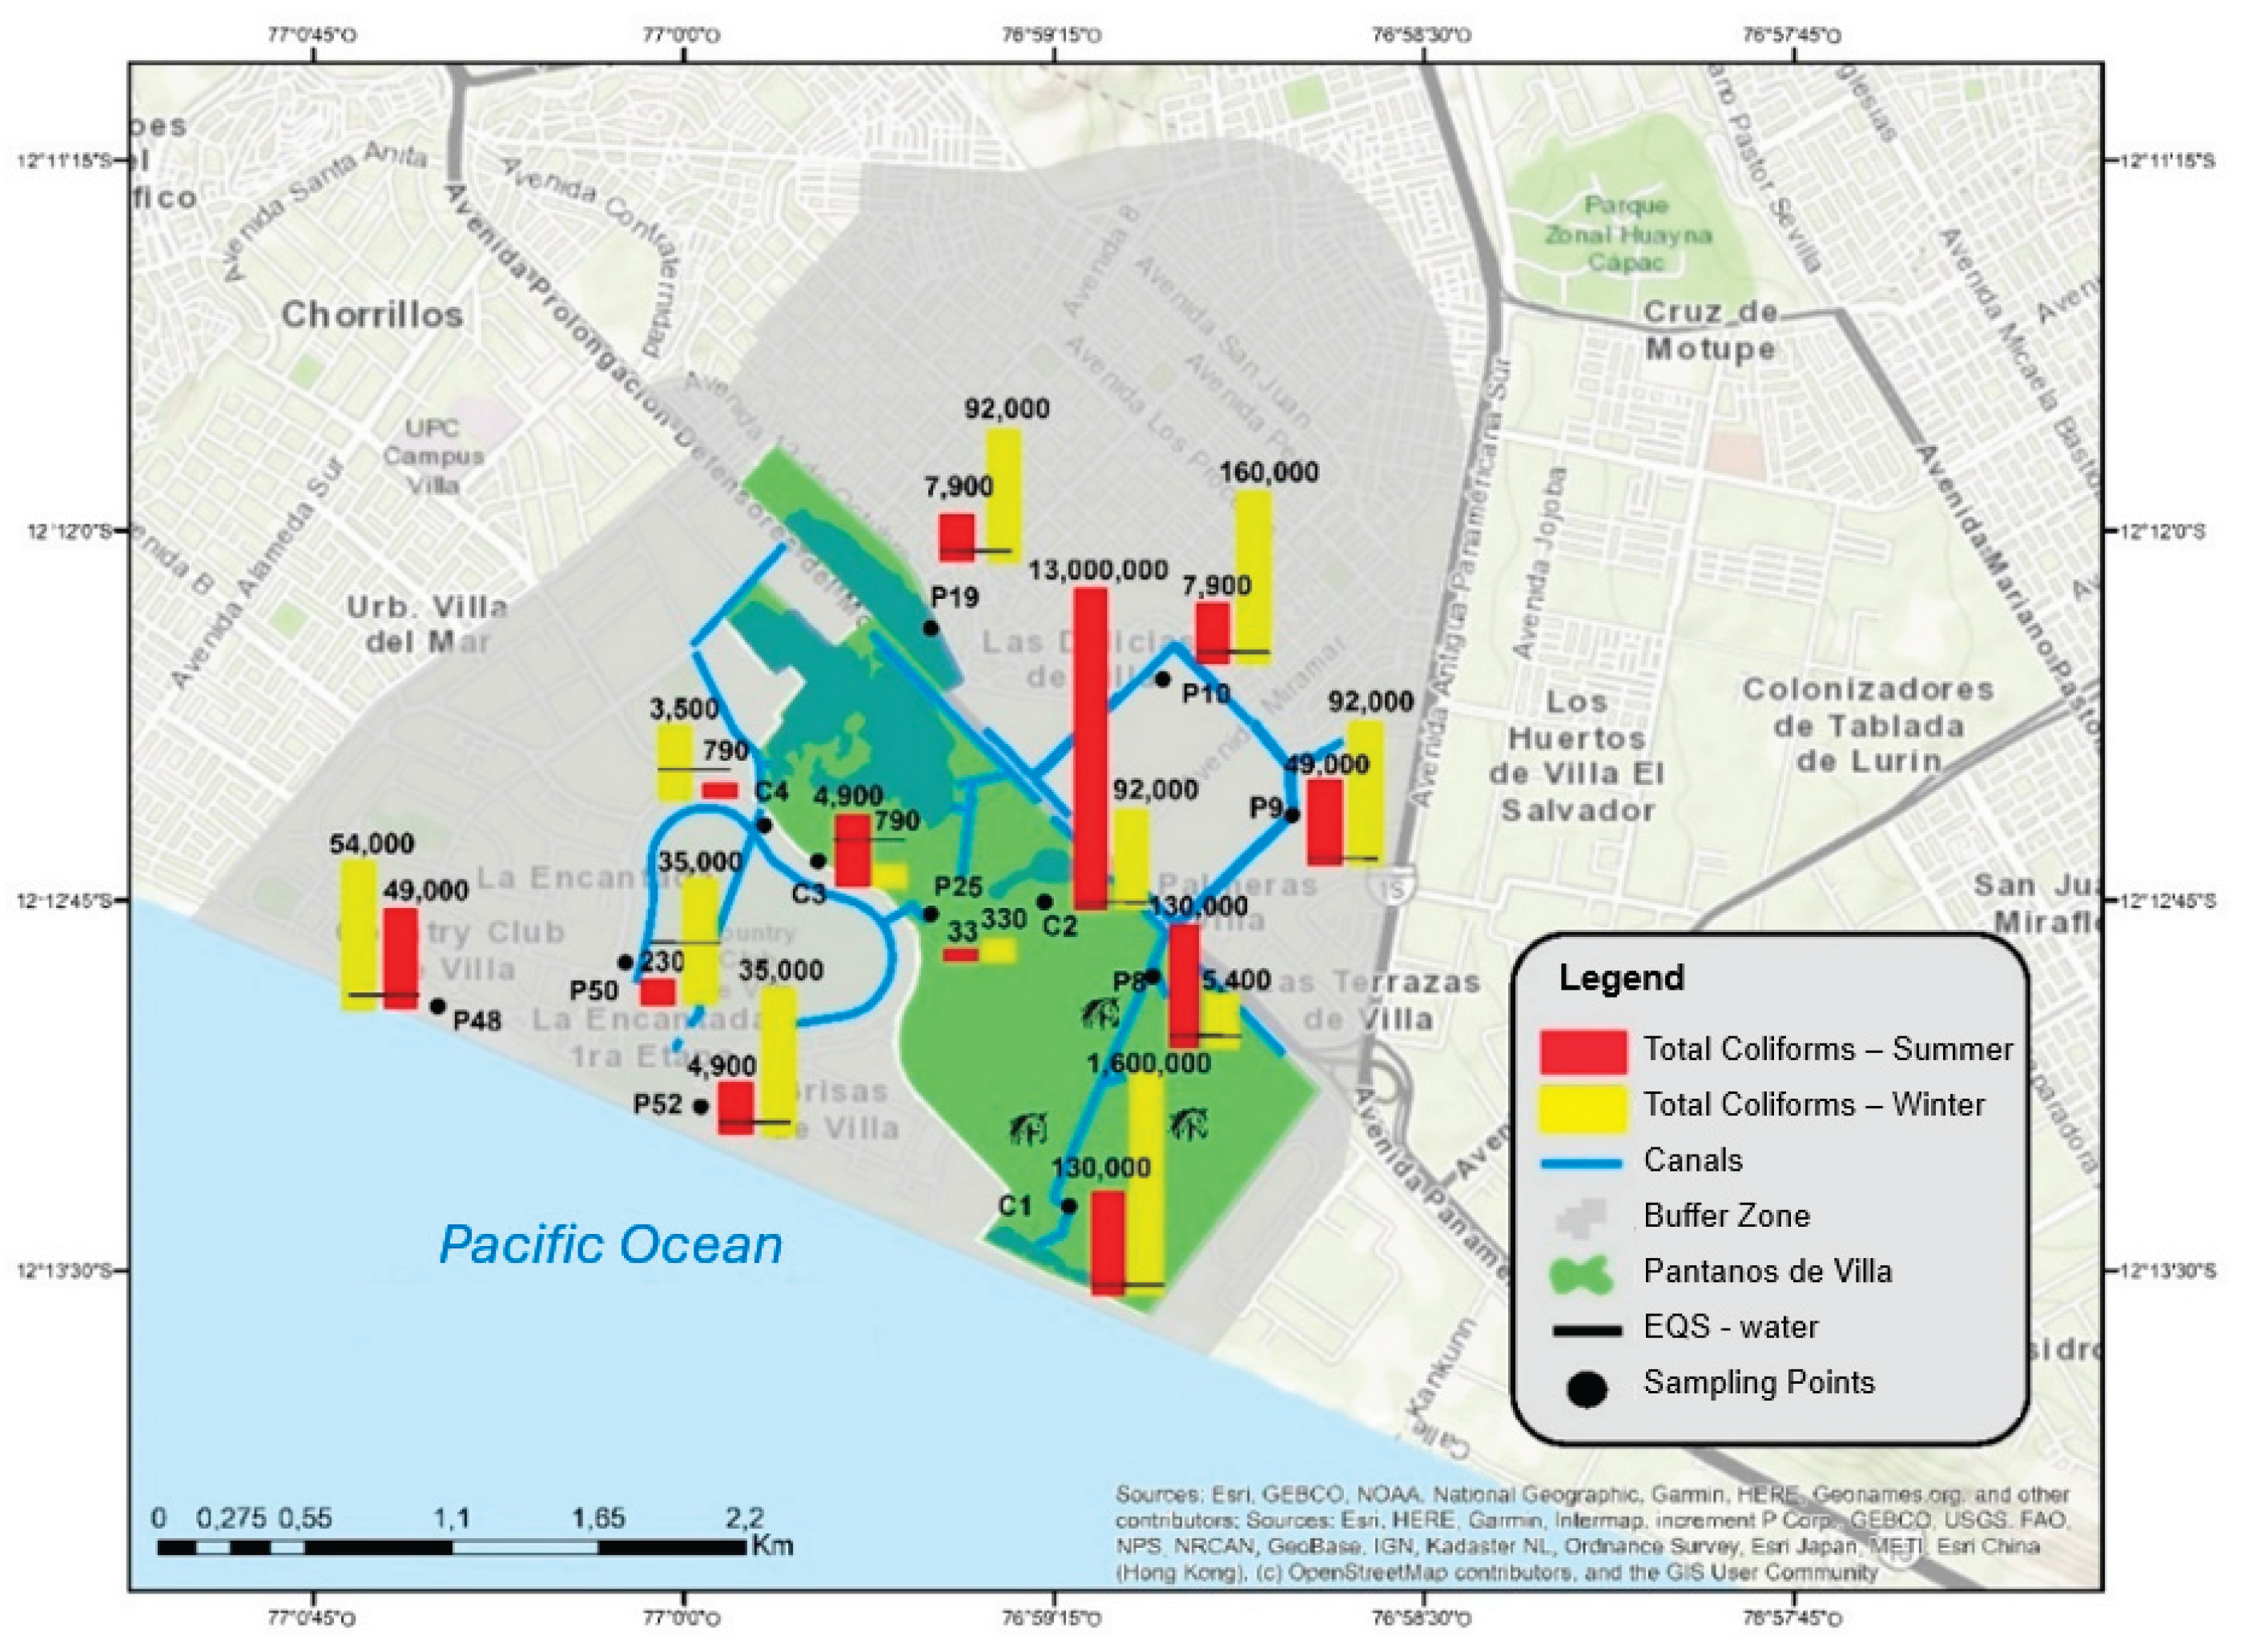
Figure 6.
Escherichia coli found in groundwater inside and outside Los Pantanos de Villa during the summer and winter of 2023.
Figure 6.
Escherichia coli found in groundwater inside and outside Los Pantanos de Villa during the summer and winter of 2023.
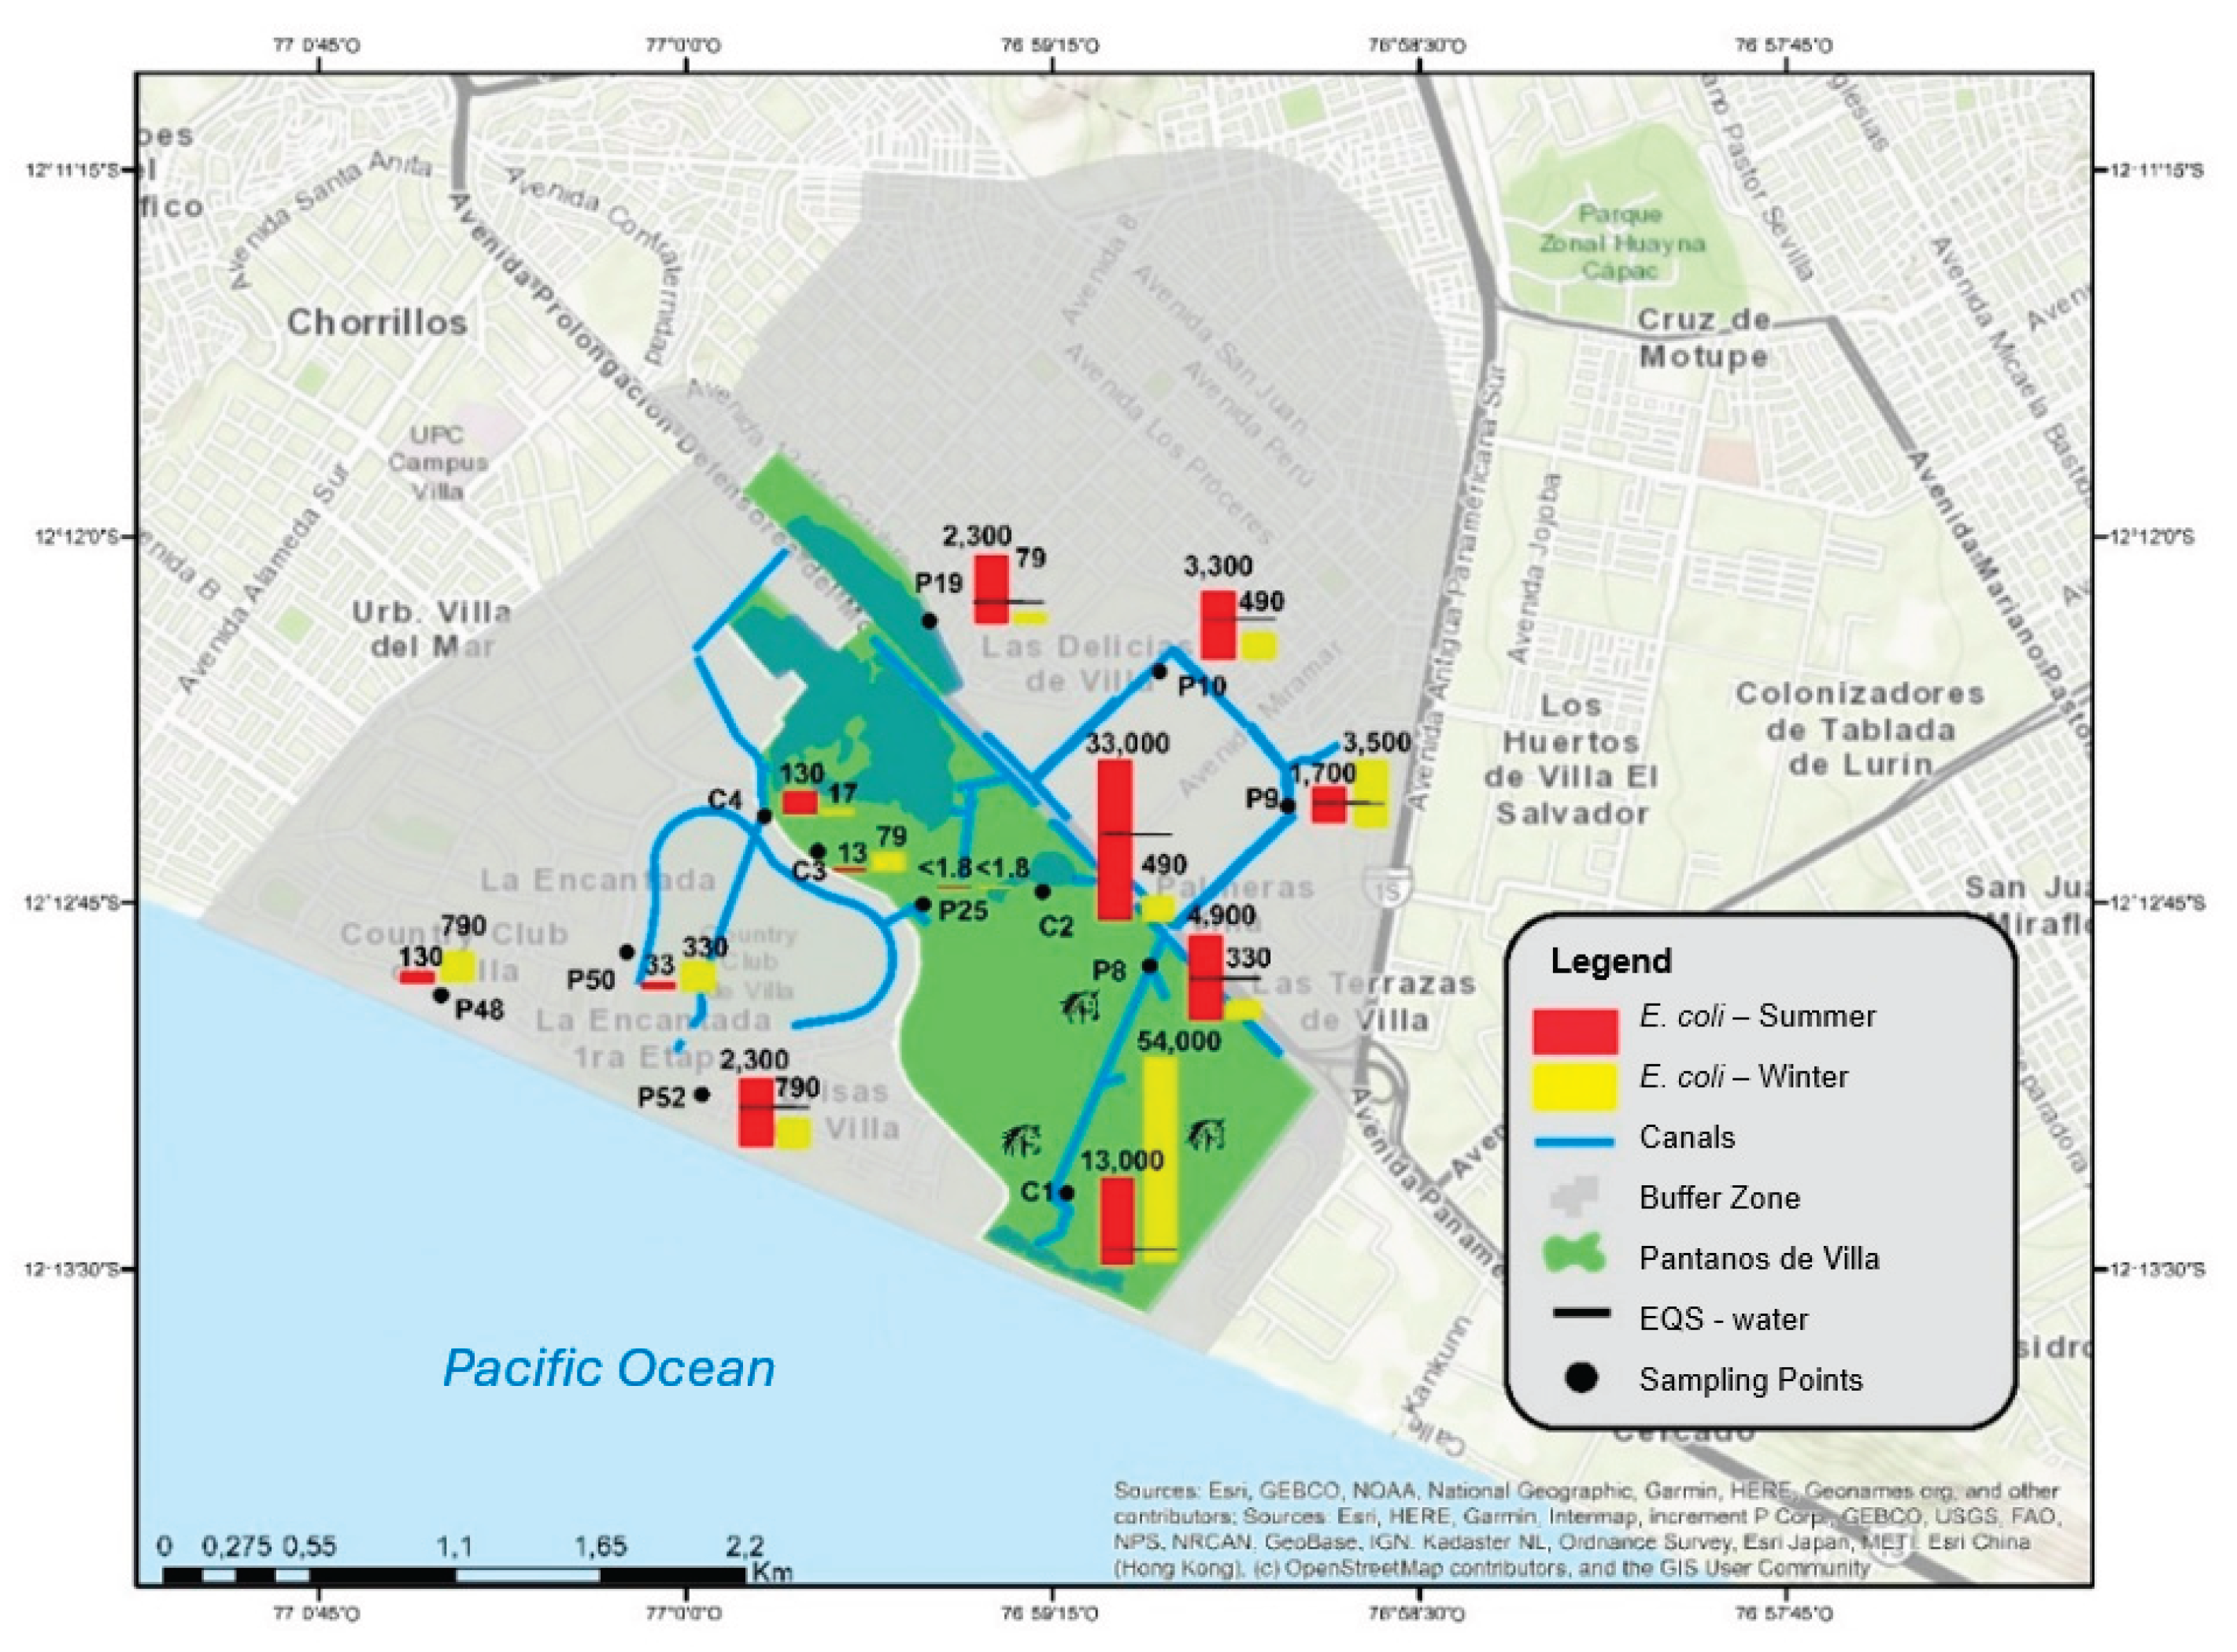
Figure 7.
Comparison of microbiological parameters according to the water flow of the Pantanos de Villa wetland and national and international regulations. (a) Total coliforms (MPN/100mL) (b) Fecal coliforms (MPN/100mL) (c) Escherichia coli (MPN/100mL).
Figure 7.
Comparison of microbiological parameters according to the water flow of the Pantanos de Villa wetland and national and international regulations. (a) Total coliforms (MPN/100mL) (b) Fecal coliforms (MPN/100mL) (c) Escherichia coli (MPN/100mL).
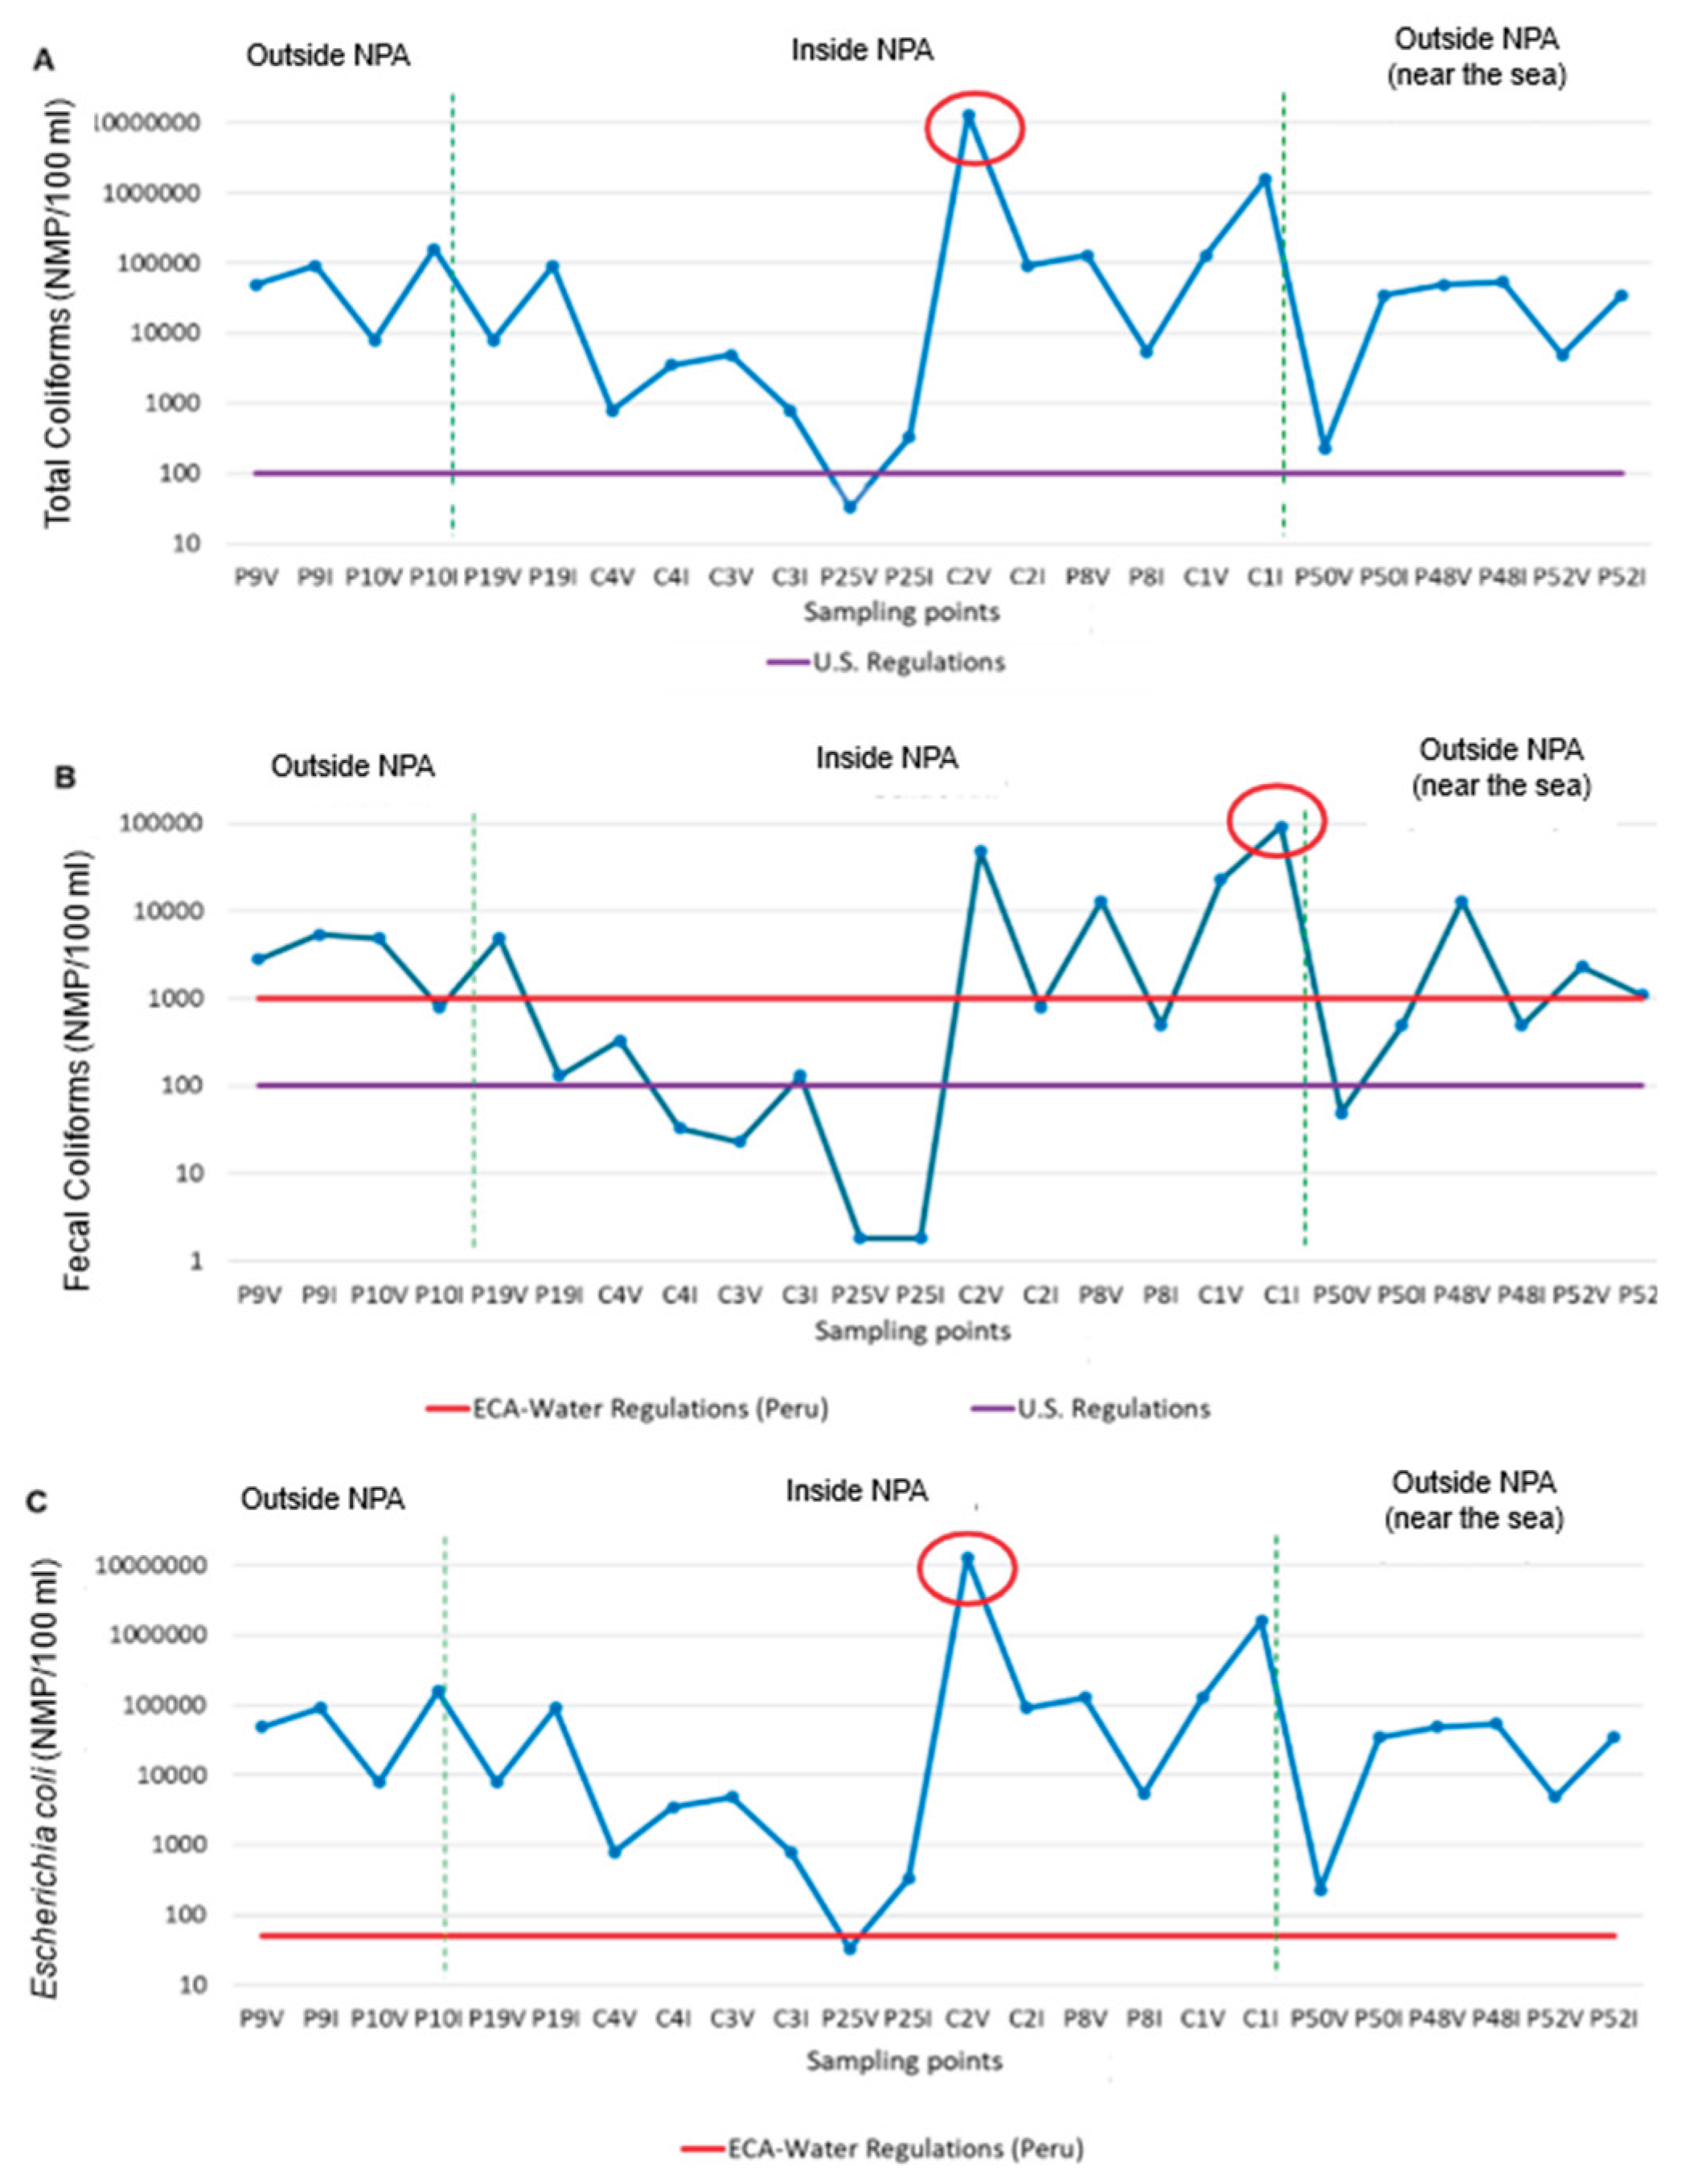
Figure 8.
Comparison of the physicochemical and microbiological parameters in the Pantanos de Villa wetland in the winter and summer. (a) Microbiological parameters (MPN/100mL) (b) COD and BOD (c) Nitrates and total phosphorus. (d) Temperature, pH, and oils and fats. Each graph shows the average values and standard error. Similar letters (a) indicate no significant difference between groups according to the Mann-Whitney U test.
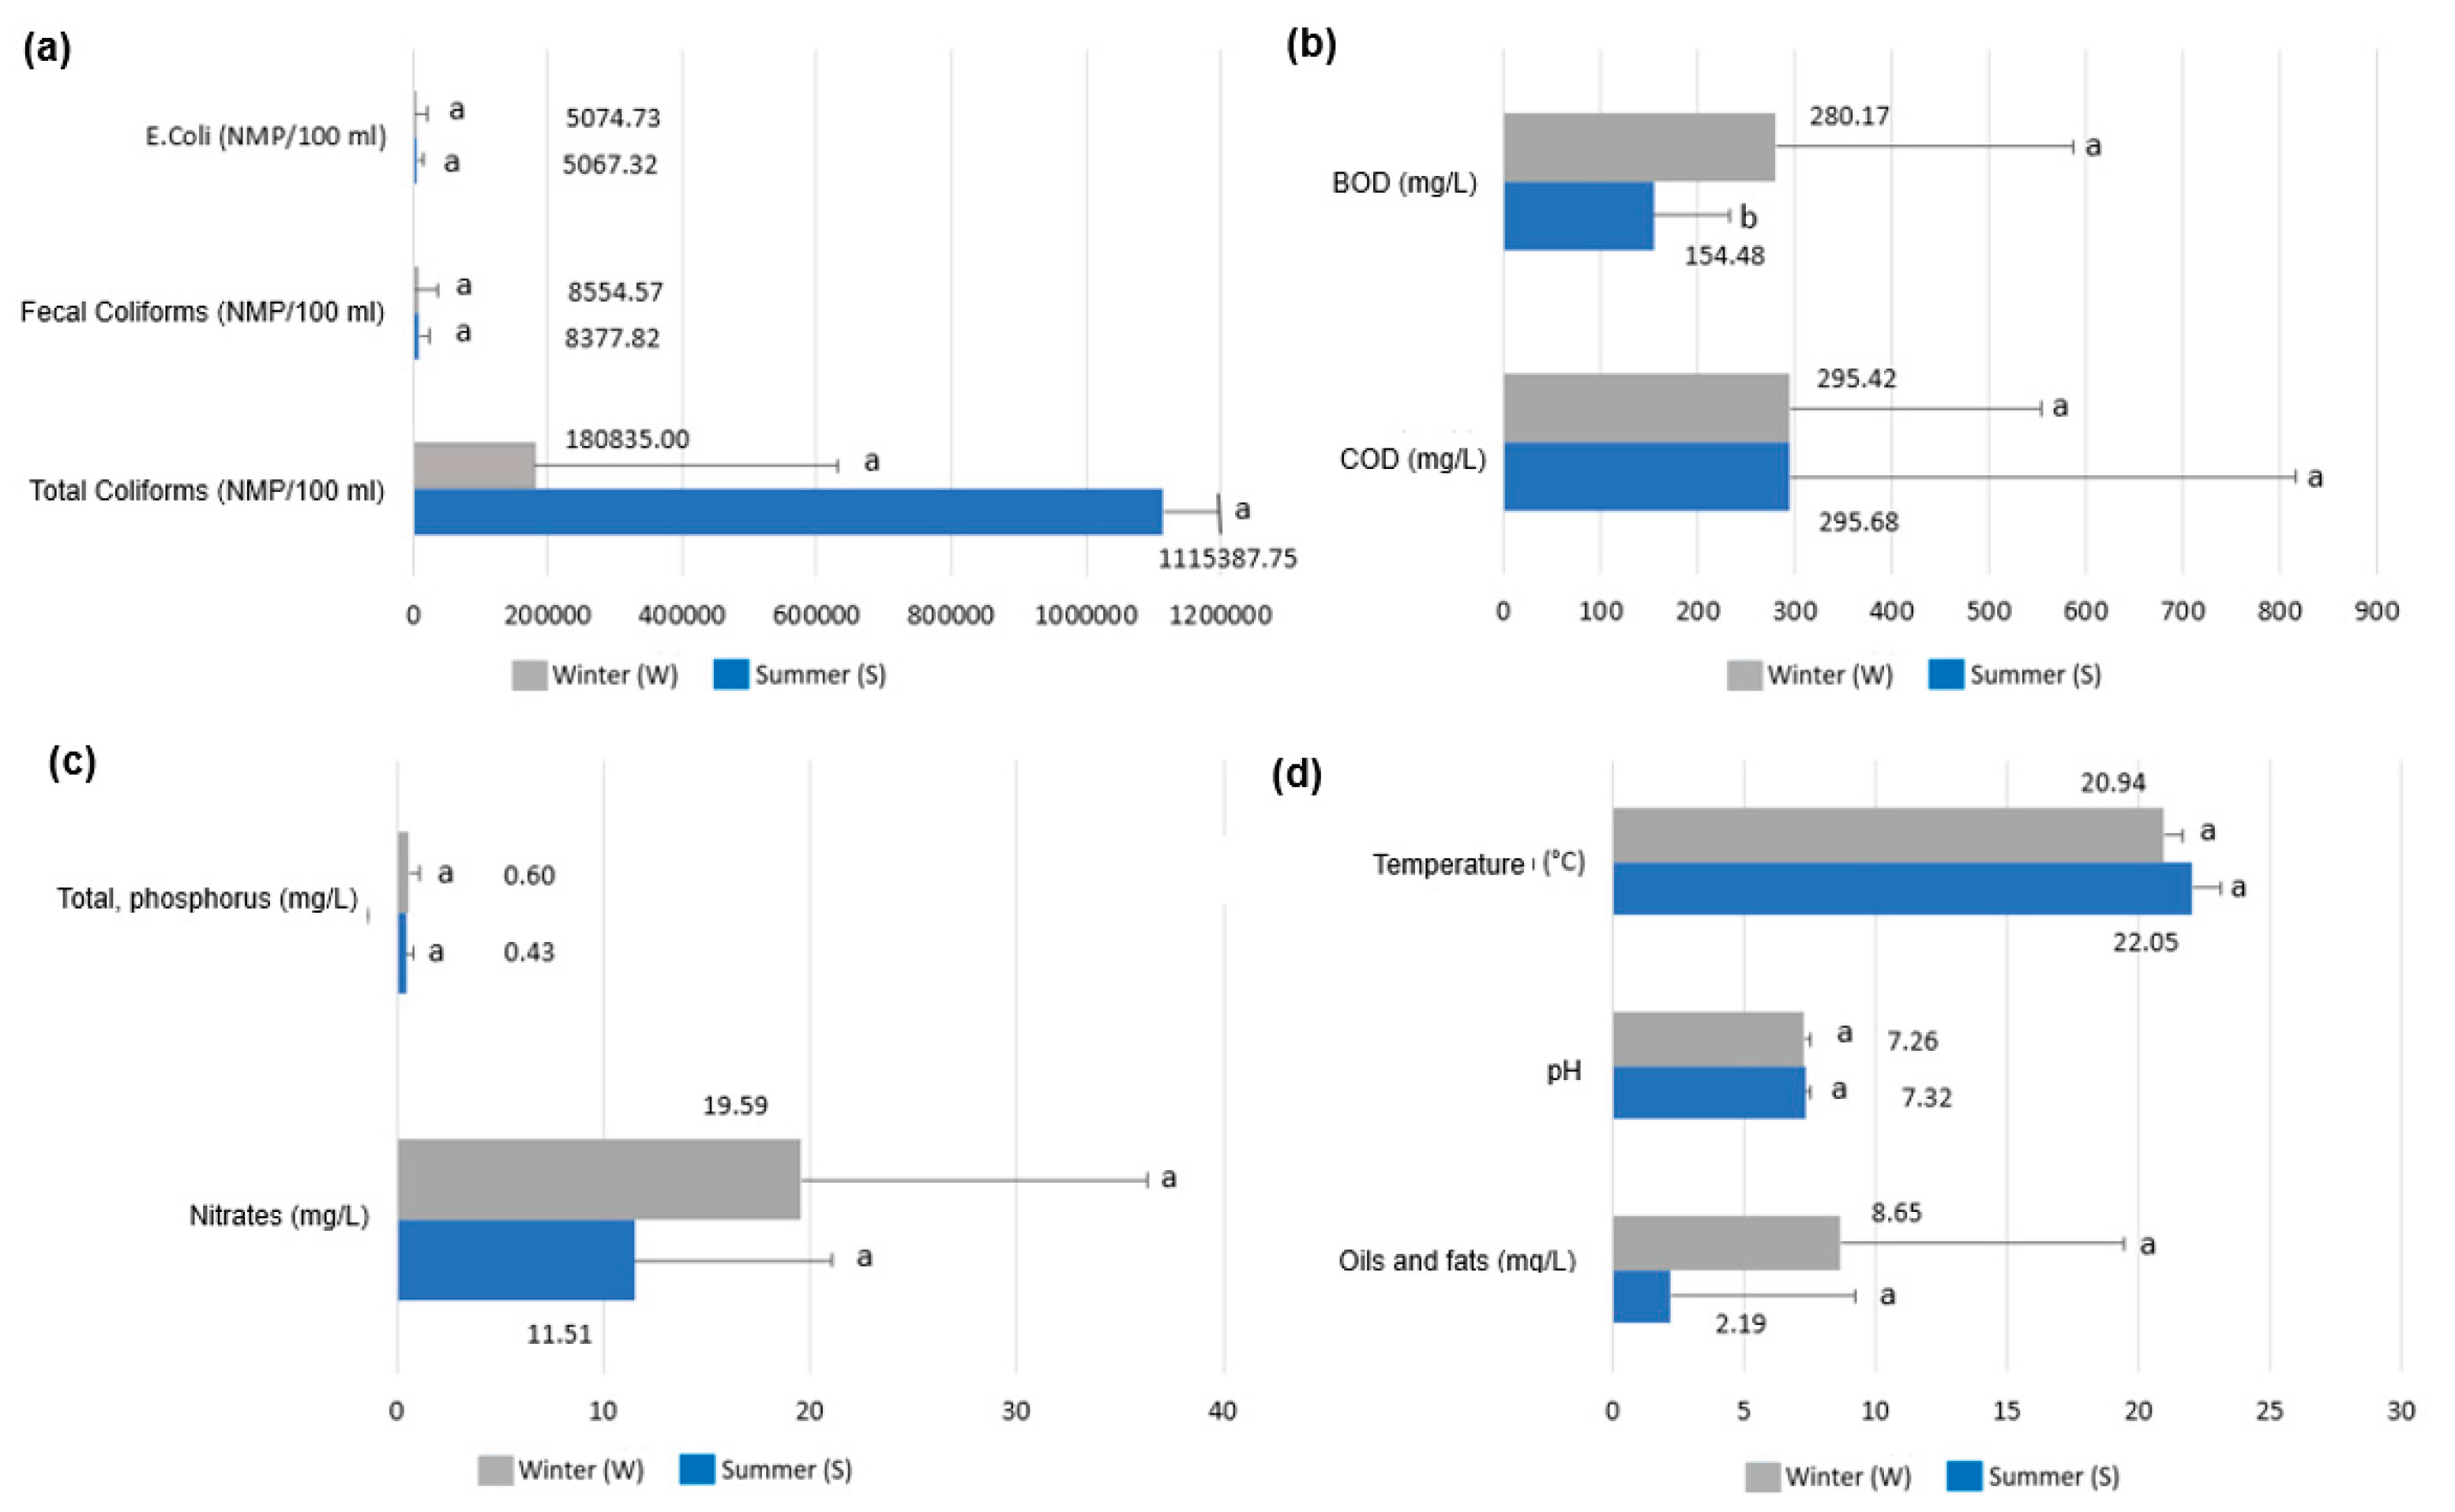

Table 1.
Interpretation of the water quality index of Peru rating.
| CCME_WQI | Rating | Interpretation |
|---|---|---|
| 95-100 | Excellent | Water quality is protected with no threats or damage. Conditions are very close to natural or desired levels |
| 80-94 | Good | Water quality deviates somewhat from natural water quality. However, desirable conditions may be with some minor threats or damage. |
| 65-79 | Favorable | Natural water quality is occasionally threatened or impaired. Water quality often deviates from desirable values. Many uses need treatment. |
| 45-64 | Regular | Water quality does not meet quality objectives; desirable conditions are often threatened. Many of the uses need treatment. |
| 0-44 | Poor | Water quality does not meet quality objectives, almost always threatened or impaired. All uses need prior treatment. |
CCME-WQI: Canadian Council of the Ministry of the Environment water quality index.
Table 2.
Interpretation of the National Sanitation Foundation water quality index of the United States.
Table 2.
Interpretation of the National Sanitation Foundation water quality index of the United States.
| NSF-WQI | Classification |
|---|---|
| 91-100 | Excellent |
| 71-90 | Good |
| 51-70 | Average |
| 26-50 | Poor |
| 0-25 | Very poor |
NSF-WQI: National Sanitation Foundation- water quality index.
Table 3.
Water quality indices of the groundwater in the Pantanos de Villa wetland.
| Code | Location | Season | CCME-WQI (Peru) | NSF-WQI (U.S.) | ||
|---|---|---|---|---|---|---|
| C1 | Inside NPA | Summer | 26.26 | Poor | 43.78 | Poor |
| Winter | 15.85 | Poor | 26.33 | Poor | ||
| C2 | Inside NPA | Summer | 10.80 | Poor | 38.71 | Poor |
| Winter | 21.30 | Poor | 37.62 | Poor | ||
| C3 | Inside NPA | Summer | 35.53 | Poor | 58,94 | Average |
| Winter | 34.66 | Poor | 53.94 | Average | ||
| C4 | Outside NPA | Summer | 40.15 | Poor | 53.29 | Average |
| Winter | 26.55 | Poor | 52.98 | Average | ||
| P8 | Inside NPA | Summer | 16.08 | Poor | 34.01 | Poor |
| Winter | 25.33 | Poor | 41.21 | Poor | ||
| P9 | Outside NPA | Summer | 15.85 | Poor | 34.35 | Poor |
| Winter | 15.85 | Poor | 33.25 | Poor | ||
| P10 | Outside NPA | Summer | 16.11 | Poor | 34.67 | Poor |
| Winter | 25.43 | Poor | 43.01 | Poor | ||
| P19 | Inside NPA | Summer | 16.11 | Poor | 35.61 | Poor |
| Winter | 25.17 | Poor | 38.13 | Poor | ||
| P25 | Inside NPA | Summer | 30.59 | Poor | 63.2 | Average |
| Winter | 31.07 | Poor | 64.46 | Average | ||
| P52 | Outside NPA | Summer | 16.33 | Poor | 43.56 | Poor |
| Winter | 20.83 | Poor | 41.7 | Poor | ||
| P48 | Outside NPA | Summer | 25.92 | Poor | 47.47 | Poor |
| Winter | 15.99 | Poor | 35.34 | Poor | ||
| P50 | Outside NPA | Summer | 29.57 | Poor | 47.25 | Poor |
| Winter | 25.17 | Poor | 36.21 | Poor | ||
NPA: national protected area; CCME-WQI: Canadian Council of the Ministry of the Environment- Water Quality Index; NSF-WQI: National Sanitation Foundation-Water Quality Index.
Disclaimer/Publisher’s Note: The statements, opinions and data contained in all publications are solely those of the individual author(s) and contributor(s) and not of MDPI and/or the editor(s). MDPI and/or the editor(s) disclaim responsibility for any injury to people or property resulting from any ideas, methods, instructions or products referred to in the content. |
© 2025 by the authors. Licensee MDPI, Basel, Switzerland. This article is an open access article distributed under the terms and conditions of the Creative Commons Attribution (CC BY) license (http://creativecommons.org/licenses/by/4.0/).
Copyright: This open access article is published under a Creative Commons CC BY 4.0 license, which permit the free download, distribution, and reuse, provided that the author and preprint are cited in any reuse.


