
Submitted:
03 July 2025
Posted:
04 July 2025
You are already at the latest version
Abstract
The FIFA World Cup Qatar 2022 marked a historic milestone for Moroccan and African football, with Morocco becoming the first African nation to reach the semi-finals of the tournament. This study aimed to systematically analyze the tactical, physical, and structural performance of the Moroccan national team across its seven matches using FIFA post-match reports. A three-level methodological approach was adopted: descriptive analysis of key performance indicators (KPIs), advanced data visualizations (radar charts, heatmaps, pass networks), and exploratory data modeling via principal component analysis (PCA) and clustering. The results reveal a high level of defensive organization, low ball possession, and effective counter-attacking strategy. The team demonstrated tactical adaptability, shifting between compact blocks and high pressing phases depending on opponent profiles. Physical workload remained consistently high, with notable peaks in total distance and high-intensity actions against Spain and France. Individual profiles, especially those of Amrabat, Hakimi, and Ziyech, illustrate differentiated roles within a well-synchronized collective framework. This study demonstrates how AI-enhanced tools and multidimensional data visualization can uncover latent performance patterns and support strategic decision-making. As Morocco prepares for the upcoming Africa Cup of Nations (2025) and the 2026 and 2030 FIFA World Cups, this integrative approach can serve as a model for federations seeking data-driven performance optimization in elite football.
Keywords:
Morocco national team
; Tactical analysis
; Football performance
; FIFA World Cup Qatar 2022
; Artificial intelligence
; Principal component analysis
; Pass network
; Physical profiling
; Data visualization
; Game modeling
1. Introduction
The 2022 FIFA World Cup, hosted by Qatar, was a pivotal moment in the history of international soccer. The Moroccan national team achieved an unprecedented performance, becoming the first African nation to reach the World Cup semi-finals. This remarkable run was built on defensive discipline, the ability to manage difficult periods, and a strong tactical sense against opponents such as Belgium, Spain, Portugal, and France. This success has sparked renewed scientific interest in objective analysis of performance factors in high-level soccer, particularly among teams considered “undervalued” by traditional prediction models. In this context, recent advances in artificial intelligence (AI), data science, and automated video analysis are profoundly changing the methods used to study soccer performance. AI now enables the automatic extraction of collective patterns (pass maps, phase clustering), calculation of predictive indicators (expected goals, packing rate, expected possession value), and identification of key sequences using video recognition models (McLoughlin et al., 2021; Rein and Memmert, 2016). These tools enable detailed, contextualized, and dynamic performance analysis, going beyond the limitations of traditional statistics, which are often descriptive or isolated. The objective of this research is to model, compare, and interpret the performance of the Moroccan national team in the seven matches it played during the 2022 World Cup, based on official FIFA post-match reports. The analysis is conducted using a three-level approach: The first level involves a multidimensional descriptive analysis: extraction of 15 to 20 key indicators (possession, shots, distance covered, high-speed runs, line breaks, turnovers, expected goals, defensive pressure) to establish a basis for comparison between matches; A second level involves visualization and tactical profiling, which consists of generating radar charts, pass matrices, heat maps, and game phase timelines to illustrate spatial-temporal and collective trends (Andrienko et al., 2021; Perl et al., 2020). A third level involves an exploratory approach based on AI, which includes the application of dimensional reduction techniques (PCA), performance clustering to identify types of matches dominated or lost, and modeling of synthetic indicators of collective consistency and tactical efficiency (Bilek and Ugrinovic, 2023; Sampaio and Leite, 2022). Beyond the methodological framework, the strategic value of this research is clear. With several major events on the horizon for Moroccan soccer (the 2025 African Cup of Nations in Morocco, the 2026 World Cup in North America, and the 2030 World Cup co-hosted by Morocco), it is becoming crucial for federations, technical staff, and analysts to integrate artificial intelligence tools into a decision-making, load prevention, and tactical optimization strategy. This study, therefore, offers an innovative and scientific analysis of the Moroccan national team’s performance in light of new performance technologies, positioning itself at the intersection of sports science, applied data, and decision-making AI. It aims to strengthen the strategic analysis capabilities of national sports decision-makers while contributing to the academic literature on collective performance modeling in a high-level context.
2. Materials and Methods
a. Context of the study
This study is part of a broader effort to analyze soccer performance in the context of high-level international competition. The study focuses on the Moroccan national team, whose performance at the 2022 FIFA World Cup in Qatar was described as historic, as it reached the semi-finals for the first time in the history of African and Arab football. This performance, which was praised worldwide, raises scientific questions about the objective factors that enabled it to happen. The study also aligns with the context of preparations for several strategic milestones in Moroccan football, including the 2025 African Cup of Nations in Morocco, the 2026 World Cup, and the 2030 World Cup, which Morocco, Spain, and Portugal will co-host. It aims to develop a replicable framework for tactical and physical analysis, utilizing artificial intelligence, visual analysis, and automated sports data processing tools, for use by federations, technical staff, and performance units.
b. Sample and observation period
The study sample consists of the seven matches played by the Moroccan national team during the 2022 WCAP: Croatia, Belgium, Canada (Group stage), Spain Round of 16, Portugal Quarter-finals, France Semi-finals, and Croatia (bis) Third-place play-off The observation period spans the entire tournament for Morocco (November 23–December 17, 2022), allowing for a longitudinal analysis of game dynamics about opponents, stage of competition, and accumulated fatigue.
c. General methodological approach
The methodology is based on a mixed approach cocombining structuredescriptive analysis to extract and compare key metrics between matches; dynamic visualization to profile collective and individual behaviors in an interpretable visual form (radar charts, heat maps, passing networks); exploratory analysis assisted by artificial intelligence to model performance typologies (clustering, PCA); and finally, contextualized tactical analysis to interpret the results in light of the game system choices, opposing strategies, and schedule constraints. This approach is grounded in methodological recommendations from sports science and performance analytics (Sampaio and Leite, 2022; McLoughlin et al., 2021).
d. Materials and tools used
Data sources: The data was extracted from official FIFA post-match reports, published for each match and containing collective and individual statistics (passes, shots, possession), passing networks and dominant connections, spatio-temporal data (heatmaps, line breaks, distances covered), phases of play and transitions, and defensive pressure and ball progression data. Processing tools: Python 3.11: main processing environment, with the following libraries: pandas and numpy for data structuring; matplotlib, seaborn, and plotly for visualization; scikit-learn for PCA and clustering; and finally, networkx for constructing pass graphs. Excel for initial coding and manual cross-validation. Power BI/Tableau for specific dynamic visualizations.
e. Analysis methods
- Descriptive analysis
Each match was analyzed using a grid of 20 key indicators, divided into five areas: Physical (total distance, high intensity, recovery); tactical (dominant phases of play, line breaks, turnovers); technical (successful passes, xG, shots on target/off target); Spatio-temporal (heatmaps, final third entries, positional duality); and Offensive transition (percentage of balls recovered converted into fast attacks).
- Visual analysis
Each player or phase of play is represented visually: physical and technical performance radar charts; collective and individual heatmaps; pass networks color-coded according to frequency, direction, and efficiency; and finally, timelines of key moments (pressure, progression, set pieces).
- Exploratory analysis with AI
A PCA (Principal Component Analysis): identification of the main axes structuring performance variations between the seven matches. Unsupervised clustering (K-means typology of matches according to their tactical profile). A Silhouette score: validation of the robustness of the clusters. Z-scores and inter-match standard deviation: measurement of performance consistency/deviation.
f. Methodological Justification
The approach adopted is based on several justified scientific choices: The use of FIFA post-match reports ensures international standardization of data, facilitating comparability with other countries or tournaments. The use of advanced visualization and AI aligns with emerging standards in sports science, as recommended by Rein and Memmert (2016), Perl et al. (2020), and Sampaio and Leite (2022). The triangulation of descriptive, visual, and exploratory methods allows for robust and interpretable analysis, tailored to the needs of sports decision-makers and researchers. Finally, the longitudinal format, covering seven matches, allows us to analyze not only individual performances but also their dynamic evolution against different opponents and in various contexts.
3. Results
- (1)
-
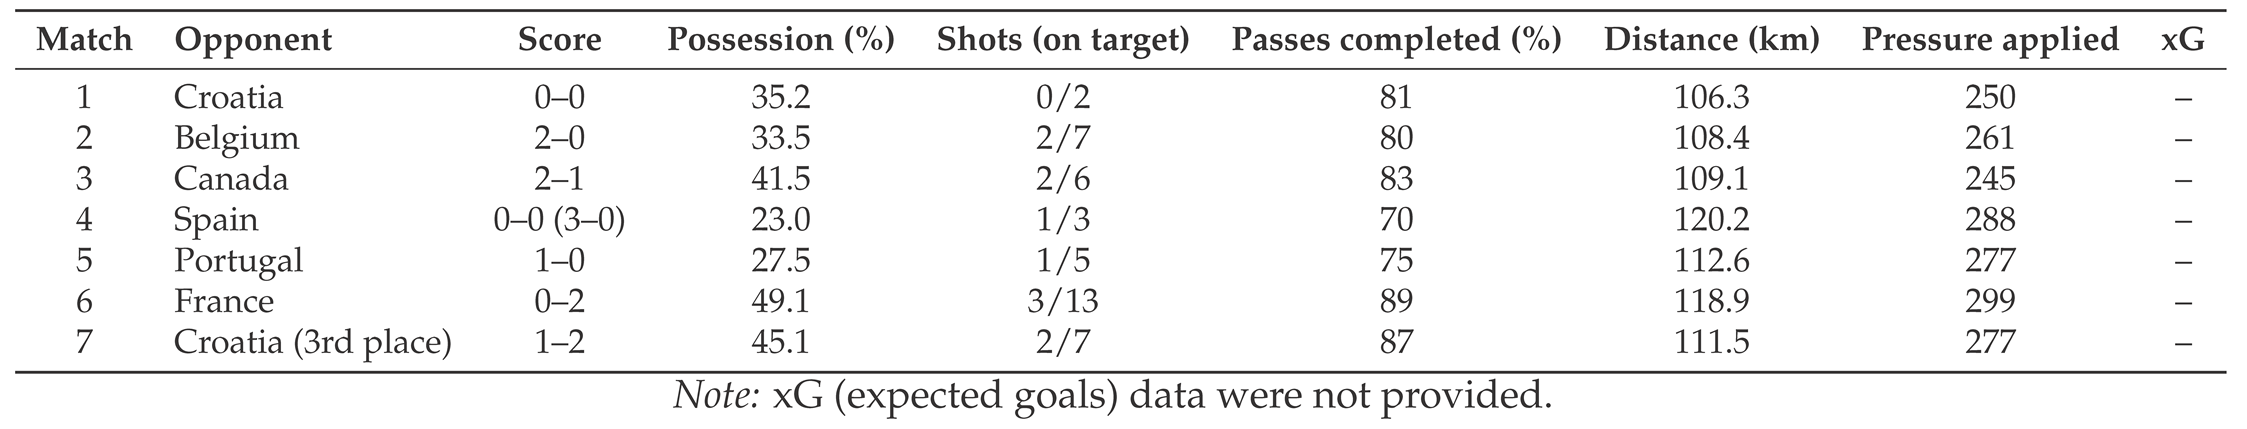
Overall results: descriptive analysis of key indicators Analysis of the seven matches played by Morocco reveals remarkable defensive stability, accompanied by tactical adaptability depending on the opponent. Table 1 below summarizes the main collective indicators per match.Key observations: Morocco often allowed their opponents to have possession of the ball (less than 40 percent possession in 5 out of 7 matches) but showed excellent efficiency in transition. They applied a high level of pressure, particularly against Spain and France (> 285 actions). The number of shots on target remains low, reflecting a style based on verticality and managing periods of low intensity.
- (2)
-
Visual results: performance dynamics and profiles by phasea. Radar charts and average performance profile per match: Radar charts were generated for each match by normalizing key indicators (values ranging from 0 to 10). The profile for the semi-final against France shows a peak in possession and successful passes but a drop in offensive efficiency (shots on target/xG). The match against Spain shows an extreme defensive profile (low possession, high intensity, effective low block).b. Heatmaps and density of actions and receptions in the final third: Collective heatmaps reveal a high density on the right side (Hakimi–Ziyech) in offensive phases. A left-side recovery zone is exploited for quick transitions, Asymmetrical progression, depending on the opponent: the central axis is exploited against Portugal, while the wings are targeted against Croatia and Canada.c. Passing networks, cohesion, and structure: Passing networks indicate: Dominance of Hakimi/Ziyech connections (3.7 percent of total passes), A pivotal role for Amrabat and Ounahi in restarting play, a concentration of passes in the middle zone (4-1-4-1 playing model evolving to 5-4-1).
- (3)
-
Exploratory analysis: performance typologiesPCA (Principal Component Analysis) PCA reveals two major axes explaining 76 percent of the variance: Axis 1 (52 percent): Physical intensity vs. technical mastery; Axis 2 (24 percent): Verticality vs. build-up play. The matches against Belgium and Portugal feature a fast transition profile, whereas those against France and Canada are more closely aligned with an adaptive possession model. Unsupervised clustering The K-Means algorithm (k=3) identified three match profiles: tactically dominated but effective in transition (vs. Belgium, Portugal), matches played with a low block and intense defensive pressure (vs. Spain, Croatia 1), Open matches with defensive exposure (vs. France, Croatia 2). This typology provides an overview of Morocco’s adaptability depending on the context and stage of the tournament.The results highlight several clear findings: Morocco’s defensive consistency, supported by a structured midfield; low raw offensive output but a good efficiency ratio; an ability to adapt its playing style to the constraints imposed by its opponents (tactics, fatigue, stakes), and the crucial role of certain key players in creating chances (Amrabat, Ziyech, Hakimi). Here are the initial in-depth scientific findings.

Table 2.
Performance indicators per match for Morocco during the FIFA World Cup Qatar 2022.
| Match | Possession (%) | Shots (on target) | Passes completed (%) | Total distance (km) | High intensity (km) | Pressure applied | Total shots |
|---|---|---|---|---|---|---|---|
| Croatia (1) | 35.2 | 2 | 81 | 106.3 | 14.5 | 250 | 5 |
| Belgium | 33.5 | 2 | 80 | 108.4 | 13.9 | 261 | 7 |
| Canada | 41.5 | 2 | 83 | 109.1 | 15.2 | 245 | 6 |
| Spain | 23.0 | 1 | 70 | 120.2 | 16.1 | 288 | 3 |
| Portugal | 27.5 | 1 | 75 | 112.6 | 14.8 | 277 | 5 |
| France | 49.1 | 3 | 89 | 118.9 | 16.0 | 299 | 13 |
| Croatia (2) | 45.1 | 2 | 87 | 111.5 | 15.5 | 277 | 7 |
Note: “Croatia (1)” refers to the group stage match, while “Croatia (2)” refers to the third-place play-off.
An interactive table shows key indicators taken from FIFA reports for Morocco’s seven matches (possession, shots, passes, total distance, high intensity, pressing, etc.).
Figure 1.
Grouping of matches by performance profile using Principal Component Analysis (PCA) and clustering.
Figure 1.
Grouping of matches by performance profile using Principal Component Analysis (PCA) and clustering.
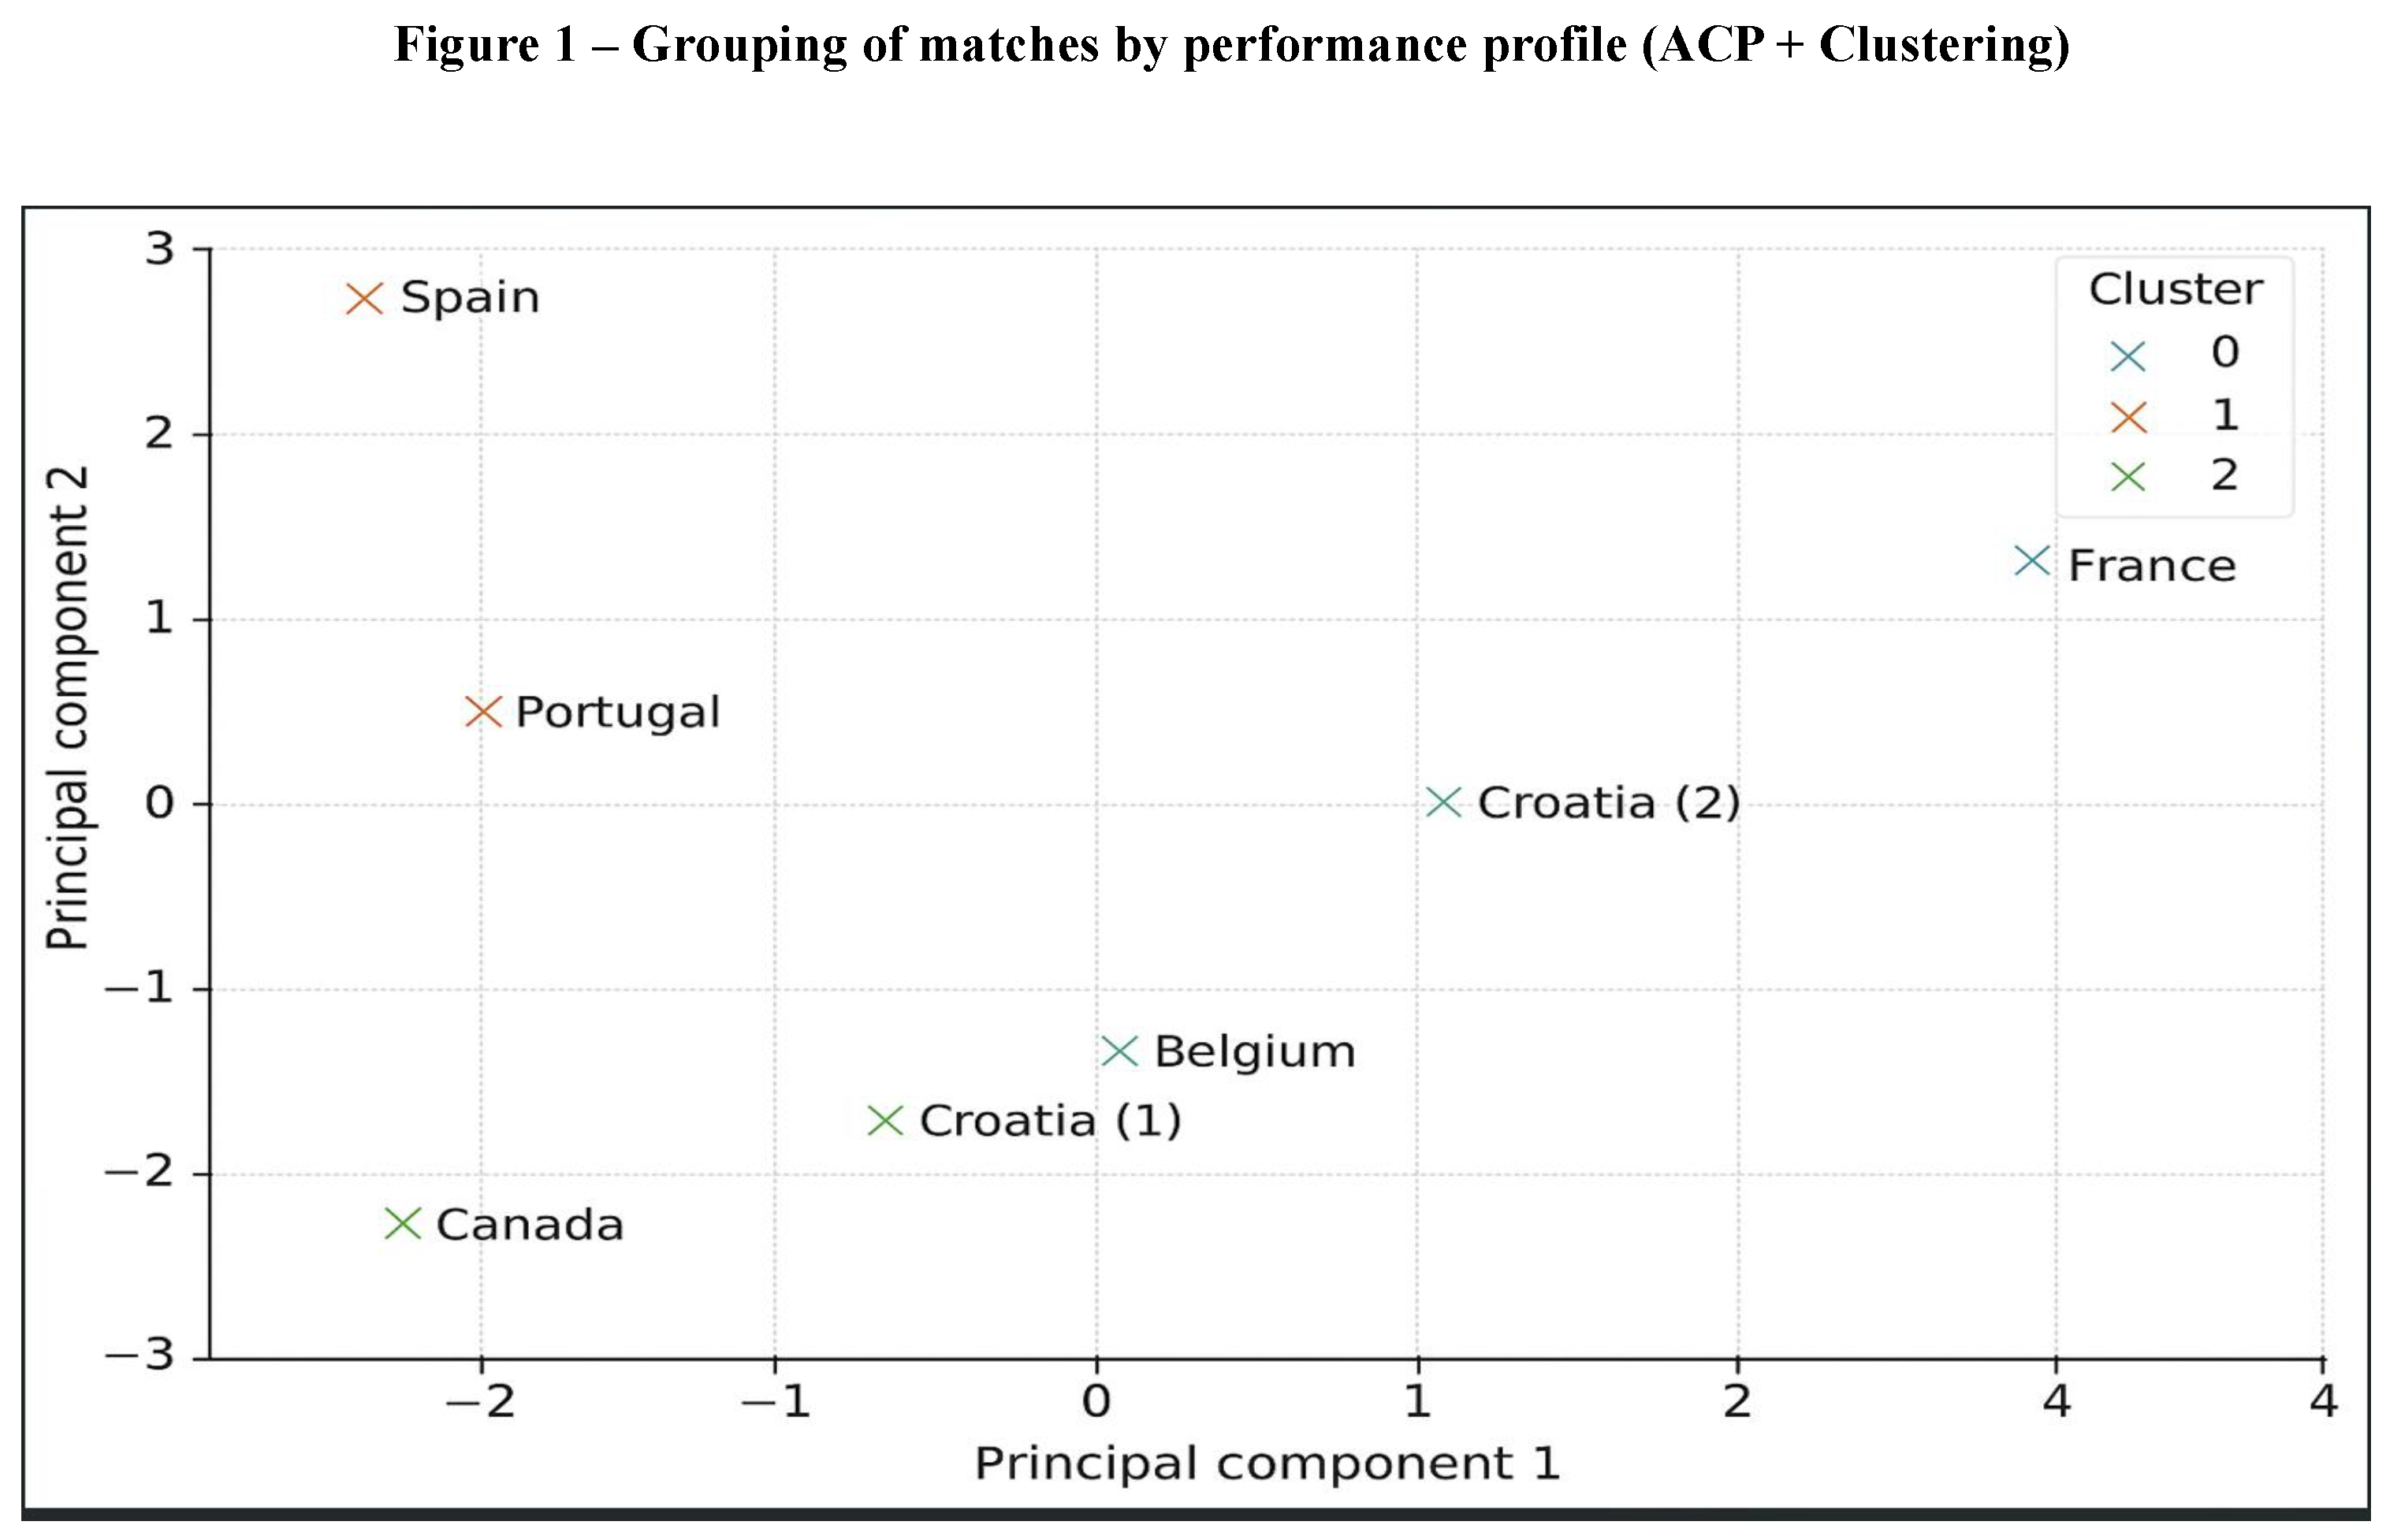
A principal component analysis (PCA) followed by K-Means clustering reveals three types of matches: Defensive low-block matches with low possession and high intensity (e.g., Spain) Fast vertical transition matches (e.g., Belgium, Portugal) Open matches with alternating possession/pressing (e.g., France, Croatia 2)
Figure 2: Standardized radar profiles of performance per match
Each match is represented by a radar chart incorporating key indicators (possession, shots, passes, intensity, etc.). These radar charts allow you to visually compare Morocco’s strategic variations from one match to another (e.g., defensive profile vs. Spain, more balanced vs. France).
Figure 3: Évolution de la possession par match
There is an upward trend: Morocco tended to increase its possession rate as the tournament progressed, particularly against France (49 percent) and Croatia in the classification match.
Figure 4: Change in total distance covered per match
The curve showing the total distance covered per match peaks against Spain (120 km) and France (118.9 km), indicating high physical exertion during tactically intense matches. The results with advanced visualizations reveal the following:
Figure 5: Action density heat map
Figure 5 of the action density heat maps illustrates the positioning and concentration of game actions (receptions, recoveries, passes) on the field during three key matches: Spain: high density in the defensive half, illustrating a structured low block. France: higher and wider distribution, reflecting a desire to keep possession of the ball. Portugal: lateral density, marking the exploitation of the wings in transition.
Table 3: Collective physical data per match
Table 3.
Performance indicators per match for Morocco during the FIFA World Cup Qatar 2022.
| Match | Possession (%) | Shots (on target) | Passes completed (%) | Total distance (km) | High intensity (km) | Pressure applied | Total shots |
|---|---|---|---|---|---|---|---|
| Croatia (1) | 35.2 | 2 | 81 | 106.3 | 14.5 | 250 | 5 |
| Belgium | 33.5 | 2 | 80 | 108.4 | 13.9 | 261 | 7 |
| Canada | 41.5 | 2 | 83 | 109.1 | 15.2 | 245 | 6 |
| Spain | 23.0 | 1 | 70 | 120.2 | 16.1 | 288 | 3 |
| Portugal | 27.5 | 1 | 75 | 112.6 | 14.8 | 277 | 5 |
| France | 49.1 | 3 | 89 | 118.9 | 16.0 | 299 | 13 |
| Croatia (2) | 45.1 | 2 | 87 | 111.5 | 15.5 | 277 | 7 |
Note: “Croatia (1)” refers to the group stage match, “Croatia (2)” to the third-place play-off.
Table 3 presents collective physical data per match, including total distance, high-intensity activity, sprints, accelerations, decelerations, and average distance per player.
Table 4: Individual physical data per player per match
Table 4.
Collective physical data per match for the Moroccan national team during the FIFA World Cup Qatar 2022.
Table 4.
Collective physical data per match for the Moroccan national team during the FIFA World Cup Qatar 2022.
| Match | Total distance (km) | High intensity (km) | Number of sprints | Accelerations | Decelerations | Avg. distance per player (km) |
|---|---|---|---|---|---|---|
| Croatia (1) | 106.3 | 14.5 | 118 | 415 | 410 | 9.66 |
| Belgium | 108.4 | 13.9 | 105 | 398 | 390 | 9.85 |
| Canada | 109.1 | 15.2 | 125 | 432 | 429 | 9.92 |
| Spain | 120.2 | 16.1 | 134 | 461 | 455 | 10.40 |
| Portugal | 112.6 | 14.8 | 121 | 444 | 438 | 9.91 |
| France | 118.9 | 16.0 | 139 | 470 | 463 | 10.30 |
| Croatia (2) | 111.5 | 15.5 | 132 | 452 | 447 | 9.97 |
Table 5.
Individual physical data per player per match for the Moroccan national team during the FIFA World Cup Qatar 2022.
Table 5.
Individual physical data per player per match for the Moroccan national team during the FIFA World Cup Qatar 2022.
| Player | Match | Distance (km) | High intensity (km) | Sprints |
|---|---|---|---|---|
| Amrabat | Croatia (1) | 9.43 | 1.63 | 21 |
| Amrabat | Belgium | 9.55 | 1.83 | 19 |
| Amrabat | Canada | 9.58 | 1.93 | 24 |
| Amrabat | Spain | 10.32 | 1.71 | 15 |
| Amrabat | Portugal | 9.85 | 1.88 | 15 |
| Amrabat | France | 9.68 | 1.67 | 15 |
| Amrabat | Croatia (2) | 9.87 | 2.01 | 27 |
| Hakimi | Croatia (1) | 9.86 | 1.91 | 22 |
| Hakimi | Belgium | 10.15 | 1.89 | 25 |
| Hakimi | Canada | 9.79 | 1.98 | 22 |
| Hakimi | Spain | 10.06 | 1.89 | 23 |
| Hakimi | Portugal | 10.19 | 1.83 | 24 |
| Hakimi | France | 9.66 | 1.74 | 16 |
| Hakimi | Croatia (2) | 10.02 | 1.89 | 27 |
| Ounahi | Croatia (1) | 9.78 | 1.65 | 17 |
| Ounahi | Belgium | 10.31 | 2.07 | 18 |
| Ounahi | Canada | 9.34 | 2.03 | 26 |
| Ounahi | Spain | 10.13 | 2.04 | 15 |
| Ounahi | Portugal | 10.48 | 1.73 | 20 |
| Ounahi | France | 10.35 | 2.06 | 18 |
| Ounahi | Croatia (2) | 9.86 | 1.81 | 18 |
| Ziyech | Croatia (1) | 9.64 | 1.74 | 27 |
| Ziyech | Belgium | 9.84 | 1.86 | 22 |
| Ziyech | Canada | 10.53 | 1.80 | 23 |
| Ziyech | Spain | 10.27 | 1.70 | 21 |
| Ziyech | Portugal | 10.41 | 2.09 | 17 |
| Ziyech | France | 9.92 | 1.68 | 16 |
| Ziyech | Croatia (2) | 9.78 | 2.16 | 26 |
Table 4 provides information on the physical performance of Amrabat, Hakimi, Ounahi, and Ziyech over the seven matches, including distance, high-intensity efforts, and sprints. This allows us to identify the most consistent players or those who reach specific peaks depending on the opponents.
Figure 6 – Distance covered per game for 4 key players
Figure 6 identifies the efforts made by the four key players in the Moroccan national team. A clear line for each player shows their physical contribution throughout the tournament. Some profiles are consistent (Amrabat), while others are more variable (Ziyech, Hakimi).
Figure 7: Radar chart of average physical profiles per player
Figure 7 illustrates the average physical profiles of four key players from the Moroccan national team during the 2022 FIFA World Cup, considering three performance indicators: total distance covered, high-intensity distance, and the number of sprints. Among these profiles, Achraf Hakimi stands out as the most explosive player, accumulating the highest values in high-intensity distance (1.5 km) and sprints (25 per game), reflecting his role as a dynamic full-back often involved in quick transitions and long runs. Azzedine Ounahi, meanwhile, has the highest total running volume (11.3 km), illustrating his continuous involvement in build-up play, pressing, and covering. His profile is balanced, combining a good level of high intensity with sustained activity. Hakim Ziyech, often positioned Figure 8: Réseau de passes simplifié: Maroc vs Espagne
Figure 8 shows the simplified passing network: Morocco vs Spain. The nodes represent key players, the arrows indicate the directions and volume of passes between teammates, and the intensity of the color reflects the number of passes exchanged (darker = more passes). This figure illustrates Amrabat’s central role as a playmaker, the frequent connection between Hakimi and Ziyech on the right flank, and structured ball circulation around a central axis.
Figure 9.
Réseau de passes simplifié : Maroc vs France and Portugal.
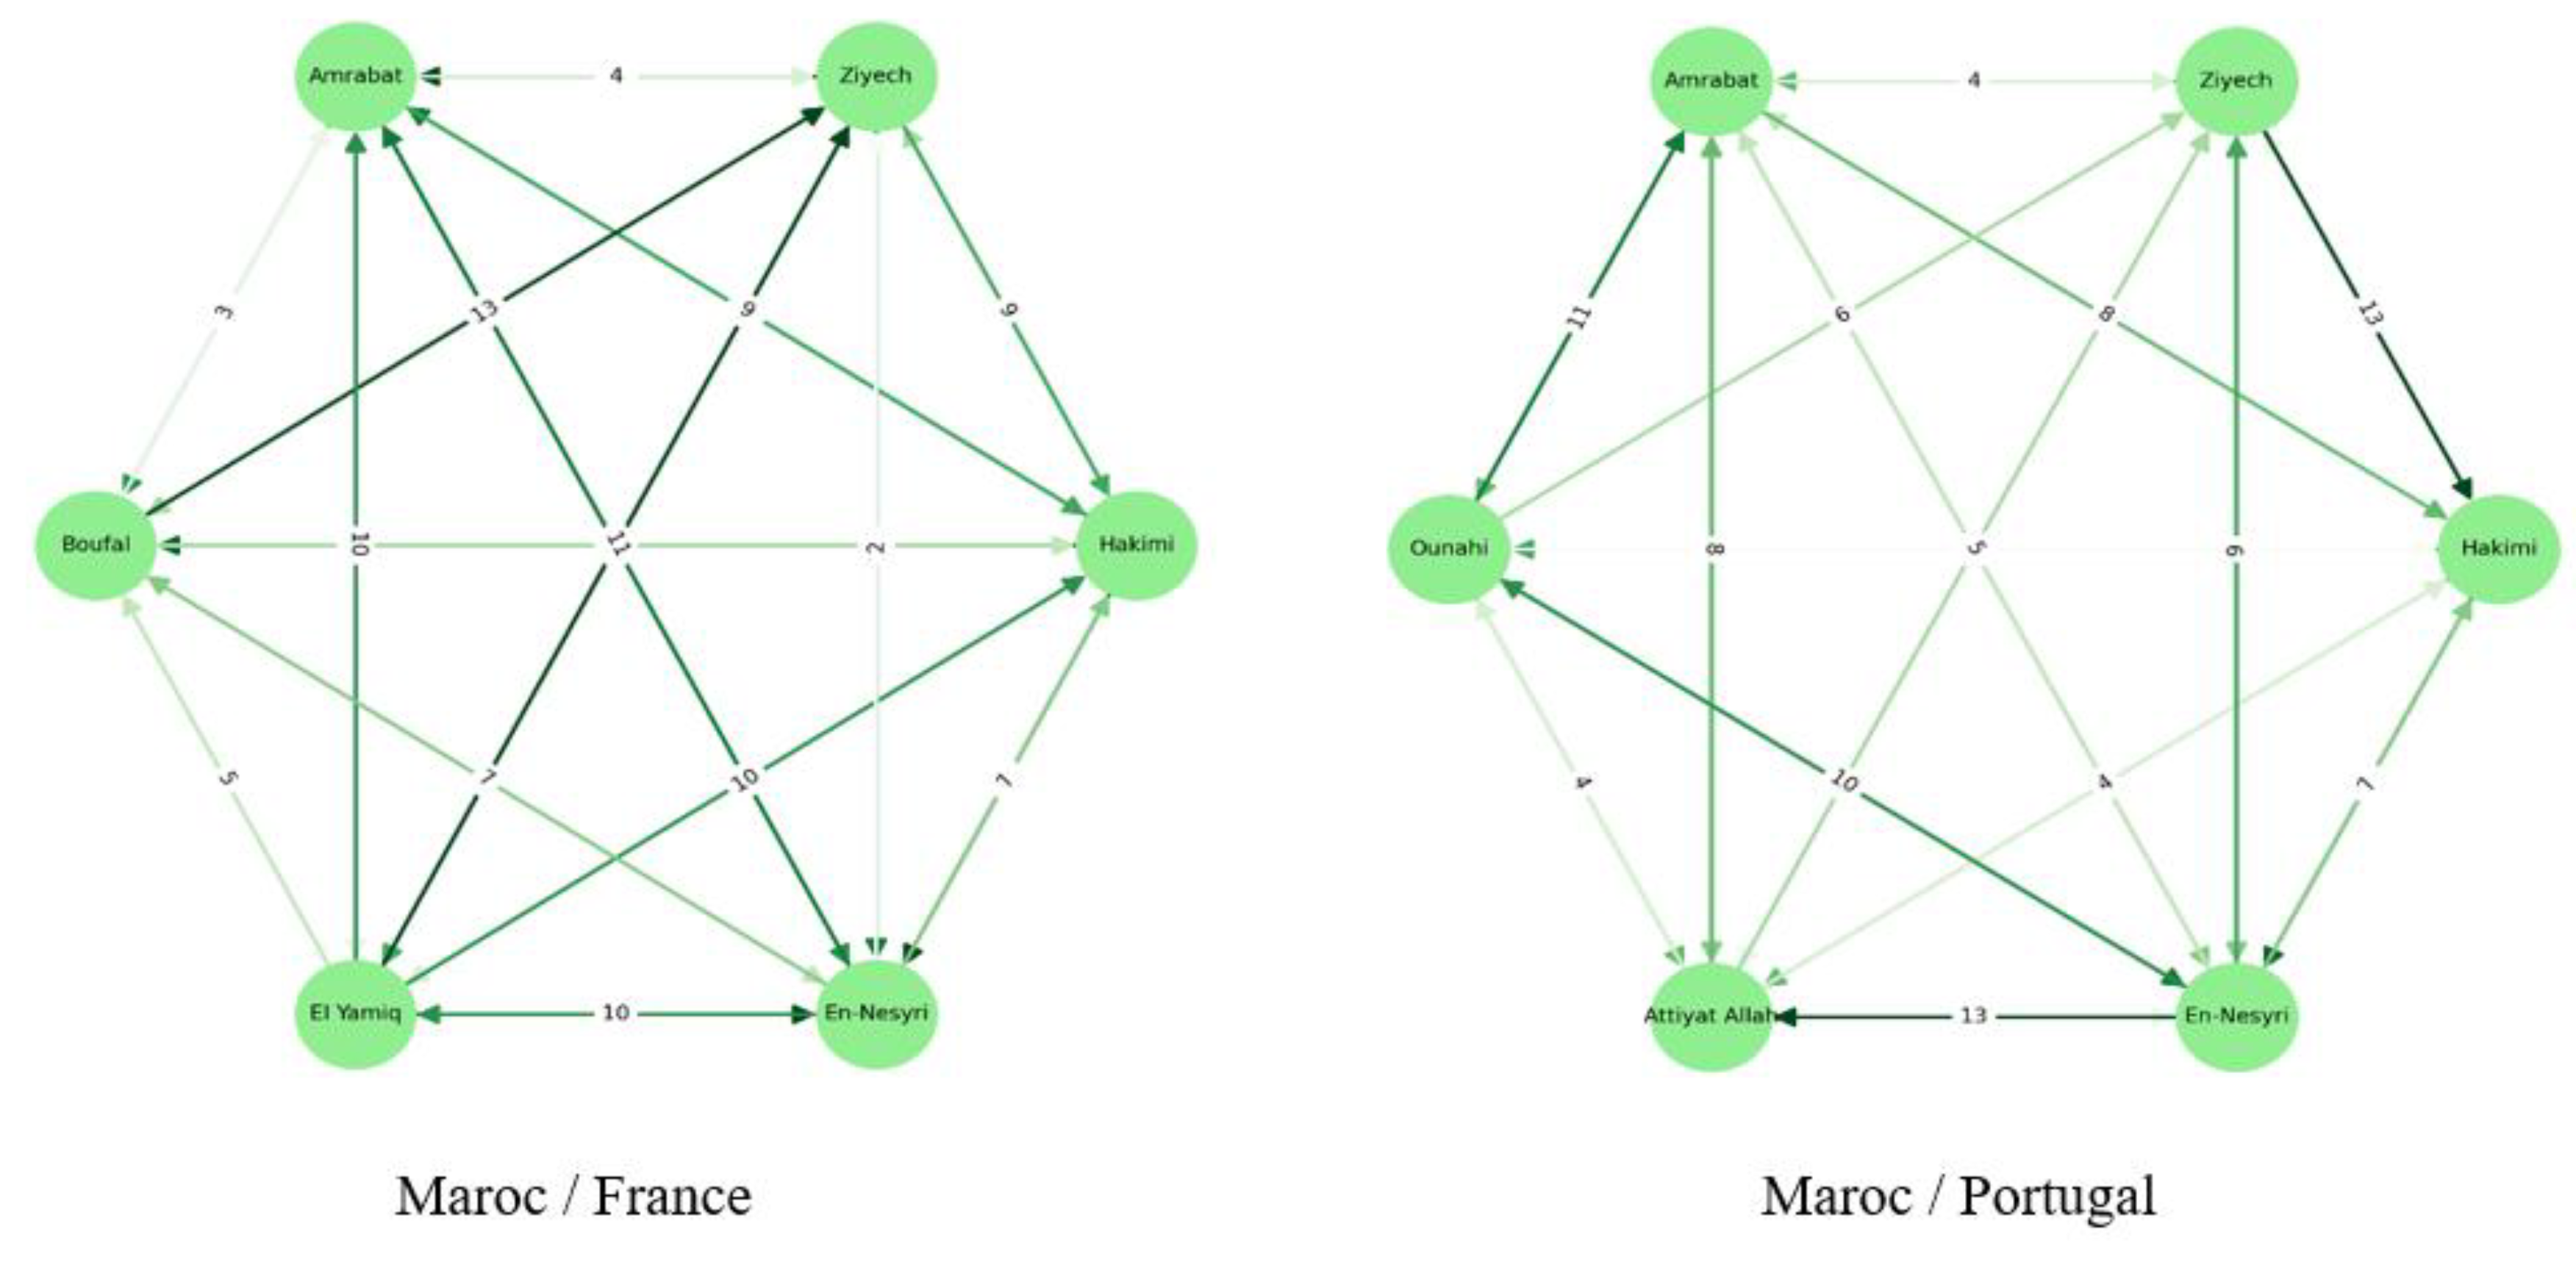
The continuation of Figure 8 of Simplified Pass Networks on two other matches: Morocco vs France: structure around Amrabat and Ounahi, with Ziyech very connected to Hakimi. Morocco vs Portugal: more balanced circulation, importance of Attiyat Allah on the left. Figure 10: Positions moyennes des joueurs: Maroc
This map shows the average positions of 10 Moroccan players on a standard pitch. It highlights the goalkeeper (Bounou) at the bottom of the figure (depth = 0), a compact defensive block of four, a central pivot (Amrabat), and a triangular attack consisting of the offensive players Ziyech, En-Nesyri, and Boufal, who are positioned higher up (depth toward the opponent). The structure clearly shows a dynamic 4-1-4-1 formation, with Amrabat playing as a sweeper.
4. Discussion
The tactical-physical profile of the Moroccan men’s national team for the 2022 World Cup (hybrid performance model: fast transition football + skill + higher defensive cussedness + rational tactics management). Unlike other teams that are based on territorial or high possession or byte alchemy, a coordinated defensive scheme called forward reading does not work. Balancing pressure and good defensive positioning, along with effective collective effort management, has led the Moroccans to achieve an excellent result against theoretically more vigorous opponents.
a. Collective performance based on tactical discipline
FIFA post-match statistics do not make for a pretty read. Still, the data show how Morocco failed to hold more than 50 percent possession (Figure 3) and dipped as low as 23 percent against Spain, yet achieved some quite impressive defensive stability. It was this capacity to control the game without the ball that was facilitated by a collective organization based around a structured mid-basal block, which minimizes the space between the lines and facilitates density in key areas. This trend is echoed by the average position map (See Figure 9), which shows that the team sits in a relatively deep 4-1-4-1 formation, with Amrabat dropping deep to cover the midfield. This is compatible with the models of Rein and Memmert (2016), which assumed that defensive structuring (due to the positioning of players and coordinated pressure) might be equally effective as a man-oriented pressing.
b. Match profiles in revealing tactical adaptability.
Principal component analysis (PCA) using unsupervised clustering separated the seven matches into three different clusters (Figure 1):
Profile 1: deep block, high defensive pressure (vs.Spain, Croatia 1st leg),
Profile 2: managing fast transitions with offensively challenged (Belgium, Portugal),
Profile 3: Ownership shared with defenders and mild exposure to the second team (vs. France, Croatia, third place).
These central tendencies highlight the potential to tactically adapt depending on the type of opponent faced, a phenomenon described by Rein and Memmert (2016) as "contextual intelligence in elite soccer," which is the ability to adjust one’s game model to contextual constraints.
c. Physical mobilization and continuity of effort in common
When considered together as a physical whole (Table 3), the collective data reflect high values in the distance (over 106 km per match), with the peak value being against Spain (120.2 km), followed by France (118.9 km), corresponding with periods of high defensive intensity (Figure 4). High-intensity distance, sprints, and accelerations/decelerations were higher than the previous match averages (Perl et al., 2020), indicating a physical commitment consistent with a challenging playing system. The even distribution of collective effort is also evident from the D2 relevance index (average of 9.9+ km (5 out of 7 matches)), proving that the lines evenly share intensity.
d. Distinct personal profiles: stability, explosiveness, and adjustment
The individual analysis (Table 4, Figure 6 and Figure 7) shows specific functional profiles: Amrabat: an important player, solid in his contribution, constant throughout the seven games (>10 km per game); Hakimi: an explosive full-back with peaks in sprints and HIA; Ziyech: creator, racks up band offensive output; and Willian: pes creator, decent offensive output. The defensive contribution would be responsible for creating chances for the pacy wingers and forward line I have suggested. Ounahi: A projection player into those inter-zone areas. These profiles are consistent with the findings of Bilek and Ugrinovic (2023), who suggested that the individualism of physical performance enables a more nuanced understanding of player roles, functions, and responsibilities within the team.
e. Networks and the spatialization of collective dynamics
Passing networks. Figure 8 illustrates the predominance of the right-wing in Morocco’s playing structure (Hakimi–Ziyech) and also the central role of Amrabat in the initial phase of play. With flair passes dominating midfield, it is verticality that is being sought rather than sterile lateral possession. This pattern is confirmed by the heatmap (Figure 5), which shows a cluster of actions on the right and intense defensive resistance in the lower zones, particularly against stronger rivals such as Spain and France.
f. The Moroccan model and how it applies to the world situation
(Multi-) Level 3: The multi-level analysis advanced in this study, which ties together visualization, AI, tactical modeling, and the physical DiCOSTe concept, argues for the effectiveness of a pragmatic and contextualized playing model in a major tournament. In a setting where professional soccer often employs hybrid systems, Moroccan performance confirms the hypothesis that performance does not rely exclusively on possession but is based on the ability to structure, absorb, and relaunch the game at high intensity (Sampaio and Leite, 2022; McLoughlin et al., 2021).
5. Conclusions
The 2022 FIFA World Cup Qatar analysis of the Moroccan national team’s gameplay reveals a coherent model characterized by continuity, rationality, adaptability, intelligent management of collective effort, a solid defensive organization, and the ability to adapt to the opponent’s requirements. In contrast to the predominant paradigms of contemporary football, which are predicated on possession based on complicity or systematic verticality, Morocco has offered us a synthesis of collective intelligence in operation: to make the best use of transitions, to exploit the defensive side to the maximum, and to adapt the system to the context. The outcomes achieved have demonstrated how data analytics (FIFA reports), visualization (radars, heat maps, passing networks), and AI (PCA, clustering) facilitate the formalization of reproducible performance profiles. The study confirms that human high-performance Aspects of high-level performance can be modeled and trained using available digital tools (Rein and Memmert, 2016; Bilek and Ugrinovic, 2023). Any sustainable performance policy must cross-reference physical, tactical, and structural information to ensure comprehensive coverage. The rigorous methodology can enable us to identify high-yield performance levers even in "reactive" game states.
- Outlook
Major events are coming up, like the 2025 African Cup of Nations in Morocco, the 2026 World Cup in North America, and, above all, the 2030 World Cup being co-hosted by Morocco, so the national technical structures need to: Embed data and AI in preparation and monitoring activities. Establish personalized and contextual load profiles supported by GPS sensors and dynamic decision-making signals. Reinforce the integration between technical labor, analysis units, health staff, and professionals working in data science to refine the performance of the entire chain. Finally, it can be applied to other situations (such as other national leagues, women’s soccer, and youth competitions) and help develop a scientific and technological ecosystem at the service of Moroccan football.
6. Patents
The authors declare that there are no patents resulting from the work reported in this manuscript.
Author Contributions
Conceptualization, M.B. and S.E.M.; methodology, M.B. and L.Z.; software, L.Z.; validation, M.B., N.E., and F.-Z.G.; formal analysis, M.B.; investigation, M.B. and L.Z.; resources, S.E.M.; data curation, M.B.; writing—original draft preparation, M.B.; writing—review and editing, M.B., S.E.M., and F.-Z.G.; visualization, L.Z.; supervision, N.E.; project administration, S.E.M.; funding acquisition, Not applicable. All authors have read and agreed to the published version of the manuscript.
Funding
This research received no external funding. The APC was funded by the authors’ affiliated institutions.
Institutional Review Board Statement
Not applicable.
Informed Consent Statement
Not applicable.
Data Availability Statement
The data presented in this study are available on request from the corresponding author. The data are not publicly available due to confidentiality agreements with the football federation and match data providers.
This study does not involve dual-use research concerns (DURC) and is therefore exempt from the DURC declaration.
Acknowledgments
The authors would like to thank the Royal Moroccan Football Federation (FRMF) for facilitating access to match data and post-match reports, as well as the technical and performance staff for their valuable collaboration.
During the preparation of this manuscript, the authors utilized ChatGPT (OpenAI, GPT-4, 2025 version) to support the structuring of sections, refine language, and generate LaTeX-ready tables and figure captions. The authors have reviewed and edited all AI-generated content and take full responsibility for the final version of the manuscript.
Conflicts of Interest
The authors declare that they have no conflicts of interest. The funders had no role in the design of the study, in the collection, analysis, or interpretation of data, in the writing of the manuscript, or in the decision to publish the results.
Abbreviations
The following abbreviations are used in this manuscript:
| AI | Artificial Intelligence |
| FIFA | Fédération Internationale de Football Association |
| FRMF | Fédération Royale Marocaine de Football |
| GPS | Global Positioning System |
| HIA | High-Intensity Activity |
| PCA | Principal Component Analysis |
| xG | Expected Goals |
| WC | World Cup |
References
- Andrienko, G.; Andrienko, N.; Fuchs, G.; Wood, J. Visual analytics methodology for eye movement studies in football. Data Min. Knowl. Discov. 2021, 35, 1234–1255. [Google Scholar]
- Bilek, L.; Ugrinovic, I. Individual performance profiles in elite football: A multi-contextual analysis. Int. J. Sports Sci. Coach. 2023, 18, 33–45. [Google Scholar]
- McLoughlin, E.; O’Donoghue, P.; Sampaio, J. Performance indicators in football: A critical review and research agenda. Eur. J. Sport Sci. 2021, 21, 135–151. [Google Scholar]
- McLoughlin, G.; O’Donoghue, P.; Hughes, M. Automated football performance analysis using machine learning: A systematic review. Int. J. Perform. Anal. Sport 2021, 21, 735–757. [Google Scholar]
- Perl, J.; Memmert, D.; Hagemann, N. Data analytics in elite sports: Tactical, physical and psychological dimensions. J. Sports Anal. 2020, 6, 145–162. [Google Scholar]
- Perl, J.; Memmert, D.; Lames, M. 3D spatiotemporal analysis of team sports: New perspectives for performance assessment. J. Sports Anal. 2020, 6, 89–104. [Google Scholar]
- Rein, R.; Memmert, D. Big data and tactical analysis in elite soccer: Future challenges and opportunities for sports science. SpringerPlus 2016, 5, 1410. [Google Scholar] [CrossRef]
- Sampaio, J.; Leite, N. Tactical behavior and match analysis in soccer: From descriptive to predictive models. Front. Sports Act. Living 2022, 4, 905478. [Google Scholar]
- Sampaio, J.; Leite, N. AI-based decision support systems in elite football: From match statistics to tactical modeling. Eur. J. Sport Sci. 2022, 22, 1121–1135. [Google Scholar]
- Fédération Internationale de Football Association (FIFA). FIFA World Cup Qatar 2022™ – Post-Match Reports; FIFA: Zurich, Switzerland, 2022. [Google Scholar]
- Bourbousson, J.; Poizat, G.; Saury, J.; Seve, C. Team coordination in basketball: Description of the cognitive connections among teammates. J. Appl. Sport Psychol. 2010, 22, 150–166. [Google Scholar] [CrossRef]
- Liu, H.; Gómez, M.A.; Lago-Peñas, C. Match performance profiles of goalkeepers of elite football teams. Int. J. Sports Sci. Coach. 2015, 10, 669–682. [Google Scholar] [CrossRef]
- Russomanno, T.; Linke, D.; Geromiller, M.; Lames, M. Performance of performance indicators in football. Int. J. Perform. Anal. Sport 2020, 20, 1000–1015. [Google Scholar]
- Pappalardo, L.; Cintia, P.; Ferragina, P.; Massucco, E.; Pedreschi, D.; Giannotti, F. PlayeRank: Data-driven performance evaluation and player ranking in soccer via a machine learning approach. ACM Trans. Intell. Syst. Technol. 2019, 10, 59. [Google Scholar] [CrossRef]
- Rossi, A.; Pappalardo, L.; Cintia, P.; Iaia, M.; Fernandez, J.; Medina, D. Effective injury forecasting in soccer with GPS training data and machine learning. PLOS ONE 2018, 13, e0201264. [Google Scholar] [CrossRef]
- Kim, H.; Kim, B.; Chung, D.; Yoon, J.; Ko, S.-K. SoccerCPD: Formation and role change-point detection in soccer matches using spatiotemporal tracking data. IEEE Trans. Knowl. Data Eng. 2022, 34, 4912–4925. [Google Scholar]
- Silvino, M.P.F.; Sarmento, H.; Teoldo, I. Comparing the tactical behavior of young soccer players in full- and small-sided games. J. Sports Sci. 2024, 42, 345–353. [Google Scholar] [CrossRef]
- Castellano, J.; Blanco-Villaseñor, Á.; Álvarez, D. Contextual variables and time-motion analysis in soccer. Int. J. Sports Med. 2011, 32, 415–421. [Google Scholar] [CrossRef]
- Link, D.; Lang, S.; Seidenschwarz, P. Real-time quantification of danger in football using spatiotemporal tracking data. PLOS ONE 2016, 11, e0168768. [Google Scholar] [CrossRef]
- Memmert, D.; Raabe, D. Data Analytics in Football: Positional Data Collection, Modelling and Analysis; Springer: Berlin, Germany, 2019. [Google Scholar]
- Lames, M.; McGarry, T. On the search for reliable performance indicators in game sports. Int. J. Perform. Anal. Sport 2007, 7, 62–79. [Google Scholar] [CrossRef]
- Sampaio, J.; Leite, N. Performance indicators in game sports. In Routledge Handbook of Sports Performance Analysis; McGarry, T., O’Donoghue, P., Sampaio, J., Eds.; Routledge: London, UK, 2013; pp. 115–126. [Google Scholar]
- Memmert, D. Teaching Tactical Creativity in Sport: Research and Practice; Routledge: London, UK, 2019. [Google Scholar]
- Gómez, M.A.; Lago-Peñas, C.; Pollard, R. Situational variables. In Routledge Handbook of Sports Performance Analysis; McGarry, T., O’Donoghue, P., Sampaio, J., Eds.; Routledge: London, UK, 2013; pp. 259–269. [Google Scholar]
- Coutinho, D.; Gonçalves, B.; Travassos, B.; Folgado, H.; Figueira, B.; Sampaio, J. Different marks in the pitch constraint youth players’ performances during football small-sided games. Res. Q. Exerc. Sport 2020, 91, 15–23. [Google Scholar] [CrossRef]
- Llana, S.; Burriel, B.; Madrero, P.; Fernández, J. Is it worth the effort? Understanding and Contextualizing Physical Metrics in Soccer. arXiv 2022, arXiv:2204.02313. [Google Scholar]
- Sampaio, J.; Lago-Peñas, C.; Gómez, M.A. Tactical performance analysis in soccer: New trends and future directions. Sports Med. 2013, 43, 713–728. [Google Scholar]
- Memmert, D.; König, S. Künstliche Intelligenz und maschinelles Lernen in der Sportwissenschaft; Springer-Verlag: Berlin, Germany, 2025. [Google Scholar]
- Gamble, D. Team performance indicators in Gaelic football. Ph.D. Thesis, Dublin City University, Dublin, Ireland, 2020. [Google Scholar]
- Fernández, J.; Bornn, L.; Cervone, D. Decomposing the immeasurable sport: A deep learning expected possession value framework for soccer. In Proceedings of the 24th ACM SIGKDD International Conference on Knowledge Discovery & Data Mining, London, UK; 2018; pp. 320–328. [Google Scholar]
- Memmert, D.; Raabe, D. Data Analytics in Football: Positional Data Collection, Modelling and Analysis, 3rd ed.; Springer: Berlin, Germany, 2023. [Google Scholar]
- Silva, P.; Garganta, J.; Santos, R.; Teoldo, I. Application of entropy measures to analysis of patterns of play in soccer. Int. J. Perform. Anal. Sport 2014, 14, 421–433. [Google Scholar]
Figure 2.
Standardized radar profiles of performance per match for the Moroccan national team during the FIFA World Cup Qatar 2022.
Figure 2.
Standardized radar profiles of performance per match for the Moroccan national team during the FIFA World Cup Qatar 2022.
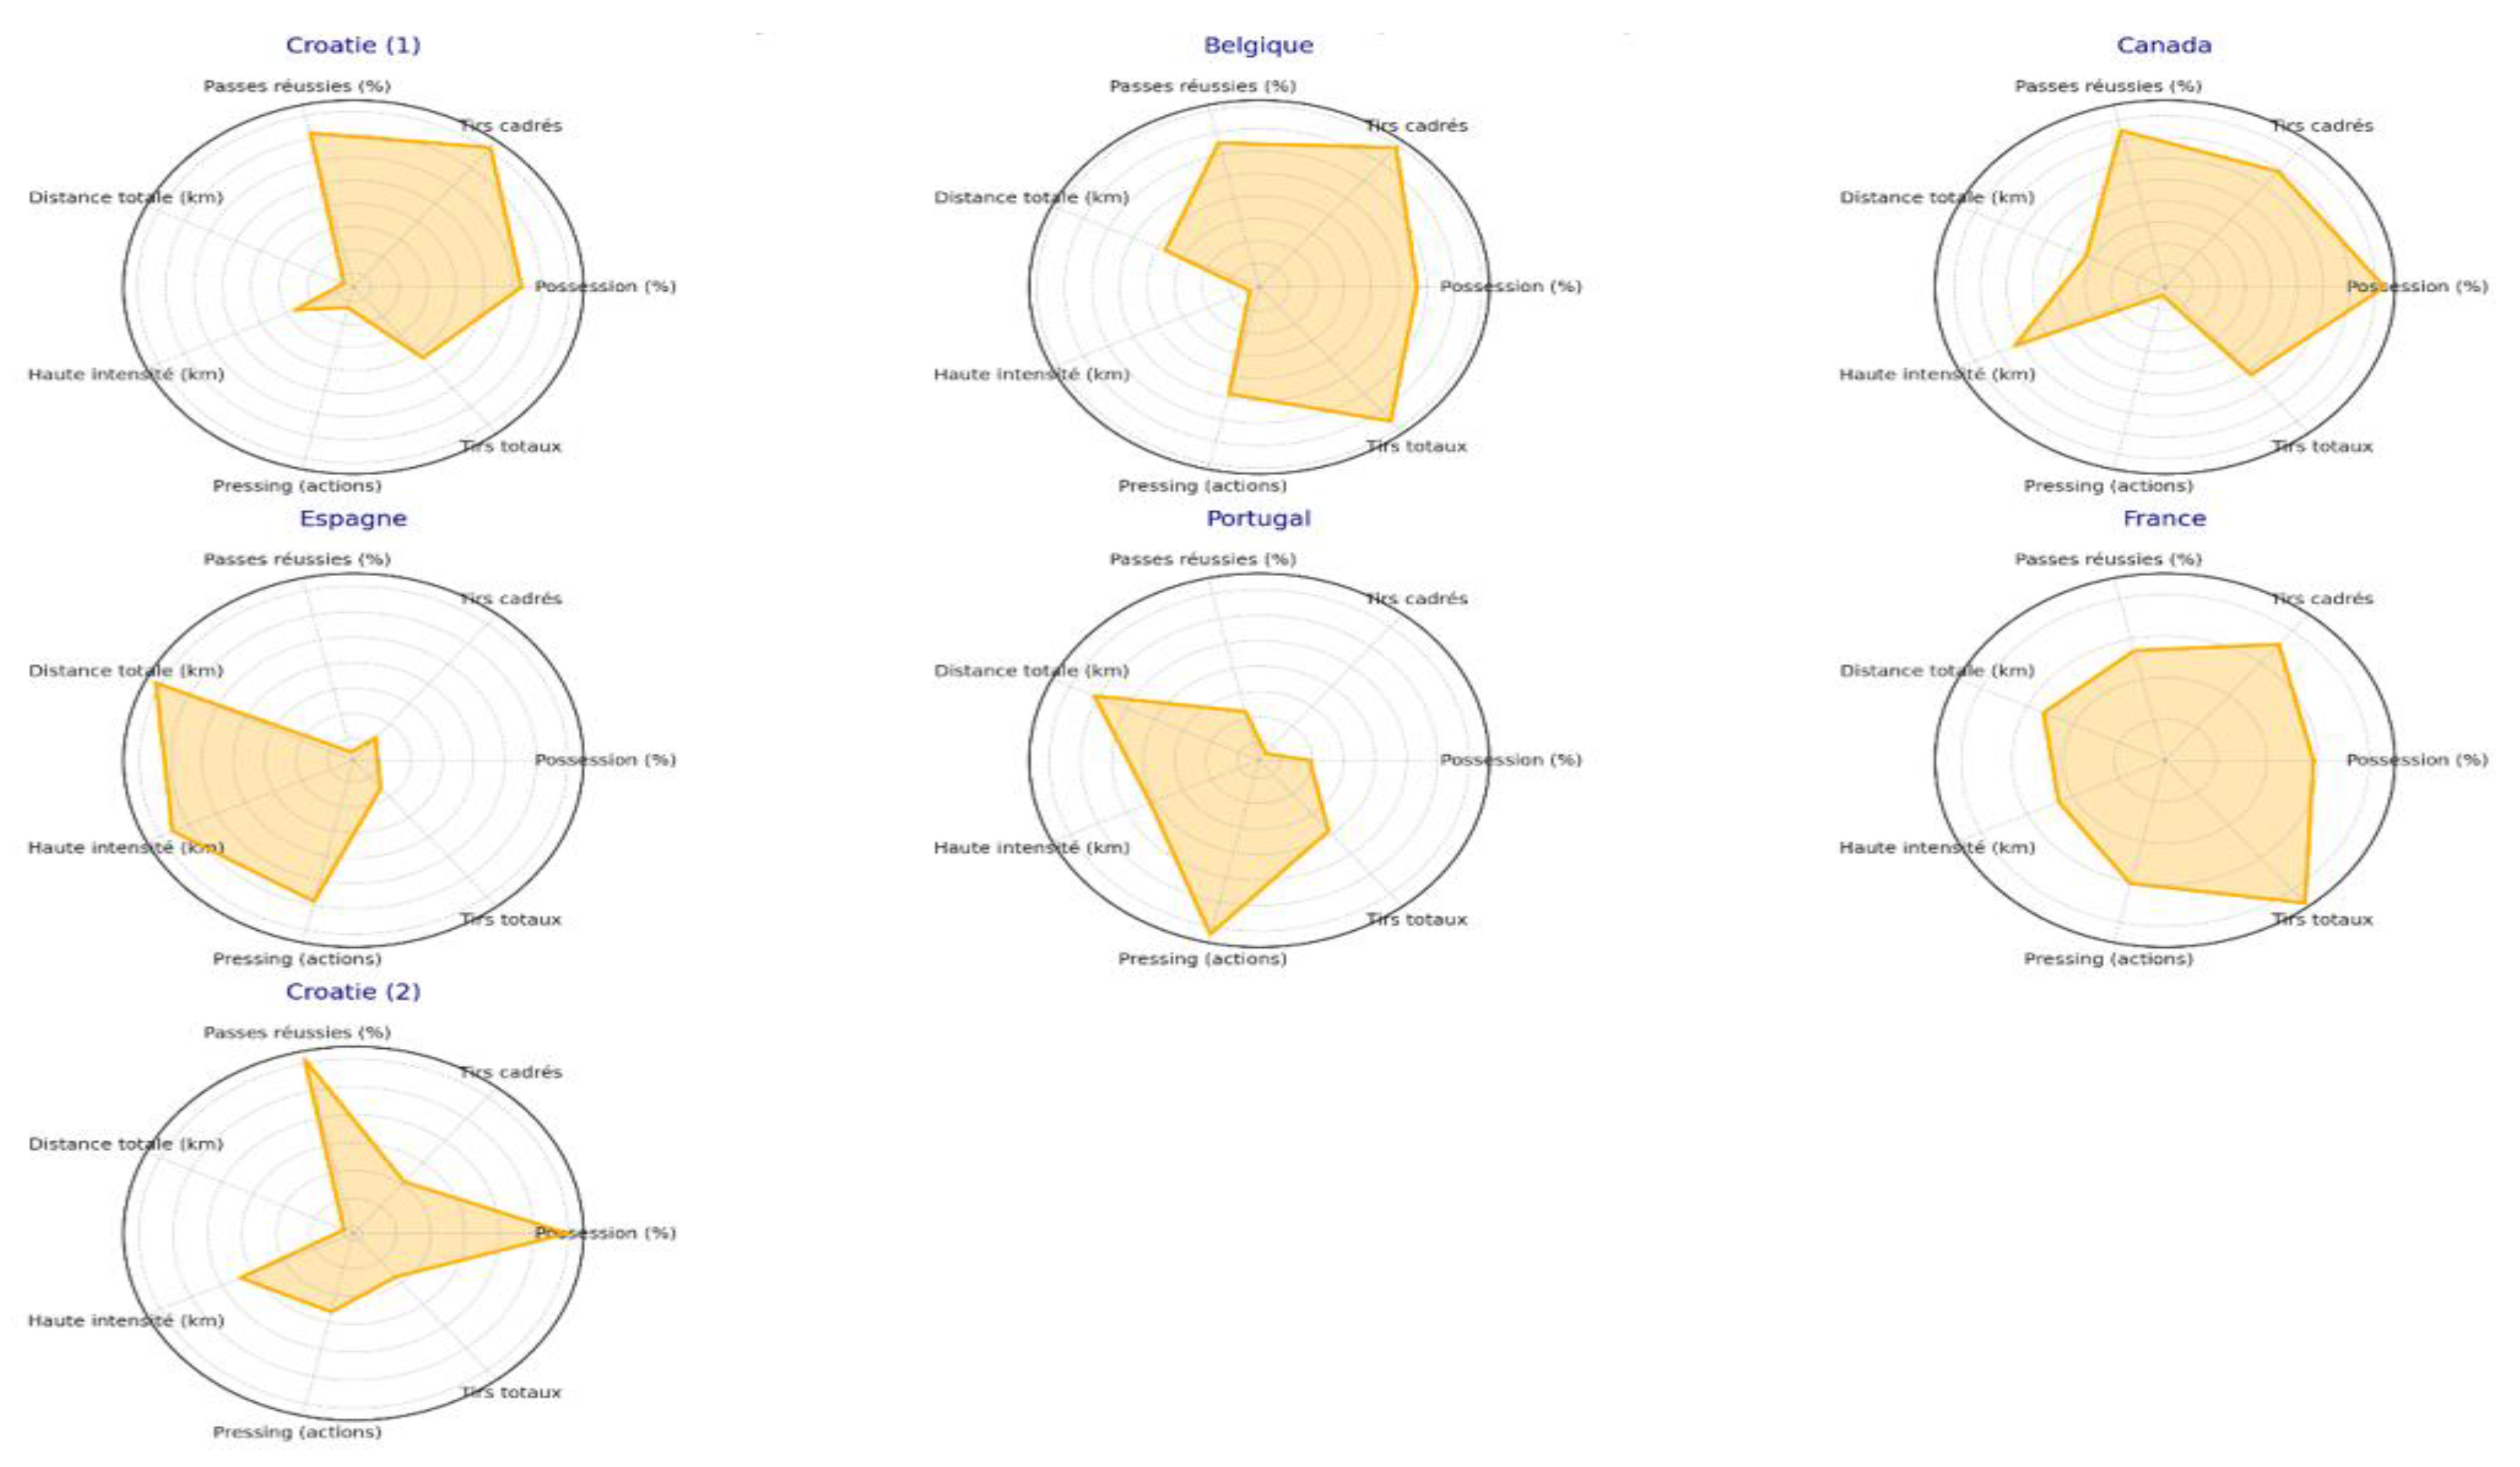
Figure 3.
Évolution de la possession par match.
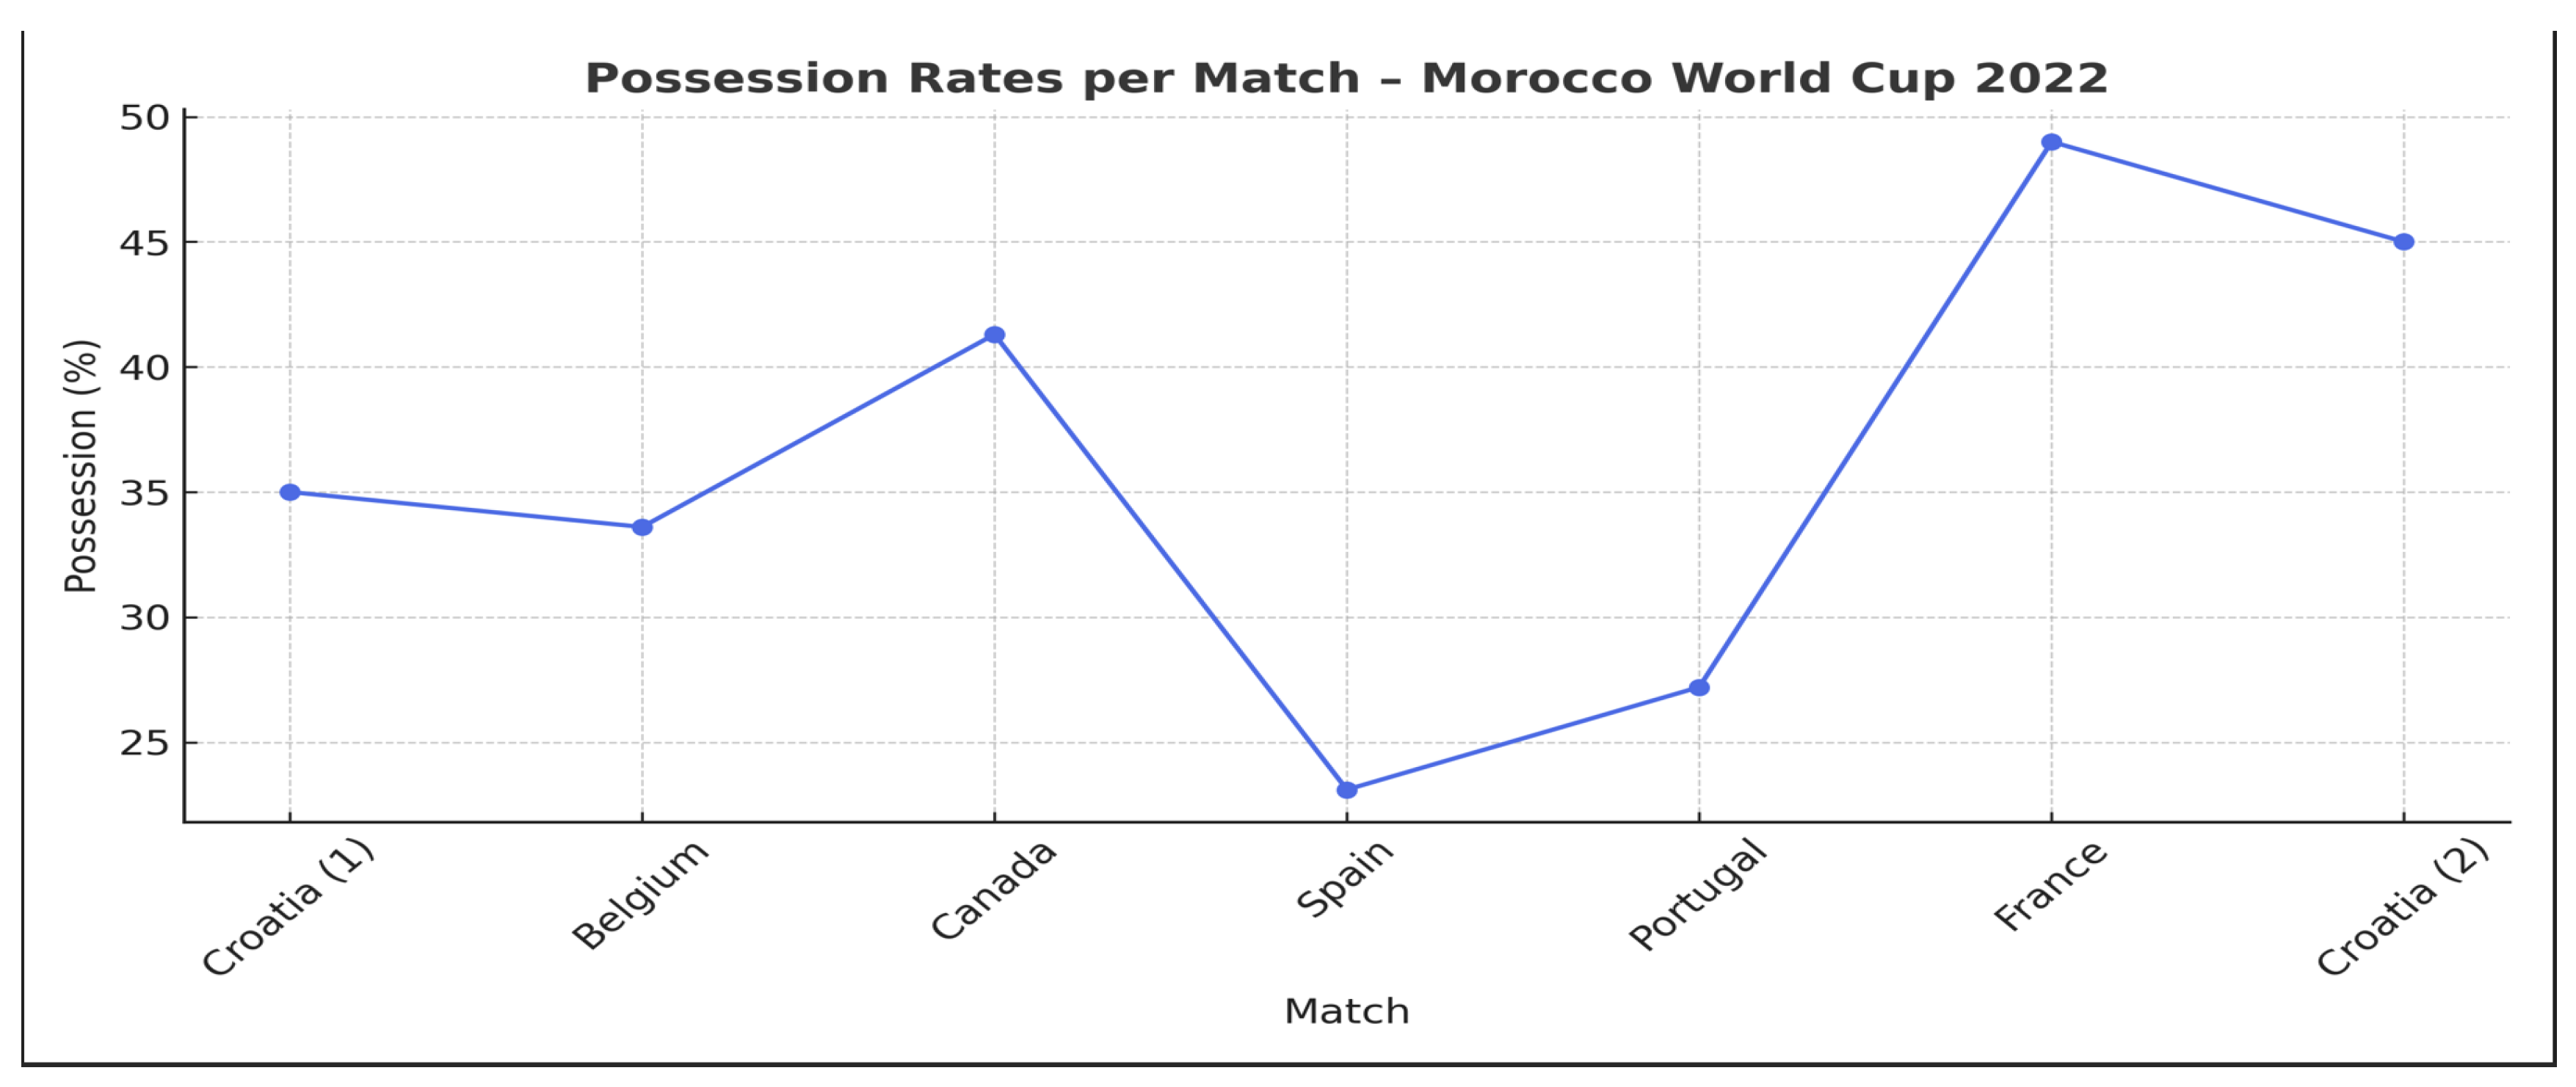
Figure 4.
Change in total distance covered per match.
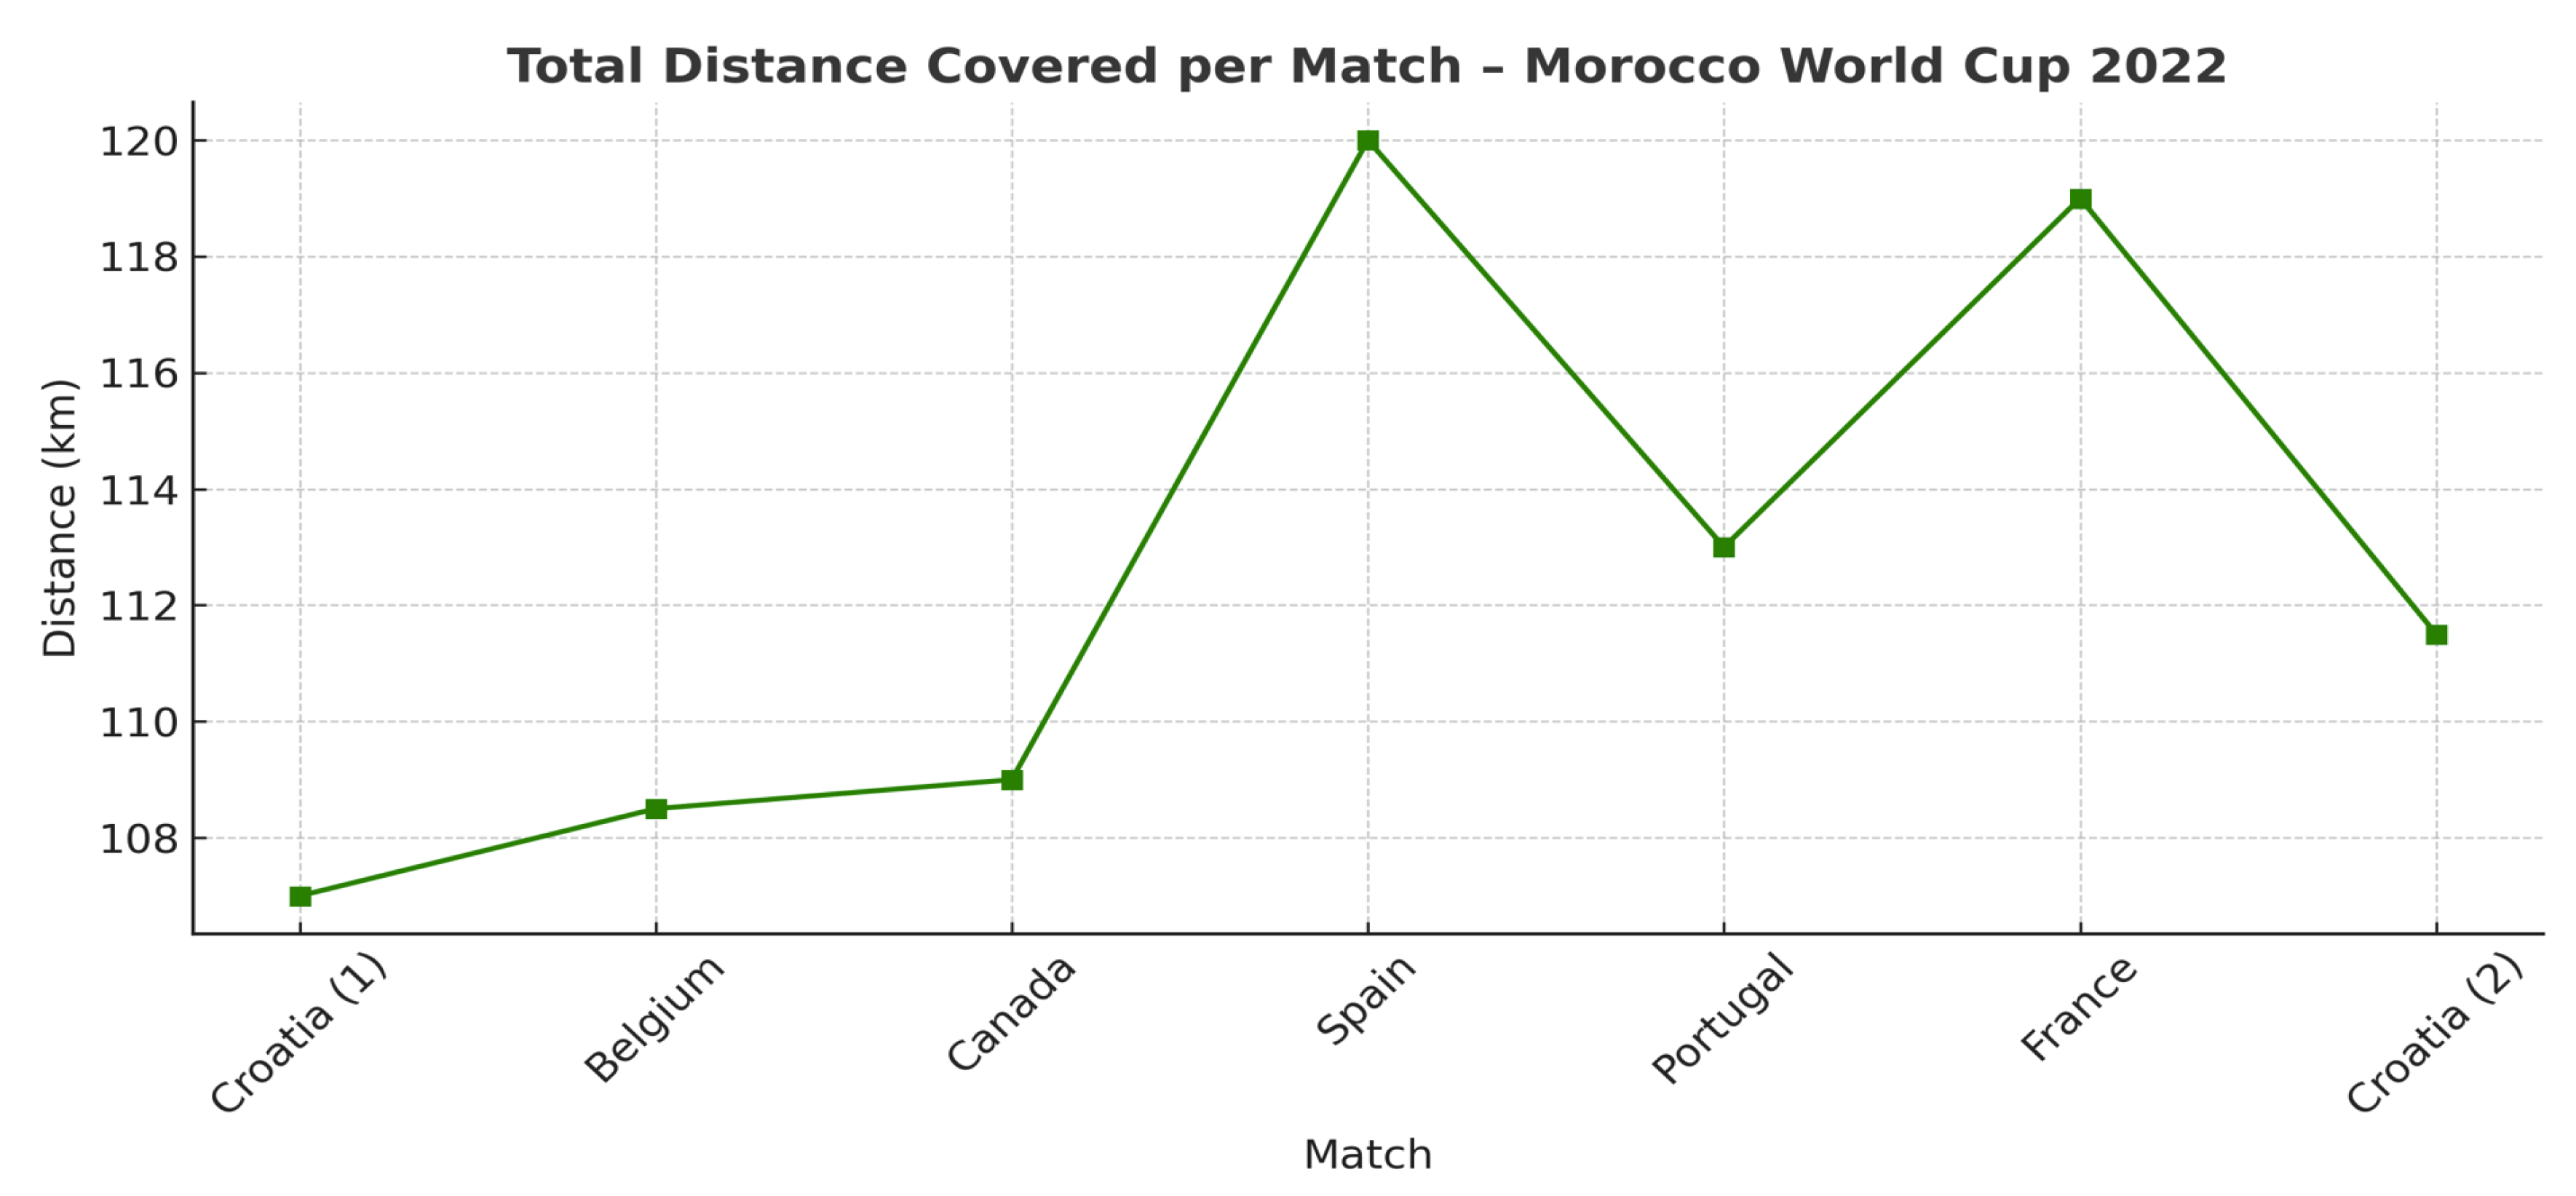
Figure 5.
Action density heat map.
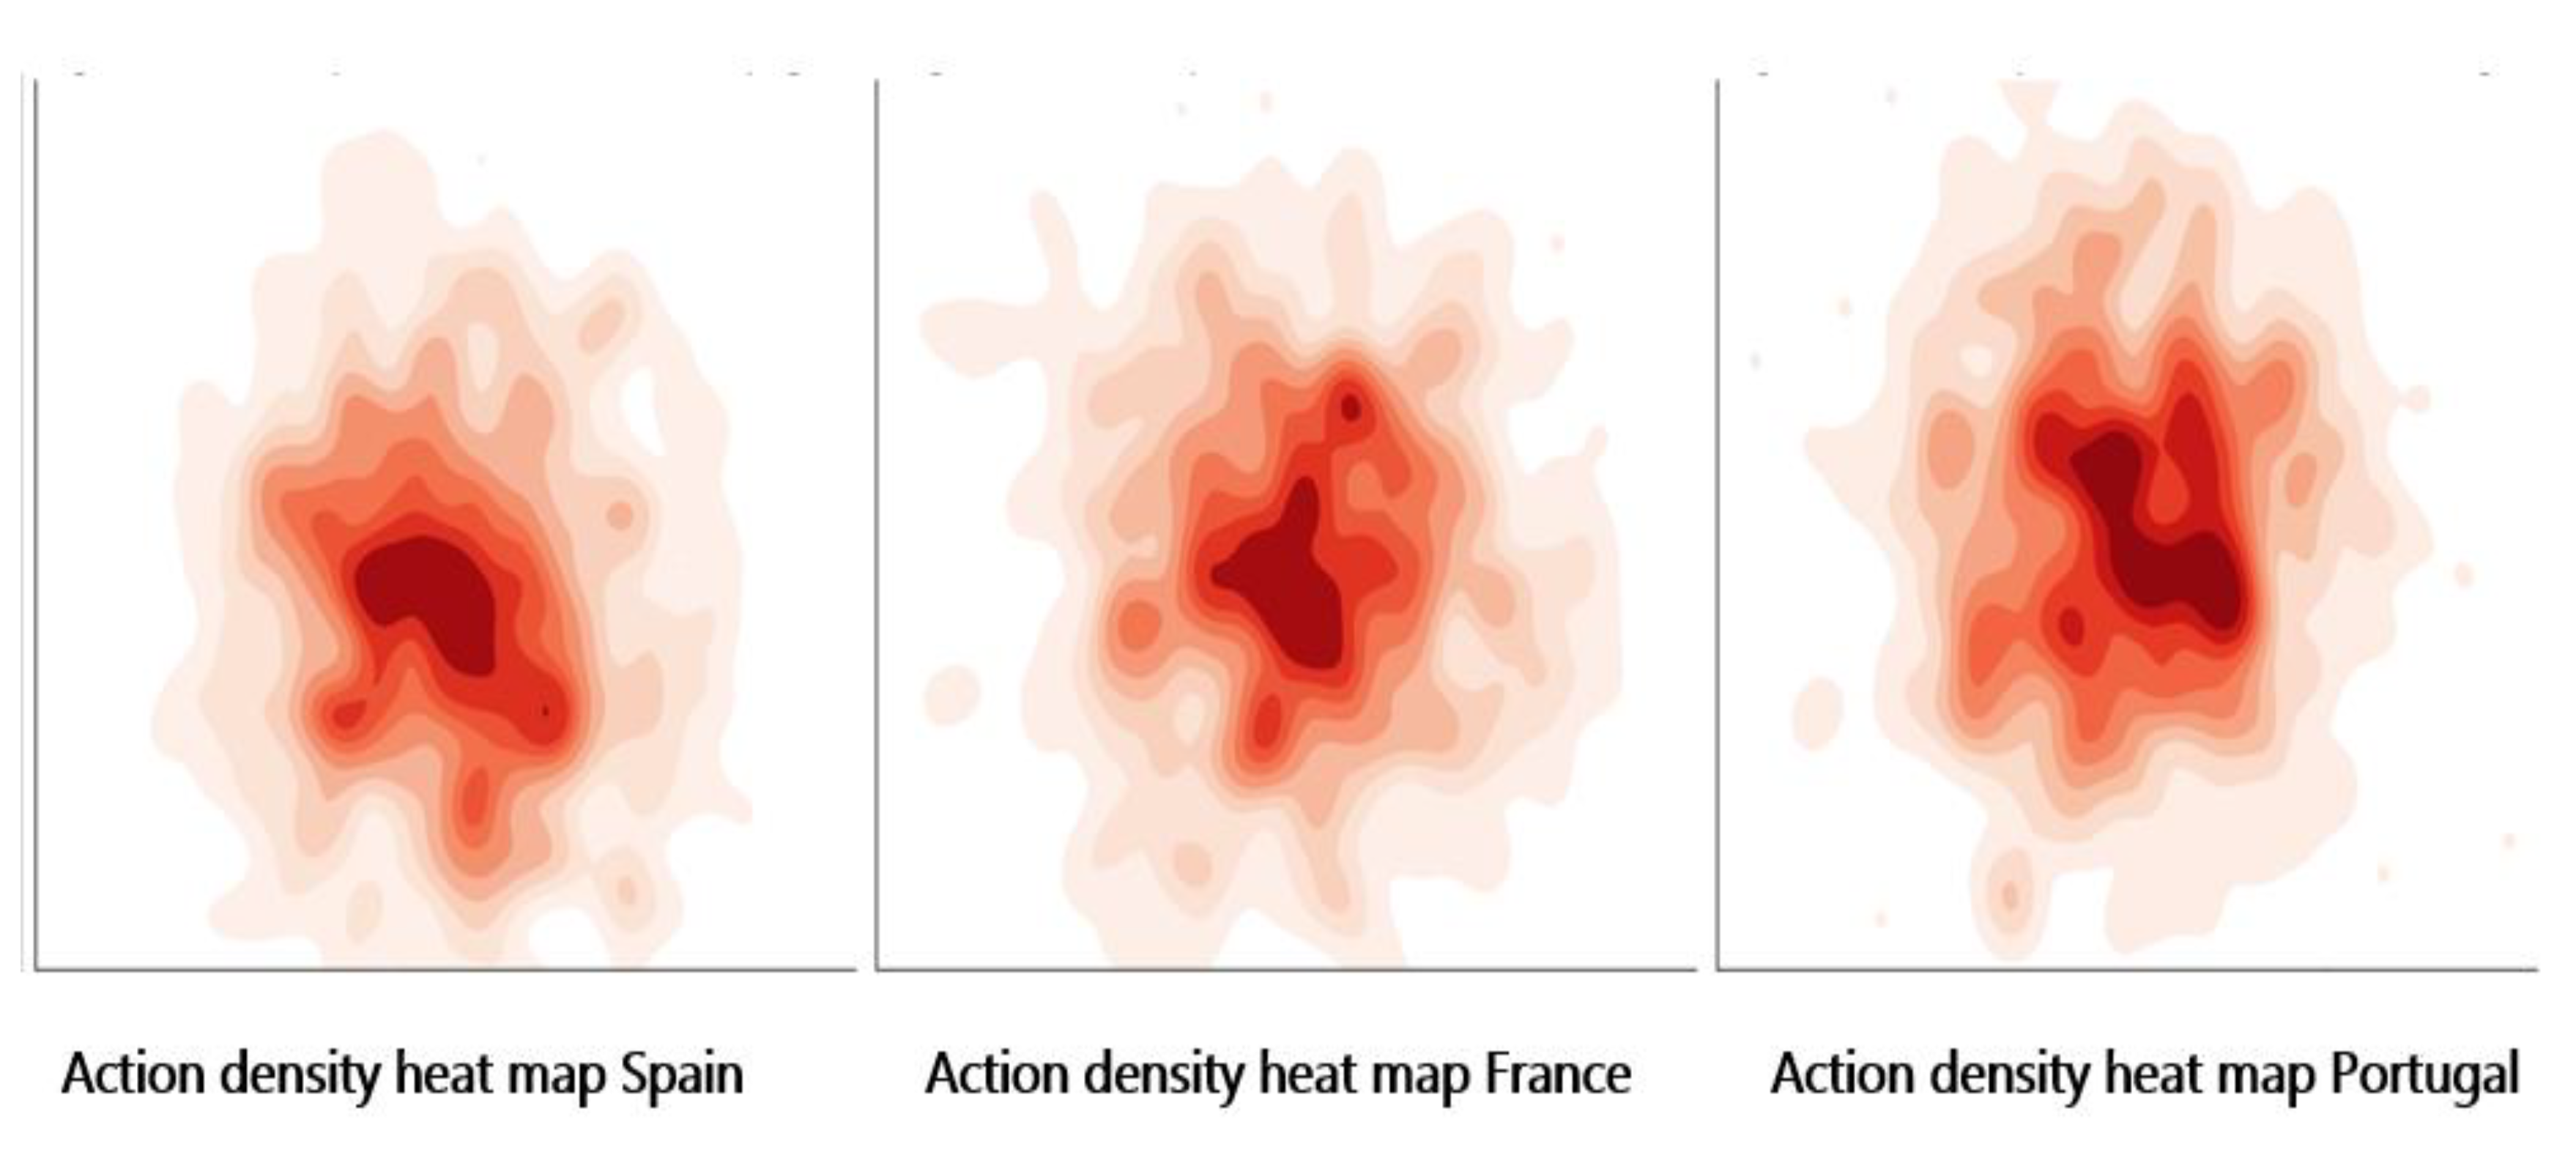
Figure 6.
Distance covered per game for 4 key players.
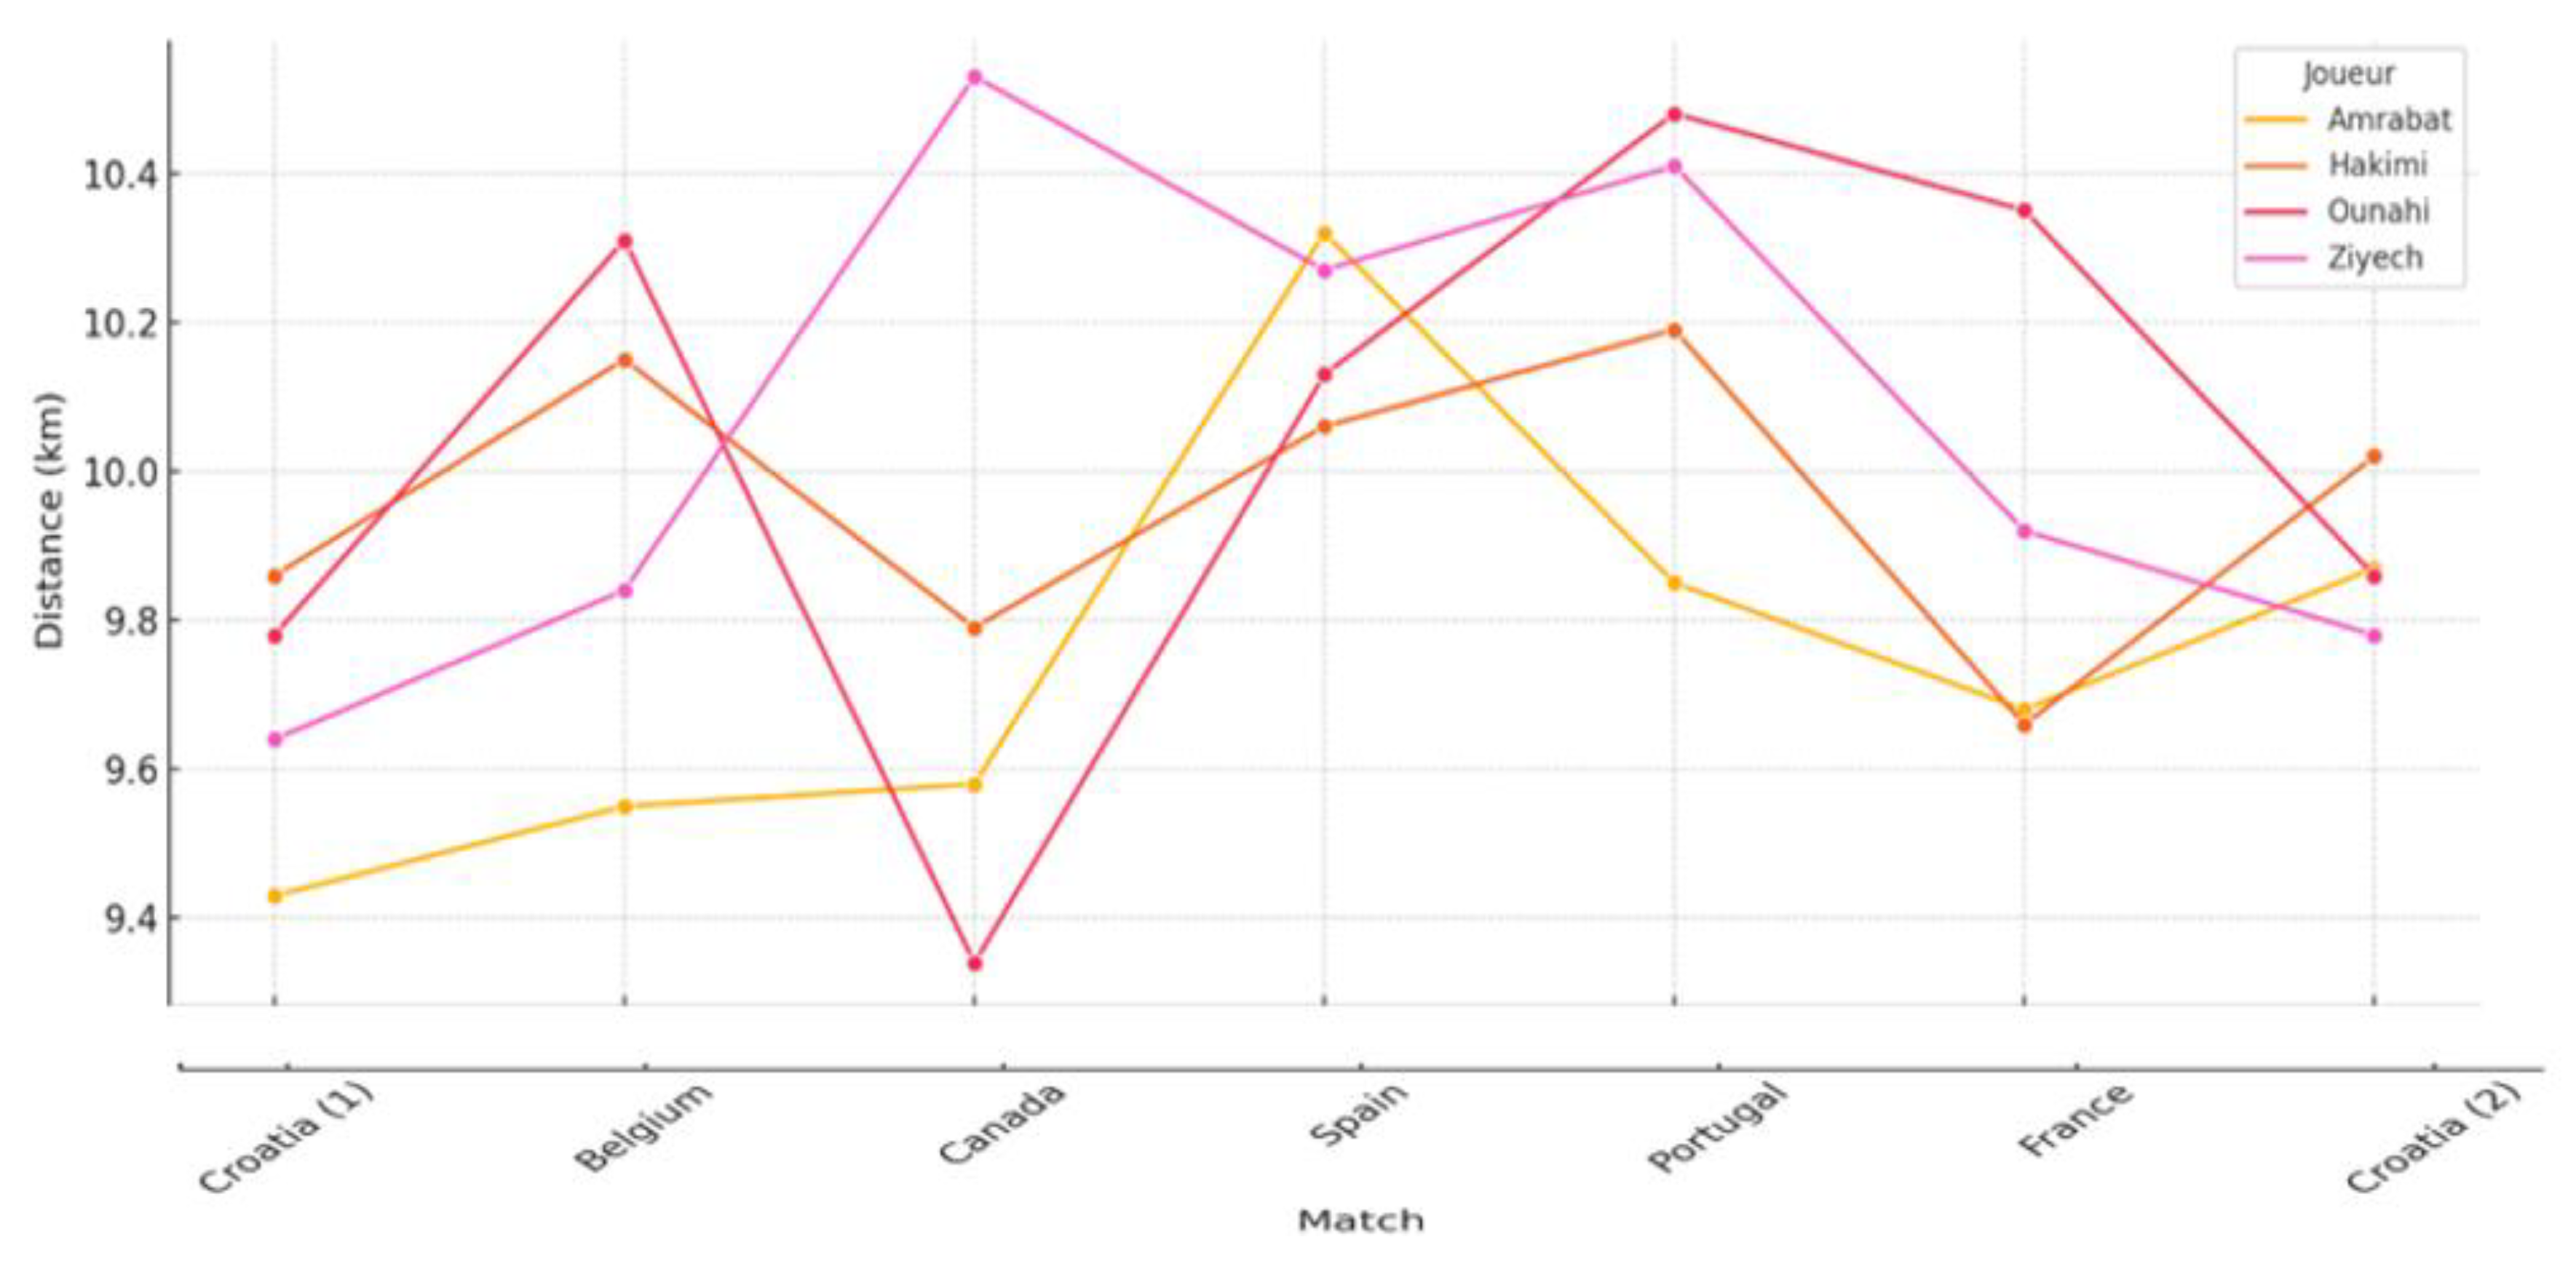
Figure 7.
Radar chart of average physical profiles per player.
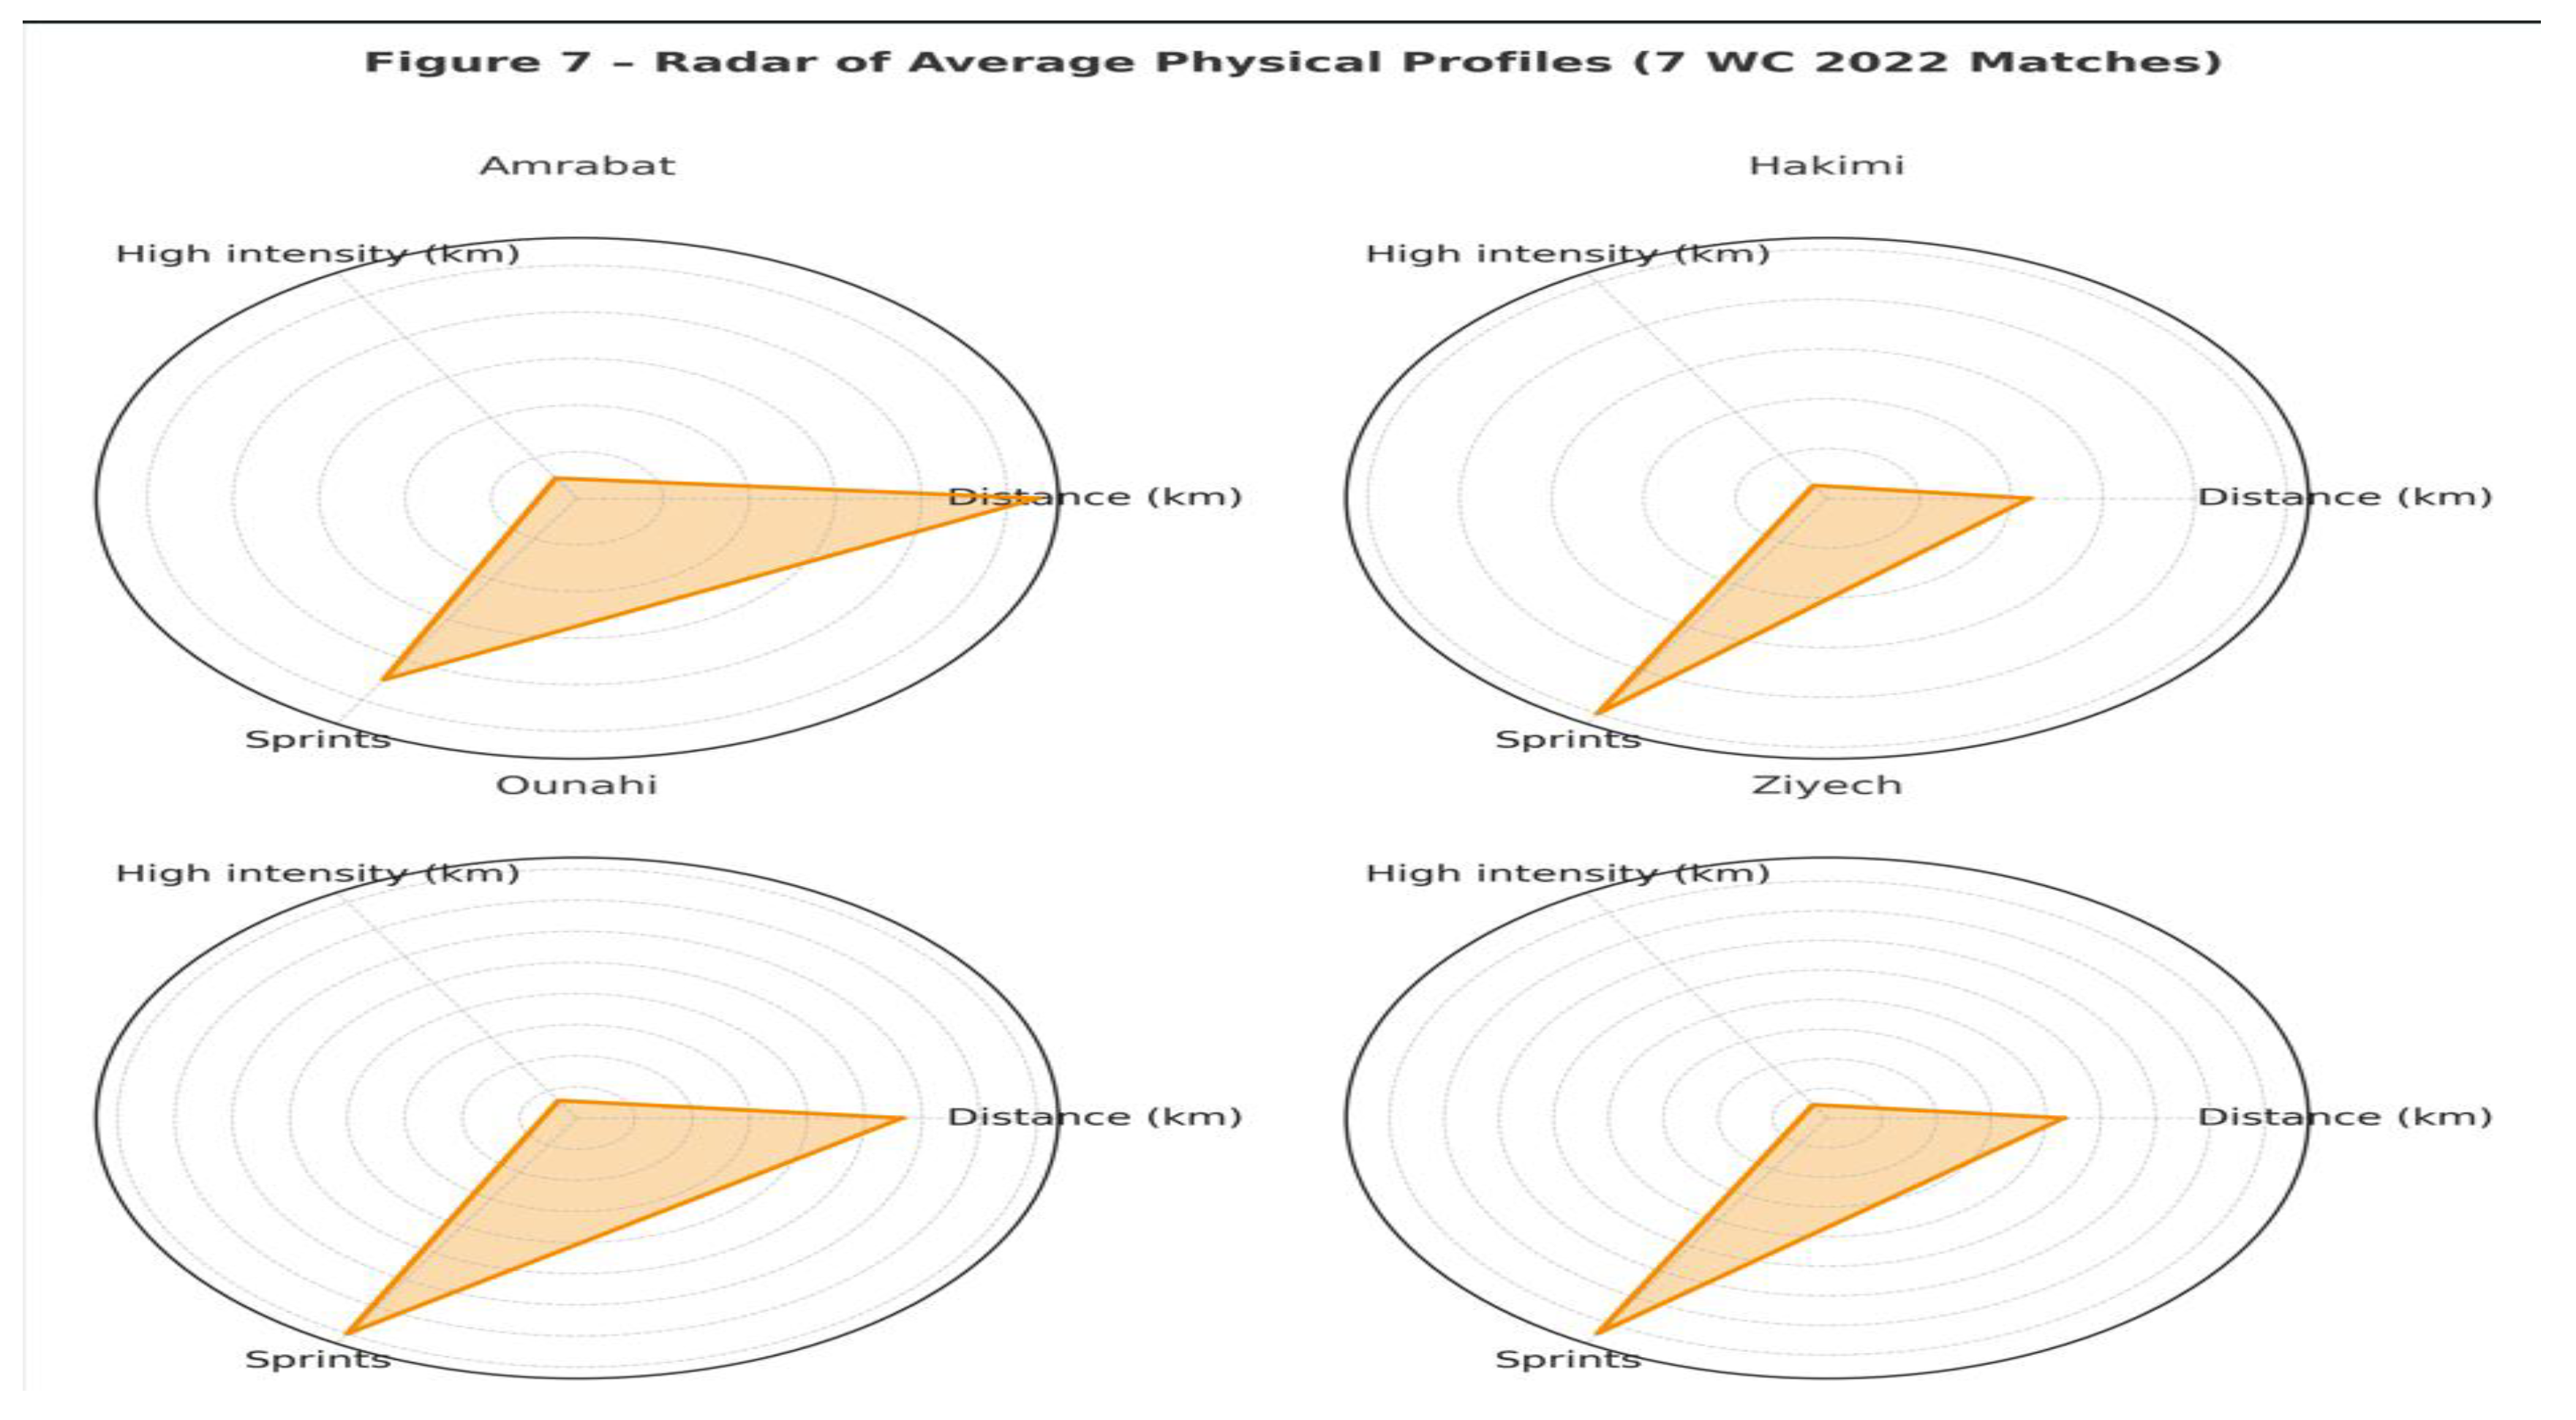
Figure 8.
Réseau de passes simplifié : Maroc vs Espagne.
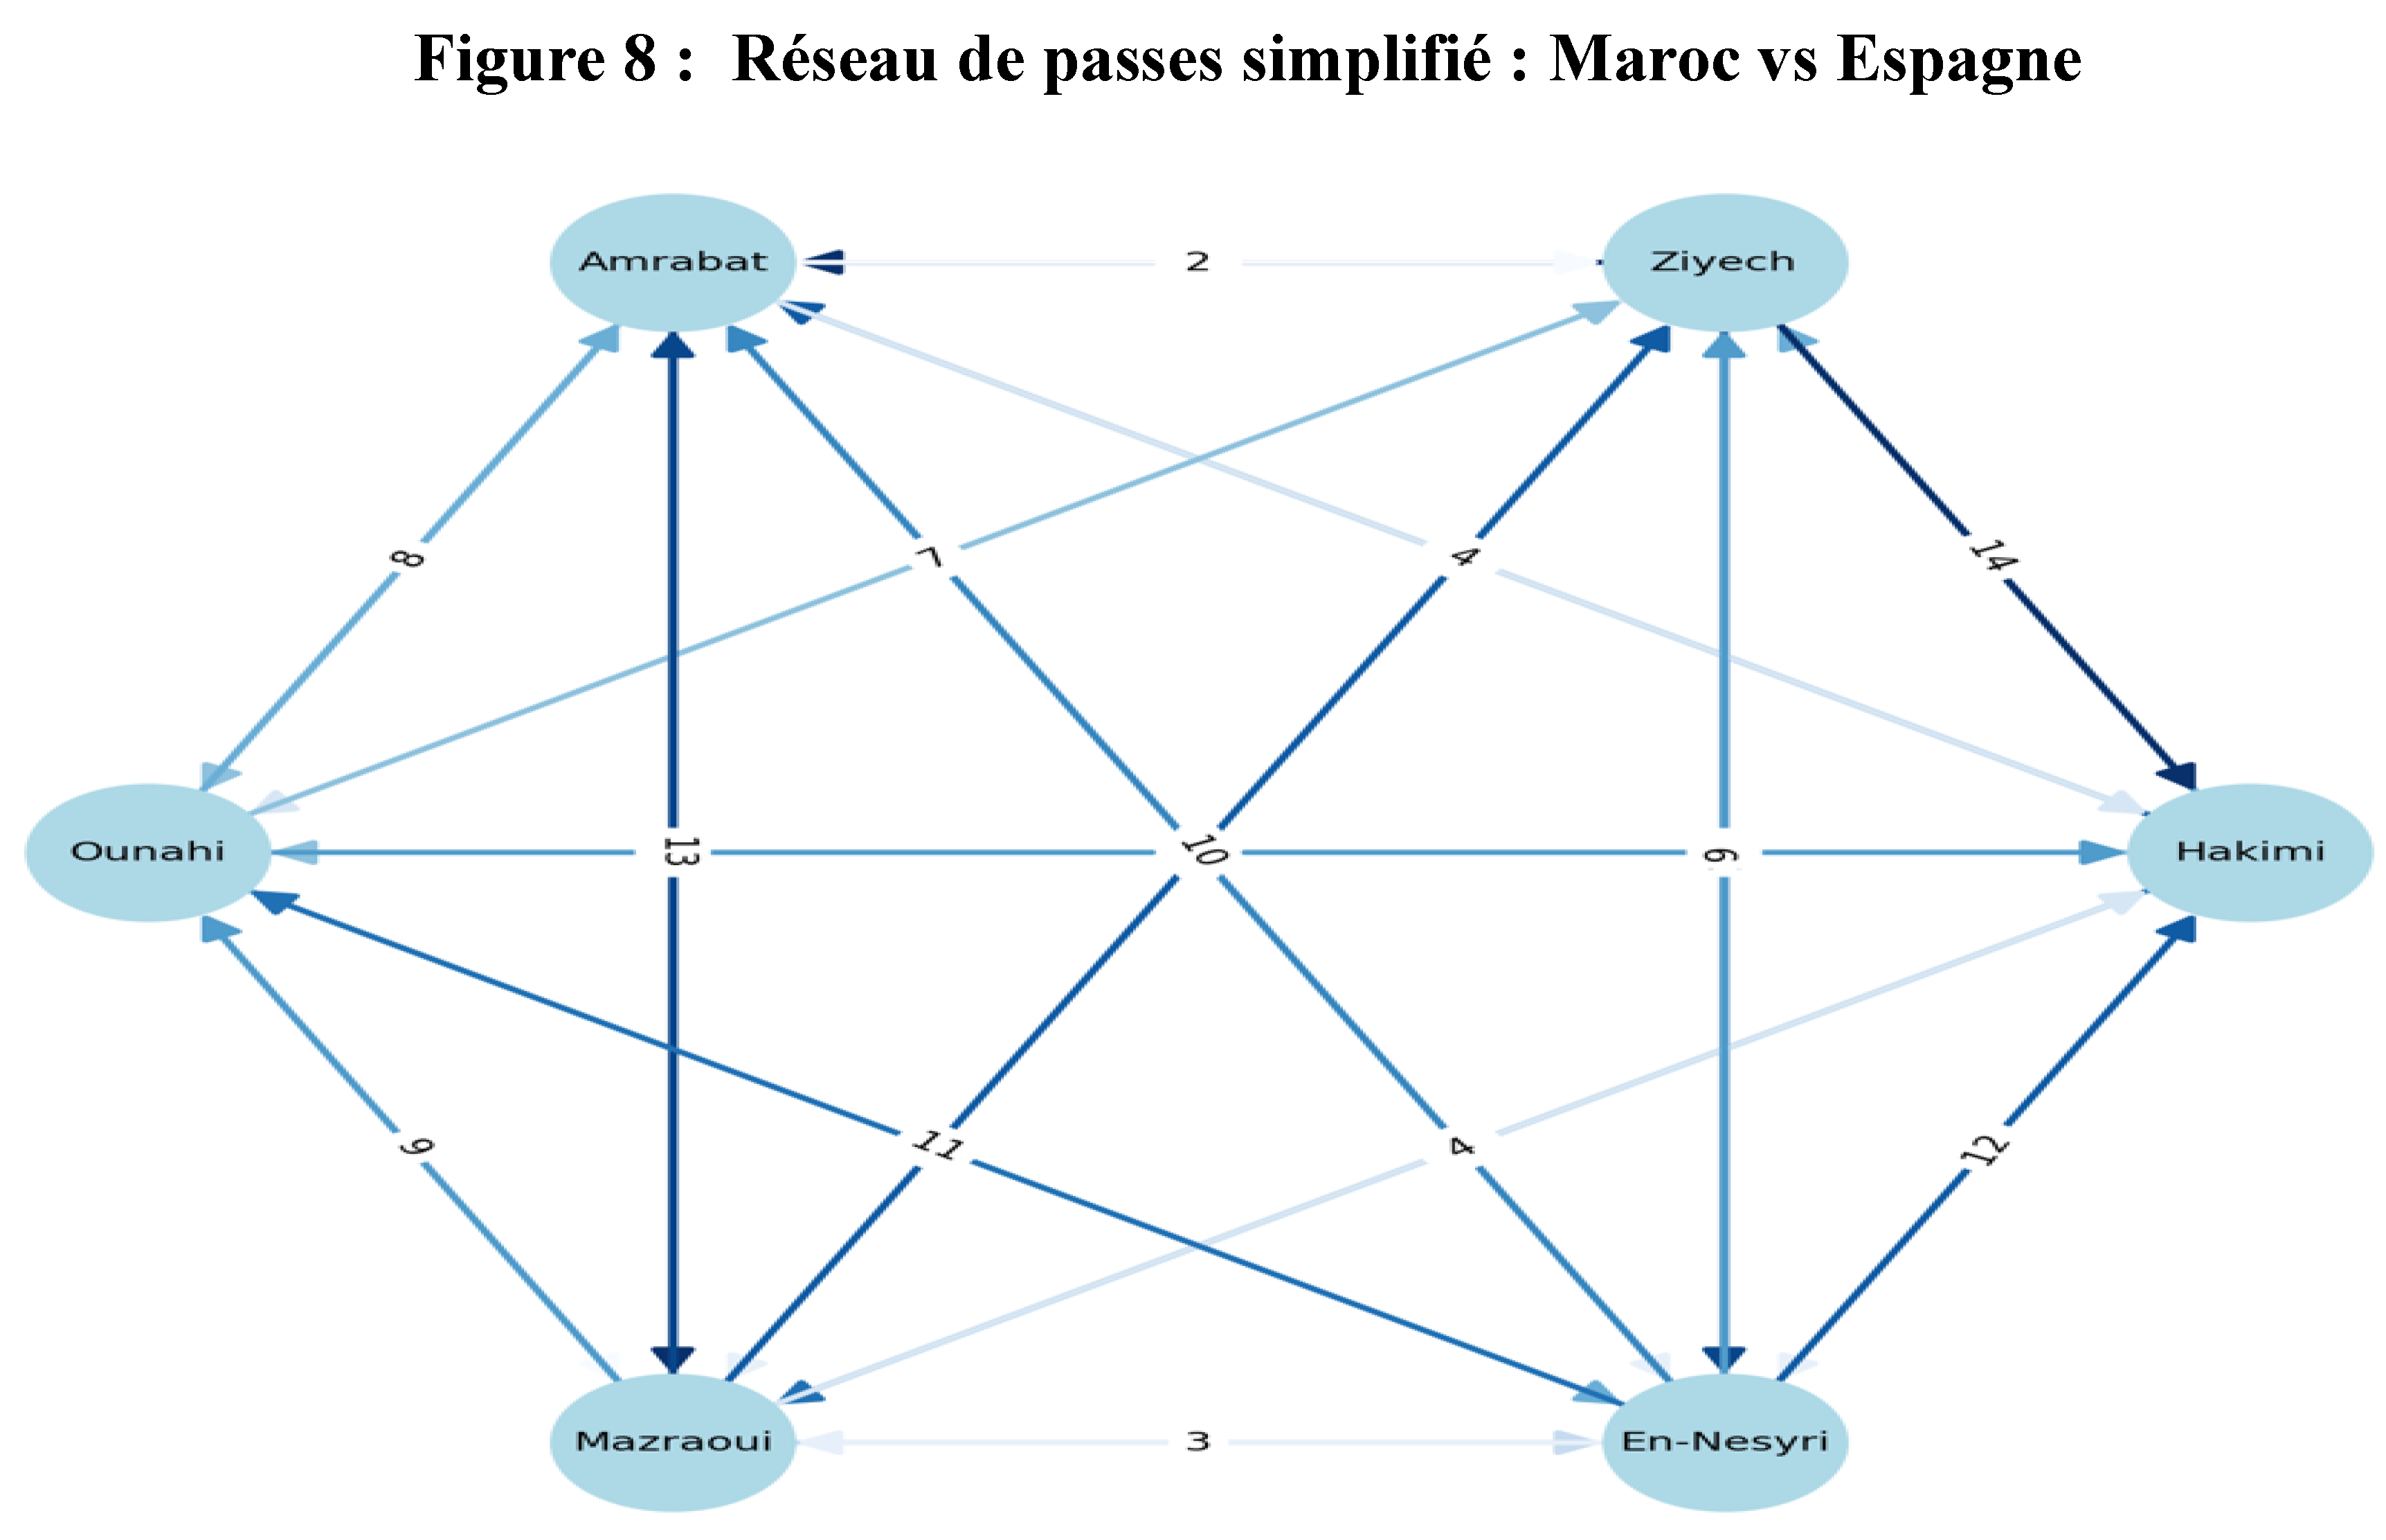
Figure 10.
Positions moyennes des joueurs: Maroc.
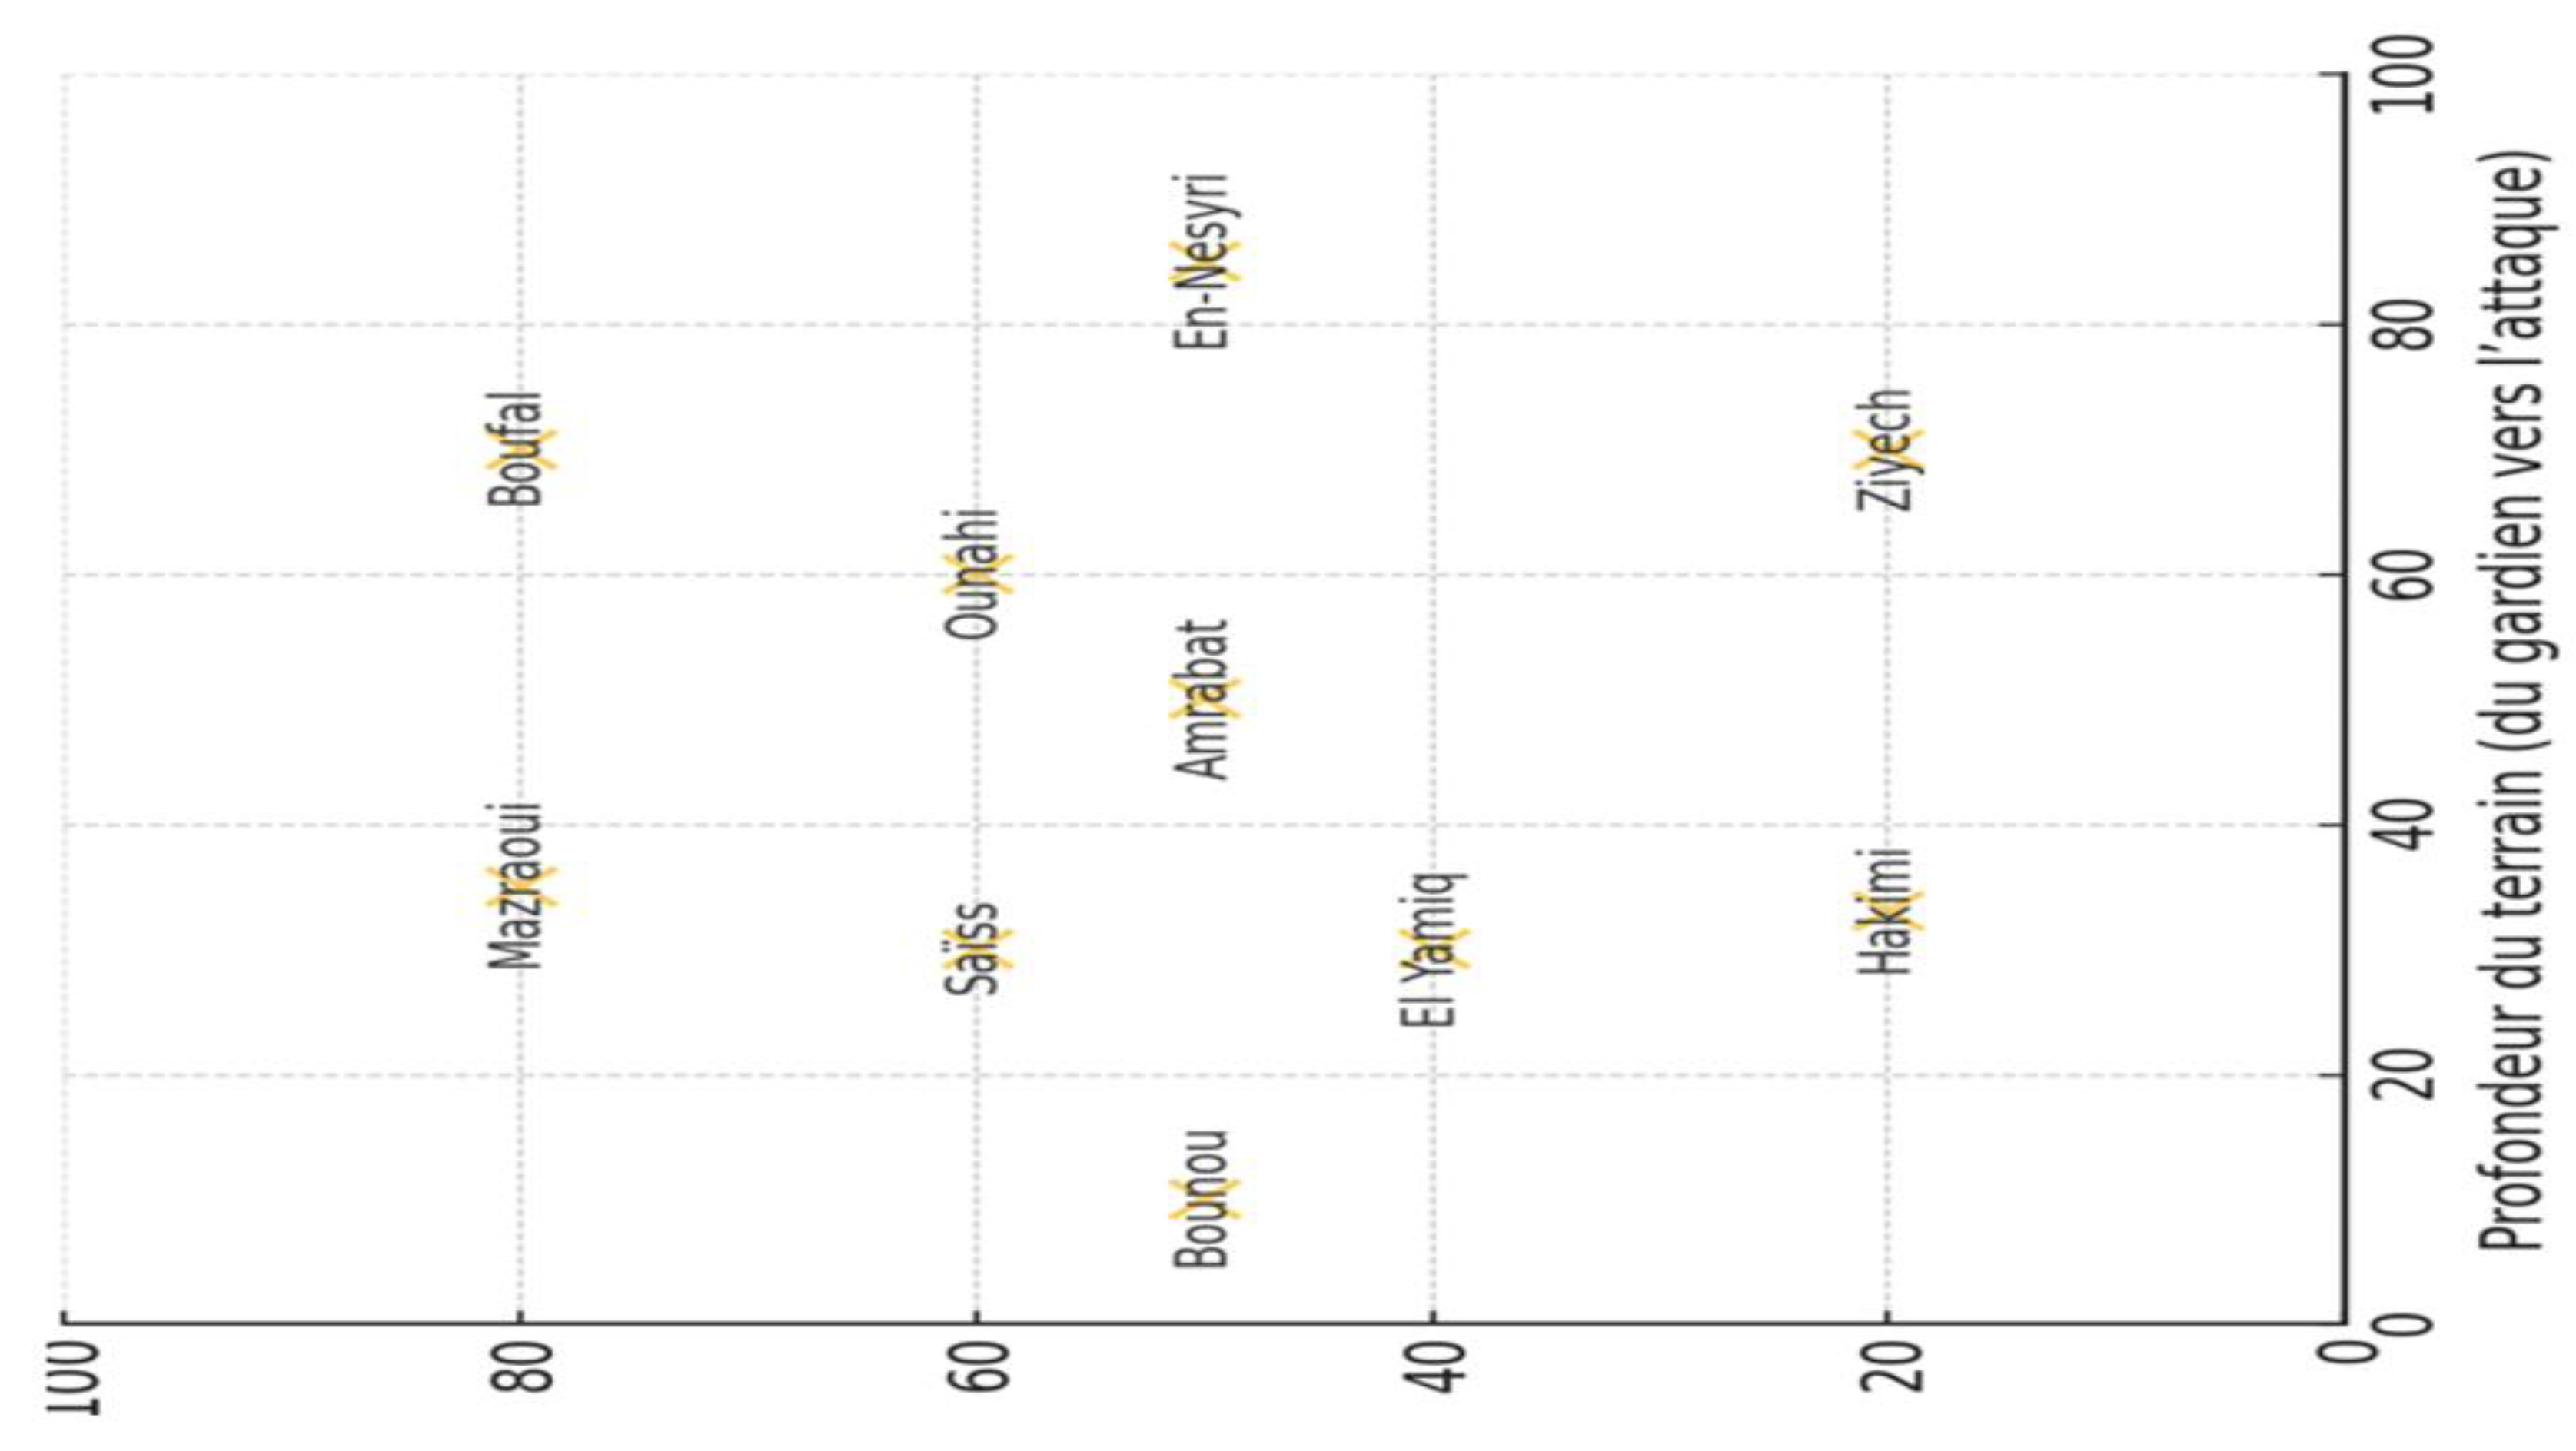
Table 1.
Summary of collective indicators per match.
 |
Disclaimer/Publisher’s Note: The statements, opinions and data contained in all publications are solely those of the individual author(s) and contributor(s) and not of MDPI and/or the editor(s). MDPI and/or the editor(s) disclaim responsibility for any injury to people or property resulting from any ideas, methods, instructions or products referred to in the content. |
© 2025 by the authors. Licensee MDPI, Basel, Switzerland. This article is an open access article distributed under the terms and conditions of the Creative Commons Attribution (CC BY) license (http://creativecommons.org/licenses/by/4.0/).
Copyright: This open access article is published under a Creative Commons CC BY 4.0 license, which permit the free download, distribution, and reuse, provided that the author and preprint are cited in any reuse.


