Submitted:
02 July 2025
Posted:
04 July 2025
You are already at the latest version
Abstract
Social scientists are often interested in analyzing user behavior towards green energy transitions. A common approach is to conduct a survey on a sample population over a period of time supervised through interventions with the aim to study the underlying behavioral groups and determine the best intervention suitable for a behavior group within the survey. In this work we have developed a novel machine learning algorithm pipeline suitable for analysis of user behavior through social intervention data. There are three major steps in the pipeline: a) developing a recommendation system trained on survey queries to learn latent embedding representations of the users, b) perform cluster analysis on the user-embeddings to identify the behavioral groups in the data, c) validate the embedding representation by training a prediction model mapping the latent vectors to measured energy consumption. In this approach we have also developed a human-centric artificial intelligence tool that aids the social scientists to identify and recommend suitable interventions for users in each behavioral group to make a transition towards a greener carbon footprint. It also helps policy makers to help evolve society at large through sustainable alignment of policies guided by the success of predetermined intervention.
Keywords:
machine learning
; recommendation systems
; matrix factorization
; embedding representation
; clustering
; energy behavioral analysis
; green energy transition
1. Introduction
Fostering efficiency behavior in the society has been a strong focus of study among the behavioral and social scientists alike. Assessing the impact of people through large-scale rollout of interventions inspired from social, psychological and behavioral science is one of the standard approaches to go forward in studying it. There have been many projects in H2020 call like ENCHANT [1], NUDGE [2], EVIDENT [3], WHY [5] etc and their precursor projects each defining a means to probe into behavior psychology to understand human behavior impacting energy transition. The data and results discussed in this work are derived from the ENCHANT survey but can be extended to other projects with similar defining parameters. ENCHANT started with the objective to affect energy behavior on a sustainable pan-European level. The project targets sustainable energy transition in Europe with a broader aim to support international, national, regional as well as local policies by directing European citizens and households under real-life conditions.
As a part of ENCHANT the following questions are being studied that are of interest to the social scientists working in energy transition:
- Can behavioral groups within an energy transition survey data be detected?
- Do the underlying user sentiments support the perceived energy consumption changes reported from their usage data?
- If a user’s sentiment are reflective of their consumption patterns can we recommend a suitable intervention that can aid in their transition towards green footprint?
- Is there are preferred channel of communication to connect with a specified user group?
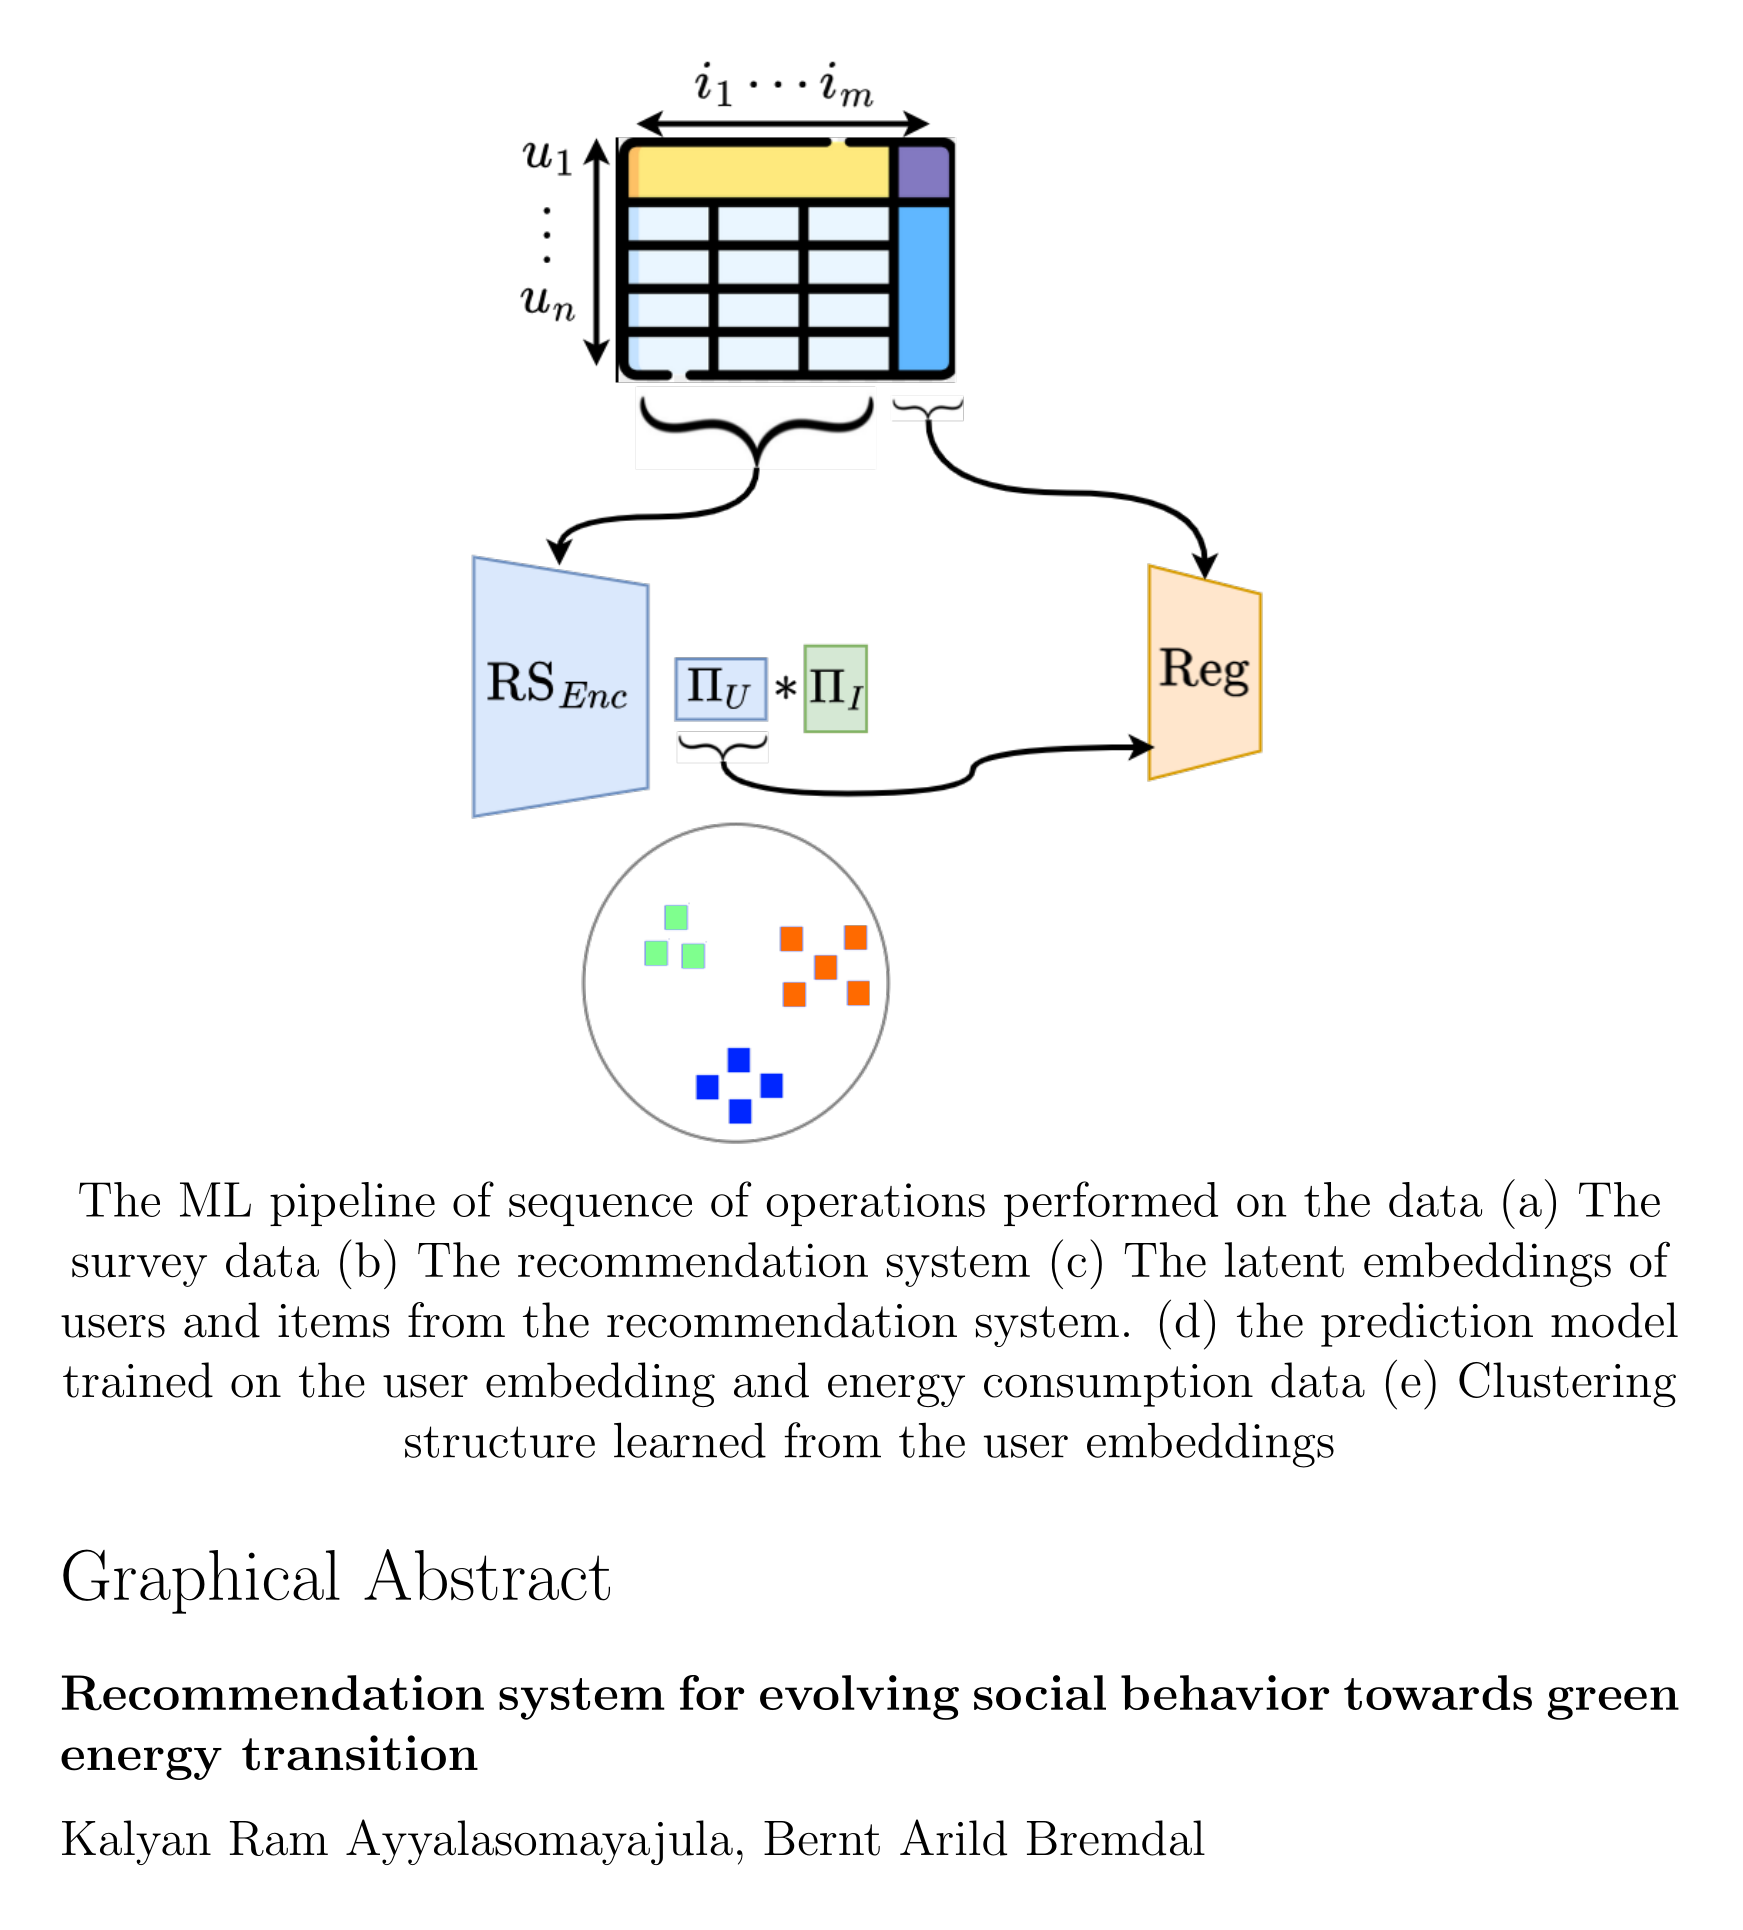
In this work we propose a machine learning (ML) pipeline as shown in Figure 1 trained on the intervention data collected from ENCHANT survey to answer the fore mentioned questions. We develop a recommendations system (RS), Figure 1(b) that is trained on the survey data Figure 1(a). The underlying user representations Figure 1(c) learned by the RS are used to train a prediction model Figure 1(d) to validate the relevance between the interventions performed and their impact on energy consumptions. A clustering algorithm is run on the latent embeddings to identify the behavior groups as shown in Figure 2. We make the following technical contributions in this work:
- Developing user-embedding through recommendations systems as means to analyze behavioral patterns in data that reflect energy consumption trends.
- Demonstrate the capability to predict suitable interventions for energy transition specific to a behavior group.
- Provide the ML pipeline as a tool to inculcate energy saving behavior in end-users as well as help decision makers to develop policies specific to user demographics.
The paper is structured as follows: the first section introduces the essential problem statement along with the highlights from the proposed human-centric artificial intelligence (AI) solution. The second section provides an overview of the related social intervention projects and recommendation systems literature. The methodology section provides the details into the experimental setup, hyper-parameter choices made to achieve the results. It is followed by a section providing an overview of the results. The final section provides a discussion on the strengths and weakness of the current approach along with some future direction for follow-up work and conclusions on the usage of the proposed ML pipeline.
2. Related Work
Impact on energy transition using behavioral psychology is a major field of study for social scientists. There have been many studies in the past that have dealt with various approaches to deal with this problem [6,7]. One of the major problems with survey data is that people often respond with a socially or politically acceptable truth or narrative but their action indicate otherwise. ENCHANT is one such project that tries to see the disparity between the indicated preference and the action taken during interventions. The effect of the action is measure by collecting the energy consumption data with a decrease indicating the intervention to be successful else a failure. Some also argue that energy-related behavioral interventions could be comparatively cheaper than structural interventions that require high upfront costs and can be highly risky in the mid to long term, so that their cost vs impact ratio can be quite significant. From a general point of view, it is usually assumed that the ability to improve energy-related behavior is linked to the behavioral choices of users and to the specific conditions that facilitate people’s willingness to accept sustainable energy policies and energy system changes. It is therefore important to consider the social and psychological factors driving a successful implementation of an energy transition process at the individual, community, and organizational level [9,15].
A sample population was asked to participate in the behavioral experiment and every person was assigned to one of the 14 intervention studies. They are then asked a series of psychological questions (for example: how do you feel about an emerging green technology? are you motivated by the changes you perceive from the technological impact on carbon footprint etc.) on a weekly basis along with a verifiable action (such as reduced shower time by 5 minutes, setting the house thermostat setting lower by 1 °C, air drying your cleaned laundry instead of using a dryer etc.) to be taken to make a positive impact towards greener energy transition by reducing energy consumption and load on the grid. The impact of their actions were recorded through energy consumption data reported in the household. By the end of the interventions period the control groups and intervention groups (as shown in Table 1) are compared to identify if an intervention is successful. The broad aim is to help authorities, organizations, public decision-makers and energy providers/suppliers in driving a global sustainable transition, and to impact public policies in the energy domain. In addition this tool can also make recommendations to the user on individual level. It is now conventionally accepted at the scientific and policy levels that behavioral change in real-life situations can be promoted and steered through behavioral insights that are capable to be easily understood and assimilated by the general public.
NUDGE [2] is a sister project of ENCHANT with a mixed approach to consumer analysis and intervention design tasks. In scenarios with high potential for energy savings the project combines surveys and field trials as a means to improve the results. The trials proposed proposed in this project are conducted in five different European union (EU) member states, each testing a broad set of behavioral interventions based on nudging techniques. These trials are conducted in residential, energy communities and school environments. The NUDGE project aims to implement an end-to-end approach by promoting in addition to incentivize the adoption of behaviorally tested policy interventions at local, regional, national and EU level.
EVIDENT [3] is another H2020 project that aims at understanding main drivers of individuals’ decision making to support policy-making. It creates an analytical framework and a platform for tools and data as support for policy decisions. In this project five large use cases were proposed based on consumer engagement of more than 100,000 consumers. In addition to the user engagement it analyzes financial literacy as a means to consumers’ energy efficiency decision-making. The cases are analyzed in a multi-layer structure encompassing information gathering, evaluation and policy design.
WHY [5] is also very closed related to the fore mentioned EU projects, however it implements causal modeling to analyze quantitatively people’s everyday decisions regarding energy consumption and their reactions to interventions. It aims to foster innovative methodologies for short-term and long-term load forecasting, which will be bench-marked in different use cases ranging from micro-grid size to international contexts. The project will provide greater insight into household energy consumption and improve energy demand modeling in leading Energy System Models (ESMs).
Recommender systems (RS) provide a means to associate users with a choice among available items by providing them with suitable proposals that might be interesting to them, without being overwhelmed with all the available choices. The two fundamental approaches in RS are: collaborative filtering, content-based both of which are employed in the current work. The most dominant approach is collaborative filtering which leverages the collective behavior of the users. The underlying assumption is that users who had similar preferences in the past (on seen or known items) will also have similar preferences in the future (when extended to unseen or unknown items). This is major characteristic of RS is the reason why recommendations are made typically by computing the users’ past interactions with the items. These interactions are recorded in a user-item rating matrix, where the users’ ratings for each items are stored. Such ratings can be where, user scores an item on a scale of, e.g., 0-5 or where, an interaction is recorded as positive (user clicking on an ad or spending time watching it) or negative (user ignores the ad or closes soon after displayed).
Given the volume of potential items that could be of interest to a user it is practically impossible for a user to have interacted with all of them. Hence, user-item matrices are often rectangular sparse matrices with the number of items much larger than number of users. The primary task of a RS is the completion of user-item matrix, predicting the missing ratings in the matrix where user has not interacted with an item. This prediction of ratings can be performed using various methods: from traditional matrix completion methods such as neighborhood-based methods to more sophisticated matrix factorization, or deep learning-based approaches. Motivated readers can look for further details on these approaches in [10,13,17].
3. Methodology
The data from an intervention survey can be seen as matrix with each user response as a row and each question along as a column. We denote all users as and all questions as items this can be seen as a user-item interaction matrix M of size denoted as . Typical challenges encountered with raw intervention data are the following:
- Handling null responses: Users in the survey have opted not to respond leaving the question unanswered or with an invalid option (out of 1-5 range)
- Pruning data: Data such as demographic, energy consumption etc. though important for answering ENCHANT objectives are beyond the scope of behavioral analysis of users. Hence, these responses were pruned in current analysis.
- Sanity checks: Response rates were also gauged to eliminate entries with very few responses to the questions (typically threshold being < 15%)
- Normalization: To make data across the EU countries comparable the raw data from the survey platform is normalized w.r.t the household size and the seasonality in the country from the past data. Also, some inconsistency in reporting such as reporting absolute energy consumption readings versus reporting difference in energy readings are fixed in this step.
- Handling binary input: The RS algorithm considers a response as strong (set to +1) if the rating to a question is else a weak response (set to -1)
The dataset from ENCHANT interventions after the sanity checks was used to train a ML recommendation algorithm. The missing user-item interactions is interpolated by the recommendation algorithm using both content-based filtering: using only feature in the individual data point to get to guess the features or behavior of a user given the item’s features, one has reacted positively to. collaborative filtering: compares the likes of users to form relative matches then recommend items based on similarities shared among users.
3.1. Recommender System
The algorithm used in training the RS is a matrix factorization (MF) algorithm. The algorithm tries to decompose the user-item interaction matrix into product of user latent embedding matrix and item latent embedding matrix such that:
where . The algorithm tries to find the values for and such that the reconstruction error is minimized.
The RS model in general tries to exploit user and item-based similarity. This requires a distance metric that measures the similarity between any two pairs of users/items. A commonly used distance metric in RS is cosine similarity that measures as the cosine of the angle between the two users’ vectors. A key observation here is that we require a means to associate vectors to users and items as the metric treats geometrically a given users (items) row (column) of the ratings matrix as a vector. This is the reasons RS employees MF algorithm. Using the matrix factorization approximation by letting a user u and an item i take the form of a l-dimensional vector , respectively as shown in Figure 1. We approximate the true rating corresponding to the user-item pair by as:
The algorithm tries to pick the , values to minimize the loss function:
We use the latent vectors as the embeddings for the users and items respectively.
3.2. K-Means Clustering
We start with the set of embeddings for all users from the interventions . We run the algorithm on the embeddings space to identify the clustering structure. As we do not know the number of clusters or groups in the data to begin with, we employ two methods to determine the total number of groups.
Elbow method: We iterative run k-Means to identify the number of groups from an enumerated list starting from , then create a plot with the number of clusters on the x-axis and the total within sum of squares error among clusters on the y-axis and then identifying where an “elbow” or bend appears in the plot as shown using all the intervention data.
Silhouette score: In the range identified we use the silhouette coefficient or silhouette score of k-means as a measure of how similar a data point is within-cluster (cohesion) compared to other clusters (separation). The Silhouette score are run for the identified range in this case . The number of clusters with highest coefficient is selected as the relevant number groups identified in the data as shown in Figure 3.
Note: As the clustering structure varies with data imputation the maximum cluster identified in the silhouette plots in majority of the case is taken as the true cluster number. If there is no clear majority, then data without imputation is used for identification.
A visualization of the clustering structure is shown in Figure 2. Here is an overview of the steps followed by the algorithm:
- There were 6, 3 and 5 behavioral groups identified using all the interventions data collected from Norwegian and German and Romanian surveys (using k-Mean clustering).
- The cluster centroids of the group clusters are marked with a star of the corresponding group color with a black star to mark its center.
- All the data points corresponding to a group are marked with the respective group color.
- With the group centroids as the center each group region is filled out with a faded color corresponding to the region (using Voronoi tessellations)
- Marking the regions for the group will help identify the behavior changes for each group over the interventions.
- The embeddings are in a high dimensional vector space (7-dimensions) . Each vector learned by the RS is projected using linear projections (using principal component analysis [PCA]) to two dimensions and plotted along each axis.
- A non-linear projection (using t-Distributed Stochastic Neighbor Embedding [t-SNE]) was also be used to visualize the group behavior as shown in the plots Figure 2.
Note: Although the t-SNE plots look visually more pleasing compared to PCA plots interpreting the projections used to map , by t-SNE can be more complicated compared to PCA. Hence, we opt to use both methods in visualizing the results.
3.3. Establishing Correlation with Energy Consumption
Before we use the embedding vectors a correlation between these vectors and the energy consumption needs to be established. This is done by training a prediction model fitting the user embeddings using all the interventions data to the energy consumption per person per day in a household. Another prediction model was trained fitting the user embeddings from weekly intervention data to the energy consumption per person per day in a household. The idea here is to show that there exists a strong correlation between the behavioral data and energy saving behavior using the latent embedding as the features capturing the correlation. The results from prediction models are shown in Figure 4. The model predicts the energy consumption with a mean absolute percentage (MAP) error of . The predicted value and the confidence intervals are also available in the plots. In general the embedding from all weeks intervention data is having lower MAP error as opposed to using weekly intervention data alone.
3.4. Effect of Data Imputation
As the energy consumption data was collected via user inputs made available through a web portal there were instances of missing data for some users. The missing data was patches through expectation-maximization (EM) based imputation approach. It was observed that the models tend to perform better with data imputation. One possible explanation for this behavior could be due to the EM-imputation approximating the missing value around the mean. This allows prediction model to predict values around mean better thus showing a reduction in MAP-error. The need for using all the intervention data is to establish a common representation of the user that can be used when comparing all the interventions across countries in EU that have participated in the survey. Without data imputation valid survey response drop to usable data. When this dataset was further used to stratify the interventions within the behavioral group, we are left with very few samples to work. Hence, all the stratification analysis discussed in the following section were conducted with imputed data.
3.5. Intervention Stratification Within Behavioral Groups
The successive difference in energy consumptions over the five weeks was computed for all the users. Within each behavioral group the users were separated into their respective intervention strata. A histogram of the consumption differences against the user-ids are plotted as shown in Figure 5. Every instance with the intervention strata where the user has shown a reduction in energy (negative bars in the histogram) over the past week are considered as a success case for the intervention. The color outlined on the border of the histograms correspond to the color code of the behavioral groups in the cluster plot shown in Figure 2. As similar histograms were constructed to indicate the responses received over the channels per behavior group the plots are now shown here for brevity.
4. Experimental Results
The Table 2 summarizes the results from all the experiments for Romanian survey. Similar results exist for Norwegian and German interventions as well. Coverage: Indicates the percentage of group population covered by the intervention. Success rate: Indicates the percentage of group population that benefited from the intervention. The data from the survey is made available here [4]. During the course of the project users were asked to enter their energy consumption data into a portal based on the kind of intervention they have been subjected to as explained in Table 1. The sample size varied per country as follows: Norway: , Germany: , Romania: . It has to be noted that due to manual entry into the web portal some of the reporting had missing entries in energy consumption data. This was rectified through EM-based (expectation maximization) imputation.
5. Discussions and Conclusion
The proposed ML pipeline provides a novel approach to analyze the social behavioral data with interventions. It is capable of detecting the behavioral clusters and well as recommend the most suitable interventions for a behavioral group. The recommendation made for the best suited communication channel merely is a permutation of the largest communication channels used and not sensitive to user choice as it was not reflected in the data. In the current approach the RS, clustering and prediction steps are acting sequentially on the output of the previous step and in isolation we would like to make the pipeline end-to-end trainable in our future work.
5.1. Continual Model Learning Maintaining User Anonymity
One very important problem when dealing with social surveys is replicability of the experiments and re-usability of the data maintaining anonymity. Most of the approaches adopted in the technical community register the users through the use of unique userids. However, the problem arises with storage and reuse of the data while still being complaint to general data protection regulation (GDPR). In the current approach each the user is mapped to the trained latent embedding representation in the recommendation system. This helps to adhere to the GDPR guidelines as well as continually use new data to learn the user embeddings leveraging on the representations learned historically. This leads to a continuous improvement of the systems from new and old data while storing nor processing any user specific sensitive data.
References
- ENCHANT-H2020, https://www.enchant-project.eu, 2018-2023.
- NUDGE-H2020, https://www.nudgeproject.eu/, 2018-2023.
- EVIDENT-H2020, https://www.evident-h2020.eu/, 2018-2023.
- ENCHANT-data, https://zenodo.org/records/10453810, 2018-2023.
- WHY-H2020, https://www.why-h2020.eu/, 2019.
- Linda, S.; Perlaviciute, G.; Van der Werff, E. Understanding the human dimensions of a sustainable energy transition. Frontiers in psychology 2015, 6, 805. [Google Scholar]
- Annukka, V.; et al. Citizens’ sustainable, future-oriented energy behaviours in energy transition. Journal of Cleaner Production 2020, 245, 118801. [Google Scholar]
- WHY-H2020, https://enchant.sinter.ai/, 2019.
- Sommer, L.K.; Swim, J.K.; Keller, E.; Klöckner, C.A. “Pollution Pods”: The merging of art and psychology to engage the public in climate change. Global Environmental Change 2019, 59, 101992. [Google Scholar] [CrossRef]
- Ekstrand, M.D.; Riedl, J.T.; Konstan, J.A.; et al. Collaborative filtering recommender systems, Foundations and Trends in Human–Computer Interaction. 2011, 4, 81–173. [Google Scholar]
- Fortunato, s. Community detection in graphs. Phys. Rep.-Rev. Sec. Phys. Lett. 2010, 486, 75–174. [Google Scholar] [CrossRef]
- Hullermeier, E.; Rifqi, M. A Fuzzy Variant of the Rand Index for Comparing Clustering Structures. Proc. IFSA/EUSFLAT Conf. 2009; 1294–1298. [Google Scholar]
- Koren, Y.; Rendle, S.; Bell, R. Advances in collaborative filtering, Recommender Systems Handbook. 2021; 91–142. [Google Scholar]
- Newman, M.E.J.; Girvan, M. Girvan, Finding and evaluating community structure in networks. Phys. Rev. E 2004, 69, 026113. [Google Scholar] [CrossRef] [PubMed]
- Ruepert, A.; Keizer, K.; Steg, L.; Maricchiolo, F.; Carrus, G.; Dumitru, A.; Mira, R.G.; Stancu, A.; Moza, D. Environmental considerations in the organizational context: A pathway to pro environmental behaviour at work. Energy Research & Social Science 2016, 17, 59–70. [Google Scholar]
- Vehlow, C.; Reinhardt, T.; Weiskopf, D. Visualizing Fuzzy Overlapping Communities in Networks. IEEE Trans. Vis. Comput. Graph. 2013, 19, 2486–2495. [Google Scholar] [CrossRef] [PubMed]
- Zhang, S.; Yao, L.; Sun, A.; Tay, Y. Tay, Deep learning based recommender system: A survey and new perspectives. ACM Computing Surveys (CSUR) 2019, 52, 1–38. [Google Scholar] [CrossRef]
Figure 1.
The ML pipeline of sequence of operations performed on the data (a) The survey data (b) The recommendation system (c) The latent embeddings of users and items from the recommendation system. (d) the prediction model trained on the user embedding and energy consumption data (e) Clustering structure learned from the user embeddings
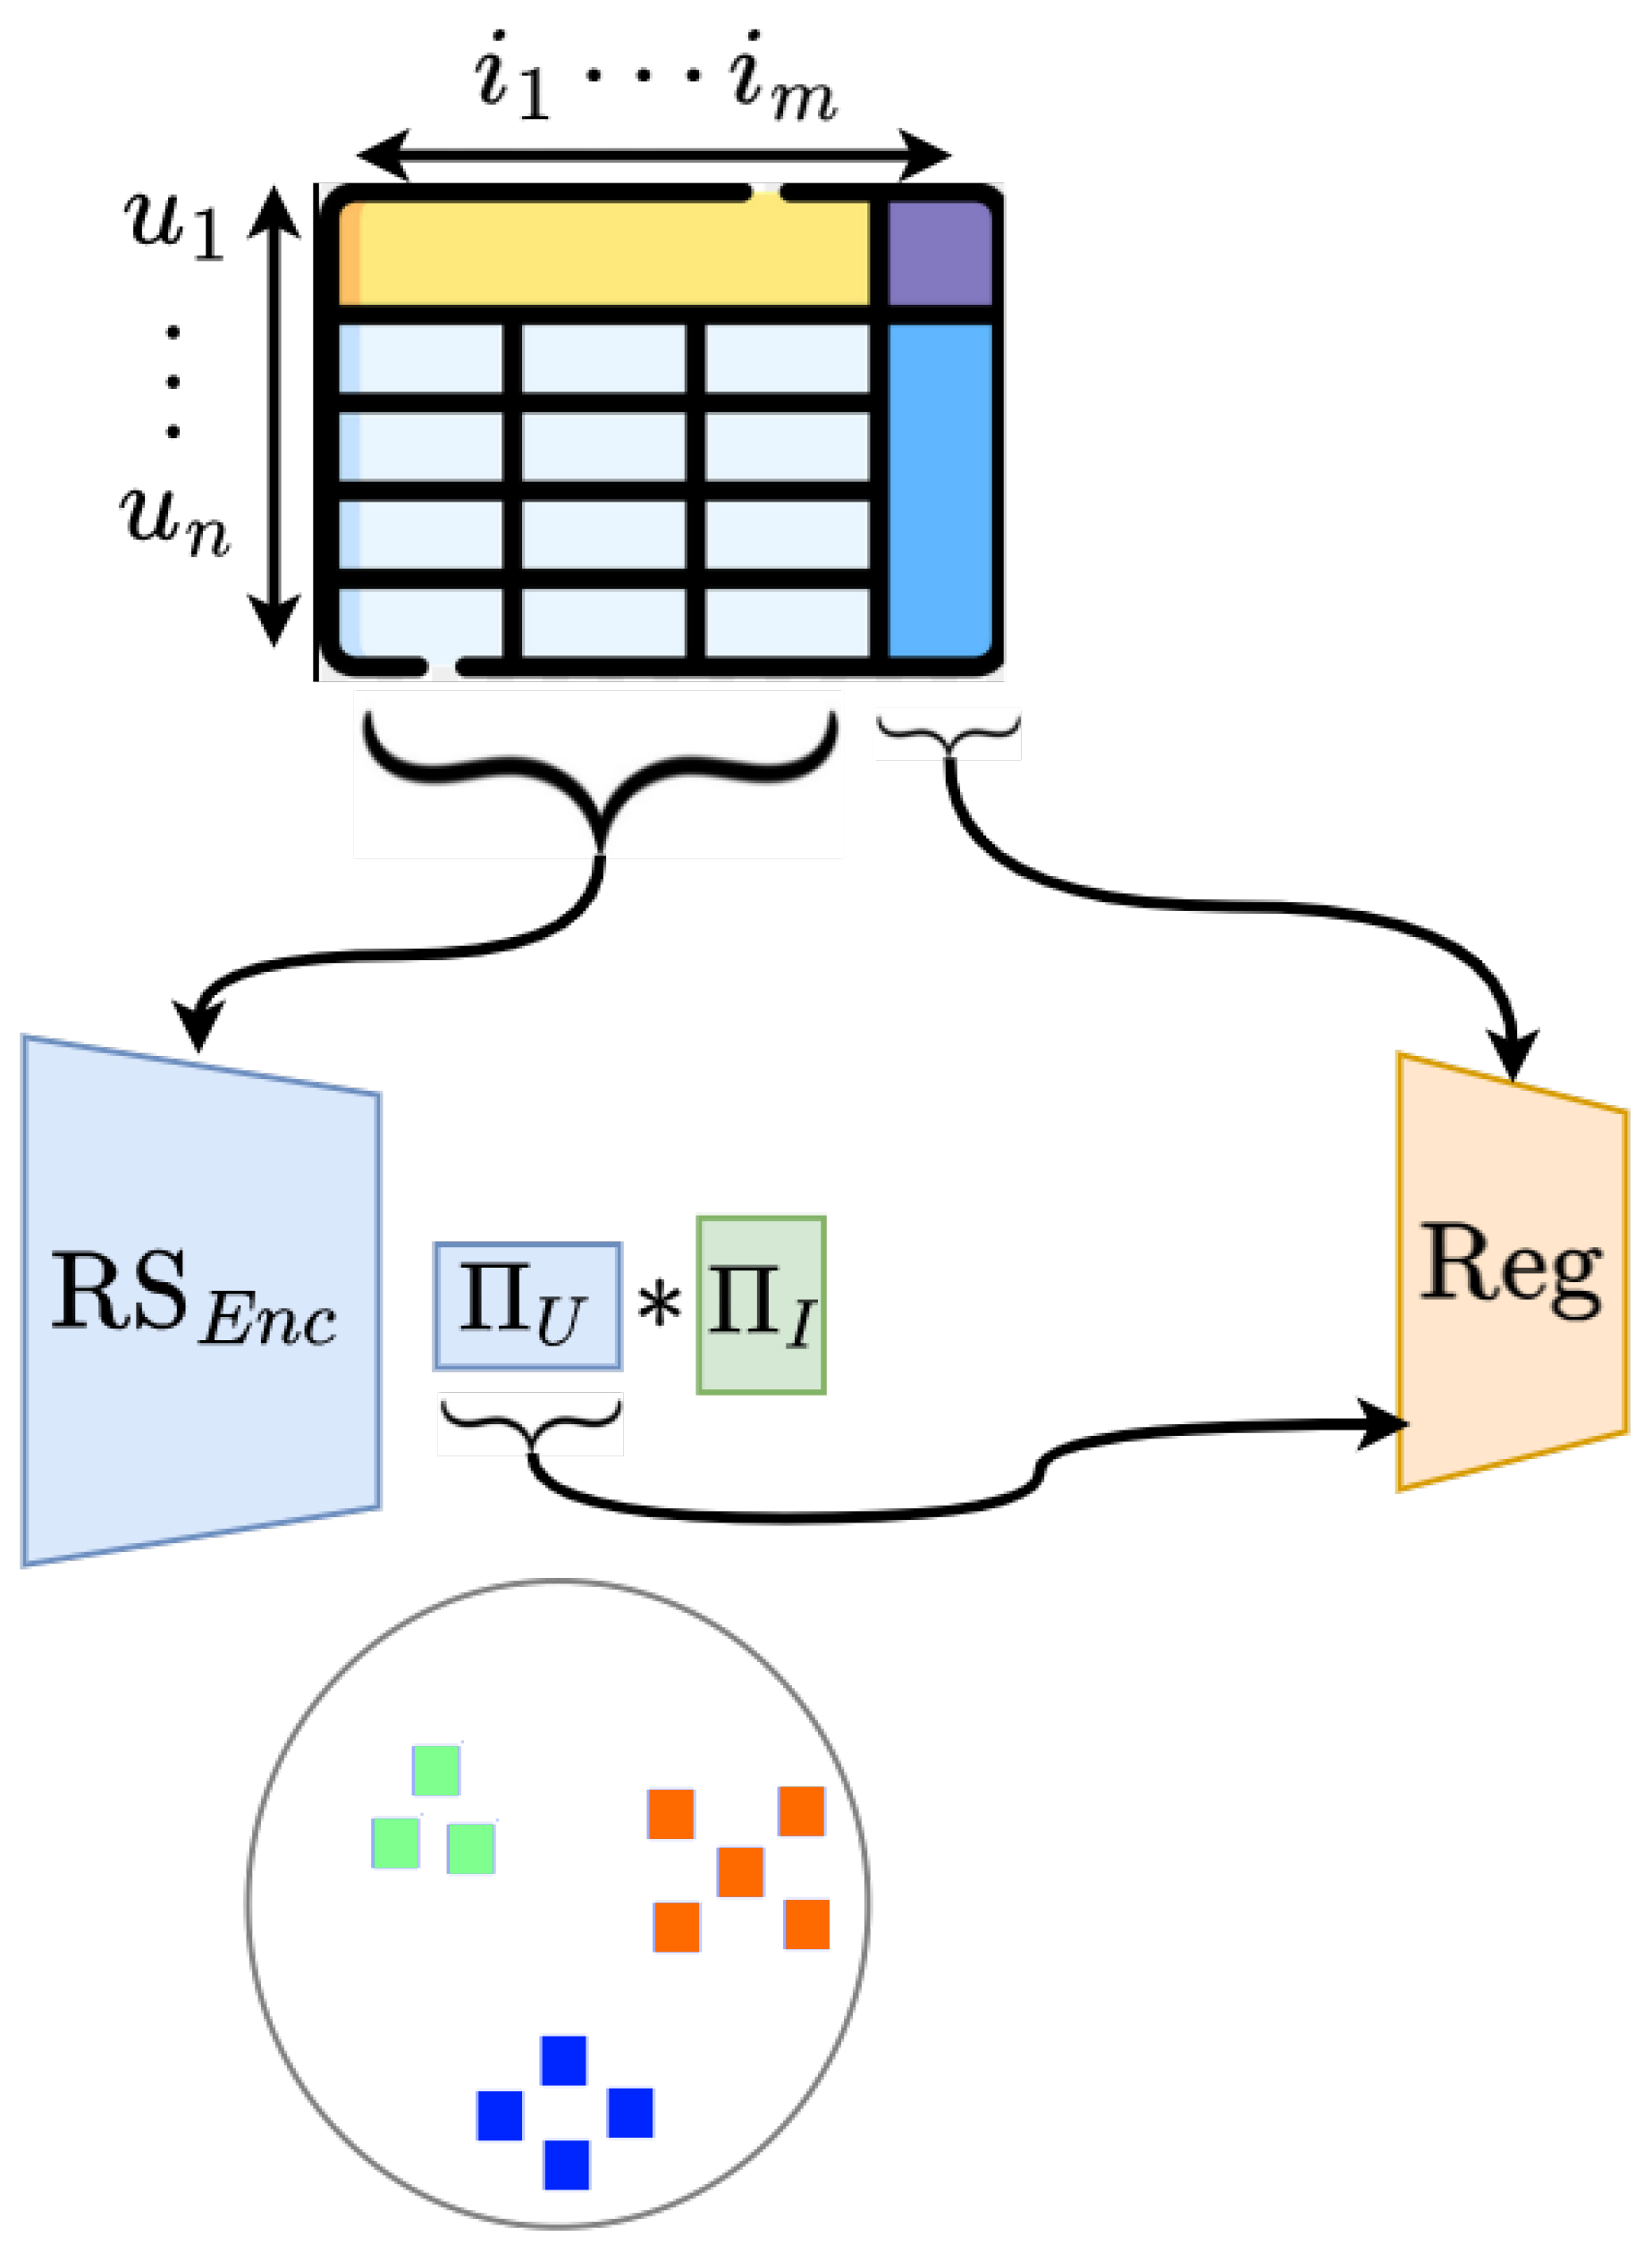
Figure 2.
The clustering structure observed through projecting the user embeddings from recommendation system into a two dimensional plane using t-SNE. The cluster centroids are marked with ★s and Vornoi tessellation of each cluster is indicated to aid the study of the behavioral change over the weekly interventions
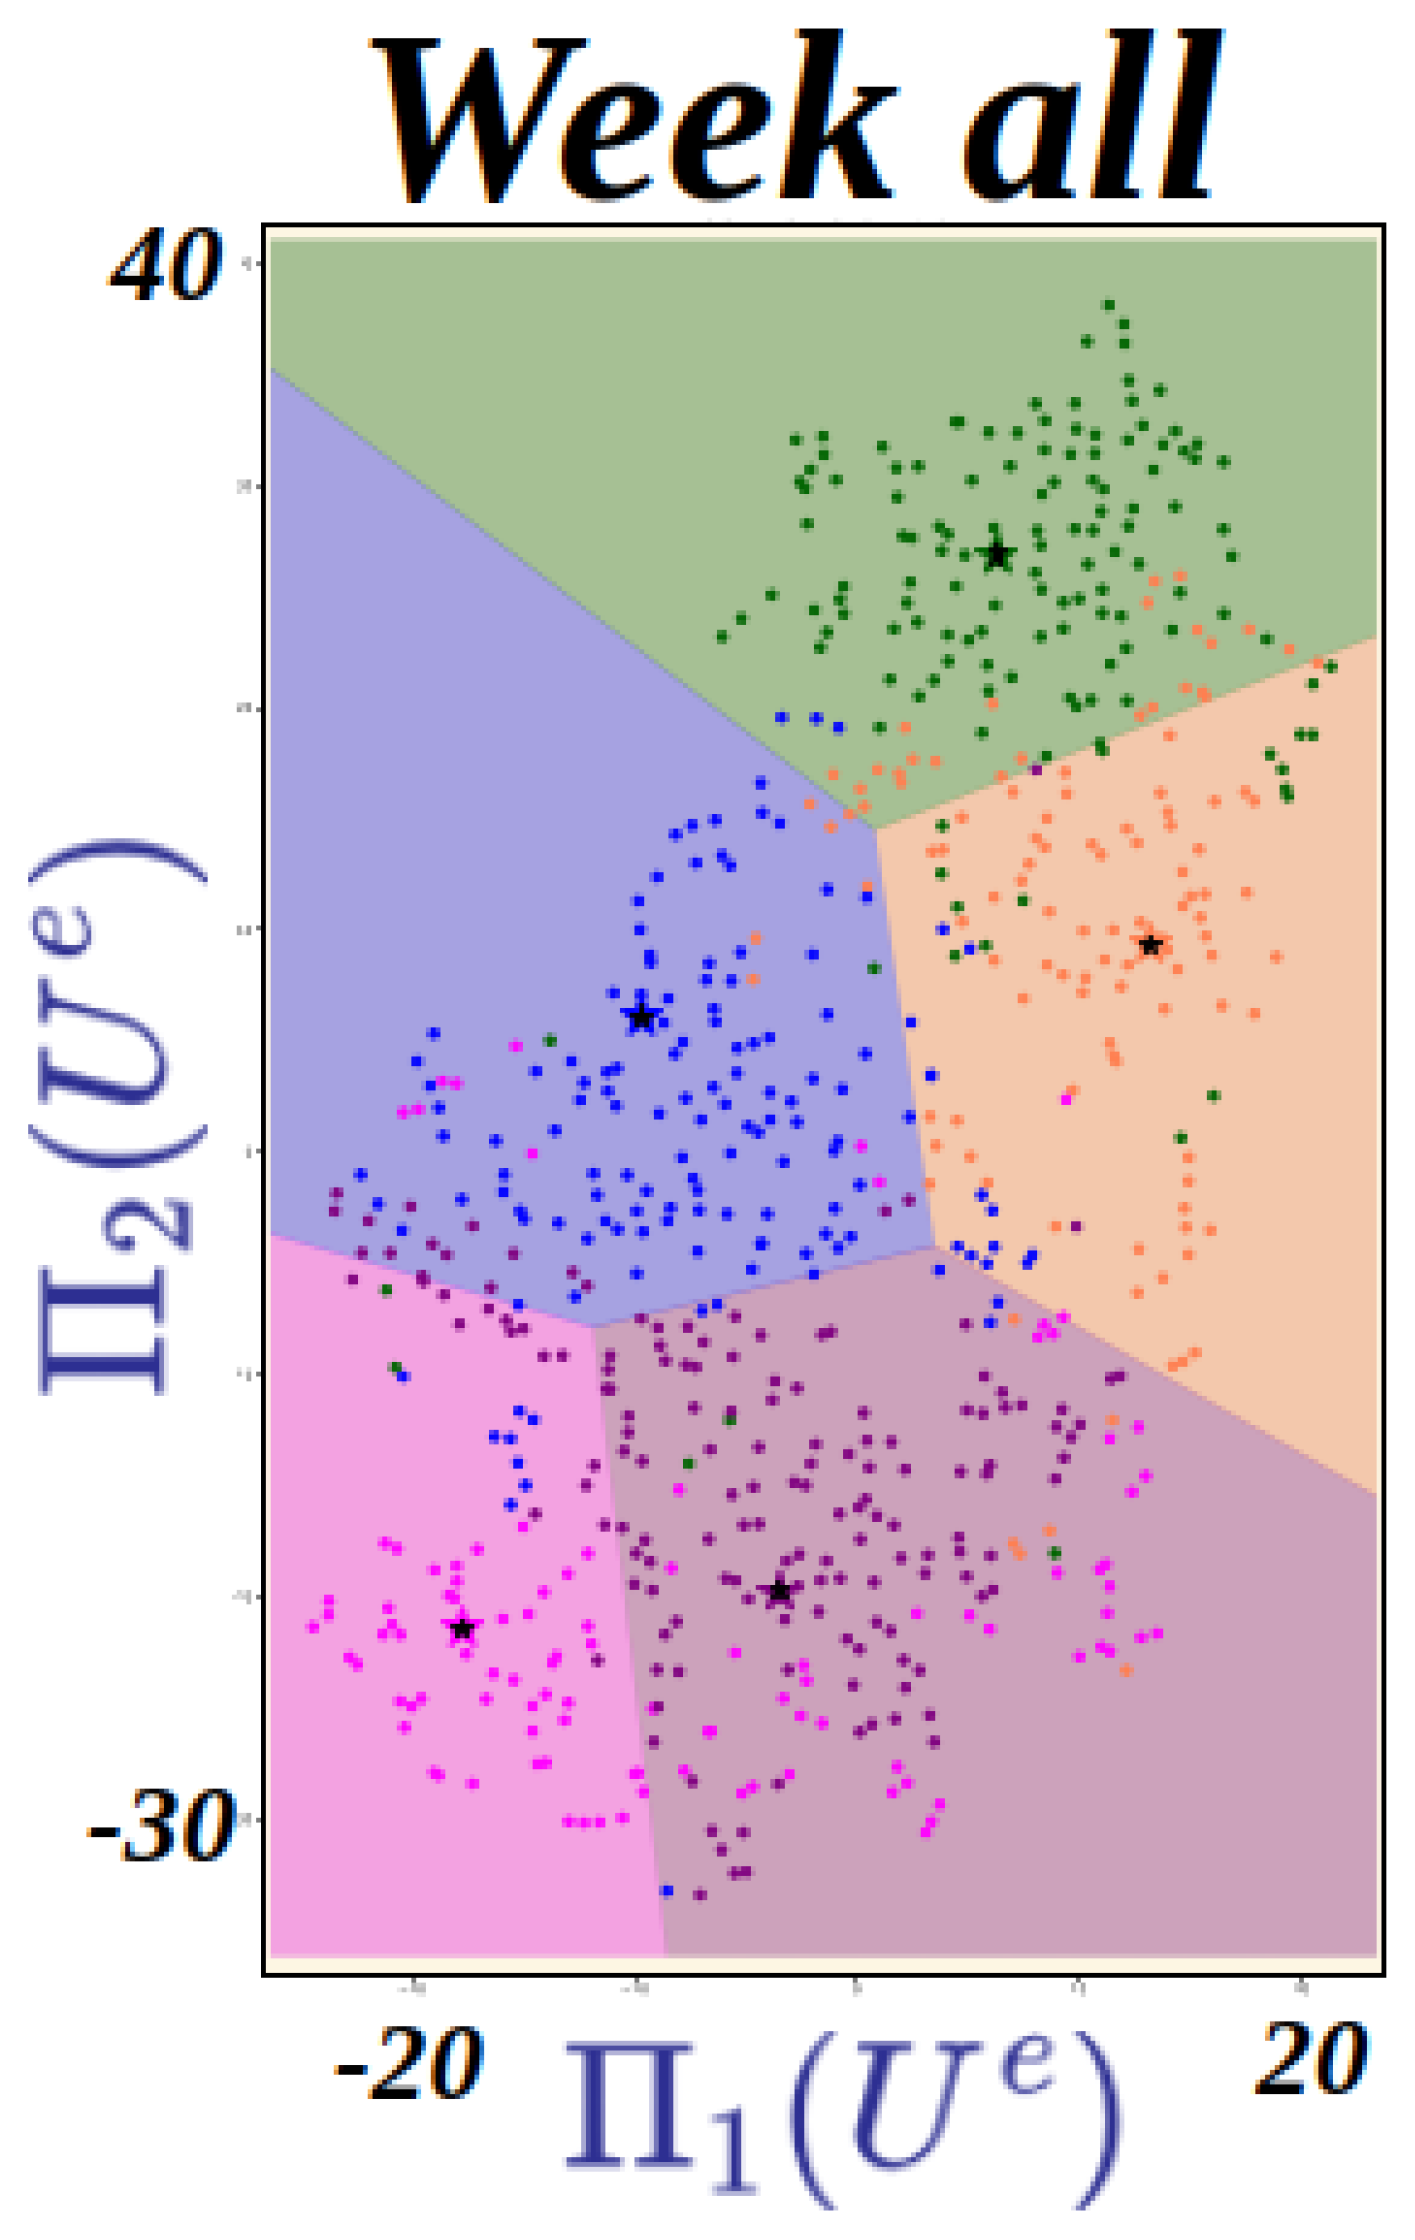
Figure 3.
The picking the number of possible clusters is done using the silhouette plot. The maximum cluster number () indicated in majority of the weekly interventions is picked as the possible number of clusters (6 in the above case).
Figure 3.
The picking the number of possible clusters is done using the silhouette plot. The maximum cluster number () indicated in majority of the weekly interventions is picked as the possible number of clusters (6 in the above case).
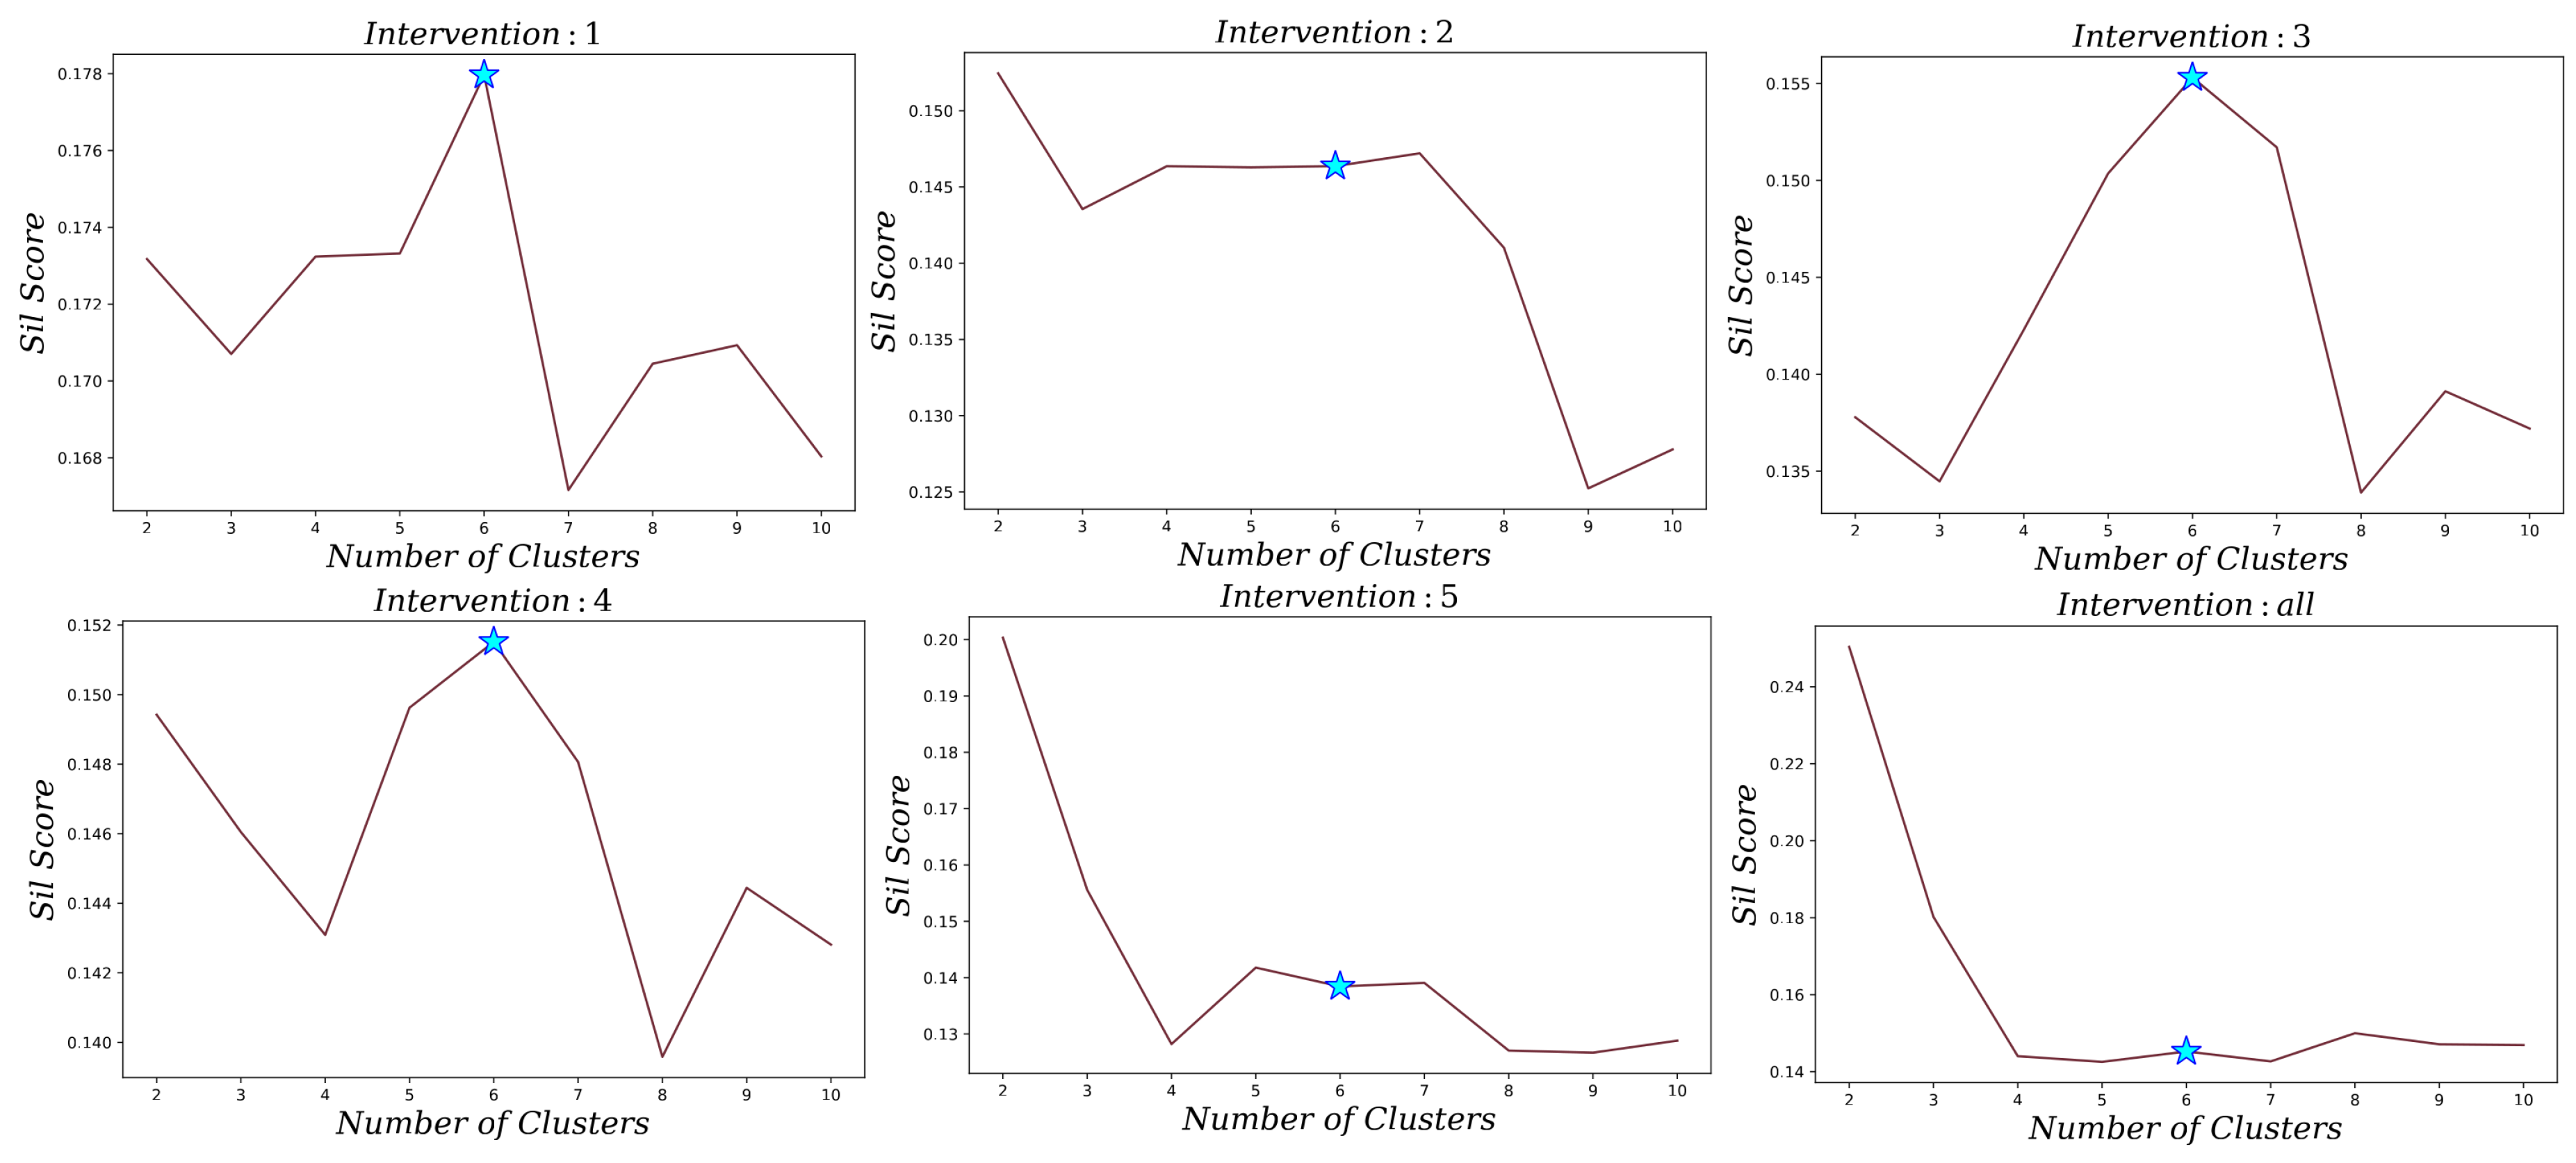
Figure 4.
The prediction model results are indicated for each week. The top plot in each week indicated the predicted value when using the embedding learned from only respective weekly intervention where as the bottom plot in each week shows the prediction when using the embeddings learned from all five weeks intervention data.
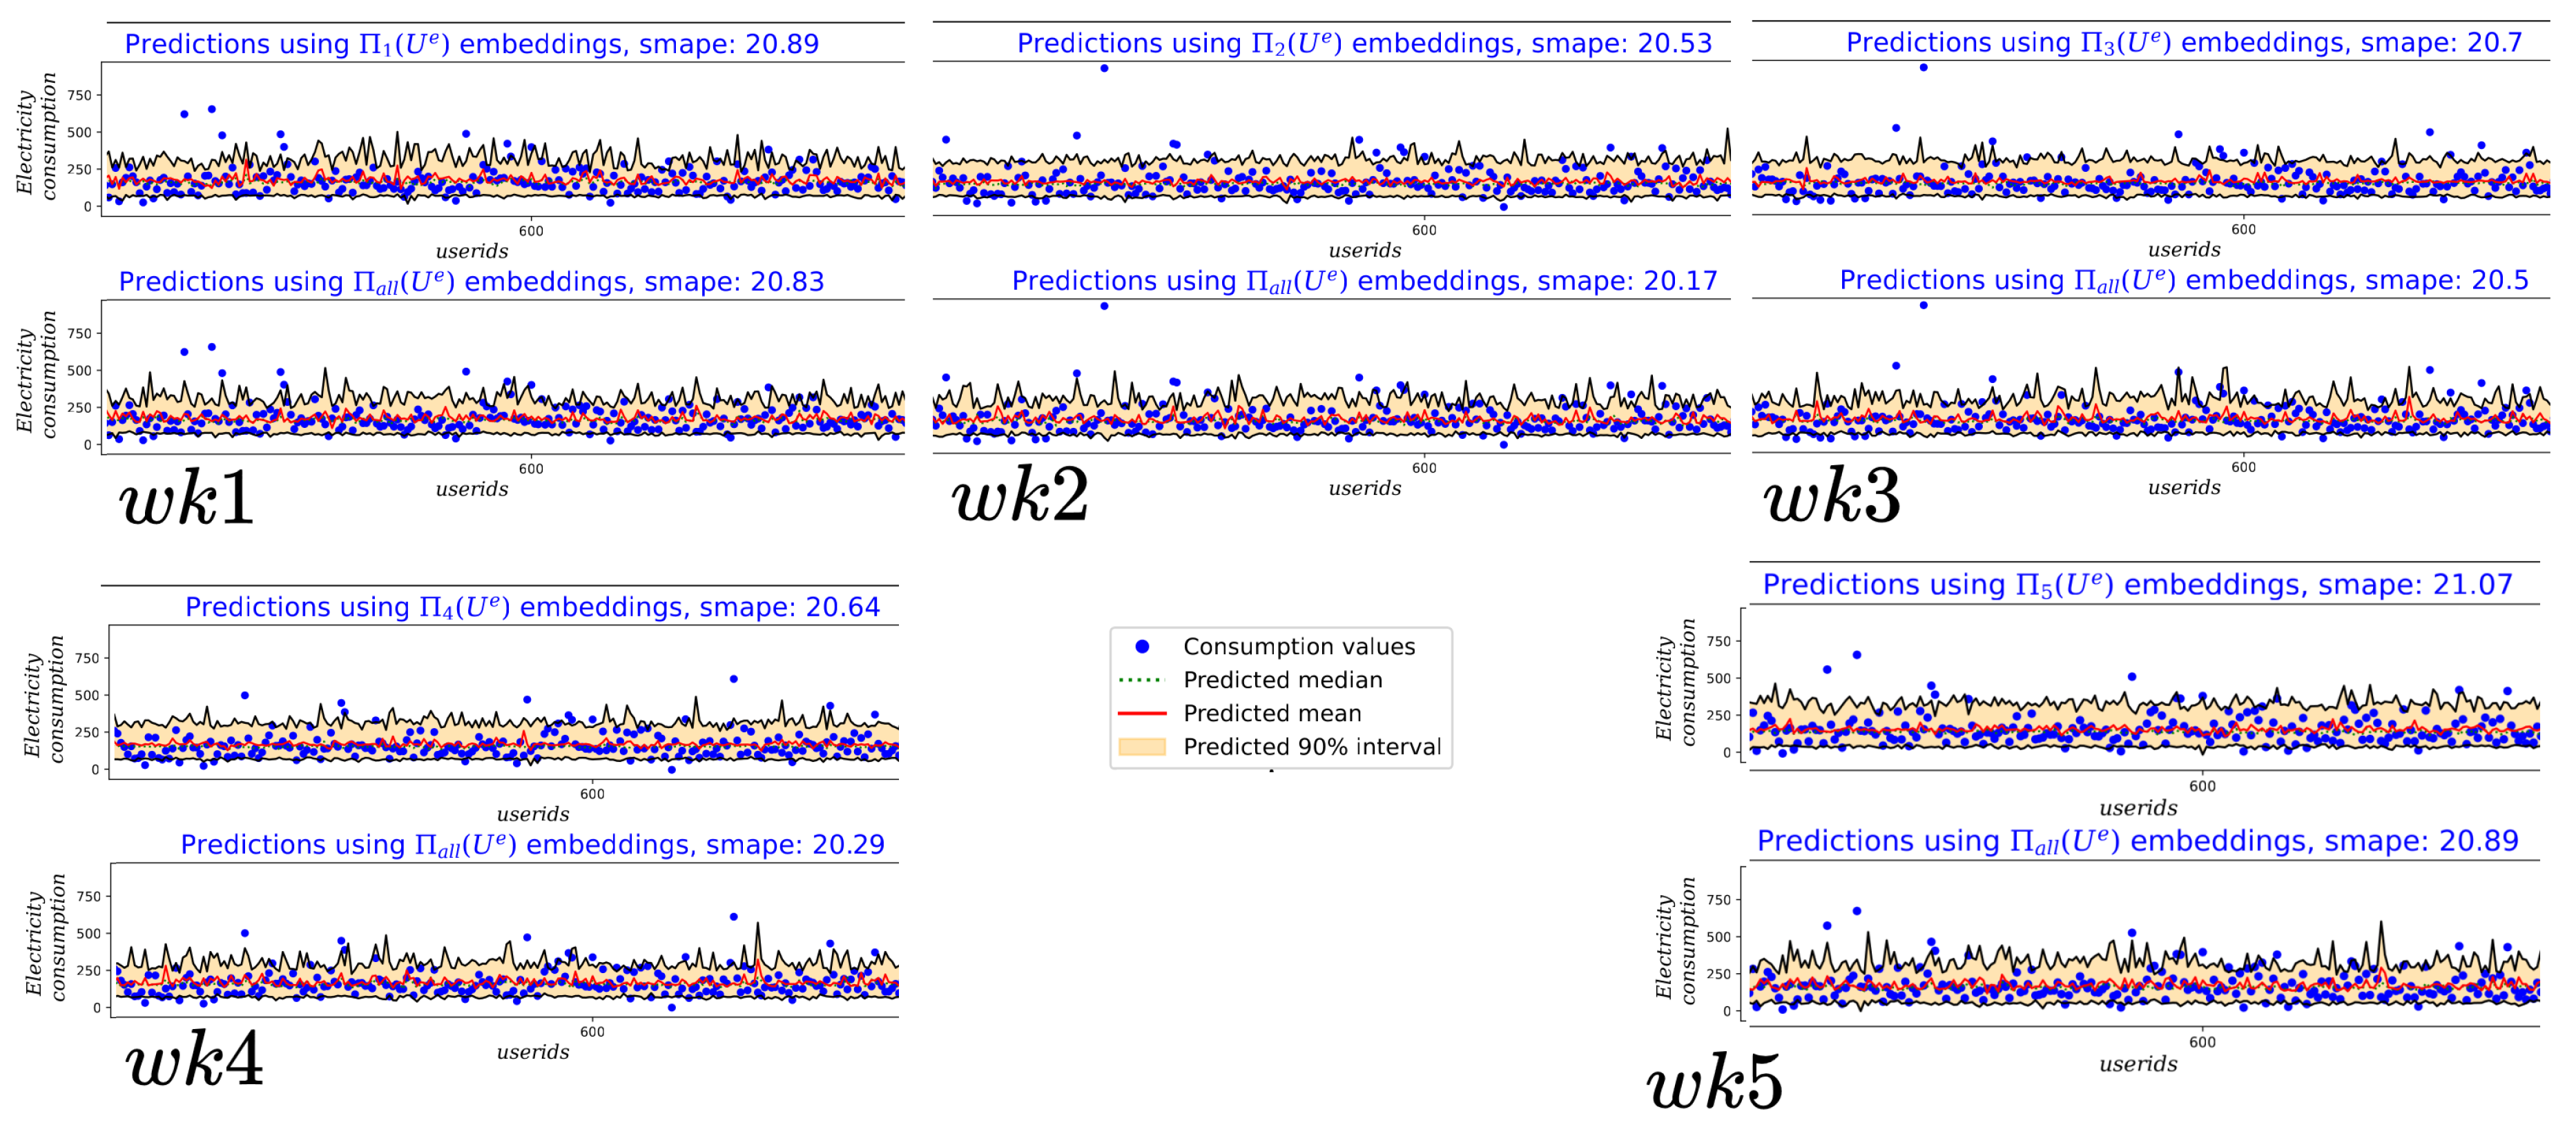
Figure 5.
The energy consumption difference for the past five weeks are plotted as histograms. The orange color outlined on the border of the histograms correspond to the orange behavioral group in the cluster plot Figure 2. Here we can compare the effect of collective framing when included for this behavior group
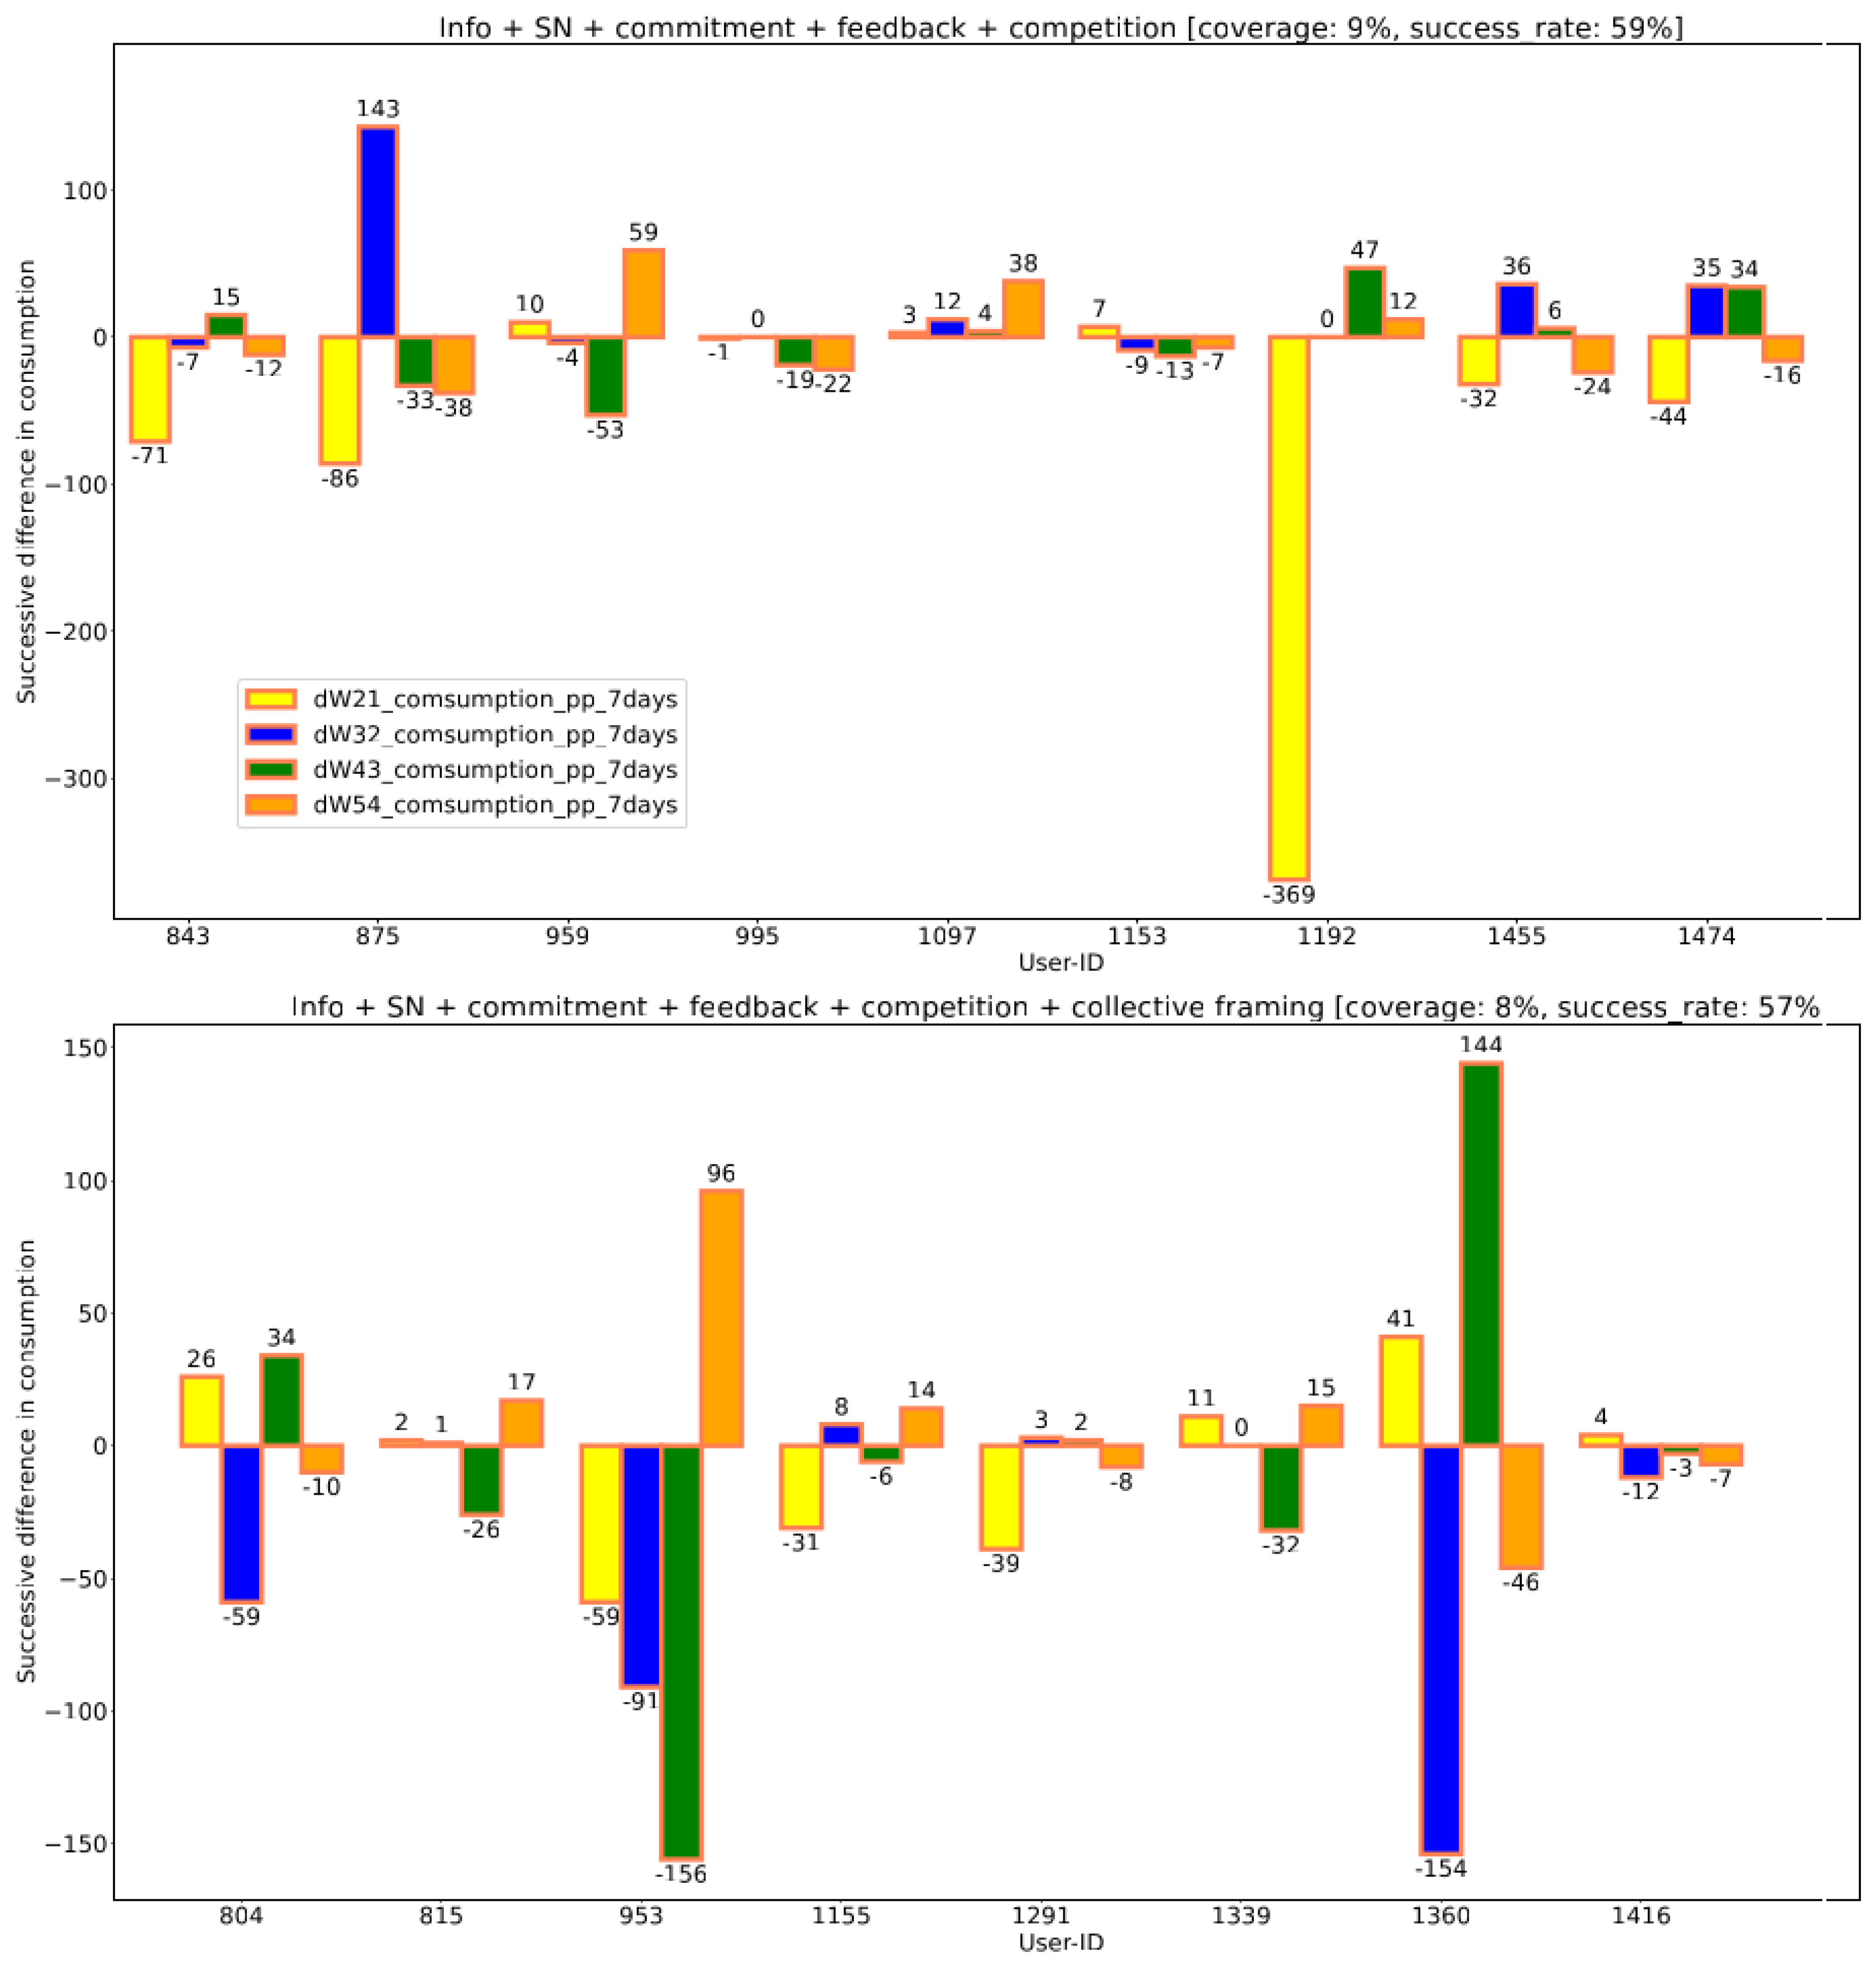

Table 1.
Description of interventions studied during survey
| Intervention | Description |
|---|---|
| Info | Provide information on energy consumption to know the impact of their actions |
| SN | User is part of social norm intervention |
| Commitment | User is asked to commit to a task or target |
| Feedback | Provide feedback to user on the possible improvements |
| Competition | Make the user part of competition with leader board on energy saving |
| Collective framing | User is monitored with individual or group sense of responsibility |
| Control 1 | Control group that provides weekly energy reports |
| Control 2 | Control group that provides energy consumption data once in the beginning and once towards the end of intervention period. |
Table 2.
Top-3 interventions and communication channels suitable for each group are indicated below
| Group | Intervention | Coverage % | Success rate % | Channel |
|---|---|---|---|---|
| 0 | Control 2 (start-end) | 23 | 90 | MUNICIPALITY, FACEBOOK, OTHERS |
| Info + SN + commitment + feedback + competition |
13 | 63 | ||
| Info + collective framing | 5 | 63 | ||
| 1 | Control 1 (weekly) | 12 | 71 | FACEBOOK, MUNICIPALITY, OTHERS |
| Info + feedback + competition |
10 | 66 | ||
| Info + collective framing |
17 | 62 | ||
| 2 | Control 2 (start-end) | 3 | 69 | MUNICIPALITY, FACEBOOK, OTHERS |
| Info | 9 | 65 | ||
| Info + collective framing |
12 | 63 | ||
| 3 | Control 2 (start-end) | 32 | 80 | FACEBOOK, MUNICIPALITY, OTHERS |
| Info + SN + commitment + feedback + competition |
8 | 73 | ||
| Info + commitment |
15 | 73 | ||
| 4 | Info + SN + commitment + feedback + competition + collective framing |
14 | 73 | MUNICIPALITY, FACEBOOK, OTHERS |
| Info + SN + commitment + feedback + competition |
9 | 67 | ||
| Info + commitment | 17 | 63 |
Disclaimer/Publisher’s Note: The statements, opinions and data contained in all publications are solely those of the individual author(s) and contributor(s) and not of MDPI and/or the editor(s). MDPI and/or the editor(s) disclaim responsibility for any injury to people or property resulting from any ideas, methods, instructions or products referred to in the content. |
© 2025 by the authors. Licensee MDPI, Basel, Switzerland. This article is an open access article distributed under the terms and conditions of the Creative Commons Attribution (CC BY) license (http://creativecommons.org/licenses/by/4.0/).
Copyright: This open access article is published under a Creative Commons CC BY 4.0 license, which permit the free download, distribution, and reuse, provided that the author and preprint are cited in any reuse.


