
Submitted:
01 July 2025
Posted:
03 July 2025
You are already at the latest version
Abstract
Hispanic breast cancer survivors reported worse quality of life, and fatalism is considered one of the mediators for this disparity. This study aimed to identify the factors associated with fatalism within a diverse Hispanic population. Hispanic origin was self-reported, and the Multidimensional Fatalism Measure questionnaire, a validated tool that measures fatalism across multiple dimensions, was used to assess fatalism. A total of 390 women, consisting of 210 Puerto Ricans, 34 Colombians, 29 Dominicans, 25 Cubans, 24 Venezuelans, 22 Mexicans, and 46 individuals of other Hispanic backgrounds, completed fatalism. The mean fatalism score was 16.4 (95% CI= 15.8–17.0), characterized by a high internal locus of control and strong religious beliefs, along with moderate beliefs in luck and a low external locus of control. The higher fatalism scores were reported in Dominican, Mexican, and Venezuelan groups, while Colombians reported the lowest score. Multivariable analysis showed that Colombians (β= -4.0), individuals with higher household incomes (β= -2.3 for $20,000-$75,000, β= - 2.4 for ≥ 75,000), higher education levels (β= -1.9), and those using English more frequently at home (β= -2.0) reported lower fatalism compared to their reference group. To enhance the quality of life for these survivors, culturally tailored interventions should focus on improving perceived control and mitigating fatalism.
Keywords:
breast cancer
; fatalism
; Hispanic
; cancer survivorship
; disparity
; country of origin
1. Introduction
Breast cancer is the leading cancer diagnosed among Hispanic/Latina women in the United States (US) [1]. Although they are less likely to be diagnosed with breast cancer and die from this disease compared to their non-Hispanic White counterparts [2], they face unique challenges. These include diagnoses of high-grade tumors at younger ages [3], which entails a worse prognosis. Latina breast cancer survivors report experiencing more severe symptoms, such as fatigue, depression, and difficulties in work and spousal relationships [4,5,6] and a lower overall quality of life (QOL) compared to non-Hispanic survivors [7,8,9,10].
Growing evidence indicates that cultural factors play a significant role in cancer survivorship, particularly concerning the QOL disparity [9,11]. Fatalism has been recognized as a dominant belief among Hispanic populations compared to non-Hispanic Whites [12]. Research suggests a substantial association between fatalistic beliefs and adverse outcomes in overall well-being and concerns related to breast cancer survivorship [13,14]. Fatalism, as defined by Merriam-Webster, is the belief that events are predetermined, leaving individuals powerless to change them [15]. This viewpoint implies that people have limited control over their fate concerning cancer incidence or survival [16]. High levels of fatalism reflect a diminished sense of personal control [4–6over health outcomes, whereas low levels indicate a greater sense of autonomy [17]. Research shows that fatalism can impede proactive behaviors, such as breast cancer screening and timely medical responses [18,19].
Examining fatalism is crucial, particularly as the Hispanic population continues to grow. Some studies showed that several factors, including acculturation, age, education, religion, locus of control, poverty, and cancer fear, influence fatalism among cancer survivors [20,21]. However, findings are inconsistent across different study populations. For example, a study of ethnic minorities in the United Kingdom found a negative association between fatalism and fear of cancer [20], while another study involving Chinese breast cancer survivors found a positive association with fear of recurrence [22]. Research on fatalism among Latina breast cancer survivors is limited, as previous studies either excluded Hispanic populations from the study sample or did not explicitly focus on fatalism as the key study variable [16,21,23,24,25]. Additionally, studies did not adequately differentiate between various Hispanic subgroups [7,16,21].
Thus, the main objectives of the present study were twofold. First, it aimed to explore the factors independently associated with fatalism among Hispanic/Latina breast cancer survivors to identify individuals who are at higher risk for experiencing high fatalism. Secondly, the study examined how fatalism varies according to different Hispanic backgrounds. By understanding these perspectives, healthcare providers can develop tailored, culturally responsive strategies to reduce fatalism in these populations.
2. Materials and Methods
2.1. Study Design and Population
This is a report of an ongoing population-based, cross-sectional study that aims to evaluate the mediators of the QOL disparities among breast cancer survivors within the Hispanic community in Central Florida, US. The Florida Cancer Data System (FCDS) provided contact information for individuals who met the eligibility criteria of the study. The eligibility criteria required participants to be adult women presumed to be Hispanic or Latina, aged ≥ 20 years, diagnosed with breast cancer from 2015 to 2023 in Central Florida, and reported to the FCDS. We followed the state-mandated patient recruitment procedure [26]. Our success in this recruitment process has been reported elsewhere (in press). Briefly, bilingual invitation letters were sent to all individuals deemed eligible to gauge their interest in participating in the study. If there was no response after three weeks, a second letter, accompanied by a telephone opt-out card, was sent to facilitate their participation. If there was no response to the second invitation, the bilingual research team made follow-up phone calls, attempting up to four times to gauge prospective participants’ interest in the study.
Among the 3,398 women whom we sent invitation letters, a total of 1,234 women were found to be contactable and eligible for the study. We sent a survey packet to 720 women who expressed interest in participating, either online or via mail, depending on their choice, in their preferred language of English or Spanish. The survey comprised questionnaires measuring QOL, unmet needs, sociodemographic characteristics, lifestyle, comorbidities, social support, fatalism, life satisfaction, and breast cancer worry. Between September 2023 and January 2025, a total of 413 women returned the survey. We excluded two participants who identified as non-Hispanic and 21 individuals due to missing fatalism scores. This results in a final sample of 390 women for data analysis in the current study. All participants provided informed consent for their involvement and received a $25 gift card as compensation for their participation. The study was approved by the University of Central Florida Institutional Review Board (IRB) and the Florida Department of Health IRB. The detailed numbers are displayed in Figure 1.
2.2. Measures
2.2.1. Fatalism
The Multidimensional Fatalism Measure (MFM) was used to assess fatalistic beliefs. This questionnaire was developed and validated in both English and Spanish, ensuring linguistic consistency across different populations, and it showed strong psychometric properties, including high reliability and validity [27]. The MFM consists of 30 questions, assessing general fatalism (e.g., if something bad is going to happen to me, it will happen no matter what I do) and four related domains, including divine control (e.g., whatever happens to me in my life, it is because that is the way God wanted it to happen), internality (e.g., what happens to me is a consequence of what I do), helplessness (e.g., I feel that nothing I can do will change things), and luck (e.g., some people are simply born lucky). Each domain has six items on a five-point Likert scale ranging from 1 (not at all) to 5 (very much), with the highest score possible in each domain being 30. A high fatalism score indicates a high belief in general fatalism. A high score in divine control indicates high religious beliefs, while a high score in luck indicates a high belief in luck. A high score in internality indicates a strong internal locus of control, and a high score in helplessness indicates a strong external locus of control. Since there are no cut-off points suggested for the level of belief, we used scores of 6 - 12, 12 - 21, and 21–30 to define the levels of belief as low, moderate, and high, respectively, to enhance understanding of characteristics of fatalism in the current study. Although there are several instruments to measure fatalism, including the Powe Fatalism Inventory or the Breast Cancer Fatalism Scale we chose the MFM instrument, because MFM can assess multiple dimensions of fatalism, which allows for a more nuanced understanding of fatalistic beliefs [27] compared to other instruments, which are unidimensional, measuring only fatalistic belief for specific disease outcome [28].
2.2.2. Hispanic Origin
Hispanic origin was self-reported in the survey, and this information was also collected by the cancer registry. Whenever possible, participants were categorized according to their self-reported origin. For the 19 women who did not provide a self-report of their Hispanic origin, supplementary information regarding nationality and Hispanic origin in the FCDS dataset was used. Hispanic origin was classified by country, which includes Colombian, Cuban, Dominican, Mexican, Puerto Rican, Venezuelan, and Other Hispanic. Origins with < 20 participants were grouped together under the ‘Other Hispanic’ category due to the low sample size.
2.2.3. Acculturation
As acculturation is seen as adapting to the culture and norms of a new environment surrounding a person [29], in our case, it would be Hispanic/Latino participants adopting more American views and beliefs. As language proficiency and time spent in a new culture are common predictors of acculturation [30], two questions from the Behavioral Risk Factor Surveillance System [31] were used to measure acculturation: 1) ‘which language do you use at home (only Spanish, more Spanish than English, equal Spanish and English, more English than Spanish, and only English spoken at home)?’ and 2) ‘how long have you lived in the US (in years)?’ Although some studies used less than 10 years, 10 - 19 years, and 20 or more years as the cut-off [16,32], we grouped the duration of residence into less than 10 years, 10–29 years, and 30 or more years because more than 50% have lived for more than 30 years in the present study.
2.2.4. Fear of Recurrence
The Lerman Breast Cancer Worry Scale is a three-item questionnaire used to measure the level of breast cancer recurrence worry and its impact on their daily lives [33]. For the current study, the question, ‘how worried are you about getting your breast cancer back?’ was used to assess the participants’ level of fear of breast cancer recurrence, with a category of 1 (low), 2-3 (moderate), and 4-5 (high).
2.2.5. Other Covariates
In addition to the above characteristics, age at the time of survey completion, race, smoking, marital status, household income, education level, height, weight, chronic medical conditions, and place of birth were self-reported in the survey. Self-reported comorbid conditions included hypertension, cardiovascular diseases, stroke, gastrointestinal problems, chronic lung diseases, arthritis, sciatica, diabetes, osteoporosis, and depression, and the presence of multimorbidity was defined as having two or more comorbidities [34], excluding cancer. The body mass index (BMI) was calculated with reported height and weight. Cancer-related characteristics, including age at diagnosis, diagnosis date, cancer stage, treatments (surgery, radiation, chemotherapy), and estrogen receptor status, were used from the FCDS data.
2.3. Statistical Analysis
Descriptive statistics (mean ± SD for continuous variables; frequencies and percentages for categorical variables) were used to describe characteristics of study participants according to their Hispanic origin. The association between fatalism scores and each of the study characteristics was examined with the least squares mean and 95% confidence interval (CIs) using a generalized linear model. A correlation matrix was conducted to examine the interrelationship among different characteristics of fatalism (i.e., general fatalism, religious belief, belief in luck, and internal and external locus of control). To describe the characteristics of fatalism according to Hispanic origin, a radar plot in Microsoft Excel was used to visualize the distribution of the five domains. A multivariable linear regression model was built with variables found significant in the univariate analyses alongside the potential confounders known from literature review. The results from the multivariable linear regression analysis were summarized as coefficients, standard errors, and associated P-values. Only the cases with non-missing data were included in the multivariable analysis. Statistical analyses were performed using SAS (version 9.4), and a P-value < 0.05 was considered statistically significant.
3. Results
3.1. Study Participants
The study consisted of 390 participants, and they were grouped based on their self-reported Hispanic origin: Colombian (8.7%), Cuban (6.4%), Dominican (7.4%), Mexican (5.6%), Puerto Rican (53.8%), Venezuelan (6.2%), and Other Hispanics (11.8%), including Peru, Brazil, Honduras, and other countries. Sociodemographic characteristics by Hispanic origin group can be found in Table 1. The mean age of the participants was 59.5 (± 11.8) years, with an average of 4.8 (± 2.0) years since diagnosis. About half of the participants self-reported their race as White (46.9%) and had a household income of $20,000– $75,000 (45.1%), while 60% were married and 68.5% had an education of some college or higher. Only 25.4% use more English than Spanish at home, and 79.0% were born outside of the US and have lived in the US for an average of 32.9 (± 19.4) years. Most of them were diagnosed at an early stage with ER-positive tumors and received surgery, while only less than half of them received radiation (43.6%) and chemotherapy (44.1%) for breast cancer. About 65% showed a moderate or high level of fear of recurrence. Interestingly, Cubans have lived in the US for a longer time than other subgroups (45.4 years), and 48% use English more often at home. A higher proportion of Cubans had an income level of $75,000 or more (44.0%), but a smaller proportion had received chemotherapy (28.0%) than other subgroups. In contrast, Venezuelans have lived in the US for the shortest time of 13.5 years. Notably, 83.3% Venezuelans had higher levels of education, 91.7% use Spanish more often at home, and 75.0% have received chemotherapy.
3.2. Fatalism Scores by Participant Characteristics
The estimated mean fatalism score was 16.4 (95% CI = 15.8–17.0), as shown in Table 2. The mean scores were varied by Hispanic origin, approaching statistical significance (P= 0.060). Notably, higher fatalism scores were reported among Dominican, Mexican, and Venezuelan groups, with scores of 17.4, 17.8, and 17.4, respectively, whereas Colombians reported the lowest score of 13.3. Participants with higher income levels (P= 0.004), higher education attainment (P= 0.003), an increased use of English at home (P= 0.007), recent diagnoses within two years (P= 0.043), or lower levels of fear of cancer recurrence (P= 0.039) reported lower fatalism scores. Fatalism scores did not differ significantly by age groups, race, BMI, smoking, marital status, place of birth, the presence of multimorbidity, cancer stage, and treatments received, or duration of residence in the US.
3.3. Characteristics of Fatalism
As shown in Figure 2 and Table 3, Hispanic breast cancer survivors endorsed a strong internal locus of control (23.4 ± 5.0) and religious beliefs (21.3 ± 7.5). They also demonstrated a moderate belief in luck (12.6 ± 4.7) and a low external locus of control (10.9 ± 5.3). The fatalism score was positively correlated with all other measures. As anticipated, fatalism had a stronger correlation with external locus of control and religious beliefs compared to internal locus of control and belief in luck. However, no significant correlations were found between internal locus of control and any measures, except for fatalism.
Figure 2 presents a radar plot illustrating the dynamics of MFM based on Hispanic origin. The mean fatalism scores for Dominicans, Mexicans, and Venezuelans were similar; however, their fatalism characteristics differ. For example, all three groups reported a strong internal locus of control. Dominicans reported high religious beliefs but moderate
beliefs in luck and external locus of control. Mexicans reported moderate religious beliefs, beliefs in luck, and an external locus of control. Venezuelans reported strong religious beliefs, moderate beliefs in luck, and low external locus of control. In addition, Colombians and Cubans had a strong internal locus of control, moderate religious beliefs, and low beliefs in luck and external locus of control.
3.4. Factors Associated with Fatalism
The multivariable linear regression model included Hispanic origin, current age, race, income level, education level, language use at home, years lived in the US, years since diagnosis, and the level of fear of recurrence, as outlined in Table 4. This model accounted for 14.0% of the variance in fatalism (R2 = 0.140, F(22, 356) = 7.8, P < 0.0001). Relative to the Puerto Rican subgroup, Colombians reported significantly lower fatalism score, with a mean difference of 4.0 points (β= -4.0, P= 0.001). No other subgroups demonstrated significant differences in fatalism scores when compared to Puerto Ricans. Furthermore, participants making between $20,000 and $74,999 and over $75,000 had significantly lower fatalism scores (β= -2.3, P= 0.011 and β= -2.4, P= 0.033, respectively) compared to participants with incomes below $20,000. Individuals possessing some college education or a higher degree had significantly lower fatalism scores (β= -1.9, P= 0.012) compared to those with an education level of high school or below. Participants who primarily use English at home reported a significantly lower fatalism score (β= -2.0, P= 0.042) than those who predominantly use Spanish. There were no significant associations between fatalism scores and current age, race, years lived in the US, and the level of fear of recurrence after adjusting for confounding effects.
4. Discussion
This study evaluated fatalism among 390 breast cancer survivors of various Hispanic backgrounds. The results demonstrated that these women had moderate levels of fatalism, characterized by a strong internal locus of control and religious belief, a moderate belief in luck, and a low external locus of control. Additionally, breast cancer survivors of Colombian origin and those with higher income, higher education, or proficiency in English reported lower fatalism, highlighting the need for culturally tailored interventions aimed at enhancing cancer survivorship among Hispanic breast cancer survivors.
Hispanic origin significantly influences levels of fatalism, as shown in a previous study where Mexicans and Puerto Ricans had a more fatalistic (negative) view of cancer [35]. In our study, Colombians reported a lower fatalism score compared to Puerto Ricans, contrasting with Diaz’s research, which suggested Colombians have less power to control their health stemming from a collectivist perspective [36]. The Colombians in our study were immigrants or descendants of Colombian Americans who had adapted to US culture, likely leading to a greater sense of control over their health and lower fatalism, as well as a strong internal locus of control. Although several studies reported differences in fatalism between Caucasians and African Americans [12,37,38], we were not able to observe this difference, which could be because that many participants in the current study responded either ‘other’ or ‘prefer not to report,’ with only a few identifying them as Black, Asian, Native Indian, or Pacific Islander. According to Pew Research Center, only about 44% of Hispanics see their identity reflected very well with the traditional categories of the race and ethnicity questions in the US Census, and see origins as central to their identity [39]. These findings underscore the importance of considering patient’s origins, including their ethnic backgrounds, nationality, and culture, to enhance understanding of their health beliefs and behaviors, highlighting the need for cultural competency in healthcare.
Income and education have demonstrated a negative association with fatalism scores, as shown in prior research [23,37,40]. This association could be because individuals with higher household incomes often feel a greater sense of control over their medical care and have access to a more extensive support network compared to those with lower incomes [41]. Additionally, individuals with higher levels of education typically have an enhanced understanding of available treatment options, their associated outcomes, and effective coping mechanisms [42].
The level of acculturation may be linked to fatalism [40,43]. We assessed acculturation employing two proxy questions: proficiency in language use and duration of residence. Among these variables, only English language proficiency showed a negative association with fatalism, aligning with previous research findings [16,20]. One potential explanation for the lack of association with the length of residence in the US is that most participants in our study have resided in the country for an extended duration, resulting in minimal variability. Acculturation is defined as the process of adapting to the cultural norms and values of a new environment [29]. Therefore, measuring acculturation solely through language proficiency and duration of residence may not provide a complete representation of acculturation. Future studies should consider participants’ cultural norms, values, and practices to offer a more nuanced understanding of acculturation [44], especially when the majority of the study population consists of long-term immigrants.
Although it did not reach statistical significance, there was a slight increase in the mean fatalism score with increasing levels of fear of cancer recurrence, as demonstrated in previous research [22]. Fear of recurrence is common among breast cancer survivors, particularly those with fatalistic beliefs, and it mediates the association between fatalism and anxiety and depression.
It is noteworthy that Hispanic breast cancer survivors in our study displayed a strong internal locus of control alongside a strong religious belief. This combination suggests that their sense of fatalism may not be solely linked to a belief in a divine being. While Hispanic survivors acknowledge that God controls every aspect of life, they also display an increased sense of personal control in managing their own lives. Stronger fatalistic beliefs, especially when coupled with medical mistrust, can lead to avoidance of necessary medical procedures [21]. Therefore, it is crucial to approach patients who display high fatalism with an understanding of the origins of these beliefs to enhance adherence to screening and treatment [21,37]. By fostering trust between patients and physicians, patients are more likely to discuss their concerns or symptoms earlier in their breast cancer survivorship care. As a result, they may be more inclined to follow recommended treatment plans, ultimately improving their prognosis and QOL. Furthermore, for those with high fatalism, interventions focusing on enhancing perceived control and reducing reliance on fatalistic beliefs could also be beneficial [22].
This study has some limitations that warrant consideration. It was conducted within a specific geographic area, which may accurately reflect the experiences of all Hispanic breast cancer survivors. However, the distribution of Hispanic origins in the sample aligns closely with the demographics observed in Central Florida, as previously reported (in press), thereby rendering the results applicable to the Hispanic breast cancer population in that region. Additionally, due to a cross-sectional design of the study, a causal relationship among the factors examined cannot be established. There is also a possibility of residual confounding, as not all variables known to influence fatalism, such as coping mechanisms, religious affiliation, or medical access [19,40,45], were included in the multivariable model.
This study has several strengths. It is one of the first to demonstrate a disparity in fatalism based on country of origin, which is not possible when using an aggregated Hispanic group. Fatalism was measured using a valid instrument (i.e., MFM), ensuring linguistic consistency across different populations [27]. Importantly, this instrument incorporates a multidimensional belief system regarding fatalism, allowing for an evaluation of the interrelationship among various beliefs related to fatalism. The findings demonstrated how these beliefs vary by Hispanic origin, enhancing our understanding of the characteristics of fatalism among Hispanic breast cancer survivors. Future research should explore whether fatalism serves as a mediator in the disparities of QOL within this Hispanic population.
In conclusion, Hispanic breast cancer survivors reported a moderate level of fatalism, with significant variations according to their specific Hispanic origin. Notably, Colombians had lower fatalism scores in comparison to Puerto Ricans. In addition, Hispanic breast cancer survivors with higher household income, higher levels of education attainment, and those who predominantly use English rather than Spanish at home reported lower fatalism. These findings provide valuable insights for healthcare providers in seeking to identify individuals who may be at a greater risk of experiencing high fatalism. By recognizing these factors, healthcare providers can adapt their strategies to mitigate fatalism and enhance patients’ perceived control over their health outcomes and behaviors.
Author Contributions
Conceptualization, E.L. and V.L.; methodology, E.L., B.S., and L.L.T.; software, E.L.; validation, E.L. and L.L.T.; formal analysis, L.L.T.; investigation, L.L.T.; resources, E.L.; data curation, E.L.; writing—original draft preparation, L.L.T.; writing—review and editing, B.S., M.D., E.L., L.L.T. and V.L.; visualization, E.L.; supervision, E.L.; project administration, B.S. and M.D.; funding acquisition, E.L. All authors have read and agreed to the published version of the manuscript.
Funding
This research was funded by the Florida Breast Cancer Foundation (grant number: SGA1057674) and the University of Central Florida (grant number: AWD00001663).
Institutional Review Board Statement
The study was conducted in accordance with the Declaration of Helsinki, and approved by the Institutional Review Board of University of Central Florida (protocol code: STYDY0000832 and date of approval: March 18, 2022) and Florida Department of Health (protocol code: 2022-044 and data of approval: March 2, 2023).
Informed Consent Statement
Informed consent was obtained from all subjects involved in the study.
Data Availability Statement
Restrictions apply to the availability of the cancer registry’s data. Data were obtained from the Florida Cancer Data System and are available with the permission of the Florida Department of Health and Florida Cancer Registry. The survey data presented in this article are not readily available because data are part of an ongoing study. Requests to access the survey data should be directed to the corresponding author.
Acknowledgments
The authors are thankful to all the women who participated in the study, the staff at the Florida Department of Health, and the Florida Cancer Data System for their support. The authors also thank the research team for their effort in data collection.
Conflicts of Interest
The authors declare no conflicts of interest.
Abbreviations
The following abbreviations are used in this manuscript:
| QOL | Quality of life |
| US | United States |
| FCDS | Florida Cancer Data System |
| IRB | Institutional Review Board |
| MFM | Multidimensional Fatalism Measure |
| BMI | Body mass index |
| CI | Confidence Interval |
References
- American Cancer Society, Cancer facts & figures for hispanic/latino population 2024-2026. 2024: Atlanta: American Cancer Society, Inc.
- Giaquinto, A.N.; Sung, H.; Newman, L.A.; Freedman, R.A.; Smith, R.A.; Star, J.; Jemal, A.; Siegel, R.L. Breast cancer statistics 2024. CA: A Cancer J. Clin. 2024, 74, 477–495. [CrossRef]
- American Cancer Society, Breast cancer facts & figures 2024-2025. 2024: Atlanta: American Cancer Society.
- Ashing-Giwa, K.T.; Padilla, G.V.; Bohorquez, D.E.; Tejero, J.S.; Garcia, M.; D, P.; Mph Understanding the Breast Cancer Experience of Latina Women. J. Psychosoc. Oncol. 2006, 24, 19–52. [CrossRef]
- Blinder, V.S.; Patil, S.; Thind, A.; Diamant, A.; Hudis, C.A.; Basch, E.; Maly, R.C. Return to work in low-income Latina and non-Latina white breast cancer survivors: A 3-year longitudinal study. Cancer 2011, 118, 1664–1674. [CrossRef]
- Eversley, R.; Estrin, D.; Dibble, S.; Wardlaw, L.; Pedrosa, M.; Favila-Penney, W. Post-Treatment Symptoms Among Ethnic Minority Breast Cancer Survivors. Oncol. Nurs. Forum 2005, 32, 250–256. [CrossRef]
- Almatkyzy, G.; Mojica, C.M.; Stroup, A.M.; Llanos, A.A.; O’malley, D.; Xu, B.; Tsui, J. Predictors of health-related quality of life among Hispanic and non-Hispanic White breast cancer survivors in New Jersey. J. Psychosoc. Oncol. 2020, 39, 595–612. [CrossRef]
- Nápoles-Springer, A.M.; Ortíz, C.; O’brien, H.; Díaz-Méndez, M.; Pérez-Stable, E.J. Use of cancer support groups among Latina breast cancer survivors. J. Cancer Surviv. 2007, 1, 193–204. [CrossRef]
- Yanez, B.; Thompson, E.H.; Stanton, A.L. Quality of life among Latina breast cancer patients: a systematic review of the literature. J. Cancer Surviv. 2011, 5, 191–207. [CrossRef]
- Carver, C.S.; Smith, R.G.; Petronis, V.M.; Antoni, M.H. Quality of life among long-term survivors of breast cancer: different types of antecedents predict different classes of outcomes. Psycho-Oncology 2005, 15, 749–758. [CrossRef]
- Yanez, B.; Stanton, A.L.; Maly, R.C. Breast cancer treatment decision making among Latinas and non-Latina whites: A communication model predicting decisional outcomes and quality of life.. Heal. Psychol. 2012, 31, 552–561. [CrossRef]
- Powe, B.D.R.; Finnie, R.M. Cancer Fatalism. Cancer Nurs. 2003, 26, 454???467–465. [CrossRef]
- Lopez-Class, M.; Perret-Gentil, M.; Kreling, B.; Caicedo, L.; Mandelblatt, J.; Graves, K.D. Quality of Life Among Immigrant Latina Breast Cancer Survivors: Realities of Culture and Enhancing Cancer Care. J. Cancer Educ. 2011, 26, 724–733. [CrossRef]
- Graves, K.D.; Jensen, R.E.; Cañar, J.; Perret-Gentil, M.; Leventhal, K.-G.; Gonzalez, F.; Caicedo, L.; Jandorf, L.; Kelly, S.; Mandelblatt, J. Through the lens of culture: quality of life among Latina breast cancer survivors. Breast Cancer Res. Treat. 2012, 136, 603–613. [CrossRef]
- Fatalism, in Merriam-Webster. 2025: United States.
- Abraído-Lanza, A.F., M.C. Martins, et al., Breast cancer screening among dominican latinas: A closer look at fatalism and other social and cultural factors. Health Education & Behavior, 2015. 42(5): p. 633-641.
- Powe, B.D.; Hamilton, J.; Brooks, P.; PhD, R.B.D.P.; Mph Perceptions of Cancer Fatalism and Cancer Knowledge. J. Psychosoc. Oncol. 2006, 24, 1–13. [CrossRef]
- Remennick, L. The Challenge of Early Breast Cancer Detection among Immigrant and Minority Women in Multicultural Societies. Breast J. 2006, 12, S103–S110. [CrossRef]
- Shahid, F.; Beshai, S.; Del Rosario, N. Fatalism and Depressive Symptoms: Active and Passive Forms of Fatalism Differentially Predict Depression. J. Relig. Heal. 2020, 59, 3211–3226. [CrossRef]
- Vrinten, C.; Wardle, J.; Marlow, L.A. Cancer fear and fatalism among ethnic minority women in the United Kingdom. Br. J. Cancer 2016, 114, 597–604. [CrossRef]
- Bustillo, N.E.; McGinty, H.L.; Dahn, J.R.; Yanez, B.; Antoni, M.H.; Kava, B.R.; Penedo, F.J. Fatalism, medical mistrust, and pretreatment health-related quality of life in ethnically diverse prostate cancer patients. Psycho-Oncology 2015, 26, 323–329. [CrossRef]
- Tsai, W.; Wang, J.H.-Y. Fatalism and Psychological Distress Among Chinese American Breast Cancer Survivors: Mediating Role of Perceived Self-control and Fear of Cancer Recurrence. Int. J. Behav. Med. 2022, 30, 705–713. [CrossRef]
- Baron-Epel, O.; Friedman, N.; Lernau, O. Fatalism and Mammography in a Multicultural Population. Oncol. Nurs. Forum 2009, 36, 353–361. [CrossRef]
- Ghaderi, I.; Kaviani, A.; Fakhrejahani, E.; Mehrdad, N.; Hazar, N.; Karbakhsh, M.
- Gullatte, M.M.; Brawley, O.; Kinney, A.; Powe, B.; Mooney, K. Religiosity, Spirituality, and Cancer Fatalism Beliefs on Delay in Breast Cancer Diagnosis in African American Women. J. Relig. Heal. 2009, 49, 62–72. [CrossRef]
- Florida Department of Health, Procedure guide for studies that utilize patient identifiable data form the florida cancer data system. 2016.
- Esparza, O.A.; Wiebe, J.S.; Quiñones, J. Simultaneous Development of a Multidimensional Fatalism Measure in English and Spanish. Curr. Psychol. 2014, 34, 597–612. [CrossRef]
- Valenti, G.D.; Faraci, P. Instruments measuring fatalism: A systematic review.. Psychol. Assess. 2022, 34, 159–175. [CrossRef]
- Berry, J.W. Acculturation: Living successfully in two cultures. Int. J. Intercult. Relations 2005, 29, 697–712. [CrossRef]
- Wilson, E.J., K.K. Bennett, et al., The interaction between fatalism and religious attendance is negatively associated with mental health-related quality of life in hispanic/latino americans low in acculturation. North American Journal of Psychology, 2020. 22: p. 521.
- U.S. Department of Health and Human Services, Behavioral risk factor surveillance system survey questionnaire. Centers for Disease Control and Prevention (CDC).
- Kandula, N.R.; Diez-Roux, A.V.; Chan, C.; Daviglus, M.L.; Jackson, S.A.; Ni, H.; Schreiner, P.J. Association of Acculturation Levels and Prevalence of Diabetes in the Multi-Ethnic Study of Atherosclerosis (MESA). Diabetes Care 2008, 31, 1621–1628. [CrossRef]
- Lerman, C., B.K. Trock B Fau - Rimer, et al., Psychological side effects of breast cancer screening. (0278-6133 (Print)).
- Brettschneider, C.; Leicht, H.; Bickel, H.; Dahlhaus, A.; Fuchs, A.; Gensichen, J.; Maier, W.; Riedel-Heller, S.; Schäfer, I.; Schön, G.; et al. Relative Impact of Multimorbid Chronic Conditions on Health-Related Quality of Life—Results from the MultiCare Cohort Study. PLOS ONE 2013, 8, e66742. [CrossRef]
- Ramirez, A.G.; Suarez, L.; Laufman, L.; Barroso, C.; Chalela, P. Hispanic Women’s Breast and Cervical Cancer Knowledge, Attitudes, and Screening Behaviors. Am. J. Heal. Promot. 2000, 14, 292–300. [CrossRef]
- Díaz, D.; Blanco, A.; Bajo, M.; Stavraki, M. Fatalism and Well-Being Across Hispanic Cultures: The Social Fatalism Scales (SFS). Soc. Indic. Res. 2014, 124, 929–945. [CrossRef]
- Mayo, R.M.; Ureda, J.R.; Parker, V.G.; D, P.; H, D.P. Importance of Fatalism in Understanding Mammography Screening in Rural Elderly Women. J. Women Aging 2001, 13, 57–72. [CrossRef]
- Sukkarieh-Haraty, O.; Egede, L.E.; Kharma, J.A.; Bassil, M. Predictors of Diabetes Fatalism Among Arabs: A Cross-Sectional Study of Lebanese Adults with Type 2 Diabetes. J. Relig. Heal. 2017, 57, 858–868. [CrossRef]
- Cohn, D.V., A. Brown, and M.H. Lopez, Black and hispanic americans see their origins as central to who they are, less so for white adults. 2021, Pew Research Center.
- Otero-Sabogal, R.; Stewart, S.; Sabogal, F.; Brown, B.A.; Pérez-Stable, E.J. Access and Attitudinal Factors Related to Breast and Cervical Cancer Rescreening: Why are Latinas Still Underscreened?. Heal. Educ. Behav. 2003, 30, 337–359. [CrossRef]
- Finkelstein, D.M.; Harding, J.F.; Paulsell, D.; English, B.; Hijjawi, G.R.; Ng’aNdu, J. Economic Well-Being And Health: The Role Of Income Support Programs In Promoting Health And Advancing Health Equity. Heal. Aff. 2022, 41, 1700–1706. [CrossRef]
- Berkman, N.D.; Sheridan, S.L.; Donahue, K.E.; Halpern, D.J.; Crotty, K. Low Health Literacy and Health Outcomes: An Updated Systematic Review. Ann. Intern. Med. 2011, 155, 97–107. [CrossRef]
- Harmon, M.P.; Castro, F.G.; Coe, K. Acculturation and Cervical Cancer: Knowledge, Beliefs, and Behaviors of Hispanic Women. Women Heal. 1997, 24, 37–57. [CrossRef]
- Schwartz, S.J.; Unger, J.B.; Zamboanga, B.L.; Szapocznik, J. Rethinking the concept of acculturation: Implications for theory and research. Am. Psychol. 2010, 65, 237–251. [CrossRef]
- Durmaz, H.; Çapik, C. Are Health Fatalism and Styles of Coping with Stress Affected by Poverty? A Field Study. Iran. J. Public Heal. 2023, 52, 575–583. [CrossRef]
Figure 1.
Sample Selection Process.
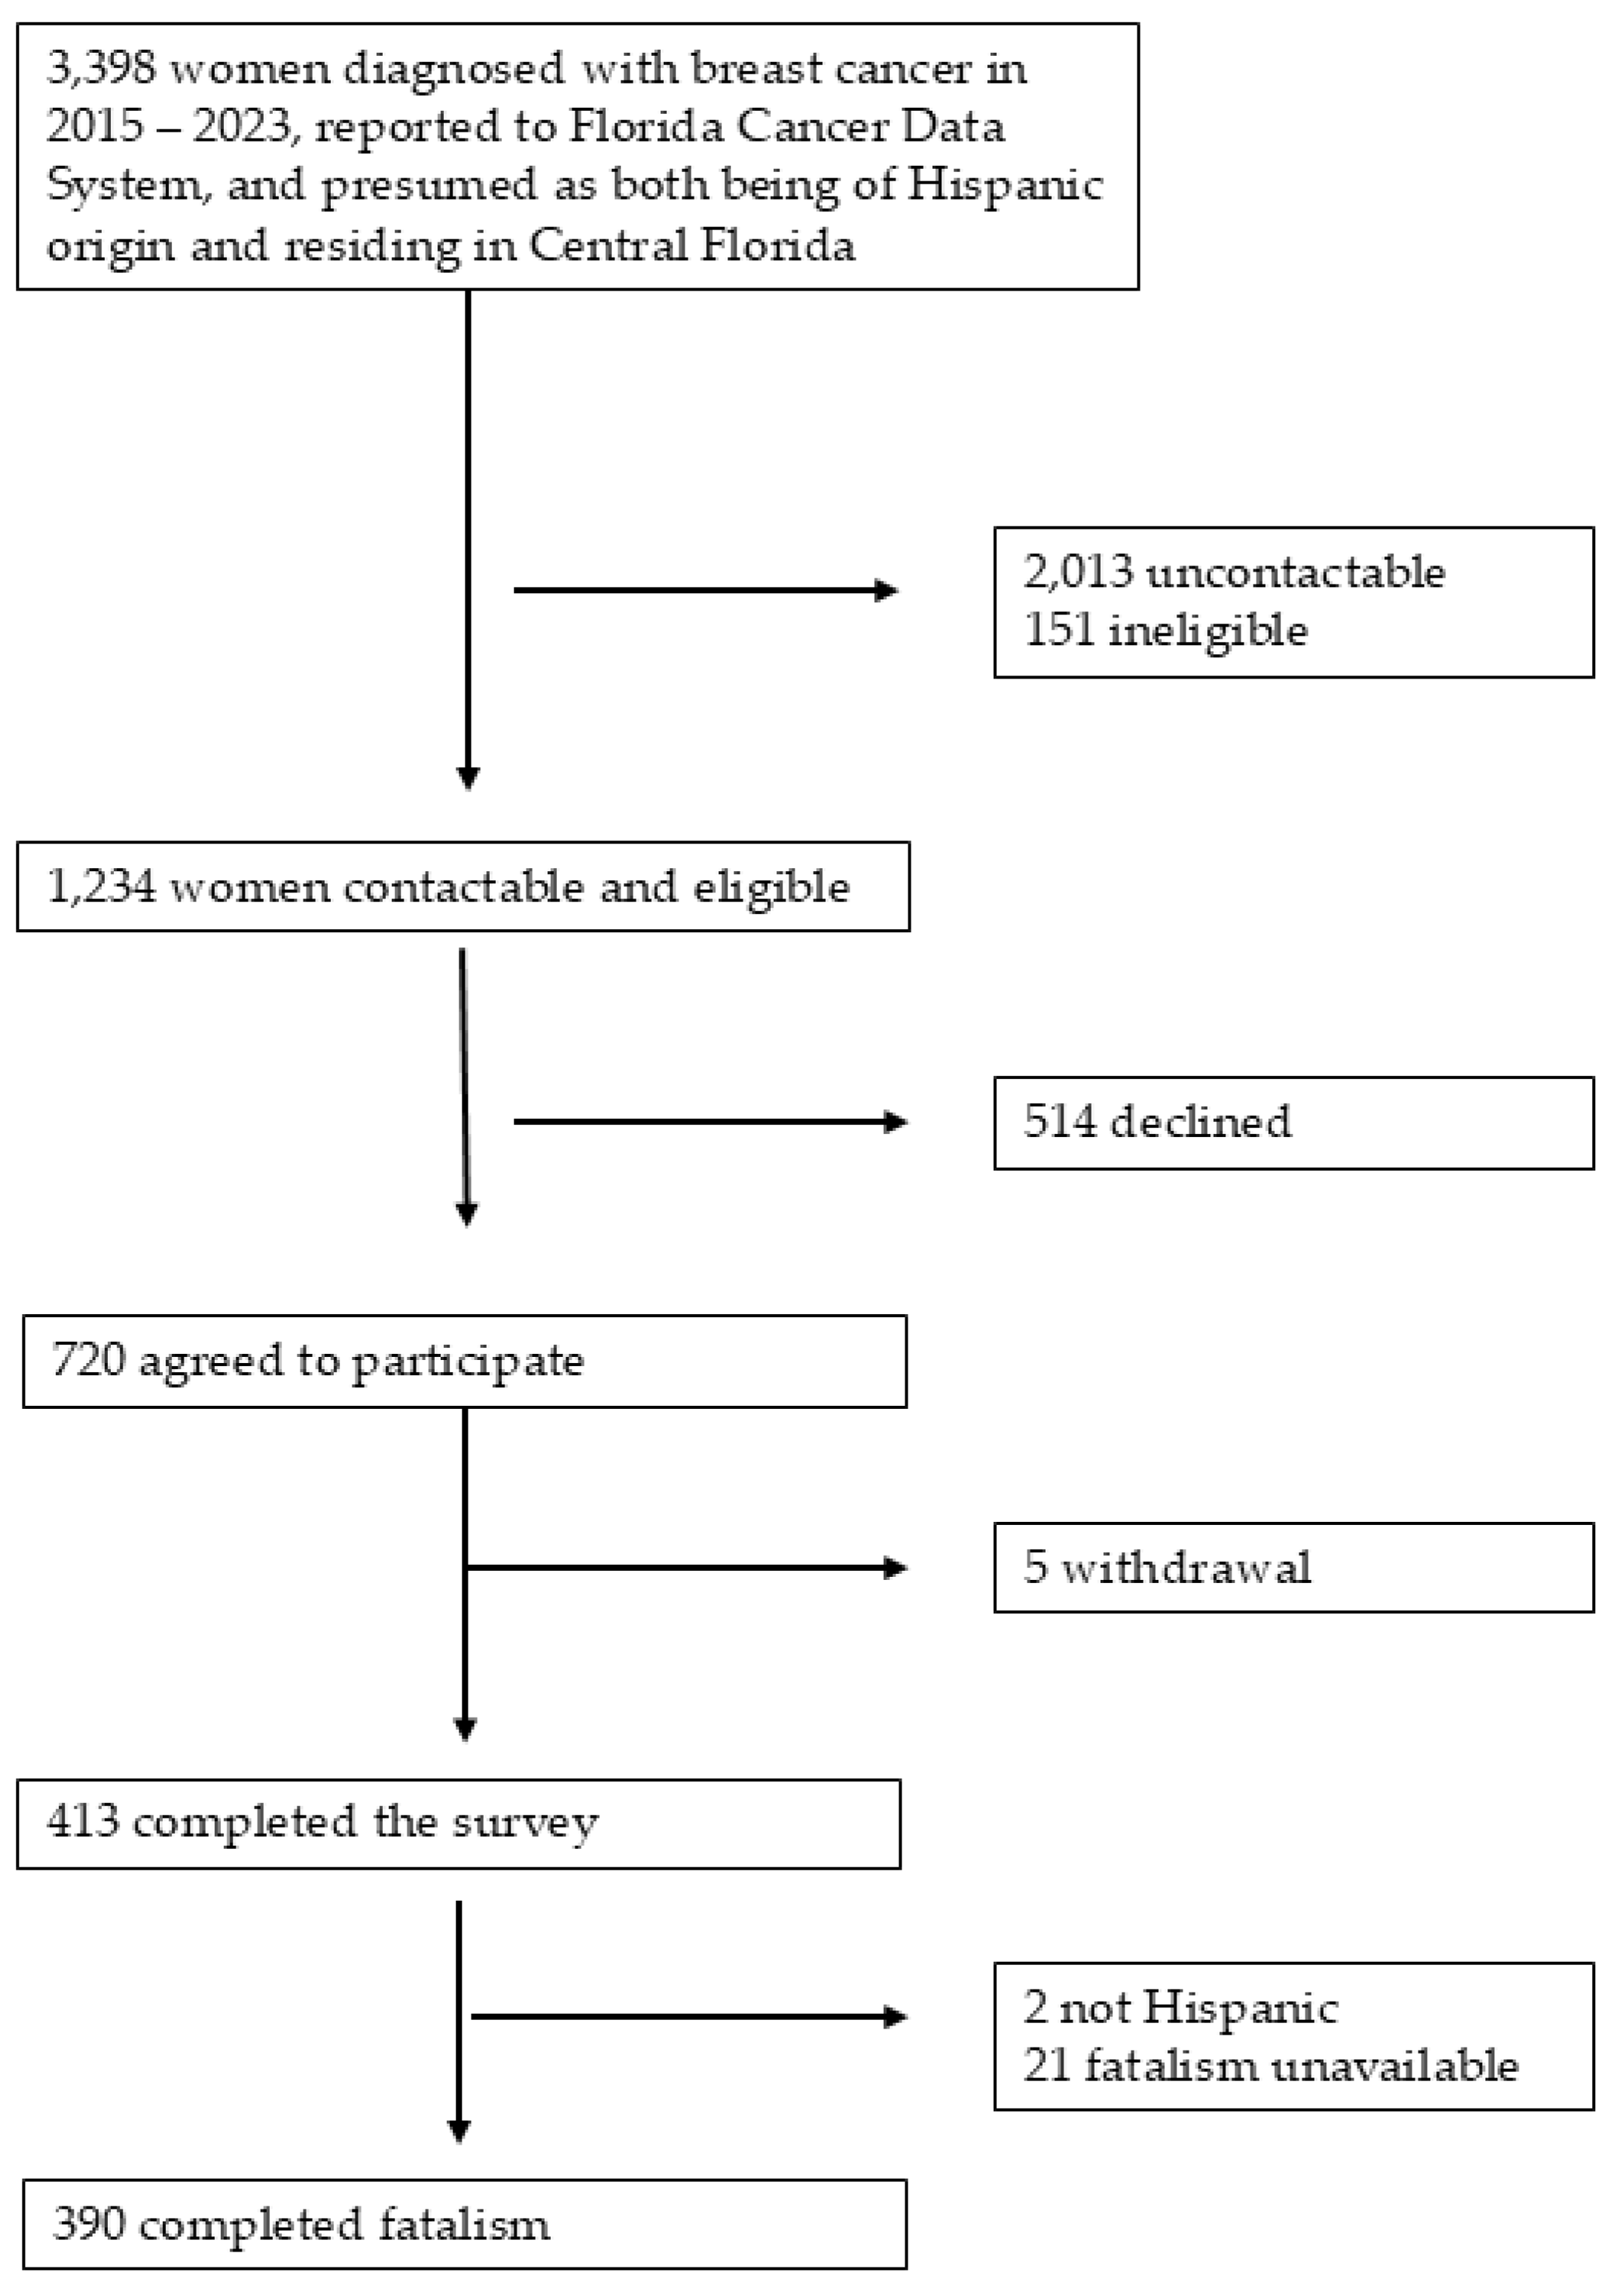
Figure 2.
Dynamics of Multidimensional Fatalism Measure of Hispanic breast cancer survivors by Hispanic origin. The radar plot displays the dynamics of multidimensional fatalism measures, starting at 0 in the center and reaching a maximum possible score of 30 at the outer edges. This plot helps us understand the characteristics of fatalism across different Hispanic subgroups and identify subgroups with a lower dimension score.
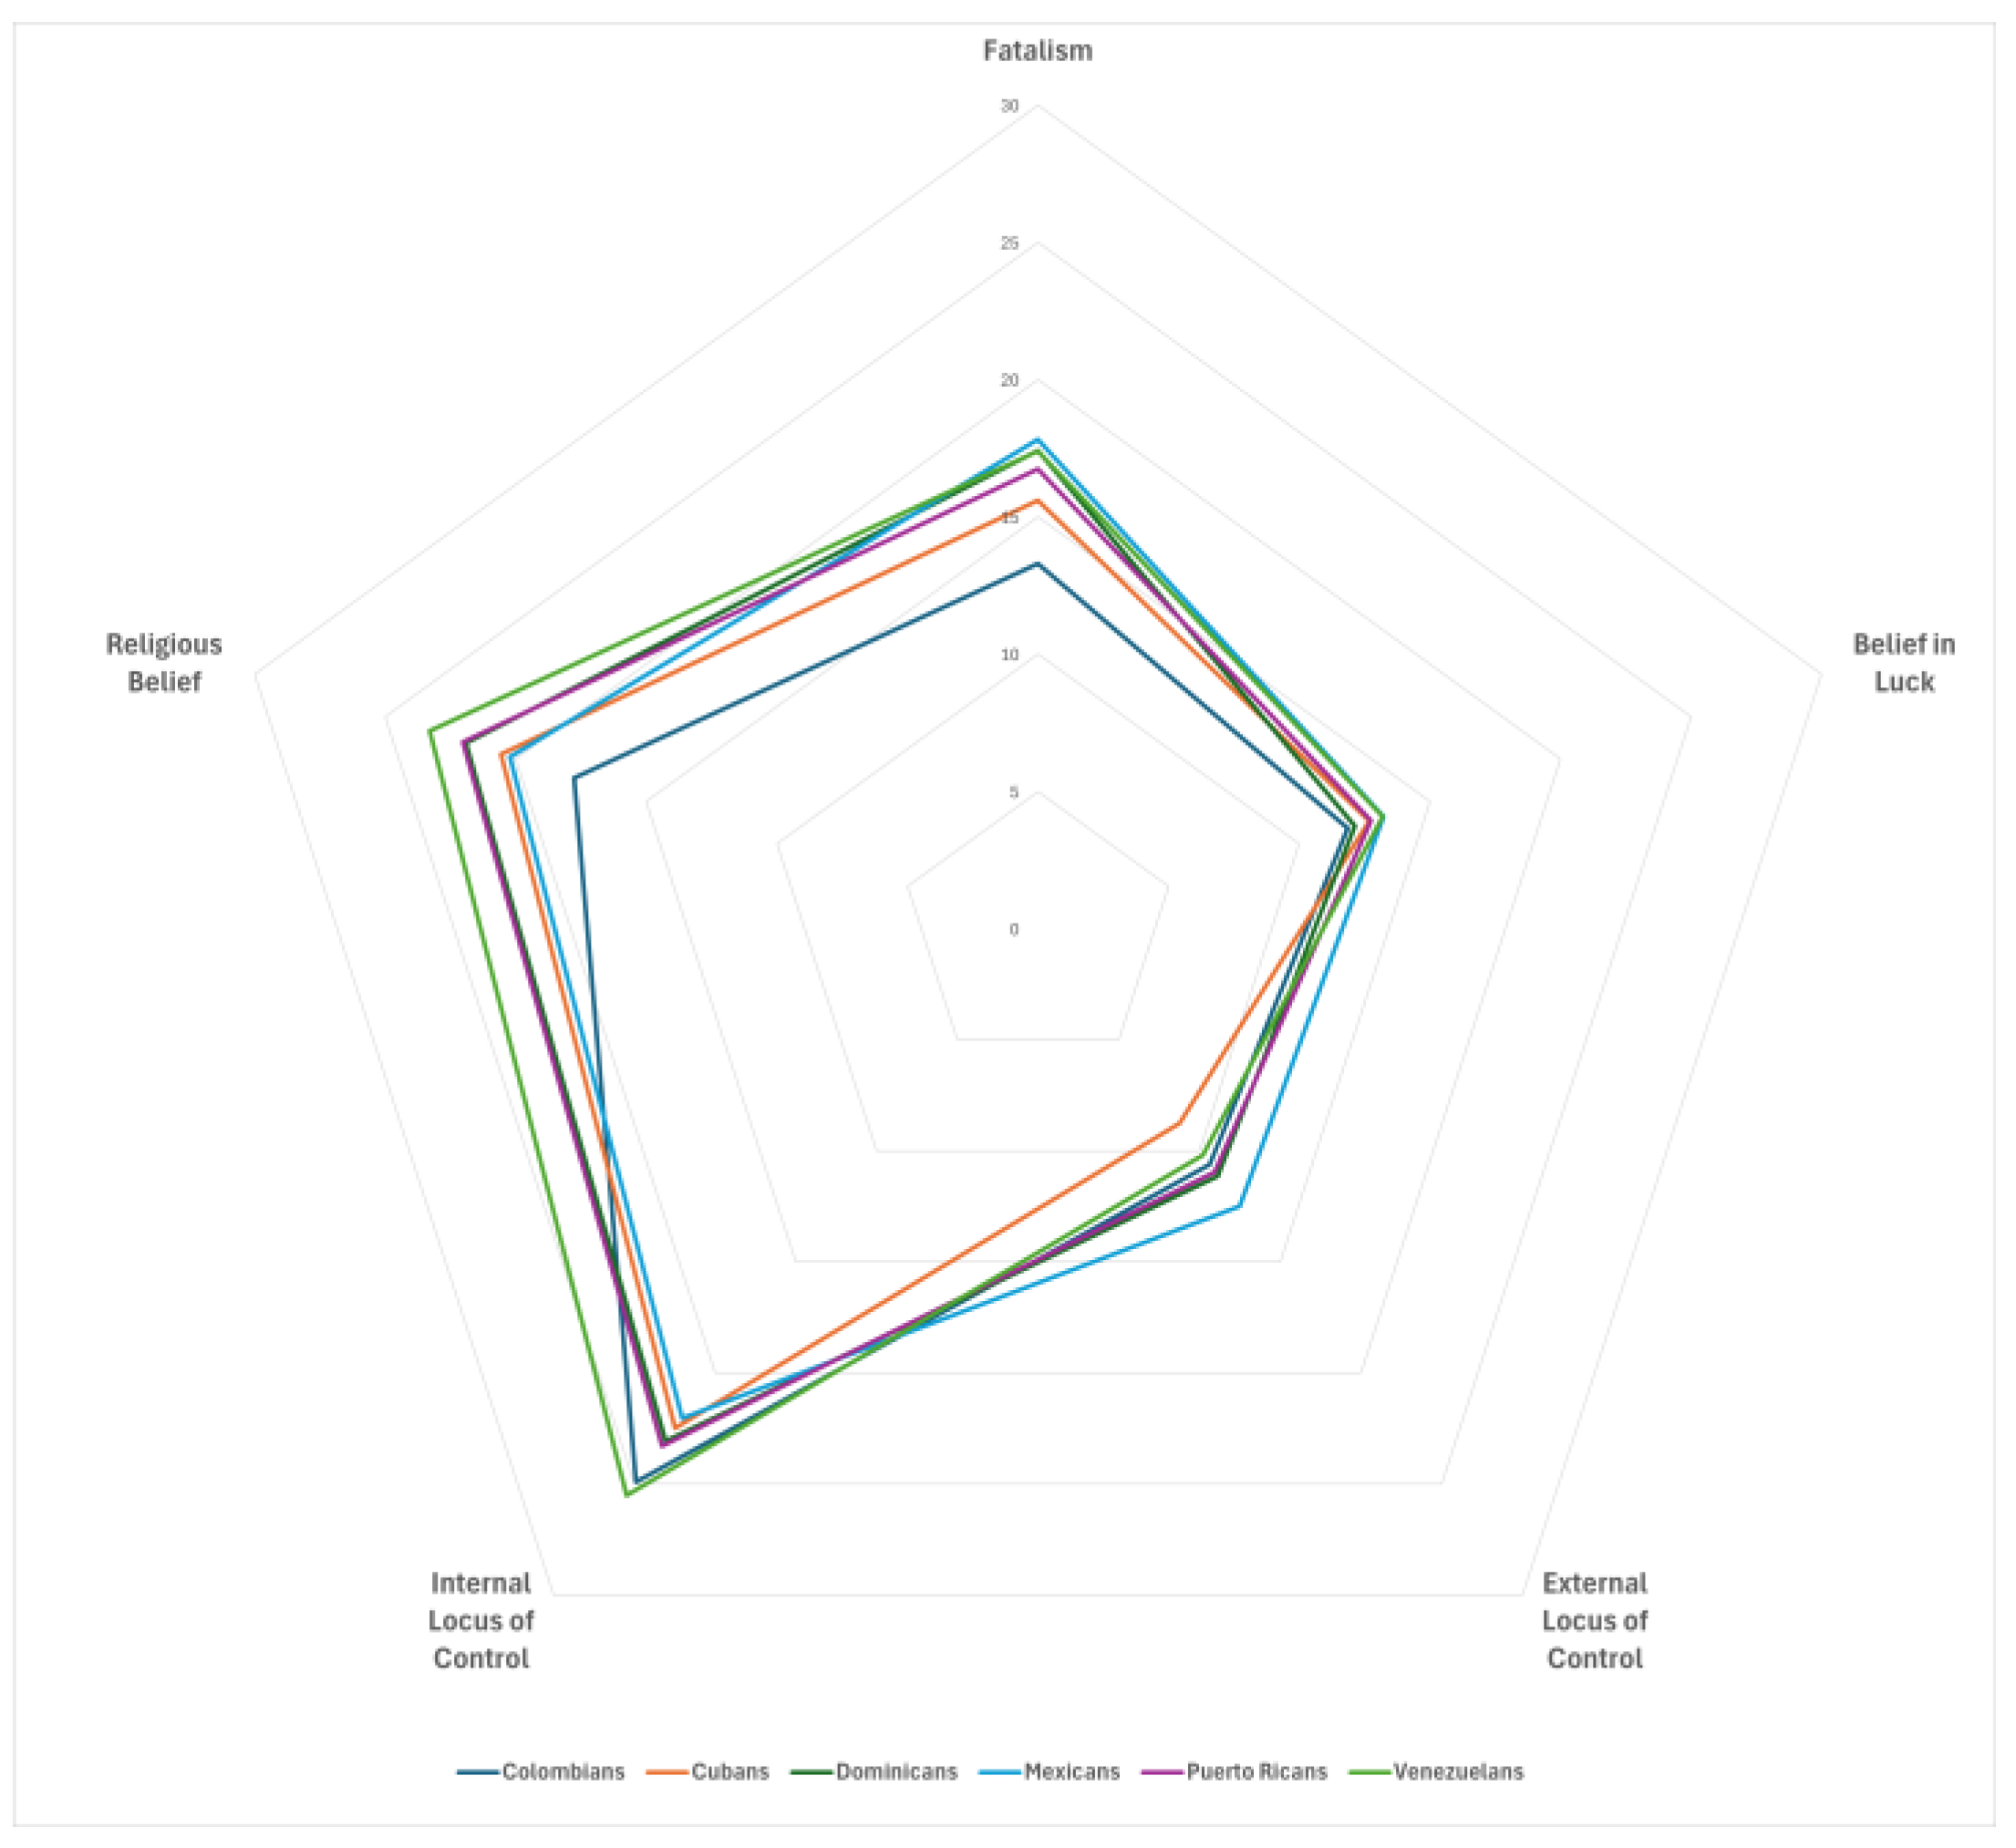

Table 1.
Sociodemographic Characteristics of Study Participants According to Hispanic Origin (N= 390).
Table 1.
Sociodemographic Characteristics of Study Participants According to Hispanic Origin (N= 390).
| Total | Colombian | Cuban | Dominican | Mexican | Puerto Rican | Venezuelan | Other Hispanic | ||||||||||
| No. of participants | 390 | 100.0 | 34 | 8.7 | 25 | 6.4 | 29 | 7.4 | 22 | 5.6 | 210 | 53.8 | 24 | 6.2 | 46 | 11.8 | |
| Mean (SD) | P-value | ||||||||||||||||
| Age at diagnosis | 55.0 | (11.9) | 56.4 | (9.8) | 57.1 | (12.0) | 55.7 | (13.3) | 50.0 | (12.2) | 55.7 | (11.9) | 53.5 | (12.3) | 52.3 | (11.1) | 0.177 |
| Current age | 59.5 | (11.8) | 60.4 | (9.6) | 61.6 | (12.3) | 60.0 | (13.0) | 55.0 | (11.7) | 60.2 | (11.8) | 57.9 | (12.2) | 57.6 | (11.6) | 0.375 |
| Years since diagnosis | 4.8 | (2.0) | 4.8 | (2.1) | 4.6 | (1.9) | 4.4 | (1.9) | 5.1 | (2.1) | 4.6 | (1.9) | 4.6 | (1.8) | 5.6 | (2.9) | 0.089 |
| Years lived in US | 32.9 | (19.4) | 33.6 | (18.2) | 45.4 | (17.9) | 40.9 | (16.7) | 37.7 | (16.5) | 31.3 | (19.9) | 13.5 | (11.1) | 35.6 | (16.1) | <0.001 |
| Body mass index | 28.7 | (5.7) | 26.7 | (4.8) | 29.3 | (5.6) | 28.1 | (5.4) | 29.5 | (6.5) | 29.2 | (5.9) | 27.8 | (6.2) | 27.9 | (4.4) | 0.194 |
| N, % | P-value | ||||||||||||||||
| Race | 0.029 | ||||||||||||||||
| White | 183 | 46.9 | 15 | 44.1 | 5 | 20.0 | 20 | 69.0 | 12 | 54.5 | 98 | 46.7 | 9 | 37.5 | 24 | 52.2 | |
| Nonwhite | 207 | 53.1 | 19 | 55.9 | 20 | 80.0 | 9 | 31.0 | 10 | 45.5 | 112 | 53.3 | 15 | 62.5 | 22 | 47.8 | |
| Current smoking | 0.729 | ||||||||||||||||
| No | 372 | 95.4 | 32 | 94.1 | 23 | 92.0 | 29 | 100.0 | 22 | 100.0 | 200 | 95.2 | 23 | 95.8 | 43 | 93.5 | |
| Yes | 15 | 3.8 | 2 | 5.9 | 2 | 8.0 | . | . | . | . | 8 | 3.8 | 1 | 4.2 | 2 | 4.3 | |
| Marital status | 0.074 | ||||||||||||||||
| Married | 234 | 60.0 | 20 | 58.8 | 20 | 80.0 | 14 | 48.3 | 15 | 68.2 | 117 | 55.7 | 16 | 66.7 | 32 | 69.6 | |
| Divorced/separated/widowed | 151 | 38.7 | 14 | 41.2 | 4 | 16.0 | 15 | 51.7 | 6 | 27.3 | 90 | 42.9 | 8 | 33.3 | 14 | 30.4 | |
| Household income | 0.090 | ||||||||||||||||
| < $20,000 | 67 | 17.2 | 10 | 29.4 | 3 | 12.0 | 6 | 20.7 | 2 | 9.1 | 37 | 17.6 | 3 | 12.5 | 6 | 13.0 | |
| $20,000 - < $75,000 | 176 | 45.1 | 14 | 41.2 | 5 | 20.0 | 11 | 37.9 | 13 | 59.1 | 100 | 47.6 | 13 | 54.2 | 20 | 43.5 | |
| ≥ $75,000 | 92 | 23.6 | 7 | 20.6 | 11 | 44.0 | 6 | 20.7 | 3 | 13.6 | 48 | 22.9 | 3 | 12.5 | 14 | 30.4 | |
| Prefer not to answer | 55 | 14.1 | 3 | 8.8 | 6 | 24.0 | 6 | 20.7 | 4 | 18.2 | 25 | 11.9 | 5 | 20.8 | 6 | 13.0 | |
| Education level | 0.025 | ||||||||||||||||
| ≤ High school | 122 | 31.3 | 13 | 38.2 | 9 | 36.0 | 11 | 37.9 | 13 | 59.1 | 60 | 28.6 | 4 | 16.7 | 12 | 26.1 | |
| Some college+ | 267 | 68.5 | 21 | 61.8 | 16 | 64.0 | 18 | 62.1 | 8 | 36.4 | 150 | 71.4 | 20 | 83.3 | 34 | 73.9 | |
| Multimorbidity | 0.309 | ||||||||||||||||
| No | 157 | 40.3 | 16 | 47.1 | 10 | 40.0 | 11 | 37.9 | 12 | 54.5 | 75 | 35.7 | 12 | 50.0 | 21 | 45.7 | |
| Yes | 218 | 55.9 | 18 | 52.9 | 14 | 56.0 | 17 | 58.6 | 9 | 40.9 | 129 | 61.4 | 11 | 45.8 | 20 | 43.5 | |
| Language used at home | <0.001 | ||||||||||||||||
| More Spanish | 203 | 52.1 | 22 | 64.7 | 9 | 36.0 | 13 | 44.8 | 10 | 45.5 | 112 | 53.3 | 22 | 91.7 | 15 | 32.6 | |
| Both equally | 86 | 22.1 | 5 | 14.7 | 4 | 16.0 | 7 | 24.1 | 1 | 4.5 | 57 | 27.1 | 1 | 4.2 | 11 | 23.9 | |
| More English | 99 | 25.4 | 7 | 20.6 | 12 | 48.0 | 9 | 31.0 | 10 | 45.5 | 41 | 19.5 | 1 | 4.2 | 19 | 41.3 | |
| Birthplace | 0.167 | ||||||||||||||||
| US | 308 | 79.0 | 31 | 91.2 | 18 | 72.0 | 23 | 79.3 | 18 | 81.8 | 159 | 75.7 | 23 | 95.8 | 36 | 78.3 | |
| Non-US | 81 | 20.8 | 3 | 8.8 | 7 | 28.0 | 6 | 20.7 | 4 | 18.2 | 50 | 23.8 | 1 | 4.2 | 10 | 21.7 | |
| Stage | 0.441 | ||||||||||||||||
| In situ | 65 | 16.7 | 7 | 20.6 | 3 | 12.0 | 7 | 24.1 | 4 | 18.2 | 35 | 16.7 | 1 | 4.2 | 8 | 17.4 | |
| Localized | 158 | 40.5 | 12 | 35.3 | 12 | 48.0 | 11 | 37.9 | 7 | 31.8 | 87 | 41.4 | 17 | 70.8 | 12 | 26.1 | |
| Regional/Distant | 66 | 16.9 | 4 | 11.8 | 4 | 16.0 | 5 | 17.2 | 3 | 13.6 | 41 | 19.5 | 2 | 8.3 | 7 | 15.2 | |
| Surgery | 0.467 | ||||||||||||||||
| No | 15 | 3.8 | 3 | 8.8 | 1 | 4.0 | 1 | 3.4 | . | . | 7 | 3.3 | 1 | 4.2 | 2 | 4.3 | |
| Breast-conserving surgery | 199 | 51.0 | 20 | 58.8 | 18 | 72.0 | 16 | 55.2 | 12 | 54.5 | 102 | 48.6 | 10 | 41.7 | 21 | 45.7 | |
| Mastectomy | 176 | 45.1 | 11 | 32.4 | 6 | 24.0 | 12 | 41.4 | 10 | 45.5 | 101 | 48.1 | 13 | 54.2 | 23 | 50.0 | |
| Radiation therapy | 0.160 | ||||||||||||||||
| No | 209 | 53.6 | 16 | 47.1 | 8 | 32.0 | 15 | 51.7 | 11 | 50.0 | 115 | 54.8 | 13 | 54.2 | 31 | 67.4 | |
| Yes | 170 | 43.6 | 18 | 52.9 | 15 | 60.0 | 14 | 48.3 | 10 | 45.5 | 89 | 42.4 | 11 | 45.8 | 13 | 28.3 | |
| Chemotherapy | 0.008 | ||||||||||||||||
| No | 217 | 55.6 | 21 | 61.8 | 18 | 72.0 | 15 | 51.7 | 9 | 40.9 | 117 | 55.7 | 6 | 25.0 | 31 | 67.4 | |
| Yes | 172 | 44.1 | 12 | 35.3 | 7 | 28.0 | 14 | 48.3 | 13 | 59.1 | 93 | 44.3 | 18 | 75.0 | 15 | 32.6 | |
| ER status | 0.347 | ||||||||||||||||
| Negative | 54 | 13.8 | 5 | 14.7 | 3 | 12.0 | 4 | 13.8 | 6 | 27.3 | 24 | 11.4 | 6 | 25.0 | 6 | 13.0 | |
| Positive | 319 | 81.8 | 27 | 79.4 | 22 | 88.0 | 22 | 75.9 | 15 | 68.2 | 176 | 83.8 | 18 | 75.0 | 39 | 84.8 | |
| Fear of recurrence | 0.470 | ||||||||||||||||
| Low | 132 | 33.8 | 13 | 38.2 | 12 | 48.0 | 8 | 27.6 | 10 | 45.5 | 63 | 30.0 | 10 | 41.7 | 16 | 34.8 | |
| Moderate | 201 | 51.5 | 19 | 55.9 | 11 | 44.0 | 15 | 51.7 | 11 | 50.0 | 109 | 51.9 | 13 | 54.2 | 23 | 50.0 | |
| High | 50 | 12.8 | 2 | 5.9 | 2 | 8.0 | 6 | 20.7 | 1 | 4.5 | 33 | 15.7 | 1 | 4.2 | 5 | 10.9 | |
Percentages may add to less than 100% due to rounding and missing data. Other includes participants from countries in Central or South America (Argentina, Brazil, Peru, Honduras, and Panama) and Europe (Spain and Portugal).
Table 2.
Least Squares Means and 95% Confidence Intervals of Fatalism Score Across Sociodemographic and Clinical Characteristics.
Table 2.
Least Squares Means and 95% Confidence Intervals of Fatalism Score Across Sociodemographic and Clinical Characteristics.
| Variable | Category | N | Estimated Mean (95% CI) | P-value | |
|---|---|---|---|---|---|
| Total | 16.4 | (15.8–17.0) | |||
| Hispanic origin | Colombian | 34 | 13.3 | (11.2–15.4) | 0.060 |
| Cuban | 25 | 15.6 | (13.1–18.1) | ||
| Dominican | 29 | 17.4 | (15.1–19.7) | ||
| Mexican | 22 | 17.8 | (15.2–20.5) | ||
| Puerto Rican | 210 | 16.7 | (15.9–17.6) | ||
| Venezuelan | 24 | 17.4 | (14.9–132.8) | ||
| Other Hispanic | 46 | 15.8 | (14.1–17.7) | ||
| Current age (years) | 20 - < 40 | 15 | 18.7 | (15.5–21.8) | 0.377 |
| 40 - < 55 | 131 | 16.6 | (15.5–17.7) | ||
| 55 - 70 | 159 | 15.9 | (14.9–16.9) | ||
| ≥ 70 | 85 | 16.7 | (15.3– 18.0) | ||
| Race | White | 207 | 15.9 | (15.1–16.8) | 0.111 |
| Nonwhite | 183 | 17.0 | (16.0–17.9) | ||
| Body mass index (kg/m2) | < 25 | 109 | 16.2 | (15.1–17.4) | 0.709 |
| 25 - < 30 | 141 | 16.3 | (15.2–17.3) | ||
| ≥ 30 | 135 | 16.8 | (15.7–17.9) | ||
| Current smoking | No | 372 | 16.3 | (15.7–17.0) | 0.304 |
| Yes | 15 | 18.1 | (14.8–21.3) | ||
| Marital status | Married | 234 | 16.6 | (15.7–17.4) | 0.770 |
| Unmarried | 151 | 16.4 | (15.3–17.4) | ||
| Household income | < $20,000 | 67 | 18.5 | (17.0–20.0) | 0.004 |
| $20,000 - < $75,000 | 176 | 16.1 | (15.2–17.0) | ||
| ≥ $75,000 | 92 | 15.1 | (13.8–16.3) | ||
| Prefer not to answer | 55 | 17.1 | (15.5–18.8) | ||
| Education level | ≤ High school | 122 | 18.2 | (17.1–19.3) | < 0.001 |
| Some college or more | 267 | 15.6 | (14.8–16.4) | ||
| Language use at home | More Spanish | 203 | 17.1 | (16.2–17.9) | 0.007 |
| Both equally | 86 | 17.0 | (15.6–18.3) | ||
| More English | 99 | 14.7 | (13.5–16.0) | ||
| Birthplace | United States | 81 | 15.8 | (14.4–17.2) | 0.314 |
| Outside United States | 308 | 16.6 | (15.9–17.3) | ||
| Multimorbidity | No | 157 | 16.7 | (15.7–17.7) | 0.513 |
| Yes | 218 | 16.2 | (15.4–17.1) | ||
| Cancer stage | In Situ | 65 | 16.2 | (14.6–17.7) | 0.574 |
| Localized | 158 | 16.1 | (15.1–17.1) | ||
| Regional/Distant | 66 | 17.0 | (15.5–18.6) | ||
| Surgery | No | 15 | 13.8 | (10.6–17.0) | 0.259 |
| Breast-conserving surgery | 199 | 16.6 | (15.7– 17.5) | ||
| Mastectomy | 176 | 16.5 | (15.5–17.4) | ||
| Radiotherapy | No | 209 | 16.4 | (15.6–17.3) | 0.895 |
| Yes | 170 | 16.4 | (15.4–17.3) | ||
| Chemotherapy | No | 217 | 16.3 | (15.4–17.1) | 0.527 |
| Yes | 172 | 16.7 | (15.7–17.6) | ||
| Estrogen receptor | Negative | 54 | 16.3 | (14.6–18.0) | 0.881 |
| Positive | 319 | 16.4 | (15.7–17.1) | ||
| Years since diagnosis (years) | < 2 | 42 | 14.1 | (12.2–16.1) | 0.043 |
| 2 - < 5 | 216 | 16.8 | (16.0–17.7) | ||
| 5 - < 10 | 132 | 16.5 | (15.4–17.6) | ||
| Years lived in US | < 10 | 64 | 16.1 | (14.5–17.6) | 0.718 |
| 10 - < 30 | 119 | 16.8 | (15.6–17.9) | ||
| ≥ 30 | 206 | 16.3 | (15.4–17.2) | ||
| Fear of recurrence | Low | 132 | 15.6 | (14.5–16.7) | 0.039 |
| Moderate | 201 | 16.6 | (15.7–17.4) | ||
| High | 50 | 18.2 | (16.5–20.0) | ||
Table 3.
Correlation Matrix among the Multidimensional Fatalism Measures among Hispanic Breast Cancer Survivors (N= 390).
Table 3.
Correlation Matrix among the Multidimensional Fatalism Measures among Hispanic Breast Cancer Survivors (N= 390).
| Variable | Fatalism | Religious belief | External locus of control | Internal locus of control | Belief in luck |
|---|---|---|---|---|---|
| Mean (SD) | 16.4 (6.3) | 21.3 (7.5) | 10.9 (5.3) | 23.4 (5.0) | 12.6 (4.7) |
| Correlation Matrix: Correlation Coefficient (P-value) | |||||
| Religious belief | 0.394 (P< 0.001) |
||||
| External locus of control | 0.400 (P< 0.001) |
0.125 (P= 0.014) |
|||
| Internal locus of control | 0.150 (P= 0.003) |
-0.003 (P= 0.949) |
-0.045 (P= 0.677) |
||
| Belief in luck | 0.273 (P< 0.001) |
0.156 (P= 0.002) |
0.384 (P< 0.001) |
0.060 (P= 0.234) |
|
Table 4.
Results from a multivariable linear regression model, investigating factors associated with Fatalism score among Hispanic breast cancer survivors (N= 379).
Table 4.
Results from a multivariable linear regression model, investigating factors associated with Fatalism score among Hispanic breast cancer survivors (N= 379).
| Characteristics | Parameter | β | SE | P-value |
|---|---|---|---|---|
| Intercept | 19.3 | 2.4 | <.0001 | |
| Hispanic Origin (Ref: Puerto Rican) | Colombian | -4.0 | 1.2 | 0.001 |
| Cuban | -0.9 | 1.4 | 0.527 | |
| Dominican | -0.1 | 1.2 | 0.945 | |
| Mexican | 1.3 | 1.5 | 0.395 | |
| Venezuelan | 1.3 | 1.4 | 0.357 | |
| Other Hispanic | -0.7 | 1.1 | 0.522 | |
| Current age (Ref: 20 - < 40) | 40 - < 55 | -2.0 | 1.7 | 0.252 |
| 55 - < 70 | -2.9 | 1.7 | 0.099 | |
| 70 + | -3.3 | 1.8 | 0.075 | |
| Race (ref: white) | Non-white | 0.6 | 0.7 | 0.327 |
| Household income (Ref: < $20,000) | $20,000 - < $75,000 | -2.3 | 0.9 | 0.011 |
| ≥ $75,000 | -2.4 | 1.1 | 0.033 | |
| Prefer not to answer | -1.3 | 1.1 | 0.259 | |
| Education (Ref: ≤ High school) | Some college + | -1.9 | 0.8 | 0.012 |
| Language use at home (Ref: More Spanish) | Both equally | -0.2 | 0.9 | 0.815 |
| More English | -2.0 | 1.0 | 0.042 | |
| Years lived in US (ref: < 10) | 10 - < 30 | 0.9 | 1.0 | 0.390 |
| 30+ | 1.5 | 1.1 | 0.147 | |
| Years since diagnosis (Ref: < 2) | 2 - < 5 | 1.9 | 1.1 | 0.086 |
| ≥ 5 | 1.9 | 1.1 | 0.099 | |
| Fear of recurrence (Ref: Low) | Moderate | 0.8 | 0.7 | 0.276 |
| High | 1.7 | 1.1 | 0.126 |
Disclaimer/Publisher’s Note: The statements, opinions and data contained in all publications are solely those of the individual author(s) and contributor(s) and not of MDPI and/or the editor(s). MDPI and/or the editor(s) disclaim responsibility for any injury to people or property resulting from any ideas, methods, instructions or products referred to in the content. |
© 2025 by the authors. Licensee MDPI, Basel, Switzerland. This article is an open access article distributed under the terms and conditions of the Creative Commons Attribution (CC BY) license (http://creativecommons.org/licenses/by/4.0/).
Copyright: This open access article is published under a Creative Commons CC BY 4.0 license, which permit the free download, distribution, and reuse, provided that the author and preprint are cited in any reuse.


