
Submitted:
01 July 2025
Posted:
03 July 2025
You are already at the latest version
Abstract
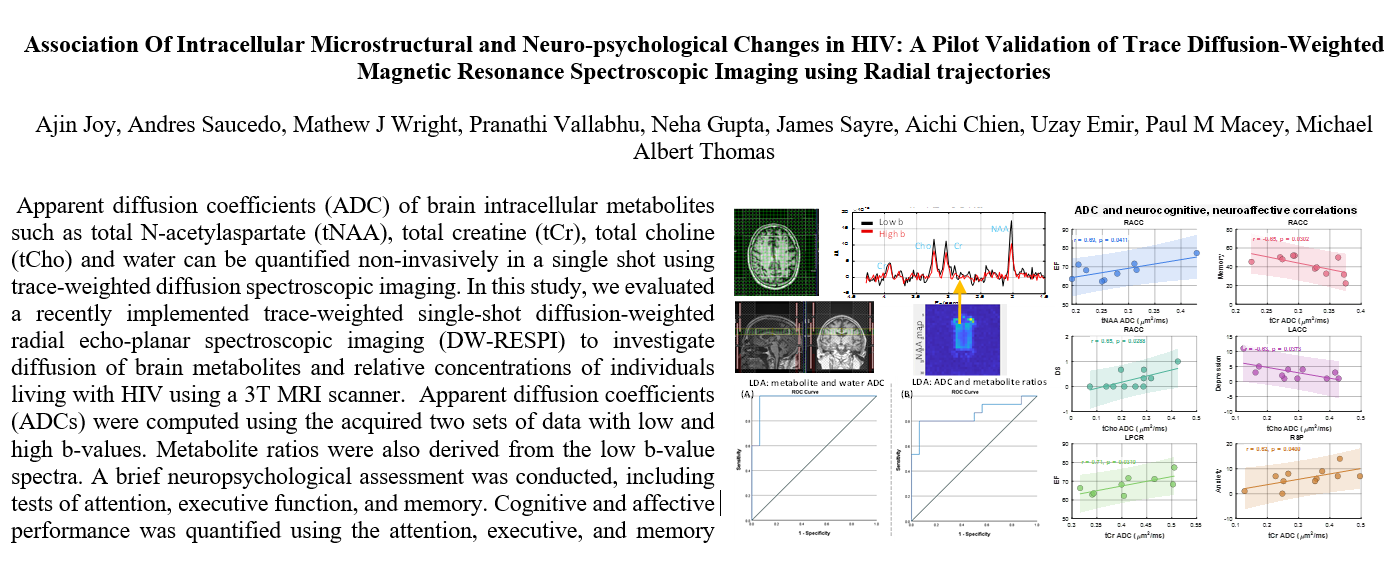
Despite effective antiretroviral therapy, HIV-associated neurocognitive disorders (HAND) remain prevalent, highlighting the need for sensitive biomarkers of early brain alterations. Trace-weighted diffusion spectroscopic imaging offers a non-invasive means to assess microstructural changes in brain metabolites in a single-shot by measuring apparent diffusion coefficients (ADC) of total N-acetylaspartate (tNAA), total creatine (tCr), total choline (tCho) and water. In this study, we used trace-weighted single-shot diffusion-weighted radial echo-planar spectroscopic imaging (DW-RESPI) to investigate metabolite diffusion and relative concentrations in the brains of individuals living with HIV. Using a 3T MRI scanner, two sets of data with low and high b-values were collected and apparent diffusion coefficients (ADCs) were computed. Metabolite ratios were also derived from the low b-value spectra, and a brief neuropsychological assessment was conducted, including tests of attention, executive function, and memory. Cognitive and affective performance was quantified using the attention, executive, and memory domain deficit scores as well as depression and anxiety scores, enabling a comprehensive evaluation of brain function. ADC values for tNAA, tCr, tCho, and water were significantly elevated in multiple gray and white matter regions in HIV compared to healthy subjects, with the most pronounced differences observed in the superior precuneus, anterior cingulate cortex, and corona radiata. Notably, regional ADC values and metabolite ratios showed significant correlations with neuropsychological domain scores, indicating the potential of metabolite and water diffusion metrics as biomarkers for HIV-associated microstructural brain alterations and cognitive impairment.
Keywords:
magnetic resonance imaging
; HIV
; diffusion weighted imaging
; choline
; creatine
; N-acetylaspartate
; anxiety
; depression
; attention
; executive function
; memory
1. Introduction
Quantification of brain structure and function through MRI is an important tool for studying human immunodeficiency virus (HIV) infection [1]. HIV-associated neurocognitive disorders (HAND) range from mild cognitive impairments to frank dementia. Despite the availability of antiretroviral therapies (ART), these disorders continue to affect individuals with HIV [1,2,3,4,5].
Traditional imaging modalities, such as structural and functional MRI techniques, provide some information about brain anatomy and activity, although they are limited in their ability to probe the biochemical and microstructural alterations that may accompany HIV infection [6]. Diffusion-weighted imaging (DWI) in particular, can be a powerful technique for studying the microstructure of the brain. DWI captures the movement of water molecules within tissues, which can provide insights into cellular integrity and tissue organization [6,7,8,9,10,11].
Recent advances in diffusion-weighted radial echo-planar spectroscopic imaging (DW-REPSI) combine the strengths of DWI and spectroscopic techniques integrating 2 spatial with 1 spectral dimensions, offering enhanced sensitivity to changes in tissue metabolism [12,13,14]. The approach allows assessment of tissue diffusion properties across different regions of the brain along with the simultaneous characterization of biochemical profiles, providing a more comprehensive view of the brain's physiological state.
In the context of HIV, the ability to distinguish pathological from healthy brain tissues using single trace DW-REPSI could offer new insights into the mechanisms underlying HIV-associated neurocognitive impairment. HIV infection can lead to alterations in white matter (WM) integrity, cortical thinning, and regional metabolic changes [15,16,17,18,19,20,21]. By exploiting diffusion characteristics of intracellular metabolites,, this pilot study seeks to investigate whether there are significant differences in the metabolic signatures of the brain (total N-acetylaspartate (tNAA), total creatine (tCr), and total choline (tCho)) in people living with HIV(PLWH) compared to healthy controls (HC).
Specifically, an advanced spectroscopic imaging technique called trace weighted single-shot diffusion spectroscopic imaging [14,22,23] is used in this study that helps avoid unwanted effects from eddy currents and additional diffusion-weighting from b-value cross-terms between imaging and diffusion gradients. Eddy current artifacts arise from rapid switching of gradient fields and cause frequency shifts and/or baseline distortions in the spectra [24]. Cross-term interactions, particularly those between the diffusion gradients and the imaging gradients used for localization, can cause errors in the measured apparent diffusion coefficients of metabolites [14,22,24]. By isolating the trace of the diffusion tensor, this technique provides a scalar measure of diffusion that is independent of the orientation of tissue structures. This is particularly valuable in tissues with complex or unknown orientations.
This study primarily aims to use trace weighted DW-REPSI to analyze changes in the brain of PLWH that are not detectable by conventional imaging methods. Secondly, it aims to investigate if there are any significant differences in metabolic profiles between the HIV group and HC that correlate with the degree of cognitive dysfunction observed in PLWH, and if DW-REPSI can provide biomarkers for cognitive impairments and help identify individuals at higher risk for cognitive decline.
2. Materials and Methods
2.1. Trace Weighted Single-Shot Diffusion Spectroscopic Imaging
This advanced diffusion-weighted spectroscopic imaging technique is achieved by arranging 12 pairs of bipolar diffusion-sensitizing gradients (DSGs) along three spatial dimensions within a Point RESolved Spectroscopy (PRESS) sequence [14]. The specific arrangement of DSGs as described in [14,22] leads to the cancellation of signals weighted by off-diagonal terms in the diffusion tensor. In addition, the double refocusing scheme in the pulse sequence helps to (a) reverse the phase accumulation due to static field inhomogeneities, (b) reduce eddy current-induced signal variations and (c) eliminate cross-terms contributions between the diffusion-sensitizing gradients and static background gradients, thereby nullifying this contribution to the overall diffusion weighting [14,22,25].
2.2. Subjects
Sixteen HIV-infected participants (mean±SD; 41.6±14.4 years) and fifteen age-matched HIV-uninfected healthy subjects (mean±SD; 48.3±15.0 years) were recruited for this study. Written informed consent was obtained from all participants and the study participants were recruited from Harbor-UCLA Medical Center (Torrance, CA), David Geffen School of Medicine at UCLA (Los Angeles, CA) and clinicaltrials.gov. Study protocol was approved by the Institutional Review Board at the University of California, Los Angeles and the Lundquist Institute at Harbor-UCLA Medical Center. Volunteers with current alcohol or other substance use/abuse, current or past attention deficit disorder, active depression or other psychiatric diagnoses, metabolic disturbances, metallic implants, claustrophobia, pregnancy, and non-HIV-related brain diseases from both groups were excluded. Clinical and other characteristics of HIV-infected participants and HC are included in Table 1. CD4+ T-cell counts and plasma HIV RNA levels at the time of testing were collected.
2.3. Data Acquisition
All brain MRIg data collection was performed on 3.0-Tesla Prisma-Fit MRI scanner (Siemens, Magnetom, Erlangen, Germany), using a 16-channel head ‘receive’ coil. High-resolution 3D T1-weighted images were acquired using a magnetization-prepared-rapid-acquisition gradient-echo (MP-RAGE) sequence (repetition time = 2200 ms; echo time = 2.41 ms; inversion time = 900 ms; flip angle = 9°; matrix size = 320 × 320; field of view = 230 mm × 230 mm; slice thickness = 0.9 mm; pixel bandwidth = 200Hz, number of slices = 192). Following the 3D MP-RAGE, the diffusion weighted single trace DW-REPSI data was acquired using the following parameters. FOV of 320 × 320 × 20 mm3 and matrix size of 32 × 32 × 1, resulting in a voxel volume of 2 mL. A VOI of appox. 75mm × 115mm × 20mm was localized within the FOV. The TR/TE were 2250/144 ms. The radial echo-planar readout gradient sampled 512 complex t2 points with a spectral width of ~1190 Hz. Two b-values were measured: low b-value at 51 s/mm2 (11mT/m) and high b-value at 1601 s/mm2 (64mT/m). A non-water suppressed scan was acquired for eddy current phase correction. While six and fourteen averages were acquired for water-suppressed scans, one and two averages were acquired for non-water-suppressed scans of low b-value and high b-value respectively. The total scan time including both the water and non-water suppressed scans was approximately 45 minutes.
2.4. Data Reconstruction and Post Processing
The DW-REPSI data was reconstructed using nuFFT [26] after gradient delay calibration [27] and self-navigation corrections [28,29,30]. Water reference data was used for eddy-current phase correction [31]. Residual water was removed using Hankel-Lanczos singular value decomposition method [32] and the resultant spectra were quantified using LCModel [33]. The gray matter (GM) and WM fractions were calculated based on the MP-RAGE images and the ADC values were computed as ADCm = −log [ Sm(bhigh)∕Sm(blow) ] (bhigh – blow), where m denotes the metabolite.
2.1. Neuropsychological Testing
Sixteen HIV-infected and 6 HC participants completed a brief battery of neuropsychological tests. Given our data collection occurred at the tail end of the COVID-19 pandemic, the neuropsychological test battery was completed over video teleconferencing. For the present analysis, the neuropsychological tests included the Auditory Consonant Trigrams (ACT; a test of executive ability) [34], Digit Span from the Wechsler Adult Intelligence Scale, third edition (WAIS III Digit Span; a measure of attention) [35], the Hospital Anxiety and Depression Scale (HADS; a measure of mood symptoms), the Lawton and Brody Instrumental Activities of Daily Living Scale (IADLS; a functional outcome measure), National Adult Reading Test (NART ; a measure of premorbid intelligence) [36], the Oral Trail Making Test (OTMT; measure of attention/processing speed & executive ability) [37], and the Rey Auditory Verbal Learning Test (verbal learning & memory). All tests were scored and normed per convention. Domain scores for cognitive domains were calculated based on theoretical grounds (i.e., based on the abilities assessed by each test) as well as significant correlation between said T-scores for each test resulting in an attention domain score comprised of WAIS III Digit Span (OTMT trial A did not correlate with Digit Span), an executive domain score comprised of the average of OTMT trial B and the ACT total score, and the memory score comprised of the average the RAVLT trial 1-5 (learning), trial 6 (short delay recall), and trial 7 (long delay recall). Additionally, beyond cognitive domain T-scores, we also generated deficits scores for each cognitive domain and global deficit score (GDS), representing the average of the domain deficit scores [38].
2.1. Statistical Analysis
Statistical analyses were performed to assess group differences, associations with neuropsychological performance, and classification accuracy in distinguishing HIV-infected individuals from HC.
Group Comparisons: To compare metabolite ratios and apparent diffusion coefficient (ADC) values between the PLWH and HC groups, independent samples student’s t-tests were used. Separate t-tests were conducted for each metabolite ratio and ADC measure in both GM and WM regions. Statistical significance was set at p<0.05.
Correlation Analysis: Pearson correlation coefficients were calculated to assess the relationships between metabolite ratios or ADC values and neuropsychological test scores across all subjects. This analysis was performed separately for each metabolite ratio and ADC measure to identify potential associations with cognitive performance.
Discriminant Analysis: To evaluate the ability of imaging biomarkers to classify PLWH and HC subjects, linear discriminant analysis (LDA) was performed. Two classification models were constructed: The first model included metabolite ratios and water ADC values as predictors. The second model included both metabolite ratios and metabolite ADCs.Fisher’s stepwise LDA was the multivariate procedure used to test significance concerning all combinations of metabolites to find the best linear combination predictive function. A receiver operating characteristic (ROC) analysis was used to assess performance of the function using area under the curve (AUC) as the metric. IBM SPSS Statistics for Windows, Version 24.0. Armonk, NY: IBM Corp. was the software used to perform these analyses.
3. Results
3.1. ADCs at Selected Voxels in GM and WM Regions
ADC values were computed from eight regions for three metabolites (tNAA, tCr, and tCho) and water, and compared between PLWH and HC groups. The regions consisted of 1) right anterior cingulate cortex (RACC), 2) left anterior cingulate cortex (LACC), 3) right superior precuneus (RSP), 4) left superior precuneus (LSP), 5) right anterior corona radiata (RACR), 6) right posterior corona radiata (RPCR), 7) left anterior corona radiata (LACR), and 8) left posterior corona radiata (LPCR). Figure 1 shows representative localizer images (sagittal, axial and coronal), NAA metabolite map and an extracted spectrum (2cm3) from a 63-year-old HIV-infected male participant (CD4 = 420 cells/uL, viral count<20 copies/mL). Muti-voxel plot from the VOI (white box in the axial localizer image) is shown in Figure 2. 8 different regions used for the analysis are marked in green boxes. Figure 3 shows another example of axial localizer image and multivoxel plot from a 38-year-old HC. LC-Model fit of an extracted spectrum is shown in the bottom right panel.
3.1.1. Metabolite ADC Comparison of PLWH vs HC Groups
In the comparison between PLWH and HC cohort, statistically significant changes in ADC values were observed for tNAA, tCr, tCho and water. In tNAA, these changes were significant in RSP (p = 0.0034), LSP (p = 0.0453) and LACR (p = 0.0375). Similarly, tCr showed significant elevation in the RACC region (p = 0.0242). Water ADC values also showed significant differences at RACC (p = 0.0000), LACC (p = 0.0167) and RACR (p = 0.0219). In all cases the ADC values were observed to be higher in PLWH compared to HC. Figure 4 shows the ADC values of metabolites and water at different brain regions between HC and PLWH.
3.1.2. Estimates of ADC in Pure WM and GM
The ADC values from induvial voxels were extrapolated to find pure ADC values in gray and white matter as shown elsewhere [39,40,41]. tNAA, tCr and tCho showed increased ADC values in WM compared to GM while water ADCs were higher in the GM compared to WM. This was the same in both PLWH and HC. While the difference in water ADC was not statistically significant, significant differences were observed for tNAA and tCr in both PLWH and HC cohort. ADC values of tCho were significantly different in PLWH but not in HC. However, there were no significant differences between PLWH and HC for metabolites as well as water. A bar chart comparing the extrapolated ADC values of GM and WM in HC and PLWH is shown in Figure 5.
3.1.3. Correlation with Neuropsychological Scores and Emotional Functions
Here we examined the correlation between regional ADC values and neuropsychological domain T-scores (attention, executive Function (EF), memory, Anxiety, Depression, GDS reflecting overall neurocognitive dysfunction scores reflecting symptoms of anxiety and depression. This analysis showed that ADC of tNAA at RACC has a statistically significant moderate correlation with the EF scores (r=0.69, p=0.04). tCr and tCho also showed significant correlations at RACC. While tCr showed moderate negative correlation with Memory scores (r=--0.65, p=0.03), tCho showed moderate correlation with GDS (r=0.65, p=0.03) and moderate negative correlation with depression (r=-0.63, p=0.04). In addition, tCr showed moderate correlation with EF at LPCR (r=0.71, p=0.03) and with anxiety at RSP (r=0.62, p=0.04). Scatter plots of metabolite ADCs that showed significant correlations with neuropsychological domain scores are shown in Figure 6.
3.2. Metabolite Ratios at Selected Voxels in GM and WM Regions
tCr has been reported to vary with the HIV infection [42]. Therefore, metabolite ratios with respect to the sum of tNAA, tCr and tCho were computed from the low b-value data [43]. Multiple regions with statistically significant difference in the metabolite ratios were found, in both gray and white matter regions.
3.2.1. Metabolite Ratio Comparison of PLWH vs HC
Between PLWH and HC cohorts, statistically significant changes in metabolite ratios were observed for tNAA, tCr and tCho. The tNAA ratio changes were significant in RACC (p = 0.0139), RSP (p = 0.0367), RACR (p = 0.0004) and RPCR (p = 0.0019). Similarly, the tCr ratio showed significant changes in the RSP region (p = 0.0419) and the ratio of tCho at RACC (p = 0.0066), LSP (p = 0.0268) and RACR (p = 0.0140). While the tNAA ratios were reduced in PLWH compared to HC, the tCr and tCho ratios were elevated in PLWH compared to HC. A bar chart comparing the metabolite ratios at different brain regions between HC and PLWH is shown in Figure 7.
3.2.2. Correlation with Neuropsychological and Emotional Function
Similar to the correlation analysis of metabolite ADCs, correlations between metabolite ratios and neuropsychological domain T-scores the GDS, and anxiety and depression scores were computed. Scattered plots of metabolite ratios that showed significant correlations with the domain scores are shown in Figure 8. Regarding general neurocognitive dysfunction, tNAA and tCr ratios significantly correlated with the GDS (at RACC, r=-0.64, p=0.03 and at LSP, r=-0.73, p=0.01), respectively. While tCho ratios correlated with memory (at RSP, r=0.66, p=0.27). With regard to mood, tCho ratios showed correlations with greater symptoms of anxiety scores (at RPCR, r=0.77, p=0.006) as did tNAA ratios (at RACR, r=-0.65, p=0.03).
3.2.3. Linear Discriminant Analysis
LDA for PLWH and HC groups based on the ratios of metabolites and water ADCs yielded a statistically significant discriminant model using tCr ADC (Wilks’s Λ = 0.819, F(1, 28) = 6.175, p = 0.019) and water ADC (Wilks’s Λ = 0.453, F(1, 28) = 33.783, p < 0.001) with an AUC of 0.975 (95% CI: 0.923–1). The corresponding ROC curve is shown in Figure 9(A). The discriminant analysis yielded a sensitivity of 93.8% (95% CI: 67.7%–99.7%) and a specificity of 100% (95% CI: 74.7%–100%), with a positive predictive value of 100% (95% CI: 74.7%–100%) and a negative predictive value of 93.8% (95% CI: 67.7%–99.7%). The overall prevalence in the sample was estimated at 51.6% (95% CI: 33.4%–69.4%).
Using the second model with both metabolite ratios and ADCs at the classification parameters, the LDA for PLWH and HC groups yielded a statistically significant discriminant model using tCr ratio (Wilks’s Λ = 0.864, F(1, 28) = 4.397, p = 0.045) and tCr ADC (Wilks’s Λ = 0.819, F(1, 28) = 6.175, p = 0.019) with an AUC of 0.854 (95% CI: 0.708–1). ROC curve is shown in Figure 9(B). The discriminant analysis showed a sensitivity of 87.5% (95% CI: 60.4%–97.8%) and a specificity of 80.0% (95% CI: 51.4%–94.7%). The positive predictive value was 82.4% (95% CI: 55.8%–95.3%), and the negative predictive value was 85.7% (95% CI: 56.2%–97.5%). The prevalence of the condition in the sample was estimated at 51.6% (95% CI: 33.4%–69.4%).
4. Discussion
This study evaluated regional metabolite and water ADC values, as well as metabolite ratios, in both GM and WM among PLWH compared to HC using diffusion trace-weighted REPSI. The observed increases in ADC values for tNAA, tCr, tCho, and water in HIV-infected individuals, in regions such as the precuneus and anterior cingulate cortex, suggest microstructural alterations associated with HIV infection. These findings are consistent with previous reports of neuroinflammatory changes and axonal injury in PLWH, which may contribute to increased diffusivity in affected brain regions [44,45].
Successful pilot validation of the diffusion trace-weighted REPSI technology in PLWH and healthy subjects demonstrates clearly the following: (1) the trace ADC can be described as a robust, more repeatable, diffusion metric; (2) this sequence measures the trace ADC (a.k.a. mean diffusivity - MD) of the major metabolites in a single TR (instead of in 3 separate measurements); (3) the trace ADC is supposed to be more robust across different measurements where the patient set-up and orientation relative to the scanner may vary, because the trace ADC is invariant to these factors.
Comparisons between GM and WM further revealed a consistent pattern of higher ADC values for metabolites in the white matter, while water ADCs were higher in gray matter which is consistent with previous reports [46,47,48]. These differences are attributed to distinct microstructural properties of GM and WM, as well as the differential impact of diffusion time on the ADCs of different molecules [46]. However, the same GM/WM ADC trends are observed in HC as well. Hence, we cannot attribute these differences solely to HIV infection. The trends are likely due to intrinsic structural and biochemical properties of GM and WM, not HIV-specific pathology.
The significant correlations between regional ADC values and neuropsychological domain scores, such as the moderate positive association between tNAA ADC at RACC and EF, as well as significant correlations for tCr and tCho with various cognitive and affective domains, highlight the potential of ADC metrics as biomarkers for cognitive and emotional impairment in PLWH [38,49]. These findings further support the clinical relevance of metabolite diffusion measures in monitoring disease progression and neurocognitive and neuroaffective status.
Findings in the superior precuneus and corona radiata for tNAA, right anterior cingulate cortex for tCr, and cingulate cortex and corona radiata for water show that HIV infection is associated with region-specific increases in both water and metabolite ADCs. These changes reflect the pathophysiology of HIV in the brain, including glial activation and neuronal injury, and the effect of this pathology on function since the ADC values correlate with neurocognitive impairment in affected individuals [50,51].
Analysis of metabolite ratios revealed that the tNAA ratios were consistently reduced, while tCr and tCho ratios were elevated in PLWH compared to HC, with several regions showing statistically significant differences. These alterations in metabolite ratios align with the known pathophysiology of HIV-associated neurocognitive disorders, where neuronal loss (reflected by decreased NAA) and glial activation or inflammation (reflected by increased Cho and Cr) are reported [43,52,53,54,55].
The discriminant analysis demonstrated robust classification performance using both ADC and metabolite ratio metrics. The model incorporating water and tCr ADCs achieved high sensitivity (93.8%) and specificity (100%), with excellent predictive values and an AUC of 0.975, indicating strong potential for distinguishing PLWH from HC based on these imaging biomarkers. The second model, which included both tNAA ratio and tCr ADC, also showed good classification accuracy, albeit with slightly lower sensitivity and specificity than the first.
The correlations between ADC values and scores from these neuropsychological domains show potential associations between structural brain changes and cognitive and emotional functions (45, 49). For example, the moderate positive correlation of tNAA ADC at RACC with executive function, and significant correlations of tCr and tCho with memory, anxiety, and GDS, suggest that these imaging biomarkers may reflect underlying neuronal and glial processes contributing to cognitive and affective deficits in PLWH. Similarly, the observed pattern of lower tNAA and higher tCr and tCho ratios associated with HIV-infection supports their role as potential biomarkers for neurocognitive status.
Overall, these results underscore the utility of advanced MR spectroscopic imaging and diffusion metrics in detecting HIV-related brain changes and their association with cognitive function. The significant group differences, correlations with neuropsychological performance, and high discriminative power of selected biomarkers highlight their promise for clinical and research applications in HIV-associated neurocognitive disorder assessment and monitoring.
Few limitations need to be mentioned: (1) The study only assessed tNAA, tCr and tCho due to the use of long TE, as a trade off for achieving the single shot trace weighted ADC measurement, which limits the sensitivity to other key metabolites like myo-Inositol, glutamine and glutamate. (2) Neuropsychological data were not available for all HC, limiting the ability to perform comprehensive comparisons between PLWH and HC. Hence, this study primarily examined the correlation between spectroscopic imaging based biomarkers (metabolite ADC and metabolite ratios) and neuropsychological data in PLWH, rather than the comparison of neuropsychological performance between PLWH and HC.
5. Conclusions
This study demonstrates that regional metabolite and water ADC values, as well as metabolite ratios, differ significantly between individuals with PLWH and HC, particularly in brain regions implicated in cognitive functions. Elevated ADC values in PLWH suggest increased diffusivity and underlying microstructural changes, while alterations in metabolite ratios reflect neuronal and glial pathology associated with HIV infection. The correlations between imaging biomarkers and neuropsychological performance, along with high classification accuracy achieved by discriminant analysis models, shows the potential of these metrics for detecting and monitoring HIV-associated neurocognitive changes. These findings support the integration of diffusion and spectroscopic imaging measures into future clinical and research protocols aimed at early identification and management of neurocognitive impairment in PLWH.
Author Contributions
For research articles with several authors, a short paragraph specifying their individual contributions must be provided. Conceptualization, M.A.T and E.D.; methodology, M.A.T and A.J.; software, A.J.; validation, A.S. A.J. and M.A.T.; formal analysis, A.J., A.S., P.V., N.G., M.J.W.,J.S; investigation, M.A.T.; resources, M.A.T., E.D.; data curation, A.J., J.S., M.J.W.; writing—original draft preparation, A.J., M.A.T.; writing—review and editing, A.J., A.S., P.M.M., M.J.W., M.A.T.; visualization, A.J.; supervision, M.A.T.; project administration, M.A.T.; funding acquisition, M.A.T.All authors have read and agreed to the published version of the manuscript.” Please turn to the CRediT taxonomy for the term explanation. Authorship must be limited to those who have contributed substantially to the work reported.
Funding
This work was supported by an NIH R21 grant (5R21MH125349-02)
Institutional Review Board Statement
The study was conducted in accordance with the Declaration of Helsinki, and approved by the Institutional Review Board the University of California, Los Angeles (protocol code: IRB#19-001797 and the initial date of approval: 9 February 2020).
Informed Consent Statement
Informed consent was obtained from all subjects involved in the study.
Data Availability Statement
The datasets generated and/or analyzed during the current study are not publicly available due to ethical and data protection restrictions, but are available from corresponding author on reasonable request and subject to an institutional data sharing agreement.
Acknowledgments
Authors like to acknowledge the scientific support of Ms. Krissy Smith, Mr. Robert A Carmichael, Ms. Victoria C Rueda and Mr. Renato A Escobar.
Conflicts of Interest
The authors declare no conflicts of interest. The funders had no role in the design of the study; in the collection, analyses, or interpretation of data; in the writing of the manuscript; or in the decision to publish the results.
References
- Adhikary K, Banerjee A, Sarkar R, Banerjee R, Chowdhury SR, Ganguly K, et al. HIV-associated neurocognitive disorders (HAND): Optimal diagnosis, antiviral therapy, pharmacological treatment, management, and future scopes. J. Neurol. Sci 2025.
- Cysique LA, Maruff P, Brew BJ. Prevalence and pattern of neuropsychological impairment in human immunodeficiency virus-infected/acquired immunodeficiency syndrome (HIV/AIDS) patients across pre-and post-highly active antiretroviral therapy eras: a combined study of two cohorts. J. Neurovirol. 2004, 10, 350–7. [Google Scholar] [CrossRef] [PubMed]
- Eggers C, Arendt G, Hahn K, Husstedt IW, Maschke M, Neuen-Jacob E, et al. HIV-1-associated neurocognitive disorder: epidemiology, pathogenesis, diagnosis, and treatment. J. Neurol. 2017, 264, 1715–27. [Google Scholar] [CrossRef]
- Mateen FJ, Mills EJ. Aging and HIV-related cognitive loss. JAMA. 2012, 308, 349–50. [Google Scholar] [CrossRef]
- Nightingale S, Dreyer AJ, Saylor D, Gisslén M, Winston A, Joska JA. Moving on from HAND: why we need new criteria for cognitive impairment in persons living with human immunodeficiency virus and a proposed way forward. Clin. Infect. Dis. 2021, 73, 1113–8. [Google Scholar] [CrossRef]
- Yadav SK, Gupta RK, Hashem S, Nisar S, Azeem T, Bhat AA, et al. Brain microstructural changes support cognitive deficits in HIV uninfected children born to HIV infected mothers. Brain, Behavior, & Immunity-Health. 2020, 2, 100039. [Google Scholar]
- Assaf Y, Pasternak O. Diffusion tensor imaging (DTI)-based white matter mapping in brain research: a review. J. Mol. Neurosci. 2008, 34, 51–61. [Google Scholar] [CrossRef] [PubMed]
- Le Bihan D, Johansen-Berg H. Diffusion MRI at 25: exploring brain tissue structure and function. NeuroImage. 2012, 61, 324–41. [Google Scholar] [CrossRef]
- Uddin MN, Singh MV, Faiyaz A, Szczepankiewicz F, Nilsson M, Boodoo ZD, et al. Tensor-valued diffusion MRI detects brain microstructural abnormalities in HIV infected individuals with cognitive impairment. Sci. Rep. 2024, 14, 28839. [Google Scholar]
- Minosse S, Picchi E, Conti A, di Giuliano F, di Ciò F, Sarmati L, et al. Multishell diffusion MRI reveals whole-brain white matter changes in HIV. Hum. Brain Mapp. 2023, 44, 5113–24. [Google Scholar] [CrossRef]
- Mudra Rakshasa-Loots A, Diteko G, Dowell NG, Ronen I, Vera JH. Neuroimmunometabolic alterations and severity of depressive symptoms in people with HIV: An exploratory diffusion-weighted MRS study. Brain and Neuroscience Advances. 2025, 9, 23982128251335792. [Google Scholar] [CrossRef] [PubMed]
- Posse S, Otazo R, Dager SR, Alger J. MR spectroscopic imaging: principles and recent advances. J. Magn. Reson. Imaging. 2013, 37, 1301–25. [Google Scholar] [CrossRef] [PubMed]
- Bogner W, Otazo R, Henning A. Accelerated MR spectroscopic imaging—a review of current and emerging techniques. NMR Biomed. 2021, 34, e4314. [Google Scholar]
- Saucedo A, Thomas MA. Single-shot diffusion trace spectroscopic imaging using radial echo planar trajectories. Magn. Reson. Med. 2024, 92, 926–44. [Google Scholar] [CrossRef] [PubMed]
- Mina Y, Wu T, Hsieh H-C, Hammoud DA, Shah S, Lau C-Y, et al. Association of white matter hyperintensities with HIV status and vascular risk factors. Neurology. 2021, 96, e1823–e34. [Google Scholar]
- Wright PW, Vaida FF, Fernández RJ, Rutlin J, Price RW, Lee E, et al. Cerebral white matter integrity during primary HIV infection. AIDS. 2015, 29, 433–42. [Google Scholar] [CrossRef]
- Ances B, Wright P, Fernandez R, Meyerhoff D, Price R, Robertson K, et al. Effects of Primary and Chronic HIV Infection on White Matter Integrity Using Diffusion Tensor Imaging (P06. 175). Lippincott Williams & Wilkins; 2013.
- Ahmed-Leitao F, Du Plessis S, Konkiewitz EC, Spies G, Seedat S. Altered white matter integrity in the corpus callosum in adults with HIV: A systematic review of diffusion tensor imaging studies. Psychiatry Research: Neuroimaging 2022, 326, 111543. [CrossRef]
- O'Connor EE, Jaillard A, Renard F, Zeffiro TA. Reliability of white matter microstructural changes in HIV infection: meta-analysis and confirmation. Am. J. Neuroradiol. 2017, 38, 1510–9. [Google Scholar] [CrossRef]
- Cilliers K, Muller CJ. Effect of human immunodeficiency virus on the brain: A review. The Anatomical Record. 2021, 304, 1389–99. [Google Scholar] [CrossRef]
- Sarma MK, Pal A, Keller MA, Welikson T, Ventura J, Michalik DE, et al. White matter of perinatally HIV infected older youths shows low frequency fluctuations that may reflect glial cycling. Sci. Rep. 2021, 11, 3086. [Google Scholar]
- De Graaf RA, Braun KP, Nicolay K. Single-shot diffusion trace 1H NMR spectroscopy. Magn. Reson. Med. 2001, 45, 741–8. [Google Scholar] [CrossRef] [PubMed]
- Valette J, Giraudeau C, Marchadour C, Djemai B, Geffroy F, Ghaly MA, et al. A new sequence for single-shot diffusion-weighted NMR spectroscopy by the trace of the diffusion tensor. Magn. Reson. Med. 2012, 68, 1705–12. [Google Scholar] [CrossRef]
- Davies-Jenkins CW, Döring A, Fasano F, Kleban E, Mueller L, Evans CJ, et al. Practical considerations of diffusion-weighted MRS with ultra-strong diffusion gradients. Front. Neurosci. 2023, 17, 1258408. [Google Scholar]
- Reese TG, Heid O, Weisskoff R, Wedeen V. Reduction of eddy-current-induced distortion in diffusion MRI using a twice-refocused spin echo. Magn. Reson. Med. 2003, 49, 177–82. [Google Scholar] [CrossRef] [PubMed]
- Fessler JA, Sutton BP. Nonuniform fast Fourier transforms using min-max interpolation. IEEE Trans. Signal Process. 2003, 51, 560–74. [Google Scholar] [CrossRef]
- Block KT, Uecker M, editors. Simple method for adaptive gradient-delay compensation in radial MRI. Proceedings of the 19th Annual Meeting of ISMRM, Montreal, Canada; 2011.
- Feng L, Axel L, Chandarana H, Block KT, Sodickson DK, Otazo R. XD-GRASP: golden-angle radial MRI with reconstruction of extra motion-state dimensions using compressed sensing. Magn. Reson. Med. 2016, 75, 775–88. [Google Scholar] [CrossRef]
- Stehning C, Börnert P, Nehrke K, Eggers H, Stuber M. Free-breathing whole-heart coronary MRA with 3D radial SSFP and self-navigated image reconstruction. Magn. Reson. Med. 2005, 54, 476–80. [Google Scholar] [CrossRef]
- Welch EB, Rossman PJ, Felmlee JP, Manduca A. Self-navigated motion correction using moments of spatial projections in radial MRI. Magn. Reson. Med. 2004, 52, 337–45. [Google Scholar] [CrossRef]
- Klose, U. In vivo proton spectroscopy in presence of eddy currents. Magn. Reson. Med. 1990, 14, 26–30. [Google Scholar] [CrossRef]
- Cabanes E, Confort-Gouny S, Le Fur Y, Simond G, Cozzone P. Optimization of residual water signal removal by HLSVD on simulated short echo time proton MR spectra of the human brain. J. Magn. Reson. 2001, 150, 116–25. [Google Scholar] [CrossRef]
- Provencher, SW. Estimation of metabolite concentrations from localized in vivo proton NMR spectra. Magn. Reson. Med. 1993, 30, 672–9. [Google Scholar] [CrossRef] [PubMed]
- Shura RD, Rowland JA, Miskey HM. Auditory consonant trigrams: a psychometric update. Arch. Clin. Neuropsychol. 2016, 31, 47–57. [Google Scholar] [CrossRef] [PubMed]
- Wechsler, D. Wechsler adult intelligence scale. Arch. Clin. Neuropsychol. 1955.
- Blair JR, Spreen O. Predicting premorbid IQ: a revision of the National Adult Reading Test. The Clinical Neuropsychologist. 1989, 3, 129–36. [Google Scholar] [CrossRef]
- Axelrod BN, Lamberty GJ. The oral trail making test. The quantified process approach to neuropsychological assessment: Psychology Press, 2012, p. 45-51.
- Blackstone K, Moore D, Franklin D, Clifford D, Collier A, Marra C, et al. Defining neurocognitive impairment in HIV: deficit scores versus clinical ratings. The Clinical Neuropsychologist. 2012, 26, 894–908. [Google Scholar] [CrossRef]
- Ercan AE, Techawiboonwong A, Versluis MJ, Webb AG, Ronen I. Diffusion-weighted chemical shift imaging of human brain metabolites at 7T. Magn. Reson. Med. 2015, 73, 2053–61. [Google Scholar] [CrossRef]
- Hetherington HP, Pan JW, Mason GF, Adams D, Vaughn MJ, Twieg DB, et al. Quantitative 1H spectroscopic imaging of human brain at 4.1 T using image segmentation. Magn. Reson. Med. 1996, 36, 21–9. [Google Scholar] [CrossRef]
- Schuff N, Ezekiel F, Gamst AC, Amend DL, Capizzano AA, Maudsley AA, et al. Region and tissue differences of metabolites in normally aged brain using multislice 1H magnetic resonance spectroscopic imaging. Magn. Reson. Med. 2001, 45, 899–907. [Google Scholar] [CrossRef]
- Chelala L, O'Connor EE, Barker PB, Zeffiro TA. Meta-analysis of brain metabolite differences in HIV infection. NeuroImage: Clinical. 2020, 28, 102436. [Google Scholar] [CrossRef]
- Chong W, Paley M, Wilkinson I, Hall-Craggs M, Sweeney B, Harrison M, et al. Localized cerebral proton MR spectroscopy in HIV infection and AIDS. Am. J. Neuroradiol. 1994, 15, 21–5. [Google Scholar]
- Cloak C, Chang L, Ernst T. Increased frontal white matter diffusion is associated with glial metabolites and psychomotor slowing in HIV. J. Neuroimmunol 2004, 157, 147–152. [CrossRef] [PubMed]
- López-Villegas D, Lenkinski RE, Frank I. Biochemical changes in the frontal lobe of HIV-infected individuals detected by magnetic resonance spectroscopy. Proceedings of the National Academy of Sciences. 1997, 94, 9854–9. [Google Scholar] [CrossRef] [PubMed]
- Kan HE, Techawiboonwong A, Van Osch MJ, Versluis MJ, Deelchand DK, Henry PG, et al. Differences in apparent diffusion coefficients of brain metabolites between grey and white matter in the human brain measured at 7 T. Magn. Reson. Med. 2012, 67, 1203–9. [Google Scholar] [CrossRef] [PubMed]
- Helenius J, Soinne L, Perkiö J, Salonen O, Kangasmäki A, Kaste M, et al. Diffusion-weighted MR imaging in normal human brains in various age groups. Am. J. Neuroradiol. 2002, 23, 194–9. [Google Scholar]
- Sener, RN. Diffusion MRI: apparent diffusion coefficient (ADC) values in the normal brain and a classification of brain disorders based on ADC values. Computerized medical imaging and graphics. 2001, 25, 299–326. [Google Scholar] [CrossRef]
- Law-Ye B, de Truchis P, Peyrassou D, Force G, Carlier R-Y. Elevation of brain ADC (apparent diffusion coefficient) in HIV-associated neurocognitive disorders and evolution after treatment: A pilot study. J. Neurol. Sci. 2022, 442, 120446. [Google Scholar] [CrossRef]
- Ernst T, Chang L, Arnold S. Increased glial metabolites predict increased working memory network activation in HIV brain injury. NeuroImage. 2003, 19, 1686–93. [Google Scholar] [CrossRef]
- Dahmani S, Kaliss N, VanMeter JW, Moore DJ, Ellis RJ, Jiang X. Alterations of brain metabolites in adults with HIV: a systematic meta-analysis of magnetic resonance spectroscopy studies. Neurology. 2021, 97, e1085–e96. [Google Scholar]
- Meyerhoff DJ, MacKay S, Bachman L, Poole N, Dillon W, Weiner M, et al. Reduced brain N-acetylaspartate suggests neuronal loss in cognitively impaired human immunodeficiency virus-seropositive individuals: in vivo 1H magnetic resonance spectroscopic imaging. Neurology 1993, 43, 509. [CrossRef]
- Harezlak J, Buchthal S, Taylor M, Schifitto G, Zhong J, Daar E, et al. Persistence of HIV-associated cognitive impairment, inflammation, and neuronal injury in era of highly active antiretroviral treatment. AIDS. 2011, 25, 625–33. [Google Scholar] [CrossRef]
- McCONNELL JR, Swindells S, Ong CS, Gmeiner WH, CHU W-K, Brown DK, et al. Prospective utility of cerebral proton magnetic resonance spectroscopy in monitoring HIV infection and its associated neurological impairment. AIDS research and human retroviruses. 1994, 10, 977–82. [Google Scholar] [CrossRef]
- Meyerhoff DJ, MacKay S, Poole N, Dillon WP, Weiner MW, Fein G. N-acetylaspartate reductions measured by 1H MRSI in cognitively impaired HIV-seropositive individuals. Magn. Reson. Imaging. 1994, 12, 653–9. [Google Scholar] [CrossRef]
Figure 1.
Localizer images (sagittal, axial and coronal), NAA metabolite map and an extracted spectrum from a 63-year-old male HIV-infected subject (CD4 = 420, viral count<20). Top row shows sagittal, axial and coronal localizer images. Image in the bottom left shows NAA metabolite map, and bottom right shows an extracted spectrum. Low-b (white) and high-b (red) plots are overlaid.
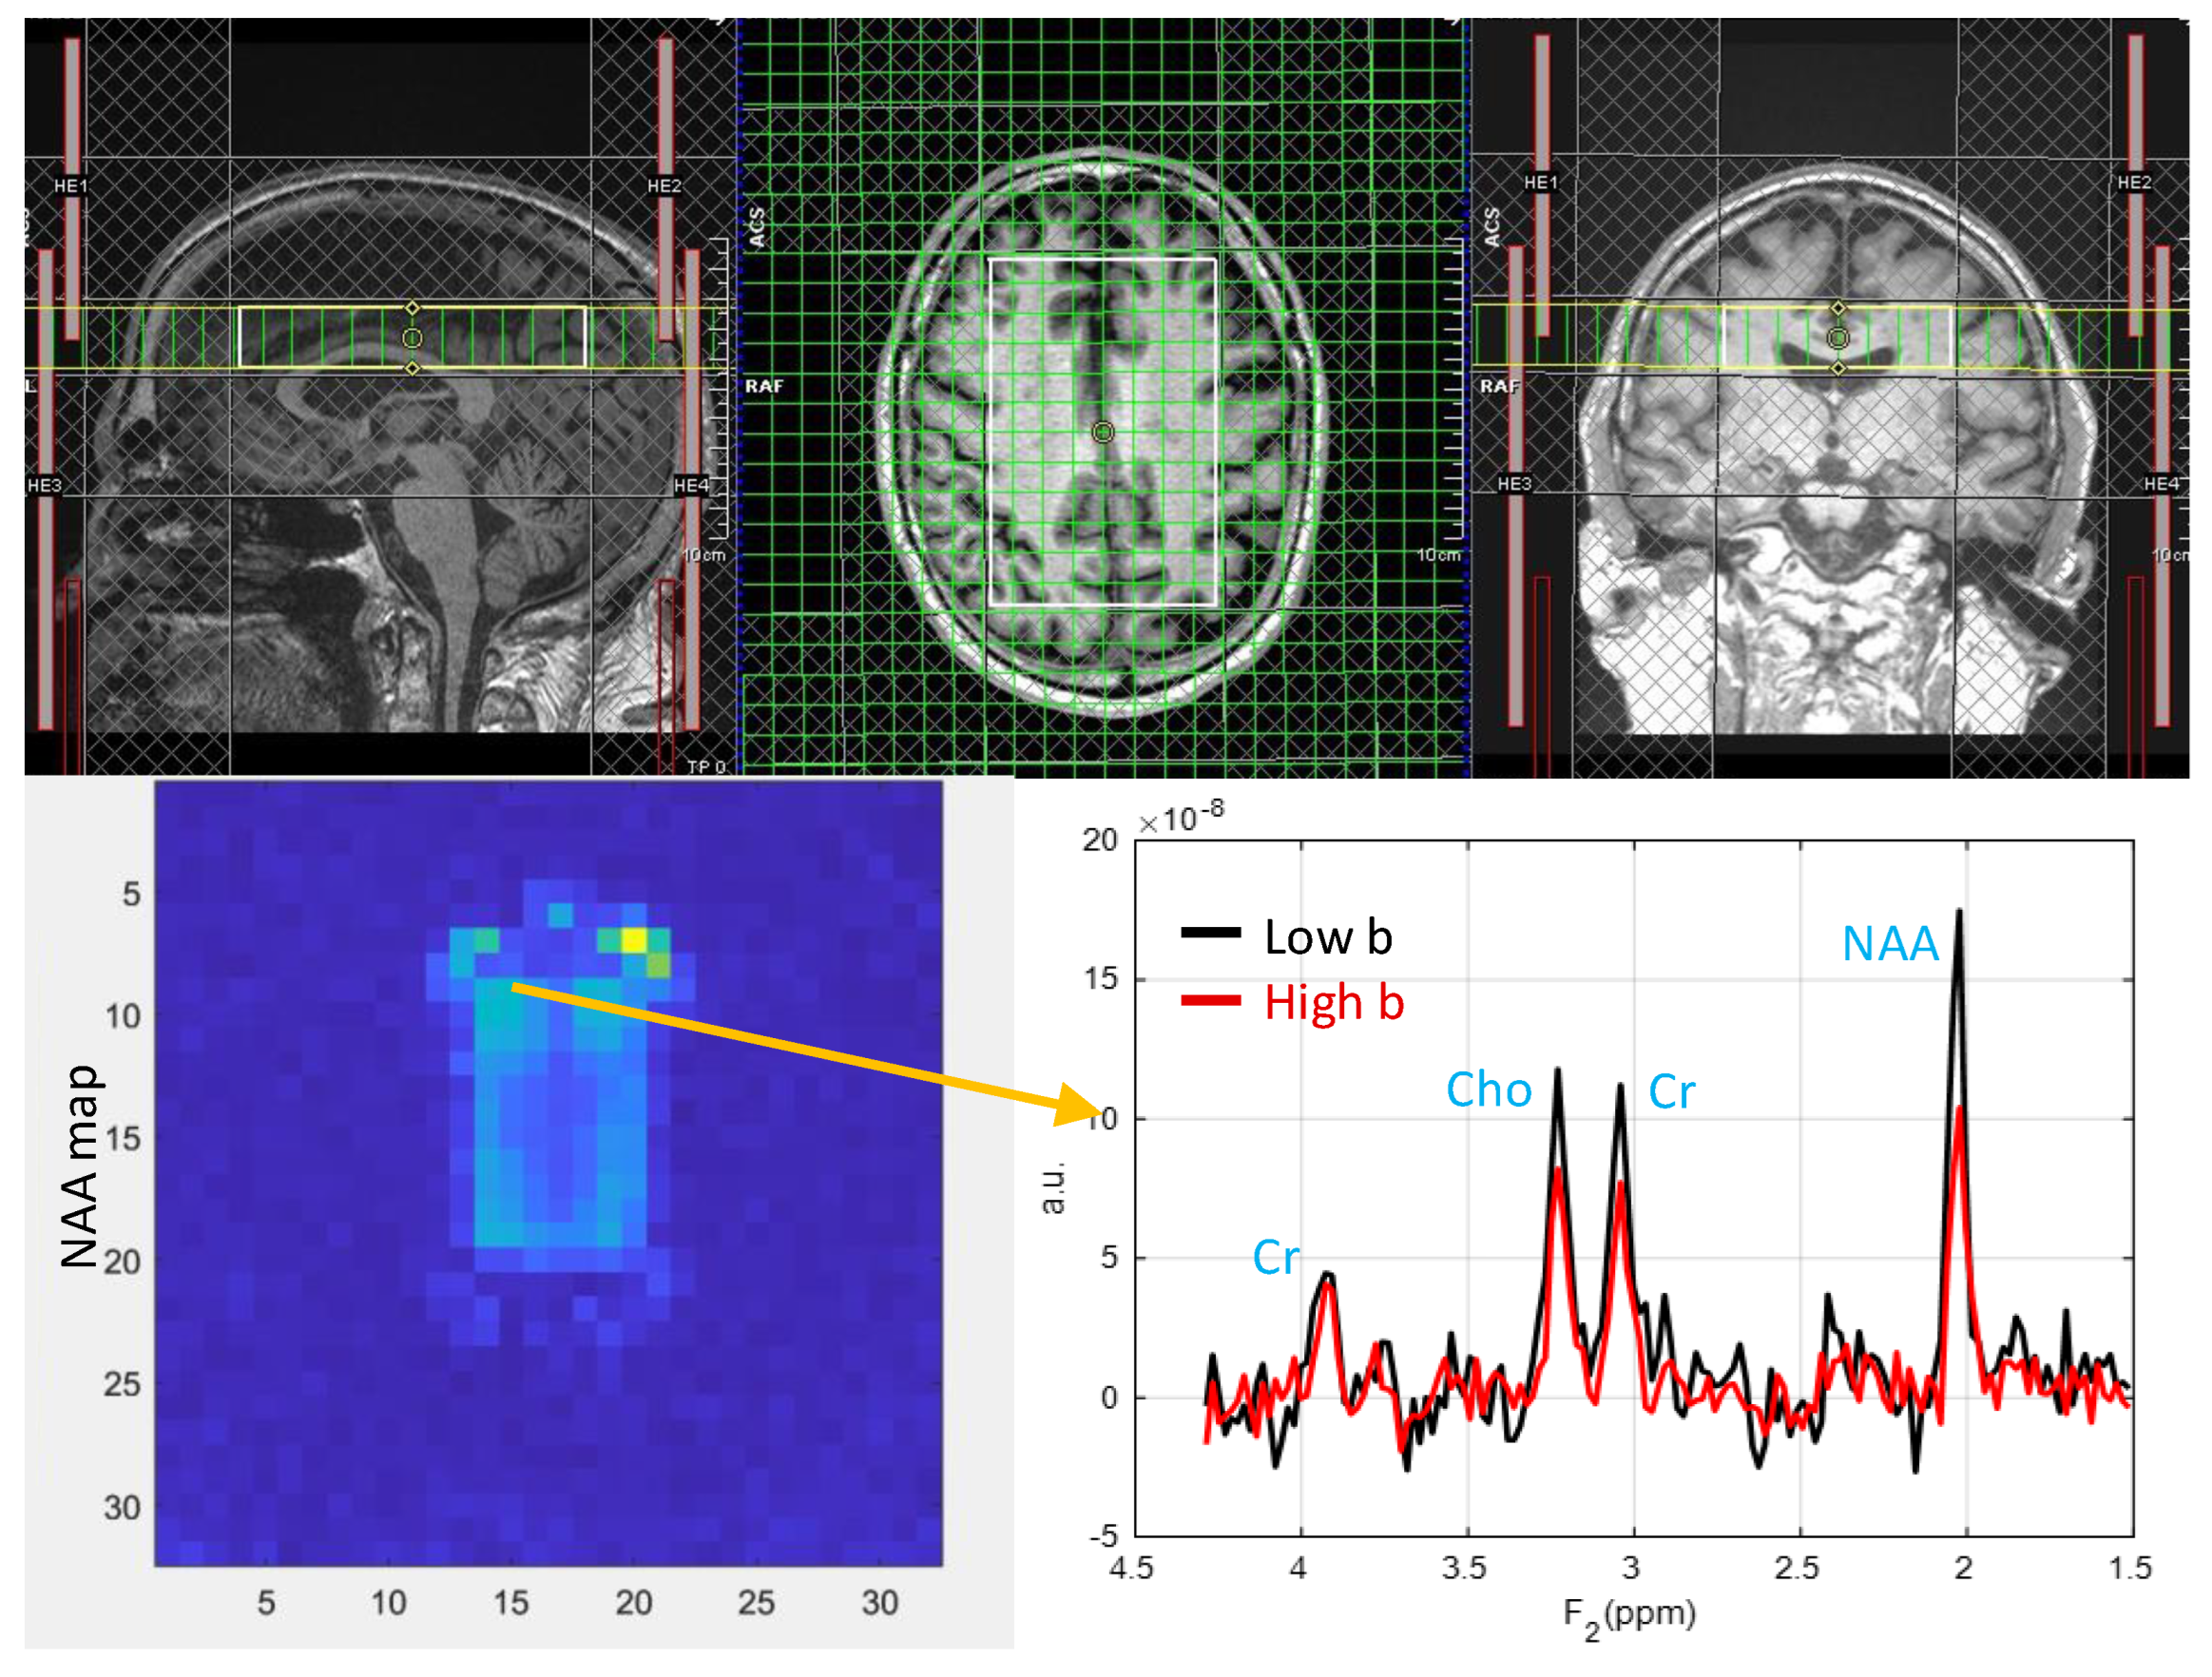
Figure 2.
Muti-voxel plot from the VOI (white box in the axial localizer image) for the same subject in figure 1 is depicted. 8 different regions used for the analysis are marked in green boxes. RACC: right anterior cingulate cortex, LACC: left anterior cingulate cortex, RSP: right superior precuneus, LSP: left superior precuneus, RACR: right anterior corona radiata, RPCP: right posterior corona radiata, LACR: left anterior corona radiata and, LPCR: left posterior corona radiata.
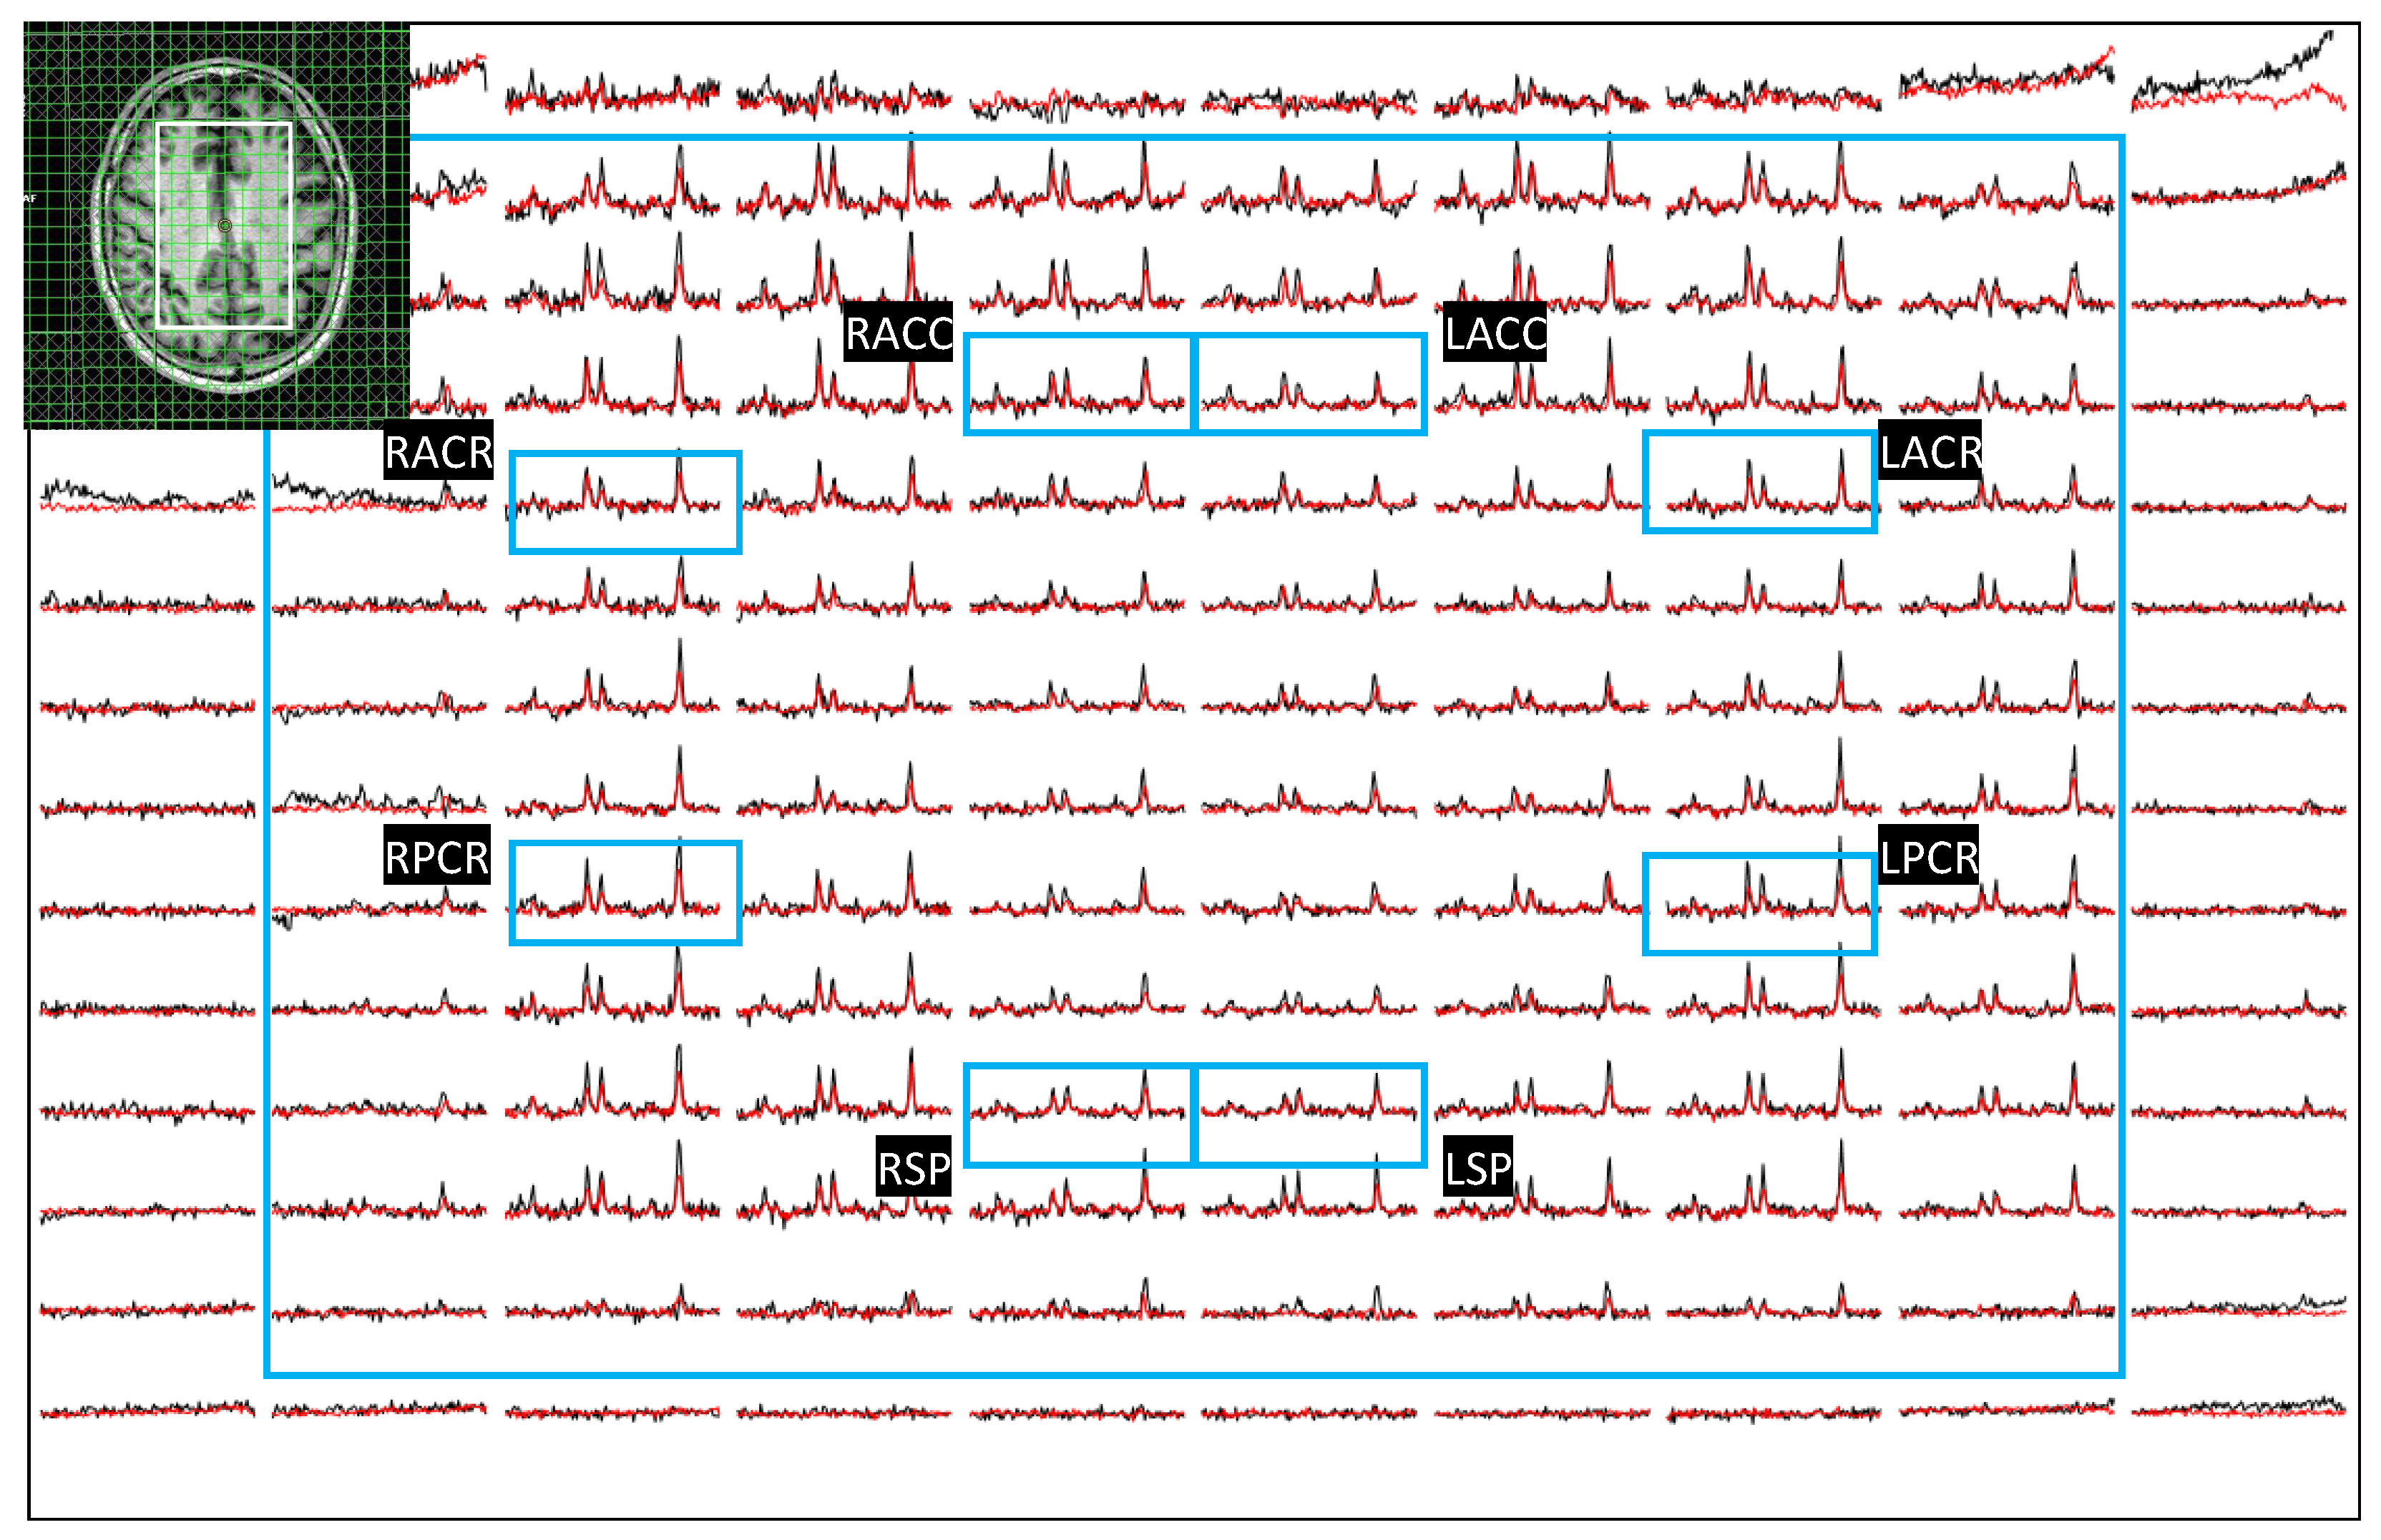
Figure 3.
Axial localizer image and multivoxel spectra from a 38 year old healthy control. LCModel fit of an extracted spectrum is shown on the bottom right panel.
Figure 3.
Axial localizer image and multivoxel spectra from a 38 year old healthy control. LCModel fit of an extracted spectrum is shown on the bottom right panel.
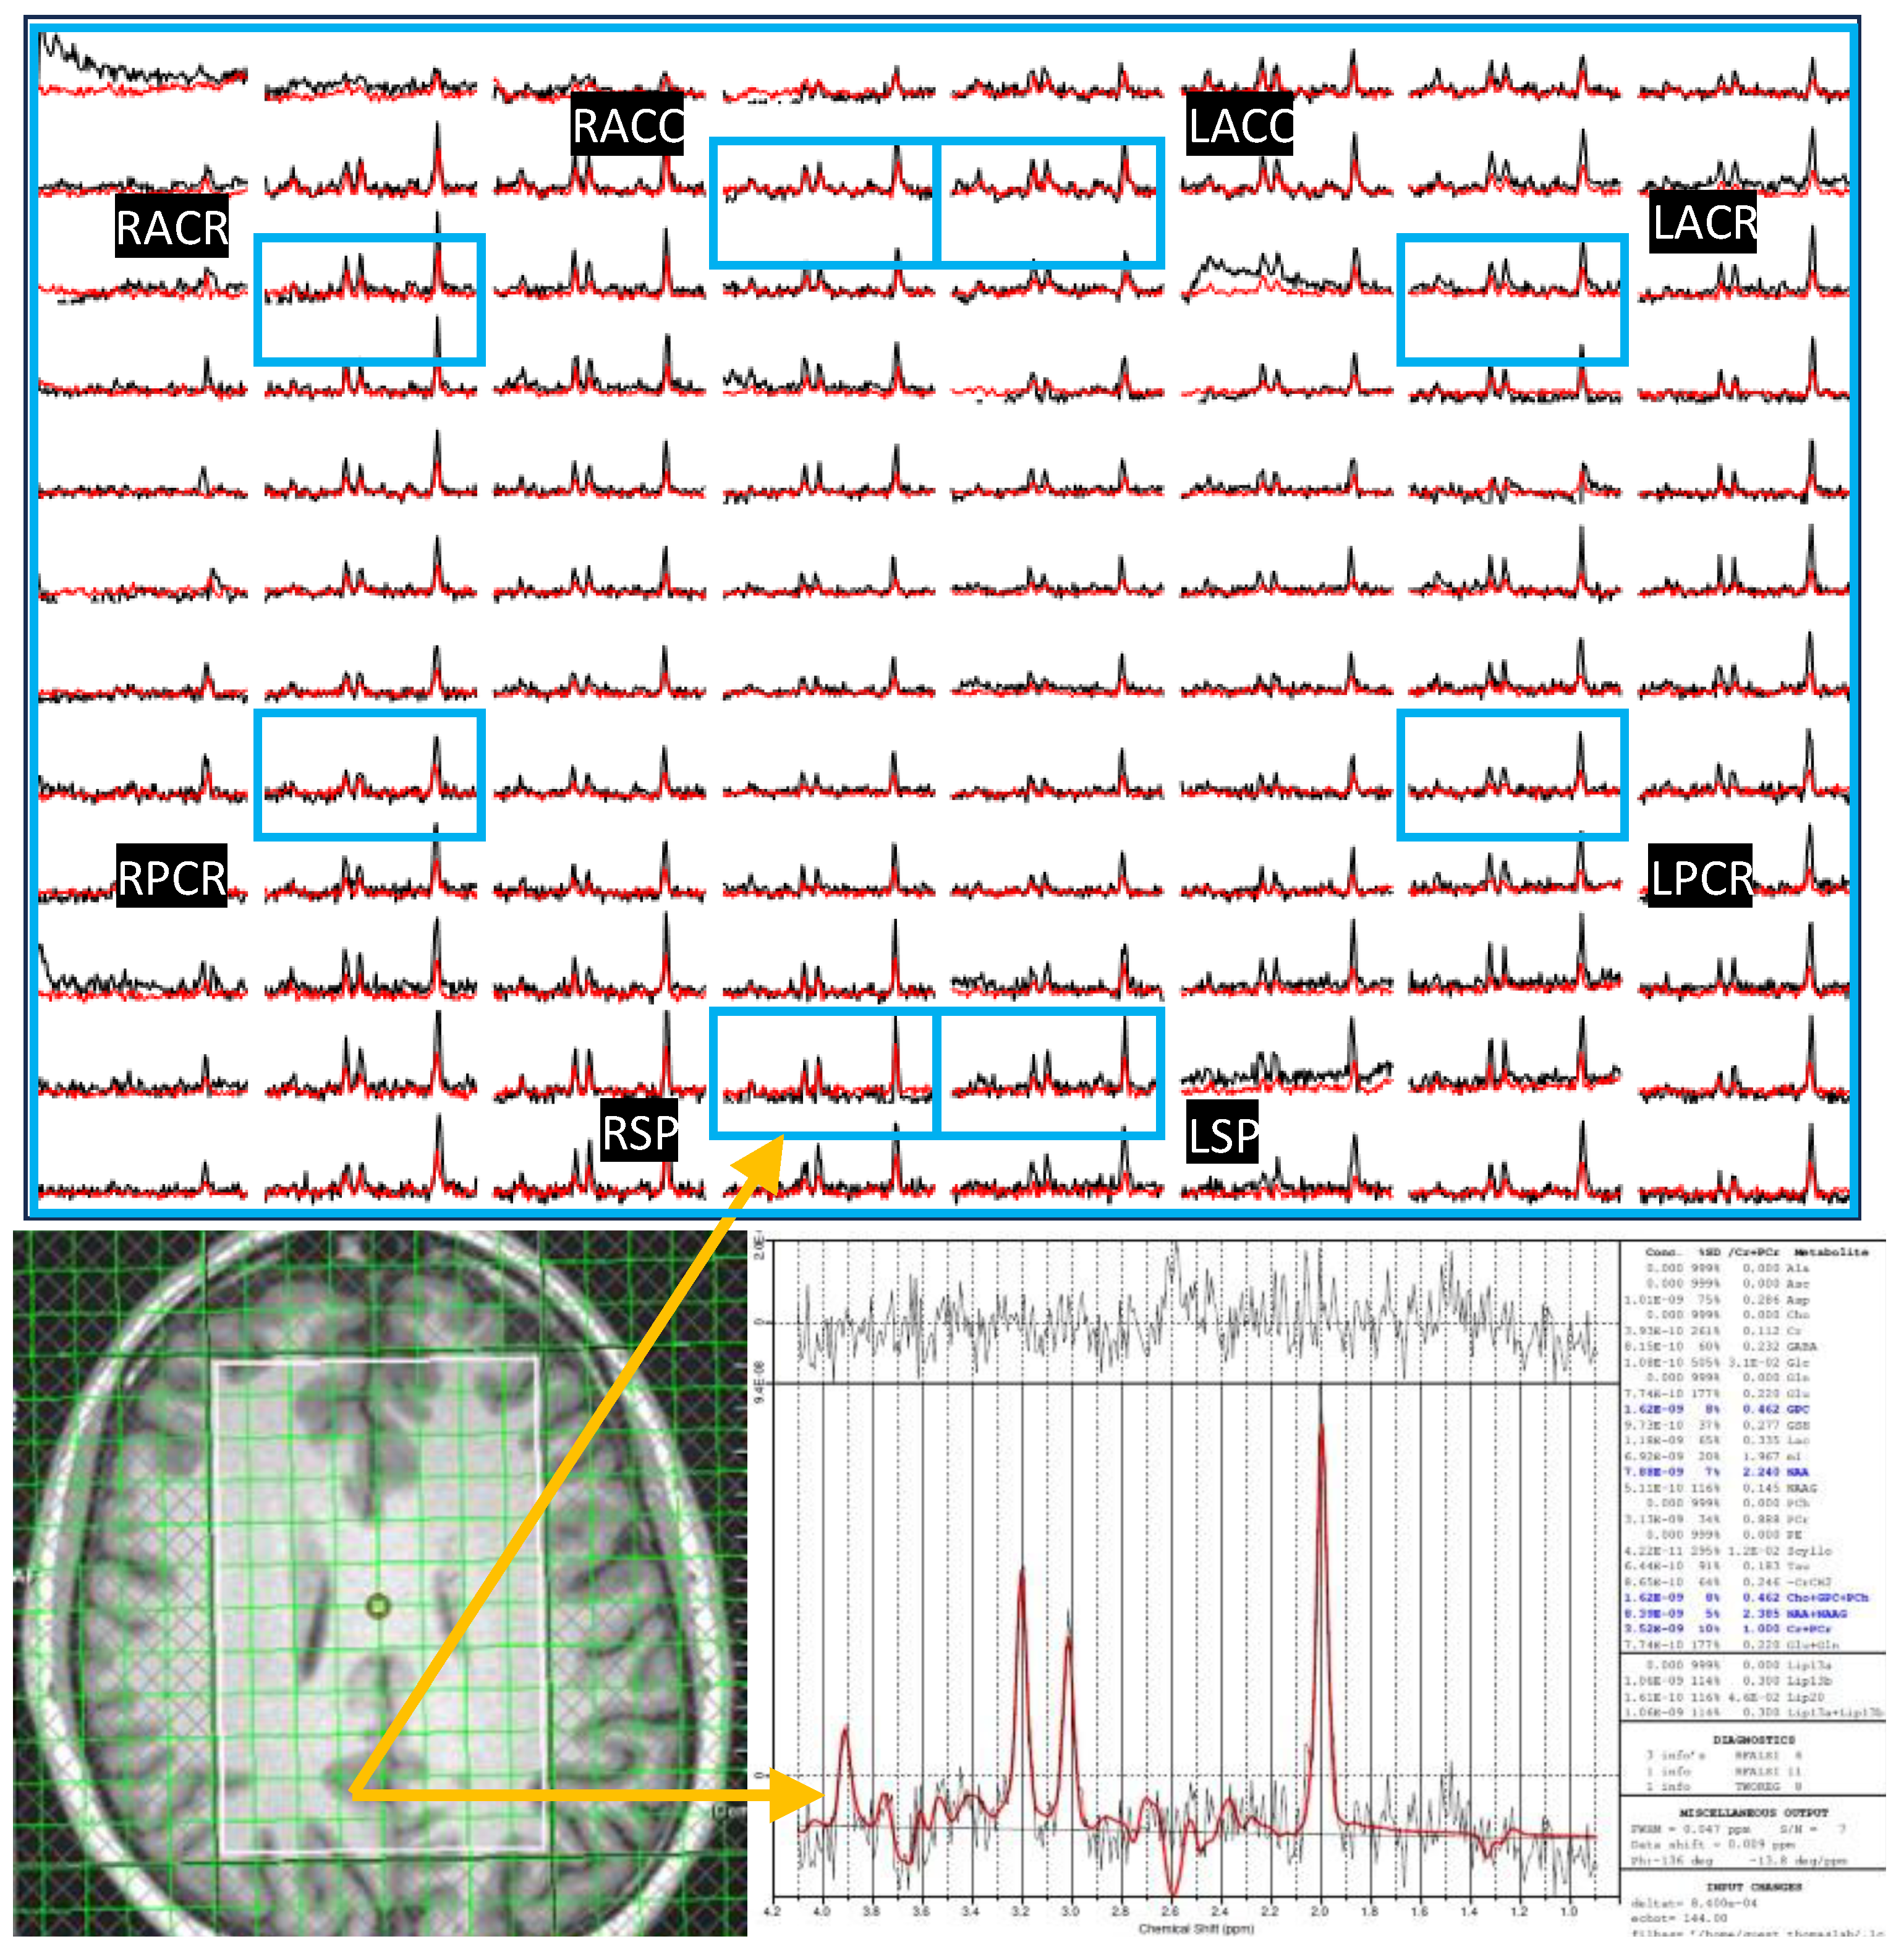
Figure 4.
A bar chart comparing the ADC values of metabolites and water at different brain regions between HC and HIV. Significant differences (p<0.5) are marked with an asterisk (*).
Figure 4.
A bar chart comparing the ADC values of metabolites and water at different brain regions between HC and HIV. Significant differences (p<0.5) are marked with an asterisk (*).
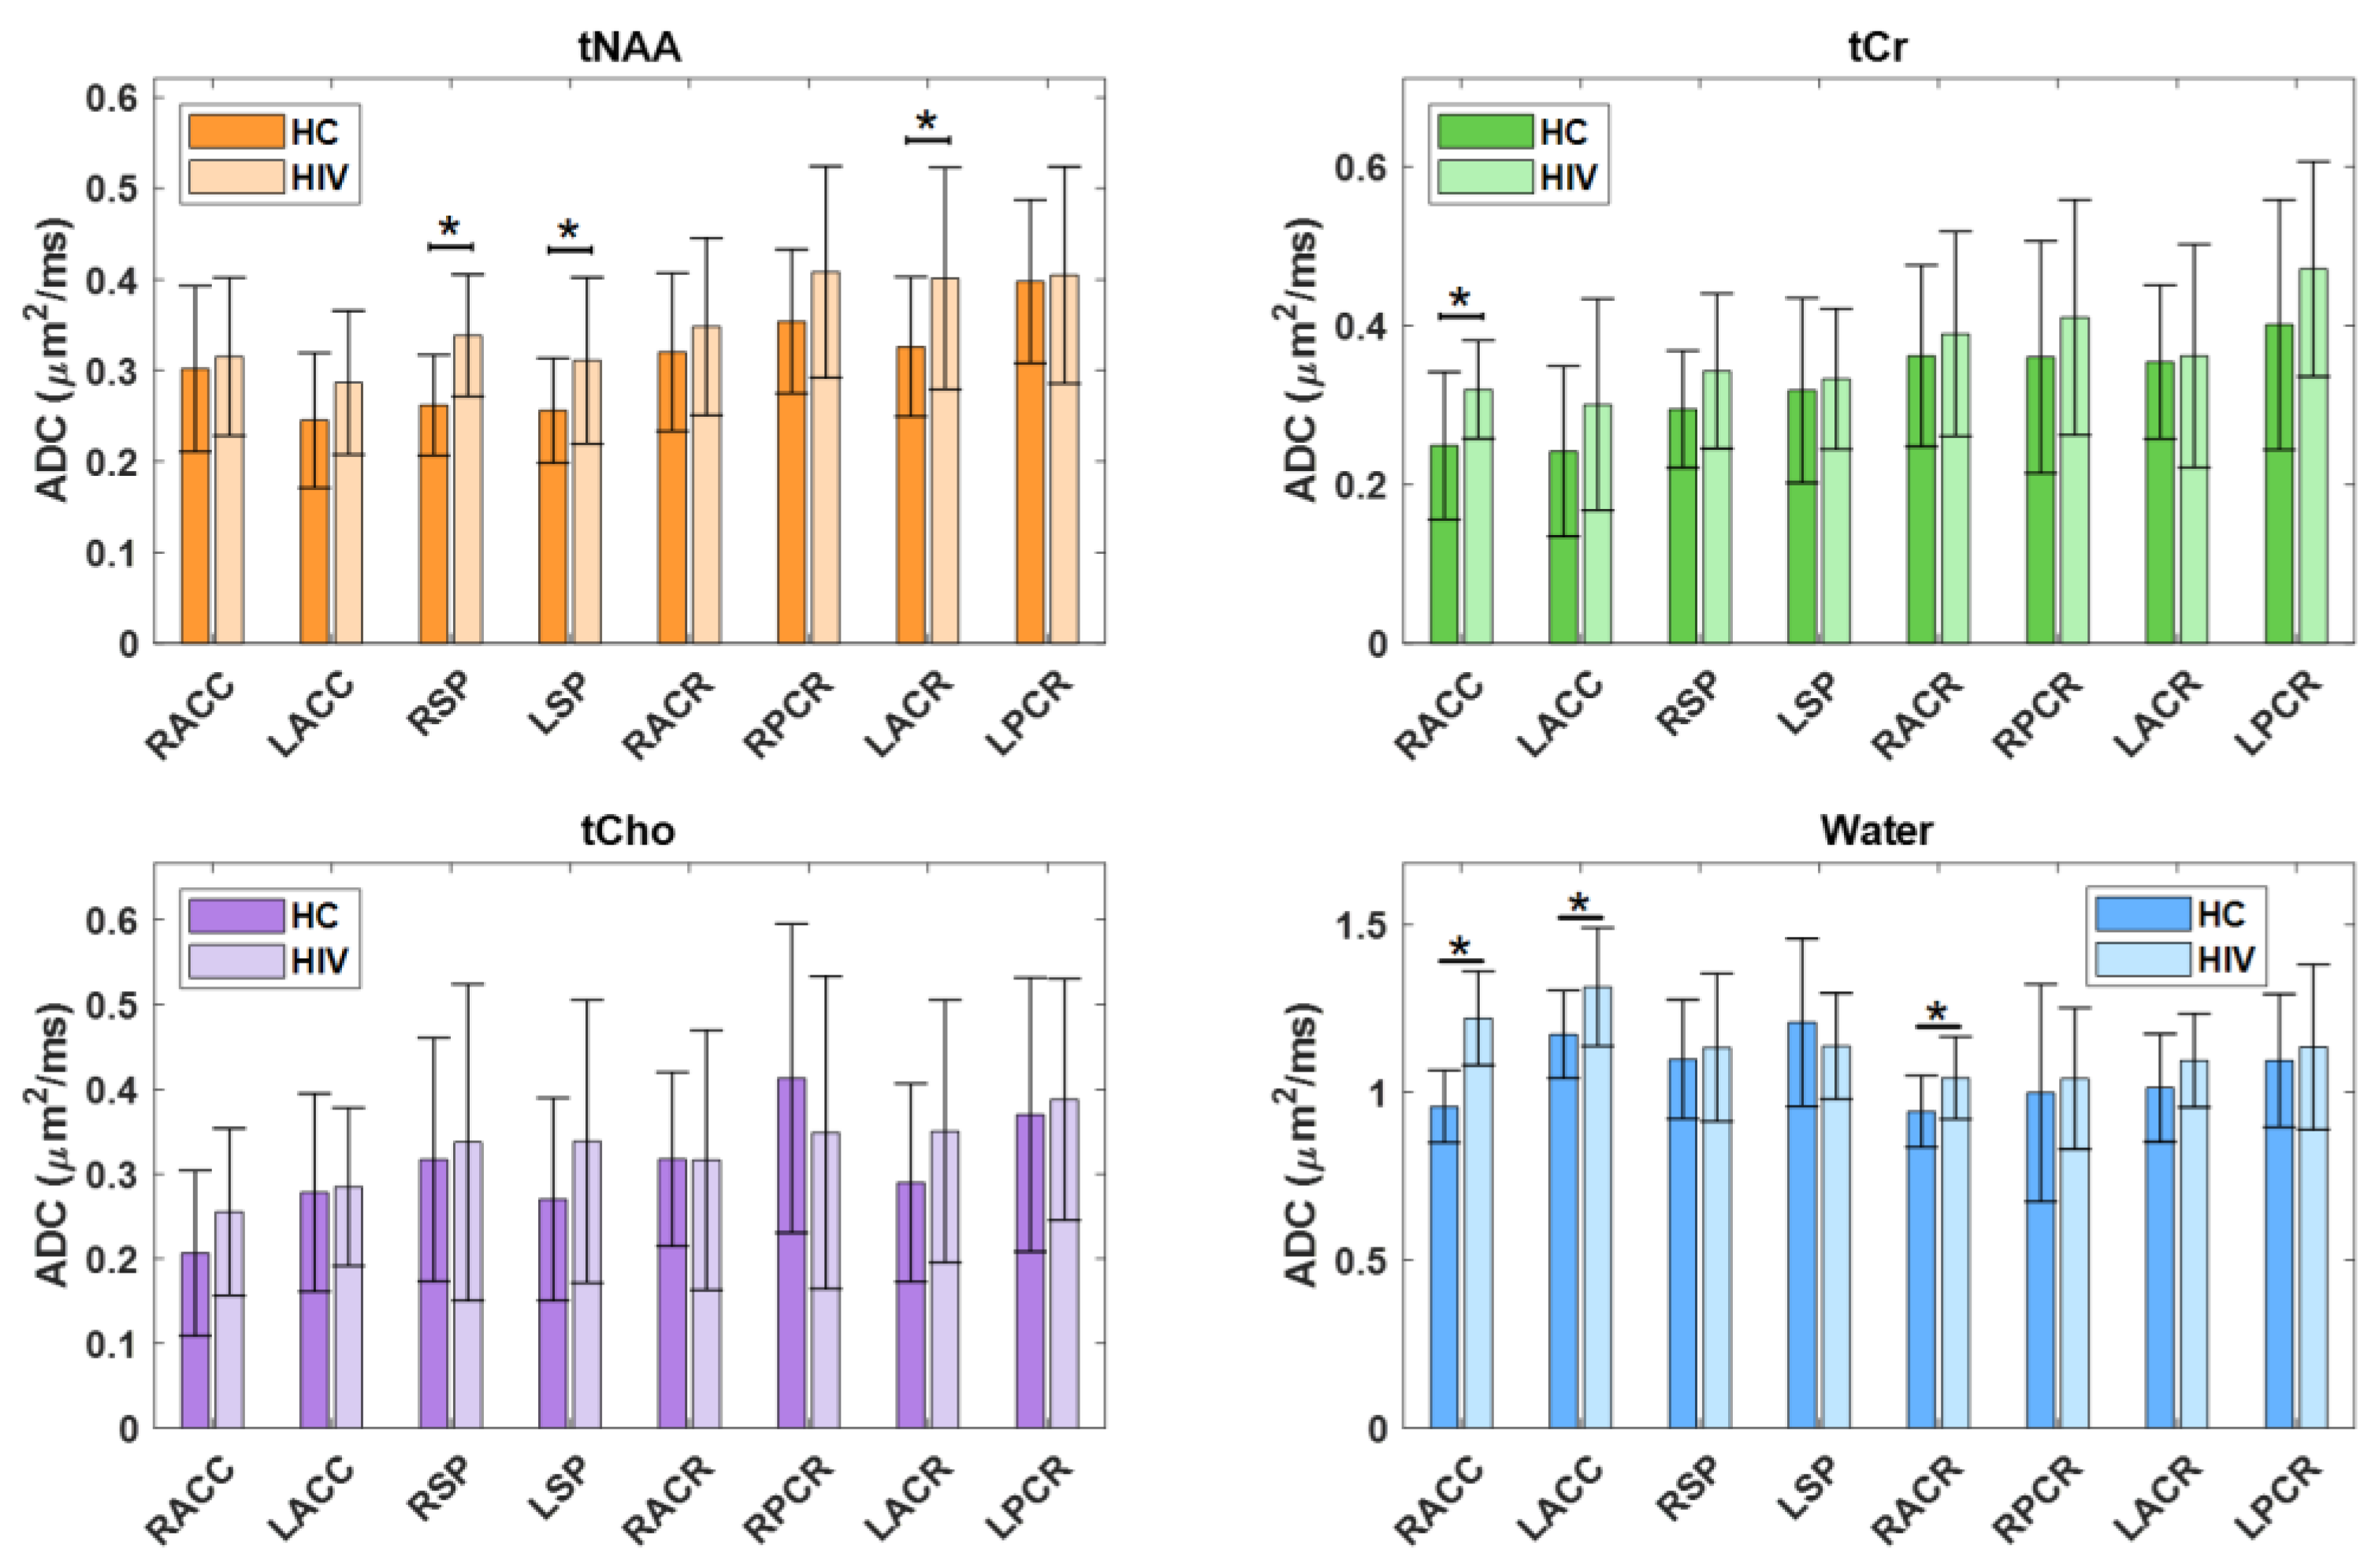
Figure 5.
A bar chart comparing the extrapolated ADC values of GM and WM in HC and HIV is shown in Figure 5. Significant differences (p<0.5) are marked with an asterisk (*).
Figure 5.
A bar chart comparing the extrapolated ADC values of GM and WM in HC and HIV is shown in Figure 5. Significant differences (p<0.5) are marked with an asterisk (*).
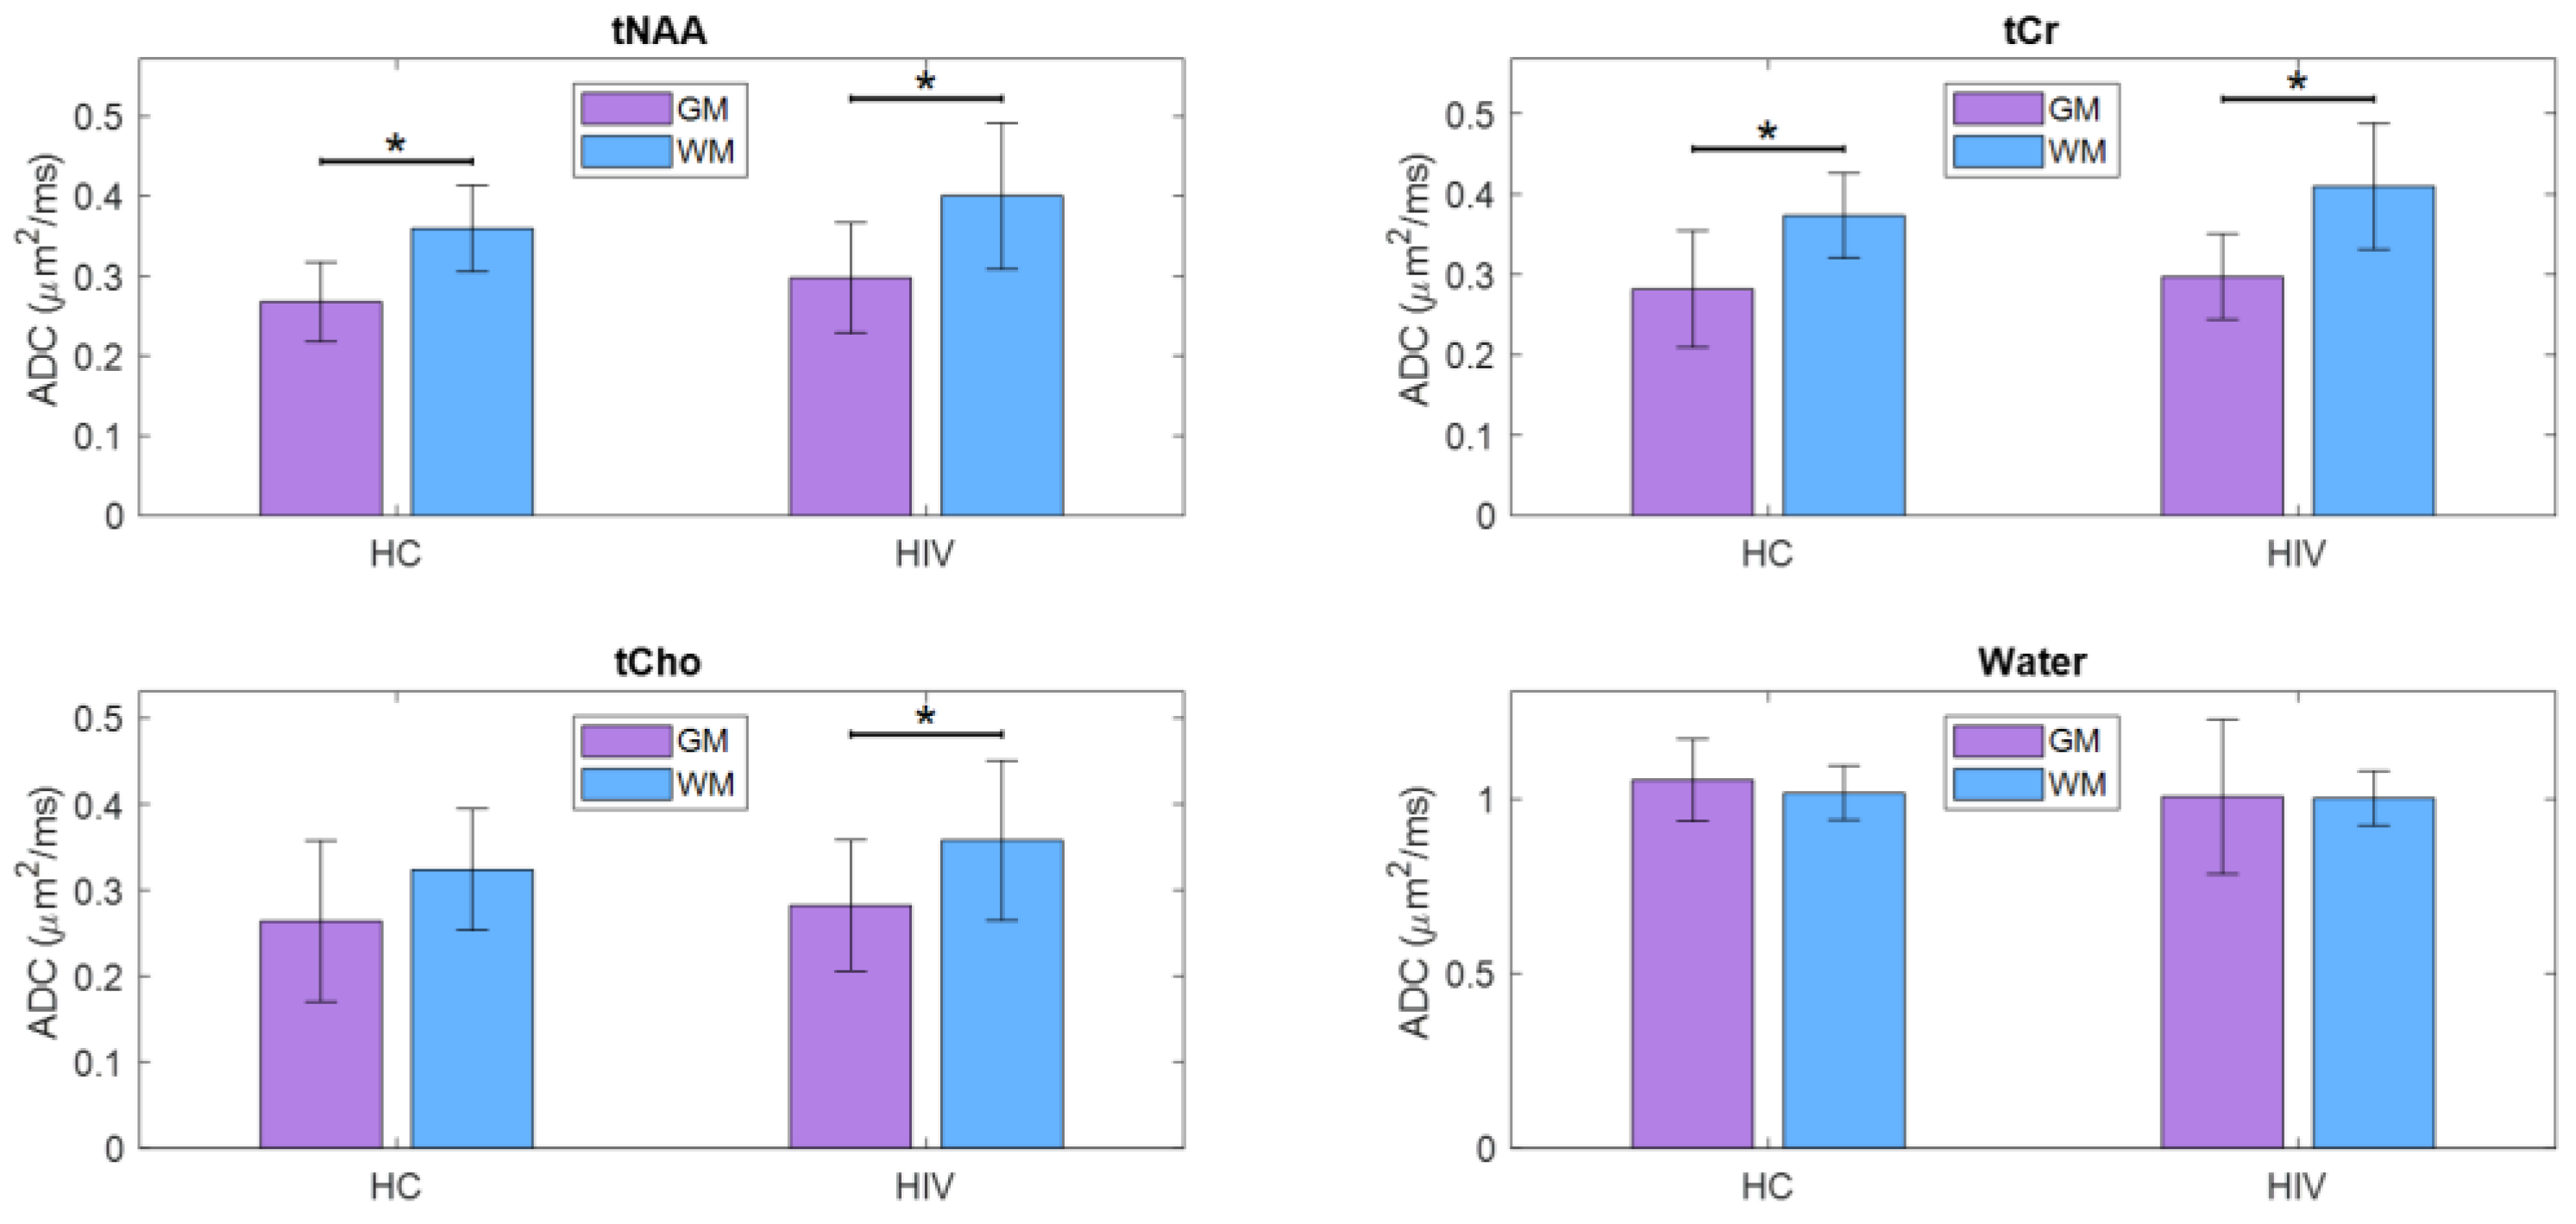
Figure 6.
Scattered plots of metabolite ADCs that showed significant correlations with neuropsychological domain scores. Pearson correlation (r) and p-values are shown in the inset.
Figure 6.
Scattered plots of metabolite ADCs that showed significant correlations with neuropsychological domain scores. Pearson correlation (r) and p-values are shown in the inset.
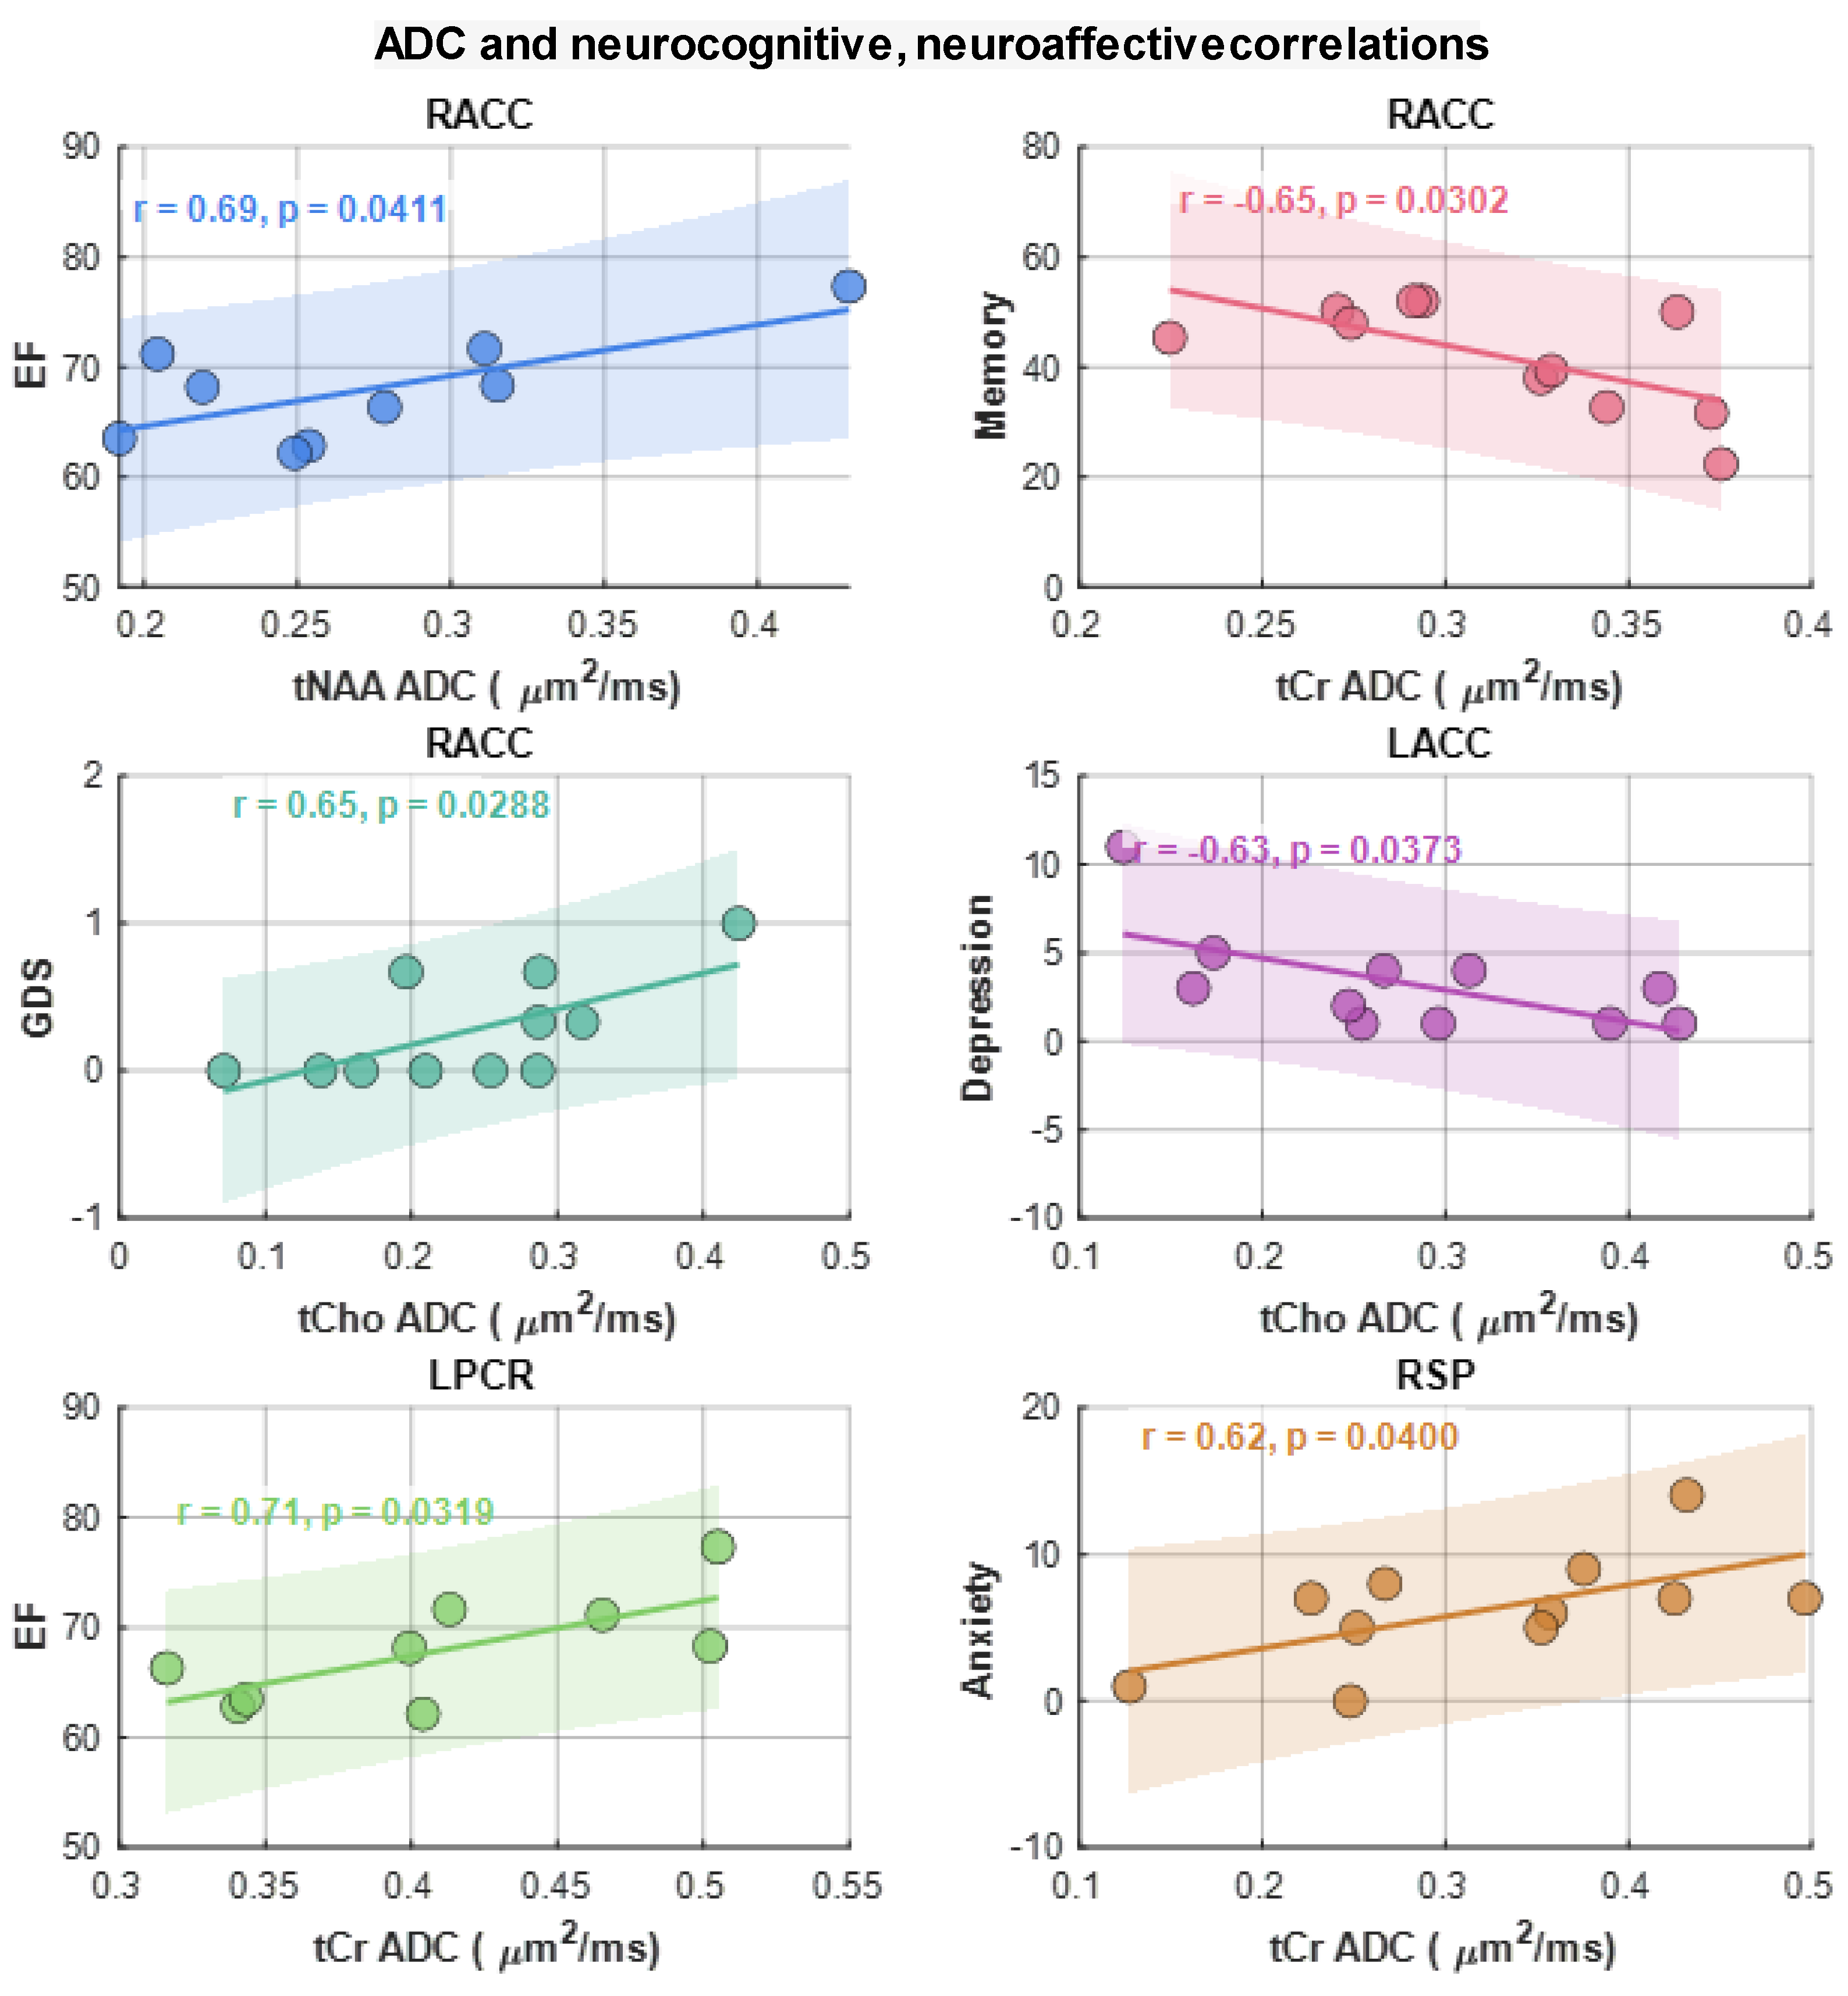
Figure 7.
A bar chart comparing the metabolite ratios at different brain regions between HC and HIV. Significant differences (p<0.5) are marked with an asterisk (*).
Figure 7.
A bar chart comparing the metabolite ratios at different brain regions between HC and HIV. Significant differences (p<0.5) are marked with an asterisk (*).
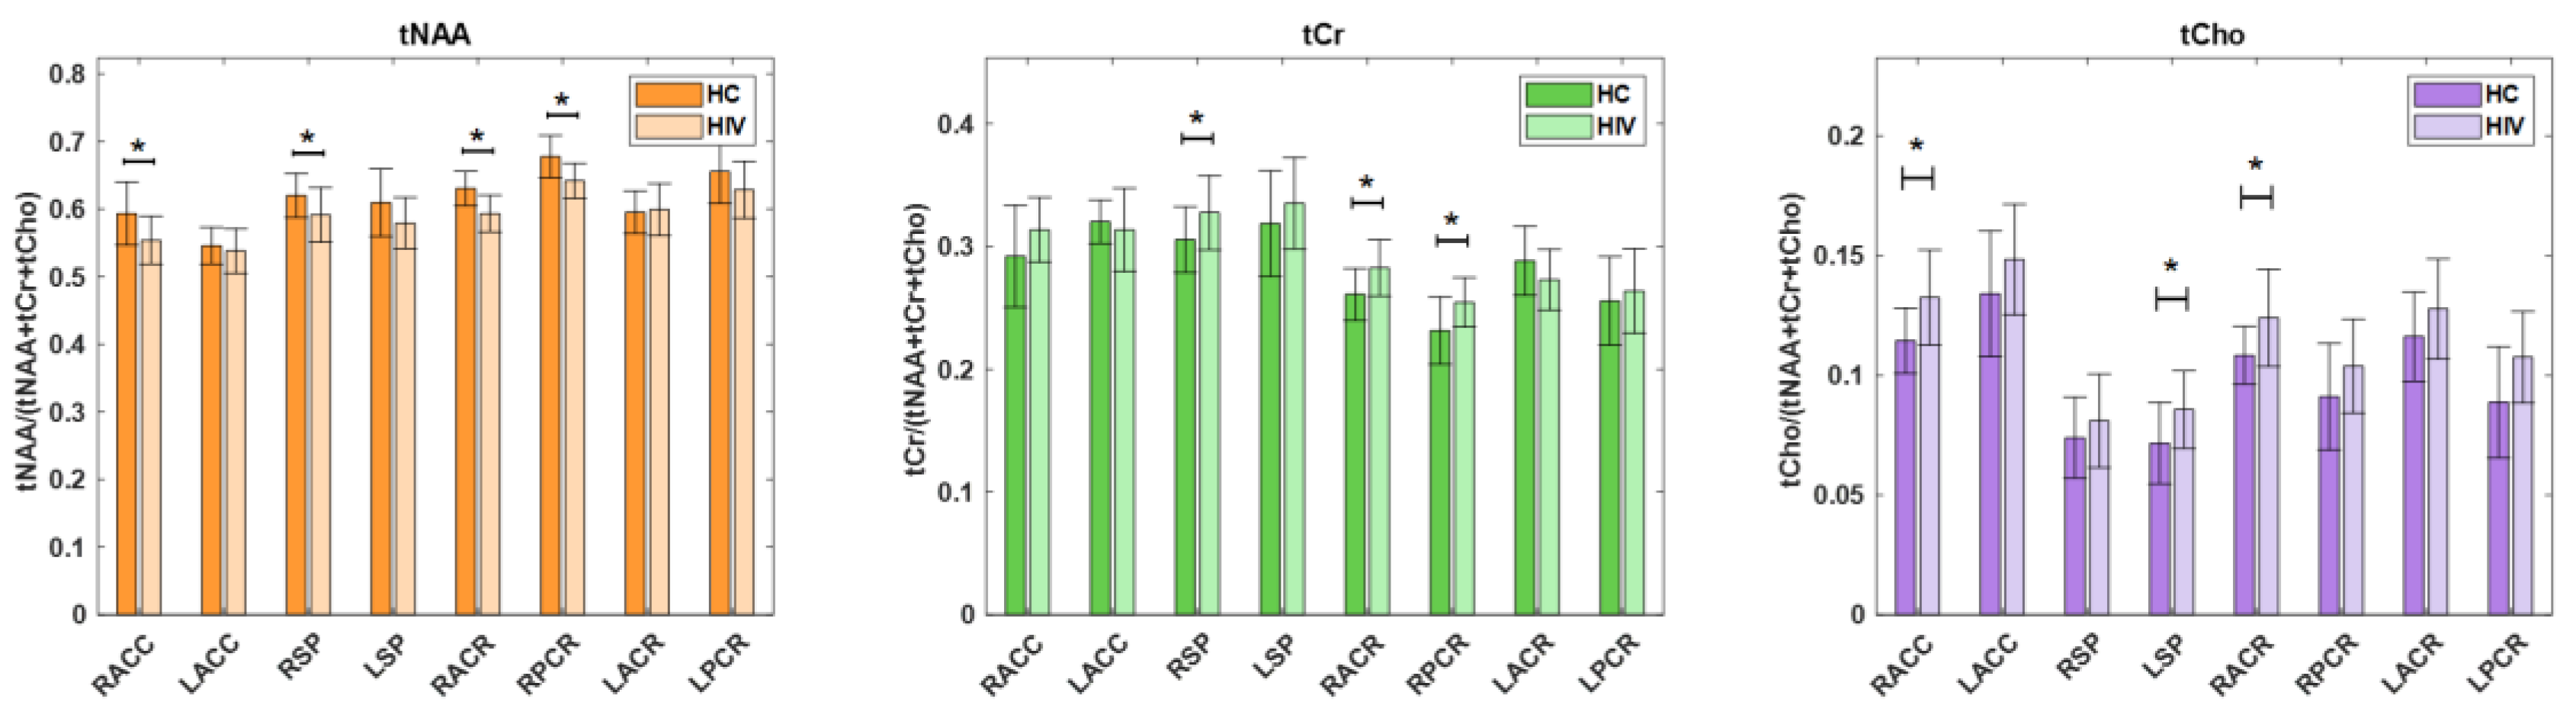
Figure 8.
Scattered plots of metabolite ratios that showed significant correlations with neuropsychological domain scores. Pearson correlation (r) and p-values are shown in the inset.
Figure 8.
Scattered plots of metabolite ratios that showed significant correlations with neuropsychological domain scores. Pearson correlation (r) and p-values are shown in the inset.
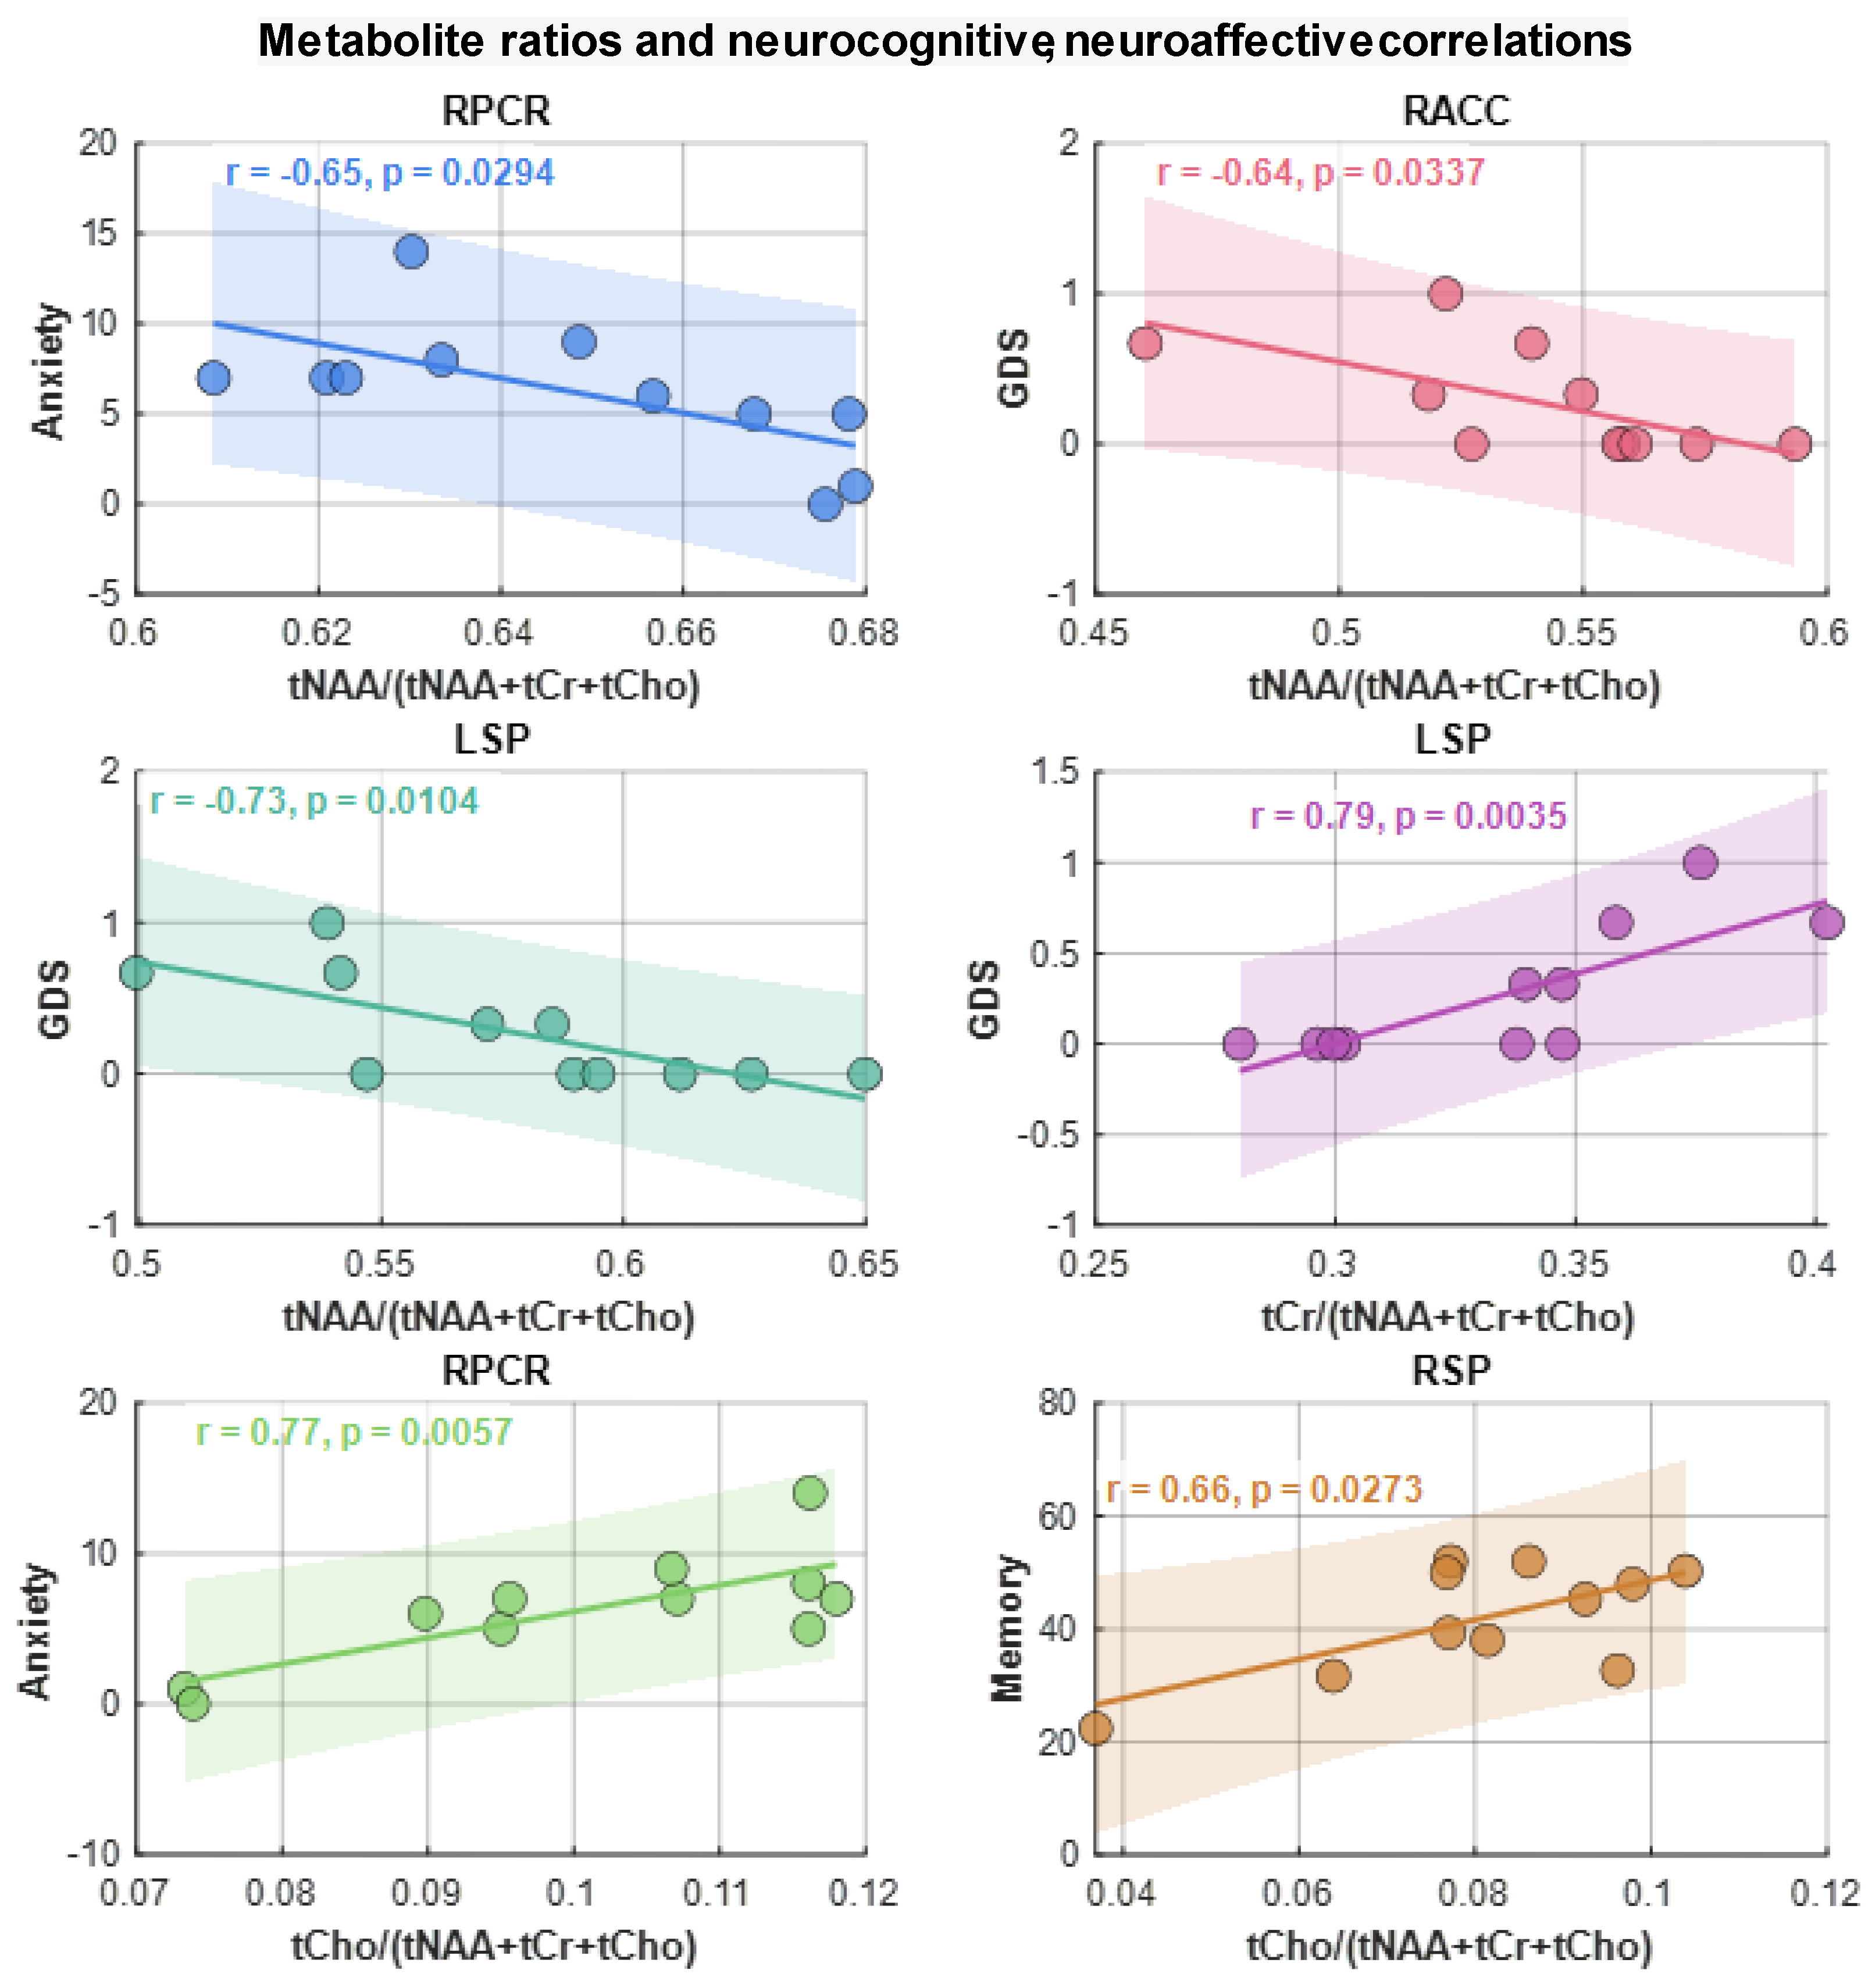
Figure 9.
(A) ROC curve of the tCr+water ADC for differentiating healthy controls from HIV based on linear discriminant analysis (LDA), with an AUC of 0.975 (95% CI: 0.923–1). (B) ROC curve of the tNAA ratio + tCr ADC for differentiating healthy controls from HIV using LDA, with an AUC of 0.854 (95% CI: 0.708–1).
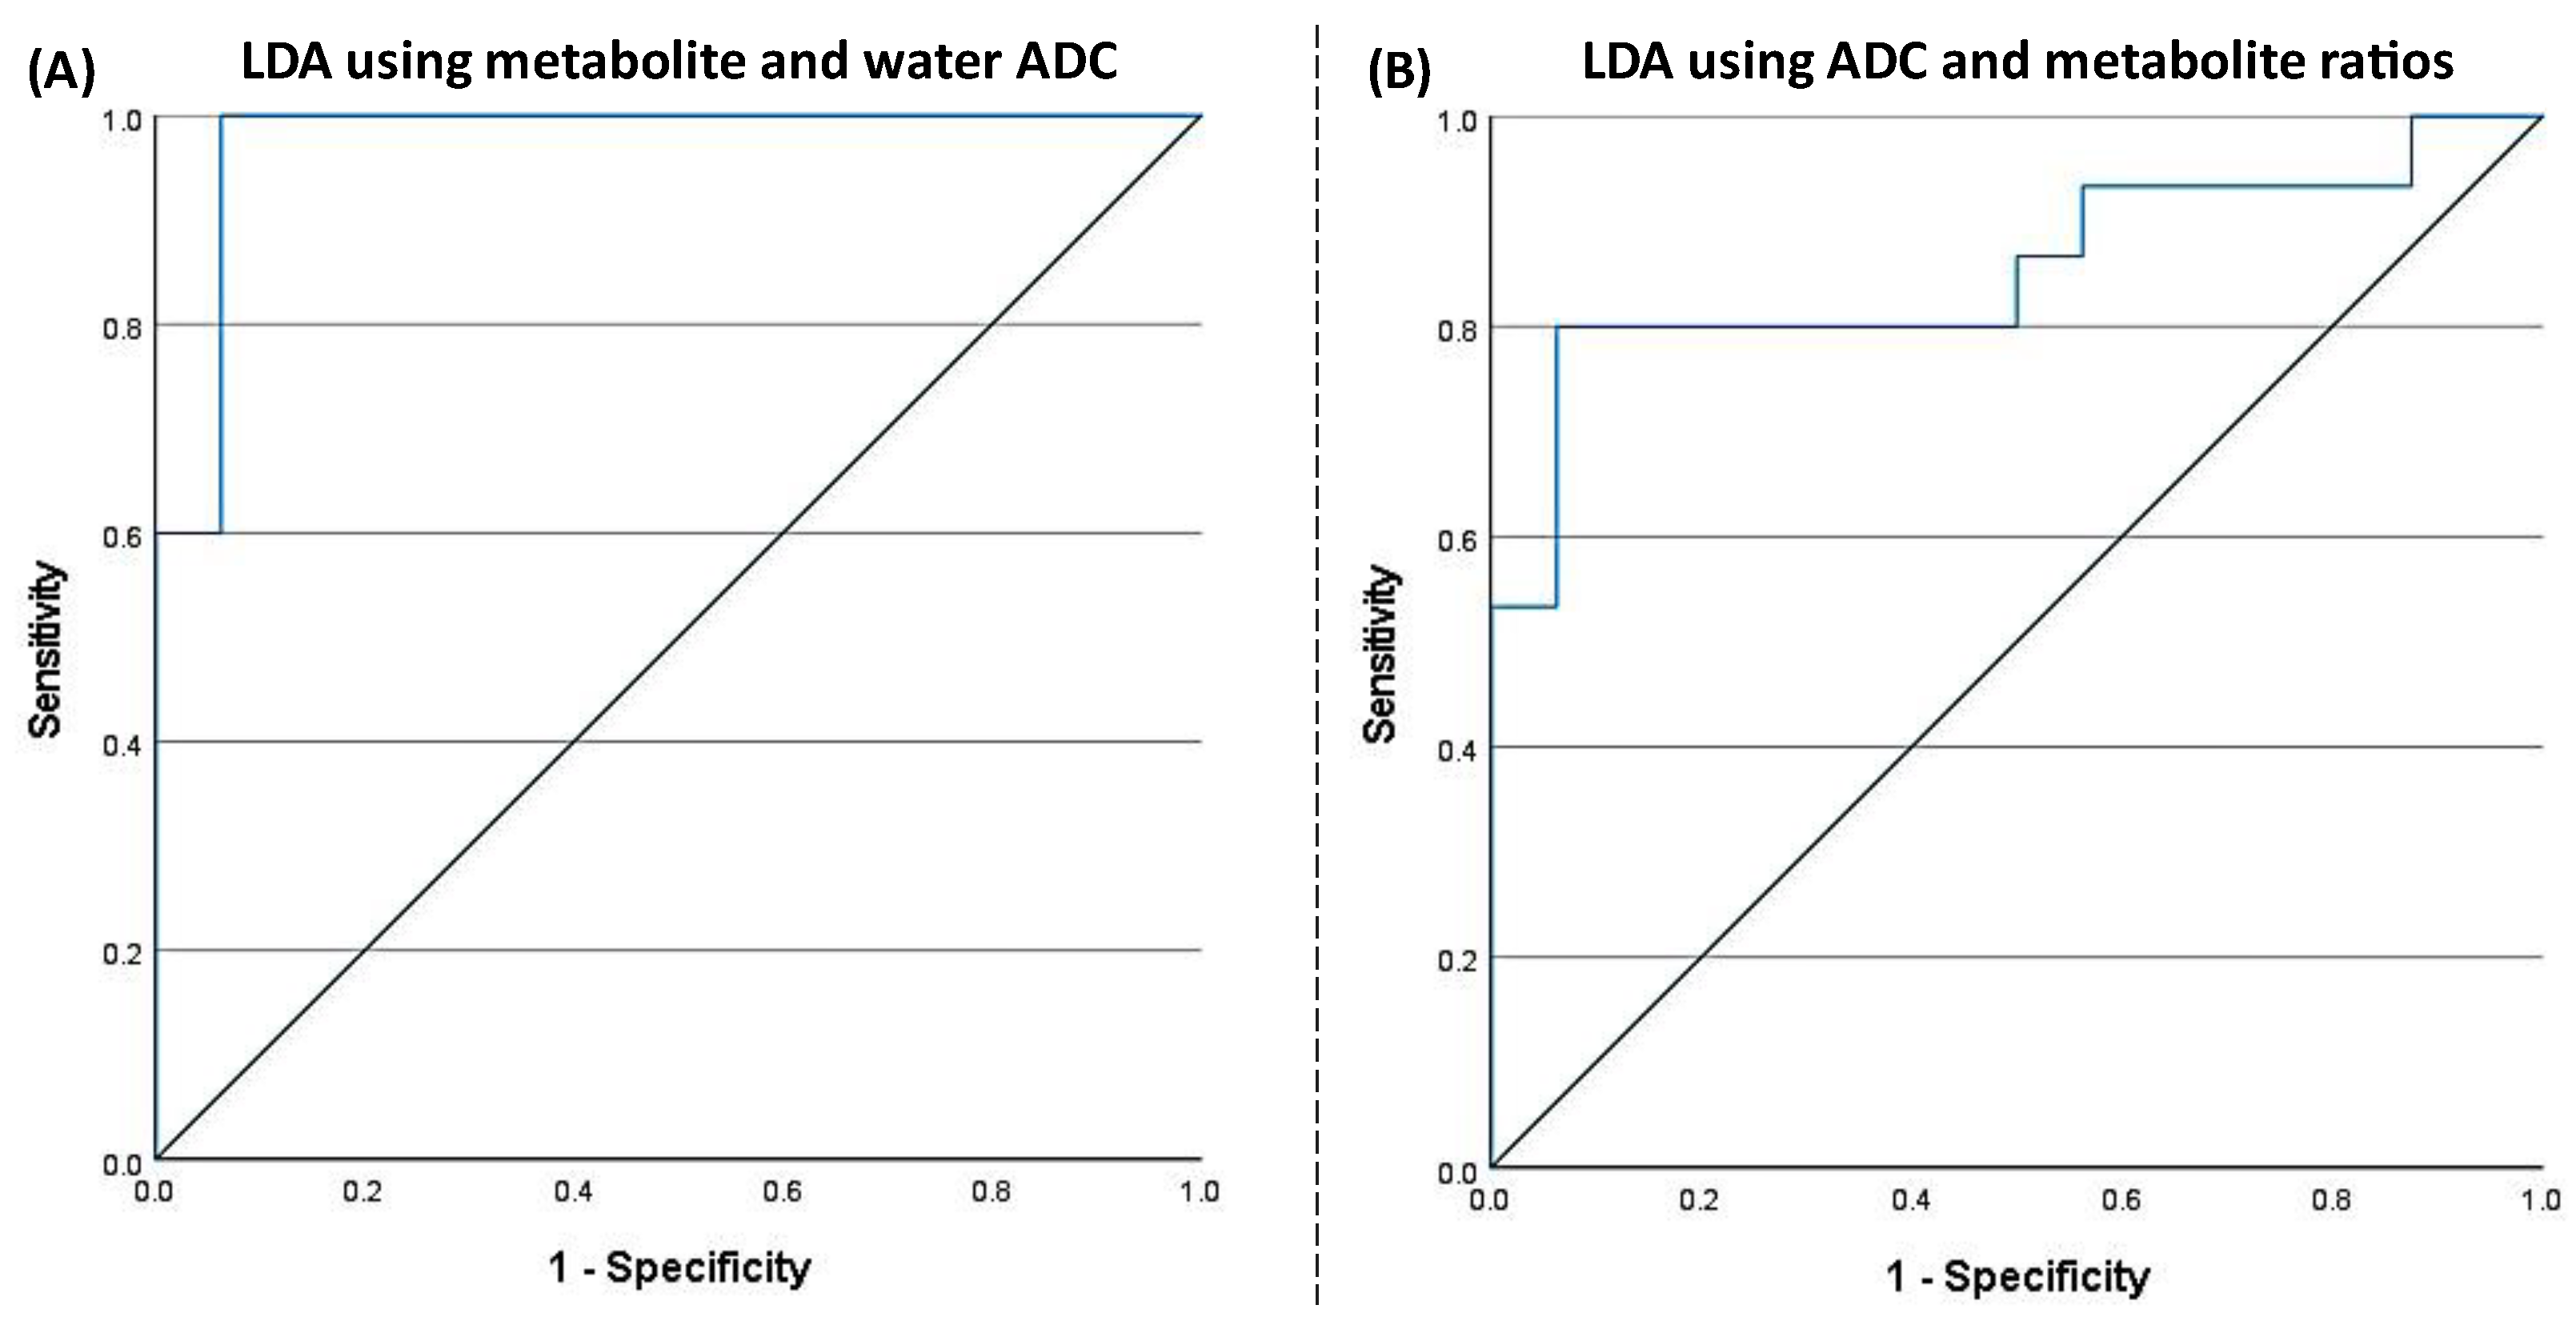

Table 1.
Baseline characteristics of study participants.
| HIV-Infected | Healthy Controls | |
|---|---|---|
| N | 16 | 15 |
| Age (Mean ± SD 1) | 48.30±15.03 | 41.45±14.42 |
| Gender (Male/Female) | 15/1 | 11/4 |
| CD4+ count cells/uL (Mean±SD) | 822.93±319 | N/A 2 |
| CD4+ count>200cells/ uL (%) | 88 (N=14) | N/A |
| Estimated duration of HIV infection (years, Mean±SD) | 24.18±7.67 | N/A |
| % years receiving cART 3 | 96 | N/A |
1 SD: standard deviation.2 N/A: Not applicable or available.; 3 cART: combination antiretroviral therapy.
Disclaimer/Publisher’s Note: The statements, opinions and data contained in all publications are solely those of the individual author(s) and contributor(s) and not of MDPI and/or the editor(s). MDPI and/or the editor(s) disclaim responsibility for any injury to people or property resulting from any ideas, methods, instructions or products referred to in the content. |
© 2025 by the authors. Licensee MDPI, Basel, Switzerland. This article is an open access article distributed under the terms and conditions of the Creative Commons Attribution (CC BY) license (http://creativecommons.org/licenses/by/4.0/).
Copyright: This open access article is published under a Creative Commons CC BY 4.0 license, which permit the free download, distribution, and reuse, provided that the author and preprint are cited in any reuse.


