Submitted:
01 July 2025
Posted:
02 July 2025
You are already at the latest version
Abstract
Background/Objectives: Traditional dietary screeners face significant limitations: they rely on subjective self-reporting, average intake estimates, and are influenced by a participant’s awareness of being ob-served—each of which can distort results. These factors reduce both accuracy and reproducibil-ity. The Guide Against Age-Related Disease (GARD) addresses these issues by applying Assem-bly Theory to objectively quantify food and food behavior (FFB) complexity. This study aimed to validate GARD as a structured, bias-resistant tool for dietary assessment in clinical and re-search settings. Methods: The GARD survey was administered in an internal medicine clinic within a suburban hospital system in the southeastern U.S. The tool assessed six daily eating windows, scoring high-complexity FFBs (e.g., fresh plants, social eating, fasting) as +1 and low-complexity FFBs (e.g., ultra-processed foods, refined ingredients, distracted eating) as –1. To minimize bias, pa-tients were unaware of scoring criteria and reported only what they ate the previous day, avoid-ing broad averages. A computer algorithm then scored responses based on complexity, inde-pendent of dietary guidelines. Internal (face, convergent, and discriminant) and external validity were assessed using Spearman rho correlations. Results: Face validation showed high inter-rater agreement using predefined Assembly Index (Ai) and copy number (Ni) thresholds. Positive correlations were found between high-complexity diets and behaviors (rho = .533–.565, p < .001), while opposing constructs showed moderate negative correlations (rho = –.363 to –.425, p < .05). GARD scores aligned with established diet patterns: Mediterranean diets averaged +22; fast food diets averaged –10.
Keywords:
dietary complexity
; Assembly Theory
; food behavior
; GARD screener
; ultra-processed foods
; fasting
; microbiome
; dietary assessment
; nutrition screening
Introduction
Does the body treat 100 calories of potatoes the same way it treats 100 calories of crackers? Conventional dietary assessments might say yes—tallying macronutrients and calories between foods as if they were always metabolically equivalent. But emerging research suggests otherwise: the structure of food—its molecular complexity and behavioral context—can shape metabolism, insulin sensitivity, satiety, microbiome health, and long-term disease risk in dramatically different ways [1,2,3].
This paper introduces and validates the Guide Against Age-Related Disease (GARD) screener, a new tool that quantifies diet and eating behavior complexity using principles from Assembly Theory. The GARD distinguishes between high-complexity foods (e.g., fresh plants, fermented foods, farm-direct proteins) and low-complexity foods (e.g., ultra-processed items, refined ingredients, distracted eating), scoring them based on quantifiable molecular and behavioral complexity.
High-complexity diets, as determined by the GARD, are consistently associated with better metabolic health, insulin sensitivity, cognitive resilience, microbiome diversity, and lower rates of chronic disease [4,5]. In contrast, diets measured as low-complexity—common in ultra-processed food environments—correlate with overeating, inflammation, insulin resistance, and gut dysbiosis [6,7,8,9]. Yet, traditional screeners focus primarily on gross estimates of intake—particularly fruit and vegetable consumption—without accounting for behavioral complexity, molecular food differences, or the practical barriers clinicians face in real-world settings [10,11].
The GARD offers a bias-resistant alternative. It assesses both what people eat and how they eat—whether meals are shared or solitary, mindful or distracted, outdoors or processed—assigning scores that reflect the real-world complexity of eating. In this study, we detail the design, administration, and validation of the GARD screener, demonstrating its ability to distinguish between healthy and unhealthy eating patterns across molecular, behavioral, and statistical dimensions.
Quantifying diet and eating behavior is essential for advancing research, clinical practice, and public health [12]. The Guide Against Age-Related Disease (GARD) survey was developed to objectively assess not only diet quality but also the behaviors that shape it. Beyond nutrient composition, the source of food—whether ultra-processed or whole, nutrient-dense options—offers critical insight into dietary health [13]. Likewise, eating behaviors, such as mindful or distracted eating, play a fundamental role and should be evaluated alongside macronutrient intake [14,15].
Existing frameworks—such as the Penn Healthy Diet Survey—omit both food behaviors and food sources. [16,17,18]. This omission is a critical flaw, as behavioral context (e.g., eating socially vs. distracted) and food origin (e.g., whole vs. ultra-processed) independently influence metabolic outcomes, satiety signals, and long-term disease risk [3,13]. Without measuring these factors, dietary screeners miss key determinants of health beyond nutrient composition. The GARD may help address this gap by suggesting that the measurable complexity of biological systems offers a meaningful way to assess FFB, enabling the GARD to precisely measure nutrition and behavior in terms of complexity.
Assembly Theory works to measure the complexity of objects:
- Assembly Index (Ai) – the fewest number of steps required to make the molecule
- Copy Number (Ni) – the number of identical molecules counted
Objects high in both Ai and Ni are defined as complex; molecules where Ai is greater than 15 steps and Ni is greater than 10,000 copies always come from a living entity [19,20,21]. The choice of 15 steps is based on experimental and mathematical evidence showing that abiotic chemical systems cannot randomly produce molecules with an Assembly Index ≥15 steps. Similarly, 10,000 identical molecules were selected as this is the minimum number of identical units detectable by nuclear magnetic resonance [22].
Deoxyribonucleic acid (DNA) is an example of a high Ai and Ni molecule that could only have been created by preexistent life. Assembly Theory categorizes our genome as consistent of highly complex molecules considering it requires >15 steps to create each individual strand (high Ai) and exists nearly identically in each of the human body’s 10 billion bone marrow cells (high Ni) [23,24]. In juxtaposition, atmospheric oxygen (O2) would be an example of a simple molecule. While it has a high Ni in the atmosphere, it has a low Ai, often resulting from a < 15 step process such as the product of simple inorganic decomposition [25]. For example, the O2 on Jupitar’s moon Ganymede is likely from the ultraviolet irradiation of water not aerobic respiration [26]. Additional examples are shown in Table 1.
Modern Ultra-Processed Food (UPF), as defined by the Nova Classification, is similar to atmospheric oxygen; its components have high Ni but low Ai; they are refined but simple [27]. Refined oils (fats), carbohydrate monomers (sugars), and reconstituted soy bean isolates (proteins) are used to create the plethora of UPF associated with negative health outcomes [13,28]. While these ingredients possess high Ni from refining, the complex food matrix is reduced to the constituent building blocks [29]. These foods do not contain the abundance of complex molecules found in whole foods [30]. For instance, while average supermarket shelf pastry may contain 40 simple ingredients including artificial preservatives, apples contain hundreds of distinct phytochemicals, including a variety of flavonoids, phenolic acids, and antioxidants, which have been linked to various health benefits [31]. This loss of complexity removes plant compounds critical for regulating inflammation, supporting the microbiome, and preventing chronic disease [32,33,34].
Assembly Theory, initially applied to physical objects, can also be extended to abstract constructs which exhibit complexity arising from cumulative interactions and evolving components [19,22]. For example, social behavior exhibits greater complexity than passive activities like eating alone while watching television. A sea anemone, which evolved underwater millions of years before humans walked on land, can observe its environment while consuming food but lacks the capacity for nuanced political or emotional discussions—skills that require significantly more assembly time to develop [35]. Assembly time is the total time spent in constructing an object or concept, including the time encoded in the processes and patterns that guide its recreation, rather than just the immediate creation of the object itself [19]. Social engagement is more complex than passive behaviors due to the extensive assembly time required to develop the intricate interactions and patterns involved in meaningful community connections [36].
The principles of Assembly Theory suggest that behaviors requiring greater assembly time and structural complexity are fundamentally distinct from frequent but less intricate behaviors. For example social interaction is more complex than passive solitary behaviors because it requires the integration of cognitive, emotional, and social cues in real time while solitary behaviors typically involve fewer variables and less cognitive load, as they do not demand the same level of social processing [37]. FFB can also be analyzed through this lens. Some dietary patterns and eating behaviors demand higher levels of novelty and structured assembly, distinguishing them from simpler, repetitive consumption habits [38].
FFB complexity arises from molecular and social complexity. Whole foods contain a variety of bioactive compounds, fibers, and phytochemicals, whereas processed foods strip away this complexity in favor of uniformity, stability, refinement, and shelf-life [31]. Similarly, eating behaviors that involve social engagement or environmental variability introduce additional layers of structural and cognitive complexity [38]. By applying Assembly Theory, we can systematically categorize and measure these variations, providing a quantitative framework for understanding the dietary impact on health.
Since Assembly Theory allows for the quantification of molecules and phenomena [19]. Within this framework, we hypothesized that food and food behavior (FFB) with high complexity, measured by elevated Assembly Index (Ai) and Copy Index (Ni), correlated with behaviors and diets known to promote health, enabling the quantification of healthy FFB. This paper outlines the development and validation of the GARD, a framework for quantifying FFB complexity using Assembly Theory, establishing a foundation for future studies to assess its relationship between complexity and wellness outcomes.
2. Materials and Methods
With the ability to quantify FFB based on Assembly Theory, the GARD was designed to simplify all FFB into two categories: high and low complexity.

Table 1.
- Quantifiable Food and Food Behavior Categories.
| Quantifiable Food and Food Behavior Categories | |||
| High Complexity Diet | Point Value | Low Complexity Diet | Point Value |
| Farm Direct Animal Product | (+1) | Processed Animal Product | (-1) |
| Fresh Plants | (+1) | Processed Ingredient | (-1) |
| Fermented Foods | (+1) | Refined Ingredient | (-1) |
| Fasting (Autophagy) | (+7) | Ultra-Processed Food | (-1) |
| High Complexity Behavior | Point Value | Low Complexity Behavior | Point Value |
| Social Eating | (+1) | Distracted Eating | (-1) |
| Outside Eating | (+1) | Over consumptive Eating | (-1) |
Data Collection Methods
A printable survey was designed to quantify the complexity of food consumed and associated food behaviors (see Figure 1). The GARD has two components: collecting a food diary and grading the food diary. Covered below are the different aspects of the survey: collecting the food diary, defining what can be counted as a point, and determining if a point is high or low complexity.
Collecting the Food Diary
The survey is most similar to others which quantify abstract concepts like cognition, such as the Montreal Cognitive Assessment (MoCA), in that it requires two people to perform correctly: the provider and the patient [39]. In the GARD, the provider reads through each of the eight questions, stopping at question 8 or stopping if the patient answers “no” to questions 1, 3, or 6.
If a patient answers question 3 indicating their food was prepared outside the home, they receive a (-1) for the refined ingredient variable, and the administrator moves to the next eating window. This choice ensures an accurate assessment of food quality by prioritizing meals with fully known ingredients. Moreover, research consistently links eating out to poorer diet quality and complexity—showing increased energy, saturated fat, sugar, and sodium intake, along with decreased fiber, fruit, and micronutrient consumption—which supports the negative scoring for refined ingredients in the GARD [40,41,42].
The set of questions is repeated for each of the six daily eating windows to ensure all FFB are accounted for in the diary. As the patient states all FFB from the prior day, each response is graded according to the criteria below.
Question 4 may require clarification to determine the ingredients in a meal. If a patient states they ate a ham sandwich, the provider must ask what was in the sandwich. Each individually purchased or collected item should be given a point. For example, the sandwich may contain white bread, deli ham, tomatoes, lettuce, and mustard. Each of these five ingredients would receive a point and be categorized as high or low complexity.
Defining a Point
A point is assigned for each individually purchased or collected item. For instance, one picked or purchased tomato is a single item, so it receives a single point. Additionally, one purchased processed pastry is identified as one point despite being comprised of over 40 ingredients. Whether a point is assigned in the low or high complexity category is discussed below.
Grading of High Complexity Variables
High complexity markers are characterized by FFB which are the result of high Ai, Ni. These include fresh plant ingredients, farm-direct animal products, and fermented food. Additionally, behaviors such as fasting, social eating and eating outdoors are considered high complexity eating behaviors.
Fresh Plant
A point will be given for every unique plant in a patient’s diet. If a patient eats a salad with seven unique plants and spices the provider will tally an additional seven high complexity points. Note that a type of plant can only be counted once. If a patient eats a tomato for lunch and dinner, that is still 1 point.
A plant can only be counted once because the diversity of plants in the diet—rather than the quantity of any single plant—is the strongest predictor of gut microbiome diversity and complexity. Individuals who consumed at least 30 different types of plants per week have significantly greater microbial complexity compared to those who eat fewer plant types. The microbiome benefits most from a wide range of plant-derived fibers, polyphenols, and prebiotics. Variety, not redundancy, is what drives microbiome diversity and complexity [43].
Farm Direct Animal Product
A point will be given for every unique dairy, seafood or meat item a patient ate provided the animal product came from a fisherman, farmer, or rancher known by the patient or a friend of the patient. This distinction of complex animal products only being from sources that are less than or equal to 2 degrees of separation addresses the need for fresh meat with molecules that have not been degraded by extended supply chains and preservation ingredients [44]. Concerning honey, given the presence of enzymes and essential vitamins honey is a part of a high complexity diet [45].
Fermented Food
An additional point will be given if the plant product is fermented to account for the complexity of the microbiota in the food. For example, sauerkraut has three ingredients: salt, water, and cabbage, which would only be considered one point. However, it is the cabbage’s microbiome that proliferates in the salty brine to give the characteristic tangy taste. This microbiome is another complex ingredient [46]. Therefore, fermented foods receive an additional point to account for the complexity of the microbiota.
Fasting (Autophagy)
Autophagy begins around 12–13 hours of fasting, peaking between 18 and 24 hours [47]. Since autophagic processes originate from living tissue, they represent a rich source of biological complexity [48]. Patients who intentionally fast for more than 12 hours receive 7 points per skipped meal, aligning fasting with the complexity value of a high-complexity meal. Clinicians should confirm that fasting is a deliberate and appropriate choice, as involuntary food deprivation due to economic or social factors is classified as starvation. For clinical practice, appropriate fasting should be limited to individuals >18 years old and with a body mass index (BMI) >20 [49]. Fasting is classified as a dietary choice and not a behavior because it changes what a person eats, not just the way food is consumed.
Social Eating
A point is given for each meal shared with at least one other person. Social eating introduces unpredictability as conversations, social cues, and external influences shape the experience. Eating in a crowded space without interaction does not qualify for a +1 point. From an evolutionary perspective, the assembly space for social eating is more constrained than solitary eating, as the structures enabling social interaction had to first evolve and be conserved [50].
Outside Eating
A point is given for meals consumed outdoors in natural settings. Exposure to fluctuating environmental conditions—such as temperature, wind, and ambient sounds—adds dynamic complexity, absent in controlled indoor spaces. In evolutionary terms, eating in a dynamic environment represents a less constrained assembly space than eating in a static one, as homeostatic mechanisms had to evolve to adapt to environmental variability [51].
Grading of Low Complexity Variables
Low complexity FFB are characterized by primarily low Ai. These include processed ingredients, refined ingredients, processed animal products, and ultra-processed foods. Additionally, distracted eating and over-consumptive eating are considered low complexity.
Processed Ingredients
Processed ingredients are synthesized additives and chemicals absent in whole foods. These include artificial sweeteners (e.g., sucralose), preservatives, emulsifiers, and industrial compounds that extend shelf life, enhance flavor, or modify texture. These additives simplify food complexity. An apple’s flavor and texture arise from hundreds of high Ai molecules, while an apple-flavored pastry relies on less than forty low Ai molecules [31].
Any store-bought food that contains a processed ingredient is considered low complexity. However, if a processed ingredient is added to a high-complexity food by personal choice, the food itself remains high complexity. For example, black coffee earns one high-complexity point. Adding sucralose (Splenda) introduces one low-complexity point, resulting in a net score of zero rather than a negative score.
Refined Ingredients
Refined ingredients are stripped-down versions of whole foods, losing fiber, micronutrients, and bioactive compounds [52]. Examples include white rice, sugar, seed oils, and white flour. These ingredients create uniform, energy-dense products with minimal complexity. Refined sugar in a homemade cookie earns a low complexity point, as does a store-bought pastry or drink with added sugar.
Processed Animal Products
Processed animal products—such as deli meats, fast-food burgers, and preserved sausages—are shelf-stable, ultra-processed meats sourced from food systems typically three or more steps removed from the consumer. These items undergo extensive modification through curing, salting, or chemical additives [53]. In contrast, farm-direct meat from farmers' markets, usually pasture-raised and minimally processed, contains significantly higher levels of omega-3 fatty acids, conjugated linoleic acid (CLA), and fat-soluble vitamins A and E due to the animals’ forage-based diets [54,55]. Shorter storage times also help preserve these nutrients by reducing oxidative and enzymatic degradation [56,57]. While processed meat remains chemically dense and highly repetitive at the molecular level, it is less complex overall than farm-direct meat, which exhibits a more diverse and functionally rich molecular structure.
Ultra-Processed Foods
Defined by the NOVA classification system, ultra-processed foods (UPFs) are made from refined ingredients and industrial additives, using techniques that degrade the natural food matrix. These products lack intact whole foods and are engineered for convenience, shelf stability, and hyper-palatability. Examples include fast food, sugary cereals, packaged snacks, and frozen meals. In the GARD framework, such foods are scored as low complexity [58].
Distracted Eating
Distracted eating occurs when doing something while eating indoors —driving, working, watching a screen, etc. Lacking social interaction and environmental variability, it happens in controlled, repetitive settings, contrasting with the dynamic nature of social eating [59].
Over Consumptive Eating
Often associated with UPF, the GARD defines Over Consumptive eating as consuming more than one serving in a sitting, prioritizing quantity over diversity. Unlike high complexity behaviors, which adapt to hunger cues, this behavior disregards satiety often driven by UPF and engineered for overconsumption [60]. One cookie earns a low complexity point for being ultra-processed; multiple cookies earn an additional point for each cookie eaten over the recommended serving size. This overconsumption occurs because UPF's hyper-palatable formulations stimulate reward pathways and disrupt natural satiety signals [61,62].
Grading the Food Diary
Each item is categorized as high or low complexity based on the reasoning found in the research design. A breakdown of how the ham sandwich would be graded can be seen in Figure 3.
Survey Distribution
The GARD screener was adapted into an online survey to collect dietary information. Participants answered questions for each of the six daily eating and drinking windows with their responses graded. If a meal was prepared at home or by a friend, additional questions identified the individual ingredients which were then scored. The same process was applied to beverages consumed. The resulting data showed the amount of each variable that was present in a patient’s diet. Use and creation of an online GARD was chosen to shield the study from bias.
After the institutional review board (IRB) exemption of this study, patients in the Internal Medicine Resident Clinic were provided with a link or QR code to complete the GARD as they waited to be seen by a physician. The patients were informed of the study and that their responses would be used for clinical research once patient identity had been de-identified. Patients were allowed to decline participation. Physicians were unaware if the patient had completed the survey and only complete surveys were used for analysis.
Population
The population who took the GARD consisted of patients of an internal medicine residency clinic. Geographically, the clinic was located in a southeastern US hospital system which provides care to an underserved population including uninsured and underinsured individuals. The patient population was diverse, with a high prevalence of chronic conditions such as diabetes, hypertension, and cardiovascular disease. Many patients are older adults with multiple comorbidities.
Statistical Analysis
To assess discriminant and convergent validity, Spearman rho correlations were used. According to Test Theory, similar constructs should show relatively high correlations, while different constructs should show lower or no correlations [63]. In this study, we expected behaviors to correlate strongly with their corresponding diets—for example, high complexity behavior with high complexity diet, and low complexity behavior with low complexity diet. In contrast, we expected weaker or no correlations between mismatched pairs, such as high complexity behavior with low complexity diet, and vice versa. Additionally, we anticipated that each diet would show weaker or inverse correlations with behaviors or diets of the opposite complexity level compared to the stronger correlations observed between aligned types.
3. Results
The GARD was internally validated using face, convergent, and discriminant validity testing methods.
Internal Validity
Face Validity
To establish expert consensus on complexity classification, a grading system was developed to assess the Ai and Ni of each variable.
1 – Extremely Low
2 – Very Low
3 – Low
4 – Low-Moderate
5 - Moderate
6 - High-Moderate
7 – High
8 – Very High
9 – Extremely High
The Ai and Ni scores for each variable were summed with a threshold of 16 points established for categorizing a high-complexity FFB. Variables scoring 16 or higher received a (+1) GARD score while those scoring below 16 were assigned a (-1) GARD score.
Once the Ai and Ni values were finalized by the expert panel (see Table 1, Table 2, Table 3 and Table 4), the results confirmed that only variables identified as highly complex a priori met the high-complexity threshold. Conversely, all low-complexity variables scored below this threshold.
Table 2.
– Example of How the GARD would score a generic Ham Sandwich.
| Complexity Grade for a Generic Ham Sandwich | |||
| Ingredient | Variable | Complexity Grade | Point Value |
| White Bread | Refined Ingredient | Low | (-1) |
| Deli Ham | Processed Animal Product | Low | (-1) |
| Mustard | Processed Ingredient (Food Dye) | Low | (-1) |
| Tomato | Fresh Plant | High | (+1) |
| Lettuce | Fresh Plant | High | (+1) |
| GARD Score = “High Complexity Total” subtracted by “Low Complexity Total” = (-1) | |||
Table 3.
– Expert Consensus on Complexity Scores for Food Categories.
| Category | Variable | Ai (Assembly Index) of Average Molecule | Ni (Copy Number) of Average Molecule | Total |
GARD Score |
| High Complexity |
Fresh Plant | 9 (Extremely High) | 9 (Extremely High) | 18 | (+1) |
| Healthy Animal Product | 9 (Extremely High) | 9 (Extremely High) | 18 | (+1) | |
| Fermented Food | 9 (Extremely High) | 9 (Extremely High) | 18 | (+1) | |
| Autophagy (Fasting) | 9 (Extremely High) | 9 (Extremely High) | 18 | (+1) | |
| Low Complexity |
Processed Ingredient | 3 (Low) | 8 (Very High) | 11 | (-1) |
| Refined Ingreient | 2 (Very Low) | 9 (Extremely High) | 11 | (-1) | |
| Processed Animal Product | 7 (High) | 8 (Very High) | 15 | (-1) | |
| Ultra-Processed Food | 1 (Extremely Low) | 9 (Extremely High) | 10 | (-1) |
Table 4.
Explanation of Expert Consensus on Complexity Scores for Food Categories.
| Category | Variable | Internal Validity in Assembly Theory |
| High Complexity |
Fresh Plant | Fresh plants contain diverse, complex biomolecules (e.g., polyphenols, fibers) requiring many synthetic steps (Extremely High Ai), with widespread repetition in plant tissue (Extremely High Ni). |
| Farm Direct Animal Product | Whole animal products (meat, seafood) have structured proteins, fats, carbohydrates and nucleic acids (Extremely High Ai) with considerable repetition within a given tissue (Extremely High Ni). | |
| Fermented Food | Fermentation increases biochemical complexity via the presence of microbiotic life (Extremely High Ai) with high molecular repetition within individual bacteria (Extremely High Ni). | |
| Autophagy (Fasting) | Autophagy recycles highly structured biomolecules, organelles, glycogen, fatty acid chains (Extremely High Ai), which exist in repeating cell types with in a tissue (Extremely High Ni). | |
| Low Complexity |
Processed Ingredient | Processed ingredients are designed for easy manufacturing (Low Ai) at large volume (Very High Ni) |
| Refined Ingredient | Industrial processing simplifies molecular structure taking complex biomolecules (i.e. Amylopectin) and turning them into simplified molecules (i.e. Glucose, Fructose) (low Ai) while increasing uniformity and repetition (very high Ni). | |
| Processed Animal Product | Research shows measurable differences in nutritional complexity between processed meat and farm-direct, pasture-raised meat. Specifically, meat from farmers' markets—typically pasture-raised and minimally handled—contains significantly higher levels of omega-3 fatty acids, conjugated linoleic acid (CLA), and fat-soluble vitamins like A and E [54,55]. These nutrients result from the animals’ forage-based diets and shorter storage times, which help preserve delicate compounds and vitamins [56,57]. In contrast, processed meat, while chemically dense and uniform, lacks this diversity and freshness. As a result, since processed meat exhibits contains less complex molecule (high Ai) compared to farm-direct meat, which contains a more varied and functionally rich molecular structure. However, processed meat still retains a high number of repeated molecules through out the tissues (Very High). | |
| Ultra-Processed Food | Ultra-processed foods by definition contain manufactured ingredients (extremely low Ai) and refined ingredients that are mass-produced and highly repetitive (extremely high Ni). |
Table 5.
- Expert Consensus on Complexity Scores for Food Behaviors.
| Category | Variable | Ai (Assembly Index) of Average Molecule | Ni (Copy Number) of Average Molecule | Total |
GARD Score |
| High Complexity Behavior |
Social Eating | 8 (High) | 8 (High) | 16 | (+1) |
| Outside Eating | 8 (High) | 8 (High) | 16 | (+1) | |
| Low Complexity Behavior |
Distracted Eating | 4 (Low) | 9 (Extremely High) | 13 | (-1) |
| Over-Indulgent Eating | 3 (Very Low) | 9 (Extremely High) | 12 | (-1) |
Table 6.
Explanation of Expert Consensus on Complexity Scores for Food Behaviors.
| Category | Internal Validity in Assembly Theory |
| High Complexity Behavior |
Social eating requires complex social structures, communication, and shared rituals (high Ai). It has been a fundamental aspect of human evolution across cultures and time (high Ni). |
| Eating in dynamic outdoor environments requires physiological adaptation to variable conditions (high Ai). This behavior was the norm for most of human history (high Ni). | |
| Low Complexity Behavior |
Eating while distracted lacks engagement with environmental and social cues, reducing behavioral complexity (low Ai). It is a modern behavior that has become widespread (extremely high Ni). |
| Overeating prioritizes quantity over adaptive responses to hunger and social context, diminishing behavioral complexity (very low Ai). Engineered food environments have made it exceedingly common (extremely high Ni). |
Given the above scores show all high complexity items meet the cut off of 16 points and the low complexity items do not meet the cut off, the GARD passed face validation.
Convergent Validity
An online survey was designed to collect data on patients' diets and behaviors following the GARD framework. Given the data structure, nonparametric correlations (Spearman rho) were used to test for convergent validity. Analysis of the survey data demonstrated:
Strong positive correlation between high-complexity FFB, rho=.533, p<.001.
A strong positive correlation between low-complexity FFB, rho=.565, p<.001.
These results suggest convergent validity as the Spearman correlations indicate strong positive correlations among constructs of the same complexity.
Discriminant Validity
Similarly to convergent validity testing and given the data structure, nonparametric correlations (Spearman rho) were used to test discriminant validity. Analysis of the survey data demonstrated:
A moderate negative correlation between high and low complexity diets, rho= -.363, p<.05.
A moderate negative correlation between high and low complexity behaviors, rho= -.425, p<.01.
Given the lower correlations among the discriminant constructs compared to the convergent construct, discriminant validity is confirmed.
Figure 2.
– Graphical Representation of Statistical Results.
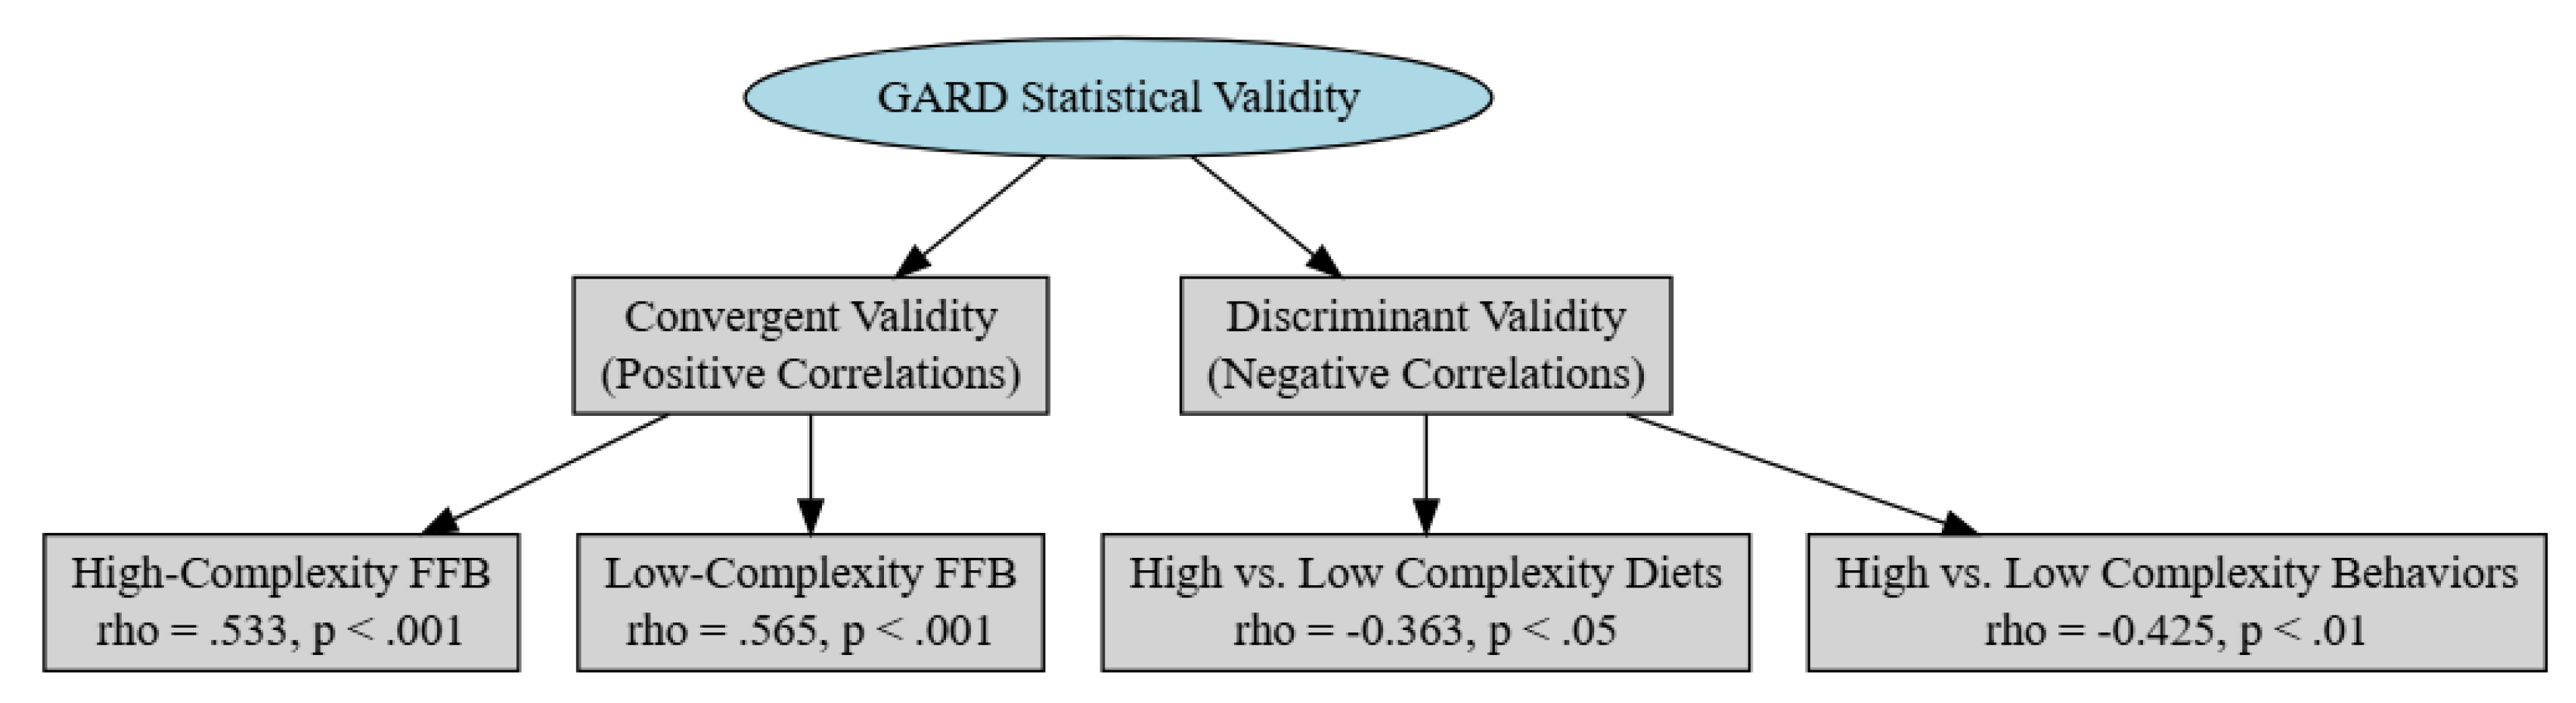
The strong positive correlation between high-complexity diet and high-complexity behavior supports convergent validity. In contrast, the moderate negative correlations between high and low complexity constructs—both in diet (rho = –.363, p < .05) and behavior (rho = –.425, p < .01)—demonstrate discriminant validity, as these relationships are weaker and in the opposite direction compared to the convergent construct.
External Validity
External validity was confirmed by applying the GARD to known healthy and unhealthy diets. The GARD consistently assigned high scores to recognized healthy diets and low scores to unhealthy ones supporting its reliability as a complexity-based dietary assessment tool.
For the GARD to be externally valid it needs to return high scores for established healthy diets and low scores for established unhealthy diets. The chosen healthy diets were the Mediterranean diets and the National Institute of Health (NIH): Healthy Meal Planning Diet; both diets have been shown to be beneficial for human health [64,65]. The GARD scores for each of the Daily Meal Plans (three meals without snacks and only drinking water) were able to discriminate between food sources: store vs. farm bought.
Table 7.
- GARD Scores for Daily Meal plans based on the NIH: Healthy Meal Planning [64].
Table 7.
- GARD Scores for Daily Meal plans based on the NIH: Healthy Meal Planning [64].
| NIH: Healthy Meal Planning: Tips for Older Adults | ||
| GARD Score | ||
| Daily Diet (Total GARD score for 3 Meals) |
Store Bought | Farm Bought All Homemade |
| Daily Meal Plan 1 | 16 | 27 |
| Daily Meal Plan 2 | 14 | 22 |
| Daily Meal Plan 3 | 12 | 25 |
| Average | 14 | 23 |
Table 8.
- GARD Scores for Daily Meal plans based on the Mediterranean Diet [65].
Table 8.
- GARD Scores for Daily Meal plans based on the Mediterranean Diet [65].
| GARD Score for Daily Mediterranean Diets | ||
| GARD Score | ||
| Daily Diet (Total GARD score for 3 Meals) |
Store Bought | Farm Bought All Homemade |
| Daily Meal Plan 1 | 19 | 27 |
| Daily Meal Plan 2 | 17 | 22 |
| Daily Meal Plan 3 | 7 | 13 |
| Average | 14 | 21 |
Table 9.
- GARD Scores for Daily Meal plans based on an 80% UPF Diet [66].
Table 9.
- GARD Scores for Daily Meal plans based on an 80% UPF Diet [66].
| 80% Ultra-Processed Food Diet | ||
| GARD Score | ||
| Daily Diet (Total GARD score for 3 Meals) |
Store Bought | Farm Bought All Homemade |
| Daily Meal Plan 1 | 1 | N/A |
| Daily Meal Plan 2 | -10 | |
| Daily Meal Plan 3 | 1 | |
| Total | -1 | |
Table 10.
- GARD Scores for Daily Meal plans based on the Standard American Diet [67].
Table 10.
- GARD Scores for Daily Meal plans based on the Standard American Diet [67].
| Standard American Diet | ||
| GARD Score | ||
| Daily Diet (Total GARD score for 3 Meals) |
Store Bought | Farm Bought All Homemade |
| Daily Meal Plan 1 | -12 | N/A |
| Daily Meal Plan 2 | -8 | |
| Daily Meal Plan 3 | -9 | |
| Average | -10 | |
The GARD was able to evaluate diets established to be unhealthy such as the Standard American Diet and an 80% Ultra-Processed Food Diet. On average, established unhealthy diets had a lower score than healthy diets.
A detailed breakdown of the grading for each diet, meal, and ingredient across the four dietary patterns is available in the supplementary document.
4. Discussion
The GARD provides a novel framework for understanding food complexity beyond traditional nutritional assessments. While conventional models focus on macronutrient content and caloric density, the GARD applies Assembly Theory to emphasize molecular structure and organizational complexity [19]. Humans continuously regenerate at the molecular level, yet maintain a consistent identity through a persistent structured pattern [68]. Similarly, food maintains essential patterns of macro and micronutrients—containing fiber, phytochemicals, and microbiota, all of which contribute to health outcomes [69,70,71]. Assembly Index (Ai) and Copy Number (Ni) offer new ways to distinguish between foods that appear similar under conventional classifications. For example, both crackers and potatoes contain carbohydrates, but a potato’s high Ai extensively branched Amylopectin structure is more complex than a cracker’s low Ai monomers [72]. This distinction highlights the potential for the GARD to refine dietary assessments and differentiate between nutrient-dense and ultra-processed foods.
The GARD provides a structured method to quantify FFB, which offers potential applications in both research and clinical practice. By distinguishing between high- and low-complexity diets, it could serve as a tool for dietary intervention studies, personalized nutrition counseling, and public health assessments.
In clinical practice, the GARD can track changes in a patient's diet over time, providing an objective measure of dietary improvement or decline. Many patients perceive their diet as healthy but fail to recognize the actual poor quality of their diet [73]. By assigning a quantifiable score, the GARD offers a concrete number helping patients understand the true impact of their food choices.
In public health, the GARD could inform policy by discouraging monetary support of diets that fall below a certain GARD score. The GARD could support state and federal resources for prioritizing access to high-complexity foods, by redirecting subsidies from low-complexity ultra-processed foods to local farmers' markets. This approach could improve population health choices by making nutritionally rich, complex foods more accessible to underserved communities [74].
Future research should explore GARD’s predictive value in longitudinal studies, assessing whether higher dietary complexity scores correlate with improved health outcomes over time. Additionally, integrating GARD with biomarker analysis, such as Hemoglobin A1C, could further establish its utility as a dietary assessment tool in metabolic and aging research. For instance future studies could descibe if there was a correlation between increased GARD score and reduced Hemoglobin A1C.
The GARD uniquely quantifies eating behaviors by recognizing that shared, mindful meals significantly enhance overall health. By measuring factors such as eating together and focusing attention during meals—rather than eating while distracted—the GARD captures essential elements of dietary patterns that traditional assessments often overlook. Social and mindful eating behaviors are particularly impactful. Studies link shared meals with improved nutrient intake [75], while distracted eating has been associated with reduced self-regulation and worse metabolic health. [76]. The GARD incorporates these evidence-based principles by objectively measuring eating behaviors such as social engagement and attention during meals.
Additionally, the GARD minimizes patient bias by having individuals recount only the previous day's food intake, while healthcare providers objectively assess and assign a dietary grade based on standardized data. This process should reduce subjectivity and improves reliability.
Moreover, the GARD provides patients with a tangible numerical score that serves as an achievable target for incremental dietary improvement. By focusing on small, consistent changes—such as increasing a score from 2 to 3—patients are encouraged to develop sustainable habits, rather than attempting rapid, large-scale dietary overhauls that frequently fail. This gradual approach harnesses the power of incremental change leading to lasting improvements in diet and overall health.
Limitations
When predicting overall dietary health, GARD assumes that dietary complexity exhibits low variability, implying that most individuals maintain a consistent level of complexity from day to day. This might not be true and may overlook natural fluctuations in eating patterns. Future studies employing month-long food diaries could better assess daily variability in GARD scores.
Although a previous-day recall minimizes recall bias compared to longer recall periods, self-reported dietary data remains inherently prone to errors such as underreporting or overreporting, particularly for unhealthy or socially undesirable foods. Memory limitations, misestimation of portion sizes, and unconscious omissions further compromise data accuracy. To enhance reliability, future studies could examine whether awareness of grading criteria influences recall accuracy, given patients are unaware of how the GARD is graded.
An additional limitation of the GARD framework stems from its reliance on Assembly Theory, which has faced scrutiny for overstating its explanatory power [77]. This raises concerns about whether Ai and Ni fully capture the complexity relevant to dietary health outcomes. Without further empirical validation linking these metrics to nutritional impacts, the framework’s theoretical foundation may overpromise its practical utility, necessitating a more restrained interpretation of its current capabilities.
Additionally, while the study demonstrated strong internal and convergent validity, external validity is limited by the specific population sampled. The participants were drawn from a single medical center serving an underserved population which may not fully represent broader demographic or cultural variations in diet and behavior. Further research in diverse populations is needed to confirm the generalizability of GARD scores.
5. Conclusions
This study introduces the GARD as a tool for quantifying dietary and behavioral complexity using Assembly Theory. By applying Ai and Ni as measures of structured complexity, the GARD successfully distinguishes between high- and low-complexity FFB, aligning with established healthy and unhealthy dietary patterns.
The validation process demonstrates strong internal validity, with predefined complexity classifications aligning with expert consensus, and external validity, as the GARD reliably scored known healthy diets higher than unhealthy ones. The strong correlations observed between high-complexity diets and behaviors, as well as between low-complexity diets and behaviors, further support the framework’s utility in assessing FFB.
While promising, further validation across diverse populations is needed to enhance the GARD’s applicability. Future research should explore how GARD scores correlate with long-term health outcomes and whether interventions based on increasing dietary complexity can predict or improve wellness. By providing a structured method to quantify FFB complexity, the GARD represents a step toward a more systematic approach to understanding the relationship between diet, behavior, and health.
Supplementary Materials
The following supporting information can be downloaded at the website of this paper posted on Preprints.org.
Author Contributions
For this research article, the contributions of the authors are as follows: Conceptualization was led by O’Connell Penrose. The methodology was developed by O’Connell Penrose, Hardeep Singh, and Ania Rynarzewska. Software development was handled by O’Connell Penrose and Ania Rynarzewska. Validation was conducted by O’Connell Penrose, Hardeep Singh, Ania Rynarzewska, and Louise Jones. Formal analysis was performed by O’Connell Penrose and Ania Rynarzewska. The investigation was carried out by O’Connell Penrose, Phillip Gross and Crystal Ayazo, with resources provided by O’Connell Penrose and Crystal Ayazo. Data curation was managed by O’Connell Penrose and Ania Rynarzewska. The original draft was prepared by O’Connell Penrose, and the writing—review and editing was completed by O’Connell Penrose, Hardeep Singh, and Ania Rynarzewska. Visualization was done by O’Connell Penrose and Hardeep Singh. Supervision was provided by Louise Jones. Project administration was handled by O’Connell Penrose, Phillip Gross and Crystal Ayazo, and funding acquisition was secured by O’Connell Penrose and Louise Jones. IRB filing and project management was done by Hardeep Singh. Data collection is monitored by Hardeep Singh. All authors have read and approved the final manuscript. Authorship is limited to those who have contributed substantially to the work reported.
Funding
This research received no external funding.
Institutional Review Board Statement
The study was conducted in accordance with the Declaration of Helsinki, and determined to be exempt by IRB, as this included an educational survey and was exempted from review under the US Department of Health and Human Services 45 code of Federal regulation 46.104 (d)(2). IRB approval number was 2196006-2 issued by Brenau University IRB. Informed Consent Statement: Patient consent was waived as the study was approved by IRB to be exempted as it was no more than minimal risk. However, it was ensured that participants received information about the study and their participation or decline of participation did not affect their care at the facility where the survey link was shared with participants. .
Data Availability Statement
The raw data supporting the conclusions of this article will be made available by the authors on request.
Acknowledgments
The authors have no acknowledgments to declare.
Conflicts of Interest
The authors declare no conflicts of interest.
Abbreviations
The following abbreviations are used in this manuscript:
| Ai | Assembly Index |
| Ni | Copy Number |
| FFB | Food and Food Behavior |
| GARD | Guide Against Age-Related Disease |
| UPF | Ultra-Processed Food |
| MoCA | Montreal Cognitive Assessment |
| NIH | National Institutes of Health |
| PUFA | Polyunsaturated Fatty Acid |
References
- F. Juul, G. Vaidean, and N. Parekh, “Ultra-processed Foods and Cardiovascular Diseases: Potential Mechanisms of Action,” Adv. Nutr., vol. 12, no. 5, pp. 1673–1680, Sep. 2021. [CrossRef]
- A.-D. Termannsen, C. S. Søndergaard, K. Færch, T. H. Andersen, A. Raben, and J. S. Quist, “Effects of Plant-Based Diets on Markers of Insulin Sensitivity: A Systematic Review and Meta-Analysis of Randomised Controlled Trials,” Nutrients, vol. 16, no. 13, Art. no. 13, Jan. 2024. [CrossRef]
- L. Seguias and K. Tapper, “The effect of mindful eating on subsequent intake of a high calorie snack,” Appetite, vol. 121, pp. 93–100, Feb. 2018. [CrossRef]
- M. del C. Fernández-Fígares Jiménez, “A Whole Plant–Foods Diet in the Prevention and Treatment of Overweight and Obesity: From Empirical Evidence to Potential Mechanisms,” J. Am. Nutr. Assoc., vol. 44, no. 2, pp. 137–155, Feb. 2025. [CrossRef]
- “The Effect of the Mediterranean Diet on Metabolic Health: A Systematic Review and Meta-Analysis of Controlled Trials in Adults.” Accessed: Apr. 17, 2025. [Online]. Available: https://www.mdpi. 2072.
- A. Crimarco, M. J. Landry, and C. D. Gardner, “Ultra-processed Foods, Weight Gain, and Co-morbidity Risk,” Curr. Obes. Rep., vol. 11, no. 3, pp. 80–92, Sep. 2022. [CrossRef]
- L. S. Grinshpan, S. Eilat-Adar, D. Ivancovsky-Wajcman, R. Kariv, M. Gillon-Keren, and S. Zelber-Sagi, “Ultra-processed food consumption and non-alcoholic fatty liver disease, metabolic syndrome and insulin resistance: A systematic review,” JHEP Rep., vol. 6, no. 1, p. 100964, Jan. 2024. [CrossRef]
- M. Tristan Asensi, A. Napoletano, F. Sofi, and M. Dinu, “Low-Grade Inflammation and Ultra-Processed Foods Consumption: A Review,” Nutrients, vol. 15, no. 6, Art. no. 6, Jan. 2023. [CrossRef]
- Z. Song, R. Song, Y. Liu, Z. Wu, and X. Zhang, “Effects of ultra-processed foods on the microbiota-gut-brain axis: The bread-and-butter issue,” Food Res. Int., vol. 167, p. 112730, May 2023. [CrossRef]
- A. L. Yaroch et al., “Evaluation of Three Short Dietary Instruments to Assess Fruit and Vegetable Intake: The National Cancer Institute’s Food Attitudes and Behaviors Survey,” J. Acad. Nutr. Diet., vol. 112, no. 10, pp. 1570–1577, Oct. 2012. [CrossRef]
- “Barriers and facilitators to undertaking nutritional screening of patients: a systematic review - Green - 2013 - Journal of Human Nutrition and Dietetics - Wiley Online Library.” Accessed: Apr. 17, 2025. [Online]. Available: https://onlinelibrary.wiley.com/doi/10.1111/jhn. 1201.
- A. Tanweer, S. Khan, F. N. Mustafa, S. Imran, A. Humayun, and Z. Hussain, “Improving dietary data collection tools for better nutritional assessment – A systematic review,” Comput. Methods Programs Biomed. Update, vol. 2, p. 100067, Jan. 2022. [CrossRef]
- S. Liang, Y. Zhou, Q. Zhang, S. Yu, and S. Wu, “Ultra-processed foods and risk of all-cause mortality: an updated systematic review and dose-response meta-analysis of prospective cohort studies,” Syst. Rev., vol. 14, no. 1, p. 53, Mar. 2025. [CrossRef]
- W. Chae, Y. J. Ju, J. Shin, S.-I. Jang, and E.-C. Park, “Association between eating behaviour and diet quality: eating alone vs. eating with others,” Nutr. J., vol. 17, no. 1, p. 117, Dec. 2018. [CrossRef]
- Y. Kimura et al., “Eating alone among community-dwelling Japanese elderly: association with depression and food diversity,” J. Nutr. Health Aging, vol. 16, no. 8, pp. 728–731, Aug. 2012. [CrossRef]
- J. V. Matos and R. J. Lopes, “Food System Sustainability Metrics: Policies, Quantification, and the Role of Complexity Sciences,” Sustainability, vol. 13, no. 22, Art. no. 22, Jan. 2021. [CrossRef]
- S. N. Bleich, J. Jones-Smith, J. A. Wolfson, X. Zhu, and M. Story, “The Complex Relationship Between Diet And Health,” Health Aff. Proj. Hope, vol. 34, no. 11, pp. 1813–1820, Nov. 2015. [CrossRef]
- C. W. Compher et al., “Development of the Penn Healthy Diet screener with reference to adult dietary intake data from the National Health and Nutrition Examination Survey,” Nutr. J., vol. 21, no. 1, p. 70, Nov. 2022. [CrossRef]
- A. Sharma, D. Czégel, M. Lachmann, C. P. Kempes, S. I. Walker, and L. Cronin, “Assembly theory explains and quantifies selection and evolution,” Nature, vol. 622, no. 7982, pp. 321–328, Oct. 2023. [CrossRef]
- S. I. Walker, C. Mathis, S. Marshall, and L. Cronin, “Experimental Measurement of Assembly Indices are Required to Determine The Threshold for Life,” Jun. arXiv:arXiv:2406.06826. [CrossRef]
- M. Jirasek et al., “Investigating and Quantifying Molecular Complexity Using Assembly Theory and Spectroscopy,” ACS Cent. Sci., vol. 10, no. 5, pp. 1054–1064, Apr. 2024. [CrossRef]
- S. I. Walker, Life as No One Knows It. 2024.
- N. C. Institute, “DNA Synthesis,” Qeios, Feb. 2020. [CrossRef]
- E. Bianconi et al., “An estimation of the number of cells in the human body,” Ann. Hum. Biol., vol. 40, no. 6, pp. 463–471, Nov. 2013. [CrossRef]
- Z. Lu, Y. C. Chang, Q.-Z. Yin, C. Y. Ng, and W. M. Jackson, “Evidence for direct molecular oxygen production in CO2 photodissociation,” Science, vol. 346, no. 6205, pp. 61–64, Oct. 2014. [CrossRef]
- F.-M. Musacchio, “The far ultraviolet aurora of Ganymede,” text.thesis.doctoral, Universität zu Köln, 2016. Accessed: Mar. 23, 2025. [Online]. Available: http://www.uni-koeln.
- M. M. Lane et al., “Ultra-processed food exposure and adverse health outcomes: umbrella review of epidemiological meta-analyses,” BMJ, vol. 384, p. e077310, Feb. 2024. [CrossRef]
- M. Astawan and A. P. G. Prayudani, “The Overview of Food Technology to Process Soy Protein Isolate and Its Application toward Food Industry,” in World Nutrition Journal, May 2020, pp. 12–17. [CrossRef]
- M. L. D. C. Louzada et al., “Ultra-processed foods and the nutritional dietary profile in Brazil,” Rev. Saúde Pública, vol. 49, no. 0, 2015. [CrossRef]
- R. H. Liu, “Health-Promoting Components of Fruits and Vegetables in the Diet,” Adv. Nutr., vol. 4, no. 3, pp. 384S-392S, May 2013. [CrossRef]
- J. Boyer and R. H. Liu, “Apple phytochemicals and their health benefits,” Nutr. J., vol. 3, no. 1, p. 5, May 2004. [CrossRef]
- F. Escalante-Araiza, G. Rivera-Monroy, C. E. Loza-López, and G. Gutiérrez-Salmeán, “The effect of plant-based diets on meta-inflammation and associated cardiometabolic disorders: a review,” Nutr. Rev., vol. 80, no. 9, pp. 2017–2028, Sep. 2022. [CrossRef]
- S. R. K. Sidhu, C. W. Kok, T. Kunasegaran, and A. Ramadas, “Effect of Plant-Based Diets on Gut Microbiota: A Systematic Review of Interventional Studies,” Nutrients, vol. 15, no. 6, Art. no. 6, Jan. 2023. [CrossRef]
- H. Peña-Jorquera et al., “Plant-Based Nutrition: Exploring Health Benefits for Atherosclerosis, Chronic Diseases, and Metabolic Syndrome—A Comprehensive Review,” Nutrients, vol. 15, no. 14, Art. no. 14, Jan. 2023. [CrossRef]
- L. D. Crerar, “Review: Aquagenesis: The Origin and Evolution of Life in the Sea, by Richard Ellis,” Am. Biol. Teach., vol. 66, no. 8, pp. 579–580, Oct. 2004. [CrossRef]
- K. A. Bard, “Social Cognition: Evolutionary History of Emotional Engagements with Infants,” Curr. Biol., vol. 19, no. 20, pp. R941–R943, Nov. 2009. [CrossRef]
- “Mechanisms of Social Cognition | Annual Reviews.” Accessed: Mar. 24, 2025. [Online]. Available: https://www.annualreviews.org/content/journals/10.1146/annurev-psych-120710-100449.
- G. M. Reséndiz-Benhumea and T. Froese, “Enhanced Neural Complexity is Achieved by Mutually Coordinated Embodied Social Interaction: A State-Space Analysis,” 2020. Accessed: Feb. 27, 2025. [Online]. Available: https://www.semanticscholar.org/paper/Enhanced-Neural-Complexity-is-Achieved-by-Mutually-Res%C3%A9ndiz-Benhumea-Froese/398560644ae1a4f3da7bbbcb12eb856184c72834.
- C. Tromop-van Dalen, K. Thorne, K. Common, G. Edge, and L. Woods, “Audit to investigate junior doctors’ knowledge of how to administer and score the Montreal Cognitive Assessment (MoCA),” N. Z. Med. J., vol. 131, no. 1477, pp. 91–108, Jun. 2018.
- S. McGuire, “Todd J.E., Mancino L., Lin B-H. The Impact of Food Away from Home on Adult Diet Quality. ERR-90, U.S. Department of Agriculture, Econ. Res. Serv., February 2010,” Adv. Nutr., vol. 2, no. 5, pp. 442–443, Sep. 2011. [CrossRef]
- E. Gesteiro, A. García-Carro, R. Aparicio-Ugarriza, and M. González-Gross, “Eating out of Home: Influence on Nutrition, Health, and Policies: A Scoping Review,” Nutrients, vol. 14, no. 6, p. 1265, Mar. 2022. [CrossRef]
- C. Lachat, E. Nago, R. Verstraeten, D. Roberfroid, J. Van Camp, and P. Kolsteren, “Eating out of home and its association with dietary intake: a systematic review of the evidence,” Obes. Rev. Off. J. Int. Assoc. Study Obes., vol. 13, no. 4, pp. 329–346, Apr. 2012. [CrossRef]
- D. McDonald et al., “American Gut: an Open Platform for Citizen Science Microbiome Research,” mSystems, vol. 3, no. 3, pp. e00031-18, May 2018. [CrossRef]
- “Advanced meat preservation methods: A mini review - Rahman - 2018 - Journal of Food Safety - Wiley Online Library.” Accessed: Feb. 27, 2025. [Online]. Available: https://onlinelibrary.wiley.com/doi/10.1111/jfs.12467.
- P. M. da Silva, C. Gauche, L. V. Gonzaga, A. C. O. Costa, and R. Fett, “Honey: Chemical composition, stability and authenticity,” Food Chem., vol. 196, pp. 309–323, Apr. 2016. [CrossRef]
- M. A. Zabat, W. H. Sano, J. I. Wurster, D. J. Cabral, and P. Belenky, “Microbial Community Analysis of Sauerkraut Fermentation Reveals a Stable and Rapidly Established Community,” Foods, vol. 7, no. 5, Art. no. 5, May 2018. [CrossRef]
- B. D.M and N. M. Bhamidipati, “Citation: Basavarajaiah DM, Narasimhamurhy B (2020) Predictive Modeling of Autophagy Interrelation with Fasting,” J. Biom. Biostat., vol. 5, p. 102, Dec. 2020.
- M. Bagherniya, A. E. Butler, G. E. Barreto, and A. Sahebkar, “The effect of fasting or calorie restriction on autophagy induction: A review of the literature,” Ageing Res. Rev., vol. 47, pp. 183–197, Nov. 2018. [CrossRef]
- S. D. Anton et al., “Flipping the Metabolic Switch: Understanding and Applying Health Benefits of Fasting,” Obes. Silver Spring Md, vol. 26, no. 2, pp. 254–268, Feb. 2018. [CrossRef]
- R. I. M. Dunbar, “Breaking Bread: the Functions of Social Eating,” Adapt. Hum. Behav. Physiol., vol. 3, no. 3, pp. 198–211, Sep. 2017. [CrossRef]
- “Outdoor time and dietary patterns in children around the world | Journal of Public Health | Oxford Academic.” Accessed: Feb. 27, 2025. [Online]. Available: https://academic.oup.com/jpubhealth/article/40/4/e493/4978076.
- N. J. Temple, “Refined carbohydrates — A cause of suboptimal nutrient intake,” Med. Hypotheses, vol. 10, no. 4, pp. 411–424, Apr. 1983. [CrossRef]
- W. Khalid et al., “Dynamic alterations in protein, sensory, chemical, and oxidative properties occurring in meat during thermal and non-thermal processing techniques: A comprehensive review,” Front. Nutr., vol. 9, Jan. 2023. [CrossRef]
- A. M. Descalzo et al., “Antioxidant status and odour profile in fresh beef from pasture or grain-fed cattle,” Meat Sci., vol. 75, no. 2, pp. 299–307, Feb. 2007. [CrossRef]
- C. A. Daley, A. Abbott, P. S. Doyle, G. A. Nader, and S. Larson, “A review of fatty acid profiles and antioxidant content in grass-fed and grain-fed beef,” Nutr. J., vol. 9, p. 10, Mar. 2010. [CrossRef]
- J. C. Rickman, D. M. Barrett, and C. M. Bruhn, “Nutritional comparison of fresh, frozen and canned fruits and vegetables. Part 1. Vitamins C and B and phenolic compounds,” J. Sci. Food Agric., vol. 87, no. 6, pp. 930–944, Apr. 2007. [CrossRef]
- C. Faustman, Q. Sun, R. Mancini, and S. P. Suman, “Myoglobin and lipid oxidation interactions: mechanistic bases and control,” Meat Sci., vol. 86, no. 1, pp. 86–94, Sep. 2010. [CrossRef]
- C. A. Monteiro et al., “Ultra-processed foods: what they are and how to identify them,” Public Health Nutr., vol. 22, no. 5, pp. 936–941, Apr. 2019. [CrossRef]
- “The Effects of Distraction on Consumption, Food Preference, and Satiety: A Proposal of Methods - Liguori - 2017 - The FASEB Journal - Wiley Online Library.” Accessed: Feb. 27, 2025. [Online]. Available: https://faseb.onlinelibrary.wiley.com/doi/10.1096/fasebj.31.1_supplement.957.
- B. J. Rolls, P. M. Cunningham, and H. E. Diktas, “Properties of Ultraprocessed Foods That Can Drive Excess Intake,” Nutr. Today, vol. 55, no. 3, p. 109, Jun. 2020. [CrossRef]
- K. D. Hall et al., “Ultra-Processed Diets Cause Excess Calorie Intake and Weight Gain: An Inpatient Randomized Controlled Trial of Ad Libitum Food Intake,” Cell Metab., vol. 30, no. 1, pp. 67-77.e3, Jul. 2019. [CrossRef]
- D. M. Small and A. G. DiFeliceantonio, “Processed foods and food reward,” Science, vol. 363, no. 6425, pp. 346–347, Jan. 2019. [CrossRef]
- R. P. McDonald, Test theory: A unified treatment. in Test theory: A unified treatment. Mahwah, NJ, US: Lawrence Erlbaum Associates Publishers, 1999, pp. xi, 485.
- “Healthy Meal Planning: Tips for Older Adults,” National Institute on Aging. Accessed: Mar. 26, 2025. [Online]. Available: https://www.nia.nih.gov/health/healthy-eating-nutrition-and-diet/healthy-meal-planning-tips-older-adults.
- I. Castro-Quezada, B. Román-Viñas, and L. Serra-Majem, “The Mediterranean Diet and Nutritional Adequacy: A Review,” Nutrients, vol. 6, no. 1, pp. 231–248, Jan. 2014. [CrossRef]
- J. M. Hess et al., “Dietary Guidelines Meet NOVA: Developing a Menu for A Healthy Dietary Pattern Using Ultra-Processed Foods,” J. Nutr., vol. 153, no. 8, pp. 2472–2481, Aug. 2023. [CrossRef]
- S. K. Totsch et al., “The impact of the Standard American Diet in rats: Effects on behavior, physiology and recovery from inflammatory injury,” Scand. J. Pain, vol. 17, no. 1, pp. 316–324, Oct. 2017. [CrossRef]
- W. Zixuan, “Continuity of Identity: The Sameness of Self from Childhood to Adulthood,” Commun. Humanit. Res., vol. 18, pp. 140–143, Dec. 2023. [CrossRef]
- A. Lalitha, “Phytochemicals and health benefits,” Ann. Geriatr. Educ. Med. Sci., vol. 11, no. 1, pp. 29–31. [CrossRef]
- J. W. Anderson et al., “Health benefits of dietary fiber,” Nutr. Rev., vol. 67, no. 4, pp. 188–205, Apr. 2009. [CrossRef]
- “Health benefits of fermented foods: Critical Reviews in Food Science and Nutrition: Vol 59, No 3.” Accessed: Mar. 28, 2025. [Online]. Available: https://www.tandfonline.com/doi/10.1080/10408398.2017.1383355?url_ver=Z39.88-2003&rfr_id=ori:rid:crossref.org&rfr_dat=cr_pub%20%200pubmed.
- “Toward an understanding of potato starch structure, function, biosynthesis, and applications - Tong - 2023 - Food Frontiers - Wiley Online Library.” Accessed: Mar. 28, 2025. [Online]. Available: https://iadns.onlinelibrary.wiley.com/doi/10.1002/fft2.223.
- J. L. Thomson, A. S. Landry, and T. I. Walls, “Can United States Adults Accurately Assess Their Diet Quality?,” Am. J. Health Promot. AJHP, vol. 37, no. 4, pp. 499–506, May 2023. [CrossRef]
- K. B. Michels, Bloom,Barry R., Riccardi,Paul, Rosner,Bernard A., and W. C. and Willett, “A Study of the Importance of Education and Cost Incentives on Individual Food Choices at the Harvard School of Public Health Cafeteria,” J. Am. Coll. Nutr., vol. 27, no. 1, pp. 6–11, Feb. 2008. [CrossRef]
- J. A. Fulkerson, N. Larson, M. Horning, and D. Neumark-Sztainer, “A Review of Associations Between Family or Shared Meal Frequency and Dietary and Weight Status Outcomes Across the Lifespan,” J. Nutr. Educ. Behav., vol. 46, no. 1, pp. 2–19, Jan. 2014. [CrossRef]
- F. van Meer, F. de Vos, R. C. J. Hermans, P. A. Peeters, and L. F. van Dillen, “Daily distracted consumption patterns and their relationship with BMI,” Appetite, vol. 176, p. 106136, Sep. 2022. [CrossRef]
- J. Jaeger, “Assembly Theory: What It Does and What It Does Not Do,” J. Mol. Evol., vol. 92, no. 2, pp. 87–92, 2024. [CrossRef]
Figure 1.
– The GARD Survey Instructions and Score Card.

Table 1.
.
| High Assembly Index (Ai) and High Copy Number (Ni) | |
| DNA polymerase | Enzyme with a complex structure (high Ai) Replicated billions of times in biology (high Ni) |
| Apples | Biological structure: cells, tissues, proteins, pigments (high Ai) Harvested globally (high Ni) |
| The English Language | Evolved over thousands of years and formed by thousands of words (high Ai) Recreated with little variation globally (high Ni) |
| High Assembly Index (Ai) and Low Copy Number (Ni) | |
| Experimental protein designs | Synthetic designed for a novel function (high Ai) Novel Molecule after first synthesis (low Ni) |
| Hand Crafted Pastry | Complex structure involving multiple layers, fillings, and precise techniques (high Ai) Produced in small batches by artisanal bakers (low Ni) |
| The Word "Alacrity" | Thousands of years of culture to create the word (high Ai) Infrequently used (Low Ai) |
| Low Assembly Index and High Copy Number | |
| Water (H₂O) | Often a biproduct on single step organic reactions (Low Ai) Found universally in high abundance (high Ni) |
| High Fructose Corn Syrup | Fructose molecules refined from a source which initially required <15 steps to assemble the carbohydrate (Low Ai);* Produced globally for sweeteners (high Ni) |
| The Sound of a Rock Falling on Impact | Created by a single step process (low Ai) Occurs universally (high Ni) |
| *Refining does not increase Ai as Ai represents the minimal number of steps needed to build an object using reusable parts. | |
| Low Assembly Index and Low Copy Number | |
| Nitric oxide radical (NO•) | Simple molecule often a biproduct (Low Ai) Reactive and short-lived (Low Ni) |
| Snowball | Formed by aggregation of ice crystals via simple mechanical action (Low Ai) Individually formed and short-lived (Low Ni) |
Disclaimer/Publisher’s Note: The statements, opinions and data contained in all publications are solely those of the individual author(s) and contributor(s) and not of MDPI and/or the editor(s). MDPI and/or the editor(s) disclaim responsibility for any injury to people or property resulting from any ideas, methods, instructions or products referred to in the content. |
© 2025 by the authors. Licensee MDPI, Basel, Switzerland. This article is an open access article distributed under the terms and conditions of the Creative Commons Attribution (CC BY) license (http://creativecommons.org/licenses/by/4.0/).
Copyright: This open access article is published under a Creative Commons CC BY 4.0 license, which permit the free download, distribution, and reuse, provided that the author and preprint are cited in any reuse.


