
Submitted:
01 July 2025
Posted:
02 July 2025
You are already at the latest version
Abstract
This research examines road users' willingness to pay for enhanced active mobility infrastructure at King Mongkut's Institute of Technology Ladkrabang (KMITL), a suburban university campus in Bangkok, Thailand. The study addresses the need for sustainable transportation solutions in middle-income urban environments by analyzing factors that influence walking and cycling adoption among university community members. The research employed a comprehensive mixed-methods framework combining qualitative SWOT analysis, a stated preference survey of 400 participants, and binary logistic regression modeling. The analysis revealed that specific infrastructure improvements significantly increase the likelihood of active mobility adoption. Rest areas demonstrated the strongest positive association (OR=1.820, p=0.034), followed by CCTV security systems (OR=1.726, p=0.060), protective barriers separating pedestrians and cyclists from motorcycles (OR=1.608, p=0.086), and improved public transport connectivity (OR=2.192, p=0.005). Demographic analysis uncovered notable resistance patterns, with male participants (OR=0.512, p=0.096) and higher-income individuals (OR=0.114, p=0.004) showing reduced willingness to transition from motorized transportation. These findings reflect broader cultural preferences and socioeconomic factors that influence mobility choices in the Thai context. Using the Contingent Valuation Method, the study quantified potential behavioral changes, projecting an 8-16 minute daily increase in active mobility engagement. This enhancement would generate measurable health benefits for individuals and environmental improvements for the broader community. The research contributes valuable insights to the limited body of active mobility literature from Southeast Asian suburban contexts, where car and motorcycle dependency remains dominant. The findings emphasize that safety infrastructure and seamless connectivity are fundamental prerequisites for successful active mobility programs. The study's methodological approach, combining economic valuation through contingent valuation with statistical modeling via logistic regression, provides a replicable framework for similar investigations.
Keywords:
active mobility
; willingness to pay
; sustainable transport
; university campus
; Thailand
; logistic regression
1. Introduction
Active Mobility (AM)—referring to human-powered transportation modes such as walking and cycling—has become a core focus in the transition toward sustainable, equitable, and liveable urban environments. Globally, efforts to promote AM have been driven by goals to reduce air pollution and greenhouse gas emissions, improve public health outcomes, and increase access to urban services (Pucher & Buehler, 2008; WHO, 2021). Countries such as the Netherlands, Japan, and Singapore exemplify integrated policies promoting active travel by combining investments in infrastructure with supportive land-use planning, enforcement, and behavioural change campaigns (Song et al., 2013; Easton & Ferrari, 2015).
In developing regions, however, including Southeast Asia, research on AM remains comparatively sparse. Thailand, as a rapidly urbanizing middle-income country, faces increasing environmental and health challenges due to motorization and urban sprawl. Active mobility presents an opportunity to address these challenges, yet empirical studies evaluating the economic benefits and the public’s willingness to pay (WTP) for AM improvements remain limited. This study seeks to contribute to filling this gap by assessing WTP for AM-related infrastructure enhancements in a suburban context, specifically at King Mongkut’s Institute of Technology Ladkrabang (KMITL), Bangkok, Thailand. University campuses are particularly relevant testbeds for such studies because of their diverse populations and potential for AM adoption (Bordagaray et al., 2015).
Despite isolated efforts to promote walking and cycling infrastructure in Thailand (e.g., bicycle lane initiatives around Rattanakosin Island and Lad Phrao Road), these projects have been largely piecemeal, lacking comprehensive assessment of user preferences, behavioural responses, and economic justifications (Meesit et al., 2023). Prior research on AM at KMITL highlights that while the built environment enables basic pedestrian and cycling activity, significant gaps in safety, accessibility, and continuity deter wider adoption (Meesit et al., 2023).
This study addresses three critical research questions: What is the public’s willingness to pay (WTP) for selected AM improvement measures in a suburban Thai university context? How do demographic and travel behavior characteristics influence WTP for AM measures? And What are the potential behavioral shifts (in walking/cycling duration) that could result from implementing these measures? By using the Contingent Valuation Method (CVM) and binary logistic regression models, this study provides evidence-based insights to support decision-making by local governments, campus authorities, and transportation planners in Thailand and similar contexts. The analysis builds upon the concept of weak complementarity between neighbourhood characteristics and walking behaviour (Saelens & Handy, 2008; Wilson et al., 2012). This theoretical approach posits that as pedestrian environments improve, individuals derive greater utility from walking, making them more willing to support investments in related public goods. Furthermore, it applies the Health Economic Assessment Tool (HEAT) developed by the WHO to frame the health co-benefits of AM in monetary terms (Rabl & Nazelle, 2012). KMITL represents a valuable case study for AM research in Thailand due to its suburban setting, relatively large population of daily commuters, and existing yet underutilized walking and cycling infrastructure. Moreover, as Thailand aspires to develop sustainable urban transport solutions under the National Strategy on Environmentally Sustainable Transport, university campuses like KMITL serve as microcosms for testing integrated AM interventions.
2. Literature Review
The promotion of Active Mobility (AM)—primarily walking and cycling—has gained substantial global traction as part of efforts to reduce greenhouse gas emissions, improve urban liveability, and promote public health (Pucher & Buehler, 2008; WHO, 2021). Numerous international studies have demonstrated that improving walking and cycling infrastructure not only facilitates non-motorized transport but also generates substantial health and environmental benefits (Sælensminde, 2004; Wang et al., 2004).
2.1. Active Mobility Promotion Measures
Extensive research has explored measures for enhancing AM adoption. These include infrastructure improvements, such as wider sidewalks, dedicated bicycle lanes, improved crossings, and lighting (Ibeas et al., 2011; Methorst et al., 2010); behavioral interventions through campaigns and educational programs (Clark, 2017; Easton & Ferrari, 2015); safety measures, including the installation of CCTV, motorcycle barriers, and pedestrian prioritization at intersections (Sansanee Sangsila, 2012; Pucher & Buehler, 2010); integrated multimodal planning, ensuring seamless connections between walking, cycling, and public transit (Song et al., 2013; Koh & Wong, 2013).
While these measures are widely studied in high-income contexts, Southeast Asian urban environments face unique challenges related to informal transport, tropical climates, and rapid motorization (Pongphonrat et al., 2015; Boon-or & Limpasenee, 2020). In Thailand, few comprehensive evaluations have been conducted on how infrastructure quality affects willingness to engage in active travel, especially in suburban or university environments.
2.2. Economic Appraisal of Active Mobility
Quantifying the economic benefits of AM has become increasingly important in guiding infrastructure investment decisions. The Contingent Valuation Method (CVM) and Choice Modelling (CM) are among the most commonly used methods for assigning monetary value to non-market benefits, such as improved safety or health gains associated with AM (Bateman et al., 2002). Studies using CVM and CM internationally have shown robust benefits. For example, Sælensminde (2004) found that the benefits of walking and cycling infrastructure in Norwegian cities far exceeded costs, with benefit-cost ratios ranging between 2.9 and 14.0. Wang et al. (2004) identified a benefit-cost ratio of 2.94 for combined pedestrian and cycling infrastructure in U.S. communities. Bejranonda & Attanandana (2015) evaluated WTP for bicycle lane maintenance in Bangkok, revealing that factors such as education, income, and environmental attitudes significantly influence WTP. WHO’s HEAT model provides a standard for estimating health-related economic benefits of walking and cycling infrastructure (Rabl & Nazelle, 2012). This tool uses values of statistical life to monetize reductions in mortality risk due to increased physical activity.
Despite growing interest, Thai research on economic valuation of AM remains underdeveloped. Prior works such as Benjasiri (2015) on Bangkok skywalk projects highlight positive WTP for improved pedestrian access, but these remain largely confined to central city areas. Additionally, past studies have focused more on walking than on cycling, despite both being critical components of AM strategies.
2.3. Research Gaps
Notably, the literature reveals three main gaps that this study aims to address: Geographic Gap: Most Thai studies focus on dense urban cores. Suburban contexts, like that of KMITL, remain under-examined despite their potential for AM development. Cycling Underrepresentation: Prior Thai WTP studies disproportionately focus on walking-related infrastructure, leaving bicycle infrastructure and integrated AM systems relatively neglected. Policy Relevance in Middle-Income Settings: While health and environmental benefits are documented, few studies have provided actionable economic valuations that local policymakers in middle-income countries like Thailand can use to justify AM investments.
This study contributes to filling these gaps by estimating WTP for multiple AM improvement measures—including both walking and cycling elements—within a suburban campus in Thailand, using robust econometric analysis. The findings are expected to support policy formulation aligned with Thailand’s National Strategy on Environmentally Sustainable Transport.
2.4. Justification for Using Contingent Valuation Method (CVM)
Given that many benefits of active mobility infrastructure—such as improved safety, environmental quality, and health outcomes—are non-market public goods, the Contingent Valuation Method (CVM) is a particularly suitable approach for eliciting individuals’ willingness to pay (WTP) for such improvements (Bateman et al., 2002; Hanemann, 1994). CVM has been widely applied in transport economics to assess user preferences for hypothetical infrastructure improvements that lack direct market prices (Bejranonda & Attanandana, 2015; Sælensminde, 2004).
Moreover, CVM is advantageous for this study for three reasons. Firstly, relevance to Public Goods: AM infrastructure, especially in suburban educational environments like KMITL, exhibits non-excludable and non-rival characteristics typical of public goods. CVM enables capturing users’ valuation of these improvements in monetary terms. Secondly, suitability for Policy Decision-Making: Economic valuations derived from CVM help translate qualitative preferences into quantifiable metrics, supporting cost-benefit analysis (CBA) frameworks for public-sector investments in Thailand and other middle-income countries. Lastly, precedent in Similar Contexts: Previous Thai WTP studies have successfully employed CVM for evaluating pedestrian infrastructure in urban cores (e.g., Benjasiri, 2015), yet suburban contexts remain underexplored. Applying CVM in this study extends its utility to suburban environments, providing valuable inputs for Thailand’s National Strategy on Environmentally Sustainable Transport. To minimize potential bias often associated with CVM (e.g., hypothetical bias), the study employed a double-bounded dichotomous choice format in the survey instrument, following best-practice recommendations for enhancing precision (Bateman et al., 2002; Hanemann, 1994).
3. Methodology
3.1. Study Area Justification
This study was conducted at King Mongkut’s Institute of Technology Ladkrabang (KMITL) and its surrounding neighbourhoods, representing a suburban university campus within Bangkok, Thailand. Suburban campuses like KMITL provide a valuable context for evaluating Active Mobility (AM) promotion due to their diverse populations of daily commuters—including students, staff, and local residents—and the typical gaps in pedestrian and cycling infrastructure.
KMITL was specifically selected as a representative microcosm of Thailand’s broader urban mobility challenges, particularly in middle-income countries experiencing rapid urbanization and increasing reliance on motorized transport. Despite the campus’s compact and walkable layout, 44% of users still rely on motorcycles, reflecting the country’s strong motorization trend (Boon-or & Limpasenee, 2020). Additionally, 73% of users live within a 3 km radius, making the setting highly suitable for targeted AM interventions. This context aligns with international trends in campus-based AM research (Cervero et al., 2009), offering a scalable model for promoting sustainable transport behaviours in suburban and educational environments across Thailand.
3.2. Research Design
A mixed-methods approach was adopted to identify key AM measures and estimate the public’s willingness to pay (WTP) for them. This design comprised three sequential stages:
3.2.1. Measure Selection Process
To ensure the relevance of measures selected for economic appraisal, the study combined qualitative and quantitative stages: Qualitative Phase: SWOT analyses of walking and cycling at KMITL were conducted using 24 in-depth interviews with students, staff, and local road users (Meesit et al., 2023). This provided rich contextual understanding of AM barriers and priorities. Pilot Survey: A pilot survey with 36 participants was conducted to test the WTP survey instrument. Respondents evaluated six AM-related measures identified from the qualitative stage including development of public transport connections, architectural improvements to pedestrian and bicycle paths, installation of resting areas, enhancements to pedestrian crossings, motorcycle barriers on sidewalks, and security improvements (e.g., lighting, CCTV)
Results from the pilot indicated that three measures emerged as highest-priority interventions based on initial WTP values and qualitative feedback: Development of public transport systems integrated with AM (to improve multimodal connectivity, especially where walkable/bikeable trips alone may be impractical in suburban settings); Architectural improvements of footpaths and bicycle lanes; and A combined package of public transport connectivity with enhanced security features. Note that while public transport itself is not strictly AM, it functions as a complementary mode by supporting “first-mile/last-mile” walking and cycling trips (Pucher & Buehler, 2010; WHO HEAT Guidance, 2021).
3.2.2. Survey Instrument
The final survey employed a double-bounded dichotomous choice format using the Contingent Valuation Method (CVM). Respondents were asked whether they would be willing to pay a stated amount for each measure; based on their answer, they were presented with a higher or lower follow-up bid to estimate their maximum WTP. This approach is widely recommended in environmental and transport valuation studies to reduce bias and increase estimate precision (Bateman et al., 2002). The Contingent Valuation Method (CVM) is a survey-based economic technique used to determine individuals’ WTP for non-market goods by presenting respondents with hypothetical scenarios. In this study, each scenario described specific AM infrastructure improvements, and participants were asked whether they would pay a proposed amount for their implementation.
A double-bounded dichotomous choice format was used to enhance precision and reduce starting point bias. Respondents were first given an initial bid amount and asked for a yes/no response. Depending on their answer, they were subsequently presented with a higher or lower follow-up bid to approximate their maximum WTP (Bateman et al., 2002; Hanemann, 1994).
The underlying utility framework assumes that a respondent will accept a bid B if their perceived utility of the improved AM infrastructure with payment exceeds that of the status quo:
U(Improvement with Payment) ≥ U(Status Quo without Payment)
The probability of accepting a given bid amount can be modeled as:
where:
P(Yes) = 1 / (1 + exp(-(α + βB + γX)))
- P(Yes) = Probability of a respondent accepting the bid
- α = Constant term
- β = Coefficient of the bid amount (expected to be negative)
- B = Bid amount presented to respondent
- γ = Vector of coefficients for explanatory variables
- X = Vector of respondent characteristics (e.g., income, gender, travel behavior)
By analyzing the responses using binary logistic regression, the study estimates how bid amounts and respondent characteristics influence the likelihood of WTP.
3.2.3. Sampling
Given a total study population of approximately 27,357 individuals (including 24,909 students and 2,448 staff at KMITL as of 2020), a sample size of 400 respondents was calculated using Yamane’s formula (1967) with a 5% margin of error. The sample was stratified to ensure representation across key groups: students, academic staff, non-academic employees, and local business operators.
3.2.4. Questionnaire Design
The questionnaire comprised two sections: (1) demographic and travel behaviour questions (e.g., gender, income, travel mode), and (2) AM factor questions (e.g., infrastructure preferences, safety measures). An initial list of 50 AM measures was derived from the qualitative findings, literature review (e.g., Methorst et al., 2010), and Thai AM studies (Pongphonrat et al., 2015). A pilot survey (n=36) tested question clarity and relevance, leading to the selection of 44 measures (Table 1) based on respondent feedback and expert consultation (urban planners, transport engineers). The pilot sample size, while small, aligns with CVM pilot studies (Hanemann, 1994), and its limitations are addressed in Section 6.
3.2.5. Measure Selection
The 44 measures (Table 1) were categorized into five domains: physical infrastructure (e.g., separated lanes), safety/security (e.g., CCTV), amenities (e.g., rest areas), promotion (e.g., media campaigns), and policy (e.g., public transport integration). Measures like public transport connections were included as complementary to AM, enhancing first/last-mile accessibility (Pucher & Buehler, 2008). The selection process ensured alignment with SWOT findings (e.g., addressing “motorcycle threats” with protective barriers) and global AM best practices.

Table 1.
Selected AM measures for quantitative survey.
| Domain | Measure | Description | Source |
| Physical Infrastructure | Separate | Separation of pedestrian and bicycle lanes | SWOT, Pucher & Buehler (2008) |
| Architecture | Beautiful architectural design (e.g., landmarks) | Qualitative interviews | |
| Roof | Pedestrian covered walkways | UddC (2015) | |
| Safety/Security | Motor Protection | Barriers to prevent motorcycles on sidewalks | SWOT, Pongphonrat et al. (2015) |
| CCTV | CCTV in high-risk areas | Qualitative interviews | |
| Safe Crossing | Clear crossings with safety technology | Sansanee Sangsila (2012) | |
| Amenities | Rest Area | Rest areas along paths | SWOT, Methorst et al. (2010) |
| Water Station | Drinking water points | Qualitative interviews | |
| Bicycle Parking | Sufficient bicycle parking | Bordagaray et al. (2015) | |
| Promotion | Promote | Offline/online media campaigns | Qualitative interviews |
| Application | AM information apps | Literature review | |
| Policy | Public Tran | Public transport integration | Pucher & Buehler (2008) |
| Service Centre | Violation notification centres | Qualitative interviews |
3.3. Econometric Analysis
To analyse the factors influencing WTP, binary logistic regression models were employed for each measure. This statistical method estimates the likelihood of a respondent being willing to pay (WTP = 1) versus not willing to pay (WTP = 0), based on a set of independent explanatory variables:
where:
logit(P) = ln(P/(1-P)) = β₀ + β₁X₁ + … + βₙXₙ
- P = probability of WTP for a given measure
- Xₙ = independent variables (e.g., gender, age, income, distance to campus, travel habits, motivation for AM)
- βₙ = estimated coefficients interpreted as odds ratios (Exp(B))
The independent variables were derived from the quantitative questionnaire and included demographic, socioeconomic, and travel-behaviour characteristics (Table 2). A preliminary correlation analysis was conducted to check for multicollinearity among variables. The models were selected based on Nagelkerke R Square values for explanatory strength and statistical significance of individual variables at 90%, 95%, and 99% confidence levels.
3.4. Social Benefit Estimation
To evaluate the overall social benefits of AM promotion, the aggregate WTP of survey respondents was scaled to the study population to estimate potential annual benefits. These were compared with cost estimates for implementing each measure to calculate key economic indicators including Benefit-Cost Ratio (B/C), Net Present Value (NPV), and Economic Internal Rate of Return (EIRR) Sensitivity analysis was conducted to assess the robustness of economic viability under varying assumptions of: Proportion of population benefiting, Operation and maintenance (O&M) costs, and Discount rate.
4. Results and Discussion
4.1. Qualitative Findings: SWOT Analysis
The SWOT analysis (Table 2 and Table 3) revealed key strengths, weaknesses, opportunities, and threats for walking and cycling at KMITL. Walking’s strengths included exercise benefits and cost savings, but weaknesses such as hot weather and long travel times were prominent. Cycling was valued for convenience but hindered by unsafe shared lanes and inadequate bicycle lights. Opportunities for both modes included improved infrastructure (e.g., separated lanes, lighting), while threats such as motorcycle encroachment and poor road surfaces persisted.
4.2. Quantitative Findings: Respondent Characteristics
The survey (n=400) captured a diverse sample: 53% male, 83% under 26 years, 80% students, and 40% with incomes <10,000 THB (~$303 USD, 1 USD = 33 THB in 2021). Most lived within 3 km of KMITL (73%), with 44% using motorcycles and 32% walking as primary modes. Travel costs were low (58% spent ≤20 THB daily), and 84% expressed willingness to switch to AM if infrastructure improved (Table 4).
Figure 1 shows the motivation for the change in walking or cycling behavior of the sample. It was found that the respondents focused on two main issues including 31% of traffic safety, followed by good health at 30%. The least effect of motivation that the sample group responded on behavior change was the promotion campaign from the public and private sector accounted for only 5%. From these results it could be concluded that having health promotion policies and safe infrastructures may be the keys to making people to change travel behavior to AM mode.
4.3. Binary Logistic Regression Results
In this study, a binary logistic regression model was used to determine the factors that influence the change in transportation modes to active mobility (AM). The quantitative questionnaire used in this study yielded 44 variables that were used to construct the Binary Logistic Model. Among these variables, FutureTravBeh was the model dependent variable used to predict future travel behavior. It had two values: 1 (changed) and 0 (unchanged), while the other 43 variables were independent variables in the model. These variables included ratio variables such as age and travel expenses, dichotomous variables such as sex and having a bicycle, and polytomous variables such as occupation and travel style. The values of these variables were defined in the form of codes, and the definitions of each variable are shown in Table 5. The polynomial variables in the form of category variables were given default values, which were used as reference values and compared to other values in the model.
The binary logistic regression model assessed factors influencing AM adoption, with a Nagelkerke R² of 0.505 (p<0.05), indicating a good fit (Table 6). The model accurately predicted 88.3% of cases (95.2% for non-switchers, 53% for switchers), suggesting robust explanatory power.
Significant variables (Table 7) included demographic, travel behaviour, and infrastructure factors. Key findings are:
- Demographics: Males were less likely to switch to AM (OR=0.512, p=0.096), possibly due to cultural preferences for motorized transport. Higher-income groups (15,001–20,000 THB) were 88.6% less likely to switch (OR=0.114, p=0.004) compared to the <10,000 THB reference group.
- Travel Behaviour: Higher daily travel costs increased AM likelihood slightly (OR=1.008, p=0.044). Motorcycle (OR=0.171, p=0.002) and car users (OR=0.136, p=0.004) were significantly less likely to switch compared to walkers/cyclists.
- Infrastructure: Beautiful architectural design (OR=1.695, p=0.045), rest areas (OR=1.820, p=0.034), CCTV (OR=1.726, p=0.060), protective barriers (OR=1.608, p=0.086), and safe crossings (OR=1.650, p=0.056) increased AM likelihood. Public transport integration was highly influential (OR=2.192, p=0.005).
- Promotion: Media campaigns (OR=0.576, p=0.039) and AM apps (OR=0.583, p=0.038) negatively affected AM adoption, suggesting infrastructure priorities over promotion.
The model suggests infrastructure improvements could increase daily AM duration by 8–16 minutes per person, based on respondent willingness to switch (84%) and typical AM distances (1–2 km, 35%). While modest, this aligns with health benefits from short AM bouts (Clark & Stigell, 2017). For example, rest areas (OR=1.820) address hot weather fatigue (SWOT weakness), potentially encouraging longer walking/cycling trips.
The findings align with global AM research emphasizing infrastructure’s role in behaviour change (Pucher & Buehler, 2008). Safety measures like CCTV and protective barriers address Thai-specific concerns about motorcycle encroachment (Pongphonrat et al., 2015), while rest areas cater to climatic challenges (UddC, 2015). The negative effect of media campaigns contrasts with studies advocating promotion (Bordagaray et al., 2015), suggesting infrastructure should precede promotion in Thailand.
Males’ lower AM likelihood (OR=0.512) may reflect cultural preferences for motorized transport as status symbols in Thailand (Boon-or & Limpasenee, 2020). This warrants targeted campaigns to normalize AM among males, drawing on successful European strategies (Pucher & Buehler, 2008).
5. Conclusion
This study investigated road users’ attitudes toward active mobility (AM) at King Mongkut’s Institute of Technology Ladkrabang (KMITL), a suburban university in Bangkok, Thailand, to identify factors influencing the adoption of walking and cycling. Employing a mixed-methods approach grounded in the Theory of Planned Behaviour (TPB), including qualitative SWOT analysis, a stated preference survey (n=400), and binary logistic regression, the study provides robust empirical insights into context-specific AM preferences in Thailand.
The findings reveal that infrastructure improvements, safety measures, and amenities significantly drive AM adoption. Rest areas (OR=1.820, p=0.034), CCTV (OR=1.726, p=0.060), protective barriers against motorcycles (OR=1.608, p=0.086), and public transport integration (OR=2.192, p=0.005) emerged as critical facilitators, addressing local barriers such as hot weather and unsafe sidewalks. Demographic factors also shaped AM adoption: males (OR=0.512, p=0.096) and higher-income groups were less likely to switch to AM, reflecting cultural preferences for motorized transport. Promotional efforts alone were insufficient, with media campaigns (OR=0.576, p=0.039) and AM apps (OR=0.583, p=0.038) reducing adoption, highlighting the need to prioritize infrastructure first.
These findings contribute to filling a key geographic gap in global AM literature by providing new evidence from a Southeast Asian middle-income context. The study demonstrates that suburban university campuses are promising testbeds for AM promotion and offers a scalable model for similar settings across Thailand.
Policy Recommendations
- Infrastructure First: Invest in rest areas, CCTV, and protective barriers before launching promotional campaigns.
- Integrate Public Transport: Strengthen first/last-mile connections with trams or bike-sharing.
- Targeted Campaigns: Tailor campaigns to address gender and cultural attitudes, particularly focusing on normalizing AM among males.
- Pilot and Scale: Test interventions at KMITL with pre/post evaluation and expand to other Thai campuses.
6. Limitations and Future Research
While the small pilot survey may limit generalizability, triangulation with qualitative findings supports the reliability of selected measures. Future research should employ larger samples, longitudinal designs, and explore psychological and cultural factors in greater depth, potentially incorporating behavioural models such as the Transtheoretical Model.
In conclusion, targeted infrastructure investments, combined with integrated transport planning and context-specific behavioural strategies, can significantly advance AM adoption in Thailand, contributing meaningfully to both national sustainability goals and global efforts to promote healthier, more liveable cities.
Author Contributions
Conceptualization, P.C. and R.M.; methodology, P.C.; validation, R.M., S.S. and P.C.; formal analysis, R.M. and S.S.; investigation, S.P.; resources, S.P.; data curation, S.P.; writing—original draft preparation, R.M. and S.S.; writing—review and editing, P.C. and M.H.; supervision, P.C.; project administration, S.A.; funding acquisition, R.M. All authors have read and agreed to the published version of the manuscript.
Funding
This work is funded by the WHO-Royal Thai Government (RTG) Country Cooperation Strategy (CCS) 2017-2021 on road safety.
Acknowledgements
This work is supported by the WHO-Royal Thai Government (RTG) Country Cooperation Strategy (CCS) 2017-2021 on road safety.
Conflicts of Interest
The authors declare no conflict of interest.
References
- Ajzen, I. (1991). The theory of planned behavior. Organizational Behavior and Human Decision Processes, 50(2), 179–211. [CrossRef]
- Alton, D., Adab, P., Roberts, L., & Barrett, T. (2007). Relationship between walking levels and perceptions of the local neighborhood environment. Archives of Disease in Childhood, 92(1), 29–33. [CrossRef]
- Bateman, I. J., Carson, R. T., Day, B., Hanemann, W. M., Hanley, N., Hett, T., ... & Watson, S. (2002). Economic valuation with stated preference techniques: A manual. Edward Elgar Publishing. [CrossRef]
- Bejranonda, S., & Attanandana, V. (2015). Willingness to pay for attributes of cycleway management. Kasetsart Journal - Social Sciences, 36, 201–216.
- Beirão, G., & Sarsfield Cabral, J. A. (2007). Understanding attitudes towards public transport and private car: A qualitative study. Transport Policy, 14(6), 478–489. [CrossRef]
- Benjasiri, R. (2015). Social return on investment of skywalk in Bangkok. Journal of Politics, Administration and Law.
- Boon-or, N., & Limpasenee, W. (2020). Sidewalk development for convenient Bangkok metropolitan. Vajira Medical Journal, 64(3).
- Boone-Heinonen, J., Evenson, K. R., Taber, D. R., & Gordon-Larsen, P. (2009). Walking for prevention of cardiovascular disease in men and women: A systematic review of observational studies. Obesity Reviews, 10(2), 204–217. [CrossRef]
- Bordagaray, M., de Oña, J., & de Oña, R. (2015). Active commuting to university: Attitudes and perceptions of university students. Journal of Transport Geography, 48, 141–150. [CrossRef]
- Bordagaray, M., Dell’Olio, L., Ibeas, A., Barreda, R., & Alonso, B. (2015). Modeling the service quality of public bicycle schemes considering user heterogeneity. International Journal of Sustainable Transportation, 9(8), 580–591. [CrossRef]
- Cervero, R., Sarmiento, O. L., Jacoby, E., Gomez, L. F., & Neiman, A. (2009). Influences of built environments on walking and cycling: Lessons from Bogotá. International Journal of Sustainable Transportation, 3(4), 203–226. [CrossRef]
- Chakrat Phala, & Monsicha Petchanon. (2016). An investigation of cycling behavior for bike use policy in Khon Kaen City. Academic Journal: Faculty of Architecture, Khon Kaen University, 15(2), 113–116.
- Clark, A., & Stigell, E. (2017). Active mobility and physical activity - results from the pan-European PASTA project. European Journal of Public Health, 27(3). [CrossRef]
- Clark, J. (2017). Behavioral economics and its application to travel behavior research. Transportation Research Board.
- Clark, J., & Stigell, E. (2017). Walking, cycling, and public transport: A review of interventions to promote active commuting. Journal of Transport & Health, 6, 156–166. [CrossRef]
- Cortright, J. (2009). Walking the walk: How walkability raises home values in U.S. cities. CEOs for Cities.
- Easton, S., & Ferrari, E. (2015). Children’s travel to school—the interaction of individual, neighborhood and school factors. Transport Policy, 44, 9–18. [CrossRef]
- Engels, F., Wentland, A., & Pfotenhauer, S. M. (2019). Testing future societies? Developing a framework for test beds and living labs as instruments of innovation governance. Research Policy, 48(9), 103826. [CrossRef]
- Erlichman, J., Kerbey, A. L., & James, W. P. (2002). Physical activity and its impact on health outcomes. Paper 2: Prevention of unhealthy weight gain and obesity by physical activity: An analysis of the evidence. Obesity Reviews, 3(4), 273–287. [CrossRef]
- Hanemann, W. M. (1994). Valuing the environment through contingent valuation. Journal of Economic Perspectives, 8(4), 19–43. [CrossRef]
- Hosmer, D. W., & Lemeshow, S. (2000). Applied logistic regression (2nd ed.). Wiley. [CrossRef]
- Hume, C., Jorna, M., Arundell, L., Saunders, J., Crawford, D., & Salmon, J. (2009). Are children’s perceptions of neighborhood social environments associated with their walking and physical activity? Journal of Science and Medicine in Sport, 12(6), 637–641. [CrossRef]
- Ibeas, Á., Cordera, R., dell’Olio, L., & Coppola, P. (2011). Pedestrian route choice models: A literature review. Transport Reviews, 31(5), 629–644. [CrossRef]
- Iii, M. P., Herriges, J. A., & Kling, C. L. (2003). The measurement of environmental and resource values: Theory and methods (2nd ed.). Resources for the Future. [CrossRef]
- Jones, T. F., & Eaton, C. B. (1994). Cost-benefit analysis of walking to prevent coronary heart disease. Archives of Family Medicine, 3(8), 703–710. [CrossRef]
- Kanchanapa Pongphonrat, Rattanatavorn, N., & Limpasenee, W. (2015). Attitudes towards walking and cycling in Chiang Mai. Journal of Transport Research Forum, 49(2), 1–18.
- Kemperman, A., & Timmermans, H. (2014). Environmental correlates of active travel behavior of children. Environment and Behavior, 46(5), 583–608. [CrossRef]
- Koh, P. P., & Wong, Y. D. (2013). Singapore’s approach to promoting walking and cycling. Transportation Research Part A: Policy and Practice, 58, 1–13. [CrossRef]
- Krizek, K. J., Handy, S. L., & Forsyth, A. (2009). Explaining changes in walking and bicycling behavior: Challenges for transportation research. Environment and Planning B: Planning and Design, 36(4), 725–740. [CrossRef]
- Kusuma Thavorn, Chaisongkram, P., & Promsuwan, S. (2014). The participatory action research in cycling way of life among town people: A case study of Phanatnikhom municipality, Chonburi Province. Thailand Cycling Club.
- Lewicka, M. (2005). Ways to make people active: The role of place attachment, cultural capital, and neighborhood ties. Journal of Environmental Psychology, 25(4), 381–395. [CrossRef]
- Meesit, R., Puntoomjinda, S., Chaturabong, P., Sontikul, S., & Arunnapa, S. (2023). Factors affecting travel behaviour change towards active mobility: A case study in a Thai university. Sustainability, 15(14), 11393. [CrossRef]
- Methorst, R., Bort, H. M., Risser, R., Sauter, D., Tight, M., & Walker, J. (2010). Pedestrian’s quality needs promotion, COST 358 final report part C executive summary. Walk 21, Cheltenham, UK.
- Morris, J. N., & Hardman, A. E. (1997). Walking to health. Sports Medicine, 23(5), 306–332. [CrossRef]
- Morse, J. M. (2004). Theoretical saturation. In M. S. Lewis-Beck, A. Bryman, & T. F. Liao (Eds.), The SAGE encyclopedia of social science research methods (pp. 1123–1124). SAGE Publications.
- Ogilvie, D., Foster, C. E., Rothnie, H., Cavill, N., Hamilton, V., Fitzsimons, C. F., & Mutrie, N. (2007). Interventions to promote walking: Systematic review. BMJ, 334(7605), 1204. [CrossRef]
- Prochaska, J. O., & DiClemente, C. C. (1983). Stages and processes of self-change of smoking: Toward an integrative model of change. Journal of Consulting and Clinical Psychology, 51(3), 390–395. [CrossRef]
- Pucher, J., & Buehler, R. (2008). Making cycling irresistible: Lessons from The Netherlands, Denmark and Germany. Transport Reviews, 28(4), 495–528. [CrossRef]
- Pucher, J., & Buehler, R. (2010). Cycling (and walking) in the USA: Recent trends and policies. Journal of Transport Geography, 18(5), 681–694. [CrossRef]
- Punyanuch Ruthirako, Promsuwan, S., & Chaisongkram, P. (2019). Action research of creating a friendly city toward walking and biking: A case study of Na-Thawi municipality, Na-Thawi, Songkhla. The 7th Thailand Bike and Walk Forum, 70–81.
- Rabl, A., & de Nazelle, A. (2012). Benefits of shift from car to active transport. Transport Policy, 19(1), 121–131. [CrossRef]
- Saelens, B. E., & Handy, S. L. (2008). Built environment correlates of walking: A review. Medicine & Science in Sports & Exercise, 40(7 Suppl), S550–S566. [CrossRef]
- Sælensminde, K. (2004). Cost–benefit analyses of walking and cycling track networks taking into account insecurity, health effects and external costs of motorized traffic. Transportation Research Part A: Policy and Practice, 38(8), 593–606. [CrossRef]
- Sansanee Sangsila. (2012). The pedestrian behavior of community around mass rapid transit station. (Master’s thesis, Silpakorn University).
- Sohn, D. W., Moudon, A. V., & Lee, J. (2012). The economic value of walkable neighborhoods. Urban Design International, 17(2), 115–128. [CrossRef]
- Song, Y., Chen, R., & Wu, X. (2013). Walking and cycling for healthy urban environments: A case study of Beijing, China. Urban Studies, 50(14), 2821–2838. [CrossRef]
- Sriprasong, P. (2010). Willingness-to-pay for and factor determination of flood-prevent tax in Bangkok by Pasak Jolasid Dam. Srinakharinwirot University.
- Sukharom, R. (1998). Hypothetical scenarios for evaluating non-market goods. Thammasat Economic Journal, 16(4), 89–117.
- UddC (Urban Design and Development Center). (2015). Today, tomorrow, and the future and the barriers to pedestrians in Bangkok. Project to study the potential of access to public utilities that promote walking and the walking potential index study project, Phase 1. Chulalongkorn University.
- United Nations. (2015). Transforming our world: The 2030 agenda for sustainable development. United Nations General Assembly. https://sdgs.un.org/2030agenda.
- Wang, G., Macera, C. A., Scudder-Soucie, B., Schmid, T., Pratt, M., Buchner, D., & Heath, G. (2004). Cost analysis of the built environment: The case of bike and pedestrian trials in Lincoln, Neb. American Journal of Public Health, 94(4), 549–553. [CrossRef]
- Wilson, L.-A., Giles-Corti, B., & Turrell, G. (2012). The association between objectively measured neighbourhood features and walking for transport in mid-aged adults. Local Environment, 17(2), 131–146. [CrossRef]
- World Health Organization. (2021). Global status report on road safety 2021. World Health Organization. https://www.who.int/publications/i/item/9789240027114.
- World Health Organization. (2021). Health economic assessment tool (HEAT) for walking and cycling. World Health Organization. https://www.who.int/tools/health-economic-assessment-tool--heat-for-walking-and-cycling.
- Yamane, T. (1967). Statistics: An introductory analysis (2nd ed.). Harper & Row.
Figure 1.
What factors will persuade your transport preference to walking or cycling?
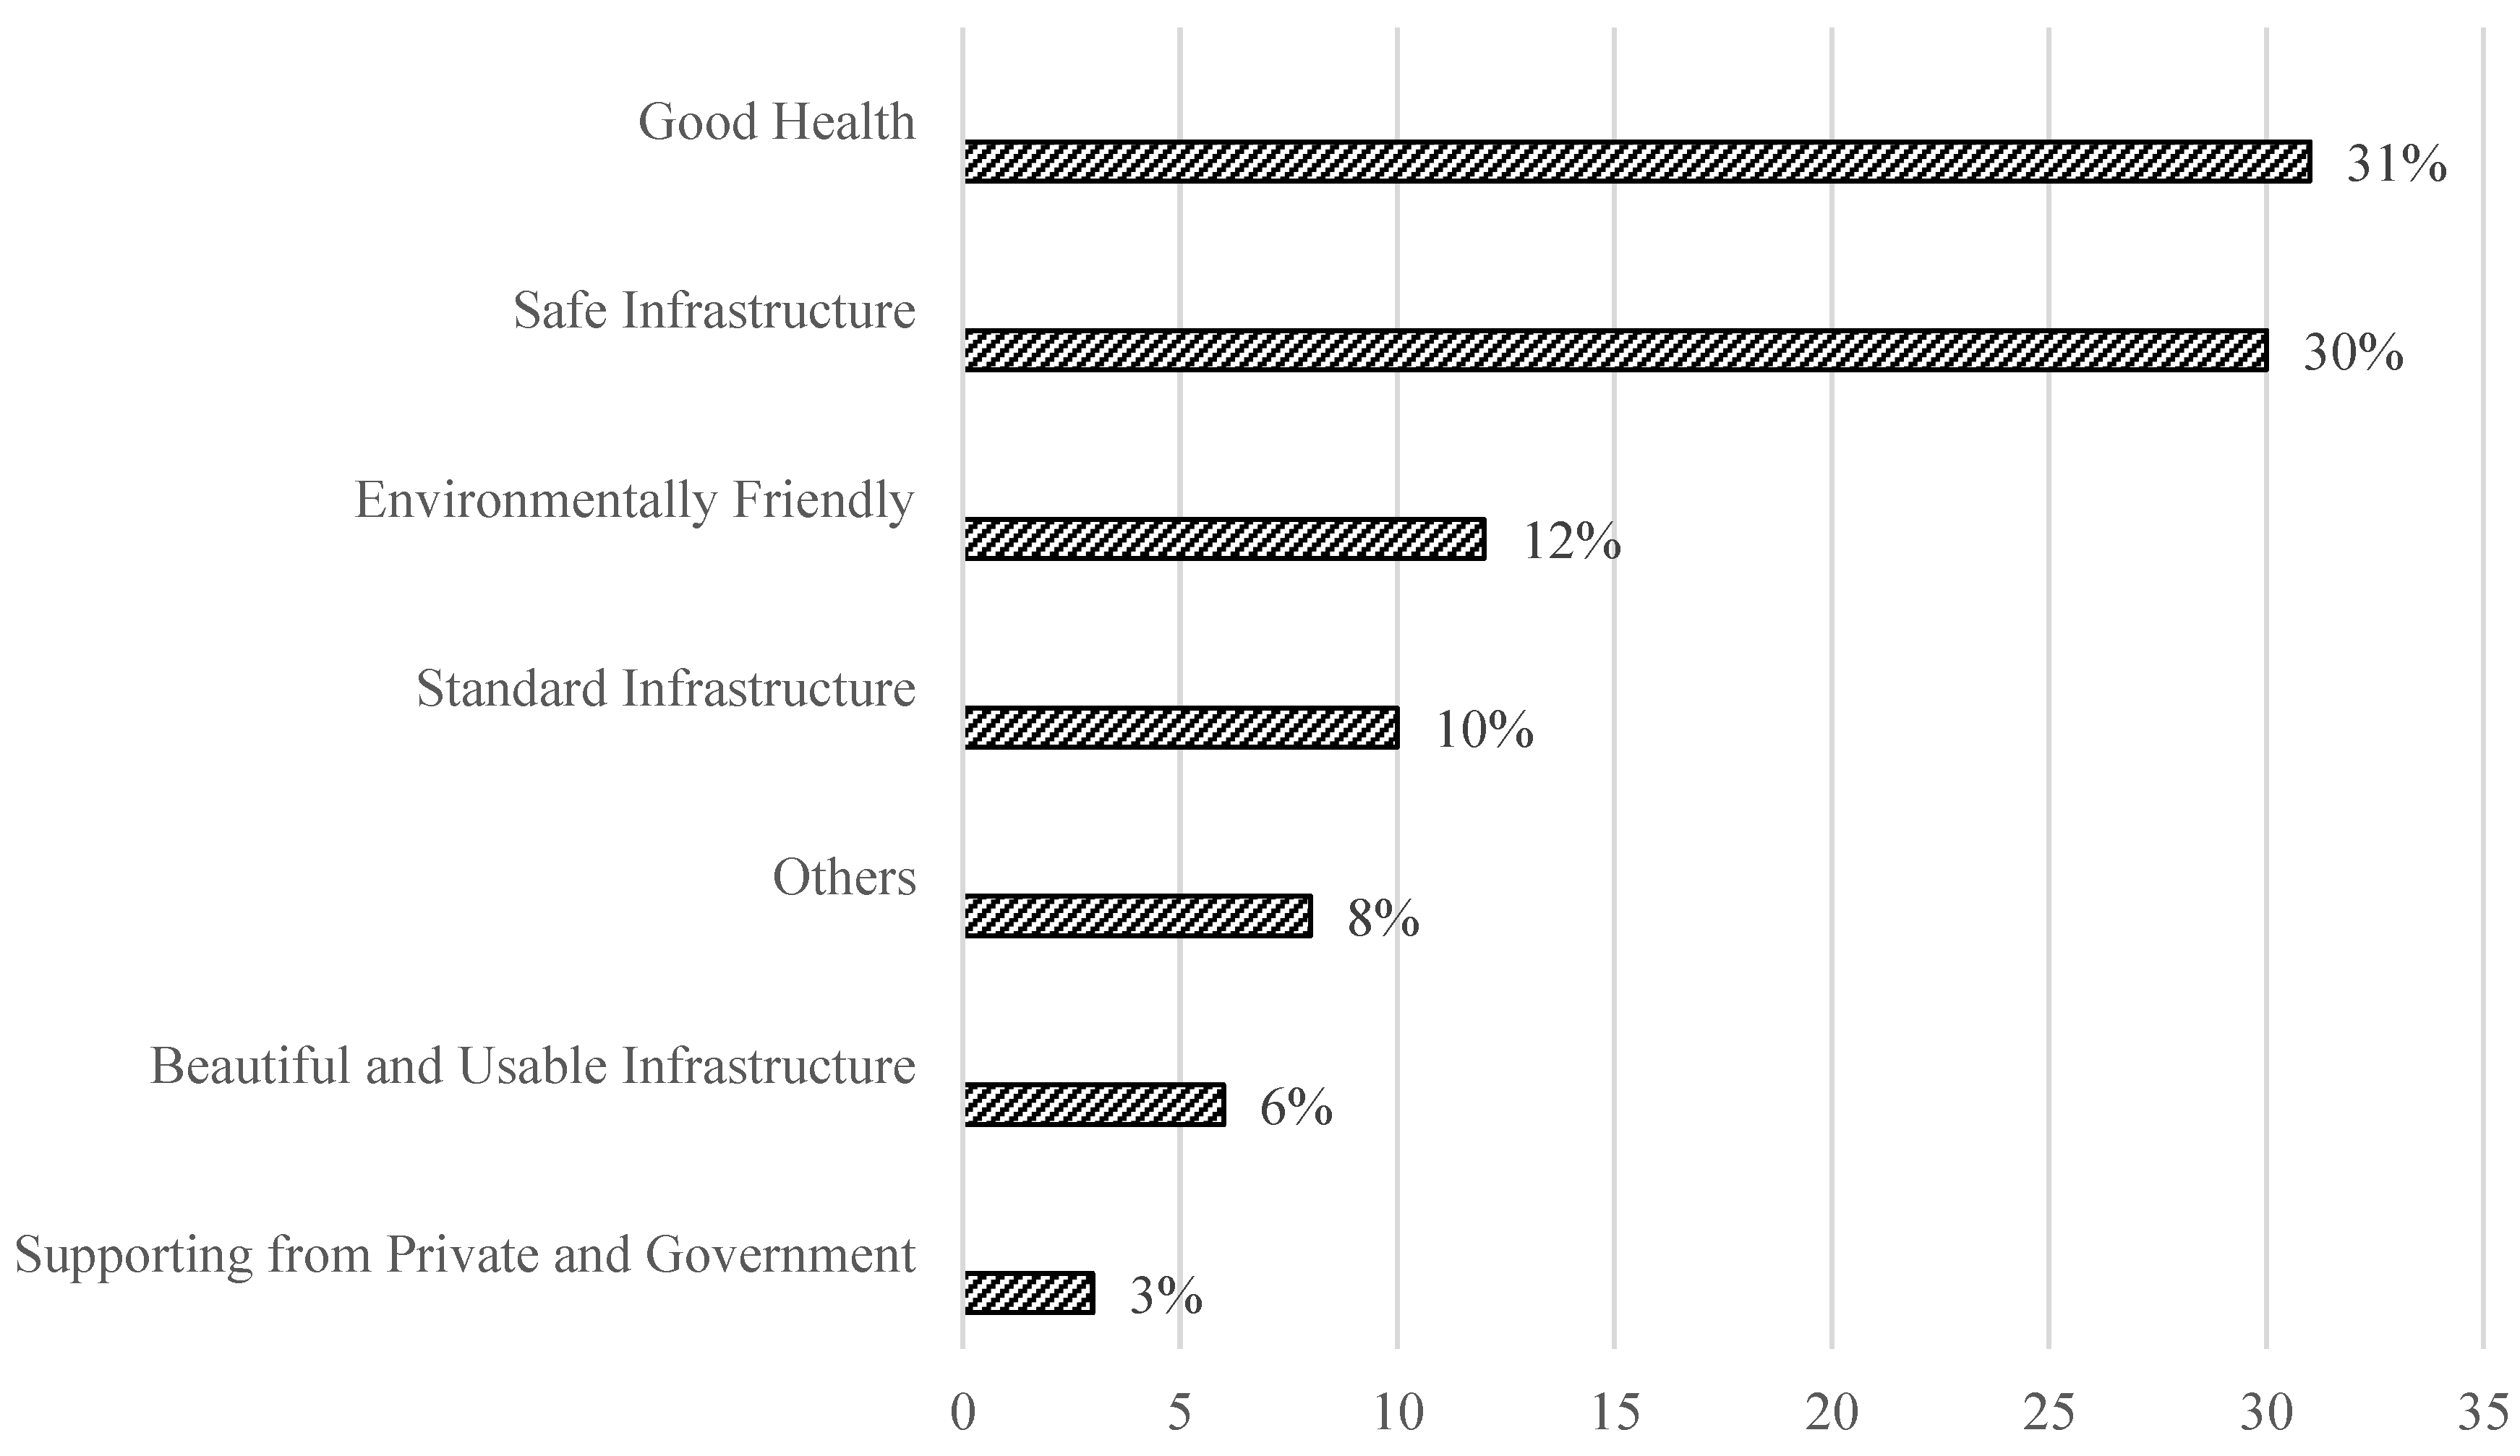
Table 2.
SWOT analysis for walking.
| Strength | Weakness | Opportunity | Threat |
| Exercise benefits | Hot weather | Prevent motorcycle encroachment | Improper motorcycle behaviour |
| Cost savings | Long travel times | Smoother road surfaces | Bad road surfaces |
| Enjoy surroundings | Insufficient sidewalk width | Adequate lighting | Waterlogging |
| Insufficient lighting |
Table 3.
SWOT analysis for cycling.
| Strength | Weakness | Opportunity | Threat |
| Exercise benefits | Skirt-wearing challenges | Prevent motorcycle encroachment | Improper motorcycle behaviour |
| Faster than walking | Small headlight/taillight | Bicycle-sharing system | Poor road sharing |
| Inadequate bicycle lanes | Improved bicycle lanes |
Table 4.
Descriptive statistics.
| Variable | N | Mean | SD | Min | Max | Median |
| SECTION 1: DEMOGRAPHIC QUESTIONS | ||||||
| Gender (0=Male, 1=Female) | 400 | 0.53 | 0.5 | 0 | 1 | 1 |
| Age | 400 | 23.6 | 7.53 | 17 | 70 | 21 |
| Marital Status | 400 | 1.14 | 0.46 | 1 | 4 | 1 |
| Education Level | 400 | 3.86 | 0.62 | 1 | 5 | 4 |
| Career | 400 | 1.39 | 0.91 | 1 | 5 | 1 |
| Income | 400 | 2.03 | 1.16 | 1 | 5 | 2 |
| Bicycle Ownership | 400 | 0.34 | 0.47 | 0 | 1 | 0 |
| Distance to University (km) | 400 | 7.47 | 10.1 | 0 | 80 | 2 |
| Travel Cost | 400 | 45.9 | 66.5 | 0 | 500 | 20 |
| Frequent Mode of Transport | 400 | 2.55 | 1.2 | 1 | 5 | 3 |
| Daily Distance for Walking or Cycling | 400 | 2.02 | 1.01 | 1 | 4 | 2 |
| Factors Influencing Transport Choice | 400 | 4.23 | 1.81 | 1 | 7 | 4 |
| Intention to Switch to Active Mobility | 400 | 0.84 | 0.37 | 0 | 1 | 1 |
| SECTION 2: ACTIVE MOBILITY FACTOR QUESTIONS | ||||||
| Separation of Pedestrian and Bicycle Lanes | 400 | 3.91 | 1.16 | 1 | 5 | 4 |
| Planting Around the Pedestrian and Bicycle Lanes | 400 | 3.59 | 1.07 | 1 | 5 | 4 |
| Architectural Design | 400 | 3.65 | 1.09 | 1 | 5 | 4 |
| Protection Against Motorcycle Incursions | 400 | 3.91 | 1.17 | 1 | 5 | 4 |
| CCTV for Security | 400 | 4.02 | 1.06 | 1 | 5 | 4 |
| Security Checkpoints | 400 | 3.69 | 1.11 | 1 | 5 | 4 |
| Emergency Communication Devices | 400 | 3.67 | 1.12 | 1 | 5 | 4 |
| Safe Crossings and Intersections | 400 | 4.04 | 1.08 | 1 | 5 | 4 |
| Covered Walkways for Pedestrians | 400 | 3.88 | 11.7 | 1 | 5 | 4 |
| Sufficient Lighting at the Pedestrian and Bicycle Lanes at Night | 400 | 4.09 | 1.1 | 1 | 5 | 4 |
| Sufficient and Suitable Bins | 400 | 3.85 | 1.1 | 1 | 5 | 4 |
| Road Signs and Maps for Pedestrian and Bicycle Lane | 400 | 3.77 | 1.12 | 1 | 5 | 4 |
| Outdoor Workout Equipment | 400 | 3.27 | 1.11 | 1 | 5 | 3 |
| Rest Areas | 400 | 3.73 | 1.07 | 1 | 5 | 4 |
| Sufficient Bicycle Parking | 400 | 3.74 | 1.14 | 1 | 5 | 4 |
| A Service Point for Borrowing and Returning Bicycles Within the Institution’s Area | 400 | 3.62 | 1.08 | 1 | 5 | 4 |
| Shower Spot and Lockers | 400 | 3.26 | 1.13 | 1 | 5 | 3 |
| Drinking Water Service Points | 400 | 3.58 | 1.07 | 1 | 5 | 4 |
| The Connection Point between Other Public Transport and Pedestrian or Bicycle Lanes | 400 | 3.73 | 1.06 | 1 | 5 | 4 |
| Pedestrian and Bicycle Lanes are Interconnected to Cover the Area | 400 | 3.84 | 1.05 | 1 | 5 | 4 |
| Promotion Through Offline and Online Media | 400 | 3.48 | 1.08 | 1 | 5 | 4 |
| Cleaning and Maintenance of Sidewalks and Bicycle Paths | 400 | 3.94 | 1.1 | 1 | 5 | 4 |
| Notification of Violation of the Use of Pedestrian and Bicycle Lane | 400 | 3.81 | 1.05 | 1 | 5 | 4 |
| Using the Area Around the Pedestrian and Bicycle Lanes to Organize Activities | 400 | 3.38 | 1.05 | 1 | 5 | 3 |
| Application to Provide Information and News About Walking and Cycling | 400 | 3.46 | 1.09 | 1 | 5 | 4 |
| Policy to Promote Walking or Bicycle by Giving Prizes or Charitable Donations | 400 | 3.40 | 1.13 | 1 | 5 | 3 |
| Pedestrian and Bicycle Photography or Video Contests | 400 | 3.26 | 1.15 | 1 | 5 | 3 |
| Walk or Bicycle Day Activities | 400 | 3.32 | 1.23 | 1 | 5 | 3 |
| Educating and Organizing Training on Safety Use of Pedestrian and Bicycle Lanes | 400 | 3.49 | 1.08 | 1 | 5 | 4 |
| Encouraging to Travel by Public Transport | 400 | 3.74 | 1.01 | 1 | 5 | 4 |
| Participation of Students or Staff in Presenting the Design of the Pedestrian or Bicycle Lanes Within the Institute | 400 | 3.57 | 1.05 | 1 | 5 | 4 |
| Determining Policies on Improving and Building Pedestrian on Campus | 400 | 3.83 | 1.09 | 1 | 5 | 4 |
Table 5.
the definitions of each variable.
| Variable | Definition |
|---|---|
| Gen | Gender (0= male, 1= female) |
| Age | Age (year) |
| Status | Status (1= single, 2= married, 3= divorce, 4= others) |
| Edu | Education level (1= primary, 2=secondary, 3= diploma, 4= bachelor, 5= upper bachelor) |
| Career | Career (1= student, 2= staff, 3= lecturer, 4= merchant/personal business) |
| Income | Income (1= <10,000, 2= 10,000-15,000, 3= 15,001-20,000, 4= 20,001-25,000, 5=>25,000 |
| Bicycle | The bicycle occupancy (yes: 1, no: 0) |
| Distance | In a typical day, what is the distance between your accommodation and university? (km) |
| TraCost | Travel cost (1= 0, 2= <20 bath, 3= <50 bath, 4= <150 bath, 5= >150 bath) |
| TraMode | Frequent mode of transport (1=walk, 2= bicycle, 3= motorcycle, 4= car, 5= others) |
| ActDistance | In a typical day, how many kilometers do you spend for walking or cycling? (1= <1 km, 2= 1-2 km, 3= 2-3 km, 4= >3 km |
| FutureTravBeh | If there is a development in walking and cycling infrastructure, are you going to switch the mode of transport to walking and cycling (0= yes, 1= no) |
| Separate | Separation of pedestrian and bicycle lanes (1=least significant, 2=less significant, 3=moderate significant, 4=significant, 5=very significant) |
| Tree | Planting around the pedestrian and bicycle lanes (1=Strongly disagree, 2=Disagree, 3=Neither agree nor disagree, 4=Agree, 5=Strongly agree) |
| Architecture | Architectural design that looks beautiful, such as having a landmark, etc. (1=Strongly disagree, 2=Disagree, 3=Neither agree nor disagree, 4=Agree, 5=Strongly agree) |
| MotorProtection | Protection to prevent motorcycles from running on the sidewalk (1=Strongly disagree, 2=Disagree, 3=Neither agree nor disagree, 4=Agree, 5=Strongly agree) |
| CCTV | CCTV for security in risk areas (1=Strongly disagree, 2=Disagree, 3=Neither agree nor disagree, 4=Agree, 5=Strongly agree) |
| CheckPoint | Checkpoints for security guards (1=Strongly disagree, 2=Disagree, 3=Neither agree nor disagree, 4=Agree, 5=Strongly agree) |
| EmerPhone | A device for contacting the staff in case of an emergency (1=Strongly disagree, 2=Disagree, 3=Neither agree nor disagree, 4=Agree, 5=Strongly agree) |
| SafeCrossing | Clear crossing, clear intersection and technology is used to increase security (1=Strongly disagree, 2=Disagree, 3=Neither agree nor disagree, 4=Agree, 5=Strongly agree) |
| Roof | Pedestrian covered walkways (1=Strongly disagree, 2=Disagree, 3=Neither agree nor disagree, 4=Agree, 5=Strongly agree) |
| Light | Sufficient lighting at the pedestrian and bicycle lanes at night (1=Strongly disagree, 2=Disagree, 3=Neither agree nor disagree, 4=Agree, 5=Strongly agree) |
| TrashCan | Sufficient and suitable bins (1=Strongly disagree, 2=Disagree, 3=Neither agree nor disagree, 4=Agree, 5=Strongly agree) |
| Sign | Road signs and maps for pedestrian and bicycle lane (1=Strongly disagree, 2=Disagree, 3=Neither agree nor disagree, 4=Agree, 5=Strongly agree) |
| WorkoutEquipment | Outdoor workout equipment (1=Strongly disagree, 2=Disagree, 3=Neither agree nor disagree, 4=Agree, 5=Strongly agree) |
| RestArea | Rest areas (1=Strongly disagree, 2=Disagree, 3=Neither agree nor disagree, 4=Agree, 5=Strongly agree) |
| BicycleParking | Sufficient bicycle parking (1=Strongly disagree, 2=Disagree, 3=Neither agree nor disagree, 4=Agree, 5=Strongly agree) |
| BicycleRental | A service point for borrowing and returning bicycles within the institution’s area (1=Strongly disagree, 2=Disagree, 3=Neither agree nor disagree, 4=Agree, 5=Strongly agree) |
| ShowerSpot | Shower spot and lockers (1=Strongly disagree, 2=Disagree, 3=Neither agree nor disagree, 4=Agree, 5=Strongly agree) |
| WaterStation | Drinking water service points (1=Strongly disagree, 2=Disagree, 3=Neither agree nor disagree, 4=Agree, 5=Strongly agree) |
| ConnectPubTran | The connection point between other public transport and pedestrian or bicycle lanes (1=Strongly disagree, 2=Disagree, 3=Neither agree nor disagree, 4=Agree, 5=Strongly agree) |
| NetworkConnection | Pedestrian and bicycle lanes are interconnected to cover the area (1=Strongly disagree, 2=Disagree, 3=Neither agree nor disagree, 4=Agree, 5=Strongly agree) |
| Promote | Promotion through offline and online media (1=Strongly disagree, 2=Disagree, 3=Neither agree nor disagree, 4=Agree, 5=Strongly agree) |
| Cleaning | Cleaning and Maintenance of sidewalks and bicycle paths (1=Strongly disagree, 2=Disagree, 3=Neither agree nor disagree, 4=Agree, 5=Strongly agree) |
| ServiceCentre | Notification of violation of the use of pedestrian and bicycle lane (1=Strongly disagree, 2=Disagree, 3=Neither agree nor disagree, 4=Agree, 5=Strongly agree) |
| OtherActivities | Using the area around the pedestrian and bicycle lanes to organize activities (1=Strongly disagree, 2=Disagree, 3=Neither agree nor disagree, 4=Agree, 5=Strongly agree) |
| Application | Application to provide information and news about walking and cycling (1=Strongly disagree, 2=Disagree, 3=Neither agree nor disagree, 4=Agree, 5=Strongly agree) |
| Charity | Policy to promote walking or bicycle by giving prizes or charitable donations (1=Strongly disagree, 2=Disagree, 3=Neither agree nor disagree, 4=Agree, 5=Strongly agree) |
| PhotoCompet | Pedestrian and bicycle photography or video contests (1=Strongly disagree, 2=Disagree, 3=Neither agree nor disagree, 4=Agree, 5=Strongly agree) |
| WalkBday | Walk or Bicycle Day activities (1=Strongly disagree, 2=Disagree, 3=Neither agree nor disagree, 4=Agree, 5=Strongly agree) |
| EduWB | Educating and organizing training on safety use of pedestrian and bicycle lanes (1=Strongly disagree, 2=Disagree, 3=Neither agree nor disagree, 4=Agree, 5=Strongly agree) |
| PublicTran | EncouragING to travel by public transport (1=Strongly disagree, 2=Disagree, 3=Neither agree nor disagree, 4=Agree, 5=Strongly agree) |
| Cooperate | Participation of students or staff in presenting the design of the pedestrian or bicycle lanes within the institute (1=Strongly disagree, 2=Disagree, 3=Neither agree nor disagree, 4=Agree, 5=Strongly agree) |
| OrgPolicy | Determining policies on improving and building pedestrian on campus (1=Strongly disagree, 2=Disagree, 3=Neither agree nor disagree, 4=Agree, 5=Strongly agree) |
Table 6.
Model suitability test results.
| -2 Log Likelihood | Cox & Snell R² | Nagelkerke R² |
| 216.385 | 0.299 | 0.505 |
Table 7.
Binary logistic regression results.
| Variable | B | S.E. | Wald | Sig. | OR(Exp(B)) | |
|---|---|---|---|---|---|---|
| Gen | -0.669 | 0.402 | 2.764 | 0.096* | 0.512 | |
| Age | -0.014 | 0.028 | 0.268 | 0.605 | 0.986 | |
| Edu (1) | 0.127 | 1.936 | 0.004 | 0.948 | 1.136 | |
| Edu (2) | -0.486 | 1.938 | 0.063 | 0.802 | 0.615 | |
| Edu (3) | 0.765 | 1.858 | 0.169 | 0.681 | 2.148 | |
| Edu (4) | 1.786 | 2.022 | 0.780 | 0.377 | 5.966 | |
| Income (1) | 0.400 | 0.487 | 0.675 | 0.411 | 1.492 | |
| Income (2) | -1.215 | 0.672 | 3.270 | 0.071* | 0.297 | |
| Income (3) | -2.174 | 0.752 | 8.363 | 0.004*** | 0.114 | |
| Income (4) | -1.426 | 0.937 | 2.316 | 0.128 | 0.240 | |
| Bicycle | 0.666 | 0.450 | 2.188 | 0.139 | 1.947 | |
| Distance | 0.023 | 0.030 | 0.582 | 0.445 | 1.023 | |
| TraCost | 0.008 | 0.004 | 4.044 | 0.044** | 1.008 | |
| TraMode (1) | 0.310 | 1.430 | 0.047 | 0.829 | 1.363 | |
| TraMode (2) | -1.768 | 0.561 | 9.917 | 0.002*** | 0.171 | |
| TraMode (3) | -1.995 | 0.699 | 8.138 | 0.004*** | 0.136 | |
| ActDistance (1) | 0.203 | 0.474 | 0.183 | 0.669 | 1.224 | |
| ActDistance (2) | -0.425 | 0.607 | 0.491 | 0.484 | 0.654 | |
| ActDistance (3) | -0.539 | 0.649 | 0.688 | 0.407 | 0.584 | |
| Separate | 0.150 | 0.273 | 0.302 | 0.583 | 1.162 | |
| Tree | -0.456 | 0.279 | 2.677 | 0.102 | 0.634 | |
| Architecture | 0.528 | 0.263 | 4.013 | 0.045** | 1.695 | |
| MotorProtection | 0.475 | 0.277 | 2.952 | 0.086* | 1.608 | |
| CCTV | 0.546 | 0.290 | 3.545 | 0.060* | 1.726 | |
| CheckPoint | -0.297 | 0.260 | 1.305 | 0.253 | 0.743 | |
| EmerPhone | -0.249 | 0.258 | 0.932 | 0.334 | 0.779 | |
| SafeCrossing | 0.501 | 0.261 | 3.667 | 0.056* | 1.650 | |
| Roof | -0.410 | 0.295 | 1.933 | 0.164 | 0.663 | |
| TrashCan | -0.340 | 0.281 | 1.460 | 0.227 | 0.712 | |
| Sign | 0.111 | 0.251 | 0.193 | 0.660 | 1.117 | |
| WorkoutEquipment | -0.103 | 0.259 | 0.157 | 0.692 | 0.902 | |
| RestArea | 0.599 | 0.282 | 4.500 | 0.034** | 1.820 | |
| BicycleParking | -0.057 | 0.252 | 0.052 | 0.820 | 0.944 | |
| BicycleRental | 0.256 | 0.284 | 0.813 | 0.367 | 1.291 | |
| ShowerSpot | -0.372 | 0.286 | 1.697 | 0.193 | 0.689 | |
| WaterStation | -0.419 | 0.306 | 1.878 | 0.171 | 0.658 | |
| ConnectPubTran | -0.061 | 0.321 | 0.037 | 0.848 | 0.940 | |
| Promote | -0.552 | 0.267 | 4.271 | 0.039** | 0.576 | |
| Cleaning | 0.253 | 0.275 | 0.846 | 0.358 | 1.288 | |
| ServiceCentre | 0.558 | 0.292 | 3.660 | 0.056* | 1.747 | |
| OtherActivities | 0.269 | 0.245 | 1.197 | 0.274 | 1.308 | |
| Application | -0.540 | 0.260 | 4.303 | 0.038** | 0.583 | |
| Charity | 0.132 | 0.244 | 0.292 | 0.589 | 1.141 | |
| PhotoCompet | 0.315 | 0.251 | 1.570 | 0.210 | 1.370 | |
| WalkBday | -0.325 | 0.246 | 1.734 | 0.188 | 0.723 | |
| EduWB | 0.306 | 0.245 | 1.556 | 0.212 | 1.358 | |
| PublicTran | 0.785 | 0.279 | 7.923 | 0.005*** | 2.192 | |
| Cooperate | -0.317 | 0.264 | 1.449 | 0.229 | 0.728 | |
| OrgPolicy | -0.034 | 0.280 | 0.015 | 0.904 | 0.967 | |
| Constant | -2.165 | 2.414 | 0.805 | 0.370 | 0.115 | |
Note: * = p<0.10, ** = p<0.05, *** = p<0.01.
Disclaimer/Publisher’s Note: The statements, opinions and data contained in all publications are solely those of the individual author(s) and contributor(s) and not of MDPI and/or the editor(s). MDPI and/or the editor(s) disclaim responsibility for any injury to people or property resulting from any ideas, methods, instructions or products referred to in the content. |
© 2025 by the authors. Licensee MDPI, Basel, Switzerland. This article is an open access article distributed under the terms and conditions of the Creative Commons Attribution (CC BY) license (http://creativecommons.org/licenses/by/4.0/).
Copyright: This open access article is published under a Creative Commons CC BY 4.0 license, which permit the free download, distribution, and reuse, provided that the author and preprint are cited in any reuse.


