
Submitted:
01 July 2025
Posted:
02 July 2025
You are already at the latest version
Abstract
Background/Objectives: This study examined how reproductive factors—such as oral contraceptive (OC), age at menarche, number of pregnancies, and age at first delivery—are related to the risk of metabolic syndrome (MetS) in Korean women aged 30–69, based on their menopausal status. Methods: Data from the Korea National Health and Nutrition Examination Survey 2010–2023 were analyzed, including 31,178 women with complete data. Survey-weighted logistic regression and restricted cubic spline analyses were conducted, adjusting for sociodemographic, lifestyle, and reproductive covariates. Results: OC use was significantly associated with increased MetS risk in both premenopausal (adjusted OR 1.40, 95% CI 1.13–1.72) and postmenopausal women (adjusted OR 1.16, 95% CI 1.03–1.29). This association was primarily driven by elevated blood pressure in both groups and high triglycerides in postmenopausal women. Other reproductive factors, including age at menarche, number of pregnancies, and age at first delivery, showed no significant nonlinear associations with MetS risk. Established risk factors such as older age, higher BMI, smoking, and high-risk drinking were confirmed. Strength exercise was inversely associated with MetS in postmenopausal women. Conclusions: OC use is linked to higher MetS risk, particularly through blood pressure and triglyceride elevations. Other reproductive factors showed limited association. These findings underscore the importance of considering OC use in metabolic risk assessments and highlight potential benefits of lifestyle interventions.
Keywords:
metabolic syndrome
; oral contraceptives
; reproductive factors
; menopausal status
1. Introduction
Metabolic syndrome (MetS) is a cluster of metabolic abnormalities, including abdominal obesity, hypertension, dyslipidemia, and impaired glucose metabolism, that increases the risk of cardiovascular disease, type 2 diabetes, and all-cause mortality [1]. Well-established risk factors for MetS include advancing age, higher body mass index (BMI), low physical activity, and unhealthy lifestyle behaviors [2]. In women, unique physiological states such as puberty, pregnancy, and menopause, as well as reproductive factors like age at menarche, parity, and age at first delivery, are increasingly recognized as important determinants not only of MetS but also of other chronic diseases including diabetes and cardiovascular disease [3,4,5,6]. The hormonal and metabolic changes across a woman’s reproductive lifespan may influence her long-term metabolic health.
Many studies have explored the relationship between female reproductive factors and MetS, but findings remain inconsistent [7,8,9,10,11,12]. Some research has shown that early age at menarche is associated with a higher risk of MetS and related disorders, while other studies have reported increased risk with both early and late menarche, suggesting a reversed J-shaped association [7,9,10]. Similarly, large-scale studies in populations have reported associations between age of menarche, frequency pregnancy, age at first birth, and MetS risk, but results have varied depending on population and analytic approach [13]. These discrepancies highlight the need for further research that considers menopausal status and uses large, representative samples.
In contrast to reproductive history, the association between oral contraceptive (OC) use and MetS has been less thoroughly investigated, despite the widespread use of OCs among women of reproductive age. Existing studies suggest that OC use may adversely affect metabolic parameters such as blood pressure and lipid profiles, but evidence regarding its impact on MetS risk is limited and inconclusive [14,15,16]. Given the potential for hormonal contraceptives to influence cardio-metabolic health, more research is warranted to clarify these relationships, especially in diverse populations and across different reproductive stages.
Therefore, this study aimed to evaluate the associations of OC use and reproductive factors—including age at menarche, number of pregnancies, age at first delivery, and breastfeeding history—with the risk of MetS among Korean women, using a large-scale, nationally representative survey. Importantly, we conducted stratified analyses by menopausal status to address a major limitation of previous research and to better understand how these associations may differ pre and post menopause.
2. Materials and Methods
2.1. Data Source and Study Population
This study utilized data from the Korea National Health and Nutrition Examination Survey (KNHANES), an ongoing, nationally representative surveillance program conducted by the Korea Disease Control and Prevention Agency. KNHANES assesses the health and nutritional status of the Korean population and monitors trends in health-related risk factors and the prevalence of major chronic diseases. The survey employs a complex, multistage probability sampling design to ensure representativeness of the civilian, non-institutionalized Korean population. Detailed information on the survey design, sampling methods, and data collection procedures is available on the KNHANES website (http://knhanes.kdca.go.kr/).
Data from the 2010–2023 KNHANES cycles were combined following the official analytic guidelines. To ensure valid population estimates, combined survey weights were calculated and applied in all analyses, accounting for the complex multistage sampling design and integration across survey years. Among women who participated in the KNHANES from 2010 to 2023, those aged 30 to 69 years were initially selected for this study. Participants with incomplete or implausible data for any key reproductive factors, including age at menarche, age at menopause, number of pregnancies, age at first delivery, duration of breastfeeding, or history of OC use, were excluded. After these exclusions, 31,178 women with complete data remained for the final analysis. These participants were further classified into premenopausal (n = 16,323) and postmenopausal (n = 14,857) groups based on their menopausal status (Figure 1).
2.2. Covariates for Adjustment
Sociodemographic, lifestyle, and reproductive variables were included as covariates from KHANES. Body mass index (BMI) was calculated as weight in kilograms divided by the square of height in meters (kg/m²), using measured values of height and weight. Education level was classified as ≤elementary school, middle school, high school, and ≥college. Monthly household income was divided into quintiles (Q1: low, Q2: low-middle, Q3: middle, Q4: middle-high, Q5: high). Marital status was defined as having a spouse or not. Smoking status was categorized as never smoker, ex-smoker, or current smoker. Drinking habits were classified as never drinking, normal drinking (less than or equal to 4 times per month), or high drinking (more than 4 times per month). Physical activity was assessed by the number of days per week participants walked for at least 10 minutes (0, 1–3, or 4–7 days) and the number of days per week they performed strength exercises (0, 1–3, or 4–7 days).
Reproductive factors included age at menarche (years), number of pregnancies, age at first delivery (years), and number of children breastfed. Menopausal status (post-menopausal or pre-menopausal) and history of OC use (yes or no) were also included as covariates. All covariates were measured using standardized questionnaires and protocols as part of the KNHANES survey.
2.3. Metabolic Syndrome as the Study Outcome
MetS, the primary outcome of this study, was defined according to the criteria established by the National Cholesterol Education Program Adult Treatment Panel III. Specifically, MetS was diagnosed when three or more of the following five components were present: (1) increased waist circumference (>88 cm for women); (2) elevated triglycerides (≥150 mg/dL) or current use of lipid-lowering medication; (3) reduced high-density lipoprotein (HDL) cholesterol (<40 mg/dL for men or <50 mg/dL for women) or current use of medication for reduced HDL cholesterol; (4) elevated blood pressure (≥130/85 mmHg) or current use of antihypertensive medication; and (5) elevated fasting glucose (≥100 mg/dL) or current use of antidiabetic medication. This definition does not require any single component as mandatory; the presence of any three or more of the five criteria qualifies as MetS.
2.4. Statistical Analysis
All statistical analyses were conducted using R software (version 4.4.3), incorporating the complex survey design and sampling weights of the KNHANES. The survey design was specified using the svydesign function of survey package, which accounted for primary sampling units, stratification, and sampling weights to ensure nationally representative estimates.
Descriptive statistics were calculated for all covariates according to the presence or absence of MetS. For categorical variables, frequencies and percentages were presented, and for continuous variables, means and standard deviations were reported. Both unweighted for number of participants and survey-weighted descriptive statistics were generated. Standardized mean differences (SMDs) were calculated to assess the balance of covariates between groups.
To examine the association between covariates and MetS, survey-weighted logistic regression models were used. Univariable logistic regression analyses were first performed for each covariate to estimate the crude odds ratios (cOR) and 95% confidence intervals (CI) for MetS. Subsequently, multivariable logistic regression models were constructed, including all covariates simultaneously, to estimate adjusted ORs (aOR) and 95% CI. All analyses incorporated survey weights to account for the complex sampling design.
To evaluate the risk of MetS according to reproductive factors, restricted cubic spline (RCS) analyses were performed separately for premenopausal and postmenopausal women. The RCS method allows for flexible modeling of potential nonlinear relationships between continuous reproductive variables, such as age at menarche, number of pregnancies, and age at first delivery, and the odds of MetS. All covariates were adjusted for in the models. The results were visualized with aOR and 95% CI plotted against the reproductive factors. Separate plots were generated for premenopausal and postmenopausal groups to assess potential differences in associations by menopausal status.
In addition to evaluating the association between OC use and the risk of MetS defined by the presence of three or more risk components, we further assessed the relationship between OC use and the presence of MetS based on alternative thresholds, including having all five risk components, four or more, two or more, and at least one risk component. Furthermore, we examined the association between OC use and each individual component of MetS, namely high blood pressure, elevated fasting blood glucose, high triglycerides, low high-density lipoprotein (HDL) cholesterol, and abdominal obesity (excess waist circumference). These analyses were conducted separately for premenopausal and postmenopausal women, and aOR with 95% CI were estimated for each outcome.
3. Results
3.1. Baseline Characteristics by Metabolic Syndrome
Table 1 presents the baseline characteristics of the study population according to the presence or absence of MetS. Among the 31,178 women included, 8,324 (26.7%) had MetS. Women with MetS were older (mean age: 57.4 vs. 47.4 years; SMD = 0.993) and had higher BMI (26.1 vs. 22.7 kg/m²; SMD = 1.046) compared to those without MetS. The MetS group also had a higher proportion of overweight or obese individuals (BMI ≥ 25.0 kg/m²; SMD = 0.967).
In addition, women with MetS had a later age at menarche (14.7 vs. 13.9 years; SMD = 0.376), more pregnancies (3.74 vs. 2.94; SMD = 0.432), a younger age at first delivery (24.73 vs. 26.64 years; SMD = 0.459), and more breastfed children (1.90 vs. 1.05; SMD = 0.430). Post-menopausal status was more common in the MetS group (74.3% vs. 37.7%; SMD = 0.775), as was OC use (21.1% vs. 13.5%; SMD = 0.180). Other lifestyle factors, such as household income (SMD = 0.162), smoking status (SMD = 0.075), walking days per week (SMD = 0.085), and strength exercise days per week (SMD = 0.165), showed smaller differences between groups.
3.2. Associations Between Covariates and Metabolic Syndrome by Menopausal Status
Table 2 shows the associations between covariates and the risk of MetS. In both pre-menopausal and post-menopausal women, higher age and BMI were strongly associated with increased risk of MetS. For each 1-year increase in age, the aOR for MetS was 1.11 (95% CI: 1.10–1.12) in pre-menopausal women and 1.09 (95% CI: 1.08–1.10) in post-menopausal women. Each 1 kg/m² increase in BMI was associated with an aOR of 1.45 (95% CI: 1.42–1.48) and 1.31 (95% CI: 1.29–1.33), respectively.
Lower income was also linked to a higher MetS risk: compared to the highest income group, the lowest quintile had aOR of 1.45 (95% CI: 1.14–1.84) in pre-menopausal and 1.27 (95% CI: 1.10–1.48) in post-menopausal women. Current smoking was associated with higher MetS risk in both groups (aOR: 1.42 [95% CI: 1.03–1.96] for pre-menopause; 1.60 [95% CI: 1.26–2.04] for post-menopause), as was high-risk drinking (aOR: 2.13 [95% CI: 1.58–2.88] and 1.41 [95% CI: 1.16–1.73], respectively).
Engaging in strength exercise was inversely associated with MetS in post-menopausal women (aOR for 1–3 or 4–7 days/week: 0.62 [95% CI: 0.52–0.75]), but not in pre-menopausal women. OC use was associated with increased MetS risk in both groups (aOR: 1.40 [95% CI: 1.13–1.72] for pre-menopause; 1.16 [95% CI: 1.03–1.29] for post-menopause). After adjustment, age at menarche, number of pregnancies, age at first delivery, and number of breastfed children were not significantly associated with MetS in either group.
3.3. Associations Between Reproductive Factors and Metabolic Syndrome
Figure 2 illustrates the results of restricted cubic spline analyses assessing potential nonlinear relationships between reproductive factors and MetS risk, stratified by menopausal status. For age at menarche, no significant nonlinear association with MetS risk was found in either pre-menopausal (P for overall = 0.929) or post-menopausal women (P for overall = 0.655). The aORs remained stable across the age range of 8–23 years, with confidence intervals including the null value of 1.0 in both groups.
Similarly, the number of pregnancies showed no significant nonlinear association with MetS risk in either pre-menopausal (P for overall = 0.364) or post-menopausal women (P for overall = 0.460). While a slight downward trend in MetS risk was observed with increasing number of pregnancies among pre-menopausal women, it was not statistically significant. In post-menopausal women, the association remained flat across the full pregnancy range (0–13).
Age at first delivery also showed no significant nonlinear relationship with MetS risk in either group (P for overall = 0.118 for pre-menopause; 0.172 for post-menopause), with aOR remaining close to 1.0 throughout the age range of 15–43 years.
3.4. Association Between Oral Contraceptive Use and Metabolic Syndrome
Figure 3 presents the association between OC use and MetS risk in both pre-menopausal and post-menopausal women, considering different definitions of MetS and its individual components. OC use was significantly associated with increased risk of MetS—defined as having three or more metabolic risk factors—in both pre-menopausal (aOR: 1.40, 95% CI: 1.13–1.72) and post-menopausal women (aOR: 1.16, 95% CI: 1.03–1.29).
However, no significant associations were found when stricter (≥4 or all 5 components) or more lenient (≥2 or ≥1 component) definitions of MetS were applied. When examining individual MetS components, OC use was associated with higher risk of high blood pressure in both pre-menopausal (aOR: 1.30, 95% CI: 1.17–1.45) and post-menopausal women (aOR: 1.20, 95% CI: 1.01–1.43), and with high triglycerides in post-menopausal women (aOR: 1.23, 95% CI: 1.04–1.44). No significant associations were observed for elevated fasting glucose, low HDL cholesterol, or increased waist circumference in either group.
4. Discussion
In this large, nationally representative study of Korean women aged 30 to 69 years, we examined the associations between reproductive factors, including OC use, and MetS, with analyses stratified by menopausal status. Our key findings include: (1) OC use was significantly associated with increased risk of MetS in both pre-menopausal and post-menopausal women; (2) other reproductive factors such as age at menarche, number of pregnancies, age at first delivery, and breastfeeding history were not independently associated with MetS after adjusting for covariates in both pre-menopausal and post-menopausal women; and (3) OC use was particularly linked to elevations in blood pressure and triglycerides, two of the core components of MetS.
In contrast to several prior studies, our analysis did not identify significant independent associations between reproductive factors, such as age at menarche, number of pregnancy, age at first delivery, and breastfeeding history, and the risk of MetS after multivariable adjustment. A study by Kwan et al. [7] and Zuo et al. [13] found a J-shaped association between age at menarche and MetS, while a study by Ling et al. [17] reported that age at menarche was not associated with MetS risk, like this study. To understand this inconsistency, methodological differences should be considered. Many previous studies did not stratify analyses by menopausal status, despite menopause being a critical modifier of metabolic risk. The hormonal changes accompanying menopause are independently associated with increased MetS risk [18,19], and failure to stratify may obscure or confound the true associations between reproductive factors and metabolic outcomes. Also, population-specific factors may also contribute. Genetic, cultural, dietary, or environmental characteristics of women may modulate the relationships between reproductive history and metabolic risk differently [20]. These differences highlight the importance of considering population context and methodological rigor in interpreting epidemiological findings related to women’s reproductive health and long-term metabolic outcomes.
OC use was consistently associated with an increased risk of MetS in both pre-menopausal and post-menopausal women, with adjusted odds ratios of 1.40 and 1.16, respectively. This association appeared to be primarily driven by elevations in blood pressure in both groups, and by hypertriglyceridemia specifically in post-menopausal women. These findings are supported by several biological mechanisms proposed in the literature [21,22,23]. One possible explanation for the increased MetS or cardiovascular risk with OC use is the estrogen component, especially ethinylestradiol, which can raise triglyceride levels and reduce the clearance of LDL, leading to worsened lipid profiles [24,25]. Another factor is certain androgenic progestins, like levonorgestrel, which may cause sodium retention and increase blood vessel resistance, resulting in higher blood pressure [22,26]. Third, a “metabolic memory” effect may be present in post-menopausal women, where earlier exposure to OCs leads to long-term alterations in insulin sensitivity and lipid metabolism, potentially explaining the persistent elevation in triglycerides observed in this group [27]. Importantly, OC use was not significantly associated with stricter definitions of MetS (i.e., presence of ≥4 or all 5 components), nor with other individual MetS components such as fasting glucose or waist circumference. This pattern suggests that the metabolic impact of OC use may be pathway-specific targeting particular components such as blood pressure and lipid metabolism, rather than contributing to a systemic increase in overall metabolic dysfunction.
Strengths of this study include the large sample size, nationally representative design, detailed reproductive and metabolic measurements, and the stratified analytic approach by menopausal status. The use of complex survey weights and advanced statistical modeling enhances the robustness and generalizability of our findings. Especially, our restricted cubic spline analyses further confirmed the lack of significant nonlinear associations between reproductive factors and MetS, regardless of menopausal status.
Despite these strength, several limitations should be considered. First, the cross-sectional design precludes causal inference. The cross-sectional nature of this study limits our ability to infer causal relationships between reproductive history, including OC use, and the risk of MetS. Since exposure and outcome were assessed simultaneously, temporal precedence could not be established. Therefore, our findings should be interpreted as associations rather than causal links. Second, reproductive histories, and history of OC use, were based on self-reported data. This raises the possibility of recall bias, particularly among older postmenopausal women, which may lead to misclassification of exposure status. Nevertheless, to mitigate this bias, we excluded individuals with incomplete reproductive data to assess the robustness of the findings. Third, our data lacked granularity regarding the specific characteristics of OC use, such as duration, formulation (estrogen/progestin dosage), and age at initiation. These factors may differentially impact metabolic outcomes, and their absence limited our ability to perform a more nuanced analysis. Future longitudinal studies with detailed OC exposure histories are warranted to clarify these relationships. Fourth, although we employed multivariable regression models and adjusted for a wide range of potential confounders, including socioeconomic status, lifestyle factors, and comorbidities, we cannot exclude the possibility of residual confounding from unmeasured or unknown variables (e.g., dietary intake, genetic susceptibility, or psychosocial stress). Accordingly, interpretation of the results should consider this potential limitation.
5. Conclusions
In conclusion, our findings suggest that OC use is independently associated with increased risk of MetS among Korean women, regardless of menopausal status, primarily via effects on blood pressure and triglycerides. Other reproductive factors—including age at menarche, number of pregnancy, age at first delivery, and breastfeeding history—were not significantly associated with MetS after adjustment for covariates. These findings underscore the need for individualized metabolic risk assessment in women, especially those with a history of hormonal contraceptive use. Comprehensive approaches that integrate reproductive history into preventive strategies may help reduce the burden of cardio metabolic disease in women.
Author Contributions
Conceptualization, R.B.K. and I.A.C.; methodology, R.B.K.; software, R.B.K.; validation, R.B.K., I.A.C. and Y.H.C.; formal analysis, R.B.K.; investigation, I.A.C., J.J., J.L., Y.H.C., and H.L.; resources, I.A.C., J.J., J.L., Y.H.C., and H.L; data curation, I.A.C., J.J., J.L., Y.H.C., and H.L; writing—original draft preparation,I.A.C. and R.B.K.; writing—review and editing, J.J., J.L., Y.H.C., and H.L.; visualization, I.A.C. and R.B.K.; supervision, Y.H.C. and R.B.K.; project administration, Y.H.C. and R.B.K.; funding acquisition, I.A.C. All authors have read and agreed to the published version of the manuscript.
Funding
This work was supported by the research grant of the Gyeongsang National University in 2023.
Institutional Review Board Statement
Ethical review and approval were waived for this study due to the use of publicly available, de-identified data from the Korea National Health and Nutrition Examination Survey (KNHANES), which contains no personally identifiable information.
Informed Consent Statement
Patient consent was waived due to the use of publicly available, de-identified data from the KNHANES.
Data Availability Statement
The data used in this study are publicly available and can be freely downloaded from the KNHANES website (https://knhanes.kdca.go.kr/).
Acknowledgments
English proofreading was partially supported by ChatGPT (OpenAI), which was used to refine grammar and language; all content was reviewed and finalized by the authors.
Conflicts of Interest
The authors declare no conflicts of interest.
Abbreviations
The following abbreviations are used in this manuscript:
| MetS | Metabolic syndrome |
| OC | Oral contraceptives |
| KNHANES | Korea National Health and Nutrition Examination Survey |
| HDL | High-density lipoprotein |
| SMD | Standardized mean differences |
| RCS | Restricted cubic spline |
References
- Mottillo, S.; Filion, K.B.; Genest, J.; Joseph, L.; Pilote, L.; Poirier, P.; Rinfret, S.; Schiffrin, E.L.; Eisenberg, M.J. The Metabolic Syndrome and Cardiovascular Risk a Systematic Review and Meta-Analysis. J Am Coll Cardiol 2010, 56, 1113–1132. [Google Scholar] [CrossRef] [PubMed]
- Grundy, S.M.; Cleeman, J.I.; Daniels, S.R.; Donato, K.A.; Eckel, R.H.; Franklin, B.A.; Gordon, D.J.; Krauss, R.M.; Savage, P.J.; Smith, S.C.; et al. Diagnosis and Management of the Metabolic Syndrome: An American Heart Association/National Heart, Lung, and Blood Institute Scientific Statement. Circulation 2005, 112, 2735–2752. [Google Scholar] [CrossRef] [PubMed]
- El Khoudary, S.R.; Aggarwal, B.; Beckie, T.M.; Hodis, H.N.; Johnson, A.E.; Langer, R.D.; Limacher, M.C.; Manson, J.E.; Stefanick, M.L.; Allison, M.A.; et al. Menopause Transition and Cardiovascular Disease Risk: Implications for Timing of Early Prevention: A Scientific Statement From the American Heart Association. Circulation 2020, 142, e506–e532. [Google Scholar] [CrossRef] [PubMed]
- Rich-Edwards, J.W.; Fraser, A.; Lawlor, D.A.; Catov, J.M. Pregnancy Characteristics and Women’s Future Cardiovascular Health: An Underused Opportunity to Improve Women’s Health? Epidemiol Rev 2014, 36, 57–70. [Google Scholar] [CrossRef]
- Nichols, A.R.; Chavarro, J.E.; Oken, E. Reproductive Risk Factors across the Female Lifecourse and Later Metabolic Health. Cell Metab 2024, 36, 240–262. [Google Scholar] [CrossRef]
- Grandi, S.M.; Filion, K.B.; Yoon, S.; Ayele, H.T.; Doyle, C.M.; Hutcheon, J.A.; Smith, G.N.; Gore, G.C.; Ray, J.G.; Nerenberg, K.; et al. Cardiovascular Disease-Related Morbidity and Mortality in Women With a History of Pregnancy Complications. Circulation 2019, 139, 1069–1079. [Google Scholar] [CrossRef]
- Kwan, B.-S.; Yang, J.; Jo, H.C.; Baek, J.C.; Kim, R.B.; Park, J.E. Age at Menarche and Its Association With Adult-Onset Metabolic Syndrome and Related Disorders in Women: A Cross-Sectional Study of a Nationally Representative Sample Over 10 Years. Asia Pac J Public Health 2024, 36, 558–564. [Google Scholar] [CrossRef]
- Kim, Y.; Je, Y. Early Menarche and Risk of Metabolic Syndrome: A Systematic Review and Meta-Analysis. J Womens Health (Larchmt) 2019, 28, 77–86. [Google Scholar] [CrossRef]
- Glueck, C.J.; Morrison, J.A.; Wang, P.; Woo, J.G. Early and Late Menarche Are Associated with Oligomenorrhea and Predict Metabolic Syndrome 26 Years Later. Metabolism - Clinical and Experimental 2013, 62, 1597–1606. [Google Scholar] [CrossRef]
- Stöckl, D.; Meisinger, C.; Peters, A.; Thorand, B.; Huth, C.; Heier, M.; Rathmann, W.; Kowall, B.; Stöckl, H.; Döring, A. Age at Menarche and Its Association with the Metabolic Syndrome and Its Components: Results from the KORA F4 Study. PLoS One 2011, 6, e26076. [Google Scholar] [CrossRef]
- Bai, L.; Yang, X.; Sun, Z.; Luo, Z.; Li, L.; Liang, X.; Zhou, J.; Meng, L.; Peng, Y.; Qin, Y. Reproductive Factors and Metabolic Syndrome among Chinese Women Aged 40 Years and Older. J Diabetes 2022, 15, 36–46. [Google Scholar] [CrossRef] [PubMed]
- Cho, G.J.; Park, H.T.; Shin, J.H.; Kim, T.; Hur, J.Y.; Kim, Y.T.; Lee, K.W.; Kim, S.H. The Relationship between Reproductive Factors and Metabolic Syndrome in Korean Postmenopausal Women: Korea National Health and Nutrition Survey 2005. Menopause 2009, 16, 998–1003. [Google Scholar] [CrossRef] [PubMed]
- Zuo, R.; Ge, Y.; Xu, J.; He, L.; Liu, T.; Wang, B.; Sun, L.; Wang, S.; Zhu, Z.; Wang, Y. The Association of Female Reproductive Factors with Risk of Metabolic Syndrome in Women from NHANES 1999–2018. BMC Public Health 2023, 23, 2306. [Google Scholar] [CrossRef] [PubMed]
- Halperin, I.J.; Kumar, S.S.; Stroup, D.F.; Laredo, S.E. The Association between the Combined Oral Contraceptive Pill and Insulin Resistance, Dysglycemia and Dyslipidemia in Women with Polycystic Ovary Syndrome: A Systematic Review and Meta-Analysis of Observational Studies. Hum Reprod 2011, 26, 191–201. [Google Scholar] [CrossRef]
- de Araújo, P.X.; Moreira, P.; de Almeida, D.C.; de Souza, A.A.; do Carmo Franco, M. Oral Contraceptives in Adolescents: A Retrospective Population-Based Study on Blood Pressure and Metabolic Dysregulation. Eur J Clin Pharmacol 2024, 80, 1097–1103. [Google Scholar] [CrossRef]
- Silva-Bermudez, L.S.; Toloza, F.J.K.; Perez-Matos, M.C.; de Souza, R.J.; Banfield, L.; Vargas-Villanueva, A.; Mendivil, C.O. Effects of Oral Contraceptives on Metabolic Parameters in Adult Premenopausal Women: A Meta-Analysis. Endocr Connect 2020, 9, 978–998. [Google Scholar] [CrossRef]
- Bai, L.; Yang, X.; Sun, Z.; Luo, Z.; Li, L.; Liang, X.; Zhou, J.; Meng, L.; Peng, Y.; Qin, Y. Reproductive Factors and Metabolic Syndrome among Chinese Women Aged 40 Years and Older. Journal of Diabetes 2023, 15, 36–46. [Google Scholar] [CrossRef]
- Erdoğan, K.; Sanlier, N. Metabolic Syndrome and Menopause: The Impact of Menopause Duration on Risk Factors and Components. Int J Womens Health 2024, 16, 1249–1256. [Google Scholar] [CrossRef]
- Christakis, M.K.; Hasan, H.; De Souza, L.R.; Shirreff, L. The Effect of Menopause on Metabolic Syndrome: Cross-Sectional Results from the Canadian Longitudinal Study on Aging. Menopause 2020, 27, 999–1009. [Google Scholar] [CrossRef]
- Gonzalez-Bulnes, A.; Astiz, S.; Ovilo, C.; Garcia-Contreras, C.; Vazquez-Gomez, M. Nature and Nurture in the Early-Life Origins of Metabolic Syndrome. Curr Pharm Biotechnol 2016, 17, 573–586. [Google Scholar] [CrossRef]
- Godsland, I.F.; Crook, D.; Devenport, M.; Wynn, V. Relationships between Blood Pressure, Oral Contraceptive Use and Metabolic Risk Markers for Cardiovascular Disease. Contraception 1995, 52, 143–149. [Google Scholar] [CrossRef] [PubMed]
- Cameron, N.A.; Blyler, C.A.; Bello, N.A. Oral Contraceptive Pills and Hypertension: A Review of Current Evidence and Recommendations. Hypertension 2023, 80, 924–935. [Google Scholar] [CrossRef] [PubMed]
- Wang, Q.; Würtz, P.; Auro, K.; Morin-Papunen, L.; Kangas, A.J.; Soininen, P.; Tiainen, M.; Tynkkynen, T.; Joensuu, A.; Havulinna, A.S.; et al. Effects of Hormonal Contraception on Systemic Metabolism: Cross-Sectional and Longitudinal Evidence. Int J Epidemiol 2016, 45, 1445–1457. [Google Scholar] [CrossRef]
- Godsland, I.F.; Crook, D.; Simpson, R.; Proudler, T.; Felton, C.; Lees, B.; Anyaoku, V.; Devenport, M.; Wynn, V. The Effects of Different Formulations of Oral Contraceptive Agents on Lipid and Carbohydrate Metabolism. N Engl J Med 1990, 323, 1375–1381. [Google Scholar] [CrossRef]
- Khoo, C.; Campos, H.; Judge, H.; Sacks, F.M. Effects of Estrogenic Oral Contraceptives on the Lipoprotein B Particle System Defined by Apolipoproteins E and C-III Content. Journal of Lipid Research 1999, 40, 202–212. [Google Scholar] [CrossRef]
- Pechère-Bertschi, A.; Maillard, M.; Stalder, H.; Bischof, P.; Fathi, M.; Brunner, H.R.; Burnier, M. Renal Hemodynamic and Tubular Responses to Salt in Women Using Oral Contraceptives. Kidney International 2003, 64, 1374–1380. [Google Scholar] [CrossRef]
- Kim, S.-W.; Jeon, J.-H.; Lee, W.-K.; Lee, S.; Kim, J.-G.; Lee, I.-K.; Park, K.-G. Long-Term Effects of Oral Contraceptives on the Prevalence of Diabetes in Post-Menopausal Women: 2007-2012 KNHANES. Endocrine 2016, 53, 816–822. [Google Scholar] [CrossRef]
Figure 1.
Flowchart for participant selection.
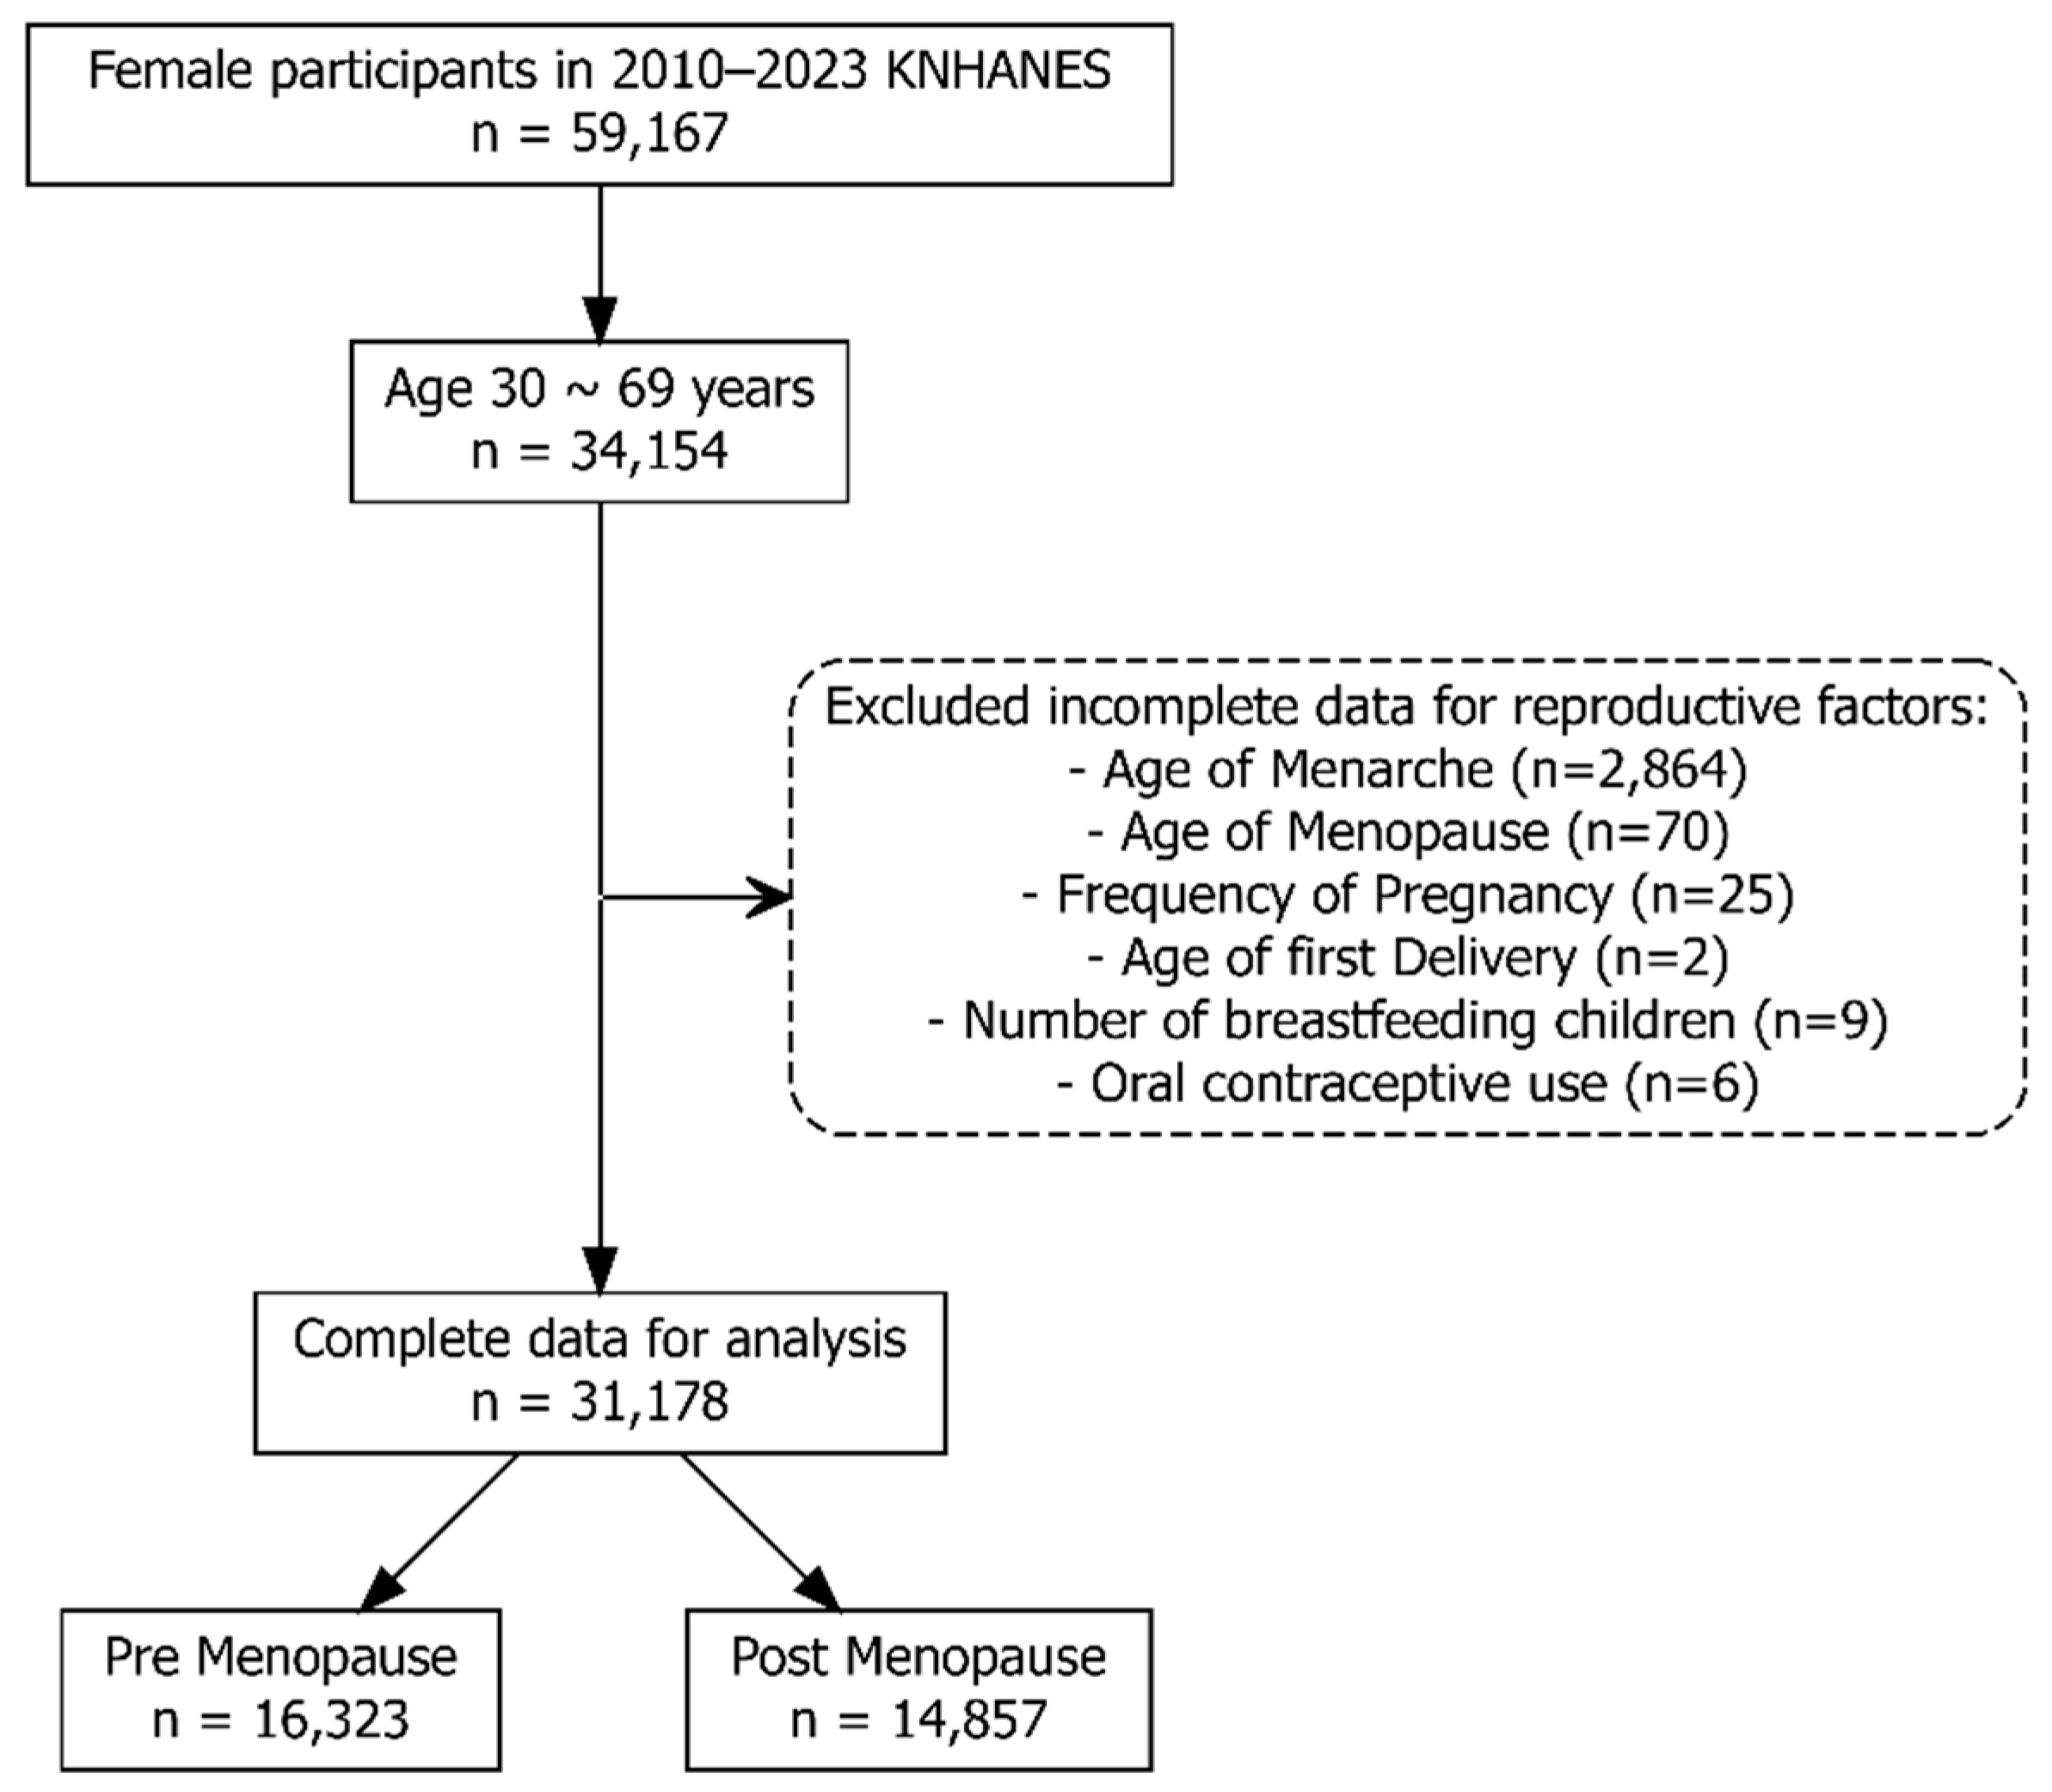
Figure 2.
Restricted cubic spline analyses of reproductive factors and risk of metabolic syndrome stratified by menopausal status. Restricted cubic spline curves illustrate the adjusted ORs and 95% confidence intervals (shaded areas) for MetS according to age at menarche (A, B), number of pregnancies (C, D), and age at first delivery (E, F), separately for premenopausal (blue, left panels) and postmenopausal women (red, right panels). Models were adjusted for age, body mass index, number of pregnancies, age at first delivery, number of breastfed children, oral contraceptive use, education level, income quintile, marital status, smoking status, drinking habits, walking frequency, and exercise frequency.
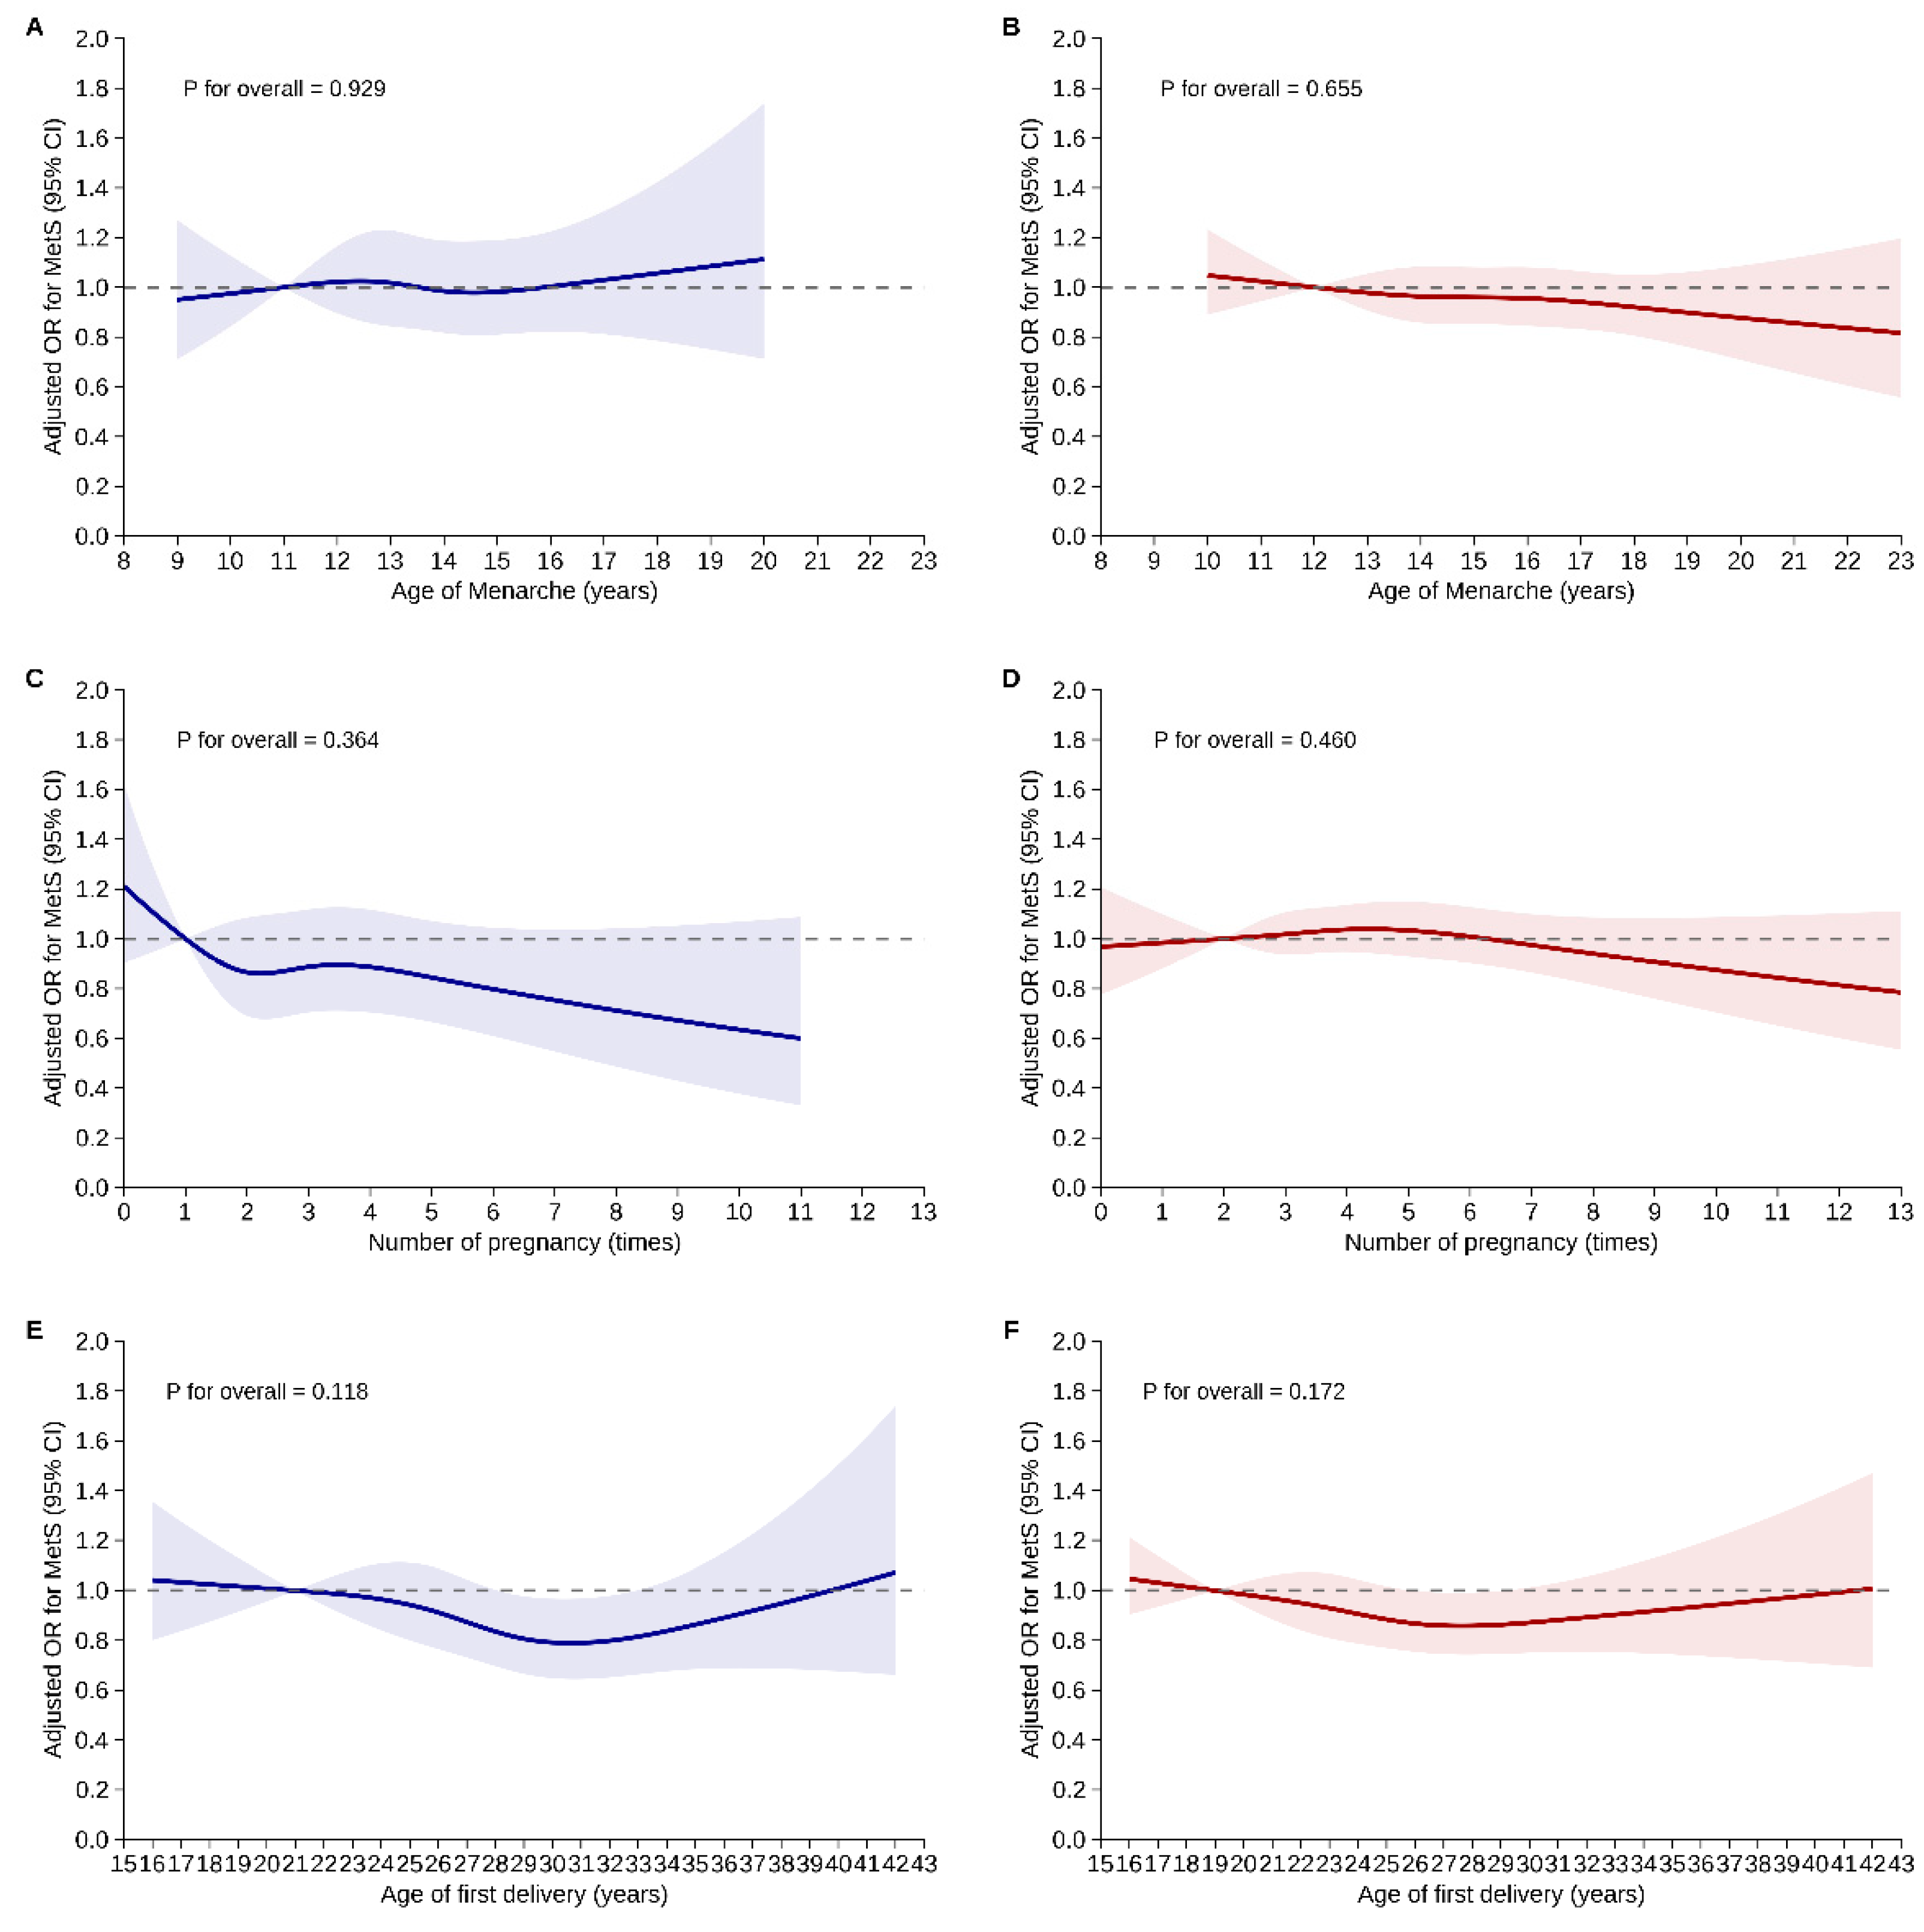
Figure 3.
Adjusted odds ratios for metabolic syndrome and its components according to oral contraceptive use, stratified by menopausal status. Forest plots display adjusted odds ratios (ORs) and 95% confidence intervals (CIs) for the association between oral contraceptive use and the risk of metabolic syndrome (MetS) and its individual components in premenopausal (left) and postmenopausal (right) women. All models were adjusted for age, body mass index, reproductive factors, education, income, marital status, smoking, alcohol consumption, and physical activity.
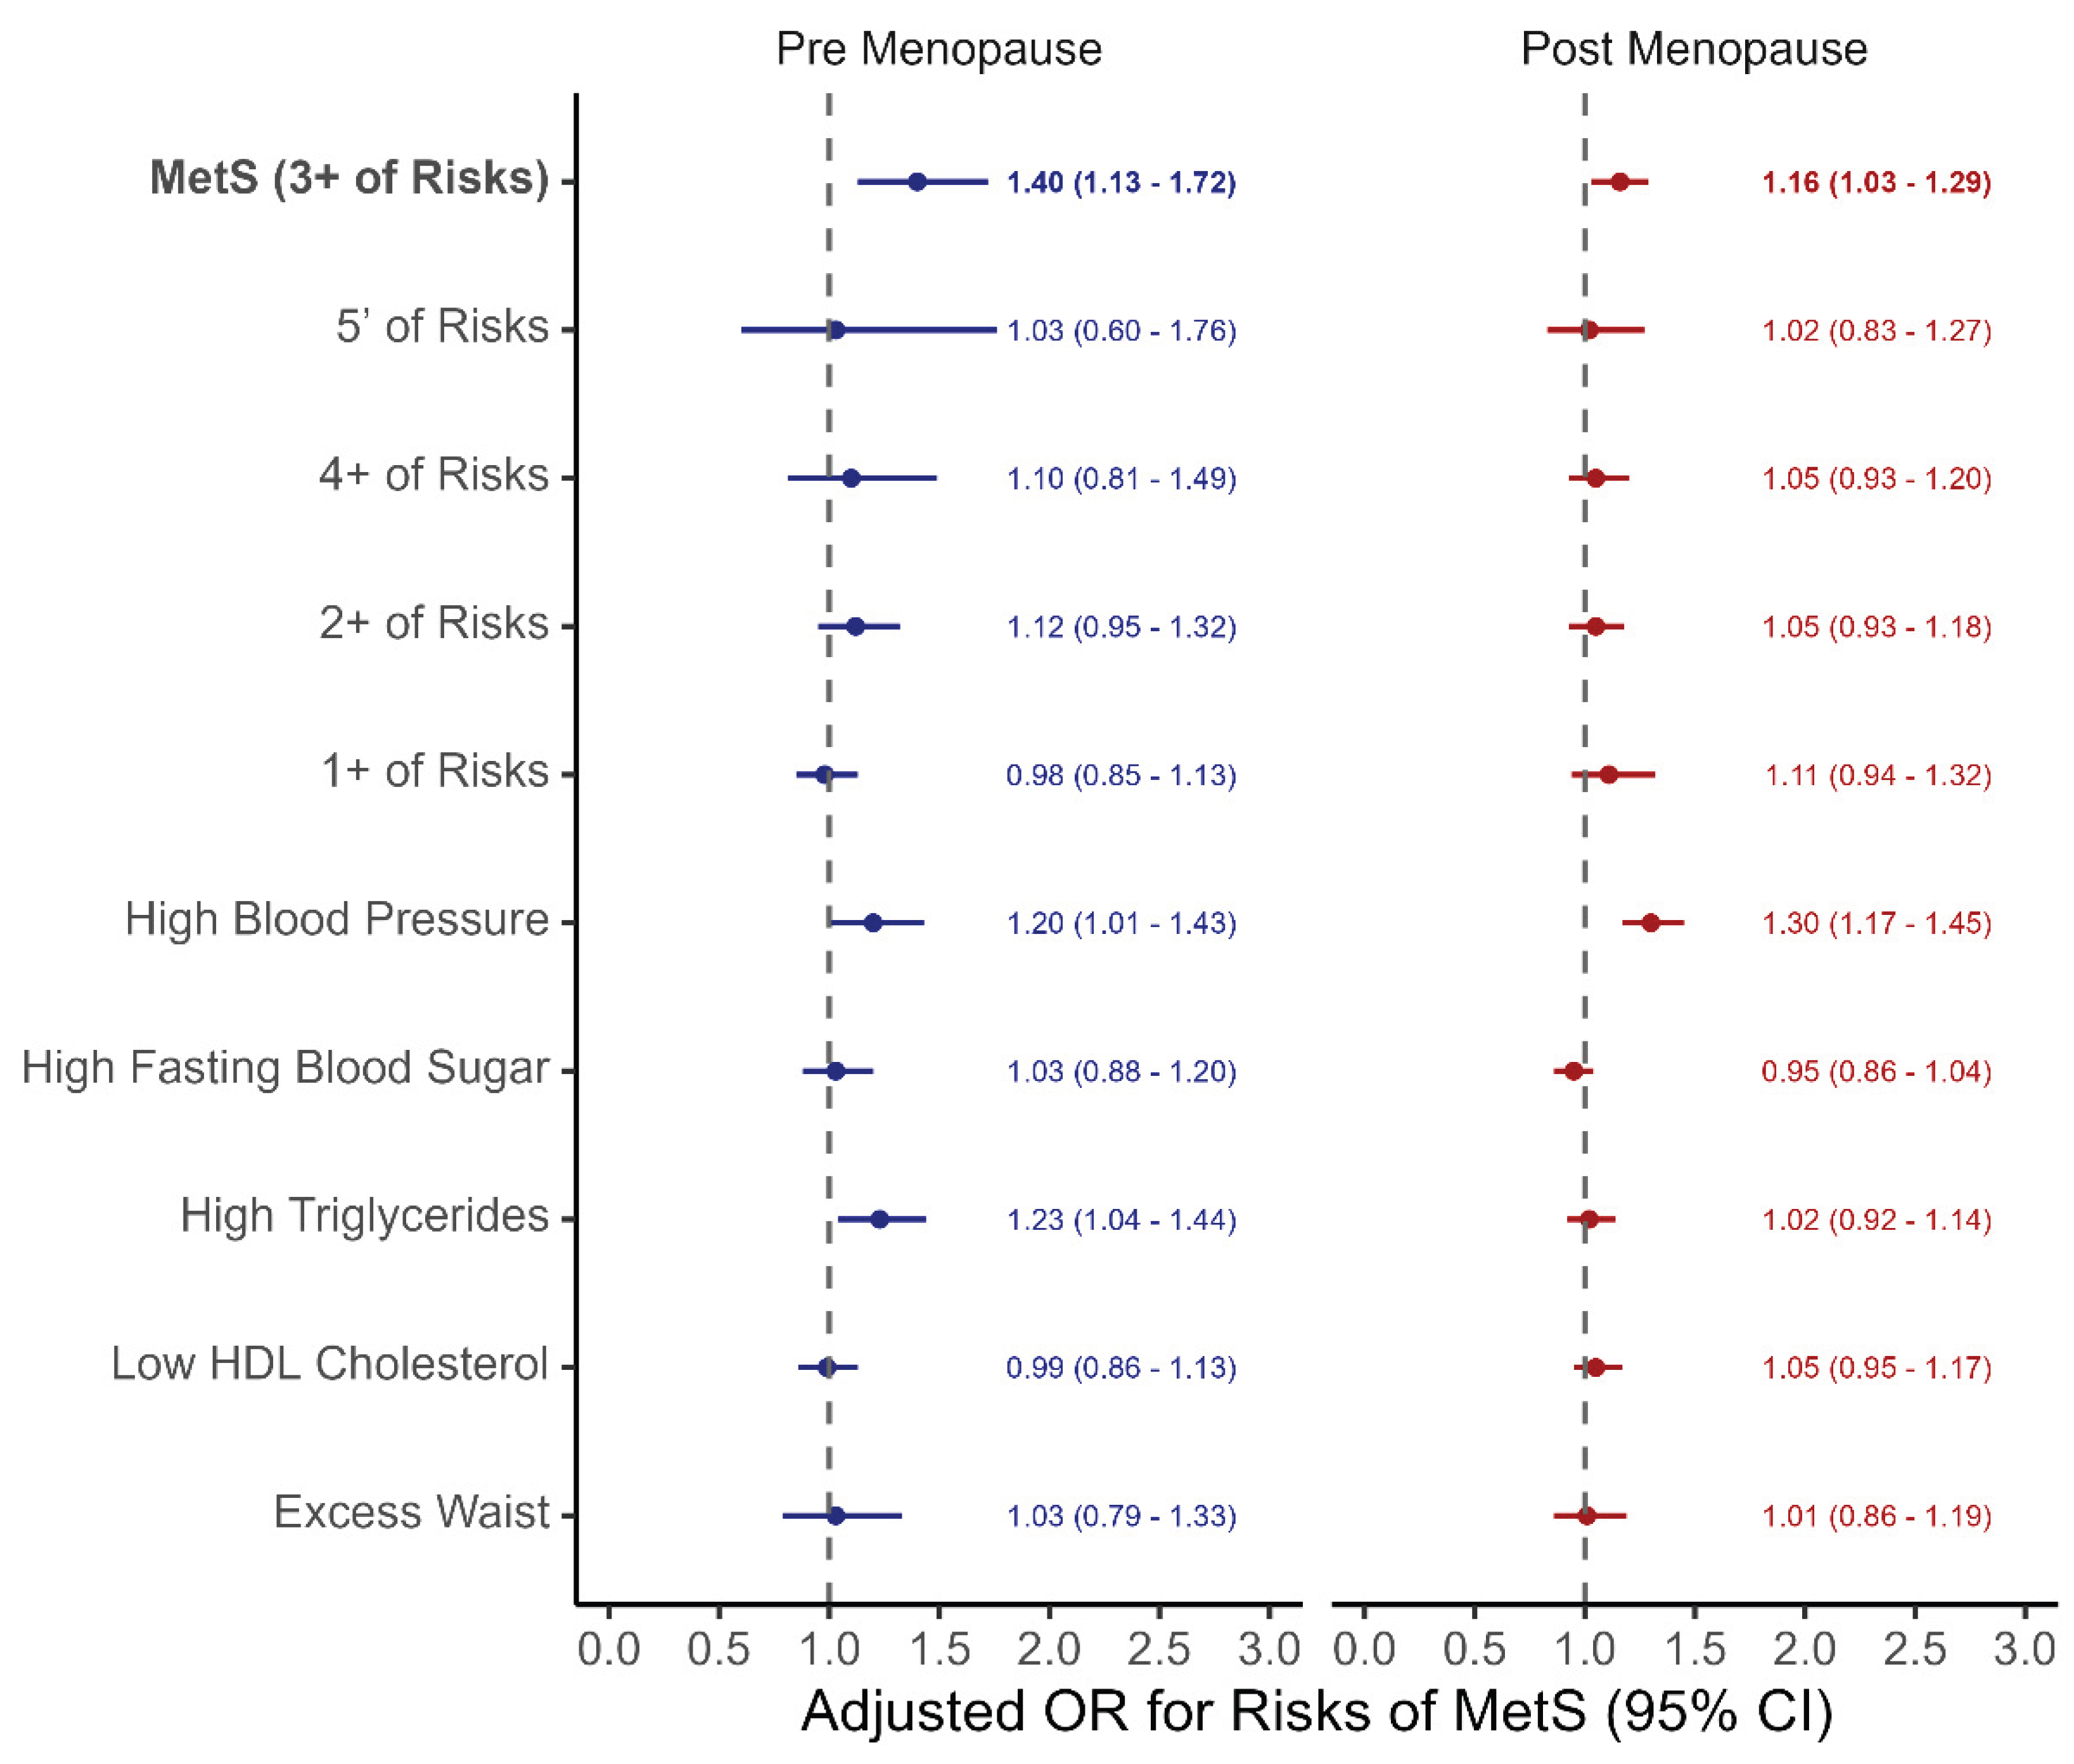

Table 1.
Baseline characteristics of study population by metabolic syndrome.
| Overall (n=31,178) | No MetS (n=21,660) | MetS (n=8,324) | SMD* | |
| Age (years), mean (±SD) | 50.1 (±11.1) | 47.4 (±10.5) | 57.4 (±9.1) | 0.993 |
| Age groups, n (%) | 0.973 | |||
| 30-39 years | 6,893 (22.1) | 6,067 (28.0) | 468 (5.6) | |
| 40-49 years | 7,846 (25.2) | 6,488 (30.0) | 1,077 (12.9) | |
| 50-59 years | 8,591 (27.6) | 5,659 (26.1) | 2,650 (31.8) | |
| 60-69 years | 7,848 (25.2) | 3,446 (15.9) | 4,129 (49.6) | |
| BMI (kg/m2), mean (±SD) | 23.6 (±3.6) | 22.7 (±3.0) | 26.1 (±3.7) | 1.046 |
| BMI groups, n (%) | 0.967 | |||
| < 18.5 | 1,304 (4.2) | 1,184 (5.5) | 44 (0.5) | |
| 18.5-24.9 | 20,447 (65.8) | 16,322 (75.4) | 3,384 (40.7) | |
| 25.0-29.9 | 7,690 (24.7) | 3,744 (17.3) | 3,703 (44.6) | |
| 30.0-34.9 | 1,403 (4.5) | 343 (1.6) | 997 (12.0) | |
| >= 35.0 | 246 (0.8) | 43 (0.2) | 183 (2.2) | |
| Education level, n (%) | 0.757 | |||
| ≦ Elementary | 5,484 (17.6) | 2,422 (11.2) | 2,851 (34.3) | |
| Middle school | 3,574 (11.5) | 1,972 (9.1) | 1,468 (17.7) | |
| High school | 10,848 (34.8) | 7,853 (36.3) | 2,596 (31.2) | |
| ≧ College | 11,240 (36.1) | 9,398 (43.4) | 1,395 (16.8) | |
| Income level, n (%) | 0.162 | |||
| Q1: Low | 6,046 (19.5) | 3,846 (17.8) | 1,929 (23.2) | |
| Q2: Low-middle | 6,229 (20.1) | 4,253 (19.7) | 1,736 (20.9) | |
| Q3: Middle | 6,240 (20.1) | 4,333 (20.1) | 1,690 (20.4) | |
| Q4: Middel-high | 6,280 (20.2) | 4,504 (20.9) | 1,566 (18.9) | |
| Q5: High | 6,246 (20.1) | 4,626 (21.5) | 1,376 (16.6) | |
| No Spouse, n (%) | 4,118 (14.0) | 2,326 (11.5) | 1,633 (20.2) | 0.243 |
| Smoking status, n (%) | 0.075 | |||
| Never smoker | 27,693 (89.0) | 19,209 (88.8) | 7,461 (89.9) | |
| Ex-smoker | 1,868 (6.0) | 1,368 (6.3) | 396 (4.8) | |
| Current smoker | 1,560 (5.0) | 1,054 (4.9) | 446 (5.4) | |
| Drinking habit, n (%) | 0.290 | |||
| Never drinking | 3,507 (11.3) | 2,745 (12.7) | 653 (7.9) | |
| Normal drinking | 23,350 (75.1) | 16,516 (76.4) | 5,941 (71.6) | |
| High drinking | 4,235 (13.6) | 2,344 (10.8) | 1,706 (20.6) | |
| Walking per week, n (%) | 0.085 | |||
| 0 day | 16,481 (52.9) | 11,521 (53.2) | 4,347 (52.2) | |
| 1-3 days | 9,770 (31.3) | 6,953 (32.1) | 2,442 (29.4) | |
| 4-7 days | 4,917 (15.8) | 3,180 (14.7) | 1,531 (18.4) | |
| Exercise per week, n (%) | 0.165 | |||
| 0 day | 25,437 (81.6) | 17,303 (79.9) | 7,121 (85.6) | |
| 1-3 days | 3,826 (12.3) | 2,976 (13.7) | 743 (8.9) | |
| 4-7 days | 1,912 (6.1) | 1379 (6.4) | 459 (5.5) | |
| Age of Menarche (years), mean (±SD) | 14.1 (±2.0) | 13.9 (±1.9) | 14.7 (±2.1) | 0.376 |
| Pregnancy (times), mean (±SD) | 3.2 (±1.9) | 2.94 (±1.8) | 3.74 (±1.9) | 0.432 |
| Age of First Delivery (years), mean (±SD) | 26.1 (±4.1) | 26.64 (±4.0) | 24.73 (±3.9) | 0.459 |
| Number of Breast Feeding (children), mean (±SD) | 1.3 (±1.8) | 1.05 (±1.6) | 1.90 (±2.2) | 0.430 |
| Post Menopause, n (%) | 14,857 (47.7) | 8,159 (37.7) | 6,187 (74.3) | 0.775 |
| Used Oral Contraceptives, n (%) | 4,858 (15.6) | 2,928 (13.5) | 1,756 (21.1) | 0.180 |
Abbreviation: BMI; body mass index, MetS; metabolic syndrome, SD; standard deviation, SMD; standardized mean difference. * SMD values of 0.2-0.5 are considered small effect size, values of 0.5-0.8 are medium, and values > 0.8 are large.
Table 2.
Uni- and multivariate analysis of risk factors for Metabolic syndrome by menopause status.
| Variables | Pre Menopause | Post Menopause | ||
|
Crude OR (95% CI) |
Adjusted OR (95% CI) |
Crude OR (95% CI) |
Adjusted OR (95% CI) |
|
| Age per 1 years | 1.10 (1.09–1.11) | 1.11 (1.10–1.12) | 1.10 (1.09–1.10) | 1.09 (1.08–1.10) |
| BMI per 1 kg/m2 | 1.43 (1.40–1.46) | 1.45 (1.42–1.48) | 1.33 (1.31–1.35) | 1.31 (1.29–1.33) |
| Education level, College | 1.00 (ref.) | 1.00 (ref.) | 1.00 (ref.) | 1.00 (ref.) |
| High school | 2.07 (1.83–2.33) | 1.06 (0.90–1.25) | 1.31 (1.16–1.49) | 1.06 (0.91–1.23) |
| Middle school | 4.53 (3.68–5.59) | 1.12 (0.84–1.51) | 2.00 (1.75–2.29) | 1.15 (0.97–1.36) |
| Elementary | 6.87 (5.47–8.63) | 1.33 (0.96–1.85) | 2.94 (2.60–3.34) | 1.19 (1.00–1.42) |
| Income level, Q5: High | 1.00 (ref.) | 1.00 (ref.) | 1.00 (ref.) | 1.00 (ref.) |
| Q4: Middel-high | 1.28 (1.07–1.52) | 1.16 (0.93–1.46) | 1.17 (1.03–1.32) | 1.09 (0.95–1.26) |
| Q3: Middle | 1.51 (1.26–1.80) | 1.26 (1.00–1.59) | 1.32 (1.16–1.49) | 1.17 (1.01–1.35) |
| Q2: Low-middle | 1.62 (1.36–1.94) | 1.31 (1.04–1.66) | 1.43 (1.27–1.62) | 1.20 (1.04–1.38) |
| Q1: Low | 2.10 (1.78–2.49) | 1.45 (1.14–1.84) | 1.58 (1.39–1.79) | 1.27 (1.10–1.48) |
| Spouse, Yes | 1.00 (ref.) | 1.00 (ref.) | 1.00 (ref.) | 1.00 (ref.) |
| No | 1.78 (1.48–2.13) | 1.04 (0.81–1.33) | 1.34 (1.22–1.48) | 0.98 (0.87–1.10) |
| Smoking status, Never smoker | 1.00 (ref.) | 1.00 (ref.) | 1.00 (ref.) | 1.00 (ref.) |
| Ex-smoker | 0.91 (0.74–1.12) | 1.03 (0.77–1.38) | 1.16 (0.95–1.41) | 1.22 (0.95–1.55) |
| Current smoker | 1.41 (1.15–1.72) | 1.42 (1.03–1.96) | 1.13 (0.93–1.37) | 1.60 (1.26–2.04) |
| Drinking habit, Never drinking | 1.00 (ref.) | 1.00 (ref.) | 1.00 (ref.) | 1.00 (ref.) |
| Normal drinking | 1.18 (1.01–1.37) | 1.28 (1.04–1.57) | 1.26 (1.08–1.46) | 1.29 (1.07–1.54) |
| High drinking | 2.55 (2.05–3.17) | 2.13 (1.58–2.88) | 1.64 (1.38–1.95) | 1.41 (1.16–1.73) |
| Walking per week, 0 day | 1.00 (ref.) | 1.00 (ref.) | 1.00 (ref.) | 1.00 (ref.) |
| 1-3 days | 1.02 (0.91–1.14) | 1.15 (0.99–1.34) | 1.01 (0.92–1.11) | 1.08 (0.96–1.22) |
| 4-7 days | 1.12 (0.96–1.31) | 0.98 (0.81–1.20) | 1.28 (1.16–1.42) | 1.08 (0.96–1.22) |
| Exercise per week, 0 day | 1.00 (ref.) | 1.00 (ref.) | 1.00 (ref.) | 1.00 (ref.) |
| 1-3 days | 0.63 (0.53–0.76) | 0.95 (0.76–1.19) | 0.60 (0.53–0.68) | 0.62 (0.52–0.75) |
| 4-7 days | 0.81 (0.63–1.03) | 0.82 (0.61–1.10) | 0.57 (0.49–0.66) | 0.62 (0.52–0.75) |
| Age of Menarche per 1 year | 1.09 (1.05–1.12) | 1.00 (0.96–1.04) | 1.07 (1.05–1.09) | 0.99 (0.96–1.01) |
| Pregnancy per 1 times | 1.18 (1.14–1.21) | 0.98 (0.94–1.03) | 1.10 (1.07–1.12) | 1.00 (0.97–1.03) |
| Age of First Delivery per 1 year | 0.92 (0.91–0.94) | 0.99 (0.97–1.01) | 0.94 (0.93–0.95) | 0.99 (0.98–1.01) |
| Breast Feeding per 1 child | 1.14 (1.09–1.18) | 0.99 (0.93–1.04) | 1.16 (1.14–1.19) | 0.99 (0.96–1.02) |
| Oral Contraceptives, Not used | 1.00 (ref.) | 1.00 (ref.) | 1.00 (ref.) | 1.00 (ref.) |
| Used | 1.42 (1.22–1.65) | 1.40 (1.13–1.72) | 1.42 (1.28–1.56) | 1.16 (1.03–1.29) |
Abbreviation: BMI; body mass index, CI; confidence interval, OR; odds ratio.
Disclaimer/Publisher’s Note: The statements, opinions and data contained in all publications are solely those of the individual author(s) and contributor(s) and not of MDPI and/or the editor(s). MDPI and/or the editor(s) disclaim responsibility for any injury to people or property resulting from any ideas, methods, instructions or products referred to in the content. |
© 2025 by the authors. Licensee MDPI, Basel, Switzerland. This article is an open access article distributed under the terms and conditions of the Creative Commons Attribution (CC BY) license (http://creativecommons.org/licenses/by/4.0/).
Copyright: This open access article is published under a Creative Commons CC BY 4.0 license, which permit the free download, distribution, and reuse, provided that the author and preprint are cited in any reuse.


