Submitted:
01 July 2025
Posted:
02 July 2025
You are already at the latest version
Abstract
In this study, we use textual analysis to identify key topics within standalone sustainability reports and evaluate their association with firm value, both currently and in the future. We also investigate the role of sustainability assurance in moderating this impact. We extract sustainability topics using Latent Dirichlet Allocation (LDA), test our hypotheses using regression analysis, and conduct supplementary analysis employing Discrete Bayesian Network (DBN) and Shapley Additive Explanations (SHAP) to support our main findings.
The main topics identified from the reports include environmental issues, sustainable consumption, daily necessities, socio-economic impact, and healthcare. When the moderating effect of assurance is factored in, we notice a significant change in how these topics influence firm value. Environmental issues and sustainable consumption have a notable impact one and two years after being addressed, whereas daily necessities affect firm value immediately and a year after coverage. However, the impact of the healthcare topic wanes after two years when assurance is considered.
Interestingly, we find assurance to influence negatively firm value a year after addressing environmental and socio-economic topics. This may imply that the initial coverage of these topics can be unfavorably perceived, or that assurance agencies can identify performance gaps due to regulatory changes, resulting in this negative impact.
Keywords:
Sustainability topics
; Sustainability reporting
; Assurance on sustainability
; Firm value
; Moderating role/effect
1. Introduction
A Corporate Social Responsibility (CSR) report, also known as a sustainability report, is a standalone report that appraises consumers, investors, and other stakeholders about the environmental, social, and governance (ESG) related activities undertaken by a company, which often go beyond its core business functions and operations. Whereas various reporting frameworks and standards exist for sustainability reporting, such as the Global Reporting Initiative (GRI), the Sustainability Accounting Standards Board (SASB), and the Task Force on Climate-related Financial Disclosures (TCFD), CSR reports vary in size, content, and format because there is no enforced reporting framework (Muslu et al. 2019). Thus, the variation in sustainability reporting makes it challenging to discern topics that are of material significance. Despite the proliferation of technological advancements in textual analysis, there remains a notable absence of critical research examining the impact of sustainability topics on firm value. To the best of our knowledge, no study has yet undertaken a comprehensive investigation into this specific area, which represents a significant gap in the current academic literature. Our research question contributes to theory by examining the phenomenon of the influence of sustainability topics on firm value, offers an explanation by means of differential effects of different sustainability topics on firm value, and provides prescriptions to companies about covering sustainability topics currently and in the future. In addition, our research question benefits academics who are interested in the importance and impact of sustainability topics on firm value and corporate managers who make decisions about their sustainability report coverage.
Extant literature extensively examines various aspects related to sustainability reports and sustainability performance. For instance, Li et al. (2023) conduct a study on the relationship between the textual characteristics of sustainability reports and sustainability performance. Their findings indicate that companies with better sustainability performance tend to use optimistic, certain, clear, and readable language in their reports. These findings align with those of Clarkson et al. (2020), who demonstrate that linguistic features and disclosure patterns in CSR reports can effectively predict actual CSR performance. Conversely, Melloni et al. (2017) find that when firms have deficiencies in their social performance, their sustainability reports tend to lack conciseness and have reduced information content. Du and Yu (2021) further emphasize the importance of readability and tone in CSR reports as a means of communicating future CSR performance and providing value-relevant information to the market. While these studies primarily focus on the relationship between sustainability reports and textual characteristics such as disclosure patterns, tone, and linguistic features, few specifically examine the discussion content of sustainability reports. Al-Shaer et al. (2022) examine the factors that determine the content of sustainability reports and find external and internal governance factors; publication of a sustainability report and financial reporting quality are the main factors. Koh et al. (2023) find that firms with superior CSR performance publish longer reports and provide incremental information in such reports relative to their financial reports, while firms with poor CSR performance use uncertain words that reduce the disclosure quality. These studies provide us with a fertile basis for our research question.
Scholars also explore various dimensions related to sustainability reports and firm market performance and accounting performance. For instance, Melloni et al. (2017) observe that firms with disappointing financial performance tend to produce longer and less accessible sustainability reports. Du et al. (2017) determine that sustainability reports enhance information transparency and facilitate the integration of sustainability information in stock valuation for investors. Eccles et al. (2014) find that high-sustainability companies significantly outperform their counterparts over the long term, both in terms of stock market and accounting performance. These studies use broad categories such as high sustainability (companies that disclose established processes and policies in sustainability practices) and low sustainability (companies that adopt almost none of these policies) (Eccles et al. 2014). In our study, we focus on specific topics within the reports that are more detailed and likely to be more informative.
Other researchers investigate various dimensions related to sustainability reports and nonfinancial firm outcomes. For example, Ertugrul et al. (2017) examine the impact of a firm’s annual report readability and ambiguous tone on borrowing costs, revealing that firms with less readable and more ambiguous annual reports not only suffer from reduced transparency in information disclosure but also experience increased costs of external financing. Similarly, Dhaliwal et al. (2014) find a negative association between CSR disclosure and the cost of equity capital. Scholars report the effects of CSR disclosure on organizational processes and performance (Eccles et al. 2014) as well as investors’ decisions (Cheng et al. 2015).
Kang et al. (2018) investigate the effect of narrative sections in 10-K reports on firms’ performance, exploring whether the tone of these narratives aligns with current earnings levels. They specifically focus on word count and tone as textual characteristics of the narrative section in 10-K reports, acknowledging its limited scope within the study. Cheng et al. (2015) use a sample of 128 graduate students as surrogates for nonprofessional investors. They acknowledge the limitation of using students due to inevitable differences between students and the general population of nonprofessional investors in terms of demographic characteristics, such as age, gender, and education, which can influence investors’ perception of CSR and their overall willingness to invest and seek assurance of CSR information (Cohen et al. 2011; Nath et al. 2013). We mitigate these limitations in our current study by avoiding surrogate measures and using standalone sustainability reports rather than 10-K reports, which tend to be limited in scope and coverage. Our sample size consists of 206 companies with 1,454 firm years for the fiscal years 2005 to 2017. Phang et al. (2023) conduct a study using annual reports and sustainability reports from Australian public companies spanning 2011 to 2021 to examine sustainability practices. Their findings reveal that the implementation of sustainability practices helped loss-making firms maintain resilience during the COVID-19 pandemic. Importantly, this study focuses on the actual sustainability practices undertaken by the firms themselves rather than solely analyzing the contents of their sustainability reports.
In a comprehensive literature review, Crous et al. (2022) find that a higher level of transparency in sustainability information led to improved financial performance. However, the authors caution against assuming that an increase in information necessarily translates to greater transparency. As a result, the contents of sustainability reports, particularly the topics covered, solicit more attention and emphasis.
Notably, none of the studies explore the influence of the specific topics covered within sustainability reports on firm value. In our study, we focus on investigating the effect of sustainability topics on firm value. Additionally, we highlight the importance of extracting thematic or sustainability topics from sustainability reports when examining the impact of sustainability reporting on firm value. While some studies use the narrative sections of 10-K reports to extract sustainability-related textual characteristics or disclosures (Dyer et al. 2017; Feldman et al. 2010; Hubbard et al. 2017; Li 2008; Nazari et al. 2017), it is crucial to recognize that 10-K reports primarily contain financial data with limited sections dedicated to management’s discussion and analysis (MD&A) and risk factors. In contrast, sustainability reports provide a broader perspective by comprehensively addressing ESG aspects. These reports typically cover topics such as environmental impact, community engagement, employee welfare, supply chain practices, and corporate governance. Additionally, the Securities and Exchange Commission (SEC) proposes climate-related information disclosures by companies, which provides us with additional motivation to examine the content in sustainability reports (SEC 2023). Therefore, our paper aims to fill this research gap and lay the groundwork for further investigations in this specific area. While sustainability topics are expected to have a direct impact on firm value, it is anticipated that this relationship will have a time lag. To account for this, we train multiple models for current as well as future years’ values of Tobin’s Q that measure firm value. Additionally, we posit that the relationship between sustainability topics and firm value will be moderated by the assurance of the sustainability report. Hence, the study aims to address the following research questions: (1) Do sustainability topics have an influence on firm value? (2) Does the assurance of the sustainability report moderate the relationship between sustainability topics and firm value?
This study employs Latent Dirichlet Allocation (LDA) to extract sustainability topics and fixed effects regression models to test the hypotheses. Thereafter, the findings are cross-examined and validated using descriptive analysis methodologies including Discrete Bayesian Network (DBN) and Shapley Additive Explanations (SHAP). Key topics we find in the reports include environmental issues, sustainable consumption, daily necessities, socio-economic impact, and healthcare. Notably, when we incorporate sustainability assurance, we see a substantial change in these topics’ impact on firm value. Environmental issues and sustainable consumption influence firm value one and two years after coverage, while daily necessities have an immediate and one-year impact. However, the effect of healthcare decreases after two years when assurance is factored in.
Counterintuitively, we find assurance negatively impacts firm value one year after reporting environmental and socio-economic topics. This could suggest that initial coverage was perceived unfavorably, or assurance agencies identified performance gaps due to regulatory changes, leading to this negative outcome. DBN and SHAP analyses affirm the general patterns of associations and interactions found in the regression analysis and uncover new multivariate associations.
The remainder of this paper is structured as follows: Section 2 provides a comprehensive review of the extant literature and formulates our hypotheses. Section 3 covers methodology. Section 4 presents empirical results from the LDA, regression, DBN, and SHAP analyses. Section 5 offers a comprehensive discussion of our findings and their implications. Finally, Section 6 presents our concluding remarks, acknowledges the limitations of our study, and suggests a path for future studies.
2. Background and Hypotheses Development
Scholars suggest that a significant number of research inquiries cannot be effectively addressed exclusively depending on a single theory (Mayer and Sparrowe, 2013). Furthermore, the amalgamation of theories has led to novel insights and transformative changes in theoretical frameworks (Makadok et al. 2018). Makadok and his colleagues propose the idea of combining various causal mechanisms, exploring their interactions via mediating and moderating effects as an avenue to contribute to theory development. Our study’s theoretical framework combines political CSR and organizational legitimacy to understand the association between sustainability topics and firm value, along with the moderating effects of assurance of sustainability reports. Political CSR views firms as political actors engaging in public deliberations and providing public goods or restricting public bads (Scherer 2018), while organizational legitimacy refers to the perception that an entity’s actions align with socially constructed norms and values (Suchman 1995).
Scholars point out that the traditional domestic approach to CSR There is a distinct difference between corporate social responsibility (CSR) and political CSR. CSR refers to the voluntary actions taken by businesses to address and improve their impact on society and the environment. It involves the integration of social and environmental concerns into business operations and interactions with stakeholders. CSR initiatives typically focus on areas such as philanthropy, environmental sustainability, ethical labor practices, community engagement, and responsible business practices. Whereas political CSR refers to the involvement of corporations in political and public policy processes with the aim of influencing and shaping government policies and regulations in favor of social and environmental goals. Political CSR goes beyond traditional CSR activities by advocating for and actively engaging in political and policy discussions, lobbying, and public advocacy (Marti and Scherer, 2016; Scherer 2018) here is a distinct difference between corporate social responsibility (CSR) and political CSR. CSR refers to the voluntary actions taken by businesses to address and improve their impact on society and the environment. It involves the integration of social and environmental concerns into business operations and interactions with stakeholders. CSR initiatives typically focus on areas such as philanthropy, environmental sustainability, ethical labor practices, community engagement, and responsible business practices. Whereas political CSR refers to the involvement of corporations in political and public policy processes with the aim of influencing and shaping government policies and regulations in favor of social and environmental goals. Political CSR goes beyond traditional CSR activities by advocating for and actively engaging in political and policy discussions, lobbying, and public advocacy (Marti and Scherer, 2016; Scherer 2018). neglects the complex and diverse institutional contexts of the global economy, particularly due to the globalization of businesses and interlinked supply chains (Naude´ et al. 2011; Scherer and Palazzo, 2011). The domestic approach to CSR assumes intact national institutions and a clear separation of public and private domains, which may not hold true in many cases, especially in fragile or failed states.
In contrast, our study adheres to Scherer’s (2018) normative-critical conceptual framework, defining political CSR as a blend of normative and descriptive scholarship aimed at responsible corporate engagement with public matters and goods while minimizing negative impacts on society. We view firms as political actors contributing to public goods, which aligns with the blurring distinction between politics and economics in the context of globalization (Scherer et al. 2014). Traditionally, the state’s role is seen as providing a framework that protects the public interest and regulates firms’ profit-seeking behavior (Henderson 2004; Jensen 2002; Sundaram and Inkpen, 2004). However, due to externalities and limitations of the law, the state has not been able to fulfill this role fully, even in advanced countries with relatively mature institutions (Henderson 2004). Scherer (2018) warns of “regulatory capture,” where regulations favor industries over public welfare. For instance, this is evident in certain sectors in the U.S., especially in healthcare and pharmaceutical sectors with high drug prices and contentious approvals. This may be attributed to industry influence on regulatory bodies like the FDA due to factors like unscrupulous practitioners and biased research. In such contexts, business firms may need to contribute to the production of public goods and the avoidance of public bads to maintain their legitimacy, as relying solely on the institutional context may not be sufficient (Marano and Kostova, 2016; Pache and Santos, 2010; Scherer et al. 2013).
We dovetail with Scherer’s appeal for a value-based approach and foundational paradigms in political CSR (Scherer 2018). Scherer and colleagues emphasize that neither managers nor researchers can accurately anticipate societal goals or determine public policy priorities on behalf of society, as they lack knowledge of diverse societal preferences (Marti and Scherer, 2016; Scherer 2018; Scherer et al. 2014; Scherer and Palazzo, 2007, 2011). Therefore, incorporating stakeholder viewpoints and their materiality assessments when evaluating sustainability topics is crucial for maintaining credibility and tackling issues of legitimacy. To ensure unbiased results, it is essential to derive empirically themes or topics from sustainability reports. These sustainability topics, influenced by a diverse array of stakeholders, are likely to mirror a democratic decision-making process, thereby affirming their relevance and legitimacy. If a company fails to meet stakeholder expectations, it could face legitimacy issues that can cause a loss of strategic reputation and increased scrutiny from regulatory bodies, potentially leading to financial repercussions (Palazzo and Scherer, 2006; Suchman 1995; Hazaea et al. 2022; Unerman 2008; Casey and Grenier, 2015; Dhaliwal et al. 2014).
We predict a positive correlation between these sustainability topics and firm value. However, we also expect a delayed impact or time lag effect. Investments in sustainability efforts tend not to yield immediate returns, which can often be attributed to various intervening factors. For example, investment into sustainable technologies or practices typically involves substantial research and development, with returns realized over an extended period. Additionally, the market may require time to recognize and reward a company’s commitment to sustainability. Customers, investors, and other stakeholders often need time to acknowledge and value a company’s dedication to sustainable practices. Building trust with stakeholders—such as customers, employees, and investors—as a sustainable business is a process that takes time. However, once this trust is established, it can lead to increased customer loyalty, higher employee engagement, and more eager investors. All these elements contribute to long-term firm value. Yet, they may not necessarily lead to immediate short-term gains. Thus, we hypothesize that:
H1:
Sustainability topics positively correlate with firm value, albeit with an expected time lag.
The extant literature provides substantial evidence regarding the impact of assuring sustainability reports. Assurance of sustainability reports is prevalent, with companies demonstrating higher levels of sustainability performance being more inclined to seek assurance (Alon and Vidovic, 2015). Assurance on sustainability reports enhances their value for capital market participants and increases the likelihood of a company’s inclusion in the Dow Jones Sustainability Index (Clarkson et al. 2020). Moreover, the quality of disclosures is improved when independent assurance is obtained (Moroney et al. 2012; Simnett et al. 2009).
Additionally, research reveals various positive outcomes associated with assured sustainability reports. Vander Bauwhede and Van Cauwenberge (2022) demonstrate a positive association between assured sustainability reports and companies’ stock market value. The credibility of information presented in sustainability reports is strengthened through assurance (Braam and Peeters, 2018; Kuzey and Uyar, 2017). Assurance also plays a significant role in enhancing corporate reputation (Hazaea et al. 2022). Carey et al. (2021) find that assurance on sustainability reports can help reduce capital constraints and lower the cost of debt for companies. Seeking assurance is also linked to improved monitoring of management behavior and the achievement of sustainability objectives (Al-Shaer and Zaman, 2019). Moreover, the value relevance of sustainability reports tends to improve over time (Peters and Romi, 2015).
Furthermore, Kim and Park (2023) conduct a study that reveals additional insight. They find that assurance on sustainability reports acts as a moderator in the negative relationship between ESG performance and information asymmetry. This highlights the multifaceted benefits of obtaining assurance on sustainability reports as well as the possibility of assurance on sustainability reports moderating the firm value effects.
Thus, we argue that the relationship between sustainability topics and firm value may vary between assured and unassured companies. We posit that the impact of sustainability topics on firm value may be stronger or more significant for assured companies compared to unassured companies, as external assurance enhances credibility and trust in the reported information. Thus, we hypothesize that:
H2:
The relationship between sustainability topics and firm value will be positively moderated by assurance on sustainability reports.
3. Methodology
3.1. Study Sample
Our study focuses on U.S. companies with a market capitalization of $20 billion or more. USA is one of the world’s largest economies and research conducted in the country has the potential to have a significant global impact on sustainability efforts. This is particularly timely given the recent and impending legislative shifts (SEC 2023). The SEC is likely to mandate climate-related disclosures by 2023, while the International Sustainability Standards Board (ISSB) plans to adopt two reporting standards on sustainability. Additionally, President Biden’s 2021 Executive Order highlights the importance of climate-related financial risk disclosure. Although ESG reporting is not mandatory in the U.S. yet, this is rapidly changing. Companies must familiarize themselves with the impending reporting requirements and relevant sustainability topics. These impending changes make our target sample of great interest to both scholars and practitioners. Additionally, we are motivated to test the boundaries of the influence of sustainability topics in a market with relatively minimal regulations. Researchers have the opportunity to replicate the study in markets with stringent regulations, such as European and Asian countries, for the purpose of conducting a comparative analysis.
Our initial sample pool comprises 297 companies, yielding 1,454 firm-years for the fiscal years 2005 to 2017. After eliminating redundant data, non-English reports, obscured text, and inaccessible variables, we are left with 1,208 firm-years (191 companies). Of these, 237 firm-years (58 companies) have assured reports, and 971 firm-years (133 companies) do not. We source all financial variables from Standard and Poor’s Capital IQ and Compustat databases. Our control variables include total inventories (INV), long-term and current period debt (Leverage), the natural logarithm of total assets (LnTotal Assets), the natural logarithm of the ration of current year revenue to prior year revenue (LnSalesGrowth), property plant and equipment (PPE), net income divided by total assets (Return on Assets), a variable that increments by 1 each year starting at 0 in the year 2006 (Trend), Environmental, Social and Governance scores. We obtain our dependent variable Tobin’s Q from the Compustat North America Database.
3.2. Topic Modeling Using LDA
Latent Dirichlet Allocation (LDA) is a popular unsupervised machine learning method used for topic modeling in text analytics to model latent topics discussed in documents (Blei et al. 2003). LDA employs a three-level hierarchical Bayesian model to model documents as a finite mixture over an underlying set of topics. Each topic is, in turn, modeled as a mixture of topic probability distributions. This allows us to represent each document as a linear function of topic probabilities, which in turn are functions of the word frequencies.
In the LDA model, the parameters can be mathematically represented as follows:
In this equation, . It is known as the Dirichlet distribution, where is the topic mixture, is the set of topics, is the set of words, and {are hyperparameters. The model parameters and latent topics are estimated using a variational expectation-maximization algorithm (Blei et al. 2003). The quality of the discrimination between topics using quantitative metrics such as perplexity and coherence scores are inspected to decide the optimal number of topics in the document corpus followed by assigning a label to each topic based on frequent words occurring in respective topics. Words such as articles and pronouns are ignored by the algorithm before the process of grouping words into topics. Further, while labeling the topics, commonly occurring nouns such as company, document, benefit, people are given less weight compared to specific terms occurring at a higher frequency within a specific topic.
The LDA method is particularly relevant as we wish to explore the nature of sustainability reporting of companies across industry sectors. LDA not only allows us to examine the distinct topic patterns in CSR documents, but also makes it possible to quantify the relative influence of topics in the discussion of each sustainability report. We use the genism library in python software to train the LDA algorithm over the CSR text documents. LDA is an unsupervised method for grouping words across documents into coherent topics, hence it does not require the authors to set any parameters for the model training. However, once the topics are determined, the words within each topic group are closely examined to label each topic. The labeling of topics involves manual inputs based on interpretation of the bag of words within each topic.
3.3. Regression Modeling
To test our two hypotheses, we fit panel regression models using clustered robust errors. Tobin’s Q and its future values (Lead-1, Lead-2, and Lead-3 Tobin’s Q) serve as our dependent variables. These proxies represent the current firm value and the anticipated firm values one, two, and three years ahead, respectively. For clarification, Lead-1 Tobin’s Q refers to future values of Tobin’s Q moved forward by one fiscal year for each company. In a similar vein, Lead-2 and Lead-3 denote Tobin’s Q advanced by two and three fiscal years, respectively.
Our analysis recognizes six latent topics (refer to section 4). However, we exclude one topic (Operations and Logistics) from the model inputs to circumvent linear dependency errors. To illustrate, linear dependency arises because the sum of the LDA weights across all six topics equals one. Therefore, given the other five estimated coefficients, the coefficient for the sixth topic becomes redundant.
Beyond the identified topics, we incorporate assurance indicators—specifically whether a firm sought assurance in a given year—into the model. Time trends and company-related covariates are also included following established literature on firm value estimation (Albuquerque et al. 2019; Luo et al. 2013; Servaes and Tamayo, 2013; Simeth and Cincera, 2016). A comprehensive list and definitions of all variables utilized in our study can be found in Appendix 1.
4. Analysis
In this study, we first identify key sustainability topics using Latent Dirichlet Allocation (LDA). We then analyze the impact of these topics on current and future firm values using regression models. Next, we evaluate how assurance factors into these relationships. Finally, we solidify our main results with additional supplementary analyses.
Table 2 shows descriptive statistics by companies that are not assured, assured, and the total sample. We compare the 10 most frequent words used in CSR documents in healthcare and IT companies (Figure 1). For this process, we remove proper nouns and conjunctions, articles, and other common stop words to retain terms that may be related to discussion topics. As shown in Figure 1, terms such as employees, global, corporate, and business are common, while there are some distinct words in each industry sector. For example, the term health is most frequently used in CSR reports of healthcare companies as expected, while IT companies use terms such as data, environmental, energy, and emissions more often. We repeat this exploration for other industry sectors, which emphasize the need for modeling the topics in CSR documents across industry sectors to see the distribution of topic themes.
We train LDA models for determining the number of topics ranging from two to 30 and observe the quality of the topic models using two well-established metrics, perplexity and coherence (Newman et al. 2011, p. 496-504). Six topics are identified using the LDA models. They can be represented as a function of words with highest frequencies as follows:
Topic_(ENVIRONMENT GLOBAL IMPACT) = 0.016*report + 0.011*employee + 0.011*product + 0.010*use + 0.009*business + 0.009*global + 0.009*include + 0.008*emission + 0.008*environmental + 0.008*management
Topic_(SUSTAINABLE CONSUMPTION) = 0.012*employee + 0.011*up + 0.009*fuel + 0.008*year + 0.007*company + 0.007*vehicle + 0.007*com + 0.007*safety + 0.006*customer + 0.006*use
Topic_(SOCIOECONOMIC IMPACT) = 0.012*employee + 0.012*business + 0.011*program + 0.010*community + 0.009*help + 0.008*corporate + 0.008*service + 0.008*customer + 0.008*report + 0.008*provide
Topic_HEALTHCARE =0.021*health + 0.011*care + 0.011*program + 0.011*patient + 0.009*product + 0.008*company + 0.007*employee + 0.006*support + 0.006*access + 0.006*work
Topic_(DAILY NECESSITIES) = 0.012*food + 0.010*product + 0.009*program + 0.008*work + 0.008*water + 0.007*company + 0.007*store + 0.007*help + 0.007*make + 0.006*consumer
Topic_(OPERATIONS AND LOGISTICS) = 0.020*energy + 0.012*customer + 0.009*employee + 0.009*program + 0.009*company + 0.007*include + 0.006*safety + 0.006*use + 0.006*emission + 0.006*project
Across the topics, we observe common terms such as employee, corporate, business, management, etc. as expected in a typical company sustainability disclosure. However, there are distinct terms in each topic that are inter-related and share common contexts. We label the topics based on the high frequency words that are distinct for each topic and that share a common context.
The first topic (environmental global impact) has a wide range of terms such as sustainability, environmental, material, waste, global, emission, and water. This topic is related to the physical environment, sustainability, impacts of a corporation on global issues such as pollutant emission, energy crisis, etc. Almost all companies dedicate a section discussing the environmental and global impact of their business entities. The second topic (socio-economic impact) has some overlapping terms with the first topic, such as environmental and energy, but the other terms appear to be more people centric. That is, terms such as social, community, team, customer, diversity, support, and financial indicators are more of a social contribution by the corporation. The social contribution may be internal – helping employees, team building, etc. or extrinsic – helping the immediate community, customers, etc. The distinct terms in the third topic category (sustainable consumption) are use, reduce, fuel, vehicle, help, facility, provide, time, and support. Most of these words indicate a theme of giving back to society through responsible and reduced consumption of resources such as fuel, facilities, and other resources. The distinct terms in the fourth topic category (healthcare) include need, medical, medicine, help, health, care, patient, and access, which point to health-related needs of employees and community. The fifth topic (daily necessities) has similar frequent words as the socio-economic impact related topic, but no terms related to finance or economics. Rather, the frequencies of terms such as food, product, program, work, water, and store are higher, indicating that this topic group pertains to the daily necessities of its employees, consumers, community, and other stakeholders of the corporation. While a few terms in the last topic (operation and logistics) are common with the Topic-1 and Topic-2 such as energy, customer, work, and environmental, there are other terms such as cost, project, safety, plan, plant, operation, service, use, etc. that indicate that this topic alludes to the logistics and operational functionality of any corporation.
4.1. Main Findings
Our findings from the linear models are presented in Table 3 and Table 4. Table 3 reveals the main effects of sustainability topics on current, Lead-1, Lead-2, and Lead-3 Tobin’s Q. Table 4 explains the moderating role of assurance on the relationships between CSR topics and firm value.
Table 3 indicates that including topics on environment and socio-economic impact in a company’s current period sustainability report significantly influences Lead-2 (p-value < 0.1), suggesting a value increase for the company two years later, given there’s no assurance sought. This lag effect is in line with our expectations. However, it is noteworthy that the impact of environment and socio-economic topics does not sustain beyond the second year.
Reporting on Daily Necessities elevates the company’s current and subsequent year’s value (p-value < 0.05), indicating immediate and sustained effects for at least two years. Furthermore, reporting on HealthCare increases not only the current and next year’s firm value but also Lead-2 (respective p-values: model 1 < 0.05, model 2 < 0.01, model 3 < 0.05). This suggests that HealthCare reporting has both an immediate and sustained effect, although the impact diminishes after the second year.
Interestingly, none of the sustainability topics show significance for Lead-3 for companies not seeking assurance. This implies that while the lag effect persists for at least two years post-reporting, its influence dwindles beyond the third year. Therefore, firms not seeking assurance might benefit from consistent HealthCare reporting due to its robust impact on current, Lead-1, and Lead-2 Tobin’s Q, thereby potentially enhancing their firm value. These results partially support Hypothesis 1 (H1).
However, when we introduce assurance as a moderating factor (Table 4), all topics except Sustainable Consumption show significance. Reporting on environmental topics in the current sustainability report increases firm value in the next year and the second-year post-inclusion (respective p-values: model 1 < 0.1; model 2 < 0.05). This impact is more pronounced when compared to scenarios of no assurance or assurance alone. Similarly, including the socio-economic impact topic also enhances firm value in the subsequent year and the second-year post-inclusion (respective p-values: model 1 < 0.05; model 2 < 0.1).
The impact of Daily Necessities and HealthCare reporting remains consistent when compared to no assurance or assurance alone, though the significance of HealthCare reporting in the second-year post-inclusion slightly drops (p-value < 0.05 to p-value < 0.1). Despite this minor change, HealthCare reporting remains more influential than other topics.
Considering the absence of any sustainability topics showing significance for Lead-3, it is crucial to maintain consistent reporting on environmental, socio-economic impact, and Daily Necessities topics, given their impact on firm value. The diminished significance over time indicates the effect is not self-sustaining. Therefore, due to the strong impact on current, Lead-1, and Lead-2 Tobin’s Q, companies should consider annual reporting on HealthCare topics to bolster their firm value. These findings partially support Hypothesis 2 (H2).
Surprisingly, the interaction of assurance with environmental topics and socio-economic impact has a negative influence on firm value in the next year and does not show significance in the following years (p-value in both cases < 0.1, Table 4). This might suggest that verified information on these topics could include unpredictable or unfavorable events, negatively impacting subsequent years’ firm value. Such a discovery warrants further investigation.
4.2. Supplementary Analyses
To cross-examine and validate the findings from the regression models, we conduct supplementary analyses using Bayesian Networks, a directed acyclic graph representing condition probabilities among variables, and Shapley Additive Explanations, a game theoretical feature importance method that ranks important textual disclosure determinants of firm value.
4.2.1. Exploring Multivariate Associations
We train a Discrete Bayesian Network (DBN) to characterize the conditional dependencies between industry sectors, assurance, ESG scores, sustainability topics in CSR reports, and the (present and future) firm values. A Bayesian network is a probabilistic graphical model that represents a set of variables and their conditional dependencies via a directed acyclic graph (DAG) (Koller and Friedman, 2009) and can be represented as follows:
In this equation, are the parents of variable . The two components of a Bayesian network are the graph structure and the numerical (conditional) probabilities assigned for each variable given its parents. Structural learning of the Bayesian network can either be done through expert inputs, or using automated methods such as grow-shrink, greedy search, or genetic algorithms (Nagarajan et al. 2013). Our model has four tiers of variables: (i) industry sectors, (ii) ESG scores and assurance, (iii) CSR topics, and (iv) present and future firm values. If the topic score for a CSR document is greater than 0.15, we assume the topic to be present, and to be absent otherwise. We initialize the automated learning by blacklisting directed edges from topics to industry sectors, assurance, ESG scores, and from firm values to topics. That is, we enforce a rule that the Bayesian network cannot have a direct link from lower tier to the higher tier variables from the outcomes of the inputs. Next, we enforce the rule that variables within the same tier are not linked to each other as between-level effects is not our focus. After comparing the classification error for nodes using different structural learning methods, we consider the hill climbing greedy search method (Tsamardinos et al. 2006) for generating the structure of the Bayesian network shown in Figure 2. The pairwise conditional probabilities of each topic variable given its parents is shown as corresponding edge labels.
The DBN shows that topics included by firms in their CSR reports are differently related to their industry sector membership. For example, CSR reports of IT companies have 0.61 and 0.95 probabilities of including text related to socio-economic impact and environmental topics respectively. Firms with assurance tend to include more text related to environmental topics than non-assured firms and less on sustainable consumption, daily necessities, and socio-economic impact topics. The model also shows that healthcare companies predominantly focus on healthcare topics in their CSR reports while firms in the energy sector emphasize health topics with a low probability of 15% in their CSR reports. The results of the Bayesian network not only reaffirm certain findings based on the regression analysis, but also uncover new multivariate associations.
4.2.2. Ranking the Predictive Contributions Variables
We examine the contribution of each feature in predicting present and future values of Tobin’s Q using the Shapley Additive Explanations (SHAP) method (Lundberg and Lee, 2017). The SHAP method uses a coalitional game theoretic approach where a prediction is explained by assuming that each feature is a player in a game where the prediction is the payout. We train a state-of-the-art machine learning model called XGBOOST (Chen and Guestrin, 2016) to predict the four outcomes independently using the input features, and then use SHAP to identify the contributions of the input features to the model’s prediction. The feature contributions in Table 5 show that topics discussed in CSR reports can serve as important predictors of present and future values of Tobin’s Q. Most industry sector indicators contribute minimally towards making predictions of firm value.
5. Discussion
In this study, our underlying assumption is that companies engage in CSR activities with the aim of benefiting society. We argue that private businesses have a vested interest in pursuing societal good due to institutional pressures and isomorphic change (Slack and Hinings, 1994), in addition to the instrumental perspectives (Freeman 2011; Cornell and Shapiro, 1987; Donaldson and Preston, 1995; Platonova et al. 2018), and strategic CSR (Baron 2001; Bondy et al. 2012). These ontological assumptions are partially supported when we examine the association of sustainability topics and the firm’s current value. However, in some instances, we find stronger results when considering the time-lagged effect. These findings are consistent with our hypotheses even though we observe some deviations.
We observe a positive association between environment and socio-economic topics and Lead-2 Tobin’s Q when no assurance is sought. Whereas the lag effect is in line with our expectations, it is noteworthy that the influence of environment and socio-economic topics does not sustain beyond the second year. Evidently, the association of environment and socio-economic topics and firm value as measured by Tobin’s Q is not self-sustaining. It suggests that while legitimacy may be acquired over time, organizations need to engage actively in maintaining it. This observation aligns with Suchman’s (1995) conceptualization of legitimacy management, involving gaining, maintaining, and repairing legitimacy. We also observe that Daily Necessities and HealthCare have an immediate and sustained effect on firm value, although the impact tapers after the second year. This could signify heightened sensitivity among stakeholders towards these topics.
Furthermore, we hypothesize that assuring sustainability reports enhances their credibility and trustworthiness. However, our results display mixed outcomes. Except for Sustainable Consumption, all topics display significance when assurance is considered as a moderating factor. Interestingly, assurance negatively impacts firm value in the immediate year following the report when associated with environmental topics and socio-economic topics, with no significant effect in subsequent years.
These counterintuitive findings warrant further exploration within the framework of legitimacy theory. We find it crucial to consider two central traditions within this theory: the strategic tradition, focusing on how organizations manipulate symbols for societal support, and the institutional tradition, which underscores cultural pressures beyond organizations’ control (Suchman 1995). These traditions may have diverse but equally plausible explanations for the counterintuitive findings. For instance, institutionalists may argue the lack of mandatory sustainability reporting in the USA reduces institutional pressure, causing investors to view voluntary sustainability investments negatively. Whereas the strategic tradition may question the materiality and informativeness of sustainability topics and assurance reports, alluding to potential communication strategy failures.
Legitimacy Theory is a complex and multidimensional phenomenon that can help us understand the real value of sustainability reporting. Applying the full spectrum of legitimacy theory, from the institutionalist perspective (external) to a strategic theorist perspective (internal) may allow researchers to explore the various dimensions of sustainability topics and gain insights into why and how firms engage in and disclose their sustainability practices or why they may assure or not assure their sustainability reports.
Makadok et al (2018) emphasize the significance of boundary conditions within theories, which define the scenarios where a theory holds its effectiveness and those where its relevance weakens or disappears. The unexpected outcomes of our study could suggest limitations based on context. Could it be plausible that, without institutional pressure, the adoption of sustainability themes and the strategic decision to assure a report offer no discernible advantages or even have adverse effects? Replicating this study in a heavily regulated environment might provide valuable insights.
Future studies should explore Functional fixation theory as an alternative conceptual framework to illuminate further some of these findings. Functional fixation refers to a conditioning effect where individuals become fixated on using certain data for specific functions, which may hinder their ability to use the same data for different purposes or their inability to incorporate additional data beyond traditional axioms (Haka et al. 1986). We opine that Functional fixation theory may explicate some of the counterintuitive findings. For instance, in the context of assurance, we find a negative moderating effect on the firm value a year after reporting on environmental and socio-economic topics. While we expect a lagged effect, the directionality is surprising. Possible explanations include impending regulatory changes or users’ naivety or insufficient understanding of CSR data. While some scholars attribute fixation to a paucity of experience or pertinent data (Chen and Schoderbek, 2000; Gupta and King, 1997; Waller et al. 1999), Luft and Shields (2001) discover that accounting knowledge does not necessarily mitigate fixation on accounting – accounting itself influences the learning process. Their perspective suggests that stakeholder sophistication and comprehension play a pivotal role in data fixation.
The intricate dynamics of decision-making and data fixation in CSR engagement necessitate an intricate understanding through multiple theoretical lenses. The acknowledgment of the delayed benefits inherent in sustainability investments highlights the relevance of theories like functional fixation and diffusion of innovations. In-depth exploration of these theoretical frameworks in future studies promises to enhance the comprehensive understanding of Sustainability topics.
From a methodological viewpoint, we use the Latent Dirichlet Allocation (LDA) method to identify sustainability topics within CSR reports. LDA is a statistical model that identifies topics based on recurring words throughout all documents and then characterizes each document using topic probabilities (Blei et al. 2003). From our analysis, we recognize six topics in the corpus of CSR reports, which we categorize as environmental, sustainable consumption, daily necessities, operations and logistics, socio-economic impact, and healthcare. We omit the Operations and Logistics topic from model inputs to avoid linear dependency errors.
However, as with all LDA-based studies, there are certain limitations. First, LDA topics require more interpretation by the researcher as CSR reports encompass both qualitative and quantitative elements. Second, changes in topics within CSR reports in this study are due to reasons other than regulation, as this area is not regulated (Muslu et al. 2019). We also acknowledge that some sectors may emphasize certain topics in their sustainability reports more than others, for instance, the healthcare sector may focus more on healthcare topics. Even though industry classification is mandatory, topic prioritization in sustainability reports is voluntary. We account for these potential variations by controlling for industry sectors in our model, thereby highlighting the effect of topic distributions in CSR reporting on firm value. Lastly, Tobin's Q is a useful measure of a firm's valuation, however, it is not devoid of criticisms, similar to other popular quantitative measures. While Tobin’s Q formula is intuitive and proves to be a reliable indicator of effective management and operational practices of firms, it makes assumptions including perfect competition, frictionless markets, industry bias, and equal access to information. Future work can bolster our findings using other valuation methods and metrics.
Our main analysis focuses on applying linear models to explain hypothesized relationships between CSR topics, assurance, and both current and future firm values. This falls under the explanatory modeling approach, which aims to uncover underlying patterns and provide insight into the current state of a phenomenon. We supplement these findings with two independent machine learning methods for descriptive and predictive modeling, namely Bayesian networks and SHAP. These methods complement our main findings by presenting alternative perspectives on sustainability reporting and its potential links to firm value. They also serve as robustness checks for our empirical analysis, reducing the risk that regression results could be fortuitous (Venkatesh et al. 2013). Our study combines explanatory modeling, which seeks to answer “what is” happening, with predictive modeling, which attempts to forecast “what will be” based on current data. Both data analysis philosophies are important and complementary. Finally, we focus on sustainability reporting in this study. However, it may be interesting to study simultaneous associations of financial and sustainability disclosures with firm value and performance as a future study.
6. Conclusions
Despite certain limitations inherent to sustainability research, our study makes valuable contributions to theory, practice, and policy (Corley and Gioia, 2011). The intricacies and intersectional nature of sustainability require a comprehensive, multi-theory approach. We utilize the political CSR theory and legitimacy theory to shape our conceptual framework and employ the fixation theory to explain the observed time-lagged effect on various topics. We concede that additional research is needed to explore other conceptual frameworks and analytical approaches. To address this, future studies could consider theories such as functional fixation, multi-stakeholder, and diffusion of innovations. The multidimensionality of legitimacy theory warrants further exploration.
Sustainability research’s inherent complexity may limit our ability to isolate variables and establish causal relationships, possibly affecting the certainty of our conclusions. To counter this limitation in our study, we control for industry sectors and exclude country-level variance.
Our study, focusing solely on U.S. firms, reveals that some topics immediately impact firm value, while others have a deferred impact. Additionally, we find that these impacts are not self-perpetuating, with no topic significantly influencing after the third year. This knowledge can guide policymakers in devising effective strategies, such as setting appropriate intervals for sustainability reporting.
Our research can also aid organizations in identifying vital topics for their sustainability reports and crafting effective communication strategies around these issues. This practice can enhance transparency, improve corporate reputation, and foster trust among stakeholders. For instance, we discover that reporting on Environment and Socio-Economic Impact significantly impacts Lead-2 Tobin’s Q, suggesting a two-year lag in increased firm value, which does not extend beyond the second year. Reporting on Daily Necessities positively influences the firm’s value for the current and subsequent years, indicating immediate and sustained effects within the first two years. Similarly, Healthcare reporting also elevates the firm’s value for the present and the following two years. Among the topics, Healthcare generates the most significant and sustained impact. Organizations would thus benefit from not only supporting Healthcare initiatives but also consistently monitoring, tracking, and reporting on those initiatives.
Appendix 1 Variable definitions
INV: Total inventories scaled by total assets.
Leverage: The long term and current period debt, scaled by total assets.
LnTotalAssets: The natural logarithm of total assets.
LnSalesGrowth: The natural logarithm of the ratio of current-year revenue to prior year revenue.
PPE: Property, plant and equipment scaled by total assets.
Return on Assets: Net Income scaled by Total Assets.
Trend: A variable that increases by 1 each year, starting at 0 in the year 2006.
Environmental Score: A score that reflects the environmental performance of a company in the past year. The highest possible score is 100 and lowest possible score is 0. Scores obtained from Standard & Poor’s Capital IQ Pro.
Social Score: A score that reflects the social performance of a company in the past year. The highest possible score is 100 and lowest possible score is 0. Scores obtained from Standard & Poor’s Capital IQ Pro.
Governance Score: A score that reflects the governance performance of a company in the past year. The highest possible score is 100 and lowest possible score is 0. Scores obtained from Standard & Poor’s Capital IQ Pro.
Tobin’s Q: We obtain Tobin’s Q from the Compustat North America Database.
References
- Albuquerque, R. , Koskinen, Y., and Zhang, C. (2019). Corporate social responsibility and firm risk: Theory and empirical evidence. Management Science 65(10), 4451-4469. [CrossRef]
- Alon, A. and Vidovic, M. (2015). Sustainability performance and assurance: Influence on reputation. Corporate Reputation Review 18, 337-352.
- Al-Shaer, H. , Albitar, K., and Hussainey. K. (2022). Creating sustainability reports that matter: an investigation of factors behind the narratives. Journal of Applied Accounting Research 23(3), 738-763.
- Al-Shaer, H. and Zaman, M. (2019). CEO compensation and sustainability reporting assurance: Evidence from the UK. Journal of Business Ethics 158, 233-252.
- Baron, D. P. (2001). Private politics, corporate social responsibility, and integrated strategy. Journal of Economics & Management Strategy 10(1), 7-45.
- Blei, D. M. , Ng, A. I. ( 2003). Latent dirichlet allocation. Journal of Machine Learning Research 3(Jan), 993–1022.
- Bondy, K. , Moon, J., and Matten, D. (2012). An institution of corporate social responsibility (CSR) in multinational corporations (MNCs): Form and implications. Journal of Business Ethics 111, 281-299.
- Braam, G. and Peeters, R. (2018). Corporate sustainability performance and assurance on sustainability reports: Diffusion of accounting practices in the realm of sustainable development. Corporate Social Responsibility and Environmental Management 25(2), 164-181.
- Carey, P. , Khan, A., Mihret, D. G., and Muttakin, M. B. (2021). Voluntary sustainability assurance, capital constraint and cost of debt: International evidence. International Journal of Auditing 25(2), 351-372.
- Casey, R. J. and Grenier, J. H. (2015). Understanding and contributing to the enigma of corporate social responsibility (CSR) assurance in the United States. Auditing: A Journal of Practice & Theory, 34(1), 97-130.
- Chen, K. C. and Schoderbek, M. P. (2000). The 1993 tax rate increase and deferred tax adjustments: A test of functional fixation. Journal of Accounting Research 38(1), 23-44.
- Chen, T. and Guestrin, C. (2016, August). Xgboost: A scalable tree boosting system. In Proceedings of the 22nd ACM sigkdd international conference on knowledge discovery and data mining (pp. 785-794).
- Cheng, M. M. , Green, W. J., and Ko, J. C. W. (2015). The impact of strategic relevance and assurance of sustainability indicators on investors’ decisions. Auditing: A Journal of Practice & Theory 34(1), 131-162.
- Clarkson, P. M. , Ponn, J., Richardson, G. D., Rudzicz, F., Tsang, A., and Wang, J. (2020). A textual analysis of US corporate social responsibility reports. Abacus 56(1), 3-34.
- Cohen, J. R. , Holder-Webb, L., Wood, D., and Nath, L. (2011). Retail investors’ perceptions of the decision-usefulness of economic performance, governance, and corporate social responsibility disclosures. Behavioral Research in Accounting 23(1), 109-129.
- Corley, K. G. and Gioia, D. A. (2011). Building theory about theory building: What constitutes a theoretical contribution? Academy of Management Review 36 (1), 12-32.
- Cornell, B. and Shapiro, A. C. (1987). Corporate stakeholders and corporate finance. Financial Management 16(1), 5-14. [CrossRef]
- Crous, C. , Battisti, E., and Leonidou E. (2022). Non-financial reporting and company financial performance: a systematic literature review and integrated framework. EuroMed Journal of Business 17(4), 652-676.
- Dhaliwal, D. , Li, O. Z., Tsang, A., and Yang, Y. G. (2014). Corporate social responsibility disclosure and the cost of equity capital: The roles of stakeholder orientation and financial transparency. Journal of Accounting and Public Policy 33(4), 328-355.
- Donaldson, T. and Preston, L. E. (1995). The stakeholder theory of the corporation: Concepts, evidence, and implications. Academy of Management Review 20(1), 65-91.
- Du, S. , and Yu, K. (2021). Do corporate social responsibility reports convey value relevant information? Evidence from report readability and tone. Journal of Business Ethics 172(2), 253-274.
- Du, S. , Yu, K., Bhattacharya, C. B., and Sen, S. (2017). The business case for sustainability reporting: Evidence from stock market reactions. Journal of Public Policy & Marketing 36(2), 313-330.
- Dyer, T. , Lang, M., and Stice-Lawrence, L. (2017). The evolution of 10-K textual disclosure: Evidence from Latent Dirichlet Allocation. Journal of Accounting and Economics 64(2-3), 221-245.
- Eccles, R. G., Ioannou, I., & Serafeim, G. (2014). The impact of corporate sustainability on organizational processes and performance. Management Science 60(11), 2835-2857.
- Ertugrul, M., Lei, J., Qiu, J., and Wan, C. (2017). Annual report readability, tone ambiguity, and the cost of borrowing. Journal of Financial and Quantitative Analysis 52(2), 811-836.
- Feldman, R. , Govindaraj, S., Livnat, J., and Segal, B. (2010). Management’s tone change, post earnings announcement drift and accruals. Review of Accounting Studies 15(4), 915-953.
- Freeman, I., & Hasnaoui, A. (2011). The Meaning of Corporate Social Responsibility: The Vision of Four Nations. Journal of Business Ethics, 100(3), 419–443. [CrossRef]
- Governance and Accountability Institute (GAO). 2019. FLASH REPORT: 86% of S&P 500 Index® Companies Publish Sustainability / Responsibility Reports in 2018. https://www.ga-institute.com/press-releases/article/flash-report-86-of-sp-500-indexR-companies-publish-sustainability-responsibility-reports-in-20.html.
- Gupta, M. and King, R. R. (1997). An experimental investigation of the effect of cost information and feedback on product cost decisions. Contemporary Accounting Research 14(1), 99-12.
- Haka, S. , Friedman, L., and Jones, V. (1986). Functional fixation and interference theory: A theoretical and empirical investigation. Accounting Review 61(3), 455-474.
- Hazaea, S. A. , Zhu, J., Khatib, S. F., Bazhair, A. H., and Elamer, A. A. (2022). Sustainability assurance practices: A systematic review and future research agenda. Environmental Science and Pollution Research 29(4), 4843-4864.
- Henderson, P. D. (2004). The role of business in the modern world. Progress, Pressures and Prospects for the Market Economy. London: Institute of Economic Affairs.
- Hubbard, T. D. , Christensen, D. M., and Graffin, S. D. (2017). Higher highs and lower lows: The role of corporate social responsibility in CEO dismissal. Strategic Management Journal 38(11), 2255-2265.
- Jensen, M. C. (2002). Value maximization, stakeholder theory, and the corporate objective function. Business Ethics Quarterly 12(2), 235-256. https://doi-org.washburn.idm.oclc.org/10. 2307. [Google Scholar]
- Kang, T. , Park, D. H., and Han, I. (2018). Beyond the numbers: The effect of 10-K tone on firms’ performance predictions using text analytics. Telematics and Informatics 35(2), 370-381.
- Kim, J. W. and Park, C. K. (2023). Can ESG performance mitigate information asymmetry? Moderating effect of assurance services. Applied Economics 55(26), 2993-3007.
- Koh, K. , Li, H., and Tong, Y. H. (2023). Corporate social responsibility (CSR) performance and stakeholder engagement: Evidence from the quantity and quality of CSR disclosures. Corporate Social Responsibility & Environmental Management 30(2), 504-517. [CrossRef]
- Koller, D. and Friedman, N. (2009). Probabilistic graphical models: principles and techniques. MIT press.
- Kuzey, C. and Uyar, A. (2017). Determinants of sustainability reporting and its impact on firm value: Evidence from the emerging market of Turkey. Journal of Cleaner Production, 143, 27-39.
- Li, F. (2008). Annual report readability, current earnings, and earnings persistence. Journal of Accounting and Economics 45(2-3), 221-247.
- Li, Z. , Jia, J., and Chapple, L. J. (2023). Textual characteristics of corporate sustainability disclosure and corporate sustainability performance: Evidence from Australia. Meditari Accountancy Research 31(3), 786-816.
- Luft, J. L. and Shields, M. D. (2001). Why does fixation persist? Experimental evidence on the judgment performance effects of expensing intangibles. The Accounting Review 76(4), 561-587.
- Lundberg, S. M. and Lee, S. I. ( 2017). A unified approach to interpreting model predictions. Advances in Neural Information Processing Systems 30, 4768–4777.
- Luo, X., Zhang, J., and Duan, W. (2013). Social media and firm equity value. Information Systems Research 24(1), 146-163. [CrossRef]
- Makadok, R., Burton, R., and Barney, J. (2018). A practical guide for making theory contributions in strategic management. Strategic Management Journal 39 (6), 1530-1545.
- Marano, V. and Kostova, T. (2016). Unpacking the institutional complexity in adoption of CSR practices in multinational enterprises. Journal of Management Studies (John Wiley & Sons, Inc.), 53(1), 28-54.
- Marti, E. and Scherer, A. G. (2016). Financial regulation and social welfare: The critical contribution of management theory. Academy of Management Review 41(2), 298-323.
- Mayer, K. J. and Sparrowe, R. T. (2013). Integrating theories in AMJ articles. Academy of management Journal 56(4), 917-922.
- Melloni, G. , Caglio, A. and Perego, P. (2017). Saying more with less? Disclosure conciseness, completeness and balance in Integrated Reports. Journal of Accounting and Public Policy 36(3), 220-238.
- Moroney, R. , Windsor, C., and Aw, Y. T. (2012). Evidence of assurance enhancing the quality of voluntary environmental disclosures: An empirical analysis. Accounting & Finance 52(3), 903-939.
- Muslu, V. , Mutlu, S., Radhakrishnan, S., and Tsang, A. (2019). Corporate social responsibility report narratives and analyst forecast accuracy. Journal of Business Ethics 154(4), 1119-1142.
- Nagarajan, R., Scutari, M., and Lèbre, S. (2013). Bayesian Networks in R. In Bayesian Networks in R. Springer, 122, 125-127.
- Nath, L. , Holder-Webb, L., and Cohen, J. (2013). Will women lead the way? Differences in demand for corporate social responsibility information for investment decisions. Journal of Business Ethics 118(1), 85-102.
- Naudé, W., Santos-Paulino, A. U., and McGillivray, M. (Eds.). (2011). Fragile states: Causes, costs, and responses. Oxford University Press.
- Nazari, J. A. , Hrazdil, K., and Mahmoudian, F. (2017). Assessing social and environmental performance through narrative complexity in CSR reports. Journal of Contemporary Accounting & Economics 13(2), 166-178.
- Newman, D. , Bonilla, E. V., and Buntine, W. (2011). Improving topic coherence with regularized topic models. In Advances in Neural Information Processing Systems, p. 496-504.
- Pache, A.-C. and Santos, F. (2010). When worlds collide: The internal dynamics of organizational responses to conflicting institutional demands. Academy of Management Review 35(3), 455-476. https://doi-org.washburn.idm.oclc.org/10.5465/amr.35.3.
- Palazzo, G. and Scherer, A. G. (2006). Corporate legitimacy as deliberation: A communicative framework. Journal of Business Ethics 66(1), 71-88. https://doi-org.washburn.idm.oclc.org/10. 1007. [Google Scholar]
- Peters, G. F. and Romi, A. M. (2015). The association between sustainability governance characteristics and the assurance of corporate sustainability reports. Auditing: A Journal of Practice & Theory 34(1), 163-198.
- Phang, S.-Y. , Adrian, C., Garg, M., Pham, A., V., and Truong, C. (2023). COVID-19 pandemic resilience: An analysis of firm valuation and disclosure of sustainability practices of listed firms. Managerial Auditing Journal 38(1), 85-128.
- Platonova, E. , Asutay, M., Dixon, R., and Mohammad, S. (2018). The impact of corporate social responsibility disclosure on financial performance: Evidence from the GCC Islamic banking sector. Journal of Business Ethics 151, 451-471.
- Scherer, A. G. , Palazzo, G., and Matten, D. (2014). The business firm as a political actor: A new theory of the firm for a globalized world. Business & Society 53(2), 143-156. [CrossRef]
- Scherer, A. G. and Palazzo, G. (2007). Toward a political conception of corporate responsibility: Business and society seen from a Habermasian perspective. Academy of Management Review 32(4), 1096-1120.
- Scherer, A. G. , Palazzo, G., and Seidl, D. (2013). Managing legitimacy in complex and heterogeneous environments: Sustainable development in a globalized world. Journal of Management Studies 50(2), 259-284.
- https://doi-org.washburn.idm.oclc.org/10.1111/joms.12014.
- Scherer, A. G. (2018). Theory assessment and agenda setting in political CSR: A critical theory perspective. International Journal of Management Reviews 20(2), 387-410.
- Scherer, A. G. and Palazzo, G. (2011). The new political role of business in a globalized world: A review of a new perspective on CSR and its implications for the firm, governance, and democracy. Journal of Management Studies 48(4), 899-931.
- Security and Exchange Commission (SEC). (2023). Fact Sheet: Enhancement and Standardization of Climate-Related Disclosures. https://www.sec.gov/files/33-11042-fact-sheet.pdf.
- Servaes, H. and Tamayo, A. (2013). The impact of corporate social responsibility on firm value: The role of customer awareness. Management Science 59(5), 1045-1061.
- . [CrossRef]
- Simeth, M. and Cincera, M. (2016). Corporate science, innovation, and firm value. Management Science 62(7), 1970-1981.
- Simnett, R. , Vanstraelen, A., and Chua, W. F. (2009). Assurance on general purpose non-financial reports: An international comparison. Accounting Review 84(3), 937-967.
- Slack, T. and Hinings, B. (1994). Strategic planning for nonprofit sport organizations: Empirical verification of a framework. Journal of Sport Management 8(3), 218-233.
- Suchman, M. C. (1995). Managing legitimacy: Strategic and institutional approaches. Academy of Management Review 20(3), 571-610.
- Sundaram, A. K. and Inkpen, A. C. (2004). The corporate objective revisited. Organization Science 15(3), 350-363. https://doi-org.washburn.idm.oclc.org/10.1287/orsc.1040. 0068. [Google Scholar]
- Tsamardinos, I. , Brown, L. E., and Aliferis, C. F. (2006). The max-min hill-climbing Bayesian network structure learning algorithm. Machine Learning 65(1), 31-78.
- Unerman, J. (2008). Strategic reputation risk management and corporate social responsibility reporting. Accounting, Auditing & Accountability Journal 21(3), 362-364.
- Vander Bauwhede, H. and Van Cauwenberge, P. (2022). Determinants and value relevance of voluntary assurance of sustainability reports in a mandatory reporting context: Evidence from Europe. Sustainability 14(15), 9795.
- Venkatesh, V. , Brown, S. A., and Bala, H. (2013). Bridging the qualitative-quantitative divide: Guidelines for conducting mixed methods research in information systems. MIS Quarterly 37(1), 21-54.
- Waller, W. S. , Shapiro, B., and Sevcik, G. (1999). Do cost-based pricing biases persist in laboratory markets? Accounting, Organizations and Society 24(8), 717-739.
Figure 1.
Frequent words used in CSR reports of firms in two industries – (a) Healthcare and (b) Information technology.
Figure 1.
Frequent words used in CSR reports of firms in two industries – (a) Healthcare and (b) Information technology.
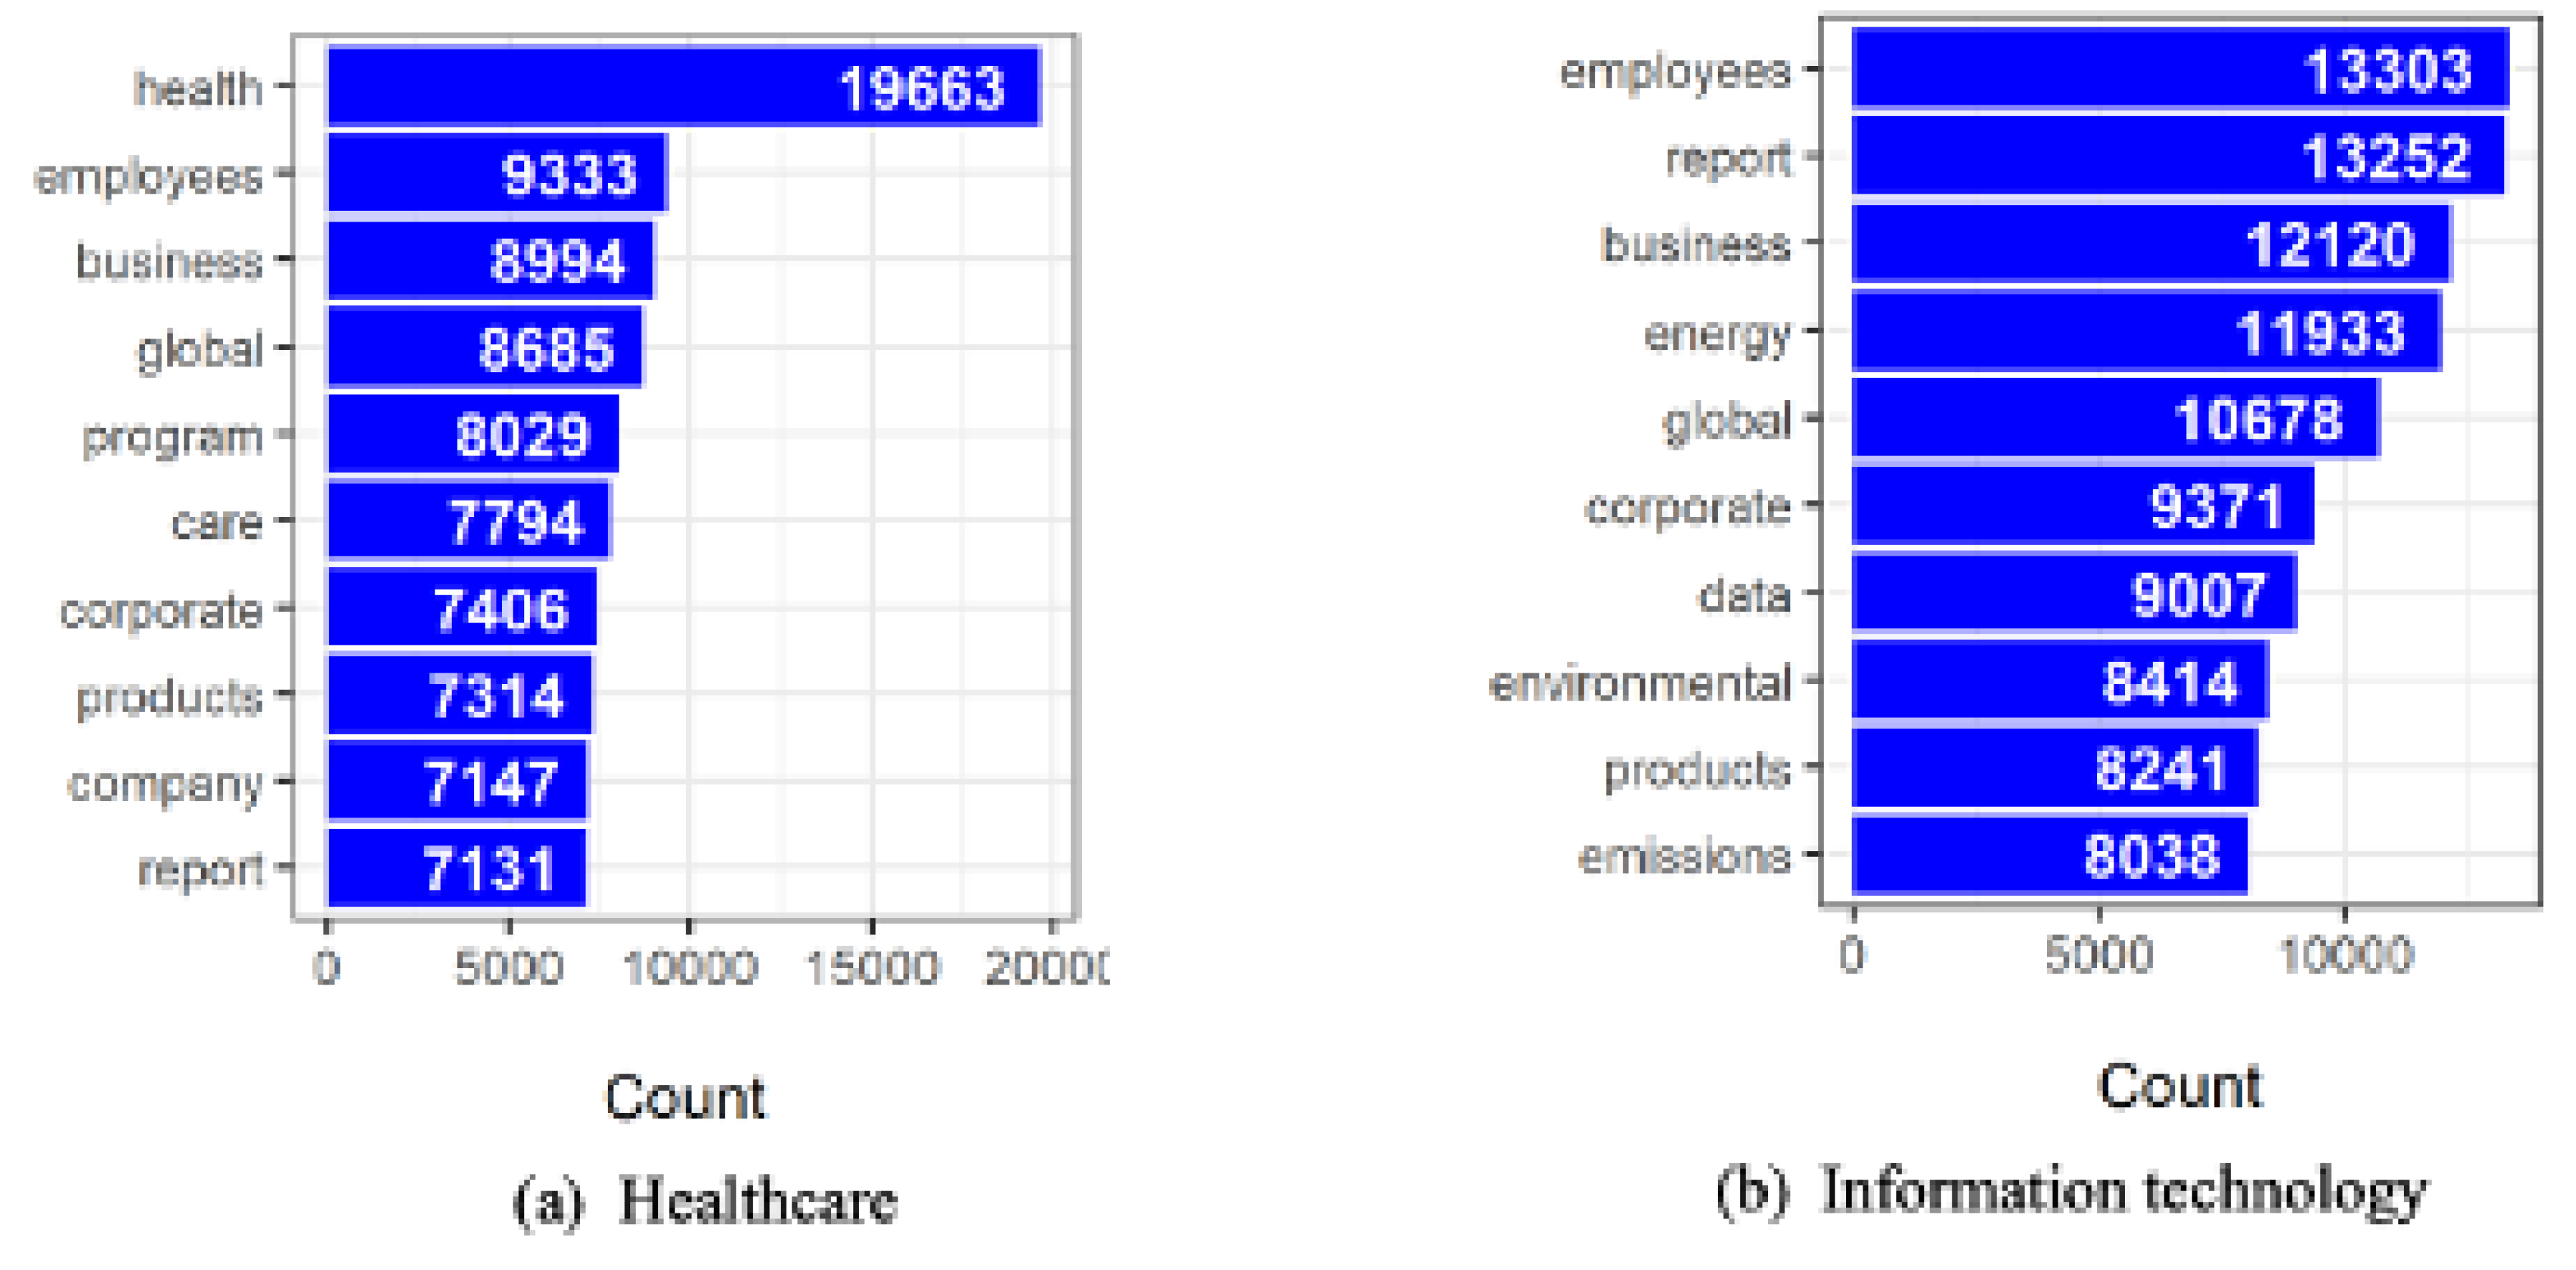
Figure 2.
A Bayesian network of industry sector, assurance and topic focus in CSR reports. The numbers in the arrows indicate conditional probability estimated by the model training process.
Figure 2.
A Bayesian network of industry sector, assurance and topic focus in CSR reports. The numbers in the arrows indicate conditional probability estimated by the model training process.
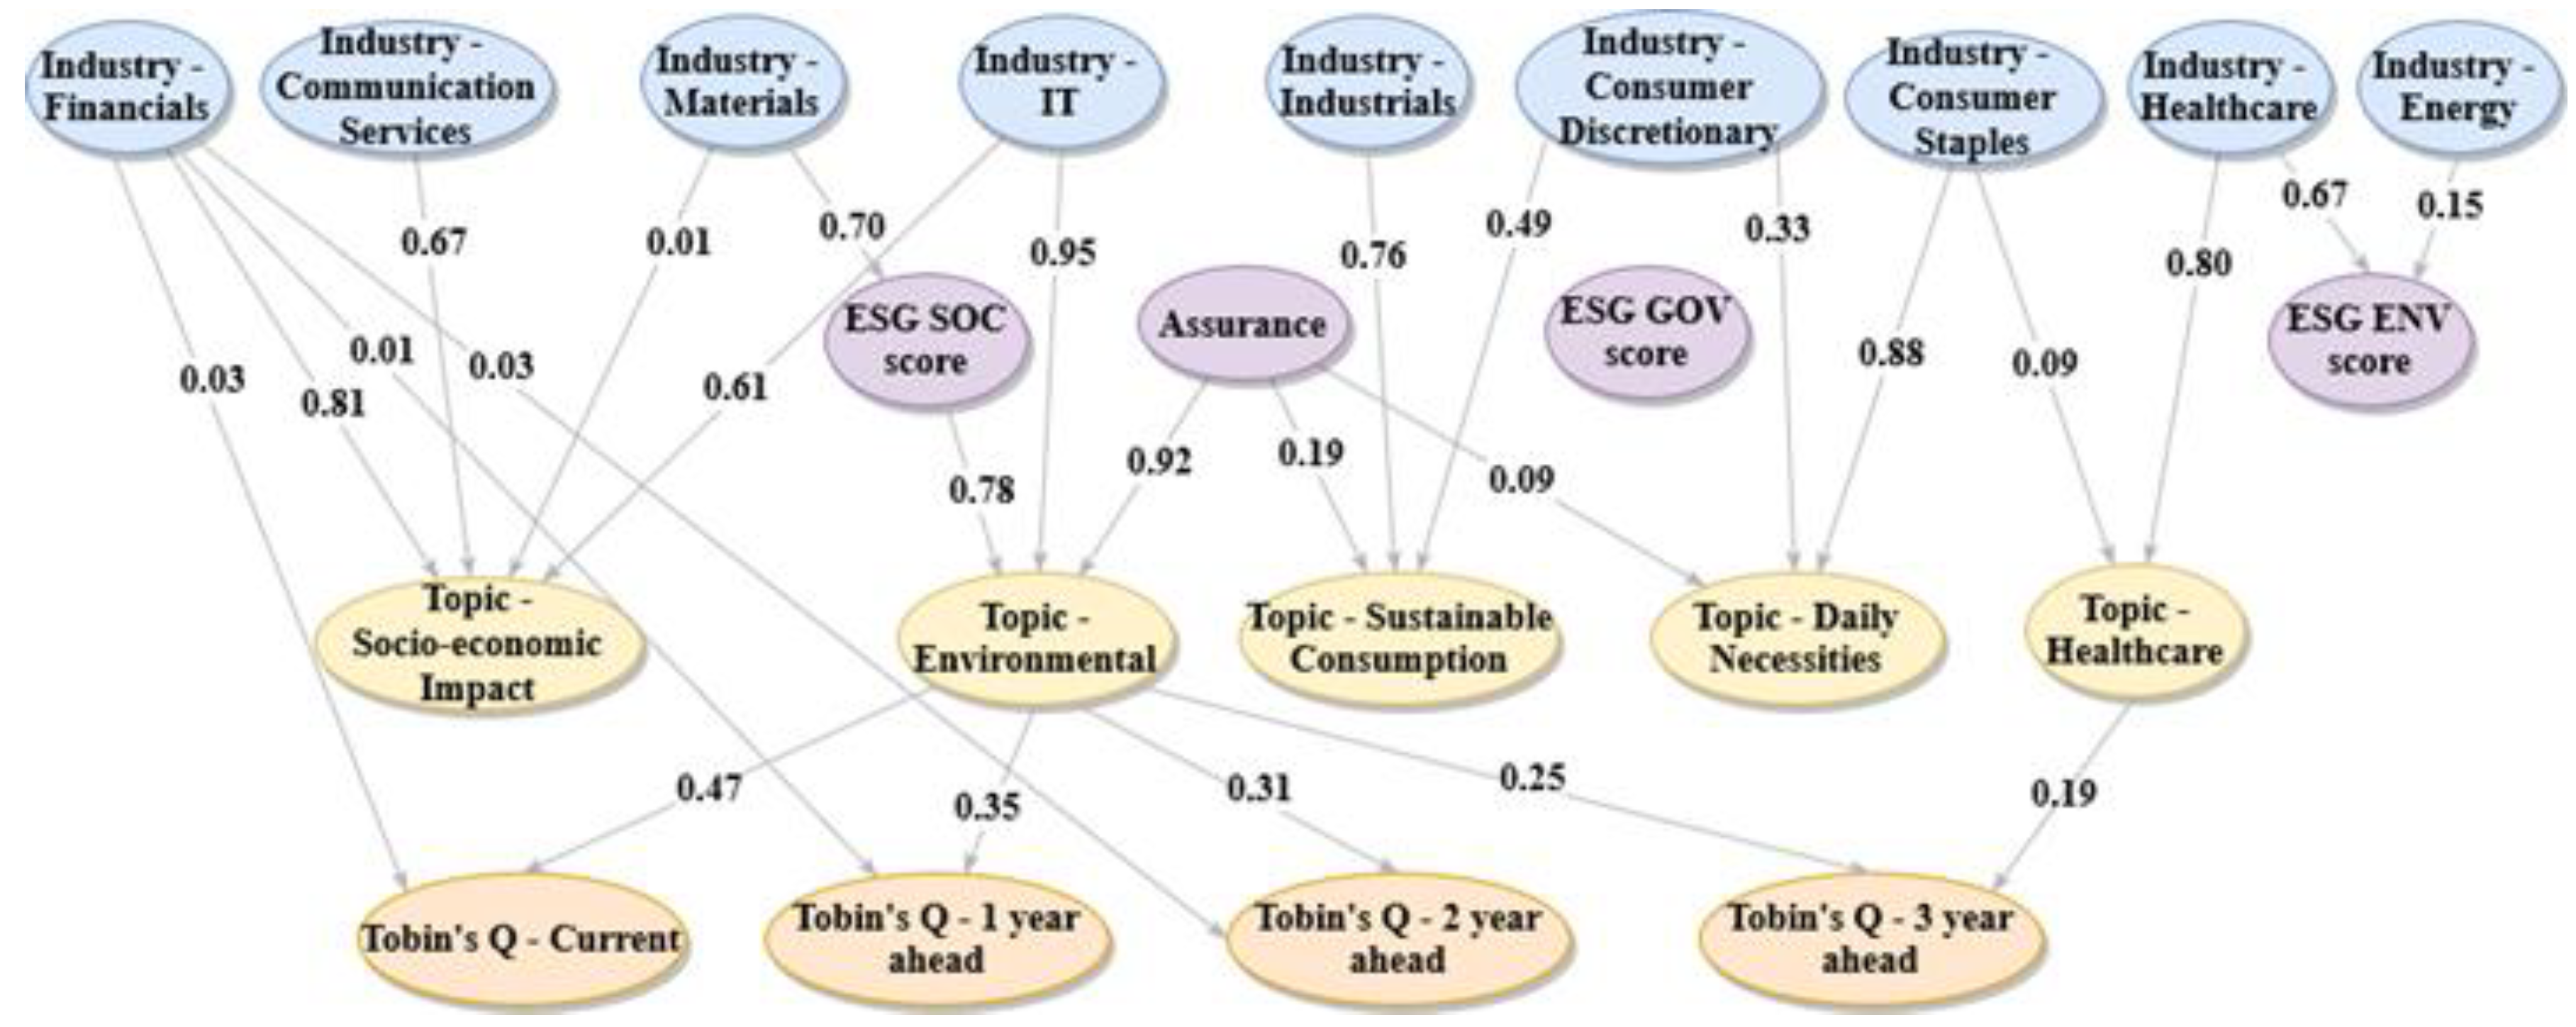

Table 1.
Sample selection of CSR reports from CorporateRegister.com.
| Number of companies in the $20 billion or above MarketCap (as of 12/31/2017) | 297 |
| Number of companies with at least 1 sustainability report | 1454 firm- years (206 companies) |
| Number of firm-years dropped, due to unavailability of variables or due to MTB value being zero | 246 |
| Remaining firm-years that we can work with | 1208 firm-years (191 companies) |
| No. of firm-years that have assurance | 37 firm-years (58 companies) |
| No. of firm-years that have NO assurance | 971 firm years (133 companies) |
Table 2.
Descriptive Statistics.
| Not Assured | Assured | Total | ||||||||||||||||
|---|---|---|---|---|---|---|---|---|---|---|---|---|---|---|---|---|---|---|
| Mean | SD | 25th per | Median | 75th per | N | Mean | SD | 25th per | Median | 75th per | N | Mean | SD | 25th per | Median | 75th per | N | |
| Topic: Environmental | 0.2811 | 0.2215 | 0.0967 | 0.2531 | 0.4205 | 971 | 0.4682 | 0.1956 | 0.3599 | 0.4609 | 0.6079 | 237 | 0.3178 | 0.229 | 0.1246 | 0.2967 | 0.4713 | 1208 |
| Topic: Sustainable Consumption | 0.1225 | 0.1589 | 0.0092 | 0.0447 | 0.1779 | 971 | 0.0876 | 0.1501 | 0.001 | 0.0091 | 0.0803 | 237 | 0.1156 | 0.1578 | 0.0059 | 0.0342 | 0.1723 | 1208 |
| Topic: Daily Necessities | 0.077 | 0.1596 | 0.0018 | 0.0083 | 0.0406 | 971 | 0.063 | 0.1391 | 0.0019 | 0.0075 | 0.0319 | 237 | 0.0743 | 0.1559 | 0.0018 | 0.0081 | 0.0388 | 1208 |
| Topic: Socio Economic Impact | 0.291 | 0.2605 | 0.087 | 0.1921 | 0.4412 | 971 | 0.1722 | 0.2165 | 0.0303 | 0.0884 | 0.1923 | 237 | 0.2677 | 0.2567 | 0.069 | 0.1669 | 0.3899 | 1208 |
| Topic: HealthCare | 0.1318 | 0.3385 | 0 | 0 | 0 | 971 | 0.097 | 0.2966 | 0 | 0 | 0 | 237 | 0.125 | 0.3309 | 0 | 0 | 0 | 1208 |
| LnTotalAssets | 10.7148 | 1.3692 | 9.7898 | 10.5667 | 11.5678 | 971 | 10.9069 | 1.2749 | 10.0151 | 10.7489 | 11.7716 | 237 | 10.7525 | 1.3528 | 9.8484 | 10.5975 | 11.5967 | 1208 |
| Leverage | 0.9347 | 1.8901 | 0.523 | 0.6602 | 0.8342 | 971 | 0.6343 | 0.2422 | 0.4737 | 0.6108 | 0.7934 | 237 | 0.8758 | 1.702 | 0.5057 | 0.6467 | 0.8244 | 1208 |
| PropPlant & Equipment | 0.3181 | 0.4297 | 0.0702 | 0.1811 | 0.5052 | 971 | 0.3378 | 0.2453 | 0.1199 | 0.2934 | 0.5321 | 237 | 0.322 | 0.4003 | 0.0793 | 0.198 | 0.5194 | 1208 |
| Inventory | 0.0809 | 0.1269 | 0.0125 | 0.0415 | 0.1010 | 971 | 0.0582 | 0.0506 | 0.0190 | 0.0465 | 0.0862 | 237 | 0.0765 | 0.1163 | 0.0131 | 0.0445 | 0.0984 | 1208 |
| Return on Assets | 0.0652 | 0.0643 | 0.0242 | 0.0563 | 0.0963 | 971 | 0.0701 | 0.0673 | 0.0248 | 0.0619 | 0.1116 | 237 | 0.0662 | 0.0649 | 0.0242 | 0.0586 | 0.0997 | 1208 |
| LnSalesGrowth | 0.0462 | 0.1442 | -0.0037 | 0.0428 | 0.0901 | 971 | 0.0173 | 0.1464 | -0.0386 | 0.0325 | 0.0784 | 237 | 0.0405 | 0.145 | -0.0091 | 0.0428 | 0.0881 | 1208 |
| Trend | 7.2225 | 3.5505 | 5 | 8 | 10 | 971 | 7.70042 | 3.43938 | 5 | 8 | 11 | 237 | 7.3162 | 3.5327 | 5 | 8 | 10 | 1208 |
| ESG: ENV_Score | 57.3522 | 20.763 | 42 | 57 | 74 | 971 | 62.37975 | 20.40769 | 44 | 65 | 82 | 237 | 58.3386 | 20.7816 | 43 | 59 | 75 | 1208 |
| ESG: SOC_Score | 42.4954 | 19.4415 | 25 | 40 | 61 | 971 | 51.03797 | 19.81339 | 33 | 46 | 71 | 237 | 44.1714 | 19.7998 | 27 | 43 | 62 | 1208 |
| ESG: GOV_Score | 51.4408 | 17.4645 | 36 | 50 | 69 | 971 | 55.38819 | 18.36290 | 37 | 57 | 70 | 237 | 52.2152 | 17.7062 | 37 | 50 | 69 | 1208 |
Table 3.
No Assurance–Effect of Sustainability topics on Current & Future Tobin’s Q.
| Dependent Variables → | TobinsQ | LeadTobinsQ | Lead2TobinsQ | Lead3TobinsQ |
|---|---|---|---|---|
| Topic: Environmental | 0.6874 | 1.1636 | 2.2502* | -0.1722 |
| (0.7432) | (0.8857) | (1.3322) | (0.7037) | |
| Topic: Sustainable Consumption | -0.4974 | 0.0343 | 0.4493 | -0.7538 |
| (0.8100) | (0.9180) | (1.3480) | (0.7322) | |
| Topic: Daily Necessities | 1.6644** | 2.3784** | 2.0504 | 0.0919 |
| (0.8379) | (0.9218) | (1.3870) | (0.7368) | |
| Topic: Socio Economic Impact | 1.2003 | 1.3550 | 2.0117* | 0.0501 |
| (0.7704) | (0.8649) | (1.2135) | (0.6399) | |
| Topic: Healthcare | 2.5281** | 3.3210*** | 3.1931** | -0.0227 |
| (0.9837) | (1.0847) | (1.5560) | (0.9031) | |
| LnTotal Assets | -0.4421*** | -0.5294*** | -0.5298*** | -0.3557*** |
| (0.0562) | (0.0604) | (0.0878) | (0.0613) | |
| Leverage | -0.0384 | 0.0059 | -0.1148 | 0.0648** |
| (0.0653) | (0.0347) | (0.1240) | (0.0308) | |
| PPE | 0.0353 | 0.0359 | 0.4485 | -0.3930* |
| (0.3078) | (0.2456) | (0.5718) | (0.2143) | |
| Inventory | -0.7194 | -1.2029** | -0.5411 | -0.3588 |
| (0.6109 | (0.5811) | (0.9607) | (0.4540) | |
| Return on Assets | 8.8346*** | 5.1387*** | 4.3817** | 13.3874*** |
| (1.1300) | (1.1564) | (1.8630) | (1.5203) | |
| LnSalesGrowth | 3.1253*** | 1.9986*** | 2.6683*** | 0.4208 |
| (0.7167) | (0.6262) | (1.0003) | (0.6855) | |
| Trend | 0.0899*** | 0.0576** | 0.1106** | 0.0879*** |
| (0.0276) | (0.0278) | (0.0479) | (0.0315) | |
| ESG: Environmental Score | 0.0126*** | 0.0126*** | 0.0127* | 0.0093** |
| (0.0041) | (0.0043) | (0.0066) | (0.0041) | |
| ESG: Social Score | 0.0109* | 0.0116* | 0.0025 | 0.0002 |
| (0.0061) | (0.0067) | (0.0099) | (0.0057) | |
| ESG: Governance Score | -0.0233*** | -0.0264*** | -0.0133 | -0.0120* |
| (0.0068) | (0.0073) | (0.0111) | (0.0066) | |
| Constant | 4.4232*** | 5.7734*** | 4.7776*** | 4.0206*** |
| (0.7617) | (0.7861) | (1.2620) | (0.7631) | |
| Control for Industry Sector | Yes | Yes | Yes | Yes |
| Observations | 1,208 | 831 | 735 | 611 |
| Number of Companies | 191 | 159 | 157 | 137 |
| R-sq Within | 0.114 | 0.0332 | 0.0174 | 0.0195 |
| R-sq Between | 0.736 | 0.738 | 0.574 | 0.785 |
| R-sq Overall | 0.568 | 0.579 | 0.513 | 0.559 |
| Standard errors are adjusted for heteroskedasticity and clustered at the firm level. | ||||
| *** p<0.01, ** p<0.05, * p<0.1. Variables defined in Appendix 1. | ||||
Table 4.
Assurance & Interactions – Effect of Sustainability Topics on Current and Future Tobin’s Q.
Table 4.
Assurance & Interactions – Effect of Sustainability Topics on Current and Future Tobin’s Q.
| Dependent Variables → | TobinsQ | LeadTobinsQ | Lead2TobinsQ | Lead3TobinsQ |
|---|---|---|---|---|
| Topic: Environmental | 0.8239 | 1.9162* | 3.0816** | -0.1425 |
| (0.7798) | (0.9829) | (1.4328) | (0.7866) | |
| Topic: Sustainable Consumption | -0.2692 | 0.9549 | 1.1858 | -0.4869 |
| (0.8575) | (1.0263) | (1.4712) | (0.8179) | |
| Topic: Daily Necessities | 1.6896** | 2.9082*** | 2.1144 | -0.0302 |
| (0.8548) | (0.9738) | (1.4545) | (0.7864) | |
| Topic: Socio Economic Impact | 1.0997 | 1.8865** | 2.2662* | 0.1086 |
| (0.7895) | (0.9263) | (1.2670) | (0.6810) | |
| Topic: Healthcare | 2.4497** | 3.8294*** | 3.2051* | -0.0619 |
| (0.9956) | (1.1463) | (1.6219) | (0.9554) | |
| Assurance | 0.8126 | 2.1546* | 1.6604 | 0.1523 |
| (1.0963) | (1.1467) | (1.7524) | (0.9605) | |
| Assurance x Environmental topic | -1.6592 | -2.8416* | -3.4635 | -0.3840 |
| (1.3809) | (1.4549) | (2.2585) | (1.4488) | |
| Assurance x SustConsumption topic | -0.4255 | -2.8195 | -2.3380 | -0.8200 |
| (1.7609) | (1.7725) | (2.6643) | (1.4651) | |
| Assurance x DailyNecessities topic | 1.4524 | -0.8282 | 1.3195 | 1.5903 |
| (1.7341) | (1.6395) | (2.6841) | (1.3955) | |
| Assurance x SocioEconImpact topic | 0.2488 | -2.3232* | -1.5545 | 0.2321 |
| (1.2049) | (1.2512) | (2.0089) | (1.2987) | |
| Assurance x Healthcare topic | 1.3951 | 0.1518 | 3.0819 | 1.5266 |
| (1.8401) | (1.7750) | (2.8939) | (1.6840) | |
| LnTotal Assets | -0.4356*** | -0.5389*** | -0.5199*** | -0.3441*** |
| (0.0570) | (0.0628) | (0.0908) | (0.0645) | |
| Leverage | -0.0328 | 0.0057 | -0.0975 | 0.0601* |
| (0.0659) | (0.0347) | (0.1272) | (0.0313) | |
| PPE | 0.0168 | 0.0446 | 0.4209 | -0.3500 |
| (0.3112) | (0.2469) | (0.5853) | (0.2180) | |
| Inventory | -0.6416 | -1.3163** | -0.8699 | -0.3906 |
| (0.6292) | (0.6020) | (0.9880) | (0.4745) | |
| Return on Assets | 8.1988*** | 4.6819*** | 3.3661* | 12.9267*** |
| (1.1620) | (1.1903) | (1.9084) | (1.5809) | |
| LnSalesGrowth | 2.7934*** | 2.1474*** | 2.7278*** | 0.3473 |
| (0.7410) | (0.6288) | (0.9945) | (0.6961) | |
| Trend | 0.0954*** | 0.0719** | 0.1344*** | 0.1050*** |
| (0.0278) | (0.0290) | (0.0490) | (0.0329) | |
| ESG: Environmental Score | 0.0122*** | 0.0136*** | 0.0125* | 0.0092** |
| (0.0041) | (0.0043) | (0.0066) | (0.0042) | |
| ESG: Social Score | 0.0110* | 0.0121* | 0.0058 | 0.0023 |
| (0.0062) | (0.0069) | (0.0101) | (0.0062) | |
| ESG: Governance Score | -0.0226*** | -0.0272*** | -0.0158 | -0.0137** |
| (0.0069) | (0.0075) | (0.0112) | (0.0069) | |
| Constant | 4.3120*** | 5.5305*** | 4.4040*** | 3.7789*** |
| (0.7631) | (0.8046) | (1.2809) | (0.7921) | |
| Controls for Industry Sector | Yes | Yes | Yes | Yes |
| Observations | 1,208 | 831 | 735 | 611 |
| Number of Companies | 191 | 159 | 157 | 137 |
| R-sq Within | 0.101 | 0.0227 | 0.00771 | 0.0251 |
| R-sq Between | 0.750 | 0.754 | 0.601 | 0.796 |
| R-sq Overall | 0.586 | 0.578 | 0.502 | 0.586 |
| Standard errors are adjusted for heteroskedasticity and clustered at the firm level. | ||||
| *** p<0.01, ** p<0.05, * p<0.1. Variables defined in Appendix 1. | ||||
Table 5.
Feature importance ranking for machine learning models predicting present and future firm values.
Table 5.
Feature importance ranking for machine learning models predicting present and future firm values.
| Rank | Feature importance | |||
|---|---|---|---|---|
| Present firm value as outcome | Firm value 1-year lead as outcome | Firm value 2-year lead as outcome | Firm value 3-year lead as outcome | |
| 1 | Company-related - ROA (48.2%) | Company-related - ROA (44.5%) | Company-related - ROA (40.7%) | Company-related - ROA (40%) |
| 2 | Company-related - LnTotalAssets (26.3%) | Company-related - LnTotalAssets (27.7%) | Company-related - LnTotalAssets (29.3%) | Company-related - LnTotalAssets (27.4%) |
| 3 | Industry - Financials (14.5%) | Industry - Financials (12.4%) | Industry - Financials (9%) | Industry - Financials (15%) |
| 4 | Time trend (9.9%) | Topic - DailyNecessities (6.7%) | Company-related - PPE (7.8%) | Time trend (7.6%) |
| 5 | Topic - SustainableConsumption (6.2%) | Company-related - PPE (5.7%) | Time trend (7.1%) | Topic - DailyNecessities (7.4%) |
| 6 | Company-related - PPE (5.7%) | Time trend (5.7%) | Topic - Environmental (5.6%) | ESG GOV score (5.5%) |
| 7 | Company-related - logeSalesGrowth (5.2%) | Company-related - logeSalesGrowth (4.9%) | Topic - DailyNecessities (4.1%) | Topic - Environmental (4.9%) |
| 8 | Topic - DailyNecessities (4.4%) | Topic - Environmental (4.1%) | Topic - SocioEconomicImpact (3.9%) | Company-related - Leverage (4.4%) |
| 9 | ESG ENV score (3.2%) | ESG ENV score (3.7%) | ESG GOV score (3.8%) | Company-related - PPE (4.3%) |
| 10 | Topic - Environmental (3.2%) | ESG GOV score (3.4%) | Company-related - Leverage (3.1%) | ESG ENV score (3.5%) |
| 11 | Topic - Healthcare (3%) | Topic - SustainableConsumption (3.3%) | Company-related - INV (2.8%) | Company-related - INV (3.3%) |
| 12 | Company-related - INV (2.7%) | Company-related - Leverage (2.8%) | ESG ENV score (2.8%) | Topic - SustainableConsumption (3.2%) |
| 13 | Company-related - LEV (2.6%) | Company-related - INV (2.5%) | Topic - SustainableConsumption (2.6%) | Industry - Energy (2.7%) |
| 14 | ESG GOV score (2.4%) | Topic - Healthcare (2.4%) | Company-related - logeSalesGrowth (2.6%) | Topic - Healthcare (2.2%) |
| 15 | Industry - Energy (1.8%) | Industry - Energy (2.2%) | Industry - Energy (2.3%) | Company-related - logeSalesGrowth (1.9%) |
| 16 | ESG SOC score (1.3%) | Topic - SocioEconomicImpact (1.7%) | Topic - Healthcare (2%) | ESG SOC score (1.6%) |
| 17 | Topic - SocioEconomicImpact (1.3%) | ESG SOC score (1.6%) | ESG SOC score (1.8%) | Topic - SocioEconomicImpact (1.3%) |
| 18 | Industry - IT (1%) | Industry - IT (1.1%) | Industry - IT (0.7%) | Industry - ConsumerDiscretionary (0.7%) |
| 19 | Industry - ConsumerDiscretionary (0.6%) | Industry - ConsumerDiscretionary (0.7%) | Industry - Materials (0.6%) | Industry - Healthcare (0.6%) |
| 20 | Industry - Industrials (0.4%) | Industry - Materials (0.4%) | Industry - ConsumerDiscretionary (0.5%) | Industry - Materials (0.5%) |
| 21 | Industry - ConsumerStaples (0.3%) | Industry - Industrials (0.4%) | Industry - Industrials (0.5%) | Industry - Industrials (0.4%) |
| 22 | Industry - Materials (0.3%) | Industry - Healthcare (0.3%) | Industry - Healthcare (0.4%) | Assured (0.4%) |
| 23 | Assured (0.3%) | Assured (0.2%) | Assured (0.3%) | Industry - IT (0.2%) |
| 24 | Industry - Healthcare (0.2%) | Industry - ConsumerStaples (0.1%) | Industry - ConsumerStaples (0.1%) | Industry - ConsumerStaples (0.1%) |
| 25 | Industry - CommunicationServices (0.1%) | Industry - CommunicationServices (0%) | Industry - CommunicationServices (0.1%) | Industry - CommunicationServices (0.1%) |
Disclaimer/Publisher’s Note: The statements, opinions and data contained in all publications are solely those of the individual author(s) and contributor(s) and not of MDPI and/or the editor(s). MDPI and/or the editor(s) disclaim responsibility for any injury to people or property resulting from any ideas, methods, instructions or products referred to in the content. |
© 2025 by the authors. Licensee MDPI, Basel, Switzerland. This article is an open access article distributed under the terms and conditions of the Creative Commons Attribution (CC BY) license (http://creativecommons.org/licenses/by/4.0/).
Copyright: This open access article is published under a Creative Commons CC BY 4.0 license, which permit the free download, distribution, and reuse, provided that the author and preprint are cited in any reuse.


