
Submitted:
28 June 2025
Posted:
30 June 2025
You are already at the latest version
Abstract
Chronic kidney disease (CKD) represents a growing medical, diagnostic and social challenge, and it is estimated to effect 8.5-9.8% of the global population and require expensive modes of treatment, such as haemodialysis or renal transplants.
Currently, a diagnosis of CKD is set based on the level of creatinine in the blood, which is the golden standard of renal function diagnostics. Unfortunately, decrease in GFR is secondary to damage of the kidney parenchyma and indicates that the best time to start more aggressive treatment has already passed. Therefore, several non-invasive methods have been proposed for predicting increased risk of CKD progression however in most of the cases kidney biopsy is essential.
Currently, the greatest hopes for a method that can confirm CKD are associated with the development of MRI, the most tissue-specific imaging method and it is already proven to be capable to detect inflammatory and oedematous changes, fibrosis, as well as perfusion and oxygenation disturbances. Therefore, in our manuscript we decided to present up-to-date knowledge about kidney MRI from a clinical point of view.
Keywords:
MRI
; magnetic resonance
; multi-parametric
; chronic kidney disease
; CKD
; kidney function
1. Introduction
From a clinical point of view, kidney disease can be divided into acute kidney disease (AKD) and chronic kidney disease (CKD). While the definition of AKD is not fully established, it is widely accepted that it entails a reduction in kidney function for less than three months. Usually, the cause of AKD is reversible and does not lead to any complications. It can be caused by glomerulonephritis as a local factor, heart failure, NSAID (nonsteroidal anti-inflammatory drugs) overdose and certain infections, injuries or bleeding taking place throughout the body [1].
The chronic form, CKD, is defined as a state where glomerular filtration (GFR) remains below 60 ml/min/1.73m2 for longer than three months, or when GFR level is above this threshold but is associated with microscopic or macroscopic destruction of renal structure. While CKD can be reversible in specific conditions, its natural evolution is mostly characterised by constant, graduate and inevitable loss of renal function ending in kidney failure. The progression of CKD can be accelerated by episodes of acute kidney injury (AKI), causing further damage to renal morphology [1,2].
Fortunately, a number of treatments exist for the primary diseases known to cause CKD, such as chronic glomerulonephritis, chronic pyelonephritis, hypertension, diabetes, autoimmune or Alport diseases. These have been found to effectively slow or even temporarily stop kidney degradation.
However, CKD still represents a growing medical, diagnostic and social challenge, and it is estimated to effect 8.5-9.8% of the global population [3] . Although this value is significantly lower than the prevalence of cardio-vascular and cancer, CKD therapy is thought to generate much greater costs because CKD patients live for a shorter time in full health and require more expensive modes of treatment, such as haemodialysis or renal transplants [4,5].
Currently, a diagnosis of CKD is set based on the level of creatinine in the blood, which is the absolute standard of renal function diagnostics. This value, along with other data such as sex, age and body weight, is used to calculate the GFR. Unfortunately, as a decrease in GFR is secondary to damage of the kidney parenchyma, a fall indicates that the best time to start more aggressive treatment to maintain kidney function has already passed. Therefore, several methods have been proposed for predicting increased risk of CKD progression; these include urine tests revealing proteinuria and other sediment abnormalities, blood tests for electrolyte levels, histopathological and immunological examinations of biopsy material as well as various, modern diagnostic imaging techniques [1].
Up to now, the role of radiological imaging in the management of CKD remains marginal. In the vast majority of cases, it has been limited to ultrasound (US) examination in M-mode, to determine organ size and morphological features, and in Doppler and spectral-doppler modes, to evaluate vascular distribution and character of blood flow [6]. The use of other modalities like computed tomography (CT) and magnetic resonance (MR), are limited to emergency situations or for diagnosis of widely-understood abdominal causes not related to the kidney [1,2,7].
However, while these methods can all provide an insight into the progression of renal function loss at different stages of development, only histopathological examinations have been found to provide a clear picture of the current kidney state. However, due to their invasive nature, they are rarely performed in practice.
Currently, the greatest hopes for a method that can confirm CKD are associated with the development of MRI, the most tissue-specific imaging method [8,9]. Therefore, the aim of this article is to present the current state of knowledge regarding the use of advanced MRI techniques for real-time detection of the pathological changes that can occur in the kidneys during CKD progression. These include inflammatory and oedematous changes, fibrosis, as well as perfusion and oxygenation disturbances [10,11,12,13]. However, it should be noted that the existing literature on this topic is highly heterogeneous. In addition, not all major diseases contributing to CKD have been evaluated, and some of the MRI sequences discussed in the following sections have been scrutinised in relatively few studies.
2. Basics of MRI
While the physics and technique of magnetic resonance imaging (MRI) seems profoundly complex, all of its sequences are based on a few basic rules [14,15]. The object of imaging, typically the patient, is located in a static electromagnetic field that aligns the spins of its hydrogen protons in one direction. A second group of coils produces a gradient of magnetization in three cartesian planes allowing structures to be coordinated in space. A final group of coils create a radiofrequency (RF) pulses destabilizing the standardized and aligned area inside first two coil groups. The RF pulse modifies the magnetic characteristics of the protons, resulting in the creation of short-lived (lasting for milliseconds) light (measured in milliteslas) signals, which are used to determine the three dimensional structure of the sample.
3. T1 and T2
3.1. Principles
The oldest, and most basic, magnetic resonance sequences are T1- and T2-weighted images. Most commonly, T1-weighted images are acquired by assessing one 180o pulse with a successive 90o pulse and a series of 180o pulses [16,17]. This protocol has to be repeated several times to produce three to eight readout points, each of them after full magnetic relaxation. The T2-weighted sequence is more simple as it usually requires only one spin-echo sequence consisting of one 90o pulse followed by a few 180o pulses [17].
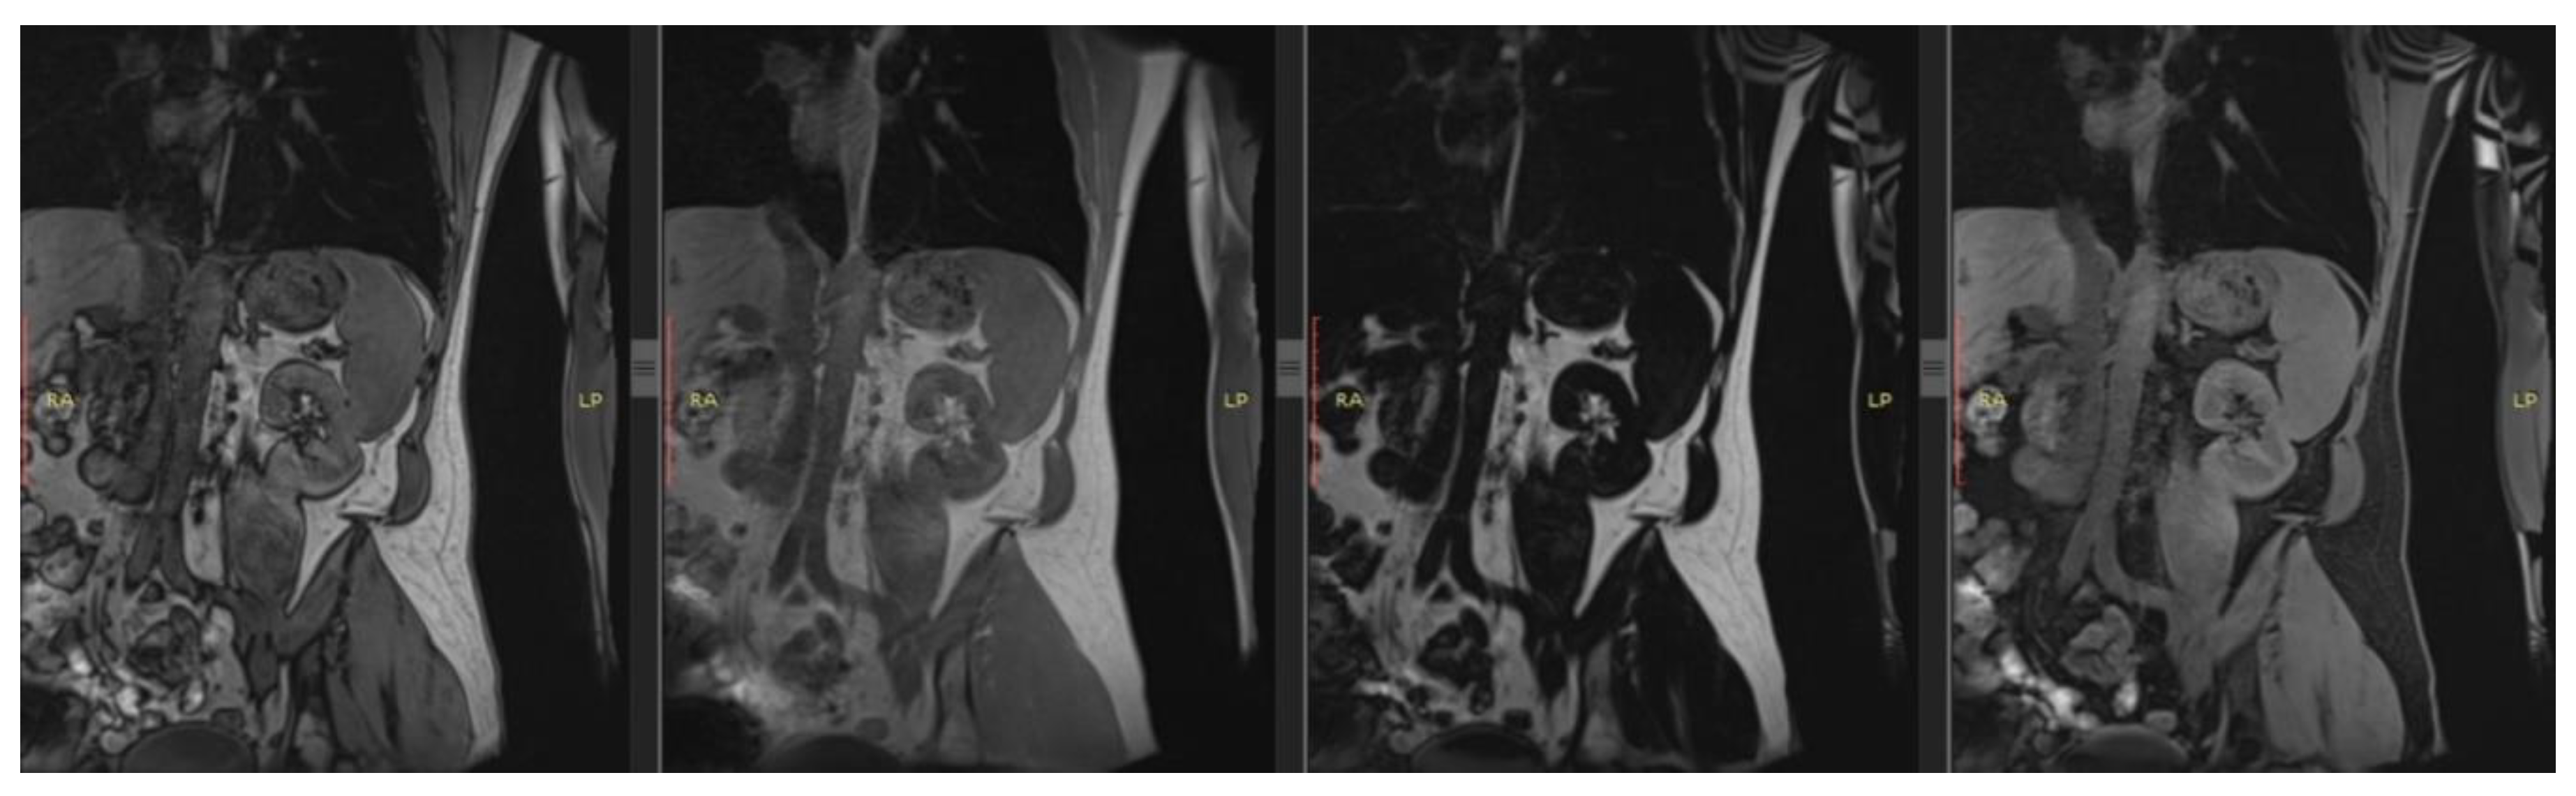
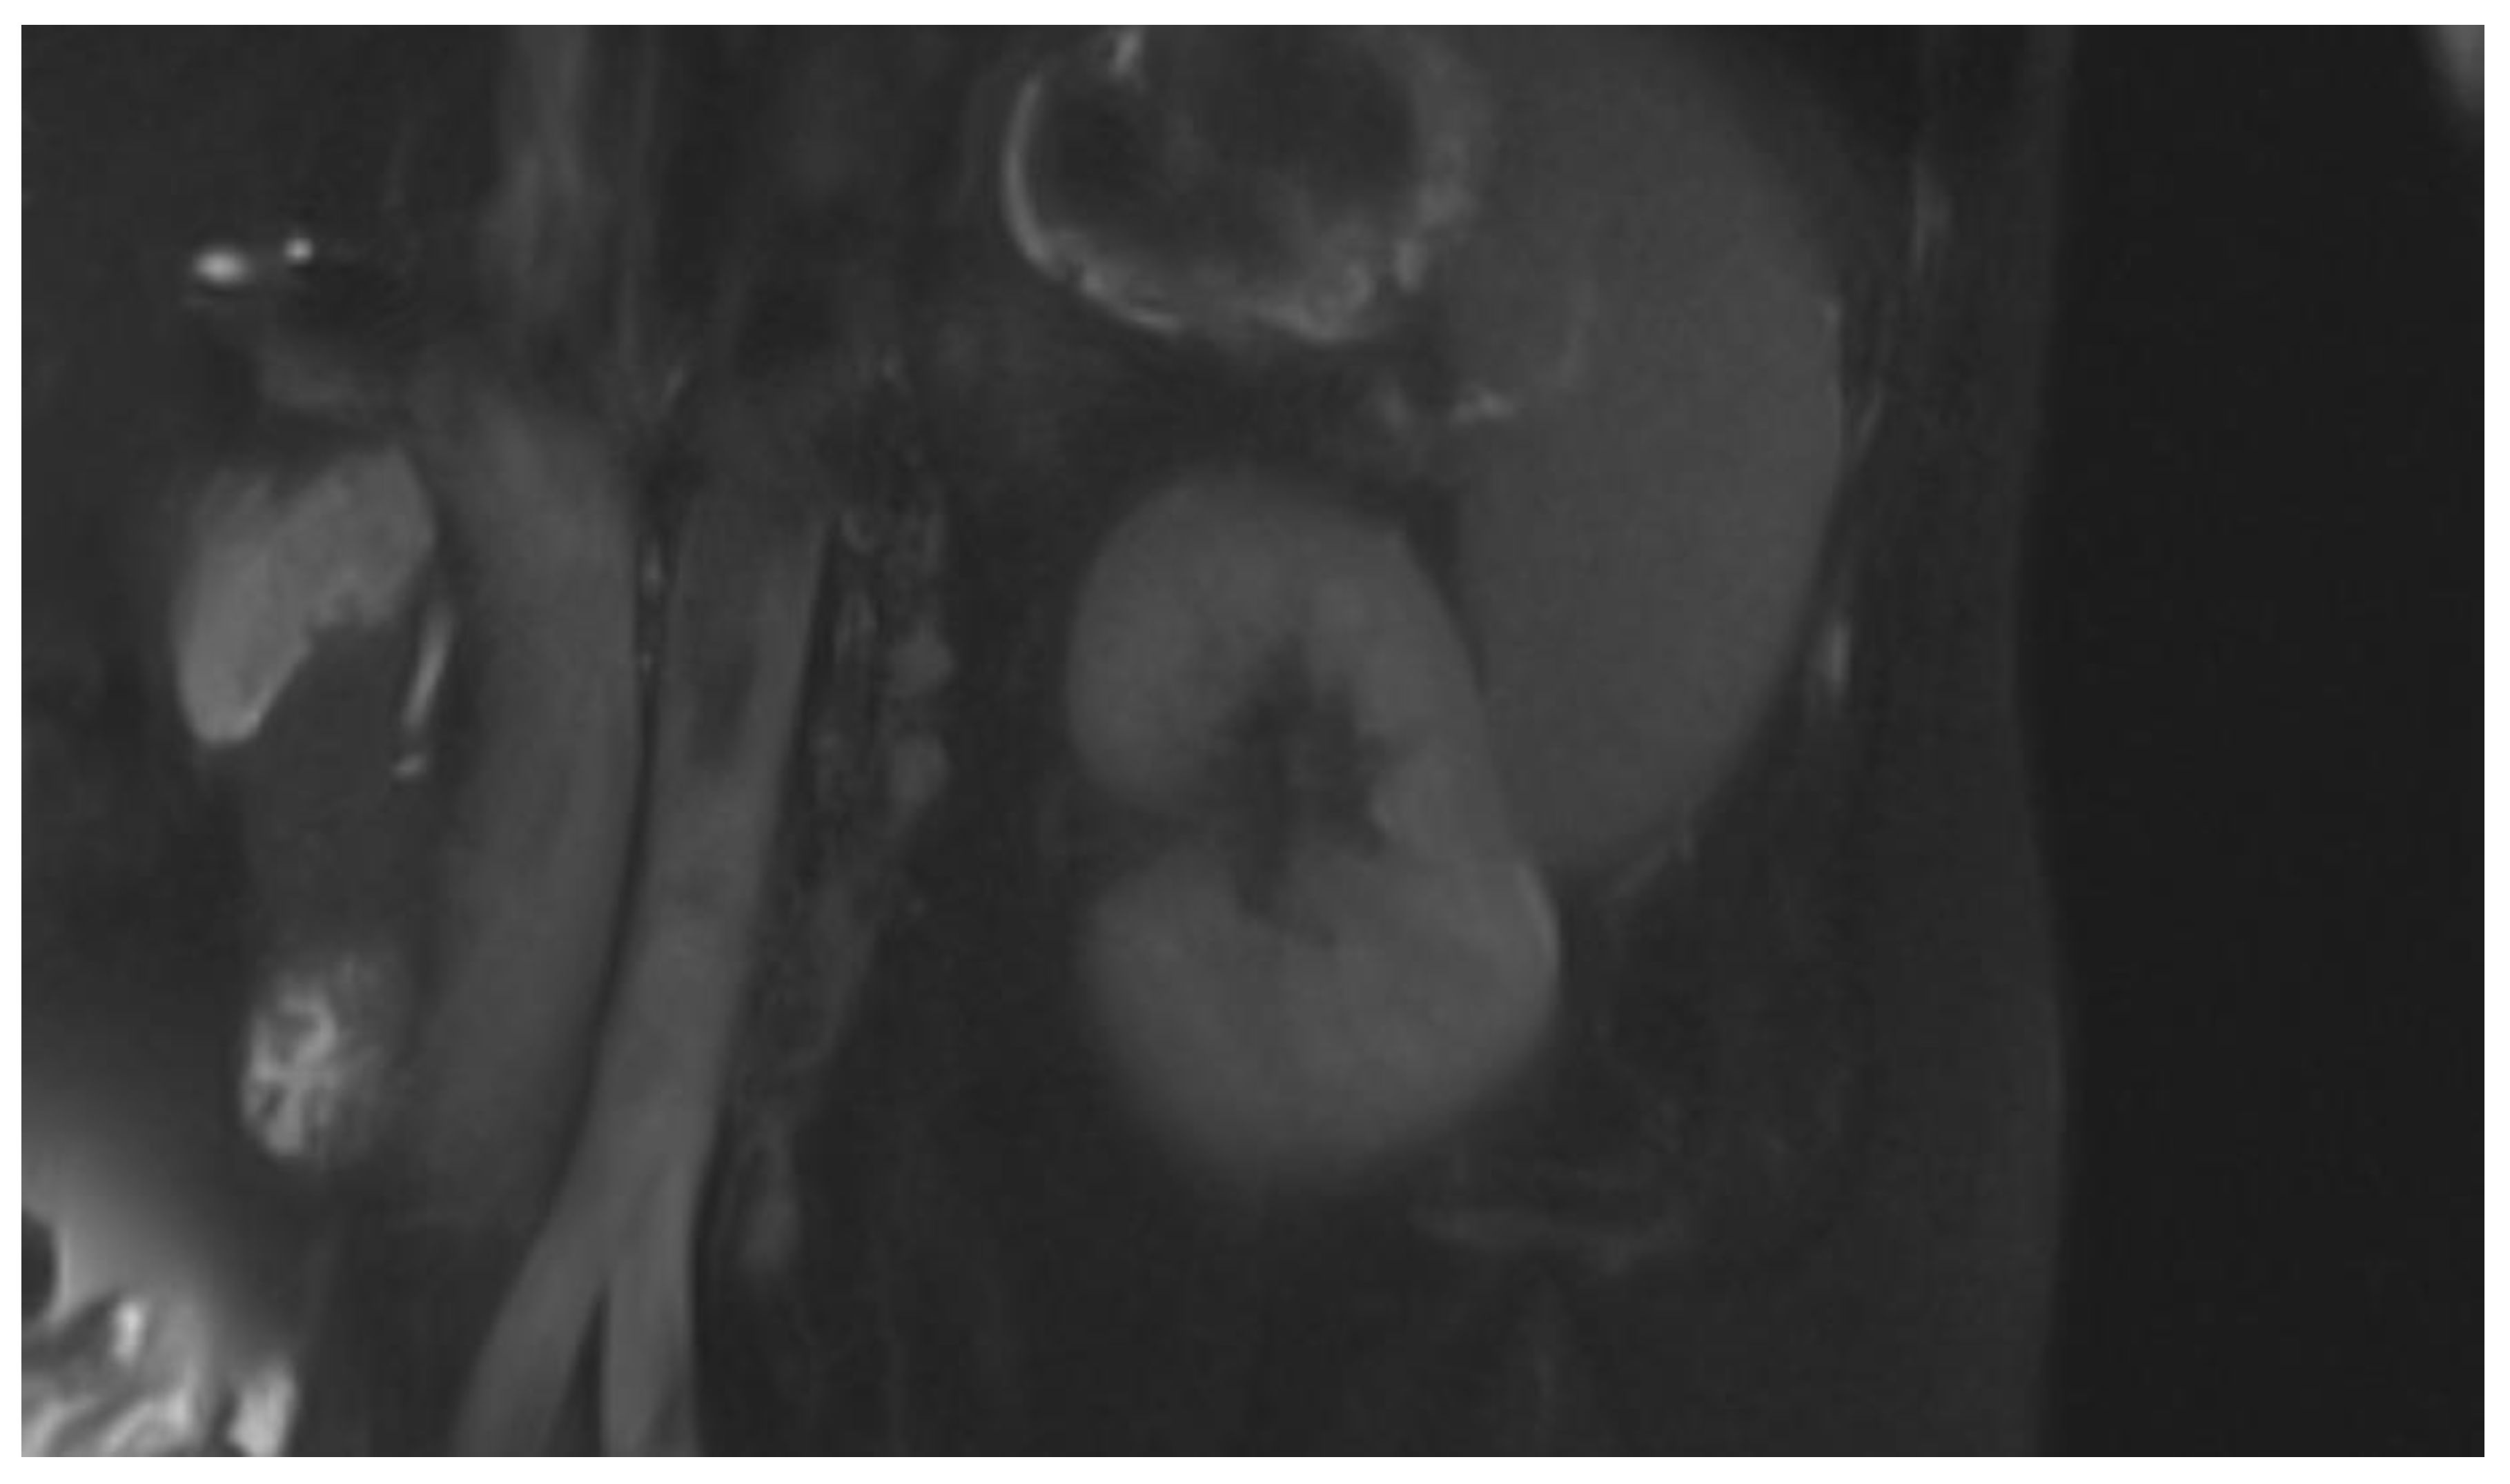
The main goal of these two sequences is to measure the most simple magnetic features as T1 i.e. the recovery time of y-axis vector of magnetic spin and T2, i.e. the disappearance of the x-axis vector of magnetic spin after the disturbance of the organised magnetic field. This date is than processed to create images or maps accessible for humans. Each of the above sequences is completely independent and depicts distinct physical characteristics of the examined object: the T1-weighted sequence focuses more on assessing kidney fibrosis and oedema, whereas the T2-weighted sequence is more sensitive to molecular changes associated with hypoxia [18,19]. Both sequences, however, are best suited for evaluating kidney morphology, including their size, shape, and corticomedullary differentiation [20]. (Rys 1), (Rys 2)
3.2. Clinical Utility
As early as the 1980s, intensive research began on the clinical utility of T1-weighted images in diagnosing pathologies of both native and transplanted kidneys, with a primary focus on T1 signal intensity changes in the cortex during the development of rejection syndrome [21]. The results of these initial studies were not convincing; however, more promising findings emerged regarding the effectiveness of T1 in detecting changes in corticomedullary differentiation, both in the assessment of transplant rejection and in the course of acute tubular necrosis [22,23].
While most studies on the utility of MRI in kidney diagnostics rely on a comparison of both T1- and T2-weighted imaging, such reports have primarily been based on animal studies. Yuasa et al [24] report prolonged T1 and T2 relaxation times in rabbit kidneys with hypoperfusion caused by renal artery occlusion. These findings were further confirmed in rat models by Pohlmann et al. [25]and mouse models by Hueper K et al [26]. This is significant because microstructural disturbances in kidney perfusion caused by renal artery stenosis is a key pathomechanism underlying CKD development.
In a mouse model, Franke et al. [27] found that the progression of polycystic kidney disease (PKD) and its treatment can be effectively monitored by T1 and T2 measurements.
Studies have also been conducted to determine the potential of T1- and T2-weighted sequences in evaluating transplanted kidneys, particularly with regard to rejection syndrome. A study on a mouse model [28] found T1 and T2 measurements to be of value in diagnosing of chronic rejection syndrome, while another study on transplanted kidneys in mice, using a multiparametric MRI [29], found greater T1 and T2 signal intensity in the cortex and external medulla to be associated with lymphocytic infiltration and the onset of renal fibrosis.
Human based studies analyzing exclusively the T1 or T2 signal remain rare. One study was conducted by Vivian S. Lee et al. [30] on a group of 10 patients found reduced corticomedullary differentiation in individuals with CKD in T1 weighted images to be almost entirely due to changes in cortical signal intensity [30], thus confirming previous studies [21,31,32,33,34]. Studies evaluating T2-weighted imaging in patient populations are rather limited. However, one paper on native kidneys by Tsutomu I [35] identified a significant relationship between hypoxia, degree of kidney fibrosis, T2 signal intensity, and apparent diffusion coefficient (ADC) maps. Also, a particularly interesting study by Mathys et al. [36] demonstrated a correlation between cortical T2 signal intensity and a decline in GFR in kidney transplant patients.
A comparison of MRI findings with histopathological data by Schley et al. [37] found that T1 and T2 relaxation times change as CKD progresses due to hypoperfusion and subsequent fibrosis. However, they concluded that T2-weighted imaging holds greater prognostic value in assessing the progression of chronic kidney disease.
More recently, the use of MRI technique for evaluating CKD has been significantly improved by the application of texture analysis; briefly, the technique is based on examining the voxel brightness in a given image acquired from a specific sequence. This appears to be an ongoing and significant research trend with substantial clinical potential, and one that may allow objective interpretation of imaging data. In two studies on T1-weighted image textures, the authors demonstrated a correlation between texture parameters and kidney function [38]. The method also allowed healthy individuals to be differentiated from those with CKD secondary to diabetes [39]. Regarding T2-weighted image textures, various algorithms have been designed that can distinguish patient groups depending on the degree of development of CKD Yu Baoting et al. [39], Grzywińska M et al. [40], and Yuki Hara et al. [41]; the methods were also used to effectively determine GFR levels in each subject. The most recent research in this area by Majos et al. [42] employed neural network models based on T2-weighted image textures data to successfully detect CKD activity.
4. DWI
4.1. Principles
Diffusion weighted imaging (DWI) is a non-contrast technique designed to measure movements of water molecules in tissues. It is typically based on very fast magnetic resonance sequences like echo-planar imaging. Most protocols use two strong 180o RF pulses, and sum up their impacts [43]. The nett phase shift signal of any non-static water molecules is detected and used to prepare final diffusion maps.
As the free movement of water molecules depends primarily on the tissue structure, the nature of the DWI signal is characteristic of the tissue. Any change in the diffusion sequence are most likely due to pathological processes such as swelling, changes in cell density and fibrosis.
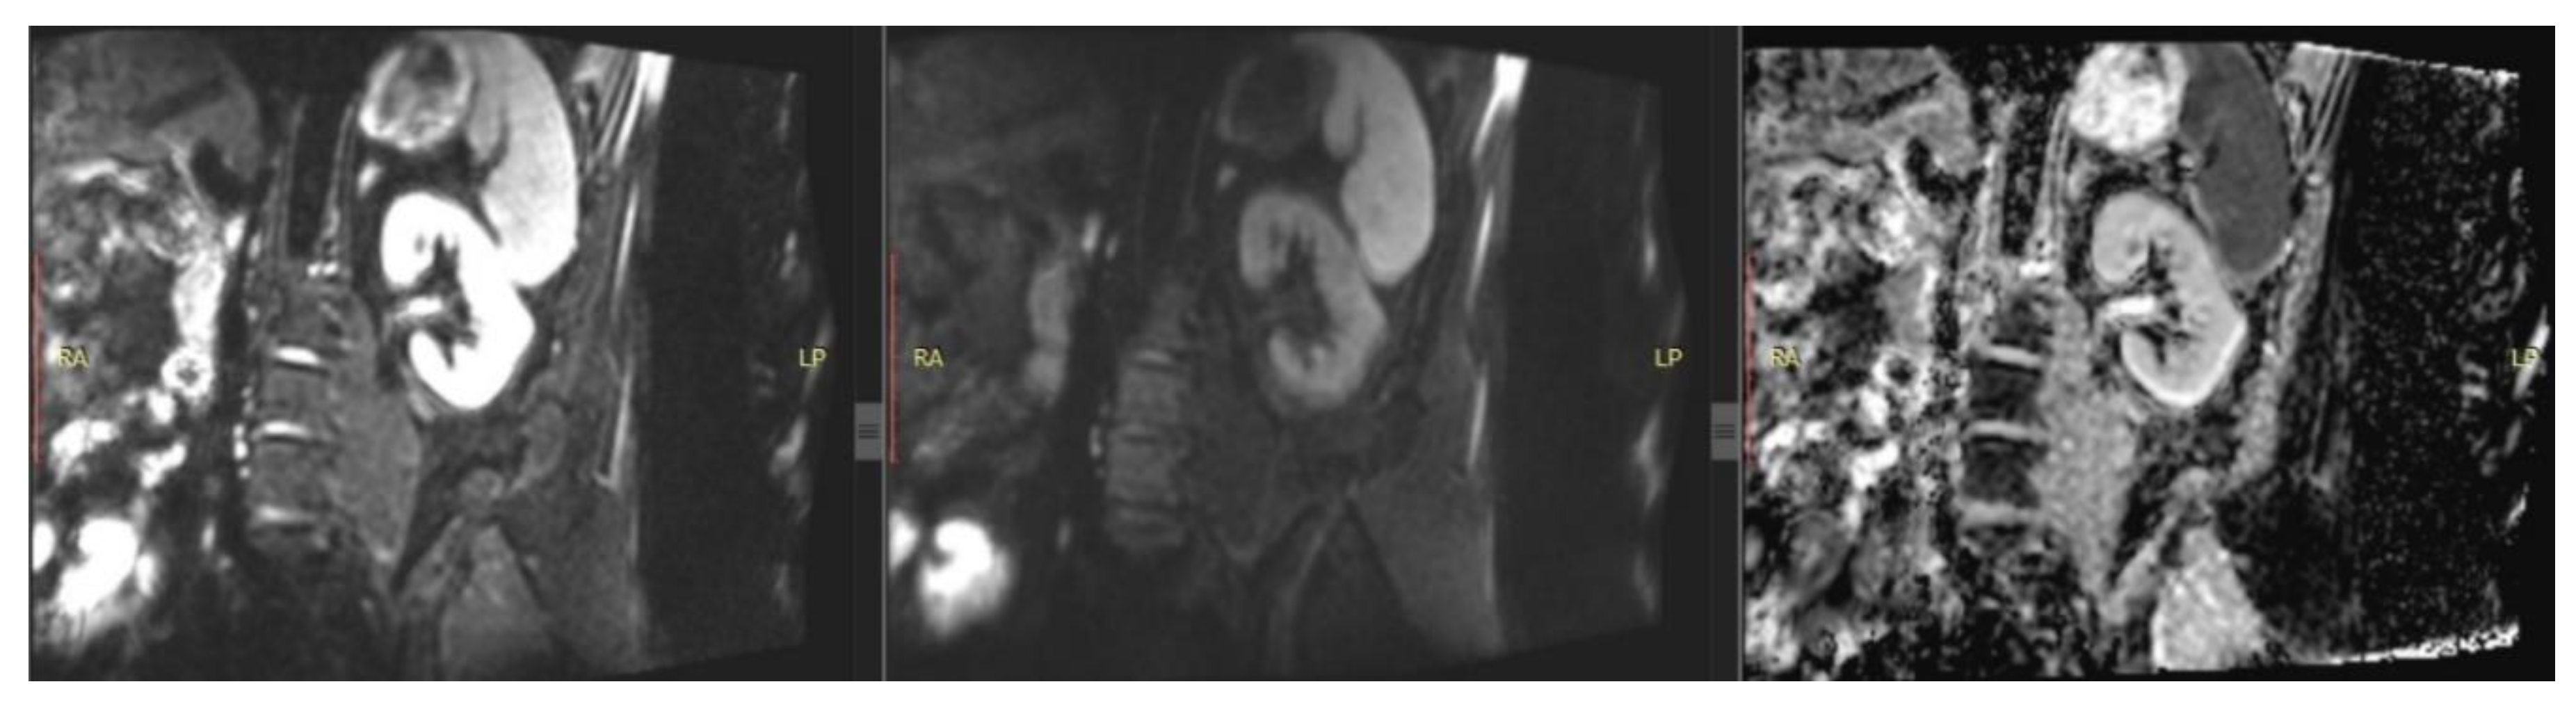
A modification of the DWI sequence that is more resistant to artefacts and the influence of T2-weighted values is the apparent diffusion coefficient (ADC), which represents the magnitude of water molecule diffusion in tissues [44]. ADC is calculated based on signal values obtained from the DWI sequence using different b-values, i.e., diffusion gradients that vary in duration, amplitude, and intervals. This approach accounts for all ranges of water molecule movement and a comprehensive evaluation of diffusion in the examined tissues: in our case, the kidneys [45]. The literature consensus is that the DWI sequence, and the ADC maps derived from it, are useful for assessing kidney perfusion and any changes related to fibrosis and oedema in these organs [20]. (Rys 3)
4.2. Clinical Utility
In CKD, the microstructure of the kidneys changes significantly, with a decrease in the number of cells, an increase in the number of fibres and the development of collagen networks. Hence, DWI may represent a powerful approach for evaluating renal microstructure and function.
Studies have found DWI values to effectively distinguish the kidneys of healthy subjects from those with CKD; these have been conducted in diverse groups of patients with different etiologies [46,47,48]. Reports also indicate that signal intensity on DWI images correlates with kidney function defined by GFR [49,50,51]. Importantly, several histopathological based studies have found ADC maps to correlate with chronic conditions, including renal fibrosis [52,53]. However, the authors could not clearly interpret the changes observed in DWI or state whether they derive from perfusion disorders or regressive structural changes.
Several interesting studies have been published on CKD associated with the course of diabetes. Various papers have confirmed that it is possible to distinguish diabetic-altered kidneys from healthy ones [54,55], as well as diabetes patients who develop CKD in its course from those developing CKD for other reasons [56]. Equally important, it has been proven that DWI signal intensity can be used to predict the evolution of diabetic CKD as well as the occurrence of macroalbuminemia [54,57].
The evaluation of DWI sequence and ADC maps in the diagnosis of polycystic kidney disease (PKD) still requires further research. Although only few such reports exist, it has been found that the signal associated with kidney parenchyma differs between patients suffering from PKD and healthy controls [58,59], and that DWI images are useful in diagnosing complicated cysts [60].
5. Phase Contrast
5.1. Principles
Another technique is renal phase contrast MRI (PC-MRI) based on 2D spoiled gradient echo pulse sequence with a short repetition time [63]. The protocol works by the principle that moving hydrogen nuclei spins are sensitive to signal phase changes, whereas stationary ones do not modify the amplitude of the applied signal. By adjusting the two signals, it is possible to calculate net phase shift of the moving spins and thus the speed of blood hydrogen. During data postprocesing, velocity maps are created that correspond to blood flow in renal arteries [64,65].
5.2. Clinical Utility
The PC-MRI sequence can be used to measure renal blood flow (RBF). The data allows indirect assessment of changes in perfusion and microperfusion, which can occur during narrowing of the renal arteries, reduction in the number of nephrons or fibrosis of the intercellular matrix [66].
Renal artery stenosis is known to be a cause of CKD and one of the two most common causes of hypertension, It has however been found to not yield any significant improvement in clinical status [67]. Despite this, attempts have been made to identify special groups of patients [68,69,70], for whom such intervention could be beneficial. So far, this issue remains unresolved.
Several studies have found PC-MRI to be of value in the evaluation of kidney function in CKD. Khatir et al. report that the reduction in perfusion and GFR is not directly proportional and is less than half than the reduction in GFR [71,72,73].
The potential of PC-MRI with regard to polycystic kidney disease has also been evaluated in preliminary studies aimed at confirming the repeatability of results [74,75]. However, two papers have identified a correlation between RBF measured by PC-MRI and kidney function, with one finding it to have predictive value for disease development [74,76].
Only one preliminary report has assessed the value of PC-MRI for evaluating transplanted kidneys [71]; while the estimated RBF values were found to be associated with GFR, this issue requires further research.
6. BOLD
6.1. Principles
Another techniques is blood oxygenation level-dependent magnetic resonance imaging (BOLD-MRI), based on the paramagnetic features of deoxyhaemoglobin. Briefly, regions of high metabolic activity are characterised by a relative increase of oxyhaemoglobin concentration and decrease in deoxyhaemoglobin. As these two molecules have different magnetic characteristics, changes of their concentration affect the magnetic environment of the local area, particularly the T2*-weighted values. Up to now, the measurement of local T2* values in renal BOLD-MRI imaging have been conducted either by single shot echo planar imaging or multiple gradient echo imaging protocols, neither of which are ideal due to their multiple limitations [77].
Even so, acquired T2* values are recalculated in so-called R2* values defined as 1/T2* per second and converted for final graphical presentation. More practically, low R2* values indicate higher local oxyhaemoglobin concentrations while high R2* values reflect higher local deoxyhaemoglobin levels.
6.2. Clinical Utility
Although local hypoxia is theorised to be directly related to the development of CKD, the results obtained by studies comparing BOLD data with GFR have not been convincing. Significant data was obtained only when an effective plasma filtration fraction (ERPF) was used [79]. Nevertheless, some studies suggest that BOLD data may be a good biomarker of CKD progression [80,81].
Attempts have been made to evaluate transplanted kidneys using BOLD sequences, which began with the study of Sadowski et al. [82] and by a combination of BOLD data and arterial spin labelling (ASL) [83]. One study found the combination of BOLD data and the use of corticomedullary differentiation factor established on T1- and T2-dependent images to distinguish acute transplant rejection from acute renal tubular necrosis [84,85].
The BOLD sequence can be used to indirectly assess RBF, making it a suitable tool for assessing changes in the kidney with renal artery stenosis. Several publications have confirmed the correlation between significant stenosis of the renal artery and T2*-weighted signal values [86,87]. Moreover, the BOLD sequence can be successfully used to monitor the effects of revascularization [88,89].
7. ASL
7.1. Principles
Arterial spin labelling (ASL) is a non-invasive magnetic resonance sequence than can be used for quantitative estimation of RBF [90,91,92]. The technique is based on labelling arterial blood passing through a limited area, and receiving its signal after passing to magnetically-prepared renal tissue. While three main types of ASL have been developed, viz. pulsed, continuous and pseudocontinuous, their main principles are similar. Briefly, the area of interest containing the kidney is scanned to acquire control images. Following this, a sequence of suppression magnetic pulses is applied to the area containing the vessels supplying the kidney to label any passing blood. After waiting for a specific period to allow the labeled blood to arrive, i.e. a post-labeling delay time, the area of interest is scanned again to obtain label images. The difference between the label and control images can be regarded as RBF maps. However, only 5% of cases demonstrate a difference in T1 relaxation times between the control and label; hence, the procedure has to be repeated several times to receive reliable results . (Rys 5)
7.2. Clinical Utility
Numerous studies have evaluated the use of ASL as a single biomarker and as a part of multiparameter studies on chronic kidney disease [93,94,95]. It has demonstrated good accuracy in distinguishing healthy volunteers from patients suffering from CKD. Interestingly, one study on diabetic CKD [96] found ASL to detect early structural changes and to correlate them with kidney function as represented by GFR values; however, it did not indicate that the technique could predict the development of CKD. Despite this, the sequence is sensitive enough to detect changes in kidney blood flow in patients with normal GFR levels [97,98].
Few studies have examined the potential of ASL sequences to evaluate the impact of renal artery stenosis on renal perfusion. The feasibility and repeatability of the technique were verified [99,100] and it was then used as a valuable part of multiparametric research. Hence, ASL appears to have high diagnostic value both as a single sequence and as a component of multi-factor analyses [101,102,103].
ASL appears to be a reliable tool for organ qualification and the evaluation of vessels prior to transplantation [104] as well as for monitoring kidneys after the operation [83,105,106]. A preliminary study by Xue Li et al. [107] found a protocol based on ASL and BOLD sequences to detect renal artery constriction in transplanted kidneys.
Studies on ASL in assessing transplanted kidney function have found estimated RBF to have good correlation with GFR values in the younger population [108] and with long-term kidney transplant recipients [109]. Practically speaking, ASL offers promise when used as part of multiparametric examinations, where it has also been found to demonstrate a good correlations with kidney function [101,102,103].
8. Conclusions
In summary, all modern MRI sequences can be useful in the diagnosis of kidney diseases and are suitable for the evaluation and monitoring of CKD (Table 1). In addition, all described sequences except PC-MRI can be used to evaluate a transplanted kidneys. T2-dependent, DWI, and ASL sequences are recommended for CKD subtypes caused by diabetes. T2-dependent, DWI and PC-MRI sequences are most suitable monitoring the function of multicystic kidneys and assessing complicated cysts; of these, PC-MRI potentially has predictive value.
When examining narrowed renal arteries, any of the listed sequences can be used to verify changes in course and assess items of hemodynamic significance; however, the BOLD and ASL sequences should be used when qualifying for revascularization and monitoring the effects of treatment. (Table 2.)
9. Limitations of the Method
While magnetic resonance imaging has obtained mostly encouraging and promising results in studies on kidney imaging, the method still has significant limitations. Most importantly, the examinations are expensive and suffer from limited availability.
In addition, MRI manufacturers and diagnostic centres can vary considerably in their choice of acquisition parameters for each of the mentioned sequences; as such, the signal intensity data obtained by specific sequences can also differ between MRI units. While attempts have been made to solve this problem, either by applying coefficients of cortical differentiation or involving algorithms analyzing textures of MR images, both methods require further verification.
Author Contributions
Conceptualization - MM, IK, AK; Data curation - MM; Formal analysis - MM; Funding acquisition - IK; Investigation - MM; Methodology - MM; Project administration – MM; Resources - MM; Supervision - AK, IK; Visualization - MM; Writing – original draft - MM; Writing – review and editing- MM, AK, IK. All authors have read and agreed to the published version of the manuscript.
Funding
Study did not received external founding.
Acknowledgments
Authors would like to thank Mr XXX for lexical correction.
Conflicts of Interest
Authors declare no conflict of interest.
References
- KDIGO 2024 Clinical Practice Guideline for the Evaluation and Management of Chronic Kidney Disease. 2024. [CrossRef]
- KDIGO Clinical Practice Guideline for Acute Kidney Injury. [CrossRef]
- Bikbov, B.; Purcell, C.; Levey, A.S.; Smith, M.; Abdoli, A.; Abebe, M.; Adebayo, O.M.; Afarideh, M.; Agarwal, S.K.; Agudelo-Botero, M.; et al. Global, regional, and national burden of chronic kidney disease, 1990-2017: a systematic analysis for the Global Burden of Disease Study 2017. Lancet (London, England) 2020, 395, 709–733. [CrossRef]
- Wang, Z.; You, Q.; Wang, Y.; Wang, J.; Shao, L. Global, regional, and national burden of chronic kidney disease among adolescents and emerging adults from 1990 to 2021. Ren. Fail. 2025, 47. [CrossRef]
- Rao, Z.; Wang, K.; Zhou, K.; Duan, Y.; Zhang, Y. Global burden and epidemic trends of chronic kidney disease attributable to high body mass index: insights from the Global Burden of Disease Study 2021. Ren. Fail. 2025, 47. [CrossRef]
- Petrucci, I.; Clementi, A.; Sessa, C.; Torrisi, I.; Meola, M. Ultrasound and color Doppler applications in chronic kidney disease. J. Nephrol. 2018, 31, 863–879. [CrossRef]
- Wang, K.C.; Lin, L.C.; Pan, S.Y.; Huang, J.W.; Chang, Y.C.; Chiang, J.Y.; Kao, H.L.; Luo, P.J.; Chen, Y.C.; Chen, B. Bin Use of iodinated and gadolinium-based contrast media in patients with chronic kidney disease: Consensus statements from nephrologists, cardiologists, and radiologists at National Taiwan University Hospital. J. Formos. Med. Assoc. 2025. [CrossRef]
- Caroli, A.; Remuzzi, A.; Remuzzi, G. Does MRI trump pathology? A new era for staging and monitoring of kidney fibrosis. Kidney Int. 2020, 97, 442–444. [CrossRef]
- Selby, N.M.; Blankestijn, P.J.; Boor, P.; Combe, C.; Eckardt, K.U.; Eikefjord, E.; Garcia-Fernandez, N.; Golay, X.; Gordon, I.; Grenier, N.; et al. Magnetic resonance imaging biomarkers for chronic kidney disease: a position paper from the European Cooperation in Science and Technology Action PARENCHIMA. Nephrol. Dial. Transplant 2018, 33, ii4–ii14. [CrossRef]
- Cho, M.E.; Brunt, V.E.; Shiu, Y.-T.; Bunsawat, K. Endothelial dysfunction in chronic kidney disease: a clinical perspective. Am. J. Physiol. Heart Circ. Physiol. 2025. [CrossRef]
- Navarro-Garcia, J.A.; Keefe, J.A.; Song, J.; Li, N.; Wehrens, X.H.T. Mechanisms underlying atrial fibrillation in chronic kidney disease. J. Mol. Cell. Cardiol. 2025, 205, 37–51. [CrossRef]
- Efiong, E.E.; Maedler, K.; Effa, E.; Osuagwu, U.L.; Peters, E.; Ikebiuro, J.O.; Soremekun, C.; Ihediwa, U.; Niu, J.; Fuchs, M.; et al. Decoding diabetic kidney disease: a comprehensive review of interconnected pathways, molecular mediators, and therapeutic insights. Diabetol. Metab. Syndr. 2025, 17. [CrossRef]
- Li, C.S.Z.; Yu, B.; Gao, Q.; Dong, H.L.; Li, Z.L. The critical role of ion channels in kidney disease: perspective from AKI and CKD. Ren. Fail. 2025, 47, 2488139. [CrossRef]
- Scherzinger, A.L.; Hendee, W.R. Basic Principles of Magnetic Resonance Imaging—An Update. West. J. Med. 1985, 143, 782.
- Schaeffter, T.; Dahnke, H. Magnetic Resonance Imaging and Spectroscopy. Handb. Exp. Pharmacol. 2008, 185, 75–90. [CrossRef]
- Cheng, H.L.M.; Wright, G.A. Rapid high-resolution T1 mapping by variable flip angles: Accurate and precise measurements in the presence of radiofrequency field inhomogeneity. Magn. Reson. Med. 2006, 55, 566–574. [CrossRef]
- Moser, E.; Stadlbauer, A.; Windischberger, C.; Quick, H.H.; Ladd, M.E. Magnetic resonance imaging methodology. Eur. J. Nucl. Med. Mol. Imaging 2009, 36, 30–41. [CrossRef]
- Rankin, A.J.; Mayne, K.; Allwood-Spiers, S.; Hall Barrientos, P.; Roditi, G.; Gillis, K.A.; Mark, P.B. Will advances in functional renal magnetic resonance imaging translate to the nephrology clinic? Nephrology 2022, 27, 223–230. [CrossRef]
- Wolf, M.; De Boer, A.; Sharma, K.; Boor, P.; Leiner, T.; Sunder-Plassmann, G.; Moser, E.; Caroli, A.; Jerome, N.P. Magnetic resonance imaging T1- and T2-mapping to assess renal structure and function: a systematic review and statement paper. Nephrol. Dial. Transplant 2018, 33, II41–II50. [CrossRef]
- Selby, N.M.; Bmbs, B.; Frcp, D.M.; Francis, S.T. Assessment of Acute Kidney Injury using MRI. J. Magn. Reson. Imaging 2025, 61, 25–41. [CrossRef]
- Marotti, M.; Hricak, H.; Terrier, F.; McAninch, J.W.; Thuroff, J.W. MR in renal disease: importance of cortical-medullary distinction. Magn. Reson. Med. 1987, 5, 160–172. [CrossRef]
- Hricak, H.; Terrier, F.; Marotti, M.; Engelstad, B.L.; Filly, R.A.; Vincenti, F.; Duca, R.M.; Bretan, P.N.; Higgins, C.B.; Feduska, N. Posttransplant renal rejection: comparison of quantitative scintigraphy, US, and MR imaging. 1987, 162, 685–688. [CrossRef]
- Baumgartner, B.; Nelson, R.; Ball, T.; Wyly, J.; Bourke, E.; Delaney, V.; Bernardino, M.; Baumgartner, B.; Nelson, R.; Ball, T.; et al. MR imaging of renal transplants. https://www.ajronline.org/ 2012, 147, 949–953. [CrossRef]
- Yusa, Y.; Kundel, H.L. Magnetic resonance imaging following unilateral occlusion of the renal circulation in rabbits. Radiology 1985, 154, 151–156. [CrossRef]
- Pohlmann, A.; Hentschel, J.; Fechner, M.; Hoff, U.; Bubalo, G.; Arakelyan, K.; Cantow, K.; Seeliger, E.; Flemming, B.; Waiczies, H.; et al. High temporal resolution parametric MRI monitoring of the initial ischemia/reperfusion phase in experimental acute kidney injury. PLoS One 2013, 8. [CrossRef]
- Hueper, K.; Rong, S.; Gutberlet, M.; Hartung, D.; Mengel, M.; Lu, X.; Haller, H.; Wacker, F.; Meier, M.; Gueler, F. T2 relaxation time and apparent diffusion coefficient for noninvasive assessment of renal pathology after acute kidney injury in mice: comparison with histopathology. Invest. Radiol. 2013, 48, 834–842. [CrossRef]
- Franke, M.; Baeßler, B.; Vechtel, J.; Dafinger, C.; Höhne, M.; Borgal, L.; Göbel, H.; Koerber, F.; Maintz, D.; Benzing, T.; et al. Magnetic resonance T2 mapping and diffusion-weighted imaging for early detection of cystogenesis and response to therapy in a mouse model of polycystic kidney disease. Kidney Int. 2017, 92, 1544–1554. [CrossRef]
- Schmidbauer, M.; Rong, S.; Gutberlet, M.; Chen, R.; Bräsen, J.H.; Hartung, D.; Meier, M.; Wacker, F.; Haller, H.; Gueler, F.; et al. Diffusion-Weighted Imaging and Mapping of T1 and T2 Relaxation Time for Evaluation of Chronic Renal Allograft Rejection in a Translational Mouse Model. J. Clin. Med. 2021, 10. [CrossRef]
- Hueper, K.; Hensen, B.; Gutberlet, M.; Chen, R.; Hartung, D.; Barrmeyer, A.; Meier, M.; Li, W.; Jang, M.S.; Mengel, M.; et al. Kidney Transplantation: Multiparametric Functional Magnetic Resonance Imaging for Assessment of Renal Allograft Pathophysiology in Mice. Invest. Radiol. 2016, 51, 58–65. [CrossRef]
- Lee, V.S.; Kaur, M.; Bokacheva, L.; Chen, Q.; Rusinek, H.; Thakur, R.; Moses, D.; Nazzaro, C.; Kramer, E.L. What causes diminished corticomedullary differentiation in renal insufficiency? J. Magn. Reson. Imaging 2007, 25, 790–795. [CrossRef]
- Leung, A.W.L.; Bydder, G.M.; Steiner, R.E.; Bryant, D.J.; Young, I.R. Magnetic resonance imaging of the kidneys. AJR. Am. J. Roentgenol. 1984, 143, 1215–1227. [CrossRef]
- Geisinger, M.A.; Risius, B.; Jordan, M.L.; Zelch, M.G.; Novick, A.C.; George, C.R. Magnetic resonance imaging of renal transplants. AJR. Am. J. Roentgenol. 1984, 143, 1229–1234. [CrossRef]
- Kettritz, U.; Semelka, R.C.; Brown, E.D.; Sharp, T.J.; Lawing, W.L.; Colindres, R.E. MR findings in diffuse renal parenchymal disease. J. Magn. Reson. Imaging 1996, 6, 136–144. [CrossRef]
- Semelka, R.C.; Corrigan, K.; Ascher, S.M.; Brown, J.J.; Colindres, R.E. Renal corticomedullary differentiation: observation in patients with differing serum creatinine levels. Radiology 1994, 190, 149–152. [CrossRef]
- Inoue, T.; Kozawa, E.; Okada, H.; Inukai, K.; Watanabe, S.; Kikuta, T.; Watanabe, Y.; Takenaka, T.; Katayama, S.; Tanaka, J.; et al. Noninvasive evaluation of kidney hypoxia and fibrosis using magnetic resonance imaging. J. Am. Soc. Nephrol. 2011, 22, 1429–1434. [CrossRef]
- Mathys, C.; Blondin, D.; Wittsack, H.J.; Miese, F.R.; Rybacki, K.; Walther, C.; Holstein, A.; Lanzman, R.S. T2’ Imaging of Native Kidneys and Renal Allografts - a Feasibility Study. Rofo 2011, 183, 112–119. [CrossRef]
- Schley, G.; Jordan, J.; Ellmann, S.; Rosen, S.; Eckardt, K.U.; Uder, M.; Willam, C.; Bäuerle, T. Multiparametric magnetic resonance imaging of experimental chronic kidney disease: A quantitative correlation study with histology. PLoS One 2018, 13. [CrossRef]
- Zhang, G.; Liu, Y.; Sun, H.; Xu, L.; Sun, J.; An, J.; Zhou, H.; Liu, Y.; Chen, L.; Jin, Z. Texture analysis based on quantitative magnetic resonance imaging to assess kidney function: a preliminary study. Quant. Imaging Med. Surg. 2021, 11, 1256–1270. [CrossRef]
- Yu, B.; Huang, C.; Fan, X.; Li, F.; Zhang, J.; Song, Z.; Zhi, N.; Ding, J. Application of MR Imaging Features in Differentiation of Renal Changes in Patients With Stage III Type 2 Diabetic Nephropathy and Normal Subjects. Front. Endocrinol. (Lausanne). 2022, 13. [CrossRef]
- Grzywińska, M.; Jankowska, M.; Banach-Ambroziak, E.; Szurowska, E.; Dębska-Ślizień, A. Computation of the Texture Features on T2-Weighted Images as a Novel Method to Assess the Function of the Transplanted Kidney: Primary Research. Transplant. Proc. 2020, 52, 2062–2066. [CrossRef]
- Hara, Y.; Nagawa, K.; Yamamoto, Y.; Inoue, K.; Funakoshi, K.; Inoue, T.; Okada, H.; Ishikawa, M.; Kobayashi, N.; Kozawa, E. The utility of texture analysis of kidney MRI for evaluating renal dysfunction with multiclass classification model. Sci. Rep. 2022, 12, 14776. [CrossRef]
- Majos, M.; Klepaczko, A.; Szychowska, K.; Stefanczyk, L.; Kurnatowska, I. Texture Analysis of T2-Weighted Images as Reliable Biomarker of Chronic Kidney Disease Microstructural State. Biomed. 2025, Vol. 13, Page 1381 2025, 13, 1381. [CrossRef]
- Le Bihan, D.; Iima, M. Diffusion Magnetic Resonance Imaging: What Water Tells Us about Biological Tissues. PLOS Biol. 2015, 13, e1002203. [CrossRef]
- Taouli, B.; Koh, D.M. Diffusion-weighted MR imaging of the liver. Radiology 2010, 254, 47–66. [CrossRef]
- Javid, M.; Mirdamadi, A.; Javid, M.; Keivanlou, M.H.; Amini-Salehi, E.; Norouzi, N.; Abbaspour, E.; Alizadeh, A.; Joukar, F.; Mansour-Ghanaei, F.; et al. The evolving role of MRI in the detection of extrathyroidal extension of papillary thyroid carcinoma: a systematic review and meta-analysis. BMC Cancer 2024, 24. [CrossRef]
- Liu, Z.; Xu, Y.; Zhang, J.; Zhen, J.; Wang, R.; Cai, S.; Yuan, X.; Liu, Q. Chronic kidney disease: pathological and functional assessment with diffusion tensor imaging at 3T MR. Eur. Radiol. 2015, 25, 652–660. [CrossRef]
- Çakmak, P.; Yaǧci, A.B.; Dursun, B.; Herek, D.; Fenkçi, S.M. Renal diffusion-weighted imaging in diabetic nephropathy: correlation with clinical stages of disease. Diagn. Interv. Radiol. 2014, 20, 374–378. [CrossRef]
- Goyal, A.; Sharma, R.; Bhalla, A.; Gamanagatti, S.; Seth, A. Diffusion-weighted MRI in assessment of renal dysfunction. Indian J. Radiol. Imaging 2012, 22, 155–159. [CrossRef]
- Carbone, S.F.; Gaggioli, E.; Ricci, V.; Mazzei, F.; Mazzei, M.A.; Volterrani, L. Diffusion-weighted magnetic resonance imaging in the evaluation of renal function: a preliminary study. Radiol. Med. 2007, 112, 1201–1210. [CrossRef]
- Yalçin-Şafak, K.; Ayyildiz, M.; Ünel, S.Y.; Umarusman-Tanju, N.; Akça, A.; Baysal, T. The relationship of ADC values of renal parenchyma with CKD stage and serum creatinine levels. Eur. J. Radiol. Open 2016, 3, 8–11. [CrossRef]
- Ding, J.; Chen, J.; Jiang, Z.; Zhou, H.; Di, J.; Xing, W. Assessment of renal dysfunction with diffusion-weighted imaging: comparing intra-voxel incoherent motion (IVIM) with a mono-exponential model. Acta Radiol. 2016, 57, 507–512. [CrossRef]
- Zhou, H.Y.; Chen, T.W.; Zhang, X.M. Functional Magnetic Resonance Imaging in Acute Kidney Injury: Present Status. Biomed Res. Int. 2016, 2016. [CrossRef]
- Li, Q.; Li, J.; Zhang, L.; Chen, Y.; Zhang, M.; Yan, F. Diffusion-weighted imaging in assessing renal pathology of chronic kidney disease: A preliminary clinical study. Eur. J. Radiol. 2014, 83, 756–762. [CrossRef]
- Duan, S.; Geng, L.; Lu, F.; Chen, C.; Jiang, L.; Chen, S.; Zhang, C.; Huang, Z.; Zeng, M.; Sun, B.; et al. Utilization of the corticomedullary difference in magnetic resonance imaging-derived apparent diffusion coefficient for noninvasive assessment of chronic kidney disease in type 2 diabetes. Diabetes Metab. Syndr. 2024, 18. [CrossRef]
- Chen, X.; Xiao, W.; Li, X.; He, J.; Huang, X.; Tan, Y. In vivo evaluation of renal function using diffusion weighted imaging and diffusion tensor imaging in type 2 diabetics with normoalbuminuria versus microalbuminuria. Front. Med. 2014, 8, 471–476. [CrossRef]
- Zhou, S.P.; Wang, Q.; Chen, P.; Zhai, X.; Zhao, J.; Bai, X.; Li, L.; Guo, H.P.; Ning, X.Y.; Zhang, X.J.; et al. Assessment of the Added Value of Intravoxel Incoherent Motion Diffusion-Weighted MR Imaging in Identifying Non-Diabetic Renal Disease in Patients With Type 2 Diabetes Mellitus. J. Magn. Reson. Imaging 2024, 59, 1593–1602. [CrossRef]
- Razek, A.A.K.A.; Al-Adlany, M.A.A.A.; Alhadidy, A.M.; Atwa, M.A.; Abdou, N.E.A. Diffusion tensor imaging of the renal cortex in diabetic patients: correlation with urinary and serum biomarkers. Abdom. Radiol. (New York) 2017, 42, 1493–1500. [CrossRef]
- Lupica, R.; Mormina, E.; Lacquaniti, A.; Trimboli, D.; Bianchimano, B.; Marino, S.; Bramanti, P.; Longo, M.; Buemi, M.; Granata, F. 3 Tesla-Diffusion Tensor Imaging in Autosomal Dominant Polycystic Kidney Disease: The Nephrologist’s Point of View. Nephron 2016, 134, 73–80. [CrossRef]
- Caroli, A.; Villa, G.; Brambilla, P.; Trillini, M.; Sharma, K.; Sironi, S.; Remuzzi, G.; Perico, N.; Remuzzi, A. Diffusion magnetic resonance imaging for kidney cyst volume quantification and non-cystic tissue characterisation in ADPKD. Eur. Radiol. 2023, 33, 6009–6019. [CrossRef]
- Suwabe, T.; Ubara, Y.; Ueno, T.; Hayami, N.; Hoshino, J.; Imafuku, A.; Kawada, M.; Hiramatsu, R.; Hasegawa, E.; Sawa, N.; et al. Intracystic magnetic resonance imaging in patients with autosomal dominant polycystic kidney disease: features of severe cyst infection in a case-control study. BMC Nephrol. 2016, 17, 1–9. [CrossRef]
- Xie, Y.; Li, Y.; Wen, J.; Li, X.; Zhang, Z.; Li, J.; Zhao, Y.; Bs, P.W.; Bs, J.Z.; Ms, Y.T.; et al. Functional Evaluation of Transplanted Kidneys with Reduced Field-of-View Diffusion-Weighted Imaging at 3T. Korean J. Radiol. 2018, 19, 201–208. [CrossRef]
- Wang, W.; Yu, Y.; Chen, J.; Zhang, L.; Li, X. Intravoxel incoherent motion diffusion-weighted imaging for predicting kidney allograft function decline: comparison with clinical parameters. Insights Imaging 2024, 15. [CrossRef]
- Zöllner, F.G.; Ankar Monssen, J.; Rørvik, J.; Lundervold, A.; Schad, L.R. Blood flow quantification from 2D phase contrast MRI in renal arteries using an unsupervised data driven approach. Z. Med. Phys. 2009, 19, 98–107. [CrossRef]
- Steeden, J.A.; Muthurangu, V. Investigating the limitations of single breath-hold renal artery blood flow measurements using spiral phase contrast MR with R-R interval averaging. J. Magn. Reson. Imaging 2015, 41, 1143–1149. [CrossRef]
- Park, J.B.; Santos, J.M.; Hargreaves, B.A.; Nayak, K.S.; Sommer, G.; Hu, B.S.; Nishimura, D.G. Rapid measurement of renal artery blood flow with ungated spiral phase-contrast MRI. J. Magn. Reson. Imaging 2005, 21, 590–595. [CrossRef]
- Levey, A.S.; Coresh, J. Chronic kidney disease. Lancet (London, England) 2012, 379, 165–180. [CrossRef]
- Cooper, C.J.; Murphy, T.P.; Cutlip, D.E.; Jamerson, K.; Henrich, W.; Reid, D.M.; Cohen, D.J.; Matsumoto, A.H.; Steffes, M.; Jaff, M.R.; et al. Stenting and medical therapy for atherosclerotic renal-artery stenosis. N. Engl. J. Med. 2014, 370, 13–22. [CrossRef]
- Binkert, C.A.; Debatin, J.F.; Schneider, E.; Hodler, J.; Ruehm, S.G.; Schmidt, M.; Hoffmann, U. Can MR measurement of renal artery flow and renal volume predict the outcome of percutaneous transluminal renal angioplasty? Cardiovasc. Intervent. Radiol. 2001, 24, 233–239. [CrossRef]
- Binkert, C.A.; Hoffman, U.; Leung, D.A.; Matter, H.G.; Schmidt, M.; Debatin, J.F. Characterization of renal artery stenoses based on magnetic resonance renal flow and volume measurements. Kidney Int. 1999, 56, 1846–1854. [CrossRef]
- Schoenberg, S.O.; Knopp, M. V.; Londy, F.; Krishnan, S.; Zuna, I.; Lang, N.; Essig, M.; Hawighorst, H.; Maki, J.H.; Stafford-Johnson, D.; et al. Morphologic and functional magnetic resonance imaging of renal artery stenosis: a multireader tricenter study. J. Am. Soc. Nephrol. 2002, 13, 158–169. [CrossRef]
- Barker, A.J.; Berthusen, A.; Vigers, T.; Schafer, M.; Browne, L.P.; Bjornstad, P. Estimation of glomerular filtration rate in a pediatric population using non-contrast kidney phase contrast magnetic resonance imaging. Pediatr. Nephrol. 2023, 38, 2877–2881. [CrossRef]
- Michaely, H.J.; Schoenberg, S.O.; Ittrich, C.; Dikow, R.; Bock, M.; Guenther, M. Renal disease: value of functional magnetic resonance imaging with flow and perfusion measurements. Invest. Radiol. 2004, 39, 698–705. [CrossRef]
- Khatir, D.S.; Pedersen, M.; Jespersen, B.; Buus, N.H. Evaluation of Renal Blood Flow and Oxygenation in CKD Using Magnetic Resonance Imaging. Am. J. Kidney Dis. 2015, 66, 402–411. [CrossRef]
- Spithoven, E.M.; Meijer, E.; Borns, C.; Boertien, W.E.; Gaillard, C.A.J.M.; Kappert, P.; Greuter, M.J.W.; van der Jagt, E.; Vart, P.; de Jong, P.E.; et al. Feasibility of measuring renal blood flow by phase-contrast magnetic resonance imaging in patients with autosomal dominant polycystic kidney disease. Eur. Radiol. 2016, 26, 683–692. [CrossRef]
- Kline, T.L.; Edwards, M.E.; Garg, I.; Irazabal, M. V.; Korfiatis, P.; Harris, P.C.; King, B.F.; Torres, V.E.; Venkatesh, S.K.; Erickson, B.J. Quantitative MRI of kidneys in renal disease. Abdom. Radiol. (New York) 2018, 43, 629–638. [CrossRef]
- King, B.F.; Torres, V.E.; Brummer, M.E.; Chapman, A.B.; Bae, K.T.; Glockner, J.F.; Arya, K.; Felmlee, J.P.; Grantham, J.J.; Guay-Woodford, L.M.; et al. Magnetic resonance measurements of renal blood flow as a marker of disease severity in autosomal-dominant polycystic kidney disease. Kidney Int. 2003, 64, 2214–2221. [CrossRef]
- Pruijm, M.; Milani, B.; Burnier, M. Blood oxygenation level-dependent mri to assess renal oxygenation in renal diseases: Progresses and challenges. Front. Physiol. 2017, 7, 240378. [CrossRef]
- Neugarten, J. Renal BOLD-MRI and assessment for renal hypoxia. Kidney Int. 2012, 81, 613–614. [CrossRef]
- van der Bel, R.; Coolen, B.F.; Nederveen, A.J.; Potters, W. V.; Verberne, H.J.; Vogt, L.; Stroes, E.S.G.; Paul Krediet, C.T. Magnetic Resonance Imaging-Derived Renal Oxygenation and Perfusion During Continuous, Steady-State Angiotensin-II Infusion in Healthy Humans. J. Am. Heart Assoc. 2016, 5. [CrossRef]
- Li, L.P.; Milani, B.; Pruijm, M.; Kohn, O.; Sprague, S.; Hack, B.; Prasad, P. Renal BOLD MRI in patients with chronic kidney disease: comparison of the semi-automated twelve layer concentric objects (TLCO) and manual ROI methods. MAGMA 2020, 33, 113–120. [CrossRef]
- Sugiyama, K.; Inoue, T.; Kozawa, E.; Ishikawa, M.; Shimada, A.; Kobayashi, N.; Tanaka, J.; Okada, H. Reduced oxygenation but not fibrosis defined by functional magnetic resonance imaging predicts the long-term progression of chronic kidney disease. Nephrol. Dial. Transplant 2020, 35, 964–970. [CrossRef]
- Sadowski, E.A.; Fain, S.B.; Alford, S.K.; Korosec, F.R.; Fine, J.; Muehrer, R.; Djamali, A.; Hofmann, R.M.; Becker, B.N.; Grist, T.M. Assessment of acute renal transplant rejection with blood oxygen level-dependent MR imaging: initial experience. Radiology 2005, 236, 911–919. [CrossRef]
- Niles, D.J.; Artz, N.S.; Djamali, A.; Sadowski, E.A.; Grist, T.M.; Fain, S.B. Longitudinal Assessment of Renal Perfusion and Oxygenation in Transplant Donor-Recipient Pairs Using Arterial Spin Labeling and Blood Oxygen Level-Dependent Magnetic Resonance Imaging. Invest. Radiol. 2016, 51, 113–120. [CrossRef]
- Djamali, A.; Sadowski, E.A.; Samaniego-Picota, M.; Fain, S.B.; Muehrer, R.J.; Alford, S.K.; Grist, T.M.; Becker, B.N. Noninvasive assessment of early kidney allograft dysfunction by blood oxygen level-dependent magnetic resonance imaging. Transplantation 2006, 82, 621–628. [CrossRef]
- Han, F.; Xiao, W.; Xu, Y.; Wu, J.; Wang, Q.; Wang, H.; Zhang, M.; Chen, J. The significance of BOLD MRI in differentiation between renal transplant rejection and acute tubular necrosis. Nephrol. Dial. Transplant 2008, 23, 2666–2672. [CrossRef]
- Gloviczki, M.L.; Keddis, M.T.; Garovic, V.D.; Friedman, H.; Herrmann, S.; McKusick, M.A.; Misra, S.; Grande, J.P.; Lerman, L.O.; Textor, S.C. TGF expression and macrophage accumulation in atherosclerotic renal artery stenosis. Clin. J. Am. Soc. Nephrol. 2013, 8, 546–553. [CrossRef]
- Abumoawad, A.; Saad, A.; Ferguson, C.M.; Eirin, A.; Woollard, J.R.; Herrmann, S.M.; Hickson, L.T.J.; Bendel, E.C.; Misra, S.; Glockner, J.; et al. Tissue hypoxia, inflammation, and loss of glomerular filtration rate in human atherosclerotic renovascular disease. Kidney Int. 2019, 95, 948–957. [CrossRef]
- Chrysochou, C.; Mendichovszky, I.A.; Buckley, D.L.; Cheung, C.M.; Jackson, A.; Kalra, P.A. BOLD imaging: a potential predictive biomarker of renal functional outcome following revascularization in atheromatous renovascular disease. Nephrol. Dial. Transplant 2012, 27, 1013–1019. [CrossRef]
- Saad, A.; Herrmann, S.M.S.; Eirin, A.; Ferguson, C.M.; Glockner, J.F.; Bjarnason, H.; McKusick, M.A.; Misra, S.; Lerman, L.O.; Textor, S.C. Phase 2a Clinical Trial of Mitochondrial Protection (Elamipretide) During Stent Revascularization in Patients With Atherosclerotic Renal Artery Stenosis. Circ. Cardiovasc. Interv. 2017, 10. [CrossRef]
- Shimizu, K.; Kosaka, N.; Fujiwara, Y.; Matsuda, T.; Yamamoto, T.; Tsuchida, T.; Tsuchiyama, K.; Oyama, N.; Kimura, H. Arterial Transit Time-corrected Renal Blood Flow Measurement with Pulsed Continuous Arterial Spin Labeling MR Imaging. Magn. Reson. Med. Sci. 2017, 16, 38–44. [CrossRef]
- Buxton, R.B.; Frank, L.R.; Wong, E.C.; Siewert, B.; Warach, S.; Edelman, R.R. A general kinetic model for quantitative perfusion imaging with arterial spin labeling. Magn. Reson. Med. 1998, 40, 383–396. [CrossRef]
- Kim, D.W.; Shim, W.H.; Yoon, S.K.; Oh, J.Y.; Kim, J.K.; Jung, H.; Matsuda, T.; Kim, D. Measurement of arterial transit time and renal blood flow using pseudocontinuous ASL MRI with multiple post-labeling delays: Feasibility, reproducibility, and variation. J. Magn. Reson. Imaging 2017, 46, 813–819. [CrossRef]
- Pi, S.; Li, Y.; Lin, C.; Li, G.; Wen, H.; Peng, H.; Wang, J. Arterial spin labeling and diffusion-weighted MR imaging: quantitative assessment of renal pathological injury in chronic kidney disease. Abdom. Radiol. (New York) 2023, 48, 999–1010. [CrossRef]
- Rossi, C.; Artunc, F.; Martirosian, P.; Schlemmer, H.P.; Schick, F.; Boss, A. Histogram analysis of renal arterial spin labeling perfusion data reveals differences between volunteers and patients with mild chronic kidney disease. Invest. Radiol. 2012, 47, 490–496. [CrossRef]
- Gillis, K.A.; McComb, C.; Patel, R.K.; Stevens, K.K.; Schneider, M.P.; Radjenovic, A.; Morris, S.T.W.; Roditi, G.H.; Delles, C.; Mark, P.B. Non-Contrast Renal Magnetic Resonance Imaging to Assess Perfusion and Corticomedullary Differentiation in Health and Chronic Kidney Disease. Nephron 2016, 133, 183–192. [CrossRef]
- Mora-Gutiérrez, J.M.; Garcia-Fernandez, N.; Slon Roblero, M.F.; Páramo, J.A.; Escalada, F.J.; Wang, D.J.J.; Benito, A.; Fernández-Seara, M.A. Arterial spin labeling MRI is able to detect early hemodynamic changes in diabetic nephropathy. J. Magn. Reson. Imaging 2017, 46, 1810–1817. [CrossRef]
- Li, L.P.; Tan, H.; Thacker, J.M.; Li, W.; Zhou, Y.; Kohn, O.; Sprague, S.M.; Prasad, P. V. Evaluation of Renal Blood Flow in Chronic Kidney Disease Using Arterial Spin Labeling Perfusion Magnetic Resonance Imaging. Kidney Int. reports 2017, 2, 36–43. [CrossRef]
- Mao, W.; Ding, Y.; Ding, X.; Fu, C.; Cao, B.; Kuehn, B.; Benkert, T.; Grimm, R.; Zhou, J.; Zeng, M. Capability of arterial spin labeling and intravoxel incoherent motion diffusion-weighted imaging to detect early kidney injury in chronic kidney disease. Eur. Radiol. 2023, 33, 3286–3294. [CrossRef]
- Wilson, G.J.; Maki, J.H. Non-contrast-enhanced MR imaging of renal artery stenosis at 1.5 tesla. Magn. Reson. Imaging Clin. N. Am. 2009, 17, 13–27. [CrossRef]
- Fenchel, M.; Martirosian, P.; Langanke, J.; Giersch, J.; Miller, S.; Stauder, N.I.; Kramer, U.; Claussen, C.D.; Schick, F. Perfusion MR imaging with FAIR true FISP spin labeling in patients with and without renal artery stenosis: initial experience. Radiology 2006, 238, 1013–1021. [CrossRef]
- Zhao, L.; Tong, X.Y.; Ning, Z.H.; Wang, G.Q.; Xu, F.B.; Liu, J.Y.; Li, S.; Zhang, N.; Sun, Z.H.; Zhao, X.H.; et al. A preliminary study of renal function for renal artery stenosis using multiparametric magnetic resonance imaging. Abdom. Radiol. (New York) 2025, 50. [CrossRef]
- Artunc, F.; Rossi, C.; Boss, A. MRI to assess renal structure and function. Curr. Opin. Nephrol. Hypertens. 2011, 20, 669–675. [CrossRef]
- Ott, C.; Janka, R.; Schmid, A.; Titze, S.; Ditting, T.; Sobotka, P.A.; Veelken, R.; Uder, M.; Schmieder, R.E. Vascular and renal hemodynamic changes after renal denervation. Clin. J. Am. Soc. Nephrol. 2013, 8, 1195–1201. [CrossRef]
- Andersson, J.; Meik, R.; Pravdivtseva, M.S.; Langguth, P.; Gottschalk, H.; Sedaghat, S.; Jüptner, M.; Koktzoglou, I.; Edelman, R.R.; Kühn, B.; et al. Non-contrast preoperative MRI for determining renal perfusion and visualizing renal arteries in potential living kidney donors at 1.5 Tesla. Clin. Kidney J. 2024, 17. [CrossRef]
- Ren, T.; Wen, C.L.; Chen, L.H.; Xie, S.S.; Cheng, Y.; Fu, Y.X.; Oesingmann, N.; de Oliveira, A.; Zuo, P.L.; Yin, J.Z.; et al. Evaluation of renal allografts function early after transplantation using intravoxel incoherent motion and arterial spin labeling MRI. Magn. Reson. Imaging 2016, 34, 908–914. [CrossRef]
- Cutajar, M.; Hilton, R.; Olsburgh, J.; Marks, S.D.; Thomas, D.L.; Banks, T.; Clark, C.A.; Gordon, I. Renal blood flow using arterial spin labelling MRI and calculated filtration fraction in healthy adult kidney donors Pre-nephrectomy and post-nephrectomy. Eur. Radiol. 2015, 25, 2390–2396. [CrossRef]
- Li, X.; Wang, W.; Cheng, D.; Yu, Y.; Wu, Q.; Ni, X.; Chen, J.; Zhang, L.; Wen, J. Perfusion and oxygenation in allografts with transplant renal artery stenosis: Evaluation with functional magnetic resonance imaging. Clin. Transplant. 2022, 36. [CrossRef]
- Radovic, T.; Jankovic, M.M.; Stevic, R.; Spasojevic, B.; Cvetkovic, M.; Pavicevic, P.; Gojkovic, I.; Kostic, M. Detection of impaired renal allograft function in paediatric and young adult patients using arterial spin labelling MRI (ASL-MRI). Sci. Rep. 2022, 12. [CrossRef]
- Jiang, B.; Li, J.; Wan, J.; Tian, Y.; Wu, P.; Xu, R.; Yu, Y.; Wang, X.; Hu, L.; Zhu, M. Arterial spin labeling combined with T1 mapping for assessment of kidney function and histopathology in patients with long-term renal transplant survival after kidney transplantation. Quant. Imaging Med. Surg. 2024, 14, 2415–2425. [CrossRef]
Rys 1.
Example of kidney in T1-weighted DIXON image.
Rys 2.
Example of kidney in T2-weighted HEIST image.
Rys 3.
Example of kidney in DWI (b 0, b 400) and ADC map.
Rys 4.
Example of kidney in BOLD maps.
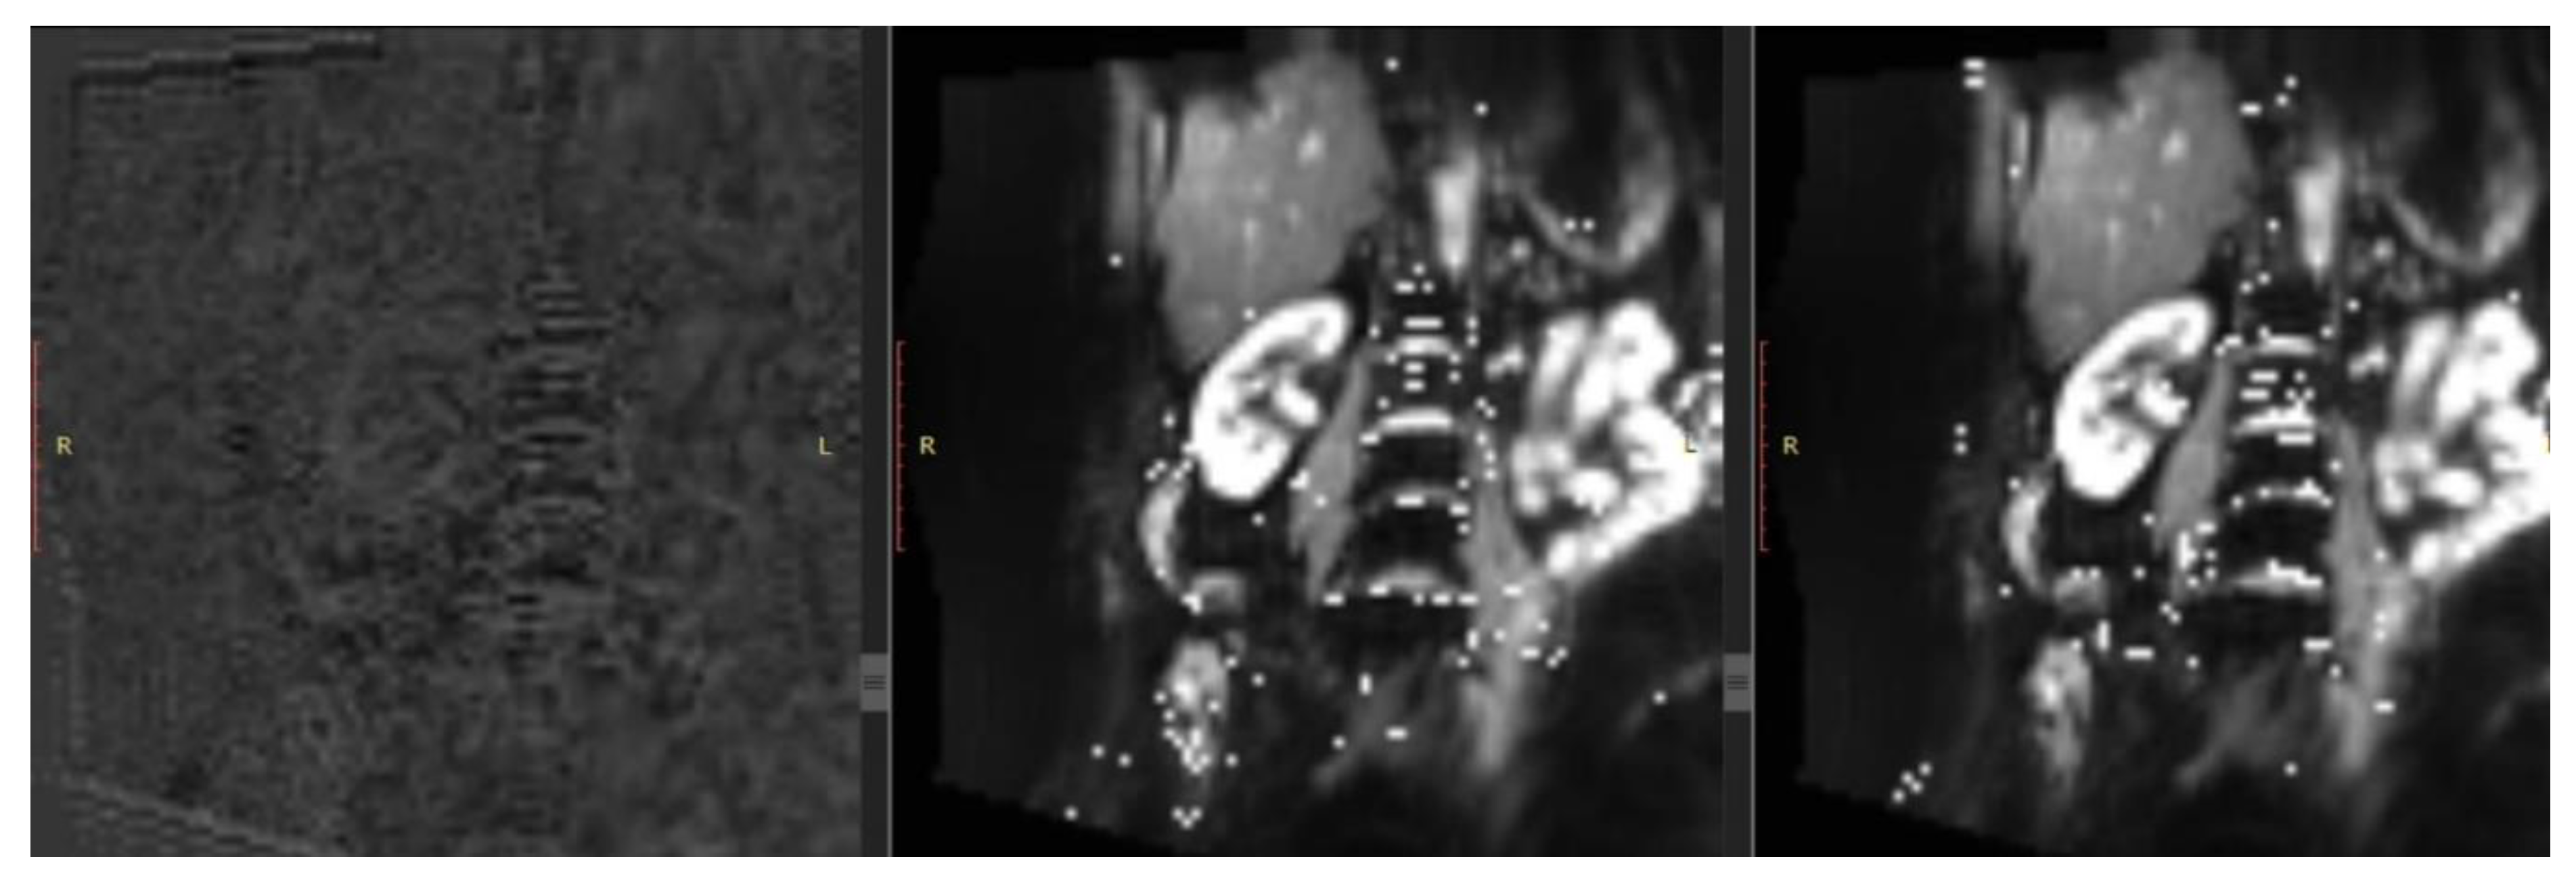
Rys 5.
Example of RBF estimation in ASL.
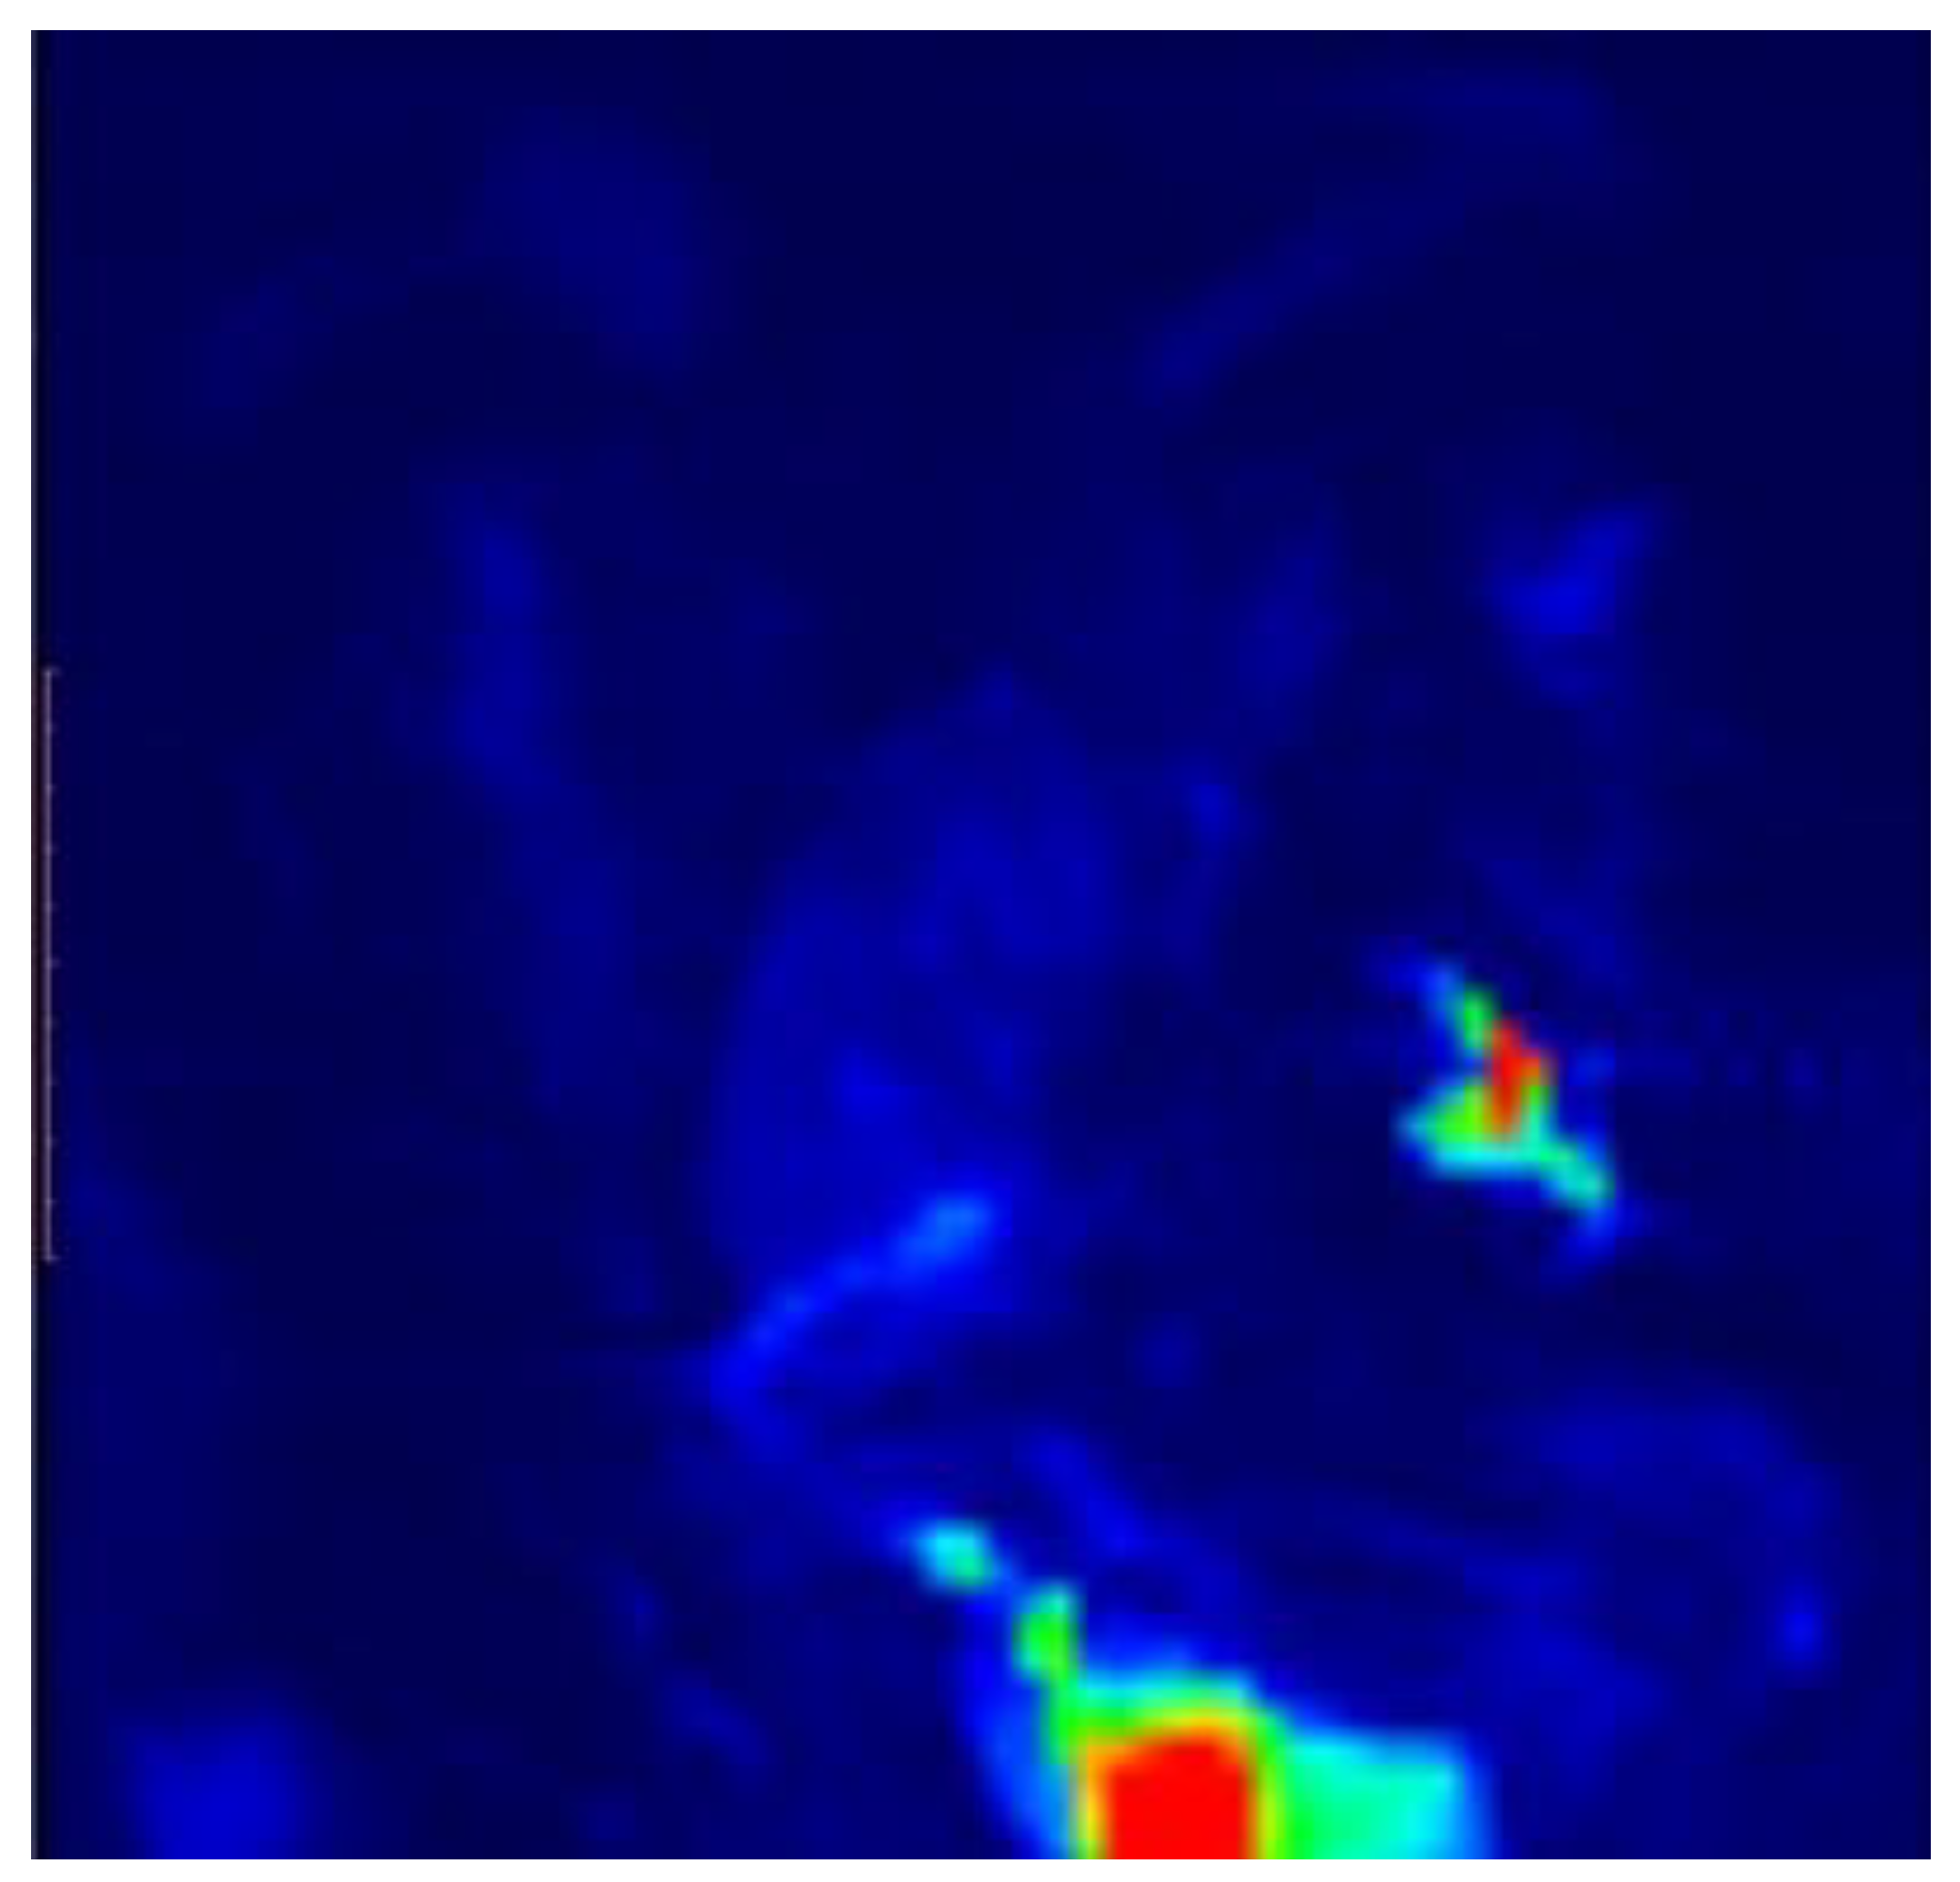

Table 1.
The value of MRI sequence type in monitoring kidney function.
| T1 | T2 | DWI | PC-MRI | BOLD | ASL | ||
| CKD | + | + | + | + | + | + | |
| Kidney transplant | + | + | + | - | + | + | |
| CKD in policystic kidney disease | - | + | + | + | - | - | |
| Renal artery stenosis | Monitoring | + | + | + | + | + | + |
| Qualification to revascularisation | - | - | - | - | + | + | |
Table 2.
Applications of MRI sequences.
| MRI sequence | Possible application |
| T1 | Assessing renal structure, fibrosis, oedema, corelation with GFR |
| T2 | Assessing renal structure, oedema, hypoxia, corelation with GFR |
| DWI | Estimation of fibrosis and oedema, corelation with GFR |
| PC-Contrast | Estimation of RBF, corelation with GFR |
| BOLD | Detection of oxygenation, estimation of RBF |
| ASL | Tissue perfusion, estimation of RBF, corelation with GFR |
Disclaimer/Publisher’s Note: The statements, opinions and data contained in all publications are solely those of the individual author(s) and contributor(s) and not of MDPI and/or the editor(s). MDPI and/or the editor(s) disclaim responsibility for any injury to people or property resulting from any ideas, methods, instructions or products referred to in the content. |
© 2025 by the authors. Licensee MDPI, Basel, Switzerland. This article is an open access article distributed under the terms and conditions of the Creative Commons Attribution (CC BY) license (http://creativecommons.org/licenses/by/4.0/).
Copyright: This open access article is published under a Creative Commons CC BY 4.0 license, which permit the free download, distribution, and reuse, provided that the author and preprint are cited in any reuse.


