Submitted:
30 June 2025
Posted:
01 July 2025
You are already at the latest version
Abstract
Breast cancer remains a leading cause of cancer mortality worldwide, underscoring the urgent need for novel and effective therapeutic strategies. Eph receptor tyrosine kinases, particularly EphB4, exhibit diverse roles in cancer biology, acting as either tumor promoters or suppressors depending on the cellular environment and ligand engagement. EphB4 is frequently overexpressed in breast cancer and contributes to dysregulated signaling and tumor progression through the abnormal interaction with its ligand Ephrin-B2. We herein developed an improved anti-EphB4 monoclonal antibody, Eb4Mab-7-mG2a, which can be characterized as a subclass-switched IgG2a variant designed to enhance immune effector function, specifically antibody-dependent cellular cytotoxicity (ADCC) and complement-dependent cytotoxicity (CDC). Our findings showed that Eb4Mab-7-mG2a effectively blocked Ephrin-B2-induced ERK phosphorylation and proliferation in EphB4-positive MCF-7 breast cancer cells but had no effect on EphB4-knockout (KO) MCF-7 cells. Flow cytometry confirmed high-affinity binding between Eb4Mab-7-mG2a and EphB4-expressing cells, whereas in vitro assays demonstrated potent and selective ADCC and CDC activities against EphB4-positive tumor cells. In vivo experiments showed that Eb4Mab-7-mG2a significantly suppressed tumor growth in xenograft models bearing EphB4-overexpressing CHO-K1 and EphB4-positive MCF-7 tumors but showed no therapeutic effect in EphB4-negative CHO-K1 or EphB4-KO tumors. Immunohistochemical analysis revealed reduced Ki-67 proliferation indices in treated tumors, supporting the antiproliferative effects of the developed antibody. Overall, these findings demonstrate that Eb4Mab-7-mG2a exerts dual-action antitumor activity through ligand blockade and immune effector engagement. Further evaluations in other EphB4-overexpressing cancers and in combination with immune checkpoint inhibitors are warranted. Humanization and tumor-selective engineering may enhance its clinical potential for precision oncology.
Keywords:
antibody-dependent cellular cytotoxicity
; complement-dependent cytotoxicity
; EphB4
; breast cancer
; ligand blockage
1. Introduction
Breast cancer remains one of the most common and lethal malignancies affecting women worldwide, accounting for 11.7% of all cancer cases and 6.9% of cancer-related deaths globally in 2020 [1]. Despite improvements in early detection and systemic therapies, breast cancer continues to be the second leading cause of cancer-related death among women [2], highlighting the urgent need for novel and more effective therapeutic strategies.
Eph receptor tyrosine kinases, which can be divided into EphA and EphB subclasses based on their ligand binding specificities, represent the largest family of receptor tyrosine kinases [3,4]. EphB receptors, including EphB4, initiate downstream signaling by interacting with transmembrane Ephrin-B ligands. Among the EphB receptors, EphB4 has gained significant interest owing to its context-dependent roles in cancer biology, specifically its ability to act as either a tumor promoter or suppressor depending on the cellular environment and ligand availability [5].
EphB4 is frequently overexpressed in breast cancer and causes aberrant downstream signaling through its often dysregulated interaction with Ephrin-B2 [6]. This dysregulation may be attributed to not only altered ligand availability but also changes in receptor localization or clustering, collectively enhancing ligand-dependent signaling through autocrine or paracrine mechanisms [5,7]. Notably, Xiao et al. demonstrated that stimulating EphB4 with Ephrin-B2 or an agonistic monoclonal antibody in MCF-7 breast cancer cells activates the Ras/MEK/ERK signaling cascade, triggering enhanced cell proliferation [8]. In contrast, the same EphB4 activation in endothelial cells suppressed ERK activity and inhibited proliferation, illustrating the striking context-dependent function of EphB4 [9]. These mechanistic insights highlight the biological complexity of EphB4 and its significance as a context-specific therapeutic target. Altogether, these findings suggest that aberrant ligand-mediated EphB4 signaling, sustained even under partial ligand dysregulation, may drive malignant phenotypes via ERK pathway activation. Despite its context-dependent dual functionality, EphB4 can serve as a potential oncogenic driver in this setting.
Given the oncogenic potential of ligand-induced EphB4 signaling in breast cancer cells, blocking this pathway represents a promising therapeutic approach. In our previous work, we developed a monoclonal antibody, B4Mab-7 (IgG1 subclass), that targets EphB4 [10]. In the present study, we engineered an improved version of this antibody, Eb4Mab-7-mG2a, which can be characterized as a subclass-switched IgG2a variant, in hopes of enhancing immune effector functions, such as antibody-dependent cellular cytotoxicity (ADCC) and complement-dependent cytotoxicity (CDC). This antibody exhibits dual functionality by simultaneously blocking ligand-induced ERK signaling and activating immune effector mechanisms. Although several therapeutic antibodies function through either signaling modulation or immune-mediated cytotoxicity, studies have suggested that combining both mechanisms in a single antibody can enhance antitumor efficacy [11,12].
As such, the current study aimed to evaluate the utility of Eb4Mab-7-mG2a as a novel bifunctional therapeutic candidate for EphB4-positive breast cancer by characterizing its mechanism of action and demonstrating its antitumor efficacy both in vitro and in vivo.
2. Materials and Methods
2.1. Kaplan–Meier Survival Analysis
Kaplan–Meier survival analysis was performed for all members of the EPHB gene families using the KMplot online tool (https://kmplot.com/analysis/), applying RNA-seq-based expression data from breast cancer samples. Overall survival (OS) was selected as the endpoint, with a follow-up threshold set at 120 months and censoring applied for data after such timepoint. Patients were divided into high and low expression groups using an automatically selected cutoff chosen from within the interquartile range to best separate survival outcomes. All other clinical and immune-related covariates were left unrestricted. Summary results, which include cutoff values, expression ranges, log-rank P values, and false discovery rates (FDR), are presented in Table S1.
2.2. Cell lines and cell culture
Chinese hamster ovary (CHO)-K1, MCF-7, BT-474, SK-BR-3, MDA-MB-468, and MCF10A cell lines were obtained from the American Type Culture Collection (ATCC, Manassas, VA, United States). The HBC5 cell line was provided by the JCRB Cell Bank (Osaka, Japan). CHO/EphB4 and EphB4-KO MCF-7 (BINDS-52) cell lines were created in our previous study.[10] CHO-K1, HBC5, and CHO/EphB4 cells were cultured in RPMI-1640 medium (Nacalai Tesque, Kyoto, Japan) supplemented with 10% heat-inactivated FBS (Thermo Fisher Scientific, Waltham, MA, USA), 100 U/mL penicillin, 100 µg/mL streptomycin, and 0.25 µg/mL amphotericin B (Nacalai Tesque). MCF-7, BT-474, SK-BR-3, MDA-MB-468, and EphB4-KO MCF-7 cells were cultured in DMEM (Nacalai Tesque) supplemented with 10% heat-inactivated FBS and the same antibiotics enumerated earlier. MCF10A cells were maintained in Mammary Epithelial Cell Growth Medium (Lonza, Walkersville, MD, USA) supplemented with growth supplements according to the manufacturer’s instructions. All cells were incubated at 37°C in a humidified atmosphere containing 5% CO₂.
2.3. Recombinant Antibody Production
Anti-EphB4 monoclonal antibody (B4Mab-7, IgG1, kappa) was developed as previously described [10]. To produce recombinant antibodies of the mouse IgG1 and IgG2a subclasses, VH and VL cDNA were isolated from hybridomas producing B4Mab-7. VH cDNAs were combined with the CH of mouse IgG1 or IgG2a and inserted into the pCAG-Ble vector (FUJIFILM Wako Pure Chemical Corporation, Osaka, Japan). Similarly, VL cDNA and mouse kappa light chain were inserted into the pCAG-Neo vector (FUJIFILM Wako Pure Chemical Corporation). These vectors were then introduced into ExpiCHO or BINDS-09 cells using the ExpiCHO Expression System (Thermo Fisher Scientific, Inc) [13], after which the culture supernatants were harvested. B4Mab-7 and Eb4Mab-7-mG2a antibodies were purified using Ab-Capcher (ProteNova Co., Ltd., Kagawa, Japan).
2.4. Western Blot Analysis
Western blot analysis was performed as described previously [14]. Cells were lysed using a buffer containing 20 mmol/L HEPES (pH 7.5), 150 mmol/L NaCl, 1% (v/v) Triton X-100, 10% (v/v) glycerol, 1 mmol/L EDTA, 50 mmol/L NaF, 50 mmol/L β-glycerophosphate, 1 mmol/L sodium orthovanadate (Na₃VO₄), and 25 μg/mL each of antipain, leupeptin, and pepstatin. For ERK phosphorylation analysis, MCF-7 and EphB4-KO MCF-7 cells were serum-starved for 12 h and then stimulated in 1% dialyzed FBS-containing medium with 5 µg/mL of recombinant human Ephrin-B2 (R&D Systems, Minneapolis, MN, United States) for 0, 5, 10, 15, 30, or 60 min. Cells were co-treated with 5 µg/mL Eb4Mab-7-mG2a or the control PMab-231 for the indicated durations at 37°C. PMab-231 is a mouse IgG2a version of the anti-tiger podoplanin (PDPN) monoclonal antibody PMab-231 that does not cross-react with human cells and has been previously reported as a control antibody [15]. Protein samples were separated by SDS-PAGE, transferred to PVDF membranes, and immunoblotted with the primary antibodies listed later. Aside from cell lysates, a commercially available normal human breast tissue lysate (Total Protein–Human Adult Normal Tissue: Breast, Novus Biologicals, Littleton, CO, United States) was used to assess expression in normal breast tissue. Antibody binding was detected using appropriate horseradish peroxidase (HRP)-conjugated secondary antibodies (Cell Signaling Technology, Danvers, MA, United States), followed by ECL detection (ECL Prime; Cytiva, Tokyo, Japan). The primary antibodies used were as follows: anti-phospho-ERK1/2 (Thr202/Tyr204; #4370, Cell Signaling Technology), anti-total ERK1/2 (clone C-9; sc-514302, Santa Cruz Biotechnology, Dallas, TX, United States), anti-EphB4 (Eb4Mab-7-mG2a), anti-β-actin (D6A8) Rabbit mAb (HRP Conjugate; #12620, Cell Signaling Technology), and anti-GAPDH (D16H11) XP® Rabbit mAb (#5174, Cell Signaling Technology). Band intensities were quantified using ImageJ software.
2.5. Proliferation Assay In Vitro
Cell proliferation was evaluated using the MTS tetrazolium assay (CellTiter 96 Aqueous One Solution Cell Proliferation Assay; Promega, Madison, WI, United States). Cells were plated into 96-well plates at 2,000 cells per well in 100 μL of medium containing test agents such as antibodies or recombinant Ephrin-B2. At the indicated time points (typically 0 to 3 days), 20 μL of MTS reagent was added directly to each well (final volume 120 μL) and incubated for 30 min at 37°C. Absorbance was measured at 490 nm with a reference wavelength of 630 nm using a PowerScan HT microplate reader (BioTek Instruments, Winooski, VT, United States). Triplicate wells were analyzed for each condition, with the results being expressed as mean ± standard deviation (SD). Statistical significance was determined using the Mann–Whitney U test. *P < 0.05; **P < 0.01; n.s., not significant.
2.6. Flow Cytometry
The CHO-K1, CHO/EphB4, MCF-7, and EphB4-KO MCF-7 cell lines were harvested using 1 mM ethylenediaminetetraacetic acid (EDTA; Nacalai Tesque, Inc.) combined with 0.25% trypsin. Cells were incubated with B4Mab-7, Eb4Mab-7-mG2a, or a control blocking buffer (0.1% BSA in PBS) for 30 min at 4°C, followed by Alexa Fluor 488-conjugated anti-mouse IgG (1:2,000; Cell Signaling Technology, Inc.) for an additional 30 min. Fluorescence data were acquired using the SA3800 Cell Analyzer (Sony Corp., Tokyo, Japan) and analyzed using SA3800 software version 2.05 (Sony Corp.).
2.7. Determination of the Dissociation Constant (KD) via Flow Cytometry
To determine the KD, CHO/EphB4 and MCF-7 cells were resuspended in 100 μL of Eb4Mab-7-mG2a at concentrations ranging from 0.001 to 20 μg/mL in a 1/2-fold serial dilution in the blocking buffer and incubated for 30 min. After washing twice with 0.1% BSA in PBS, 50 μL of Alexa Fluor 488-conjugated anti-mouse IgG (1:200; Cell Signaling Technology, Inc.) was added, followed by a 30-min incubation. Following the incubation, the cells were washed twice and plated into a 96-well plate for measurement. Fluorescence data were acquired using the SA3800 Cell Analyzer and processed using FlowJo software. The KD was determined by fitting the binding isotherms to a one-site binding model using GraphPad PRISM 6 (GraphPad Software, Inc., La Jolla, CA, United States).
2.8. ADCC
The ADCC assay was performed following previously published methods [16]. Briefly, 12 female BALB/c nude mice (5 weeks old) were purchased from Jackson Laboratories, Inc. (Kanagawa, Japan). After removing the spleens, single-cell suspensions were prepared by passing the spleen tissue through a sterile cell strainer (catalog number 352360; BD Falcon). To eliminate erythrocytes, the splenocytes were lysed with ice-cold distilled water for 30 s, followed by immediate neutralization with isotonic buffer. The remaining splenocytes were then resuspended in DMEM supplemented with 10% FBS, forming the effector cell preparation. Target cells (CHO/EphB4, CHO-K1, MCF-7, or EphB4-KO MCF-7 [BINDS-5]) were labeled with 10 μg/mL calcein AM (Thermo Fisher Scientific, Inc.) and resuspended in the same medium. Target cells (1 × 10⁴ per well) were plated into 96-well plates, combined with effector cells at a ratio of 50:1, and treated with 100 μg/mL of Eb4Mab-7-mG2a or control PMab-231. After incubation at 37°C for 4.5 h, the amount of calcein released into the supernatant was measured. Fluorescence intensity was detected using a microplate reader (PowerScan HT; BioTek Instruments, Inc., Winooski, VT, United States) with excitation and emission wavelengths of 485 and 538 nm, respectively. The percentage of lysis was calculated using the following formula: fluorescence from target-effector cultures−spontaneous fluorescence of the target cells alone / maximum fluorescence after complete lysis−spontaneous fluorescence × 100. Complete cell lysis was achieved using a buffer containing 0.5% Triton X-100, 10 mM Tris-HCl (pH 7.4), and 10 mM EDTA. All experiments were conducted in triplicate.
2.9. CDC
The CDC assay was performed following established procedures [16]. Briefly, the cells were labeled with 10 μg/mL calcein AM, suspended in the medium, and plated into 96-well plates at 1 × 10⁴ cells per well. Rabbit complement (final dilution 1:10; Low-Tox-M Rabbit Complement; Cedarlane Laboratories, Hornby, ON, Canada) and 100 μg/mL of Eb4Mab-7-mG2a or control PMab-231 were added to the wells. After 4.5 h of incubation at 37°C, calcein released into the supernatant was measured, and fluorescence intensity was calculated as described in the ADCC section.
2.10. Antitumor Activity In Vivo
All procedures involving animals were conducted in accordance with institutional guidelines and received approval from the Animal Ethics Committee of the Institute of Microbial Chemistry (Numazu, Japan; approval numbers 2024-001 and 2024-002). Female BALB/c nude mice (5 weeks old) were obtained from The Jackson Laboratory and maintained under pathogen-free conditions. Subcutaneous xenografts were created by injecting 5 × 10⁶ CHO/EphB4, CHO-K1, MCF-7, or EphB4-KO MCF-7 cells mixed with Matrigel (BD Biosciences) into the left flank of each mouse. Antibodies (Eb4Mab-7-mG2a or control PMab-231) were then delivered intraperitoneally at a dosage of 100 µg per mouse on days 7, 14, and 21 following cell inoculation. Thereafter, tumor volumes were measured twice a week using calipers and calculated by multiplying the square of the shorter diameter by the longer diameter and dividing the result by two.
2.11. Immunohistochemical analysis
Immunohistochemical analysis of mouse xenograft tumor tissues was performed as previously described.[14] Briefly, paraffin-embedded tissue sections were cut and mounted on microscope slides. After deparaffinization with xylene and rehydration through a graded ethanol series, endogenous peroxidase activity was blocked with methanol containing hydrogen peroxide. Antigen retrieval was performed by boiling the sections in 0.01 M sodium citrate buffer (pH 6.0) for 10 min. The sections were then incubated for 60 min at room temperature with an anti-Ki-67 antibody (1:200 dilution; clone SP6, ab16667, Abcam, Cambridge, United Kingdom). Immunoreactivity was visualized using 3,3′-diaminobenzidine with the ChemMate EnVision kit (Dako, Carpinteria, CA), followed by counterstaining with hematoxylin. Stained sections were examined under a Nikon Biophot microscope (Nikon, Tokyo, Japan), and images were captured with an ECLIPSE TE2000-U microscope (Nikon). Ki-67-positive cells were quantified using e-Path image analysis software (e-Path Co., Tokyo, Japan).
2.12. Statistical Analysis
All experiments were conducted in triplicate, with data being expressed as the mean ± SD. In most figures, error bars indicate mean ± SD. In some figures, SD is shown in the positive direction only, as noted in their corresponding legends. Statistical analyses were performed using either two-way ANOVA followed by Tukey’s or Sidak’s multiple comparison tests or the non-parametric Mann–Whitney U test, as appropriate. All analyses were conducted using GraphPad PRISM 10 software (GraphPad Software, Inc., La Jolla, CA, United States).
3. Results
3.1. Development of a Class-Switched Anti-EphB4 Monoclonal Antibody and Analysis of EphB4 Expression Across Breast Cancer Subtypes
To determine the clinical relevance of EphB4 expression in breast cancer, Kaplan–Meier survival analysis was first performed using RNA-seq-based datasets from KMplot. Among the EphB family members, high EphB4 expression was significantly associated with poor OS among breast cancer patients (Figure 1A), suggesting the potential oncogenic role of EphB4.
The mouse IgG1 monoclonal antibody B4Mab-7, previously developed by our group, specifically recognizes EphB4-expressing tumor cells.[10] To enhance its effector functions, such as ADCC and CDC, B4Mab-7 was class-switched into mouse IgG2a format, resulting in the generation of Eb4Mab-7-mG2a (Figure 1B). To examine EphB4 protein expression across cell models, Western blot analysis was performed using lysates from CHO-K1, CHO/EphB4, MCF-7, and EphB4-KO MCF-7 cells. Notably, we found that Eb4Mab-7-mG2a triggered an increase in the expression of EphB4 in CHO/EphB4 and MCF-7 cells but not in CHO-K1 and EphB4-KO MCF-7 cells (Figure 1C). Furthermore, EphB4 was expressed in multiple breast cancer cell lines representing different subtypes, including BT-474 (luminal B), SK-BR-3 (HER2+), MDA-MB-468 (basal-like), and HBC5 (triple-negative). However, EphB4 was barely undetectable in MCF10A, a non-tumorigenic mammary epithelial cell line, and in lysates of normal human breast tissue. Altogether, these findings indicate that EphB4 is frequently overexpressed across diverse breast cancer subtypes relative to normal breast tissue.
3.2. Effect of Eb4Mab-7-mG2a on Ephrin-B2-Induced Cell Proliferation and ERK Signaling
Given that EphB4 is frequently overexpressed in breast cancer and associated with poor prognosis, we sought to determine whether EphB4 contributes functionally to tumor cell behavior upon ligand engagement. To this end, we examined the effects of Ephrin-B2, a known ligand of EphB4, on cell proliferation. Intriguingly, Ephrin-B2 stimulation promoted the proliferation of MCF-7 cells but not EphB4-negative MCF10A cells, indicating ligand-dependent proliferative signaling mediated by EphB4 (Figure 2A). However, co-treatment with Eb4Mab-7-mG2a significantly suppressed Ephrin-B2-induced proliferation in MCF-7 but not in MCF10A cells (Figure 2B). Furthermore, Ephrin-B2 stimulation promoted time-dependent ERK1/2 phosphorylation in MCF-7 cells, which was diminished by co-treatment with Eb4Mab-7-mG2a but not with control PMab-231 (Figure 2C). No such signaling was observed in EphB4-KO MCF-7 cells, confirming that EphB4 specifically activated the ERK pathway. These results suggest that Eb4Mab-7-mG2a inhibits Ephrin-B2-induced ERK signaling associated with proliferation in EphB4-expressing breast cancer cells.
In contrast, treatment with Eb4Mab-7-mG2a alone did not alter cell proliferation in MCF-7, HBC5, or MCF10A cells across a 3-day culture period, suggesting minimal basal agonistic or toxic activity (Figure S1). Notably, although EphB4 displayed a relatively high endogenous expression in HBC5 cells, which represents a triple-negative breast cancer subtype, no growth-inhibitory effect was observed in the absence of Ephrin-B2 stimulation, further supporting the specificity and ligand-dependency of the antibody’s action.
3.3. Binding Activity of Eb4Mab-7-mG2a and B4Mab-7 Against EphB4-Expressing and Control Cells
As shown in Figure 3, both Eb4Mab-7-mG2a and its parental antibody B4Mab-7 exhibited dose-dependent binding to CHO/EphB4 and MCF-7 cells, as assessed by flow cytometry using increasing antibody concentrations (0.01–10 µg/mL). In contrast, neither antibody showed detectable binding to EphB4-negative CHO-K1 or EphB4-knockout MCF-7 cells. These results confirm the high specificity of both antibodies for human EphB4 and demonstrate that class switching to IgG2a preserves target recognition.
3.4. Binding Affinity of Eb4Mab-7-mG2a for EphB4-Expressing Cells
Flow cytometry was used to performe a kinetic analysis of Eb4Mab-7-mG2a binding to EphB4-expressing cells. As shown in Figures 4A and B, the KD of Eb4Mab-7-mG2a was 5.4 × 10⁻⁹ M for CHO/EphB4 cells and 8.5 × 10⁻¹⁰ M for MCF-7 cells, which endogenously express EphB4. These results indicate that Eb4Mab-7-mG2a exhibits high binding affinity for both overexpressed and endogenous EphB4.
The affinity of Eb4Mab-7-mG2a for MCF-7 cells was approximately 6.4-fold higher than that for CHO/EphB4 cells, which may reflect differences in the density, glycosylation status, or the membrane environment of EphB4 between the two cell lines. Overall, these results highlight the suitability of Eb4Mab-7-mG2a for targeting EphB4-positive tumors given its high binding affinity with the same.
3.5. Evaluating the ADCC and CDC Activities of Eb4Mab-7-mG2a
Eb4Mab-7-mG2a exhibited significant ADCC activity against EphB4-expressing CHO/EphB4 and MCF-7 cells compared to the control PMab-231 but demonstrated no ADCC activity against EphB4-negative CHO-K1 or EphB4-KO MCF-7 cells (Figure 4C). Similarly, CDC activity was observed in CHO/EphB4 and MCF-7 cells but not in CHO-K1 or EphB4-KO MCF-7 (BINDS-52) cells (Figure 4D). Overall, these results indicate that Eb4Mab-7-mG2a selectively mediates immune effector-driven cytotoxicity against EphB4-expressing cells, highlighting its therapeutic potential for targeting EphB4-positive tumors.
3.6. Antitumor Efficacy of Eb4Mab-7-mG2a in CHO-Derived Xenograft Models
To assess the in vivo therapeutic potential of Eb4Mab-7-mG2a, xenograft experiments were subsequently performed using the previously described CHO-K1, CHO/EphB4, MCF-7, and EphB4-KO MCF-7 cells. Antibodies were administered intraperitoneally once per week (100 μg/mouse) for a total of three injections.
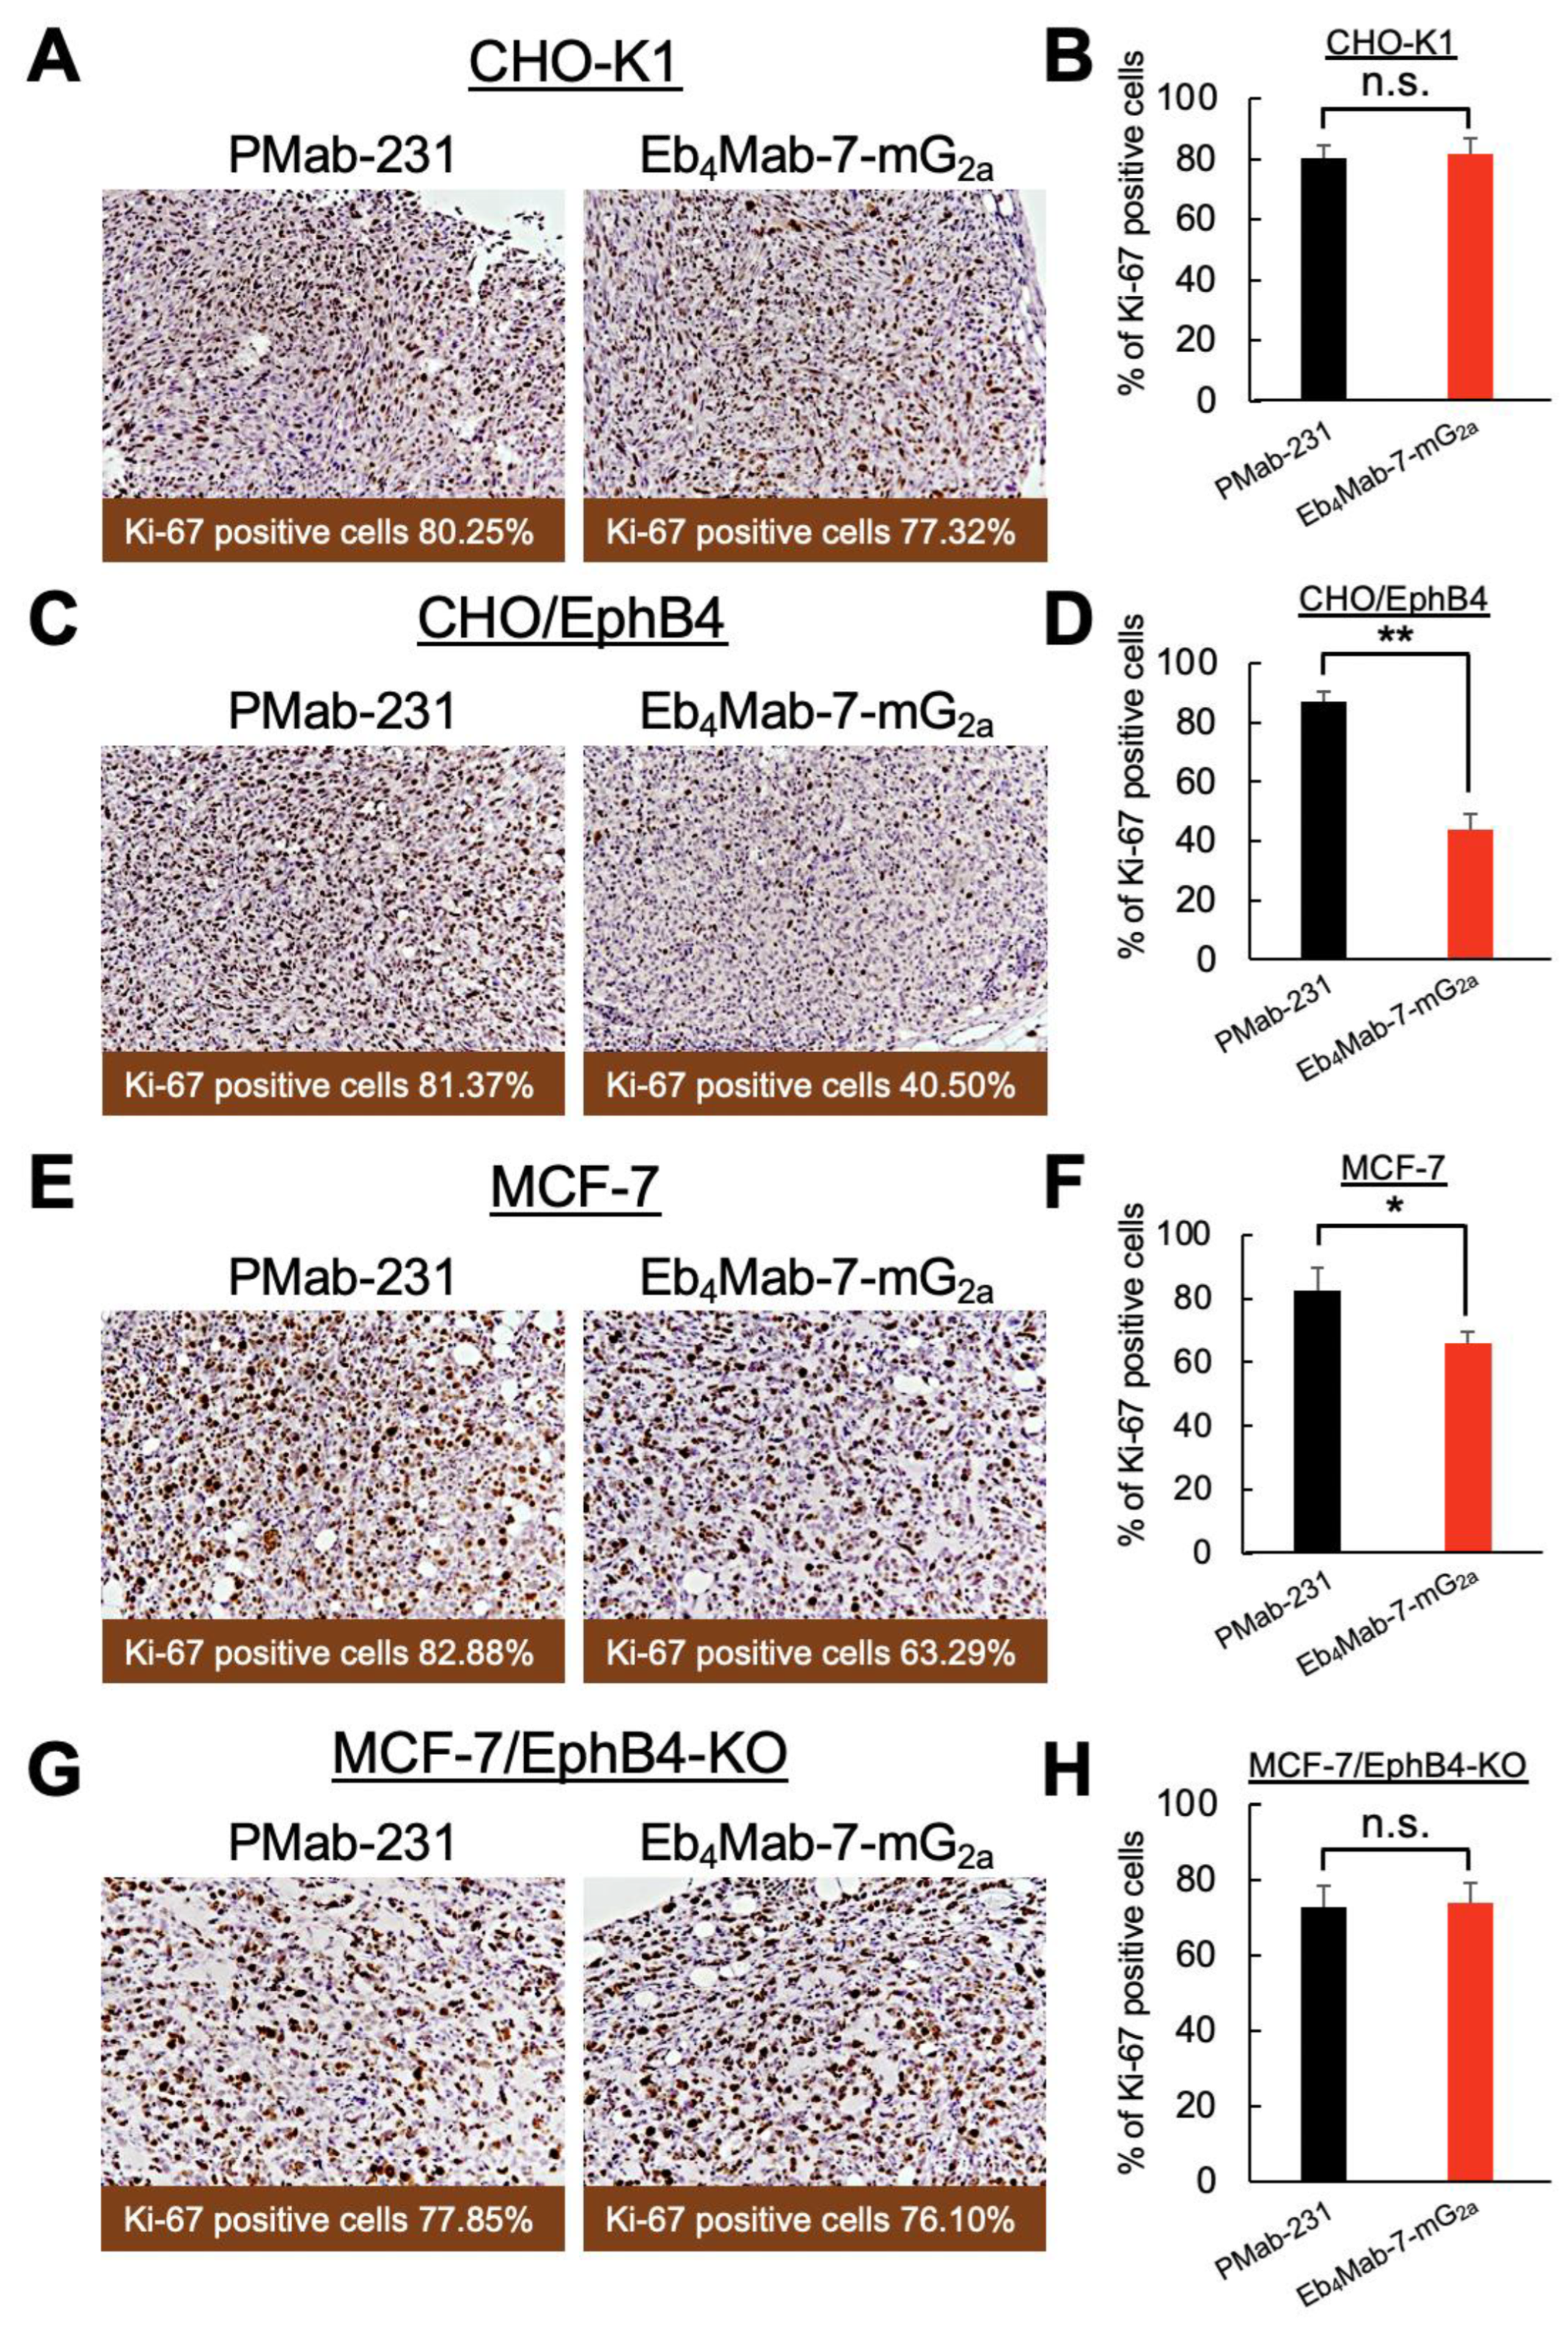
Our results for the CHO-K1 xenograft model (Figure 5A–C, Figure S2A) found no significant differences in tumor volume over time (Figure 5A), macroscopic appearance of resected tumors (Figure 5B), tumor weight upon sacrifice (Figure 5C), or body weight changes throughout the treatment period (Figure S2A, left) between mice treated with Eb4Mab-7-mG2a and those receiving control PMab-231. Representative images of mice upon sacrifice also showed no visible differences in tumor burden between groups (Figure S2A, right). Furthermore, Ki-67 immunohistochemistry of tumor sections revealed no significant difference in the proliferation index between the two treatment groups (Figure 7A,B), suggesting that Eb4Mab-7-mG2a displayed no antitumor effects against EphB4-negative cells.
In contrast, our results for the CHO/EphB4 xenograft model (Figure 5D–F, Figure S2B) found that treatment with Eb4Mab-7-mG2a significantly inhibited tumor growth compared to control PMab-231, as evidenced by reductions in the tumor volume over time (Figure 5D), size of the resected tumors (Figure 5E), and tumor weight at sacrifice (Figure 5F). No significant difference in body weight was observed between the two groups during the treatment period (Figure S2B, left), indicating that the antibody treatment was well tolerated. Representative images of the mice upon sacrifice also showed a visibly reduced tumor burden in the Eb4Mab-7-mG2a-treated group (Figure S2B, right). Ki-67 immunohistochemistry further confirmed the antitumor effects of Eb4Mab-7-mG2a, which promoted a significant reduction in the proliferation index in CHO/EphB4 tumors compared to those treated with control antibody (Figure 7C and D). Overall, these results demonstrate that Eb4Mab-7-mG2a exerts a potent antitumor effect in vivo against EphB4-overexpressing tumors by inhibiting tumor cell proliferation.
3.7. Antitumor Efficacy of Eb4Mab-7-mG2a in MCF-7-Derived Xenograft Models
We subsequently examined the therapeutic efficacy of Eb4Mab-7-mG2a in a clinically relevant model using MCF-7 breast cancer cells, which endogenously express EphB4 and EphB4-KO MCF-7 cells. The same dosing schedule, that is, intraperitoneal administration of antibody (100 μg/mouse) once per week for 3 weeks, was employed.
In the MCF-7 xenograft model (Figure 6A–C, Figure S3A), Eb4Mab-7-mG2a significantly suppressed tumor growth compared to control PMab-231, as indicated by reductions in tumor volume over time (Figure 6A), tumor size upon resection (Figure 6B), and tumor weight upon sacrifice (Figure 6C). Body weight changes did not significantly differ between the two groups (Figure S3A, left), with the representative images upon sacrifice demonstrating a visible reduction in tumor size in the Eb4Mab-7-mG2a-treated group (Figure S3A, right). Consistent with these findings, Ki-67 staining of tumor sections showed significantly decreased proliferation in the treated group compared to controls (Figure 7E and F), supporting the antiproliferative effects of the antibody in EphB4-expressing breast cancer.
In contrast, no significant antitumor effects were observed in the EphB4-KO MCF-7 xenograft model (Figure 6D–F, Figure S3B). In particular, tumor volume (Figure 6D), macroscopic appearance (Figure 6E), tumor weight (Figure 6F), and body weight (Figure S3B, left) were all comparable between the Eb4Mab-7-mG2a and control antibody groups. Additionally, no visible tumor regression was observed in mice (Figure S3B, right), with Ki-67 staining revealing no significant difference in proliferation index between groups (Figure 7G and H). These results confirm that the antitumor activity of Eb4Mab-7-mG2a is dependent on EphB4 expression in vivo.
4. Discussion
The current study demonstrated that Eb4Mab-7-mG2a, a subclass-switched anti-EphB4 monoclonal antibody, exerts potent antitumor activities against EphB4-positive breast cancer through two mechanisms, namely ligand blockade and immune effector activation. This antibody selectively inhibited Ephrin-B2-induced ERK phosphorylation and proliferation in EphB4-positive MCF-7 cells but exhibited no effect in EphB4-KO or ligand-unstimulated cells, highlighting its specificity (Figure 2). Consistent with these functional effects, flow cytometric analysis confirmed that both Eb4Mab-7-mG2a and its parental IgG1 antibody B4Mab-7 selectively bound to EphB4-expressing CHO/EphB4 and MCF-7 cells in a dose-dependent manner, but not to EphB4-negative CHO-K1 or EphB4-knockout MCF-7 cells, supporting the specificity of antigen recognition (Figure 3). Moreover, subclass switching to IgG2a enhanced ADCC and CDC activity against EphB4-positive tumor cells in vitro, with no cytotoxicity observed in EphB4-negative and EphB4-KO controls (Figure 2 and 4).
Xenograft models were used to confirm the in vivo efficacy of Eb4Mab-7-mG2a. Notably, our findings showed that it significantly suppressed tumor growth and reduced Ki-67 positivity in EphB4-expressing tumors, without affecting EphB4-negative or EphB4-KO tumors (Figures 5, 6, and 7). These results indicate that EphB4 expression is required for both the direct and immune-mediated antitumor effects of the antibody, and suggest that the treatment selectively targets EphB4-positive tumors without observable adverse effects in vivo.
Clinical studies targeting the EphB4–Ephrin-B2 axis in combination with immune checkpoint inhibitors have shown promising results. In particular, soluble EphB4-human serum albumin (HAS) combined with pembrolizumab yielded response rates of 45% and 52% in HPV-negative head and neck squamous cell carcinoma and Ephrin-B2-positive urothelial carcinoma, respectively [17,18]. In contrast, one study found that monotherapy with EphB4 blockade had no significant impact on metastatic castration-resistant prostate cancer [19], highlighting the importance of tumor context and therapeutic design. Unlike soluble receptor traps, Eb4Mab-7-mG2a offers dual-action through both ligand blockade (Figure 2) and immune engagement (Figure 4), which may enable single-agent efficacy or synergize with existing immunotherapies.
Future studies should therefore explore the therapeutic potential of Eb4Mab-7-mG2a in other EphB4-overexpressing malignancies, including those in which EphB4 plays a functional role in tumor progression and/or immune modulation. Given the observed context-dependence of EphB4 signaling, careful selection of cancer types and companion biomarkers, such as Ephrin-B2 expression or downstream ERK activity, will be crucial for identifying responsive tumors. Apart from its potential as a monotherapy, Eb4Mab-7-mG2a may be particularly effective in combination with immune checkpoint inhibitors based on clinical studies showing synergy between EphB4 blockade and pembrolizumab across multiple tumor types [17,18]. Comprehensive in vivo validation of combination regimens, together with detailed immune microenvironment profiling, will certainly support the design and development of evidence-based therapies.
To facilitate clinical translation, further optimization of Eb4Mab-7-mG2a is warranted. Humanization of the antibody backbone will be essential in reducing immunogenicity and enhancing pharmacokinetic properties in humans. Moreover, given that the current version is not cancer-specific, reengineering Eb4Mab-7-mG2a into cancer-specific monoclonal antibody (CasMab) format may improve tumor selectivity and safety, especially by minimizing on-target off-tumor effects as demonstrated with anti-PDPN CasMabs [20,21]. Additionally, the antigen recognition domain of Eb4Mab-7-mG2a could be incorporated into chimeric antigen receptor (CAR)-T cells to expand its utility to cell-based immunotherapy. This modular strategy may be particularly valuable in solid tumors wherein tumor-specific antigens are limited and off-tumor toxicity remains a major concern [22]. Together, these findings suggest the need for continued development of Eb4Mab-7-mG2a across multiple modalities given its versatility and potential for precision oncology.
Supplementary Materials
The following supporting information can be downloaded at the website of this paper posted on Preprints.org. Table S1: Kaplan-Meier survival analysis summary for EphB family genes in breast cancer. Figure S1: Eb4Mab-7-mG2a alone does not affect cell proliferation.; Figure S2: Supplementary data for Figure 5.; Figure S3: Supplementary data for Figure 6.
Author Contributions
Tomokazu Ohishi contributed to writing the original draft, investigation, methodology, and funding acquisition. Hiroyuki Suzuki, Mika K. Kaneko, and Tomohiro Tanaka were involved in investigation, conceptualization, and data curation; Tanaka also contributed to funding acquisition. Akiko Harakawa contributed to investigation and data curation. Junjiro Yoshida and Daisuke Tatsuda were responsible for validation and visualization. Yukinari Kato was involved in conceptualization, funding acquisition, project administration, resources, and writing—review and editing. Manabu Kawada supervised the project.
Funding
This research was supported in part by the Japan Agency for Medical Research and Development (AMED) under grant numbers JP24am0521010, JP24ama121008, JP24ama221339, JP24bm1123027, and JP24ck0106730 (to Y.K.), and by the Japan Society for the Promotion of Science (JSPS) Grants-in-Aid for Scientific Research (KAKENHI) under grant numbers 22K06783 (to T.O.), 24K18268 (to T.T.), and 25K10553 (to Y.K.).
Institutional Review Board Statement
Animal experiments were conducted in accordance with institutional guidelines and were approved by the Institutional Committee for Experiments of the Institute of Microbial Chemistry (approval no. 2024-071).
Informed Consent Statement
Not applicable.
Data Availability Statement
The data presented in this study are available in the article and supplementary material.
Acknowledgments
The authors thank Shun-ichi Ohba, Kyohei Kurosawa, Hiroyuki Inoue, Hayamitsu Adachi, Isao Momose, Yoko Yamazaki, Shuichi Sakamoto, Takefumi Onodera, and Nana Hashimoto (Institute of Microbial Chemistry [BIKAKEN], Numazu, Microbial Chemistry Research Foundation) for their technical assistance and valuable experimental advice.
Conflicts of Interest
The authors have no conflicts of interest to declare.
References
- Sung, H.; Ferlay, J.; Siegel, R.L.; et al. Global Cancer Statistics 2020: GLOBOCAN Estimates of Incidence and Mortality Worldwide for 36 Cancers in 185 Countries. CA Cancer J Clin 2021, 71, 209–249. [Google Scholar] [CrossRef] [PubMed]
- Siegel, R.L.; Miller, K.D.; Fuchs, H.E.; Jemal, A. Cancer statistics, 2022. CA Cancer J Clin 2022, 72, 7–33. [Google Scholar] [CrossRef]
- Pasquale, E.B. Eph receptor signalling casts a wide net on cell behaviour. Nat Rev Mol Cell Biol 2005, 6, 462–475. [Google Scholar] [CrossRef]
- Pasquale, E.B. Eph-ephrin bidirectional signaling in physiology and disease. Cell 2008, 133, 38–52. [Google Scholar] [CrossRef] [PubMed]
- Pasquale, E.B. Eph receptors and ephrins in cancer: bidirectional signalling and beyond. Nat Rev Cancer 2010, 10, 165–180. [Google Scholar] [CrossRef]
- Noren, N.K.; Foos, G.; Hauser, C.A.; Pasquale, E.B. The EphB4 receptor suppresses breast cancer cell tumorigenicity through an Abl-Crk pathway. Nat Cell Biol 2006, 8, 815–825. [Google Scholar] [CrossRef]
- Barquilla, A.; Pasquale, E.B. Eph receptors and ephrins: therapeutic opportunities. Annu Rev Pharmacol Toxicol 2015, 55, 465–487. [Google Scholar] [CrossRef]
- Xiao, Z.; Carrasco, R.; Kinneer, K.; et al. EphB4 promotes or suppresses Ras/MEK/ERK pathway in a context-dependent manner: Implications for EphB4 as a cancer target. Cancer Biol Ther 2012, 13, 630–637. [Google Scholar] [CrossRef] [PubMed]
- Martiny-Baron, G.; Korff, T.; Schaffner, F.; et al. Inhibition of tumor growth and angiogenesis by soluble EphB4. Neoplasia 2004, 6, 248–257. [Google Scholar] [CrossRef]
- Nanamiya, R.; Suzuki, H.; Kaneko, M.K.; Kato, Y. Development of an Anti-EphB4 Monoclonal Antibody for Multiple Applications Against Breast Cancers. Monoclon Antib Immunodiagn Immunother 2023, 42, 166–177. [Google Scholar] [CrossRef]
- Manso, T.; Kushwaha, A.; Abdollahi, N.; et al. Mechanisms of action of monoclonal antibodies in oncology integrated in IMGT/mAb-DB. Front Immunol 2023, 14, 1129323. [Google Scholar] [CrossRef] [PubMed]
- Rodriguez-Nava, C.; Ortuno-Pineda, C.; Illades-Aguiar, B.; et al. Mechanisms of Action and Limitations of Monoclonal Antibodies and Single Chain Fragment Variable (scFv) in the Treatment of Cancer. Biomedicines 2023, 11. [Google Scholar] [CrossRef] [PubMed]
- Suzuki, H.; Ohishi, T.; Tanaka, T.; Kaneko, M.K.; Kato, Y. A Cancer-Specific Monoclonal Antibody against Podocalyxin Exerted Antitumor Activities in Pancreatic Cancer Xenografts. Int J Mol Sci 2023, 25. [Google Scholar] [CrossRef]
- Ohishi, T.; Masuda, T.; Abe, H.; et al. Monotherapy with a novel intervenolin derivative, AS-1934, is an effective treatment for Helicobacter pylori infection. Helicobacter 2018, 23, e12470. [Google Scholar] [CrossRef] [PubMed]
- Kaneko, M.K.; Suzuki, H.; Ohishi, T.; et al. A Cancer-Specific Monoclonal Antibody against HER2 Exerts Antitumor Activities in Human Breast Cancer Xenograft Models. Int J Mol Sci 2024, 25. [Google Scholar] [CrossRef]
- Kawada, M.; Inoue, H.; Kajikawa, M.; et al. A novel monoclonal antibody targeting coxsackie virus and adenovirus receptor inhibits tumor growth in vivo. Sci Rep 2017, 7, 40400. [Google Scholar] [CrossRef]
- Jackovich, A.; Gitlitz, B.J.; Tiu-Lim, J.W.W.; et al. Improved efficacy of pembrolizumab combined with soluble EphB4-albumin in HPV-negative EphrinB2 positive head neck squamous cell carcinoma. Oncotarget 2024, 15, 444–458. [Google Scholar] [CrossRef]
- Sadeghi, S.; Quinn, D.; Dorff, T.; et al. EphrinB2 Inhibition and Pembrolizumab in Metastatic Urothelial Carcinoma. J Clin Oncol 2023, 41, 640–650. [Google Scholar] [CrossRef]
- VanderWeele, D.J.; Kocherginsky, M.; Munir, S.; et al. A Phase II Study of sEphB4-HSA in Metastatic Castration-Resistant Prostate Cancer. Clin Genitourin Cancer 2022, 20, 575–580. [Google Scholar] [CrossRef]
- Kato, Y.; Kaneko, M.K. A cancer-specific monoclonal antibody recognizes the aberrantly glycosylated podoplanin. Sci Rep 2014, 4, 5924. [Google Scholar] [CrossRef]
- Tanaka, T.; Suzuki, H.; Ohishi, T.; et al. Antitumor Activities by a Humanized Cancer-Specific Anti-Podoplanin Monoclonal Antibody humPMab-117 Against Human Tumors. Cancer Sci 2025. [Google Scholar] [CrossRef] [PubMed]
- Hou, A.J.; Chen, L.C.; Chen, Y.Y. Navigating CAR-T cells through the solid-tumour microenvironment. Nat Rev Drug Discov 2021, 20, 531–550. [Google Scholar] [CrossRef] [PubMed]
Figure 1.
Prognostic significance of EphB4 expression in breast cancer and establishment of Eb4Mab-7-mG2a. (A) Kaplan–Meier survival analysis of overall survival (OS) in breast cancer patients based on the expression levels of EphB family genes (EphB1, EphB2, EphB3, EphB4, and EphB6) using RNA-seq data from KMplot. Among these genes, high expression of EphB2 and EphB4 was significantly associated with poor prognosis (log-rank P < 0.05). Patients were then stratified into high and low expression groups using the optimal cutoff within the interquartile range. (B) Generation of a mouse IgG2a version of the anti-EphB4 monoclonal antibody (Eb4Mab-7-mG2a). The VH and VL regions of B4Mab-7 (mouse IgG1) were cloned into expression vectors containing mouse IgG2a CH and CL regions. These vectors were transfected into BINDS-09 cells (Fut8-knockout (KO) ExpiCHO-S cells) to produce Eb4Mab-7-mG2a. (C) Left: Expression of EphB4 and β-actin in CHO-K1 and CHO-EphB4-overexpressing cells, as well as in MCF-7 and EphB4-KO MCF-7 cells. Right: Expression of EphB4 and GAPDH in normal human adult tissues, MCF10A (non-tumorigenic mammary epithelial cells), MCF-7, BT-474, SK-BR-3, MDA-MB-468, and HBC5 cells.
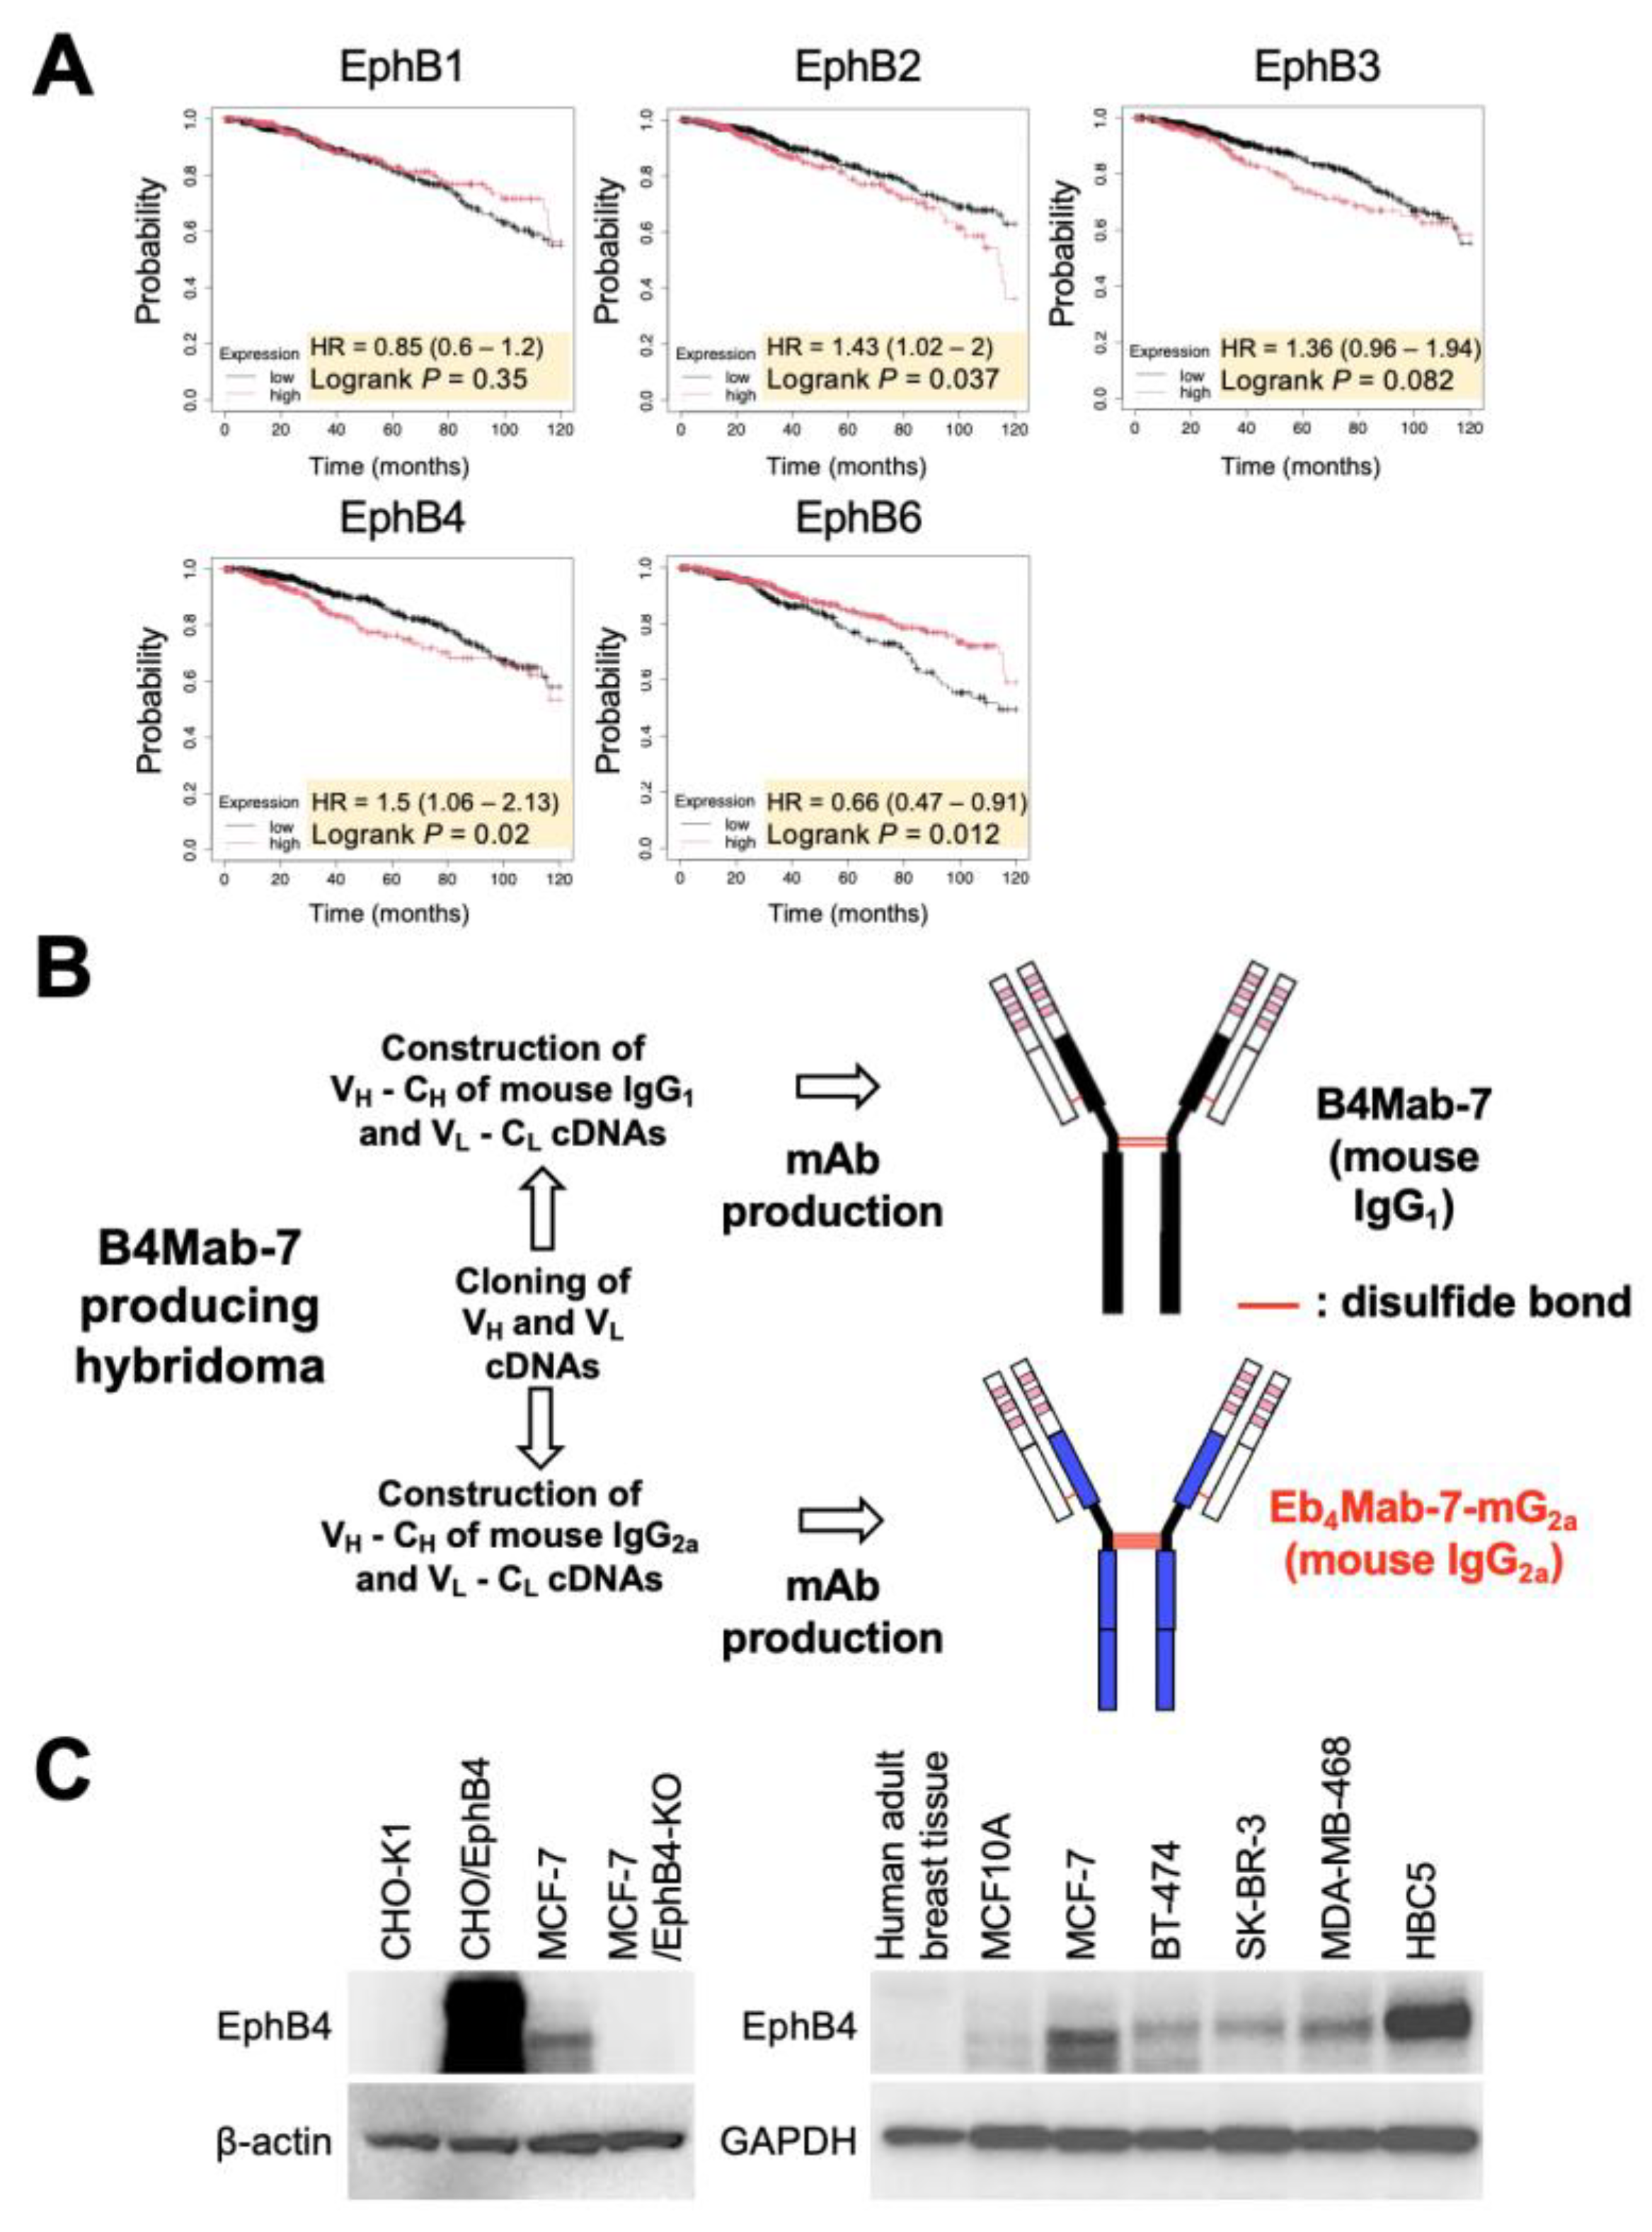
Figure 2.
Inhibitory effects of Eb4Mab-7-mG2a on Ephrin-B2-induced proliferation and ERK activation in EphB4-expressing breast cancer cells. (A) Viability of MCF10A and MCF-7 cells treated with recombinant Ephrin-B2 (5 µg/mL) or PBS for 3 days. Cell proliferation was assessed using the MTS assay. Ephrin-B2 significantly enhanced the proliferation of MCF-7 cells but not MCF10A cells relative to PBS control. Values are expressed as mean ± SD (n = 6). Asterisks indicate statistical significance (**P < 0.01; n.s., not significant; Mann–Whitney U test). (B) Viability of MCF10A and MCF-7 cells treated with recombinant Ephrin-B2 (5 µg/mL) in the presence of control PMab-231 or anti-EphB4 antibody (Eb4Mab-7-mG2a, 5 µg/mL) for 0 to 3 days. Cell proliferation was assessed using the MTS assay and normalized to day 0 (set as 1.0). Eb4Mab-7-mG2a significantly suppressed Ephrin-B2-induced proliferation of MCF-7 cells, whereas no significant effect was observed in MCF10A cells. Values are expressed as mean ± SD (n = 6). Asterisks indicate statistical significance (**P < 0.01; n.s., not significant; Mann–Whitney U test). (C) Activation of ERK signaling in MCF-7 and EphB4-KO MCF-7 cells after stimulation with recombinant Ephrin-B2 (5 µg/mL) for the indicated time points (0–60 min). Cells were pretreated with either control PMab-231 or Eb4Mab-7-mG2a (5 µg/mL) prior to stimulation. ERK1/2 phosphorylation was analyzed using Western blot analysis with anti-phospho-ERK1/2 and total ERK1/2 antibodies. Ephrin-B2 stimulation increased ERK1/2 phosphorylation in parental MCF-7 cells, which was attenuated by Eb4Mab-7-mG2a. No phosphorylation was observed in EphB4-KO MCF-7 cells. Band intensities were quantified using ImageJ. p-ERK/ERK ratios normalized to the 0 min time point are shown below each band.
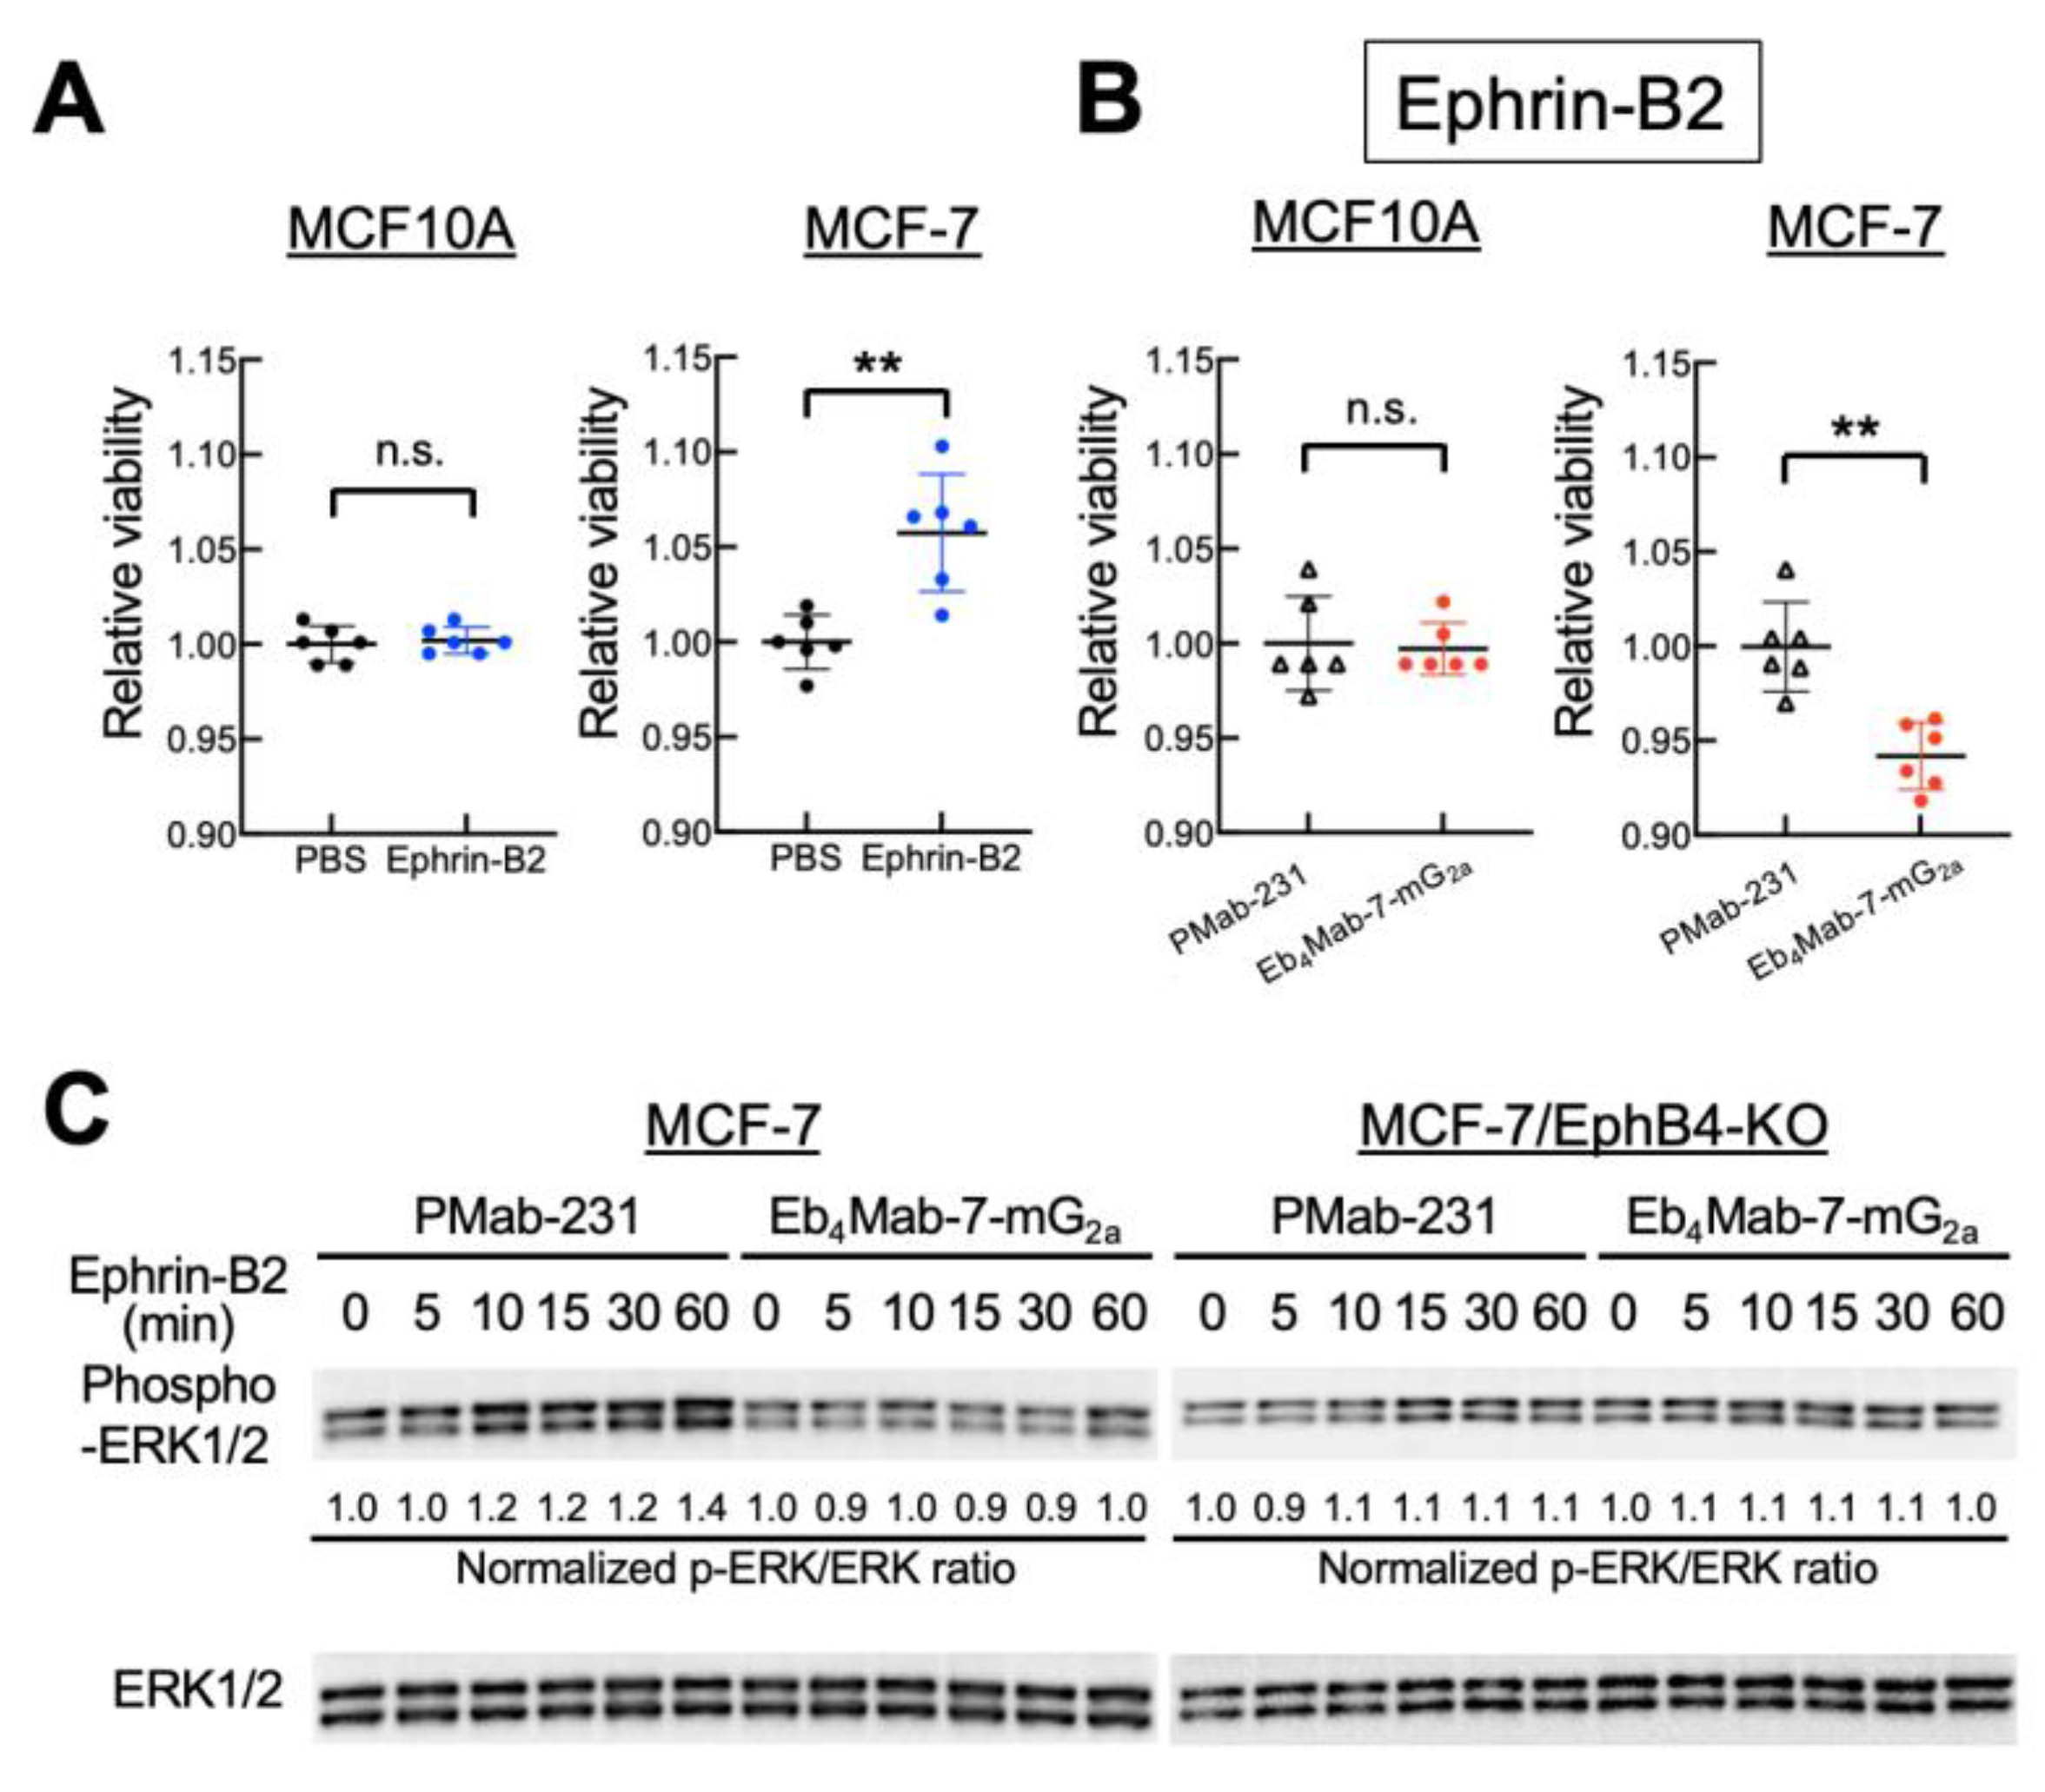
Figure 3.
Flow cytometry analysis of EphB4 binding to B4Mab-7 and Eb4Mab-7-mG2a. CHO-K1, CHO/EphB4-overexpressing cells, MCF-7, and EphB4-KO MCF-7 cells were incubated with buffer (black histograms) or increasing concentrations (0.01–10 µg/mL) of Eb4Mab-7-mG2a or B4Mab-7 (red histograms), followed by Alexa Fluor 488-conjugated anti-mouse IgG. Fluorescence was then analyzed using the SA3800 Cell Analyzer.
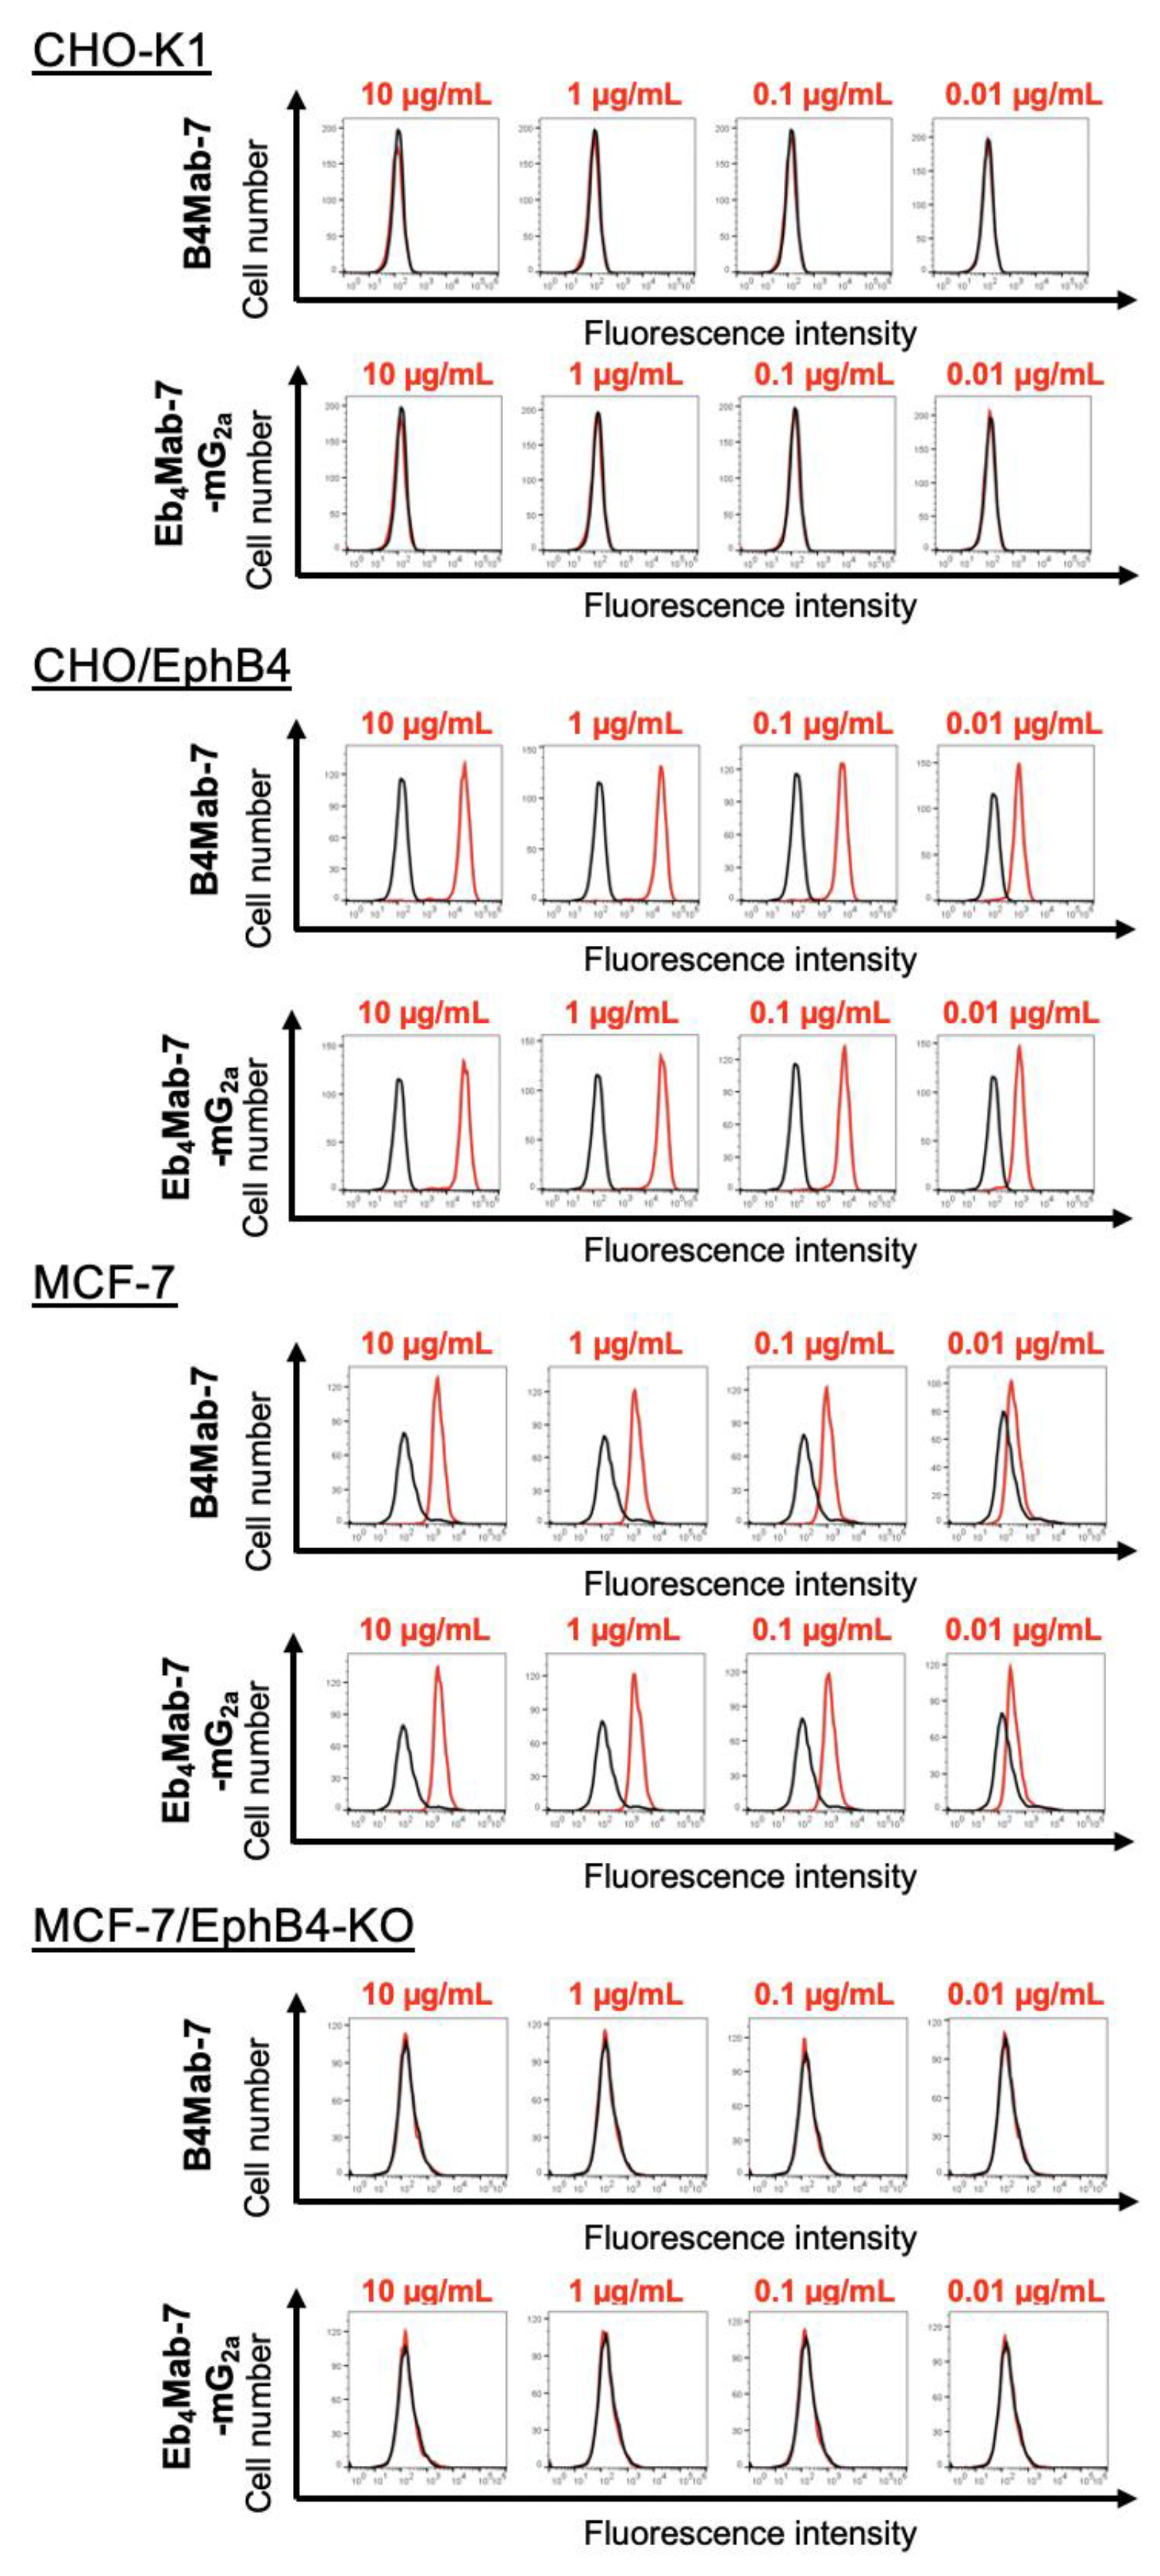
Figure 4.
Binding affinity and effector functions of Eb4Mab-7-mG2a. (A, B) Binding affinity of Eb4Mab-7-mG2a to CHO/EphB4 (A) and MCF-7 (B) cells. Cells were incubated with serial dilutions of Eb4Mab-7-mG2a, followed by Alexa Fluor 488-conjugated anti-mouse IgG. Fluorescence intensity was analyzed using the SA3800 Cell Analyzer, while the KD was calculated using GraphPad PRISM 6. (C, D) ADCC and CDC of Eb4Mab-7-mG2a. Calcein-labeled CHO-K1, CHO/EphB4, MCF-7, and EphB4-KO MCF-7 cells were treated with Eb4Mab-7-mG2a or a control PMab-231. For ADCC (C), effector splenocytes were added. For CDC (D), rabbit complement was used. Cytotoxicity was assessed by measuring calcein release into the medium. Data are presented as means ± SD shown in the positive direction only. Asterisks indicate statistical significance (**P < 0.01; n.s., not significant; one-way ANOVA with Tukey’s multiple comparisons test).
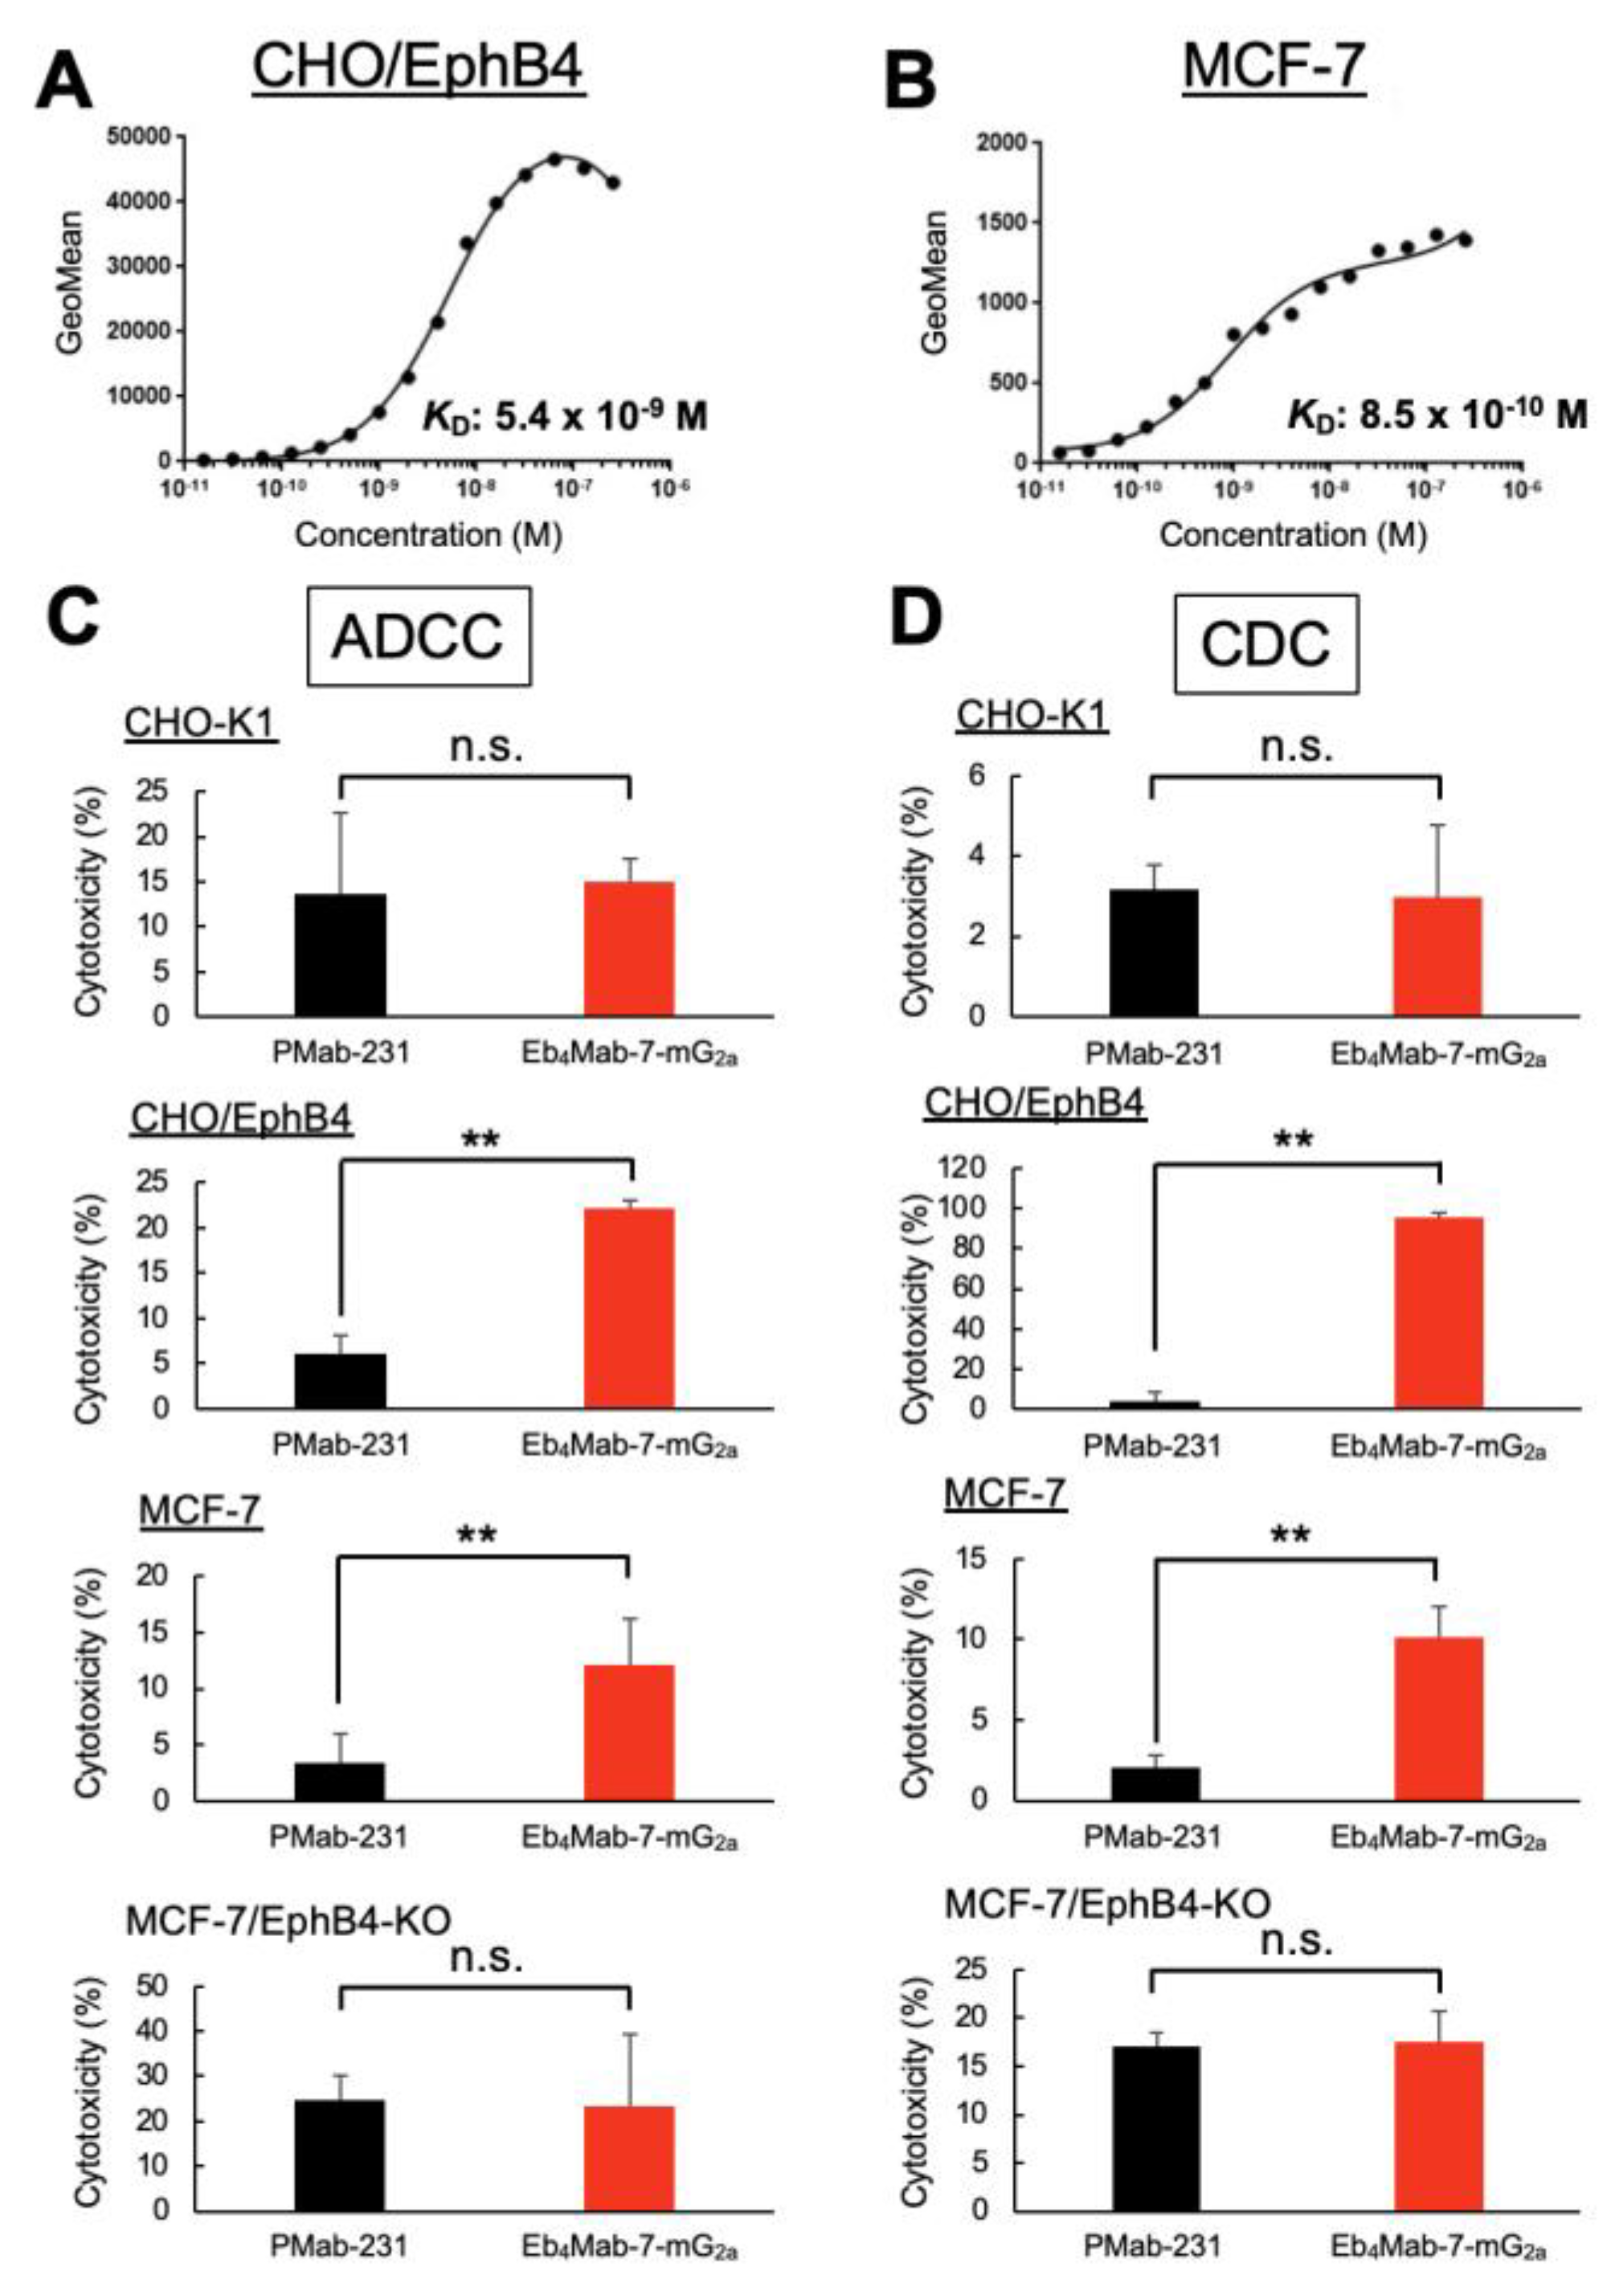
Figure 5.
Antitumor activity of Eb4Mab-7-mG2a against EphB4-overexpressing cells in vivo. CHO-K1 and CHO/EphB4 cells were subcutaneously inoculated into BALB/c nude mice on day 0. Eb4Mab-7-mG2a (100 µg) or the control PMab-231 (100 µg) was administered intraperitoneally on days 7, 14, and 21 (indicated by blue arrows). (A, D) Tumor growth curves of CHO-K1 (A) and CHO/EphB4 (D) xenografts. Tumor volumes are presented as mean ± SD. * P < 0.05 (two-way ANOVA with Sidak’s multiple comparisons test). (B, E) Representative images of resected tumors derived from CHO-K1 (B) and CHO/EphB4 (E) xenografts (scale bar: 1 cm). (C, F) Tumor weights at the endpoint from CHO-K1 (C) and CHO/EphB4 (F) xenografts. * P < 0.05 (two-way ANOVA with Sidak’s multiple comparisons test).
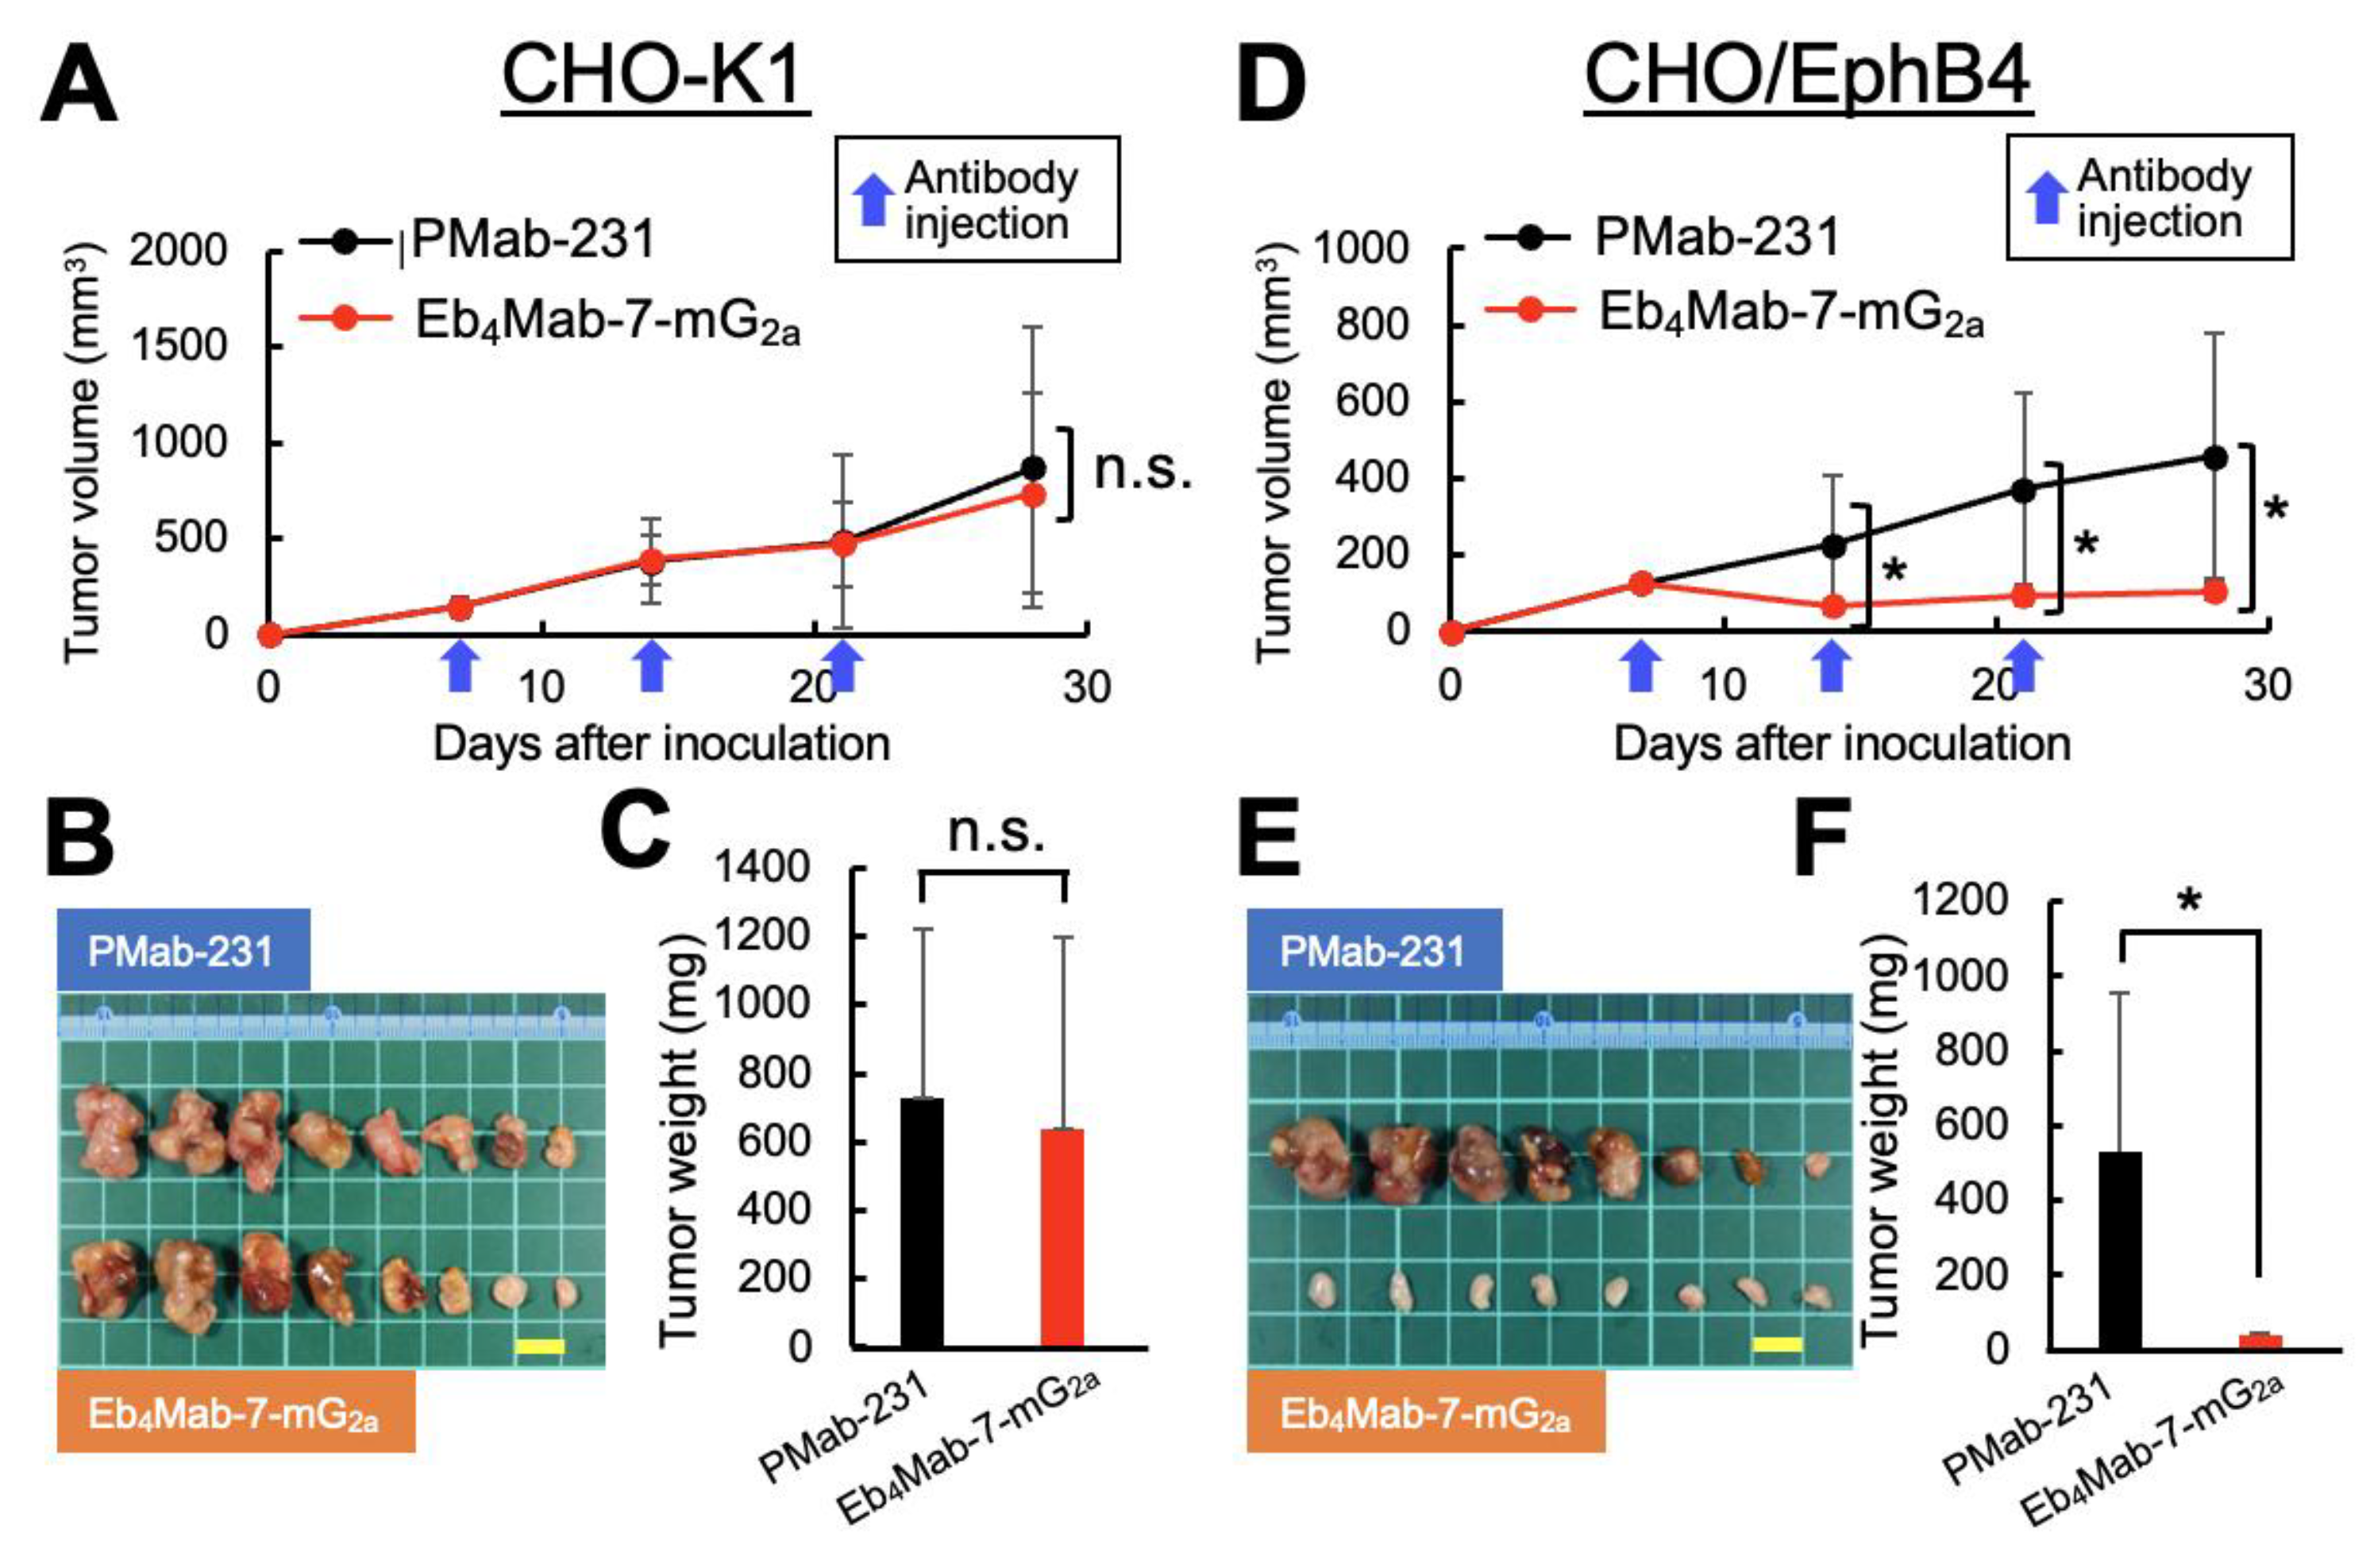
Figure 6.
Antitumor activity of Eb4Mab-7-mG2a against MCF-7 and EphB4-KO MCF-7 tumors in vivo. MCF-7 and EphB4-KO MCF-7 cells were subcutaneously inoculated into BALB/c nude mice on day 0. Eb4Mab-7-mG2a (100 µg) or the control antibody PMab-231 (100 µg) was administered intraperitoneally on days 7, 14, and 21 (indicated by blue arrows). (A, D) Tumor growth curves of MCF-7 (A) and EphB4-KO MCF-7 (D) xenografts. Tumor volumes are presented as mean ± SD. * P < 0.05 (two-way ANOVA with Sidak’s multiple comparisons test). (B, E) Representative images of resected tumors derived from MCF-7 (B) and EphB4-KO MCF-7 (E) xenografts (scale bar: 1 cm). (C, F) Tumor weights at the endpoint from MCF-7 (C) and EphB4-KO MCF-7 (F) xenografts. * P < 0.05 (two-way ANOVA with Sidak’s multiple comparisons test).
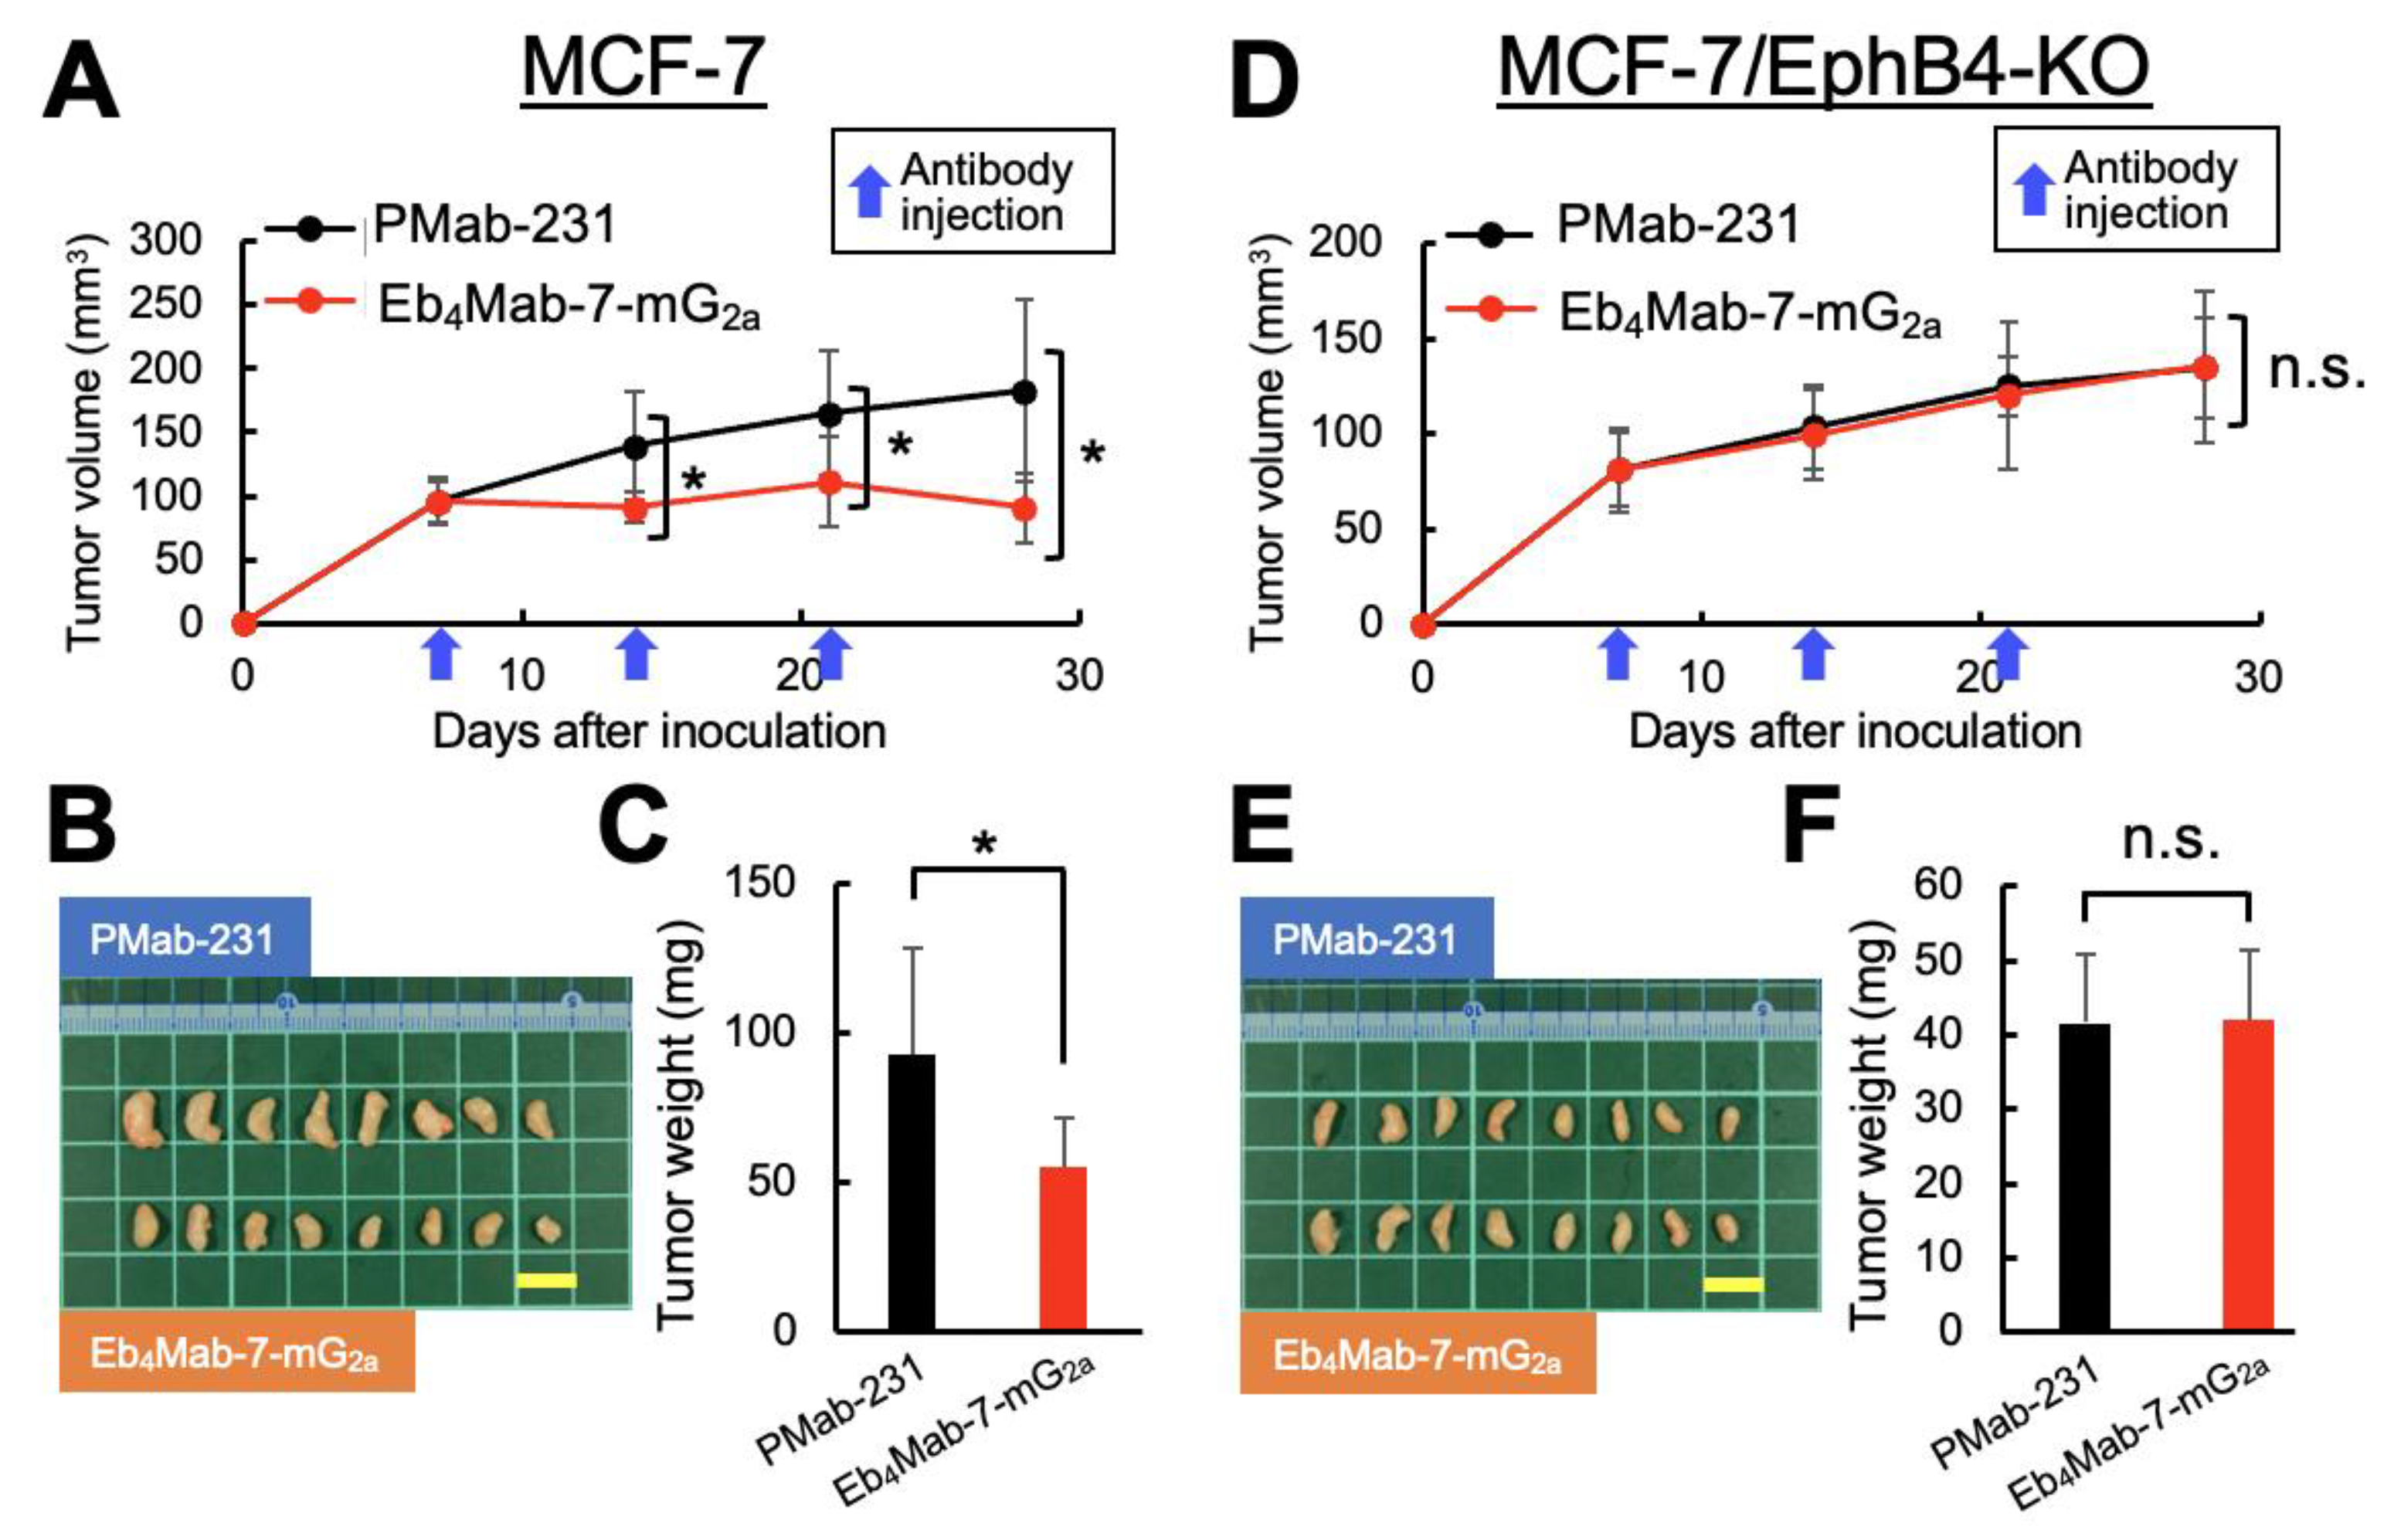
Figure 7.
Eb4Mab-7-mG2a-induced inhibition of tumor cell proliferation measured using Ki-67 staining. Tumor sections derived from CHO-K1, CHO/EphB4, MCF-7, and EphB4-KO MCF-7 xenografts were immunohistochemically stained with anti-Ki-67 antibody to assess cell proliferation. Representative Ki-67 staining images (left panels) and quantification of Ki-67-positive cells (right panels) are presented for each group. Mice were treated with Eb4Mab-7-mG2a or the control PMab-231. e-Path image analysis software was used to calculate the percentage of Ki-67-positive cells, which is presented as mean ± SD shown in the positive direction only. *p < 0.05, ** P < 0.01 (one-way ANOVA with Tukey’s multiple comparisons test). n.s., not significant.
Disclaimer/Publisher’s Note: The statements, opinions and data contained in all publications are solely those of the individual author(s) and contributor(s) and not of MDPI and/or the editor(s). MDPI and/or the editor(s) disclaim responsibility for any injury to people or property resulting from any ideas, methods, instructions or products referred to in the content. |
© 2025 by the authors. Licensee MDPI, Basel, Switzerland. This article is an open access article distributed under the terms and conditions of the Creative Commons Attribution (CC BY) license (http://creativecommons.org/licenses/by/4.0/).
Copyright: This open access article is published under a Creative Commons CC BY 4.0 license, which permit the free download, distribution, and reuse, provided that the author and preprint are cited in any reuse.


