
Submitted:
25 June 2025
Posted:
27 June 2025
You are already at the latest version
Abstract
This study proposes an interpretable and high-accuracy ensemble learning framework for predicting aspartate aminotransferase (AST) levels using open-access biomedical datasets. Using a structured pipeline of preprocessing, feature selection, and model ensembling, we evaluated a series of regression algorithms including Random Forest, XGBoost, CatBoost, and three stacking architectures. The best-performing ensemble (Stacking_v2) achieved R² = 0.98 and RMSE = 1.23 on the validation set, surpassing conventional and single-model approaches. Feature importance was assessed using SHAP values, mutual information, and correlation analysis, revealing that gamma-glutamyl transferase, ferritin, and anthropometric markers had the greatest predictive impact. The proposed stacking-based model demonstrates excellent generalization, robust calibration, and high interpretability, and can serve as a benchmark for algorithmic evaluation in medical data modeling. The work highlights the effectiveness of ensemble regression and interpretable AI in real-world clinical prediction tasks using routine biomarkers.
Keywords:
ensemble learning
; stacking
; AST prediction
; explainable AI
; SHAP
; regression algorithms
; medical machine learning
; NHANES
; biomedical data
1. Introduction
The development of interpretable and robust machine learning algorithms remains a central focus in biomedical data science. In predictive medicine, biochemical markers such as aspartate aminotransferase (AST) serve as important indicators of tissue damage, metabolic dysfunction, and systemic inflammation. Traditionally, AST has been used in clinical assessments of liver and cardiovascular health, but modern algorithmic modeling allows for its integration into large-scale, data-driven screening tools [1,2]. Despite the availability of high-quality datasets such as NHANES, challenges remain in extracting actionable insights due to data heterogeneity, multicollinearity, and the nonlinearity of medical predictors. Ensemble machine learning methods — including Random Forest, gradient boosting, and stacking — have shown great promise in overcoming these challenges [3,4,5]. These models can capture complex interactions and nonlinear dependencies while maintaining generalizability, especially when applied to diverse cohorts and routine clinical markers.
In particular, stacking ensembles allow for the integration of diverse base learners with meta-level regressors to reduce bias and variance simultaneously [6,7]. Recent studies have demonstrated that combining multiple boosting algorithms within a stacking framework leads to superior performance across a range of biomedical regression problems [8]. However, a persistent limitation is the lack of transparency in model decision-making, which has led to increasing adoption of explainable artificial intelligence (XAI) methods, including SHAP (SHapley Additive exPlanations), mutual information metrics, and hierarchical clustering [9,10,11]. Although machine learning has been widely applied to disease classification, few works focus specifically on regression-based prediction of AST as a continuous variable using interpretable and reproducible architectures [12,13,14]. Moreover, limited research has explored how biochemical and behavioral variables interact to influence AST levels, despite their proven relevance in metabolic and cardiovascular health monitoring [15].
In this work, we address these gaps by introducing an interpretable ensemble learning framework for AST prediction using routine data from the NHANES 1988–2018 dataset. Our methodology includes: (i) data cleaning and transformation, (ii) implementation of multiple base learners (CatBoost, LightGBM, XGBoost, Random Forest, etc.), (iii) construction of stacking architectures with Ridge meta-regressors, and (iv) application of XAI techniques for feature interpretation. The main contribution of our work is a highly accurate, generalizable, and interpretable stacking-based model that achieves state-of-the-art performance (R² = 0.98, RMSE = 1.23) on real-world population data. This framework has the potential to support early detection strategies and algorithmic benchmarking in medical regression tasks.
2. Materials and Methods
This study used data from the National Health and Nutrition Examination Survey (NHANES) for the period 1988–2018, including biochemical, demographic, and behavioral parameters of respondents. This source provides a representative dataset on the health status of the US population and is widely used for scientific purposes [13,14]. The study included routine biochemical markers, such as ferritin, glucose, γ-glutamyltransferase (γ-GT), and lactate dehydrogenase (LDH), as well as data on lifestyle, body weight, and physical activity level [15]. Comprehensive data preprocessing was carried out: removing outliers, eliminating gaps, standardizing numerical features, and coding categorical variables, which is a necessary step for building reliable machine learning models [16,17]. Based on the prepared data, different machine learning models were trained and compared to predict the risk of elevated aspartate aminotransferase (AST) [18].
2.1. Related Work and Literature Review
In recent years, there has been an increase in research aimed at predicting liver enzyme levels, including aspartate aminotransferase (AST), using machine learning methods. Hu et al. [19] found an association between elevated ALT/AST ratio and the risk of liver fibrosis based on NHANES data but did not focus on predicting individual AST levels. Zhu et al. [20] proposed a Random Forest model to estimate the risk of elevated transaminases in patients with rheumatoid arthritis, achieving high accuracy but limited to a narrow clinical cohort. A broader approach was proposed by Yang et al. [21], who developed machine learning models for diagnosing MASLD using routine data; AST levels were considered only indirectly. Interpretable models are also gaining momentum. Wang et al. [22] utilized SHAP to explain predictions from NAFLD ML models, demonstrating the potential of such solutions for medical interpretation. In turn, Ali et al. [23] confirmed the possibility of diagnosing cardiovascular diseases using routine blood tests and ensemble models, but liver biomarkers were not the subject of analysis. In addition, Yang et al. [24] presented a systematic review of the application of machine learning (ML) in predicting outcomes after liver transplantation, demonstrating advantages over traditional scoring systems; however, they did not address the aspect of routine screening. Khaled et al. [25] proposed a deep learning system for the early detection of liver diseases, which requires further clinical validation. McGettigan [26] investigated the performance of various machine learning (ML) models on an extensive array of medical data, confirming the potential of the algorithms for liver diagnostics but without specifying the specific architectures. Farhadi et al. [27] focused on predicting complications after recovery from hepatitis B, which limits the generalizability of their model. As shown in Table 1, all these studies emphasize the need to develop specialized and interpretable models that focus specifically on the individual risk of elevated AST, utilizing available clinical, demographic, and biochemical data.
As shown in Table 1, the majority of current studies confirm the high efficiency of machine learning methods for analyzing and predicting diseases based on routine medical data. However, only a limited number of studies directly focus on individual prediction of AST levels as a separate biomarker. In addition, few studies use interpretable models, which limits their applicability in clinical practice. The identified scientific gaps, including insufficient generalizability, the lack of multivariate analysis, and the weak integration of behavioral parameters, underscore the need to develop a comprehensive model for predicting the risk of AST elevation based on available and standardized indicators. Despite the active development of machine learning in biomedicine, most existing studies focus on predicting diseases in tissues with high metabolic activity and do not consider aspartate aminotransferase (AST) as a significant marker of cardiovascular risk. This study presents an understudied yet promising approach for predicting cardiovascular diseases using AST and other routine indicators. Distinctive features of this work include:
- Direct regression prediction of AST level, considered as an independent predictor of cardiovascular risk and not as a marker of hepatological disorders;
- Integration of routine biochemical, anthropometric, and behavioral parameters, including inflammation, body weight, and lifestyle indicators, enhances the clinical relevance of the model;
- Use of a stacking ensemble (Stacking v2), which combines the capabilities of modern algorithms and an interpretable meta-model to improve accuracy and stability;
- The use of SHAP and mutual information to analyze the significance of features ensures the interpretability of the model and its applicability in the clinical environment;
- Validation on a large and representative NHANES dataset (1988–2018) covering a wide range of health data from the US population.
Unlike previous studies limited to narrow clinical cohorts or liver disease diagnostic tasks, our study demonstrates how routine parameters, including AST, can be effectively used to assess cardiovascular disease risk in the general population. The proposed model may become a tool for early screening and personalized prevention in resource-limited settings.
2.2. Dataset Collection
To build a model for predicting aspartate aminotransferase (AST) levels, the open national dataset from the National Health and Nutrition Examination Survey (NHANES) for the years 1988–2018 was utilized. This source provides large-scale information on the health status of the US population, including biochemical analysis data, anthropometric indicators, and behavioral and demographic characteristics. NHANES was chosen due to its representativeness, standardized data collection protocols, and high degree of reliability. From the total data set, records of adult respondents (≥18 years) were selected for whom AST values and other essential indicators were available: ferritin, γ-glutamyl transferase (γ-GT), lactate dehydrogenase (LDH), glucose, body mass index, physical activity, smoking and alcohol consumption habits, as well as inflammation indicators. Incomplete observations and abnormal values were excluded, and data cleaning and standardization procedures were performed. All features are brought to a single format, categorical variables are coded, and numerical variables are normalized. As a result, a structured sample is formed, suitable for the application of machine learning algorithms. It covers various aspects of the physiological state and lifestyle of respondents, providing a basis for constructing an interpretable prognostic model. The original data presented at https://drive.google.com/drive/folders/1cgyQXj3Kl7FdDoyPlmEkCKyDXNDIv4JB?usp=drive_link (accessed on 06 June 2025).
2.3. Rationale for a Method Selection
Building an effective predictive model required the use of a complex algorithm that included several interrelated stages of data preprocessing, feature selection, and model ensemble training. Each method in this process was selected based on its robustness, efficiency, and applicability to medical data with heterogeneous features.
1. Removing emissions. In the first step, observations with suspiciously high values (s ≤ 200) were excluded from the dataset, which helps minimize the impact of anomalies and noise on model training. This is especially important when working with biomarkers, where technical or clinical artifacts may cause outliers.
2. Removing gaps. Removing rows with missing values in the target variable (AST) and critical predictors ensures the correctness of the training process. This step is necessary to maintain the quality of predictions and prevent distortions.
3. Transformation of categorical variables. One-hot encoding of categorical features (e.g., demographic and questionnaire data) is applied, which allows them to be efficiently included in machine learning models without violating assumptions about the numerical nature of the input data.
4. Scaling of Numerical Features. Numerical features are normalized (z-transformed) to equalize scales and prevent features with high variance from dominating the analysis. This is especially important for linear and gradient-boosted models that are sensitive to scale.
5. Split into training and validation samples. The standard split of the sample (train/test split) is used to assess the quality of the model objectively. This allows you to control overfitting and tune hyperparameters.
6. Base models (Base regressors). The following algorithms were selected to build a forecast of the AST level:
• Linear Regression — a basic benchmark for estimating linear relationships.
• Random Forest — a stochastic model that is robust to outliers and works well with small samples.
• XGBoost — a powerful gradient boosting that provides high accuracy and control over overfitting.
• CatBoost — an optimized boosting algorithm that works efficiently with categorical features without the need for manual coding.
• LightGBM — a fast and scalable boosting algorithm, especially effective on large and sparse data.
• Extra Trees — an improved version of Random Forest that uses additional stochasticity to improve generalization.
7. Stacking. As shown in Figure 1, Stacking v1 is a simple two-level ensemble scheme in which base models (Linear Regression, Random Forest, and XGBoost) are independently trained on the original features (1):
The meta-model — simple linear regression — receives their predictions as input and minimizes the error on the validation set. The final forecast is formed based on the aggregated predictions of the meta-regressor. The advantages of this approach include ease of implementation, high interpretability, accelerated convergence, and quality gain due to combining several models. However, Stacking v1 is limited by the linear nature of the meta-regressor, does not take into account complex dependencies between the outputs of the base models, does not support feeding the original features directly to the meta-level ("passthrough"), and can also be subject to overfitting when using a large number of base algorithms.
Stacking v2 is an advanced two-level ensemble model that utilizes modern and powerful algorithms as base models, including CatBoost, LightGBM, and ExtraTrees, which provide high accuracy through boosting and stochastic approaches (2):
At the second level, a Ridge regression meta-model is used, which is robust to multicollinearity and prone to regularization, thereby reducing the risk of overfitting and accounting for the possible correlation between the predictions of the base models. The final prediction is formed based on the outputs of these three ensembles, aggregated using Ridge regression. Among the advantages of Stacking v2 are high accuracy, resistance to overfitting, and good adaptation to nonlinear dependencies (Figure 2). The main disadvantages are the increased complexity of hyperparameter tuning and increased computational costs compared to simpler schemes such as Stacking_v1.
Figure 3 presents the most advanced and outlier-robust ensemble architecture, which includes powerful base models — CatBoost, LightGBM, XGBoost, Random Forest, and a specialized regressor for predicting high AST values (HighAST Regressor) (3):
All boosted models utilize Huber loss, which ensures robustness to outliers and asymmetric errors. LightGBM is used as a meta-model with the same loss function and a "passthrough" mode, in which the meta-algorithm receives not only the predictions of the base models but also the original features, which allows it to effectively restore complex dependencies and compensate for the weaknesses of individual models. The final forecast is formed based on cumulative information, making this scheme the most robust against various types of errors. Its advantages include high accuracy, robustness in the face of outliers, the ability to utilize rare patterns (via the HighAST model), and a rich feature representation. However, the model requires significant computational resources, careful tuning of hyperparameters, and effective control over overfitting. Despite its complexity, the model did not show substantial advantages on validation data for several key metrics (R², RMSE, MAE), indicating the need for additional analysis and possibly architecture refinement.
Overall, the Stacking_v2 architecture was optimal in terms of the combination of accuracy, stability, and interpretability criteria. It is recommended to use this option for predicting the AST level using the presented markers and features.
2.4. Stages of Model Implementation
Proper feature selection plays a key role in building accurate and interpretable machine learning models, especially in the clinical context, where each variable can reflect critical biomedical processes. Based on biochemical, anthropometric, and behavioral characteristics, as well as the use of explainable AI approaches, an assessment is carried out to evaluate their contribution to the predicted variable. This analysis not only improves the quality of prediction but also identifies pathophysiological relationships that are crucial for interpreting results and informing clinical practice.
I. Notations and variables used
- n — number of observations (patients);
- d — number of initial features;
- — feature matrix;
- — feature vector for the i-th patient;
- — target variable vector (ACT level, LBXSASSI).
Trait variables:
- ▪
- — age;
- ▪
- — gender;
- ▪
- — weight;
- ▪
- — height;
- ▪
- — ferritin;
- ▪
- — homocysteine;
- ▪
- — total cholesterol;
- ▪
- — LDL-C;
- ▪
- — glucose;
- ▪
- — hemoglobin;
- ▪
- — creatinine;
- ▪
- — hs-CRP;
- ▪
- — alkaline phosphatase (ALP);
- ▪
- — gamma-GT;
- ▪
- — LDH;
- ▪
- — urea;
- ▪
- — uric acid;
- ▪
- — leukocytes;
- ▪
- — average number of alcoholic drinks per day;
- ▪
- — physical activity.
Figure 4 shows the complete architecture of the algorithm for constructing a predictive model for the aspartate aminotransferase (AST) level, including the stages of data preprocessing, feature selection, training of base models, and formation of the Stacking_v2 ensemble. The algorithm begins by removing outliers and missing values, then encodes categorical variables and scales numerical features. After splitting into training and validation samples, several regressors are trained in parallel (including XGBoost, CatBoost, LightGBM, ExtraTrees, etc.), and the final model is formed using meta-regression based on these models.
This algorithm enables the achievement of high accuracy and robustness in the model by combining various algorithms and normalization methods. Using Stacking_v2 ensures the efficient aggregation of base model predictions, thereby reducing the risk of overfitting and improving the model's generalization ability. The inclusion of such stages as outlier analysis and feature scaling is essential in medical data, where there is high heterogeneity. The algorithm architecture presents a comprehensive and interpretable approach to AST prediction, making it suitable for subsequent application in decision support systems.
II. Steps of data preparation and processing
1. Loading and merging data. The first stage involves loading three tables containing clinical, demographic, and questionnaire data, after which they are combined using a unique patient identifier (SEQN), allowing for the formation of a single data structure for subsequent analysis and model building (4).
2. Remove outliers. Removes records where the target variable (5):
3. Removing gaps. Only those records are left where there are no gaps for the selected features and target variable (6):
4. Transformation of categorical variables. Gender indicator is encoded using the one-hot method (7):
5. Scaling of numerical features. For each numerical feature ()), except for categorical ones, standardization is applied (8):
6. Splitting into training and validation sets. The data is split into training () and validation () sets:
III. Mathematical description of model training
1. Training base regressors. For each base algorithm , we train a regression function (10):
- — linear regression
- — Random Forest
- — XGBoost
- — CatBoost
- — LightGBM
- — Extra Trees
- - local regressor for high AST values (trains only on cases with y>50)
IV. Methods of selection and analysis of features
1. Correlation analysis
- Linear correlation (11):
- Spearman/Kendall: uses nonparametric measures for robustness.
- Mutual Information (12):
- SHAP values (13):
Stacking v2. The final model is a second-level ensemble combining the predictions of the base models using ridge regression as a meta-algorithm. This approach enables the extraction of advantages from different models, thereby increasing the stability of predictions and reducing error due to aggregation. The use of stacking is especially justified in problems where there is no single universal predictor, and it is necessary to combine knowledge from different sources. Taken together, the described methodological approach enables the construction of an interpretable, robust, and accurate model for predicting the AST level based on available routine data, offering high potential for clinical application.
3. Results
This study was conducted using the publicly available, harmonized NHANES 1988–2018 (National Health and Nutrition Examination Survey) dataset, which combines national data on the health and nutrition status of the US population over 30 years [9]. Thanks to complex preprocessing, this resource ensures high comparability of variables and minimizes the impact of missing and erroneous values, which is critical for building valid machine learning models. The selection of features for analysis was carried out strictly by the goal of the study - to develop an accurate and accessible model for predicting aspartate aminotransferase (AST) levels based exclusively on low-cost and routine biochemical markers that are available as part of standard medical examinations, without the use of specialized and expensive cardiology tests.
The final dataset for building the prognostic model included the most accessible and clinically significant variables. Demographic characteristics, such as age and gender, were used as baseline covariates to account for norms and individual differences. Anthropometric indicators (body weight and height) reflected the metabolic load and served as indicators of the general physiological state. The set of features included key biochemical markers, such as ferritin, homocysteine, cholesterol, glucose, creatinine, hemoglobin, hs-CRP, urea, uric acid, and leukocytes, which characterize metabolism, inflammatory processes, kidney and liver function, as well as protein and carbohydrate metabolism. Additionally, inexpensive but informative markers of liver function (γ-GT, LDH, alkaline phosphatase) were included as a practical alternative to specialized liver tests. Behavioral parameters, such as the level of physical activity and alcohol consumption, were also taken into account to account for the influence of external factors. This selection of features is designed to maximize the practical applicability of the model, relying solely on data that are readily available in most clinical laboratories without the need for expensive equipment or specialized assays, making the proposed approach suitable for broad population screening. All variables were standardized, and categorical variables were one-hot encoded. Samples were combined by unique participant identifiers, with subsequent cleaning of missing values (Table 2).
To build a predictive model, both basic algorithms and various ensemble schemes were tested. Both interpretable (linear regression) and more powerful ensembles — Random Forest, XGBoost, and CatBoost — were used as single models. In addition, three versions of stacking models were implemented, differing in the composition of the basic models, meta-algorithm, and the use of additional strategies. All models were tuned to optimize the parameters that strike a balance between accuracy and stability. Table 3 presents brief characteristics of the models used and the key hyperparameters applied in the experiment.
As shown in Table 3, each model had its specific settings and architecture. Simple models, such as linear regression, were primarily used for basic comparison, while ensemble approaches, especially Stacking_v2, yielded the best results across several metrics. Of particular interest are complex configurations, such as Stacking_v3, and a specialized regressor for the subsample with high AST values, focused on handling outliers and complex cases. This multi-level approach allowed us to comprehensively evaluate the potential of various algorithms in predicting biomarkers on routine data. A set of validated metrics was used for a comprehensive assessment of the predictive abilities of the trained models. The forecasting quality was determined by the coefficient of determination (R²), reflecting the proportion of explained variance of the target variable, as well as by the root mean square error (RMSE) and mean absolute error (MAE), which allow us to quantify the average deviations of predictions from the actual values in the original AST units. In addition, the relative error (MAPE) was calculated and expressed as a percentage, ensuring comparability between different ranges of values and increasing the clinical interpretability of the results. Additionally, the explained variance was estimated, characterizing the model's stability in the face of fluctuations and outliers in the data. Figure 5 shows the values of the determination coefficient (R²) for the training and validation sets for all tested models: Linear Regression, Random Forest, XGBoost, CatBoost, and three stacking options.
The highest value of the coefficient of determination (R²) on the training set was achieved by the XGBoost model (R² = 1.00), indicating that it fully explains the variance of the target variable within the training dataset; however, the decrease in R² to 0.92 on the validation set indicates possible overfitting, despite maintaining high predictive accuracy. The Random Forest and CatBoost models also demonstrated high R² values (0.92 and 0.99 on training and 0.84 and 0.90 on validation, respectively), confirming their generalization ability, albeit inferior to that of XGBoost. Ensemble approaches, especially Stacking_v2, provided the best balance between accuracy on training (0.99) and validation (0.98), demonstrating resistance to overfitting due to the integration of predictions from multiple base models. In contrast, the linear regression model showed significantly lower values (0.48 for training and 0.42 for validation), indicating its insufficient flexibility in the face of complex nonlinear relationships. The Stacking_v3 model, despite its complex architecture, achieved only 0.73 for training and 0.58 for validation, which is likely due to the overcomplication of the structure and a decrease in consistency between the ensemble levels. Thus, the most stable and highly accurate results are achieved when using modern boosting and stacking models with well-chosen parameters and a relevant set of features.
Figure 6 shows a comparison of the root mean square error (RMSE) values on the training and validation samples for different models. RMSE enables us to assess the absolute accuracy of predictions: the lower the metric value, the higher the model's quality.
The RMSE metric analysis revealed the highest error value for the linear regression model (5.94 on the training set and 7.55 on the validation set), indicating its inability to model complex relationships between features and the target variable adequately. At the same time, the Random Forest, CatBoost, and especially XGBoost models showed significantly better results: the minimum RMSE value for validation belongs to XGBoost (2.75), with zero error for training, which, despite the high accuracy, may indicate overfitting. CatBoost demonstrated balanced values (0.90 - training, 3.18 - validation), only slightly inferior to XGBoost. Among the ensemble stacking models, the best performance was shown by the Stacking_v2 architecture (0.63 - training, 1.23 - validation), which indicates its high generalization ability and successful configuration. In contrast, Stacking_v3 showed inflated errors (4.28 — training, 6.43 — validation), likely due to excessive complexity and inefficient coordination between ensemble layers. Thus, XGBoost and Stacking_v2 proved to be the most effective in terms of root mean squared error (RMSE). At the same time, significant discrepancies between training and validation errors for individual models underscore the need for further work on hyperparameter tuning and preventing overfitting.
Figure 7 shows the analysis of mean absolute errors (MAE) for the training and validation sets for different models. MAE reflects the average absolute deviation of predictions from actual values, allowing us to judge the accuracy of the models without considering the direction of error.
The analysis of the mean absolute error (MAE) metric revealed that the linear regression model yields the highest values on both the training set (4.21) and the validation set (4.88), indicating its limited predictive suitability for this task. In contrast, the Random Forest and CatBoost ensemble models demonstrated significantly lower MAE values — 1.56 and 0.39 on training and 2.71 and 1.57 on validation, respectively — confirming their ability to account for complex nonlinear dependencies. The XGBoost model exhibited minimal error values (0.00 on training and 1.03 on validation), demonstrating high accuracy and generalization ability with the correctly selected parameters. Stacking models also performed well: Stacking_v1 (1.31 — train, 2.58 — val) and especially Stacking_v2 (0.40 — train, 0.90 — val), the latter of which provides one of the best accuracy-to-robustness ratios. In contrast, the Stacking_v3 model showed relatively high errors (1.72 — training, 3.02 — validation), which is likely due to the complex architecture and weak synergy between the ensemble components. Overall, the XGBoost and Stacking_v2 models demonstrated the best MAE values in validation, making them preferable for accurate and robust AST activity prediction, especially in the context of medical data with high sensitivity to outliers.
Figure 8 presents a comparison of the relative prediction error (MAPE, %) for various models on both the training and validation sets. This metric is particularly sensitive to the magnitude of the deviation between predictions and actual values. It is critical for clinical and biomedical problems where it is essential to consider the percentage error.
The mean average prediction error (MAPE) analysis revealed that the linear regression model performed the worst, with 20.27% on the training set and 19.87% on the validation set, confirming its limited applicability to AST activity prediction tasks. In contrast, ensemble methods, in particular Random Forest, significantly reduced the error rate (7.43% — train, 11.26% — val), demonstrating robustness to data heterogeneity. The XGBoost model achieved the best performance (0.02% — train, 3.77% — val), demonstrating its high ability to model complex relationships accurately. Comparably low values were shown by CatBoost (1.75% — train, 5.85% — val) and Stacking_v2 (1.95% — train, 3.85% — val), highlighting the effectiveness of advanced ensemble architectures. At the same time, Stacking_v1, despite achieving acceptable results in training, demonstrated a significantly higher MAPE in validation (10.94%), which may indicate an insufficient model complexity or overfitting. Stacking_v3 is also inferior in accuracy (6.08% — train, 10.13% — val), despite its complex structure. Thus, XGBoost and Stacking_v2 are recognized as the most accurate and robust models for individual AST level prediction, especially in the context of precision medicine and epidemiological studies.
Figure 9 shows a comparison of the Explained Variance scores for different models on the training and validation sets, reflecting the proportion of variance in aspartate aminotransferase (AST) levels explained by the model. Linear regression showed the lowest values of 0.48 for training and 0.43 for validation, indicating its limited ability to capture complex dependencies in medical data. In contrast, the Random Forest and CatBoost models provided significantly higher explained variance, at 0.92 and 0.99 for training and 0.85 and 0.91 for validation, respectively. These results demonstrate the effectiveness of ensemble and boosting approaches in modeling physiological processes with high variability, confirming their applicability to individual medical prediction problems.
The XGBoost and Stacking_v2 models demonstrate the highest Explained Variance values on the training set (1.00) and some of the highest results on the validation set (0.92 and 0.98, respectively), which indicates the high ability of these algorithms to take into account complex nonlinear dependencies between features and almost explain entirely the variability of the aspartate aminotransferase (AST) level. At the same time, Stacking_v1 and Stacking_v3 show more modest values (0.94/0.87 and 0.74/0.62 for the training and validation sets, respectively), which can be due to either excessive complexity of the ensemble structures or insufficient consistency between the base and meta-levels of the models. The best explained variance values are achieved by XGBoost, CatBoost, and Stacking_v2, which confirms their suitability for high-precision risk stratification, interpretation of significant predictors, and construction of reliable individual predictions in medical analytics tasks.
Based on the conducted analysis, the XGBoost and Stacking_v2 algorithms demonstrate the highest accuracy and stability among the tested models. At the same time, the final choice of the optimal model should take into account not only the metric values on the training set but also stability during validation, the tendency to overfit, and the interpretability of the results. XGBoost shows almost ideal training quality (R²=1.00, RMSE=0.00, MAE=0.00, ExplainedVar=1.00). However, a moderate decrease in indicators is observed on the validation set (R² = 0.92, RMSE = 2.75, MAE = 1.03), which still indicates a high generalizing ability with minimal risk of overfitting. At the same time, the Stacking_v2 model outperforms XGBoost in several validation metrics (R² = 0.98, RMSE = 1.23, MAE = 0.90, MAPE = 3.85), demonstrating stable performance and adaptability to complex data structures. This is achieved through the use of powerful base models (CatBoost, LightGBM, ExtraTrees) in combination with Ridge meta-regression, which reduces overfitting and accounts for the multicollinearity of features. Linear regression yielded the worst results among all the tested models, which is explained by its inability to accurately reflect the complex nonlinear dependencies between biochemical and behavioral parameters. Low R² values (0.48 in training and 0.42 in validation), high RMSE and MAE values, as well as a significant percentage of mean absolute error (MAPE), confirm its limited predictive capabilities in medical data. Thus, the set of tests and metrics performed supports the choice of Stacking_v2 as the main predictive model. This architecture provides an optimal balance between accuracy, interpretability, and resistance to overfitting, which is especially important when predicting aspartate aminotransferase levels in screening and clinical studies.
3.1. Importance of Features, Their Interactions, and Correlations
Figure 10 shows a comparative matrix of feature significance using the linear correlation, mutual information, and SHAP methods (for XGBoost and Random Forest), reflecting the contribution of variables to predicting the AST level. The most significant in all approaches were gamma-glutamyl transferase (LBXSGTSI), ferritin (LBXFER), and lactate dehydrogenase (LBXSLDSI), indicating their key role in the biochemical assessment of liver function. Also, anthropometric parameters such as height (BMХHT) and weight (BMХWT) showed high predictive potential, which may be associated with metabolic load.
Moderate significance is observed for parameters such as physical activity level (PAD615), low-density lipoproteins (LDL), as well as several behavioral and biochemical parameters (e.g., ALQ130, LBXCRP, LBXSBU). The least informative variables were RIAGENDR (gender), LBXHGB (hemoglobin), and LBXCRP (hs-CRP), which demonstrated low or negative significance values in most methods, indicating their weak association with AST levels in this population. Visualization of the differences between methods revealed that SHAP (especially for XGBoost) emphasizes the significance of individual biomarkers, such as LBXSGTSI and LBXFER. At the same time, mutual information confirms their relevance from the standpoint of nonlinear dependencies. Linear correlation underestimates the role of markers sensitive to nonlinearity but also confirms the significance of LBXSGTSI and LBXFER. Taken together, this allows us to conclude that the main predictors of AST are markers of liver cytolysis (LBXSGTSI, LBXSLDSI), metabolic parameters (LBXFER), and anthropometric parameters (BMХWT, BMХHT). The consistency of results between methods increases the reliability of the identified associations and confirms their practical value for screening and clinical use.
Figure 11 shows a bee swarm plot of SHAP values demonstrating the contribution of individual features to predicting aspartate aminotransferase (AST) levels using the XGBoost model. The leading predictor is LBXSGTSI (gamma-glutamyl transferase), where high feature values are associated with increased AST, emphasizing its role as a key biomarker of liver cell lysis. Ferritin (LBXFER) and anthropometric parameters (height and weight), reflecting metabolic load, also have a significant impact. The physical activity parameter (PAD615) is positively associated with AST in some cases, which may be due to physiological adaptations or microdamage. An average contribution is observed for LDH, LDL, and hs-CRP, while features such as gender, creatinine, and some biochemical parameters have a minimal impact. This confirms that AST variability in the NHANES cohort is predominantly determined by liver function, metabolism, and individual physiological characteristics.
Overall, the visualization confirms that a combination makes the most significant contribution to AST variability of liver and metabolic markers, as well as parameters characterizing inflammation and lifestyle. The high dispersion of SHAP values for the leading markers emphasizes their importance for risk stratification and the potential for inclusion in clinical predictive models. Figure 12 shows a diagram of the average modulus of the SHAP value for each feature, which allows us to rank their contribution to the prediction of aspartate aminotransferase (AST) levels by the XGBoost model. The higher the value of the column, the greater the average contribution (importance) of this feature to the final model.
Key findings from the mean SHAP ranking of features indicate that the most significant predictor of aspartate aminotransferase (AST) level is LBXSGTSI, specifically gamma-glutamyl transferase (GGT). This indicator consistently occupies a leading position, which confirms its clinical significance as a sensitive and specific marker of liver cytolysis. Ferritin (LBXFER) and anthropometric parameters (height - BMXHT, weight - BMXWT) also make a significant contribution, reflecting the impact of metabolic disorders and obesity on AST activity. Physical activity (PAD615) demonstrates a pronounced effect, which may be associated with both physiological adaptations of muscle tissue and potential damage that occurs during intense exercise. The following factors are most significant: LDH (LBXSLDSI), low-density lipoproteins (LBDLDL), the inflammatory marker hs-CRP (LBXCRP), leukocytes (LBXWBCSI), and the level of alcohol consumption (ALQ130), which indicate a complex regulation of AST, involving metabolic, inflammatory, and behavioral factors. Less significant were indicators such as alkaline phosphatase (LBXSAPSI), uric acid (LBXSUA), age (RIDAGEYR), creatinine (LBXSCR), and sex (RIAGENDR), which more informative variables may have influenced in the multifactorial model. The overall analysis confirms that the key determinants of AST variability are biochemical markers reflecting metabolic and inflammatory status, as well as physical activity indicators, which is consistent with the modern concept of risk stratification and interpretation of liver enzyme activities.
3.2. SHAP Interactions
Figure 13 illustrates the evaluation of the top 10 pairwise feature interactions, as determined by SHAP interaction values.
SHAP interaction analysis revealed that the most significant contributions to the AST level prediction were made by the BMXWT × LBXSGTSI and LBXSGTSI × BMXWT trait pairs (contribution > 0.19), which combined body weight and gamma-glutamyl transferase activity —key markers of metabolic and liver disorders. Significant interactions were also observed between LBXSGTSI and LBXSLDSI (~0.12), reflecting the synergistic effect of cytolytic enzymes. The LBXGLU × LBXFER interaction (~0.09) indicated a relationship between carbohydrate metabolism disorders and iron-containing proteins with AST activity. Less pronounced but significant pairs included LBXSBU, LBXFER, and BMXHT, emphasizing the importance of careful consideration of even secondary biomarkers. Overall, the identified interactions enhance the interpretability of the model and demonstrate the multifactorial nature of AST regulation.
3.3. Correlation Analysis
Figure 14 shows the matrix of robust correlations between AST and the studied biochemical and clinical markers. The matrix of robust correlations was calculated using four different methods: Spearman, Kendall, DistanceCorr, and MICe. The highest positive correlations with AST are observed for ferritin (LBXFER: 0.35 by DistanceCorr, 0.32 by Spearman), gamma-glutamyl transferase (LBXSGTSI: 0.42 by DistanceCorr, 0.35 by MICe) and lactate dehydrogenase (LBXSLDSI: 0.33 by DistanceCorr, 0.30 by MICe). These results reflect the established clinical relationship between cytolysis markers and AST levels, confirming their crucial role in diagnosing and monitoring liver conditions.
Pronounced correlations are also observed for hemoglobin (LBXHGB: 0.41 by MICe), which is probably due to its indirect effect on tissue respiration and metabolism in the liver. Negative correlations were recorded for parameters such as C-reactive protein (LBXCRP: -0.23 by Spearman), which may indicate complex relationships between inflammation and enzymatic activity of the liver, as well as gender (RIAGENDR: -0.22 by Spearman), which reflects physiological differences between men and women in the structure and functioning of the liver. In general, the markers of liver cytolysis, metabolic metabolism, and inflammation were the most informative in terms of correlations. This emphasizes the need for careful consideration of these indicators when constructing prognostic models of AST activity and also indicates a high biological validity of the selected features.
3.4. Clustering and Dendrogram
Figure 15 shows a dendrogram (Feature + AST Dendrogram, Ward Linkage) showing the hierarchical structure of relationships between the main features and the AST level obtained using the Ward method. The vertical axis includes all biomarkers, as well as demographic and behavioral variables. The horizontal axis represents the distance between clusters (ward linkage distance), allowing you to assess their degree of similarity visually.
The dendrogram analysis demonstrates the clustering of features corresponding to their biological and clinical nature. In the lower part, a cluster is revealed that unites biochemical markers of enzymatic activity and cellular damage (LBXSGTSI, LBXSASSI, LBXSLDSI, LBXFER), reflecting the integrative role of AST in assessing both hepatic and systemic cytolysis processes. This group is especially informative for the diagnosis of diseases accompanied by tissue necrosis, including both hematological and cardiac pathologies. The second large cluster includes metabolic and anthropometric indicators (BMXWT, BMXHT, LBDLDL), as well as biomarkers of chronic inflammation and metabolic disorders (LBXSUA, LBXHGB, LBXCRP), emphasizing the systemic effect of lipid and protein metabolism on the AST level. The third cluster combines behavioral and demographic variables (PAD615, ALQ130, RIAGENDR, RIDAGEYR), as well as glucose and related parameters (LBXGLU, LBXSAPSI, LBXWBCSI), highlighting the importance of lifestyle, age, and carbohydrate metabolism in regulating enzyme activity. Minimal distances between cytolysis markers indicate their close relationship and joint contribution to AST variability. More distant groups of features, despite a smaller relationship, also make a significant contribution due to metabolic, inflammatory, and behavioral factors. Thus, the dendrogram structure visualizes the multisystem nature of AST regulation, where the most crucial influence is exerted by enzymatic indicators of tissue damage, followed by metabolic and behavioral parameters. The resulting clusters can be used for more accurate stratification of patients and the construction of interpretable prognostic models in clinical practice.
3.5. Assessing Interpretability and Calibration
Figure 16 shows the calibration plot of the LGBM model, which allows us to assess the agreement between the predicted and observed AST levels by quantiles. The dotted line represents a perfect match between the predictions and observations, while the actual calibration line (blue line) displays the model's actual results. In most intervals of predicted values, there is a relatively high degree of agreement between the prediction and the exact values, indicating good calibration of the model in the range of low and medium AST values. However, in the region of high values (from 30 to 40), there is some discrepancy, where the actual values exceed the expected ones. This indicates a tendency of the LGBM model to underpredict patients with the most pronounced AST deviations slightly. The reason for this behavior may be both the relative rarity of high AST values in the training set and the difficulty of modeling extreme physiological states.
Overall, the graph confirms the adequacy of the model calibration for most clinically significant AST intervals, which is essential for the practical application of the prognostic model in population studies and medical screenings. Particular attention should be paid to further improving the model by adjusting predictions in the tails of the distribution, thereby improving the accuracy of the forecast for patients with atypically high enzyme values.
3.6. Predicting the Risk of Exceeding the AST Threshold
Figure 17 illustrates the ROC curve for the binary classification problem involving patients with an AST level of≥ 40 U/L. The area under the curve (AUC) is 1.000, which reflects the maximum possible discriminatory ability of the model. This result means that the model accurately distinguishes patients with pathologically elevated AST values from all other cases in the validation set. Binarization (AST ≥ 40 U/L) allowed us to test the diagnostic suitability of the models using the standard AUROC and PR-AUC metrics. The ROC curve line almost repeats the upper and left edges of the graph, indicating the absence of false-positive and false-negative decisions at the selected classification threshold. This level of prediction quality, on the one hand, demonstrates the model's high ability to identify clinically significant cases of elevated AST. On the other hand, it may indicate potential overfitting on the subsample under consideration or high homogeneity of the data structure for this feature. A key practical conclusion is that, with the current configuration of features and training set, the model can be used for screening and early detection of patients with severe liver dysfunction, as indicated by AST. To confirm the sustainability of this result, it is advisable to conduct validation on external independent cohorts.
The obtained AUC value of 1.000 requires careful interpretation, as such ideal values are scarce in clinical practice and may indicate features of the data structure or model overfitting. Possible reasons include the high homogeneity of the validation sample or the presence of pronounced features that divide groups by the AST level. To confirm the stability of the model, additional checks are necessary, including cross-validation, repeated random partitioning, and testing on external data. Nevertheless, the high sensitivity and specificity of the model open up prospects for its application not only in diagnostics but also in monitoring therapy and creating interpretable decision support systems in hepatology.
Figure 18 shows the Precision-Recall curve for the binary classification problem of patients with AST ≥ 40 U/L, with an average area under the curve (AUC) of 1.000. This result indicates 100% accuracy and recall in identifying positive cases among the entire sample.
A high AP (Average Precision) value indicates the model's exceptional ability to simultaneously achieve maximum recall (recall = 1.0) and accuracy (precision = 1.0), suggesting a complete absence of type I and type II errors on the validation set. Such a combination is scarce and typically results from the high information content of features, a low noise level in the data, or the clear separability of classes. The characteristic shape of the Precision-Recall curve with a sharp transition confirms the absence of a trade-off between accuracy and recall, which may also be due to a limited sample size or class imbalance. Such a result requires additional validation: retesting on independent data, cross-validation, and assessment of robustness to changes in the sample structure. Despite the seeming ideality, such high indicators should be interpreted with caution, especially in the context of medical problems, where overfitting can lead to false conclusions. Nevertheless, a high AP metric indicates the model's potential for screening and early detection of patients with abnormally high AST levels.
3.7. Mediator Analysis
Mediation analysis with ferritin (LBXFER) as a key mediator showed that its contribution to AST change is realized mainly in a direct way, without significant indirect influence through other routine markers. Table 4 presents the following notations: Direct reflects the direct impact of the mediator on the AST level, Indirect is an indirect or mediated influence through intermediate variables, Total is a combined effect, including both direct and indirect influence, sig indicates the statistical significance of the impact (significant values are highlighted in bold), CI is a 95% confidence interval characterizing the reliability and stability of the assessment.
The results of the mediator analysis indicate that the most pronounced direct and indirect effects on AST levels are exerted by gamma-glutamyl transferase (LBXSGTSI), growth (BMXHT), urea (LBXSBU), alkaline phosphatase (LBXSLDSI), and glucose (LBXGLU). Ferritin (LBXFER) makes a significant contribution, primarily through the direct pathway, which is consistent with its established role as a marker of systemic inflammation and cellular cytolysis. For most other biomarkers, the indirect effect is weak or absent, which emphasizes the dominance of direct impacts in the formation of AST activity. The choice of mediators was motivated by several reasons. First, only statistically significant mediators were included in the analysis: the selection was carried out according to the criterion of the presence of at least one considerable pathway (direct, indirect, or total), with a p-value less than 0.05 and a confidence interval not crossing zero. Secondly, the selected features were characterized by a high degree of association with AST, both according to the ranking of feature importance (SHAP, correlation) and according to the results of the mediator analysis itself. Among them were ferritin, gamma-GT, LDH, urea, glucose, height, and physical activity. Thirdly, mediators with no significant effect were excluded from the final table: features for which all paths were insignificant (p > 0.05) or made a minimal contribution were not included to avoid excessive detailing.
4. Discussion
In this study, a comprehensive analysis of the factors determining aspartate aminotransferase (AST) activity was performed using modern machine learning methods, mediator analysis, and assessment of stable correlations. The results obtained enable a thorough characterization of biochemical and demographic predictors, their individual and joint contributions to AST variability, and the validation of the stability of the constructed models, including key AST predictors and their biological significance. The feature importance results for various algorithms (XGBoost, SHAP, RF SHAP, and Mutual Info) consistently indicate a group of biochemical markers and metabolic parameters as the primary determinants of AST activity. The most pronounced effect was demonstrated by gamma-glutamyl transferase (LBXSGTSI), ferritin (LBXFER), height (BMXHT), body weight (BMXWT), as well as LDH (LBXSLDSI) and urea (LBXSBU) activity parameters. These data are confirmed by both the generalized importance assessments and the analysis of feature interactions (SHAP interactions), where the most significant pairs included LBXSGTSI, BMXWT, and LBXSLDSI. Such an important structure is consistent with the biological role of AST as an integral enzymatic marker of hepatocyte damage. It reflects the contribution of the liver and metabolic pathways to the variability of its level. The presence of anthropometric parameters (height, body weight) among the top predictors highlights the importance of considering physical parameters when interpreting AST. It demonstrates the advantage of multivariate analysis, particularly in terms of correlation structure. The results of the stable correlation analysis (Spearman, Kendall, DistanceCorr, MICe) confirm that the strongest positive associations with AST are found for LBXSGTSI, LBXFER, LBXSLDSI, LBXSBU, and several biochemical metabolites (LBXGLU, LBXHGB). At the same time, negative and low correlation links are characteristic of demographic characteristics (RIAGENDR, RIDAGEYR), which indicates the predominance of biochemical factors over socio-demographic ones.
Mediator analysis. Mediator analysis revealed that ferritin (LBXFER) influences AST predominantly via the direct pathway, consistent with its function as an indicator of hepatocyte cytolysis and iron stores. For several other predictors (LBXSGTSI, BMXHT, LBXSLDSI, LBXGLU, LBXSBU), statistically significant direct and indirect effects were observed, indicating multifaceted and indirect pathways of AST level regulation. A detailed mediator analysis table covers all tested features, allowing one to verify the absence of false positive effects. None of the nonspecific or demographic mediators showed a significant total or indirect effect, confirming the specificity of the identified associations.
Quality of forecast models. A comparison of models using R², RMSE, MAE, MAPE, and Explained Variance metrics demonstrated that XGBoost and the Stacking_v2 ensemble model provide the highest accuracy and stability of predictions on both the training and validation sets, with minimal signs of overfitting. Simpler models (Linear Regression, Random Forest) are significantly inferior in accuracy and stability. The weakest results were recorded for the Stacking_v3 version, which is confirmed by an increase in errors during validation. ROC and Precision-Recall curves for the task of classifying increased AST (≥ 40 U/L) confirm excellent diagnostic properties, with AUC = 1.0 and AP = 1.0, indicating the absolute sensitivity and specificity of the model in this set. Additional calibration (LGBM) demonstrates the correspondence between the predicted and observed values across the entire quantile scale, thereby excluding systematic errors and biases.
Assessment of stability and transferability. The results of cluster and dendrogram analysis indicate a clear grouping of key predictors along a single functional axis, emphasizing their integration into the overall biological network. The absence of significant associations among random or low-specific features indicates the stability of the results to random variations and overfitting.
Limitations. Only available laboratory and anthropometric data were used in this study. Some weak correlations or nonspecific indirect effects noted in the mediator analysis did not reach statistical significance, which speaks in favor of the rigor of the findings. External validation on independent cohort samples is recommended for further generalization of the results
4. Conclusions
This work aimed to build an interpretable and highly accurate model for predicting aspartate aminotransferase levels based on a set of clinical, biochemical, and behavioral data. During the experiments, both basic (linear regression) and advanced ensemble algorithms (Random Forest, XGBoost, CatBoost), including three stacking options, were tested. The most stable and accurate results on the validation set were achieved by the Stacking_v2 model, which was built on a combination of CatBoost, LGBM, and ExtraTrees with the Ridge metaregressor. Its key metrics were: RMSE = 1.23, MAE = 0.90, MAPE = 3.85%, Explained Variance = 0.98, R² = 0.98. These values exceed the performance of all other models, including XGBoost, which, despite achieving high accuracy (RMSE = 2.75, MAE = 1.03), demonstrated less resistance to overfitting and a sharper decline in quality on independent data. Thus, the Stacking_v2 algorithm was recognized as the best solution for achieving the goal, providing an optimal balance between accuracy, interpretability, and stability of the forecast. Its use allows for taking into account complex, nonlinear relationships between features, thereby minimizing errors in new data. The results obtained confirm the possibility of using this approach in precision medicine, including risk stratification, monitoring enzyme activity, and supporting clinical decisions when working with AST indicators.
Author Contributions
Conceptualization, N.M., A.K., K.K., A.I., G.Zh., Z.A., J.T., Q.R., and Zh.K.; methodology, K.K., A.I., G.Zh., Z.A., and J.T.; software, A.I. and K.K.; validation, G.Zh., Z.A., J.T., and A.I.; formal analysis, K.K., G.Zh., and Z.A.; investigation, N.M., A.K., K.K., A.I., and J.T.; resources, N.M., A.K., and K.K.; data curation, A.I. and Z.A.; writing—original draft preparation, A.K., K.K., and A.I.; writing—review and editing, N.M., A.K., and J.T.; visualization, K.K. and G.Zh.; supervision, N.M. and A.K.; project administration, A.K. and N.M.; funding acquisition, Q.R. and Zh.K. All authors have read and agreed to the published version of the manuscript.
Funding
The author(s) declare that financial support was received for the research, authorship, and/or publication of this article. This study was funded by the Committee of Science of the Ministry of Science and Higher Education of the Republic of Kazakhstan (Grant No. AP19678041).
Institutional Review Board Statement
Not applicable.
Informed Consent Statement
Not applicable.
Data Availability Statement
Dataset available on request from the authors.
Conflicts of Interest
The authors declare no conflicts of interest.
Abbreviations
The following abbreviations are used in this manuscript:
| AST | Aspartate Aminotransferase |
| ALP | Alkaline Phosphatase |
| γ-GT | Gamma-Glutamyl Transferase |
| LDH | Lactate Dehydrogenase |
| hs-CRP | High-sensitivity C-Reactive Protein |
| BMI | Body Mass Index |
| MAE | Mean Absolute Error |
| RMSE | Root Mean Square Error |
| R² | Coefficient of Determination |
| MAPE | Mean Absolute Percentage Error |
| SHAP | SHapley Additive exPlanations |
| NHANES | National Health and Nutrition Examination Survey |
| RF | Random Forest |
| XGBoost | Extreme Gradient Boosting |
| CatBoost | Categorical Boosting |
| LGBM | Light Gradient Boosting Machine |
| MICe | Maximal Information Coefficient (enhanced version) |
| SEQN | Sequence Number (unique identifier in NHANES) |
| AUC | Area Under Curve |
| ROC | Receiver Operating Characteristic |
| PR-AUC | Precision-Recall Area Under Curve |
References
- Zhou, W.; Wang, Y.; Yu, H.; et al. Machine Learning Model Identifies Circulating Biomarkers Associated with Cardiovascular Disease. Sci. Rep. 2024, 14, 77352. [Google Scholar] [CrossRef]
- Roseiro, M.; Henriques, J.; Paredes, S.; Rocha, T.; Sousa, J. An Interpretable Machine Learning Approach to Estimate the Influence of Inflammation Biomarkers on Cardiovascular Risk Assessment. Comput. Methods Programs Biomed. 2023, 230, 107347. [Google Scholar] [CrossRef] [PubMed]
- Lüscher, T.F.; Wenzl, F.A.; D’Ascenzo, F.; Friedman, P.A.; Antoniades, C. Artificial Intelligence in Cardiovascular Medicine: Clinical Applications. Eur. Heart J. 2024, 45, 4291–4304. [Google Scholar] [CrossRef] [PubMed]
- da Costa, C.A.; Zeiser, F.A.; da Rosa Righi, R.; Antunes, R.S.; Alegretti, A.P.; Bertoni, A.P.; Rigo, S.J. Internet of Things and Machine Learning for Smart Healthcare. In IoT and ML for Information Management: A Smart Healthcare. In IoT and ML for Information Management: A Smart Healthcare Perspective; Springer: Singapore, 2024; pp. 95–133. [Google Scholar] [CrossRef]
- Kwak, S.; Lee, H.J.; Kim, S.; Park, J.B.; Lee, S.P.; Kim, H.K.; Kim, Y.J. Machine Learning Reveals Sex-Specific Associations Between Cardiovascular Risk Factors and Incident Atherosclerotic Cardiovascular Disease. Sci. Rep. 2023, 13, 9364. [Google Scholar] [CrossRef]
- Ben-Assuli, O.; Ramon-Gonen, R.; Heart, T.; Jacobi, A.; Klempfner, R. Utilizing Shared Frailty with the Cox Proportional Hazards Regression: Post Discharge Survival Analysis of CHF Patients. J. Biomed. Inform. 2023, 140, 104340. [Google Scholar] [CrossRef]
- Guo, X.; Ma, M.; Zhao, L.; Wu, J.; Lin, Y.; Fei, F.; Ye, B. The Association of Lifestyle with Cardiovascular and All-Cause Mortality Based on Machine Learning: A Prospective Study from the NHANES. BMC Public Health 2025, 25, 319. [Google Scholar] [CrossRef]
- Miyachi, Y.; Ishii, O.; Torigoe, K. Design, Implementation, and Evaluation of the Computer-Aided Clinical Decision Support System Based on Learning-to-Rank: Collaboration Between Physicians and Machine Learning in the Differential Diagnosis Process. BMC Med. Inform. Decis. Mak. 2023, 23, 26. [Google Scholar] [CrossRef]
- Guo, L.; Tahir, A.M.; Zhang, D.; Wang, Z.J.; Ward, R.K. Automatic Medical Report Generation: Methods and Applications. APSIPA Trans. Signal Inf. Process. 2024, 13, e7. [Google Scholar] [CrossRef]
- Mesinovic, M.; Watkinson, P.; Zhu, T. Explainable AI for Clinical Risk Prediction: A Survey of Concepts, Methods, and Modalities. arXiv 2023, arXiv:2308.08407. [Google Scholar] [CrossRef]
- Sharma, P.; Sharma, P.; Sharma, K.; Varma, V.; Patel, V.; Sarvaiya, J.; Shah, K. Revolutionizing Utility of Big Data Analytics in Personalized Cardiovascular Healthcare. Bioengineering 2025, 12, 463. [Google Scholar] [CrossRef]
- Lai, T. Interpretable Medical Imagery Diagnosis with Self-Attentive Transformers: A Review of Explainable AI for Health Care. BioMedInformatics 2024, 4, 113–126. [Google Scholar] [CrossRef]
- Wang, Y.; Ni, B.; Xiao, Y.; Lin, Y.; Jiang, Y.; Zhang, Y. Application of Machine Learning Algorithms to Construct and Validate a Prediction Model for Coronary Heart Disease Risk in Patients with Periodontitis: A Population-Based Study. Front. Cardiovasc. Med. 2023, 10, 1296405. [Google Scholar] [CrossRef] [PubMed]
- Liao, W.; Voldman, J. A Multidatabase ExTRaction PipEline (METRE) for Facile Cross Validation in Critical Care Research. J. Biomed. Inform. 2023, 141, 104356. [Google Scholar] [CrossRef] [PubMed]
- Zhou, X.; Sun, X.; Zhao, H.; Xie, F.; Li, B.; Zhang, J. Biomarker Identification and Risk Assessment of Cardiovascular Disease Based on Untargeted Metabolomics and Machine Learning. Sci. Rep. 2024, 14, 25755. [Google Scholar] [CrossRef]
- Wang, Y.; Liu, L.; Wang, C. Trends in Using Deep Learning Algorithms in Biomedical Prediction Systems. Front. Neurosci. 2023, 17, 1256351. [Google Scholar] [CrossRef]
- Liu, S.; Zhang, J.; Xiang, Y.; Zhou, W.; Xiang, D. A Study of Data Pre-Processing Techniques for Imbalanced Biomedical Data Classification. Int. J. Bioinform. Res. Appl. 2020, 16, 290–318. [Google Scholar] [CrossRef]
- Bumbu, M.G.; Niculae, M.; Ielciu, I.; Hanganu, D.; Oniga, I.; Benedec, D.; Marcus, I. Comprehensive Review of Functional and Nutraceutical Properties of Craterellus cornucopioides (L.) Pers. Nutrients 2024, 16, 831. [Google Scholar] [CrossRef]
- Hu, Q.; Chen, Y.; Zou, D.; He, Z.; Xu, T. Predicting Adverse Drug Event Using Machine Learning Based on Electronic Health Records: A Systematic Review and Meta-Analysis. Front. Pharmacol. 2024, 15, 1497397. [Google Scholar] [CrossRef]
- Zhu, G.; Song, Y.; Lu, Z.; Yi, Q.; Xu, R.; Xie, Y.; Xiang, Y. Machine Learning Models for Predicting Metabolic Dysfunction-Associated Steatotic Liver Disease Prevalence Using Basic Demographic and Clinical Characteristics. J. Transl. Med. 2025, 23, 381. [Google Scholar] [CrossRef]
- Yang, B.; Lu, H.; Ran, Y. Advancing Non-Alcoholic Fatty Liver Disease Prediction: A Comprehensive Machine Learning Approach Integrating SHAP Interpretability and Multi-Cohort Validation. Front. Endocrinol. 2024, 15, 1450317. [Google Scholar] [CrossRef]
- Wang, Z.; Gu, Y.; Huang, L.; Liu, S.; Chen, Q.; Yang, Y.; Ning, W. Construction of Machine Learning Diagnostic Models for Cardiovascular Pan-Disease Based on Blood Routine and Biochemical Detection Data. Cardiovasc. Diabetol. 2024, 23, 351. [Google Scholar] [CrossRef] [PubMed]
- Ali, G.; Mijwil, M.M.; Adamopoulos, I.; Buruga, B.A.; Gök, M.; Sallam, M. Harnessing the Potential of Artificial Intelligence in Managing Viral Hepatitis. Mesopotamian J. Big Data 2024, 2024, 128–163. [Google Scholar] [CrossRef]
- Yang, Y.; Liu, J.; Sun, C.; Shi, Y.; Hsing, J.C.; Kamya, A.; Zhu, S. Nonalcoholic Fatty Liver Disease (NAFLD) Detection and Deep Learning in a Chinese Community-Based Population. Eur. Radiol. 2023, 33, 5894–5906. [Google Scholar] [CrossRef] [PubMed]
- Khaled, O.M.; Elsherif, A.Z.; Salama, A.; Herajy, M.; Elsedimy, E. Evaluating Machine Learning Models for Predictive Analytics of Liver Disease Detection Using Healthcare Big Data. Int. J. Electr. Comput. Eng. 2025, 15, 1162–1174. [Google Scholar] [CrossRef]
- McGettigan, B.M.; Shah, V.H. Every Sheriff Needs a Deputy: Targeting Non-Parenchymal Cells to Treat Hepatic Fibrosis. J. Hepatol. 2024, 81, 20–22. [Google Scholar] [CrossRef]
- Farhadi, S.; Tatullo, S.; Ferrian, F. Comparative Analysis of Ensemble Learning Techniques for Enhanced Fatigue Life Prediction. Sci. Rep. 2025, 15, 11136. [Google Scholar] [CrossRef]
Figure 1.
Stacking v1 architecture.
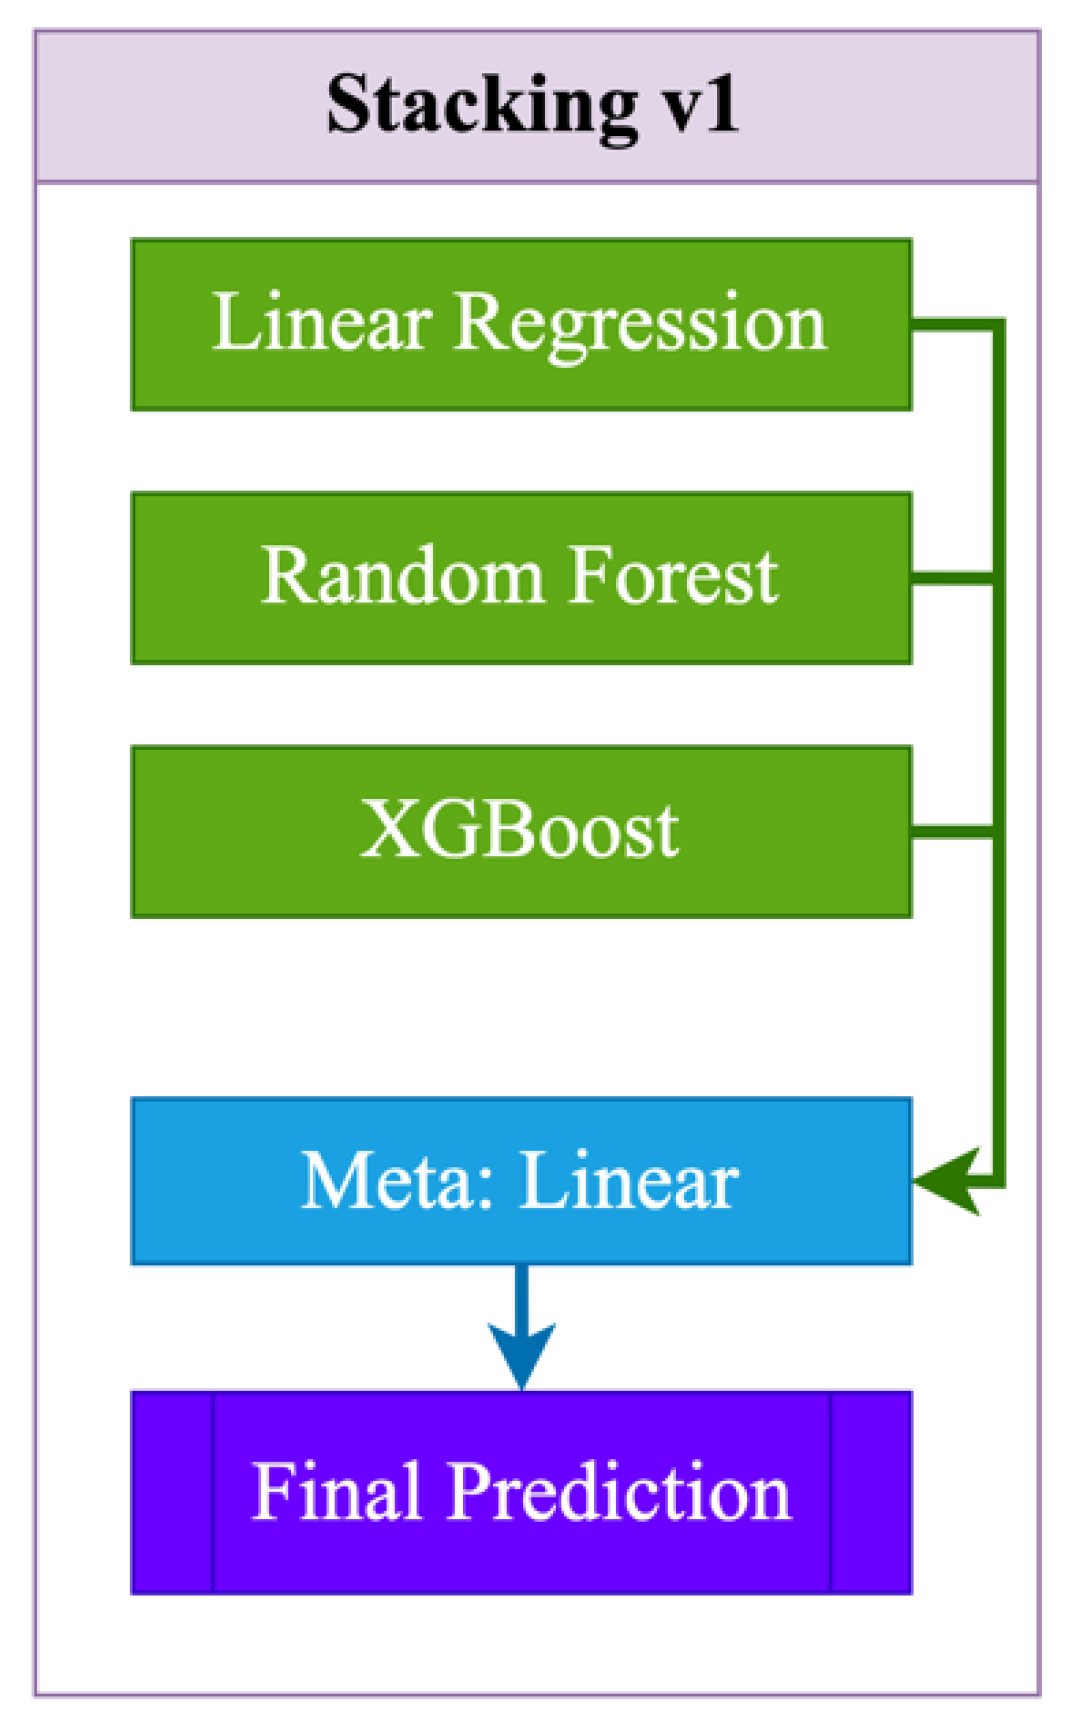
Figure 2.
Stacking v2 architecture.
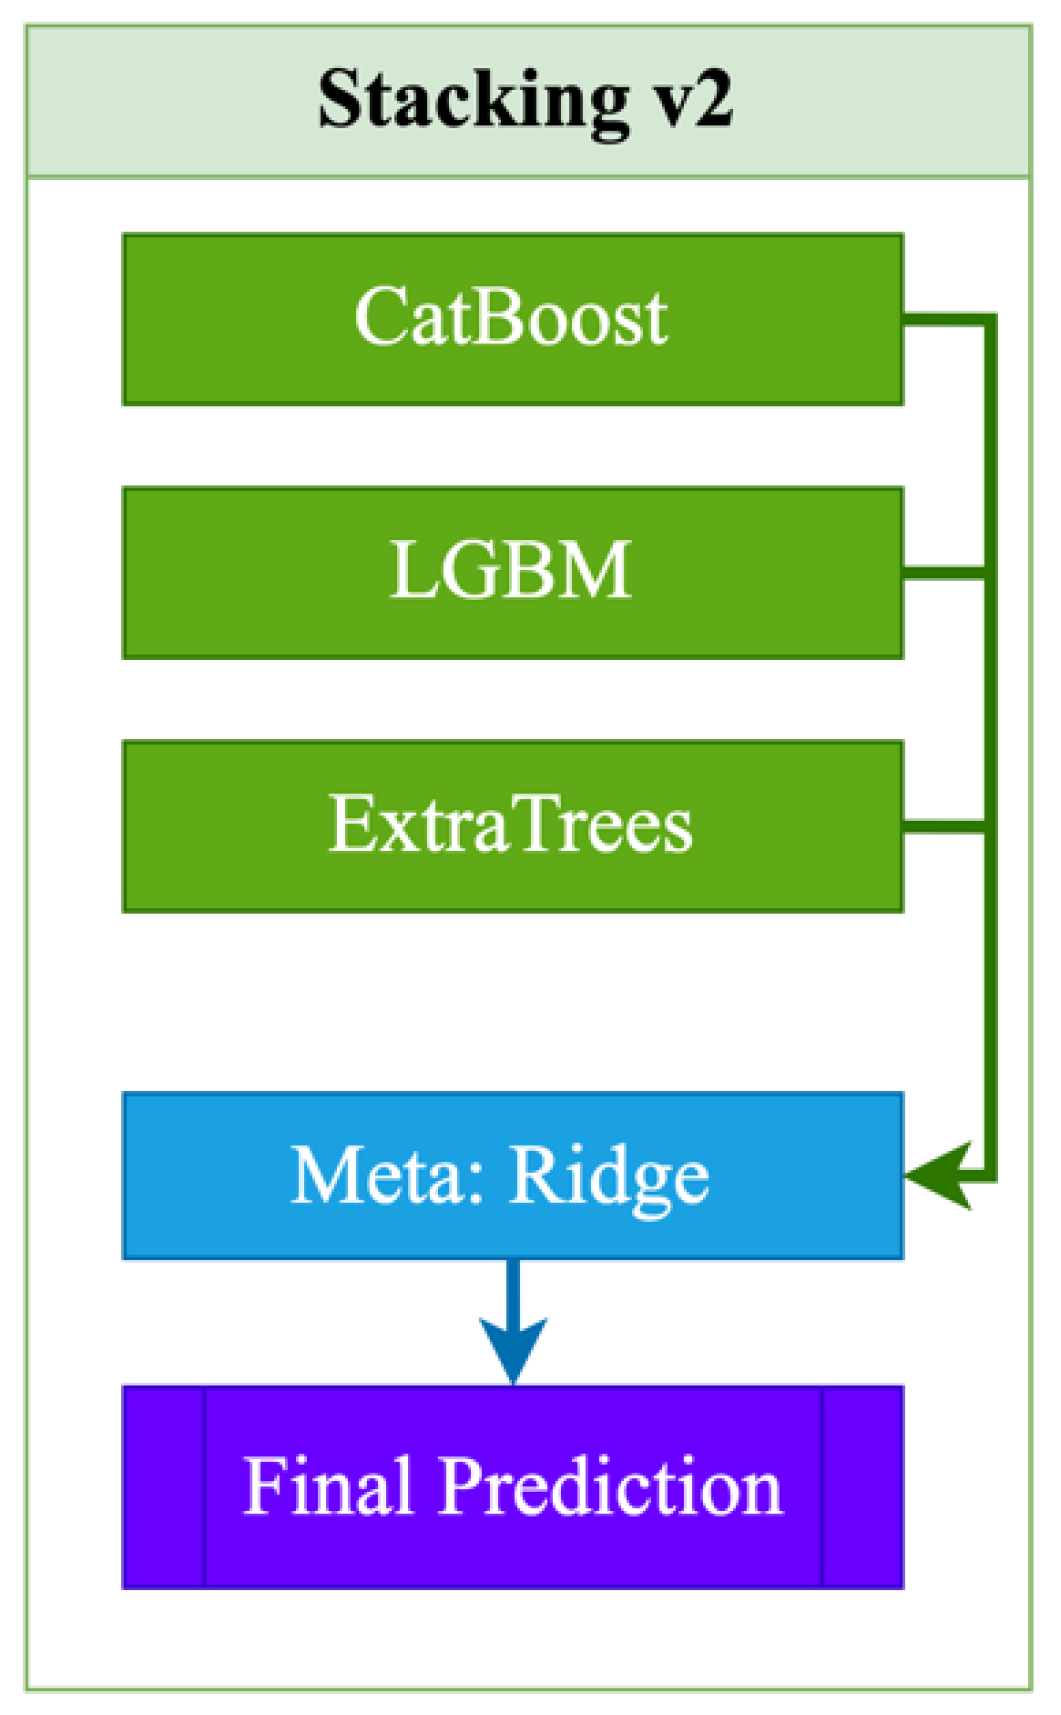
Figure 3.
Stacking v3 architecture.
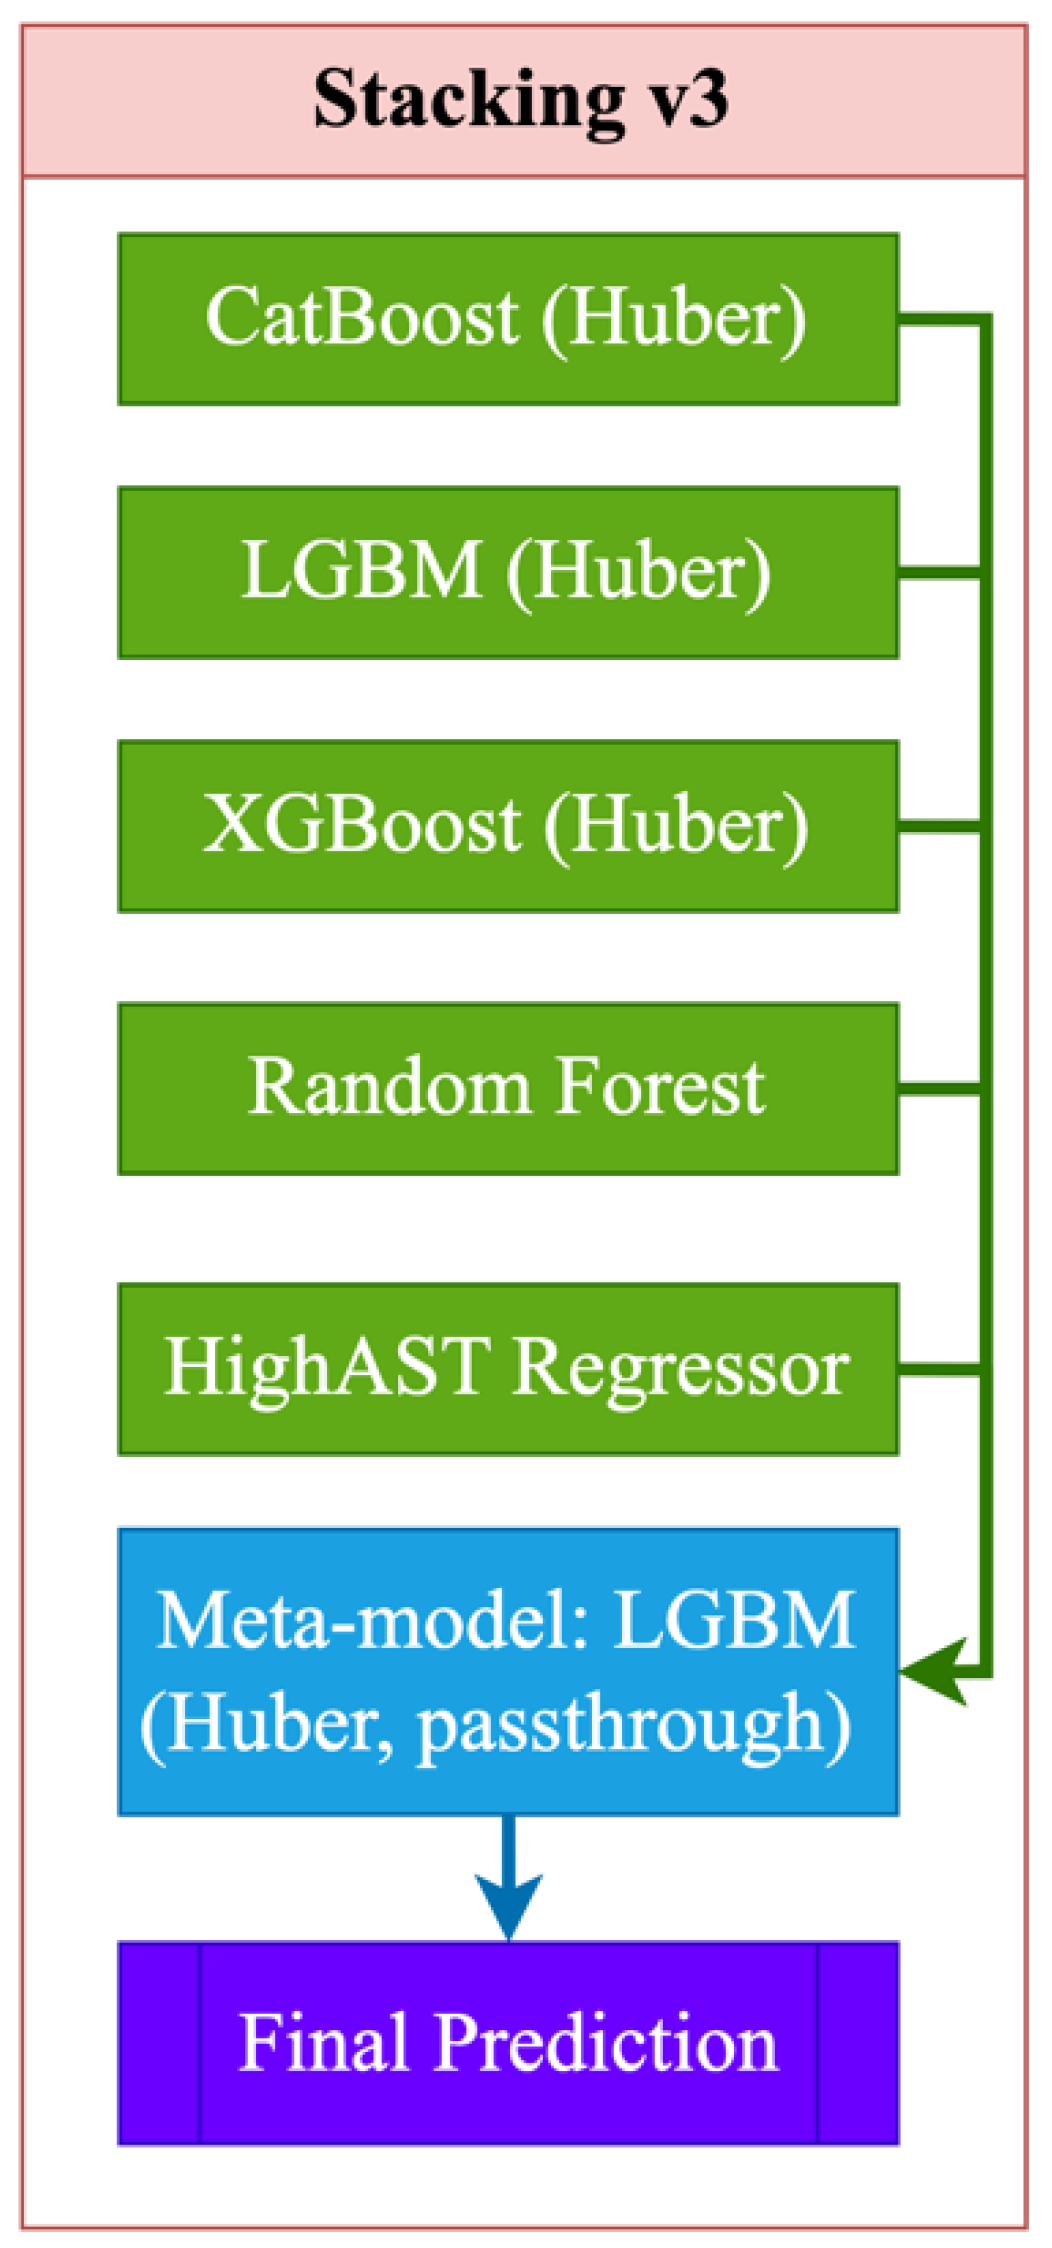
Figure 4.
Algorithm for constructing a prognostic model for aspartate aminotransferase (AST) levels.
Figure 4.
Algorithm for constructing a prognostic model for aspartate aminotransferase (AST) levels.
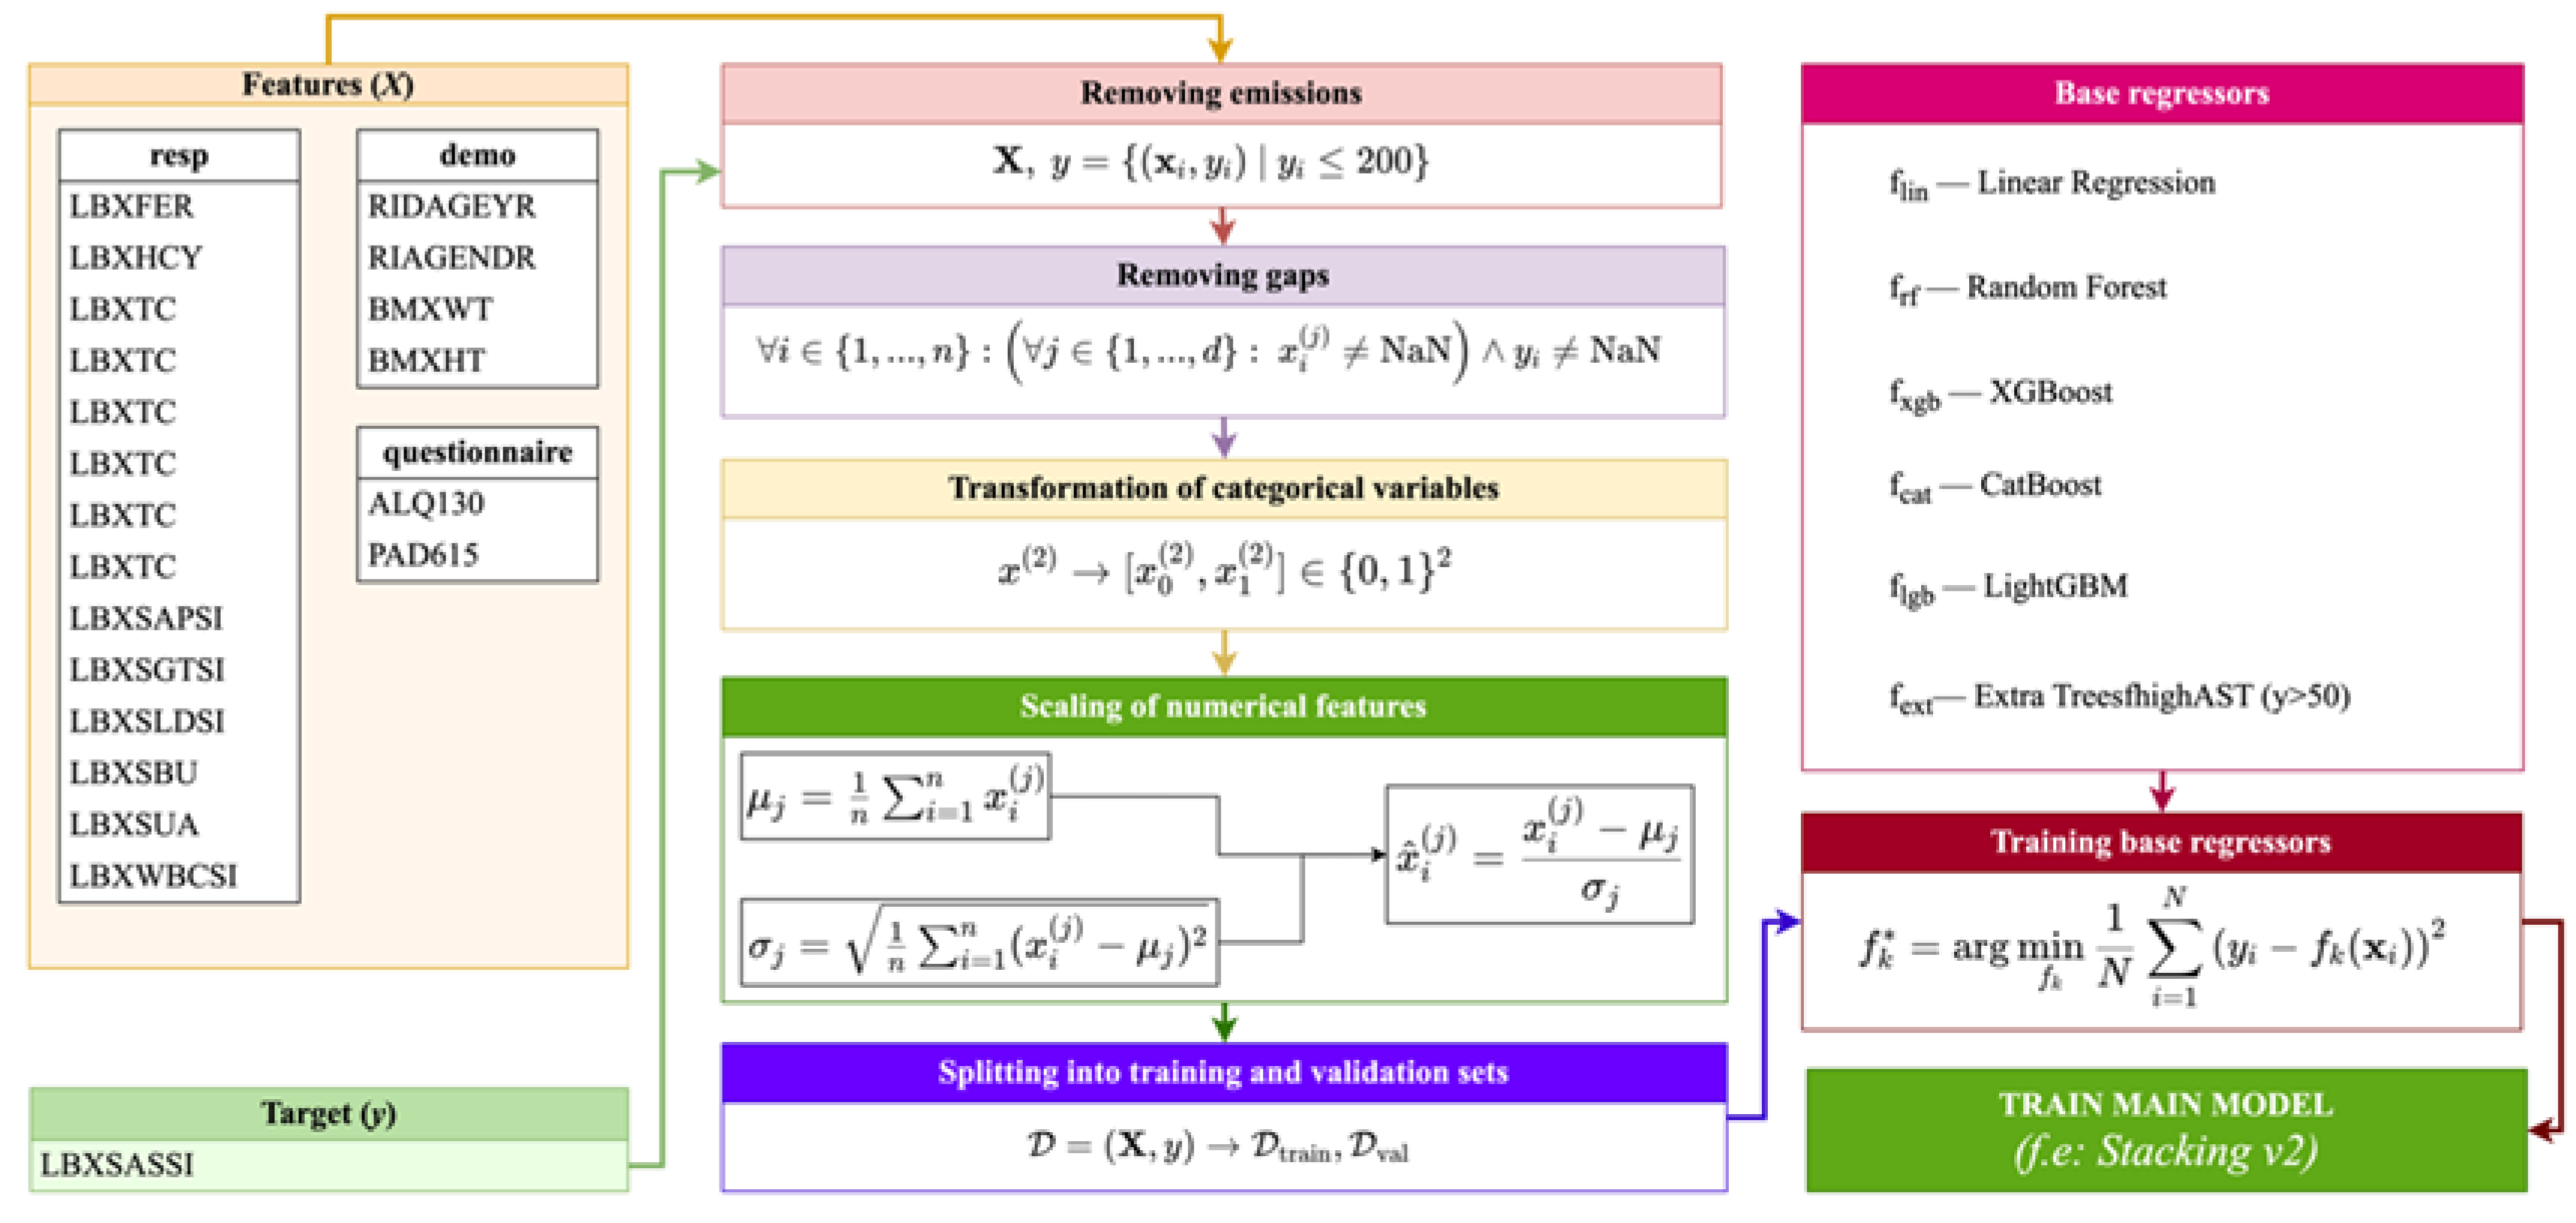
Figure 5.
Comparison of R2 for training and validation sets by models.
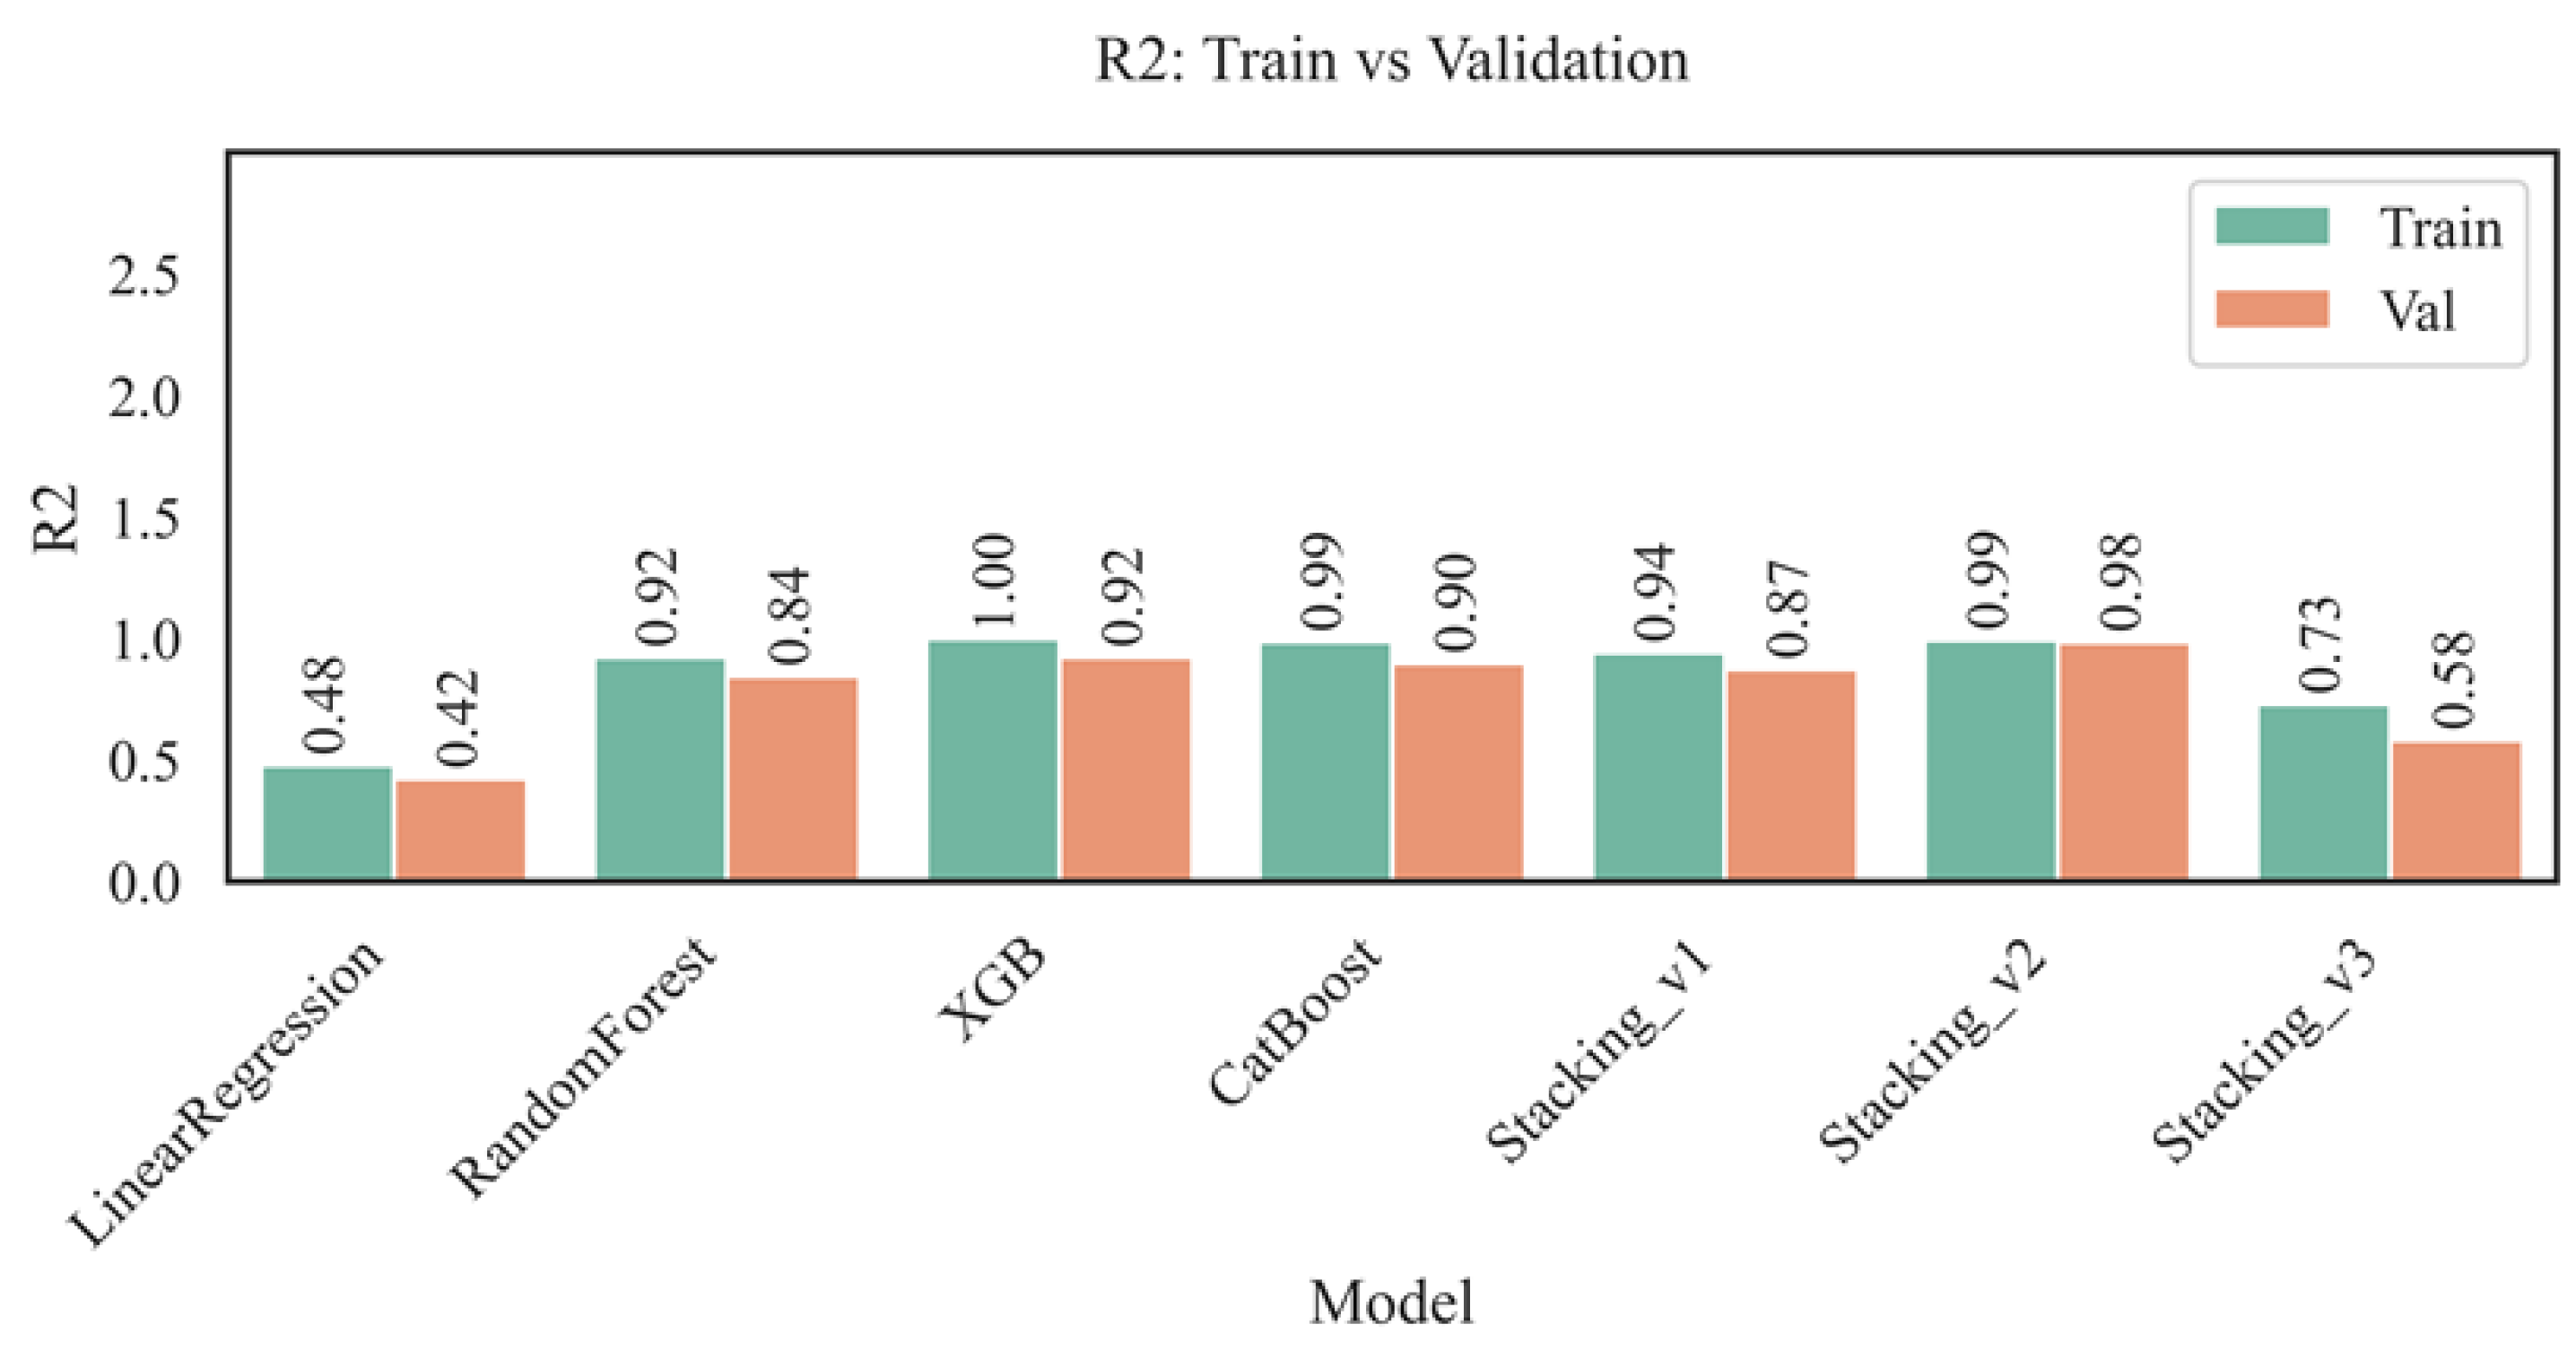
Figure 6.
Comparison of RMSE for training and validation sets.
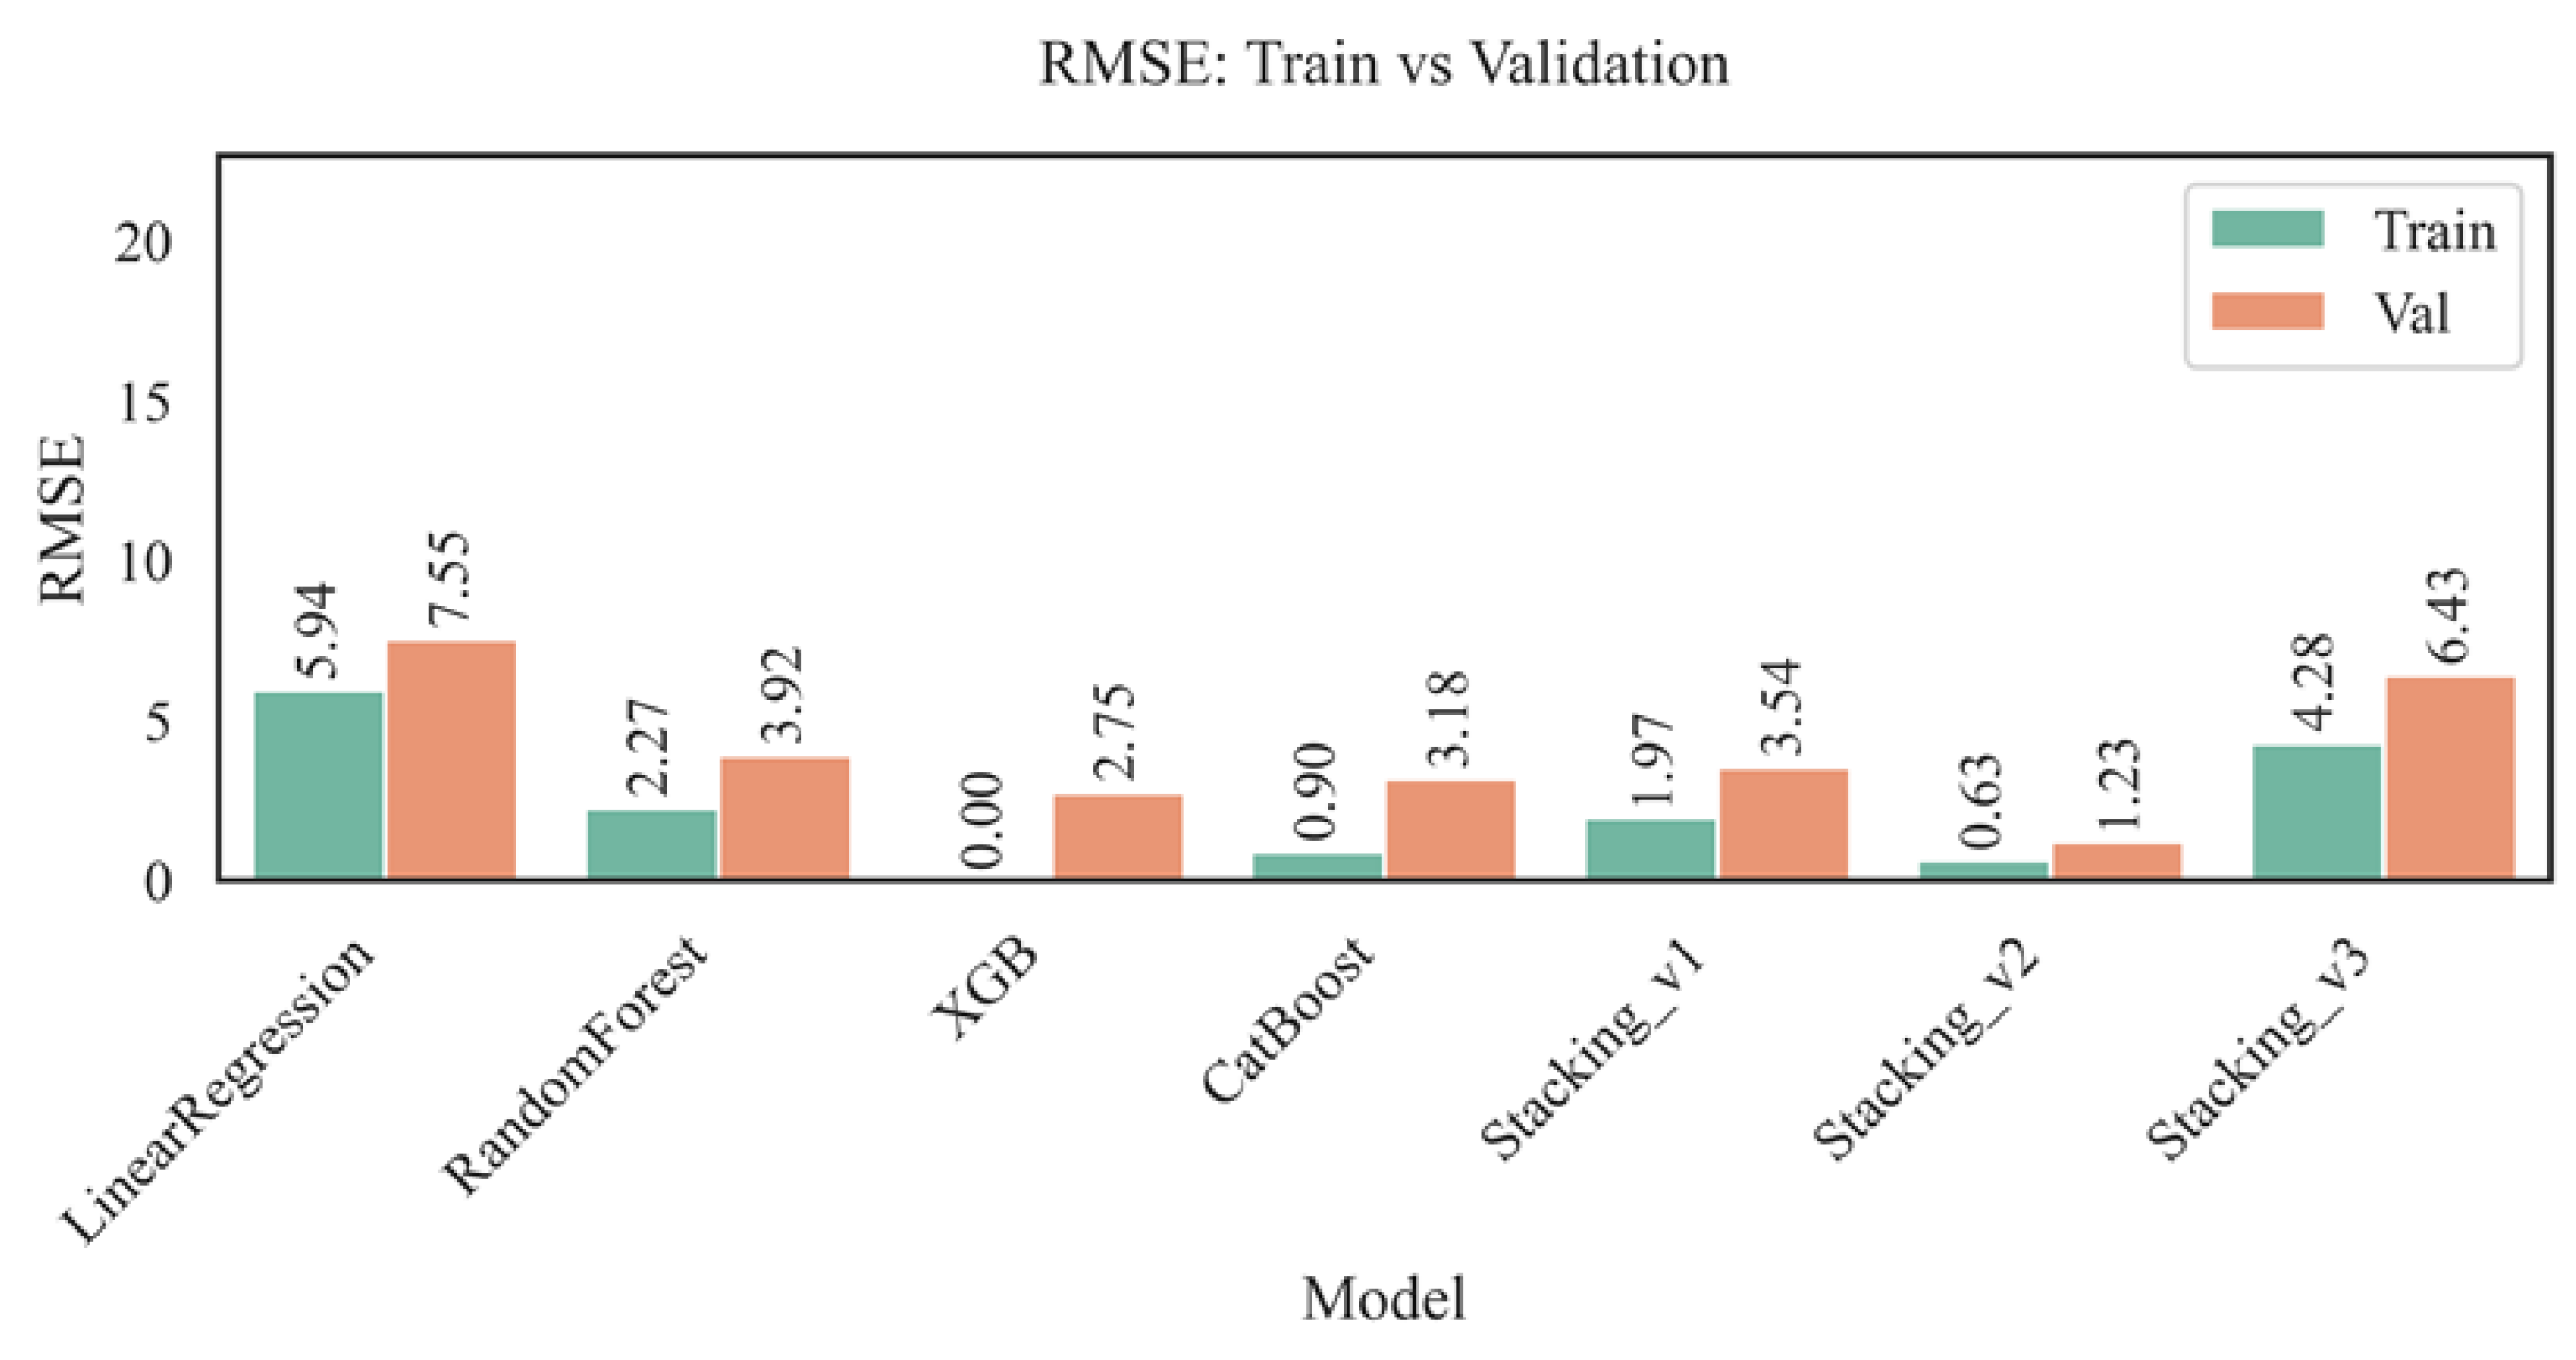
Figure 7.
Comparison of MAE for training and validation sets.
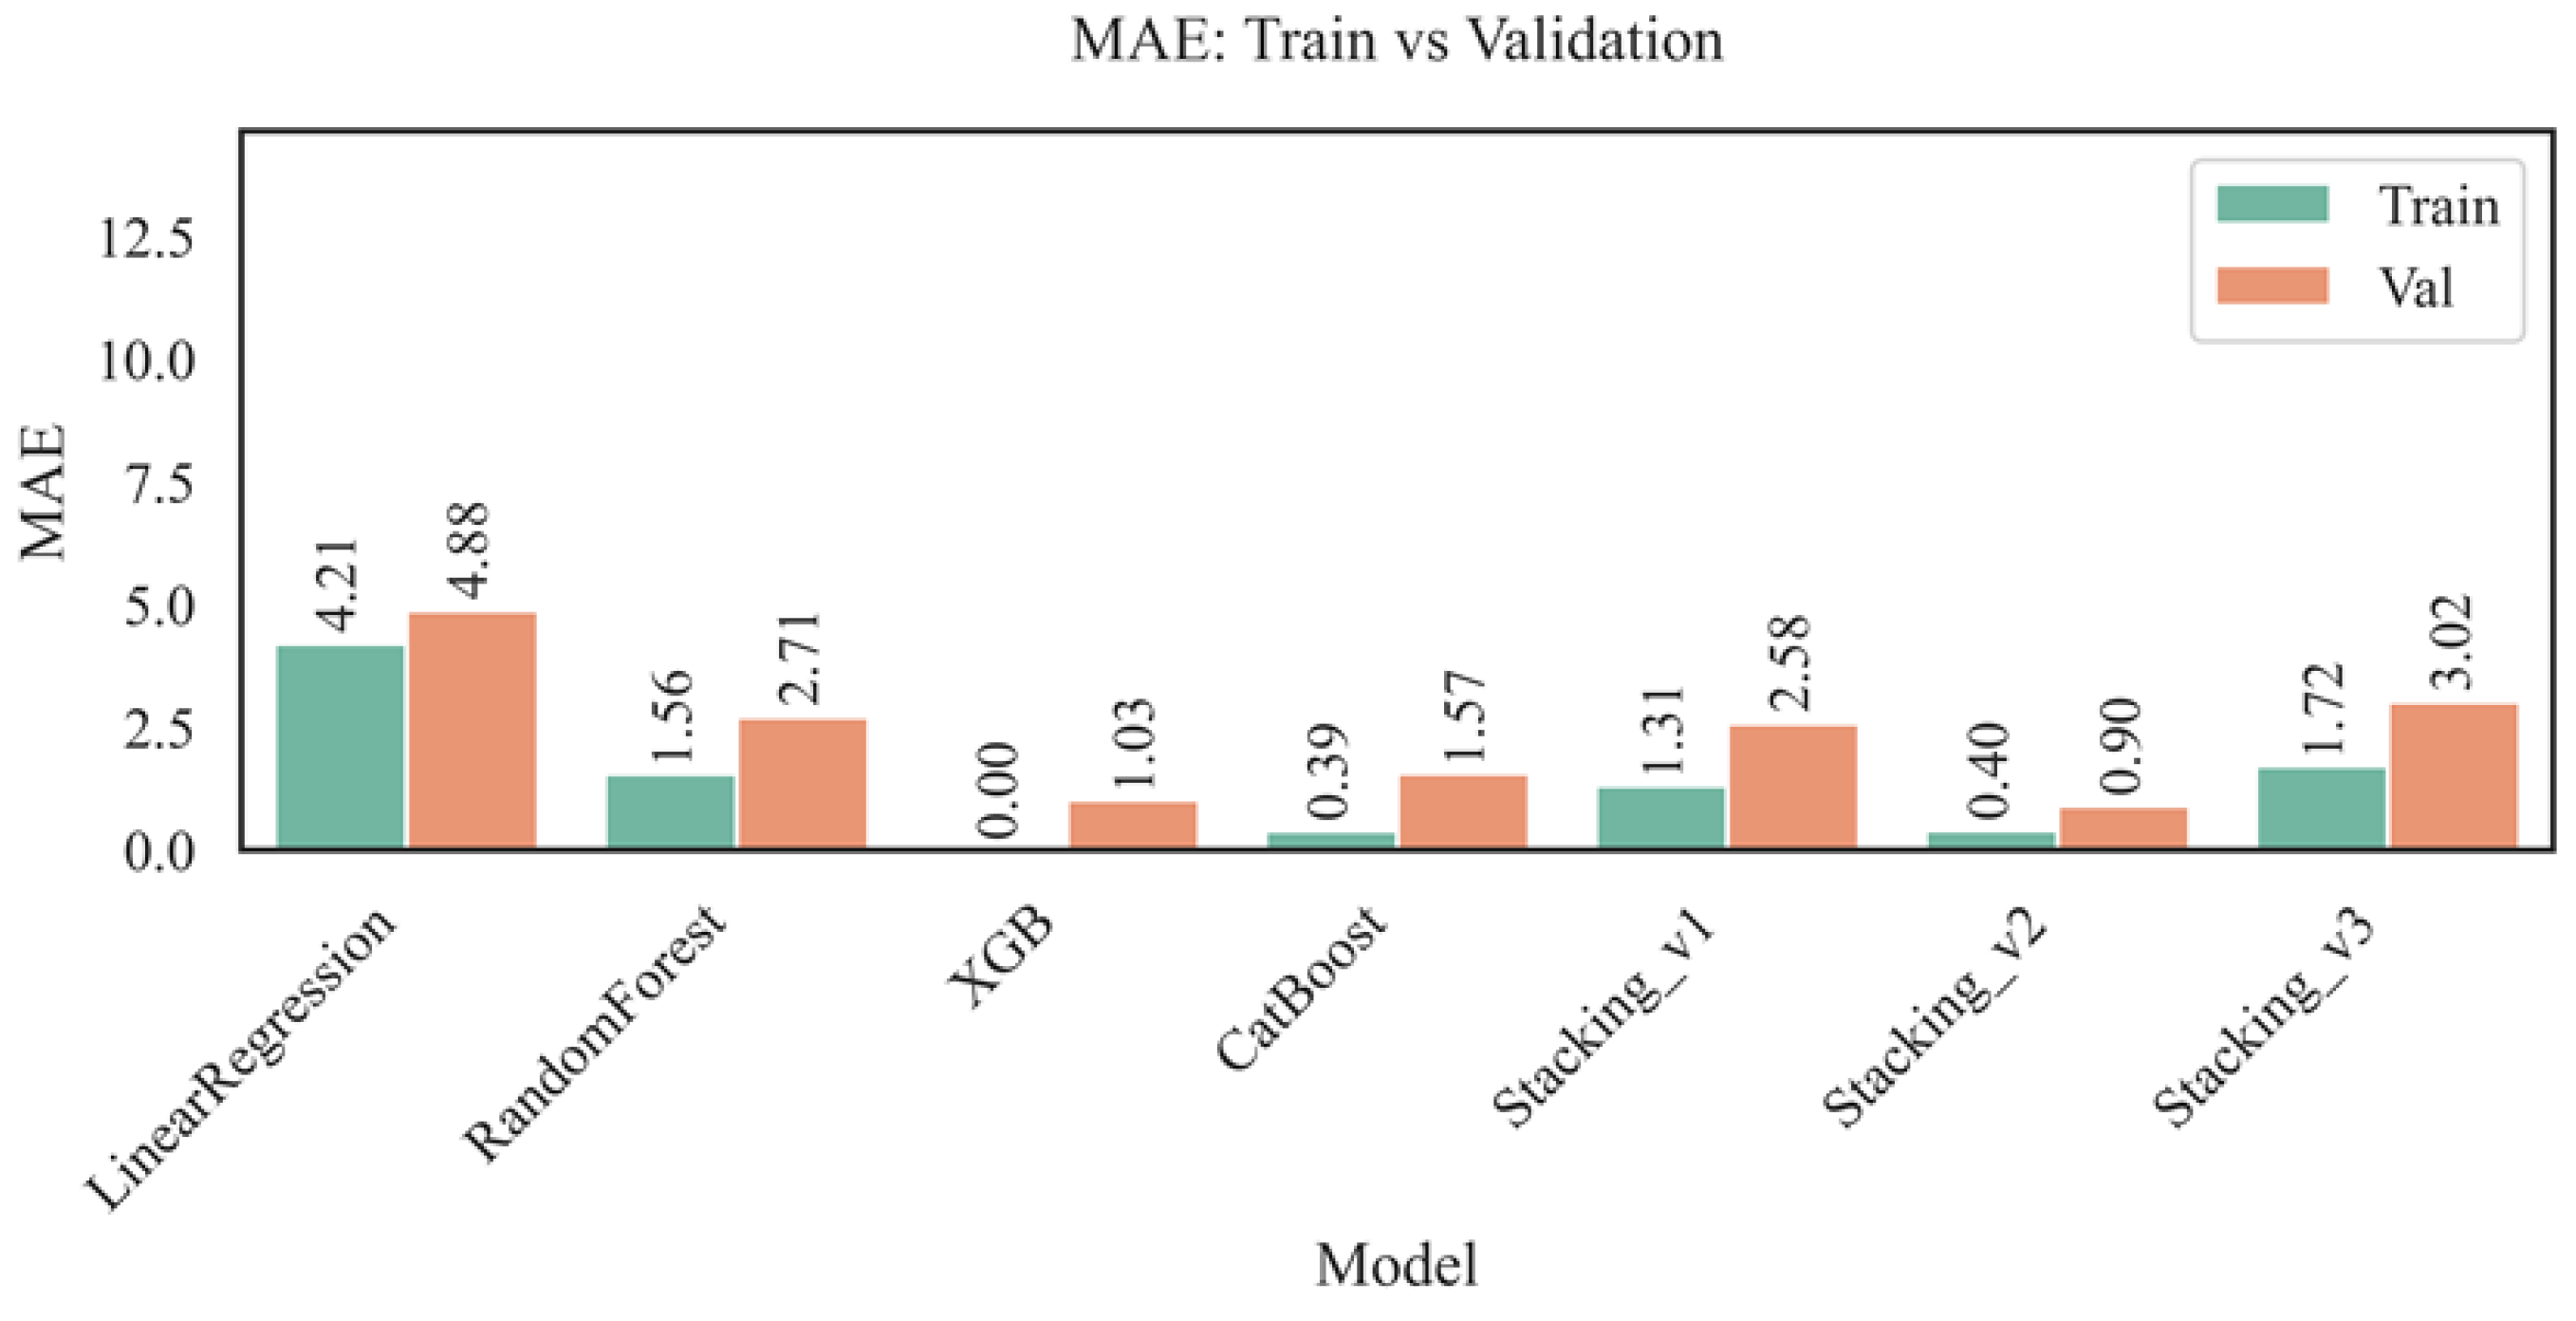
Figure 8.
Comparison of MAPE (%) for training and validation sets.
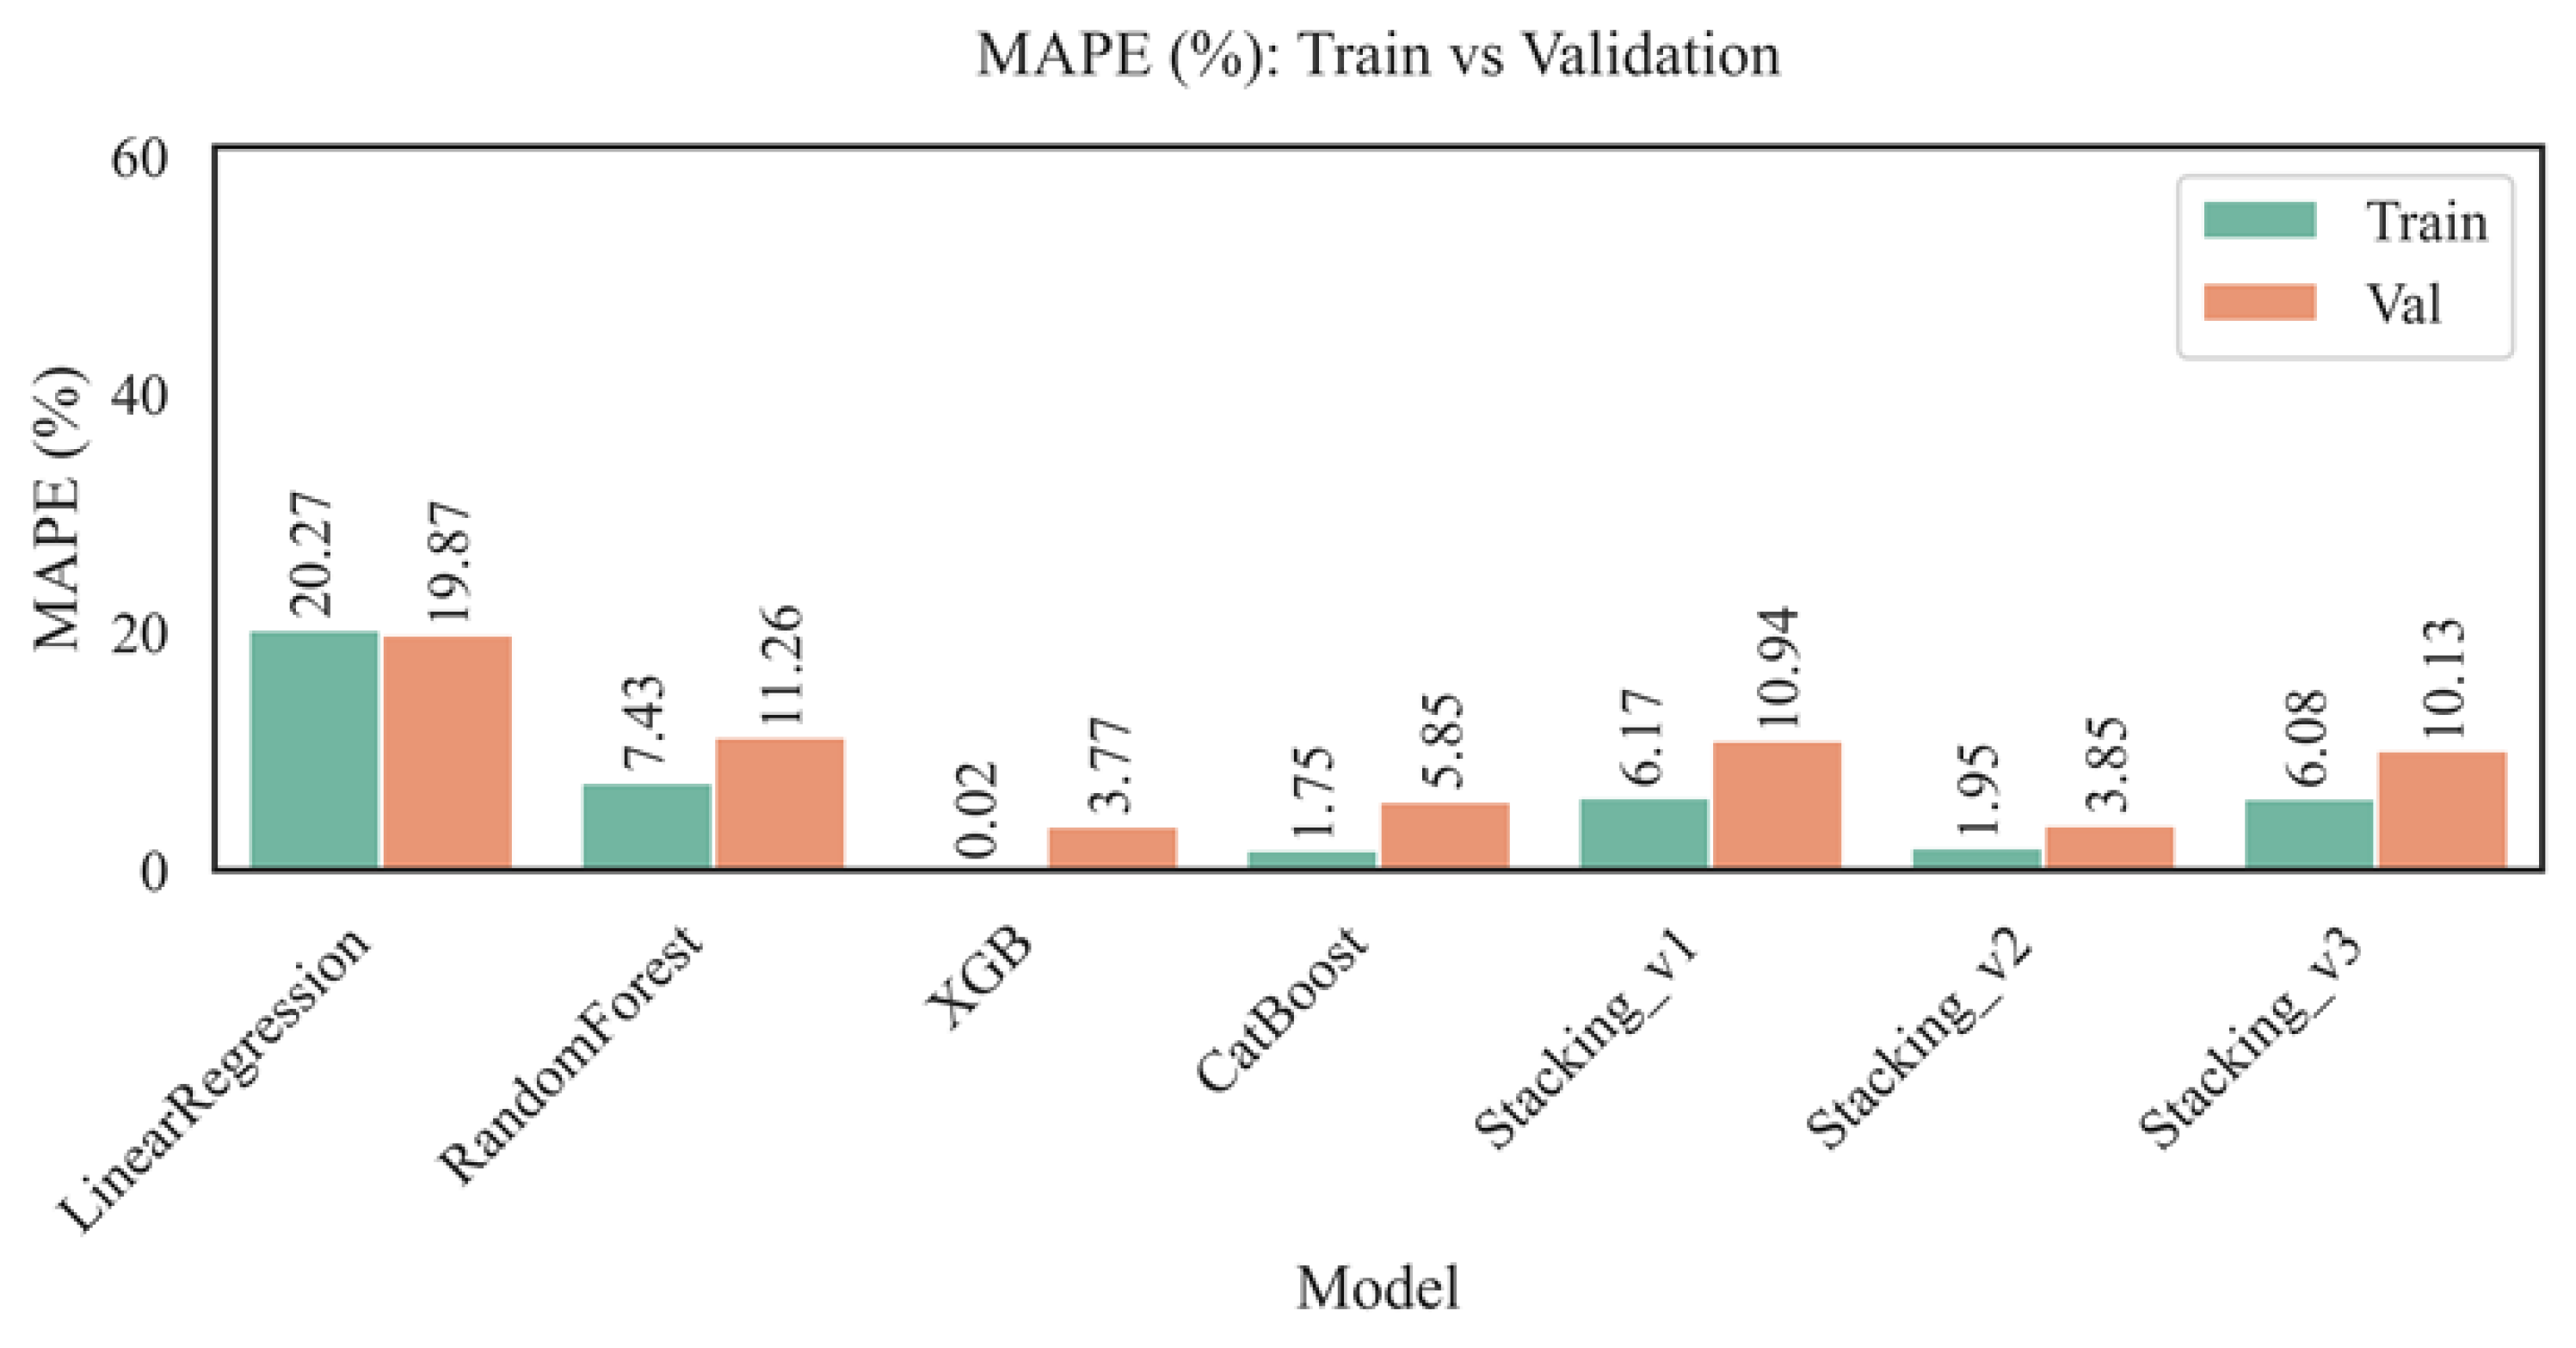
Figure 9.
Comparison of explained variance for training and validation sets.
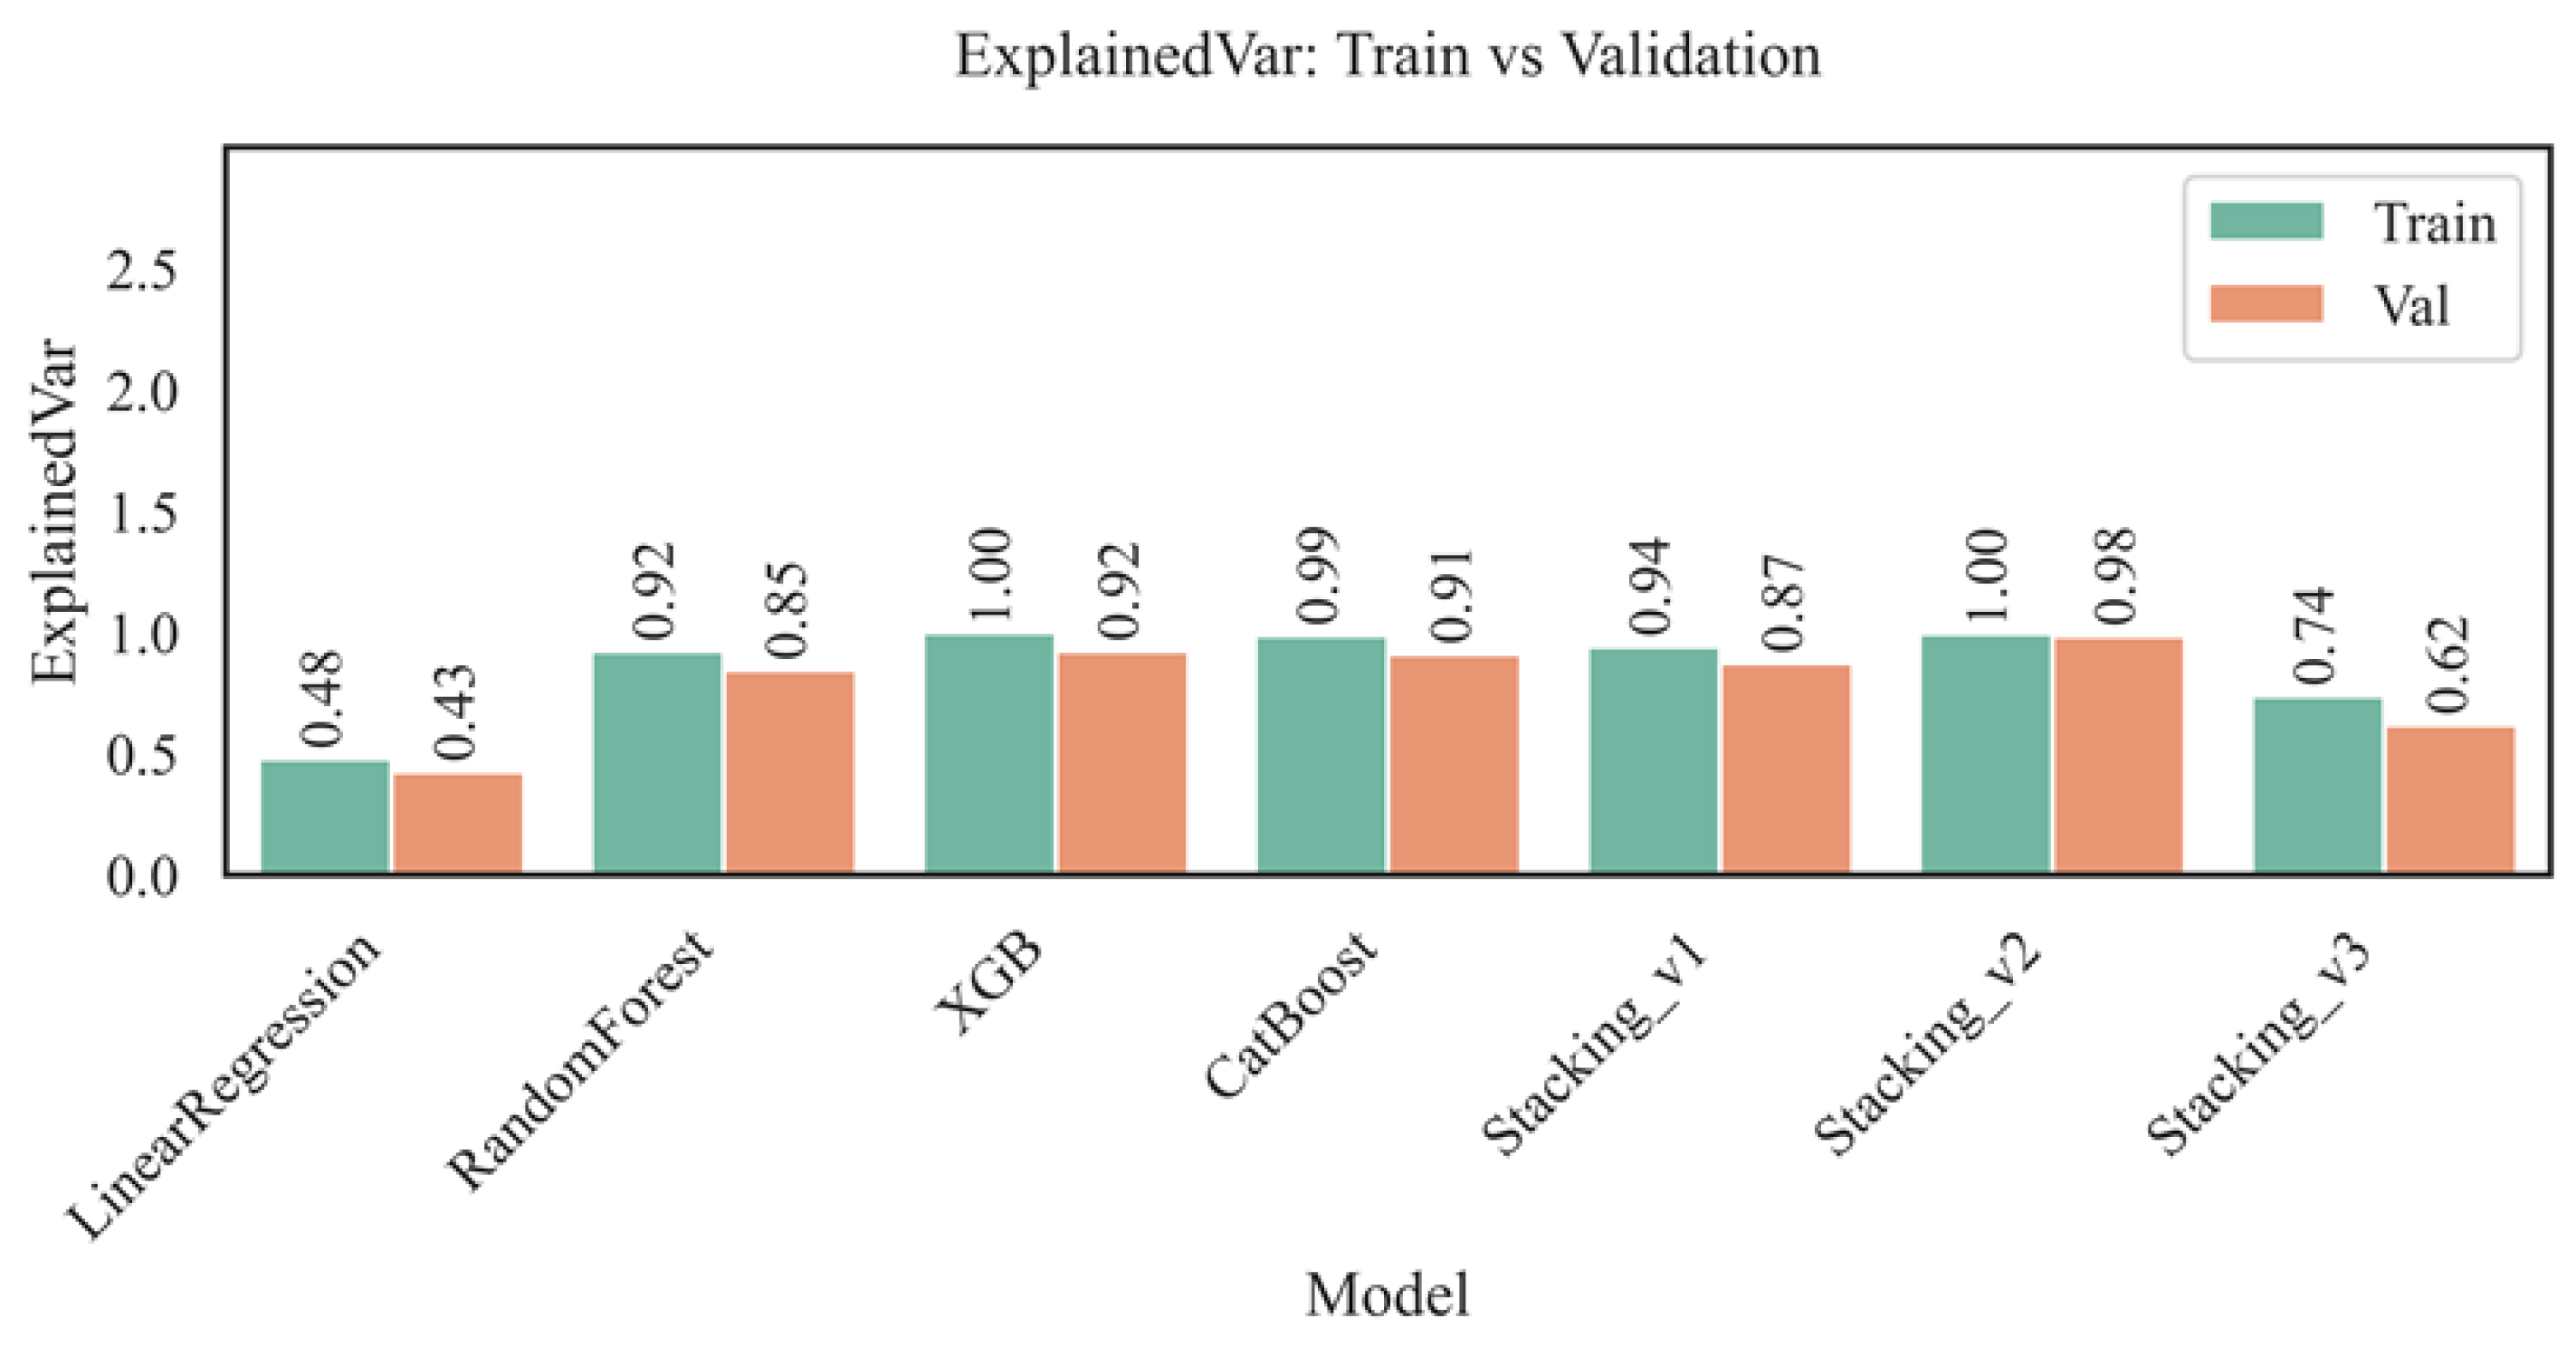
Figure 10.
Contribution of each feature to the prediction of the AST level using different methods (SHAP, Mutual Info, correlations).
Figure 10.
Contribution of each feature to the prediction of the AST level using different methods (SHAP, Mutual Info, correlations).
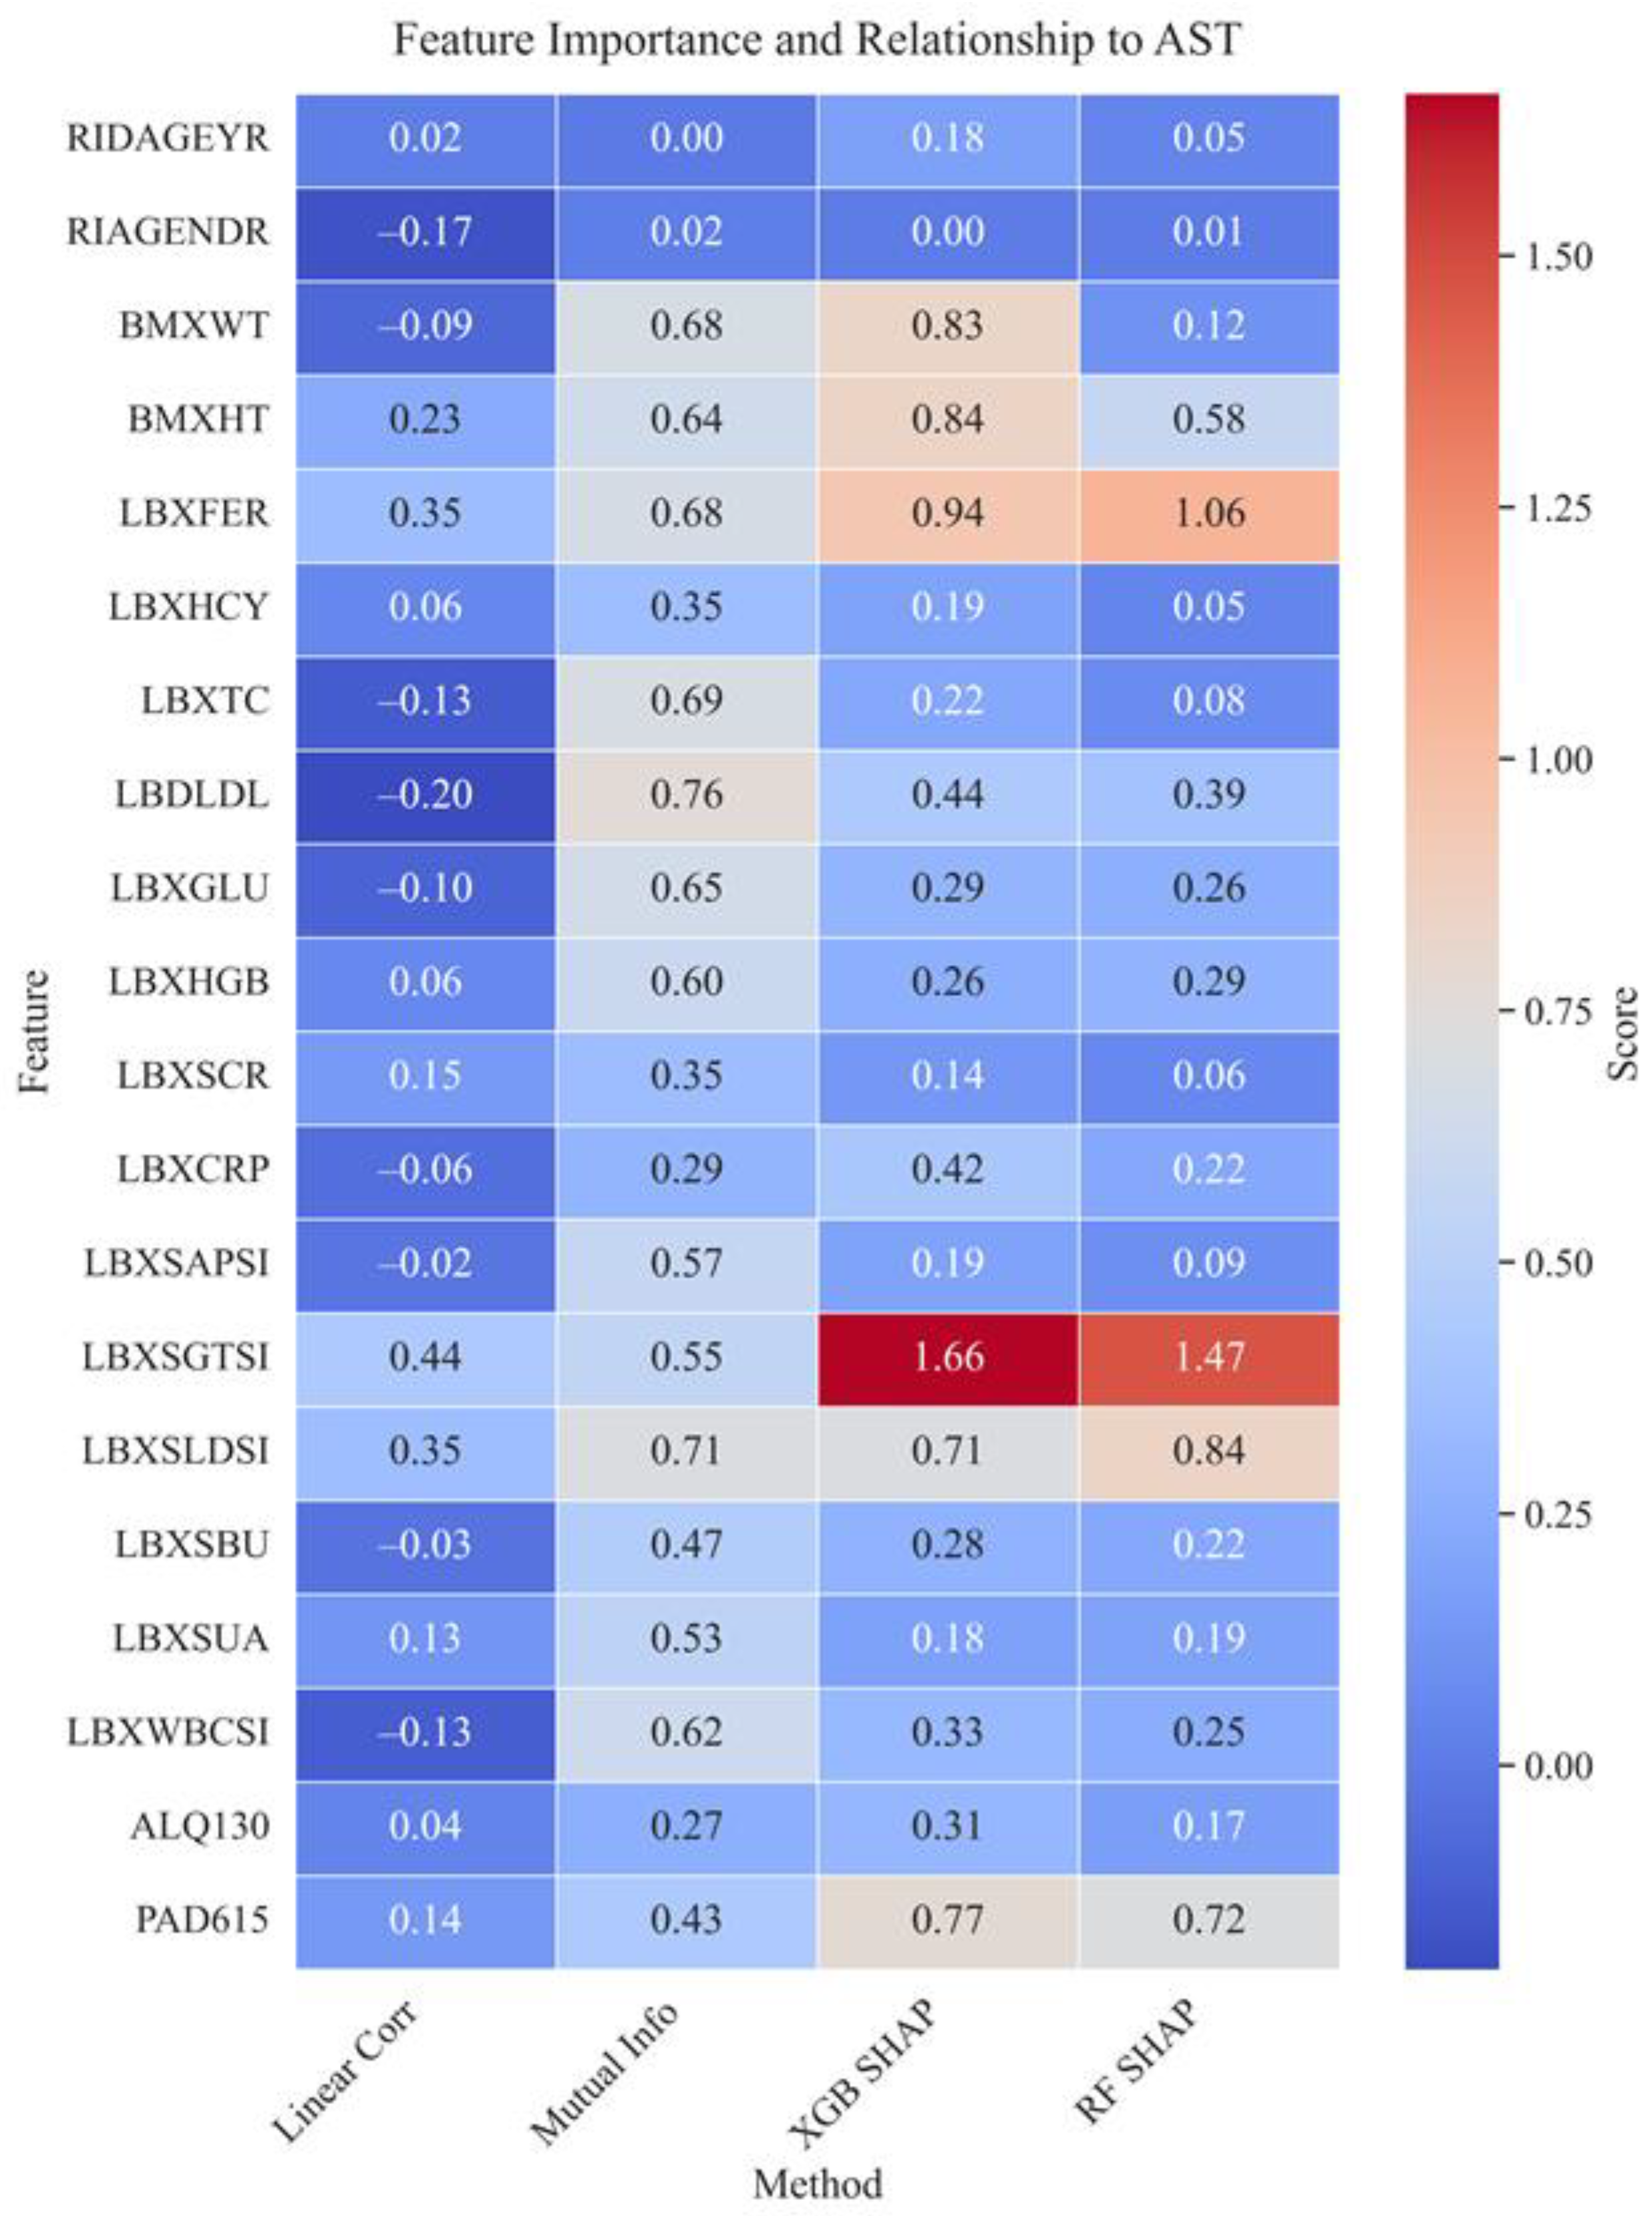
Figure 11.
SHAP Beeswarm - the contribution of each feature and the influence of values on the AST prediction.
Figure 11.
SHAP Beeswarm - the contribution of each feature and the influence of values on the AST prediction.
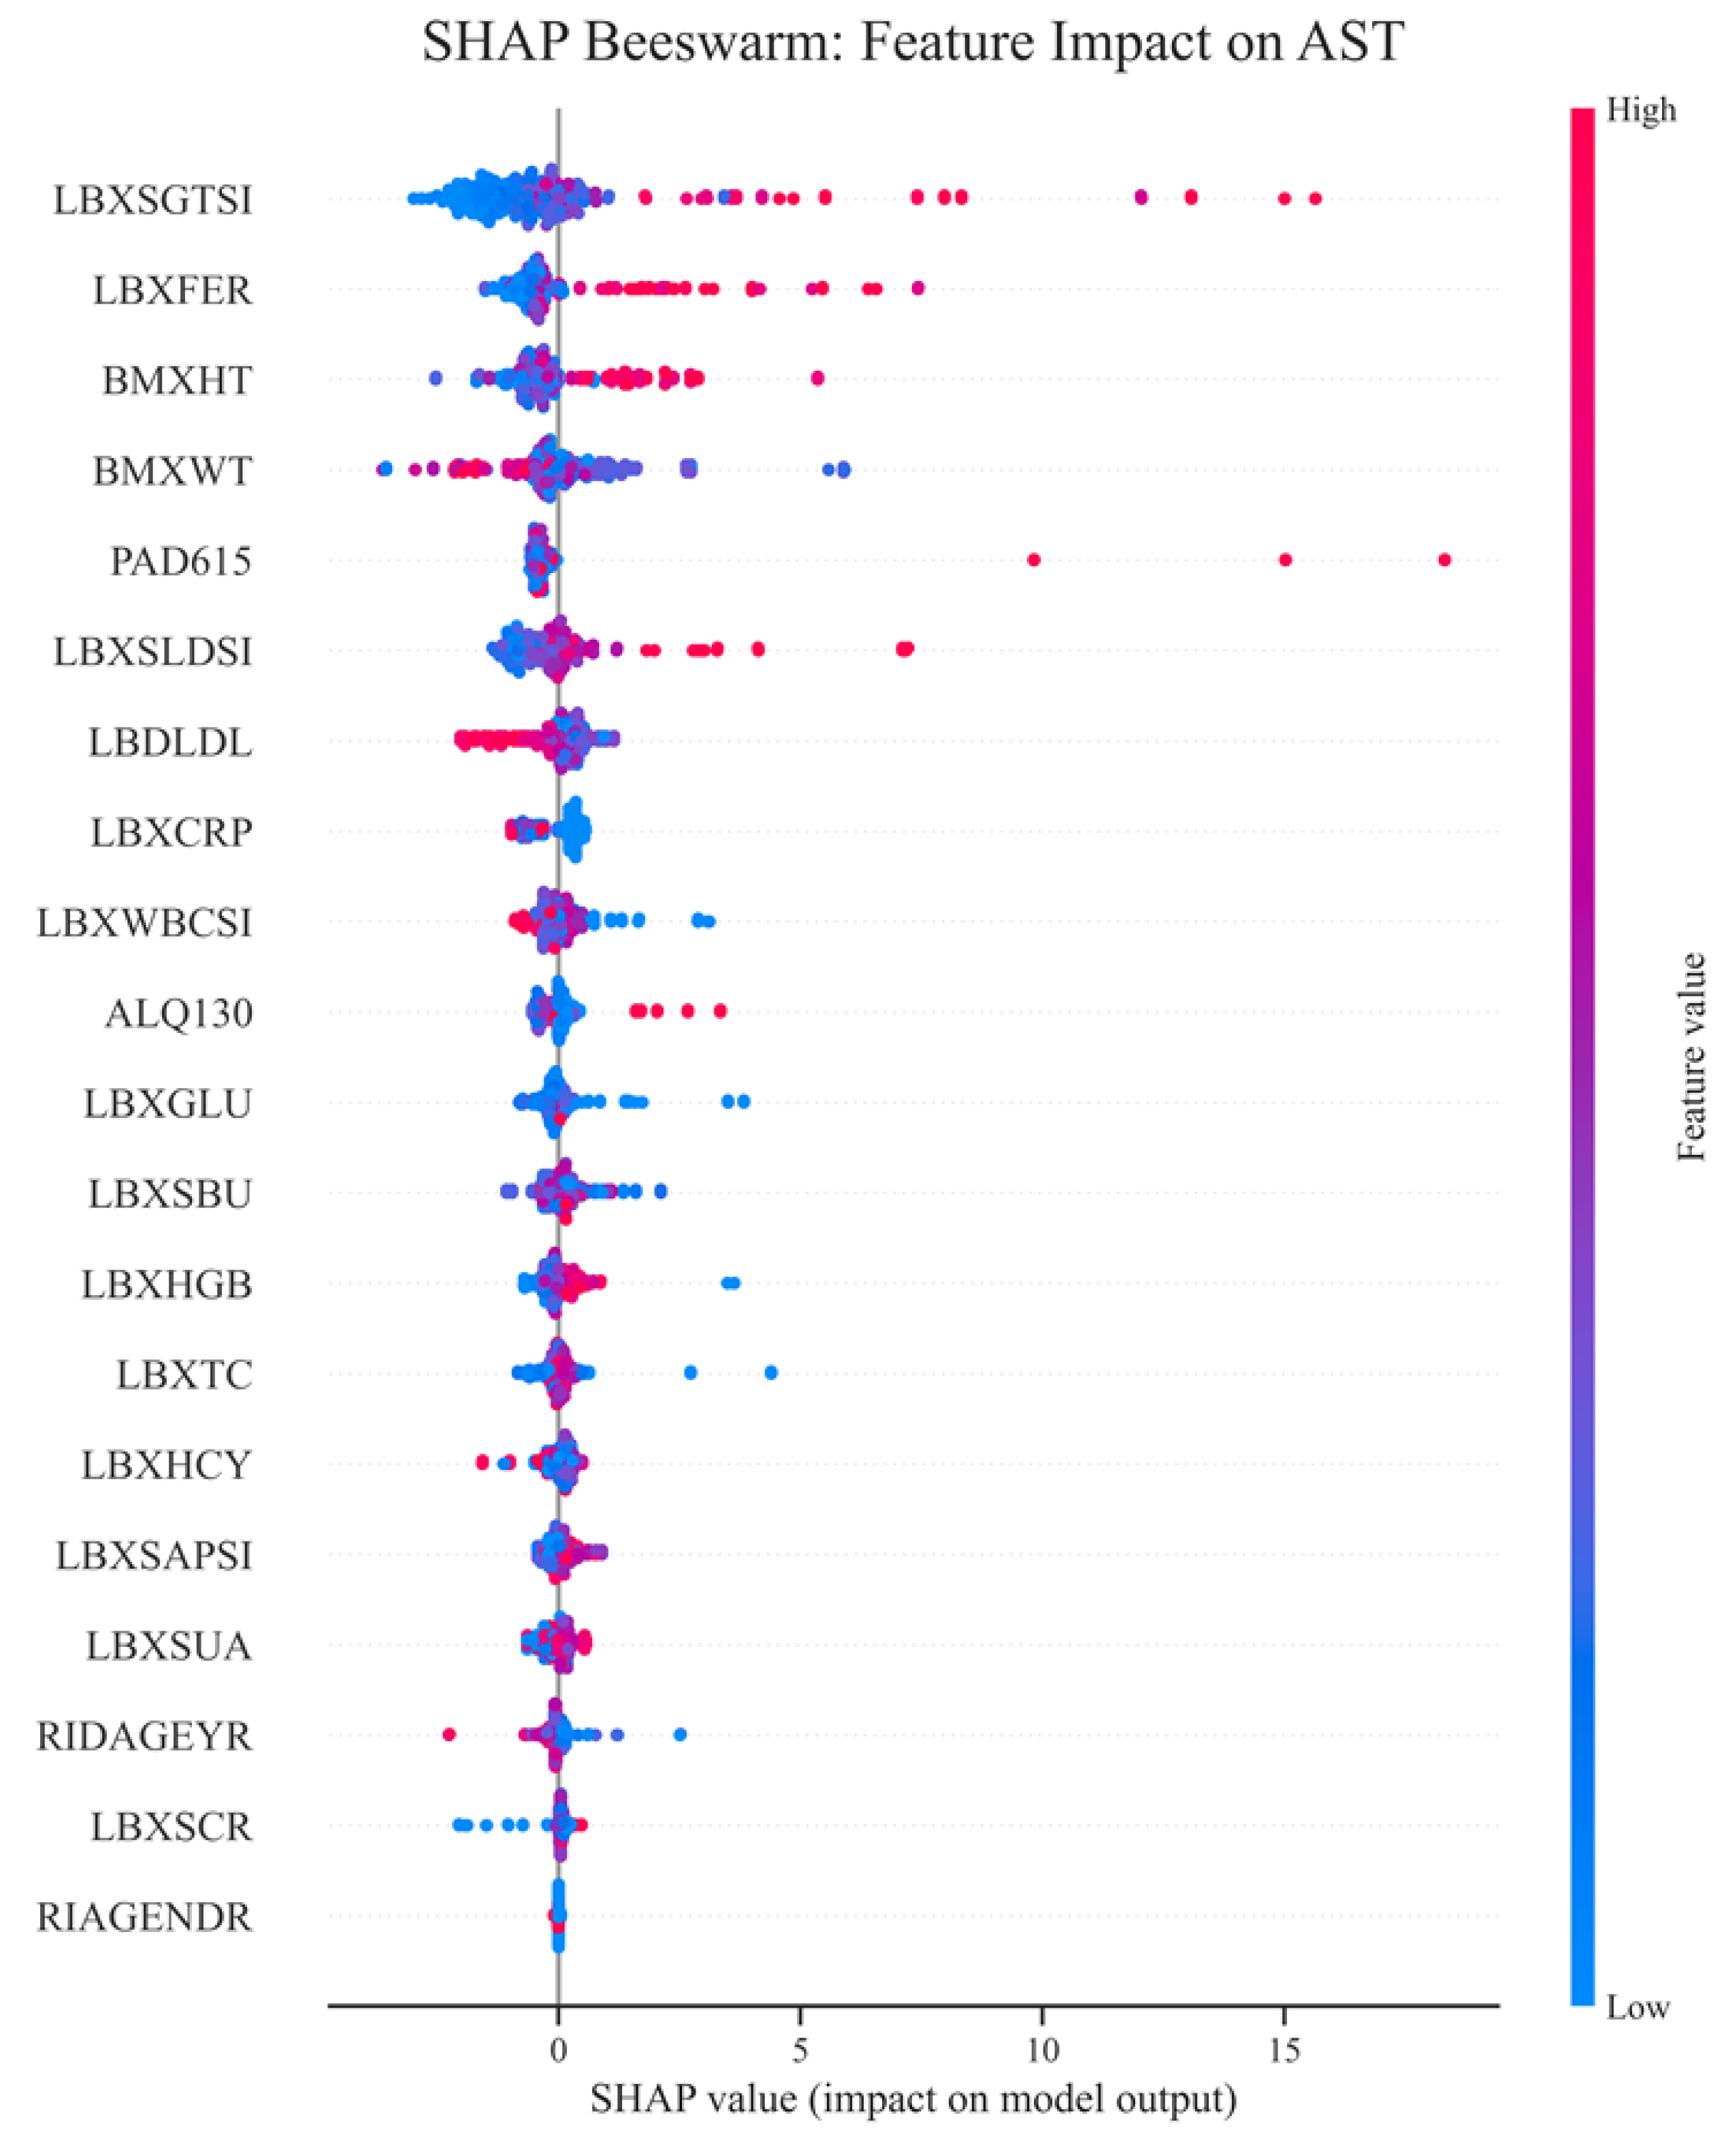
Figure 12.
Ranking features by mean absolute SHAP (XGBoost).
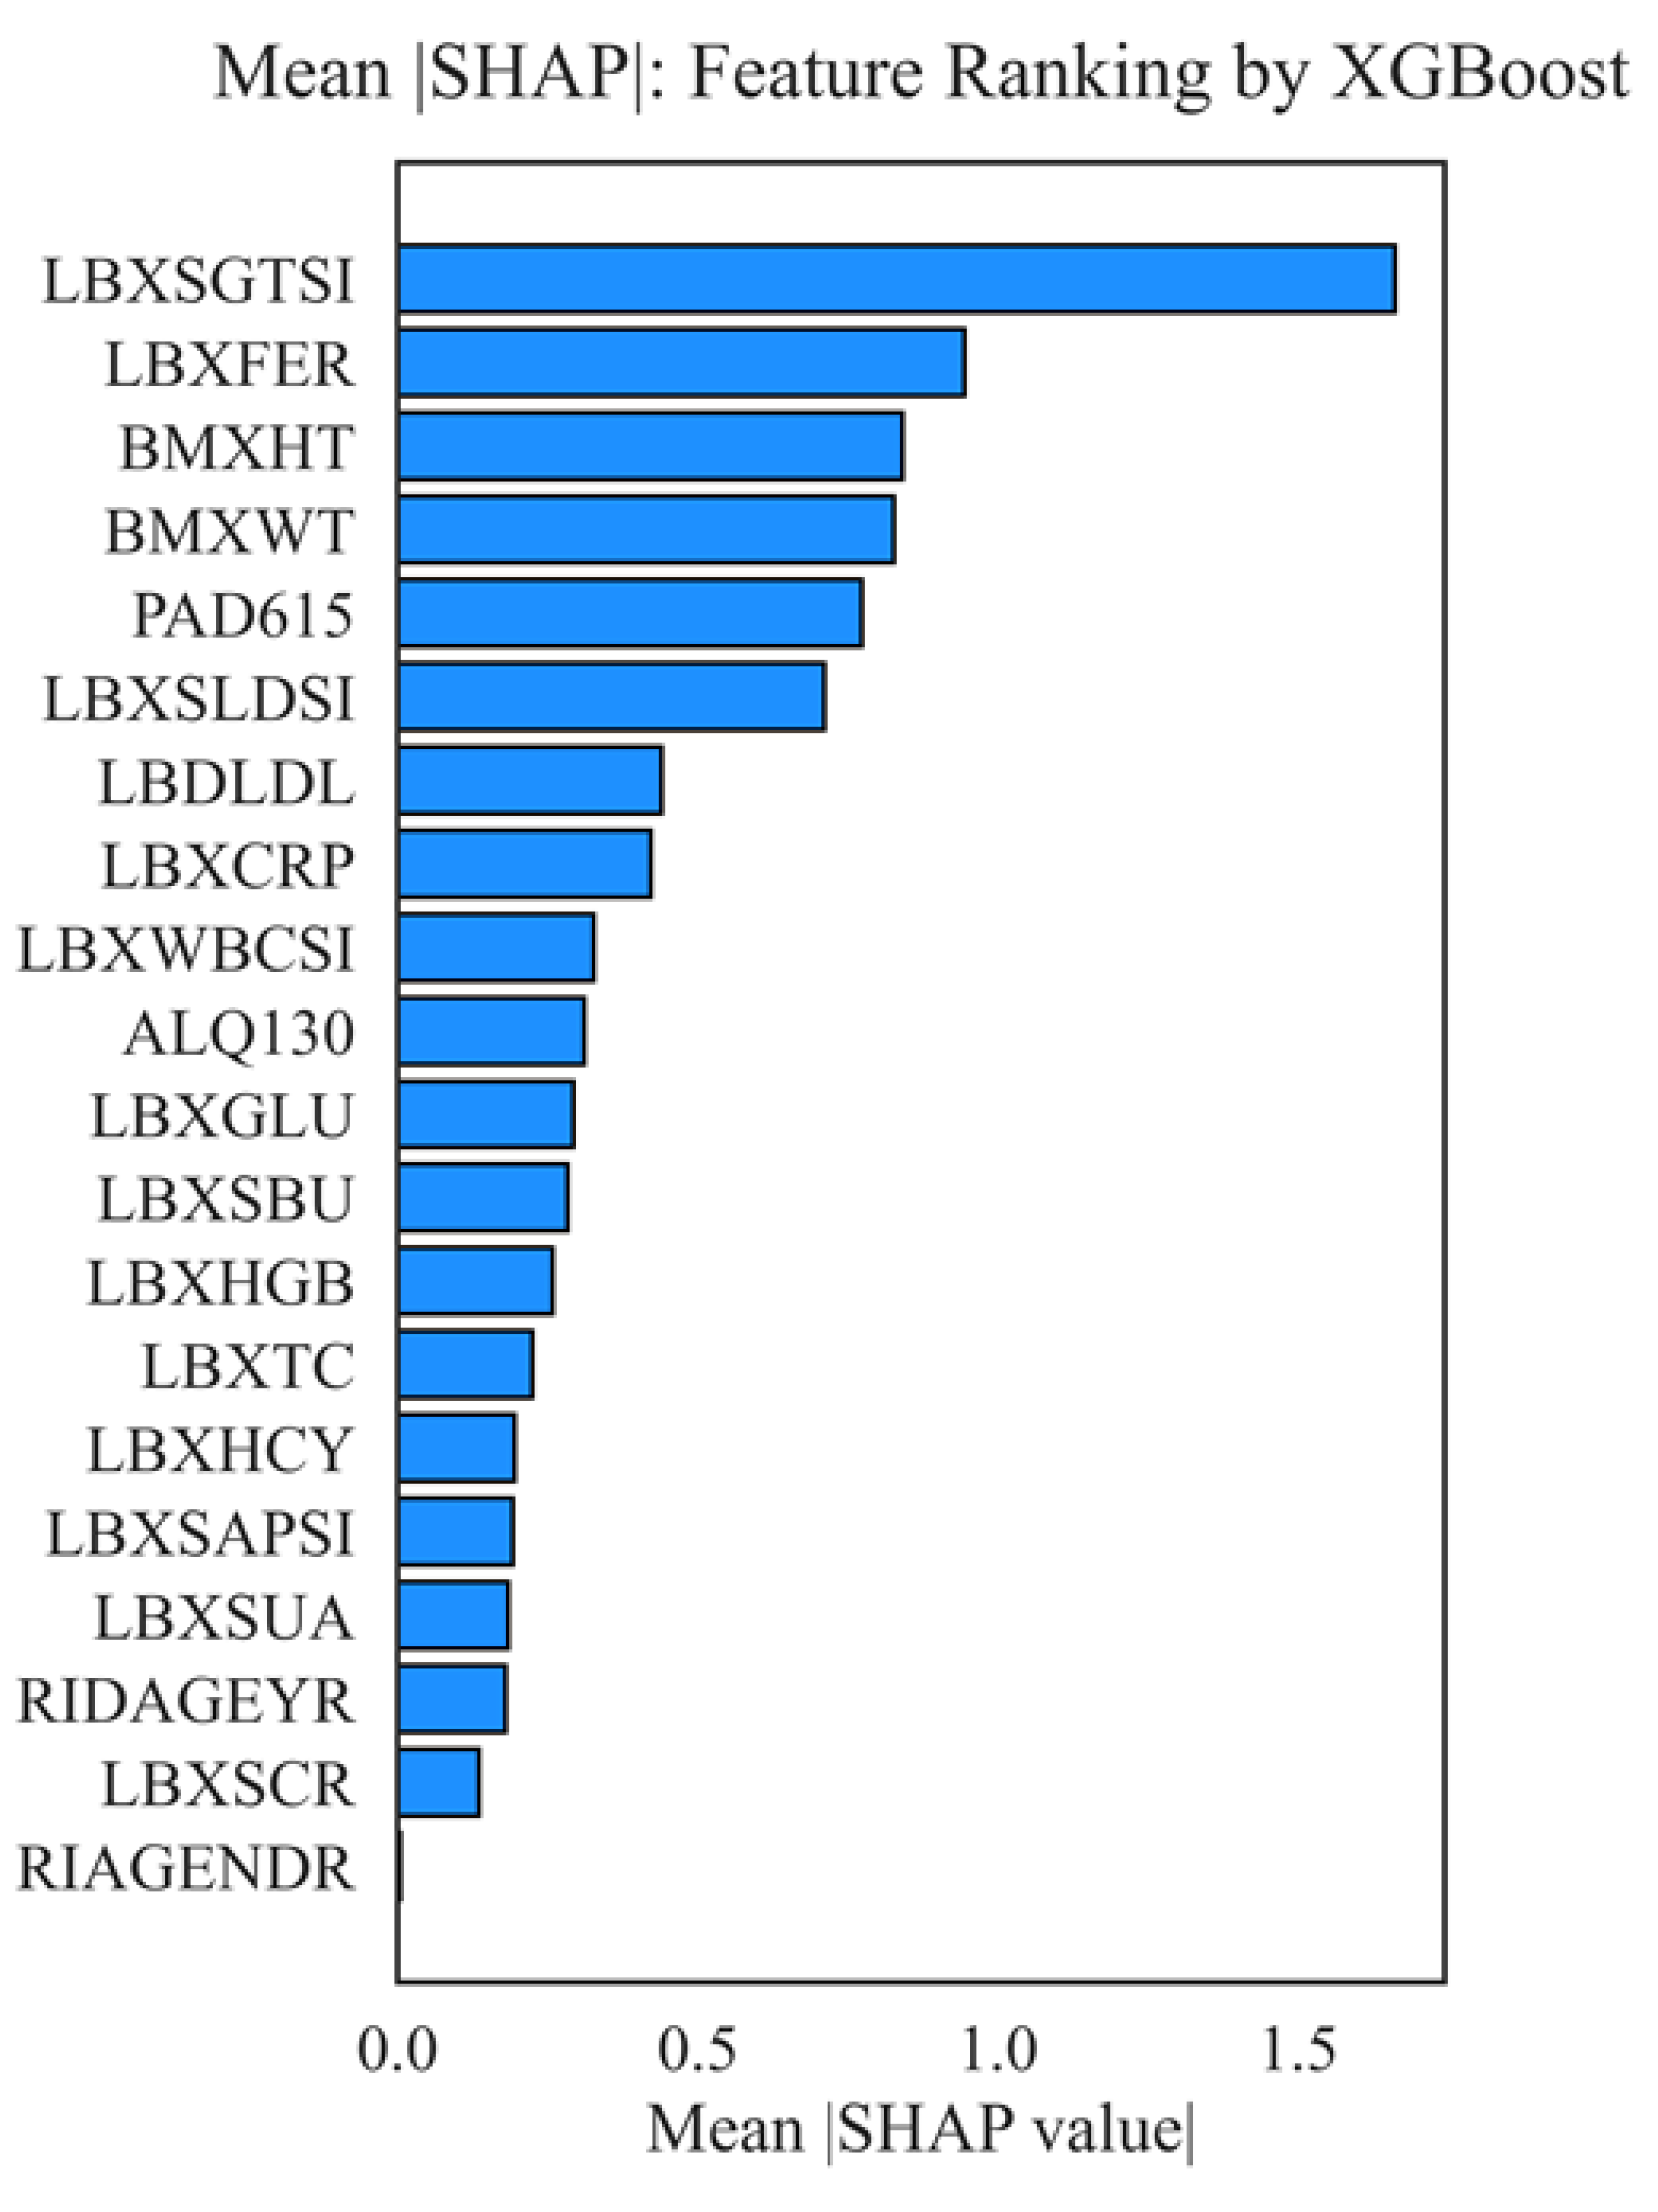
Figure 13.
Top 10 feature pairs with maximum interactions (SHAP interactions).
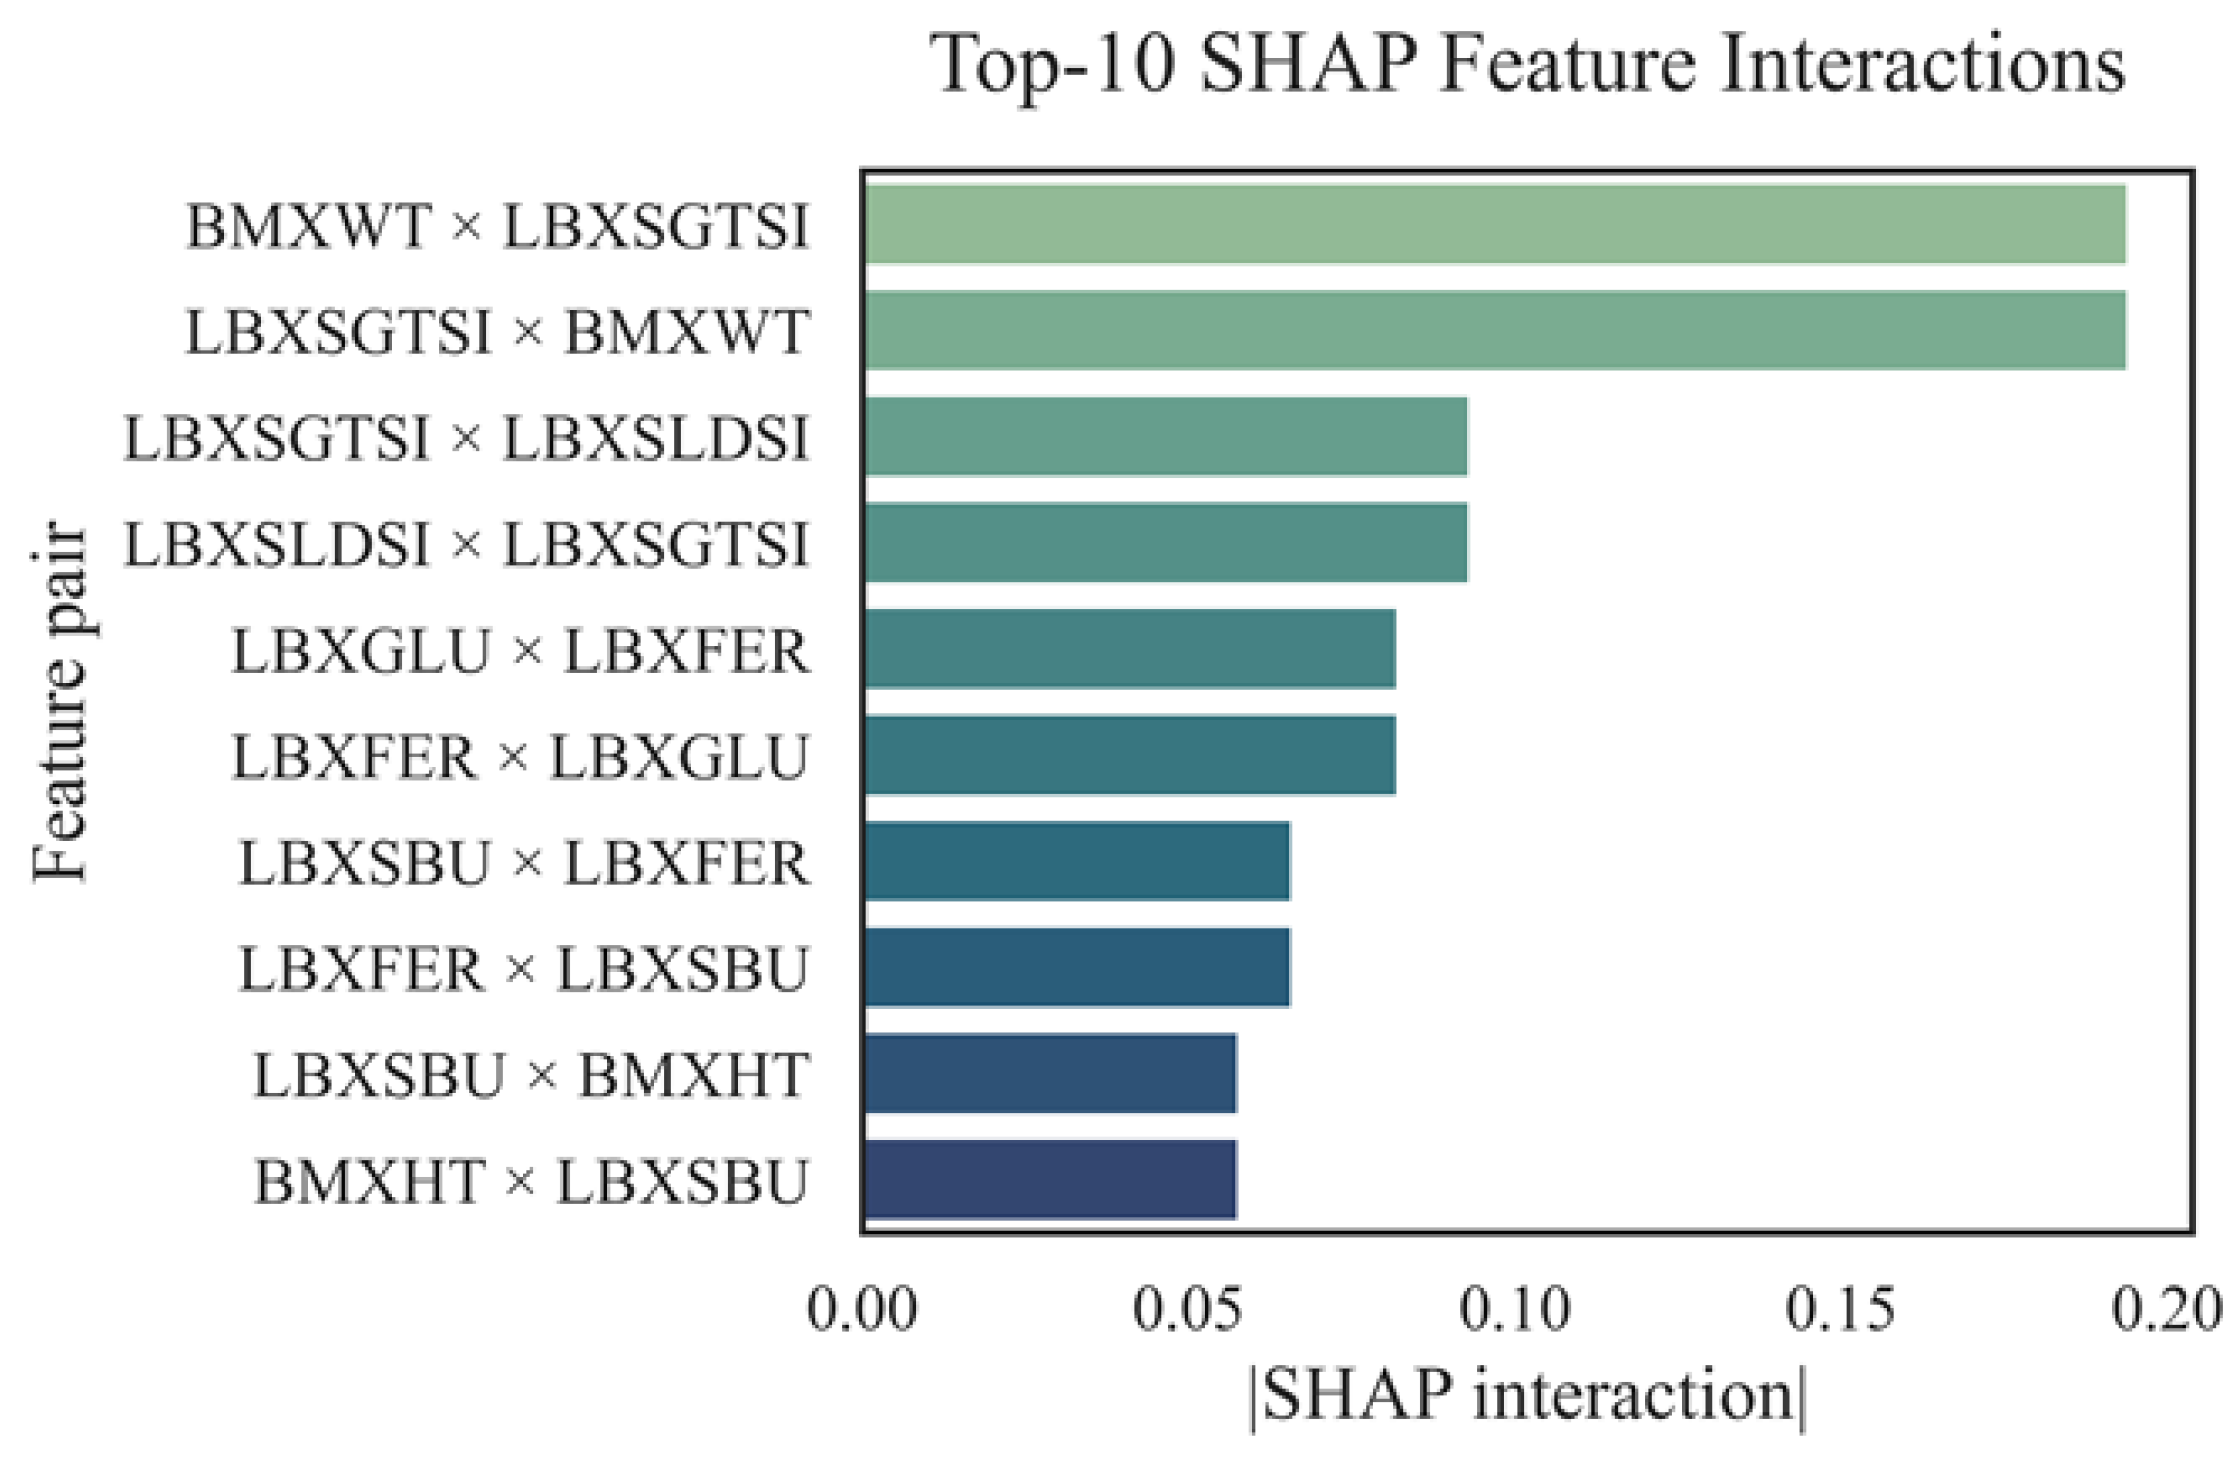
Figure 14.
Matrix of robust correlations between AST and biochemical markers.
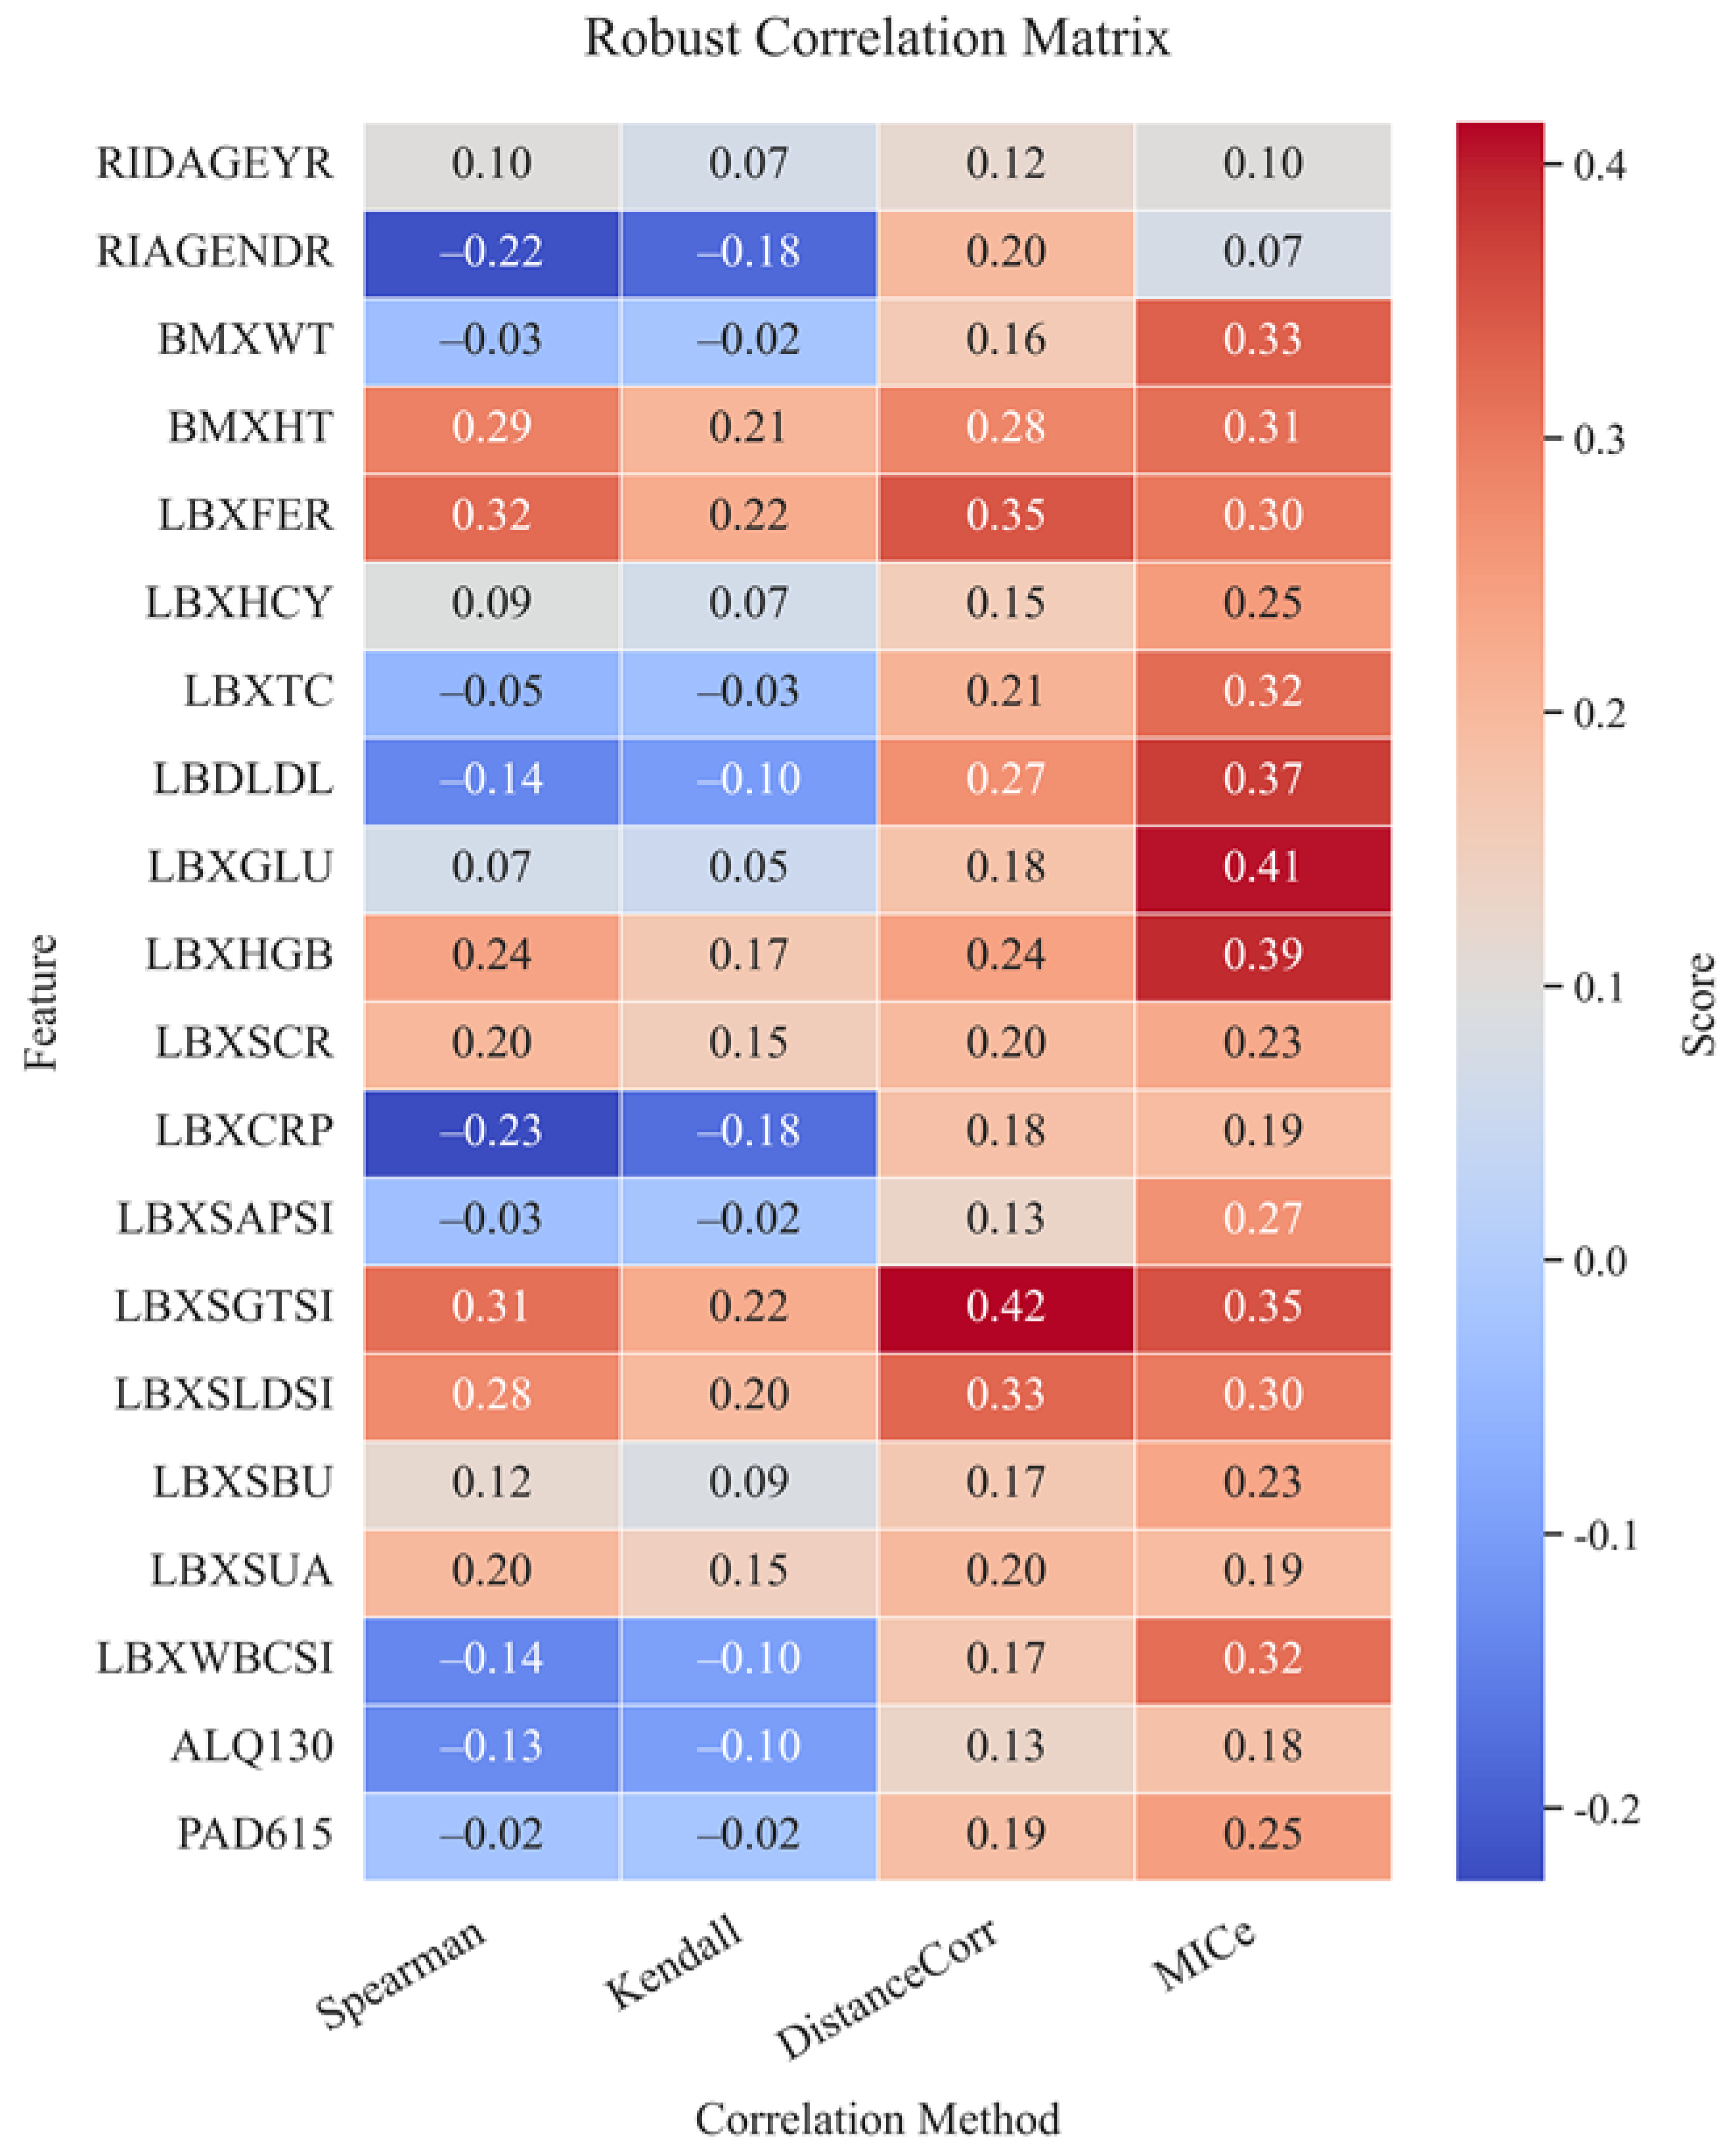
Figure 15.
Cluster structure of features and their grouping by similarity of contribution to AST.
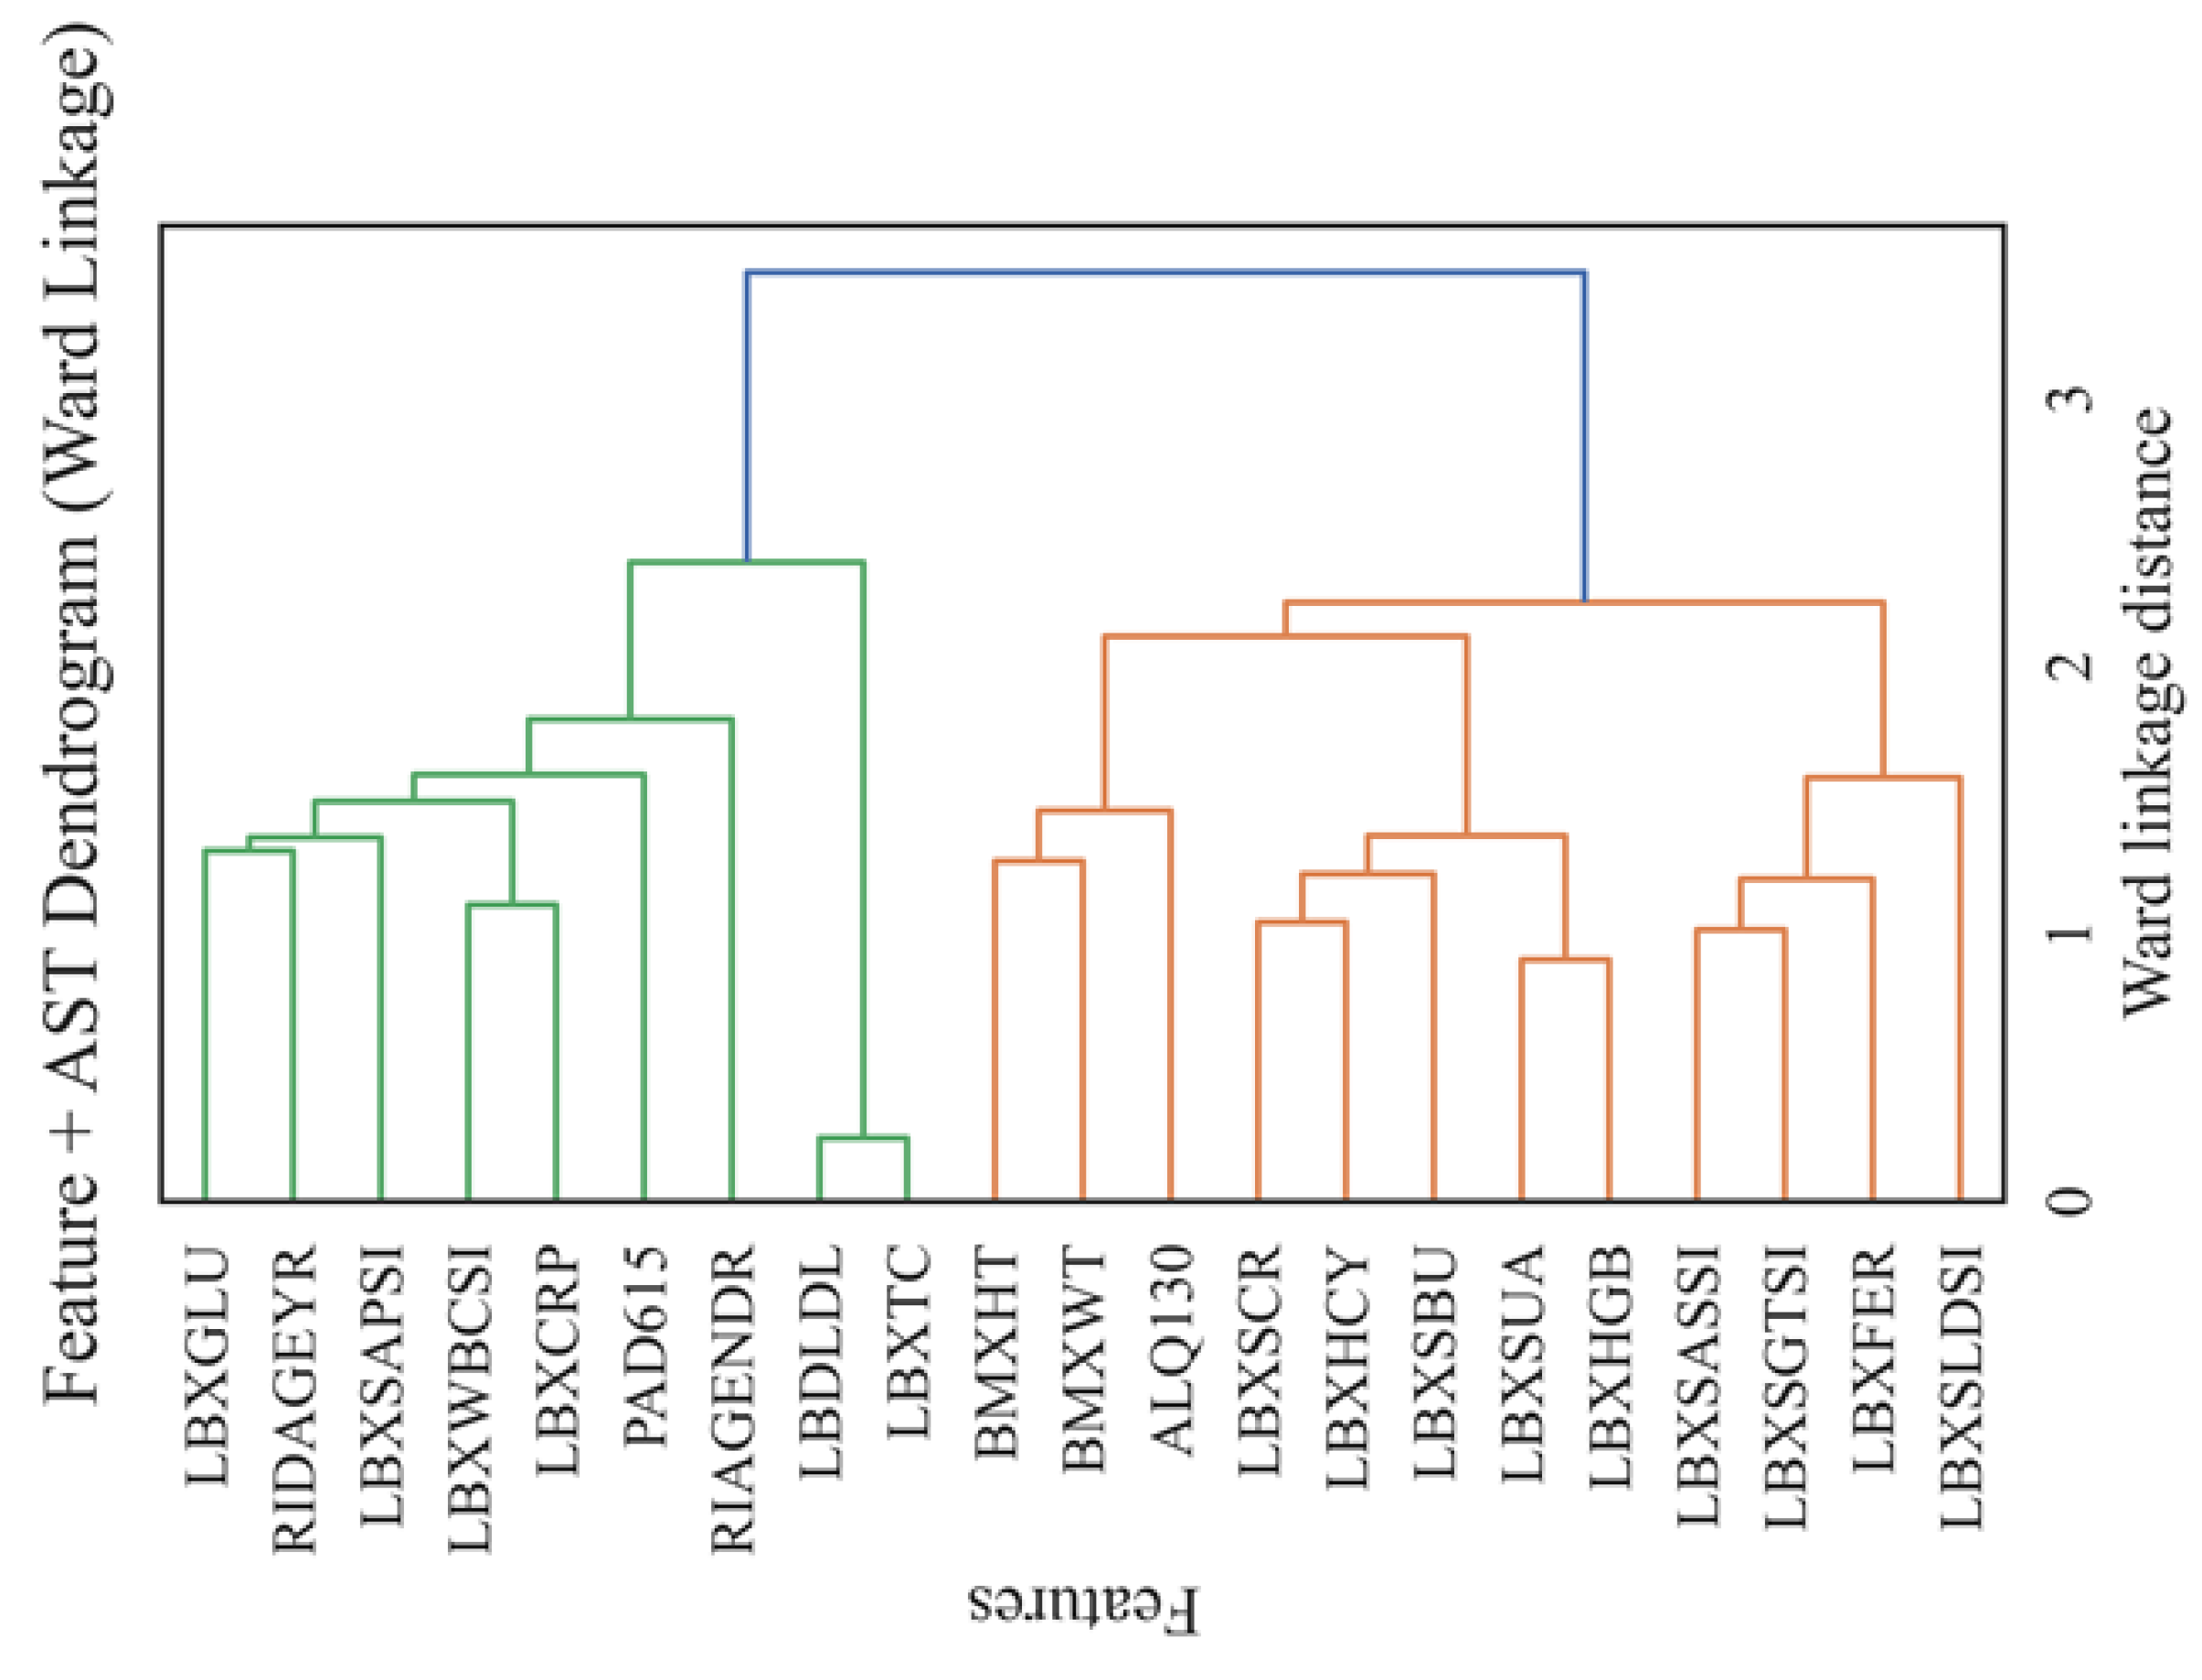
Figure 16.
Calibration of the LGBM model by prediction quantiles.
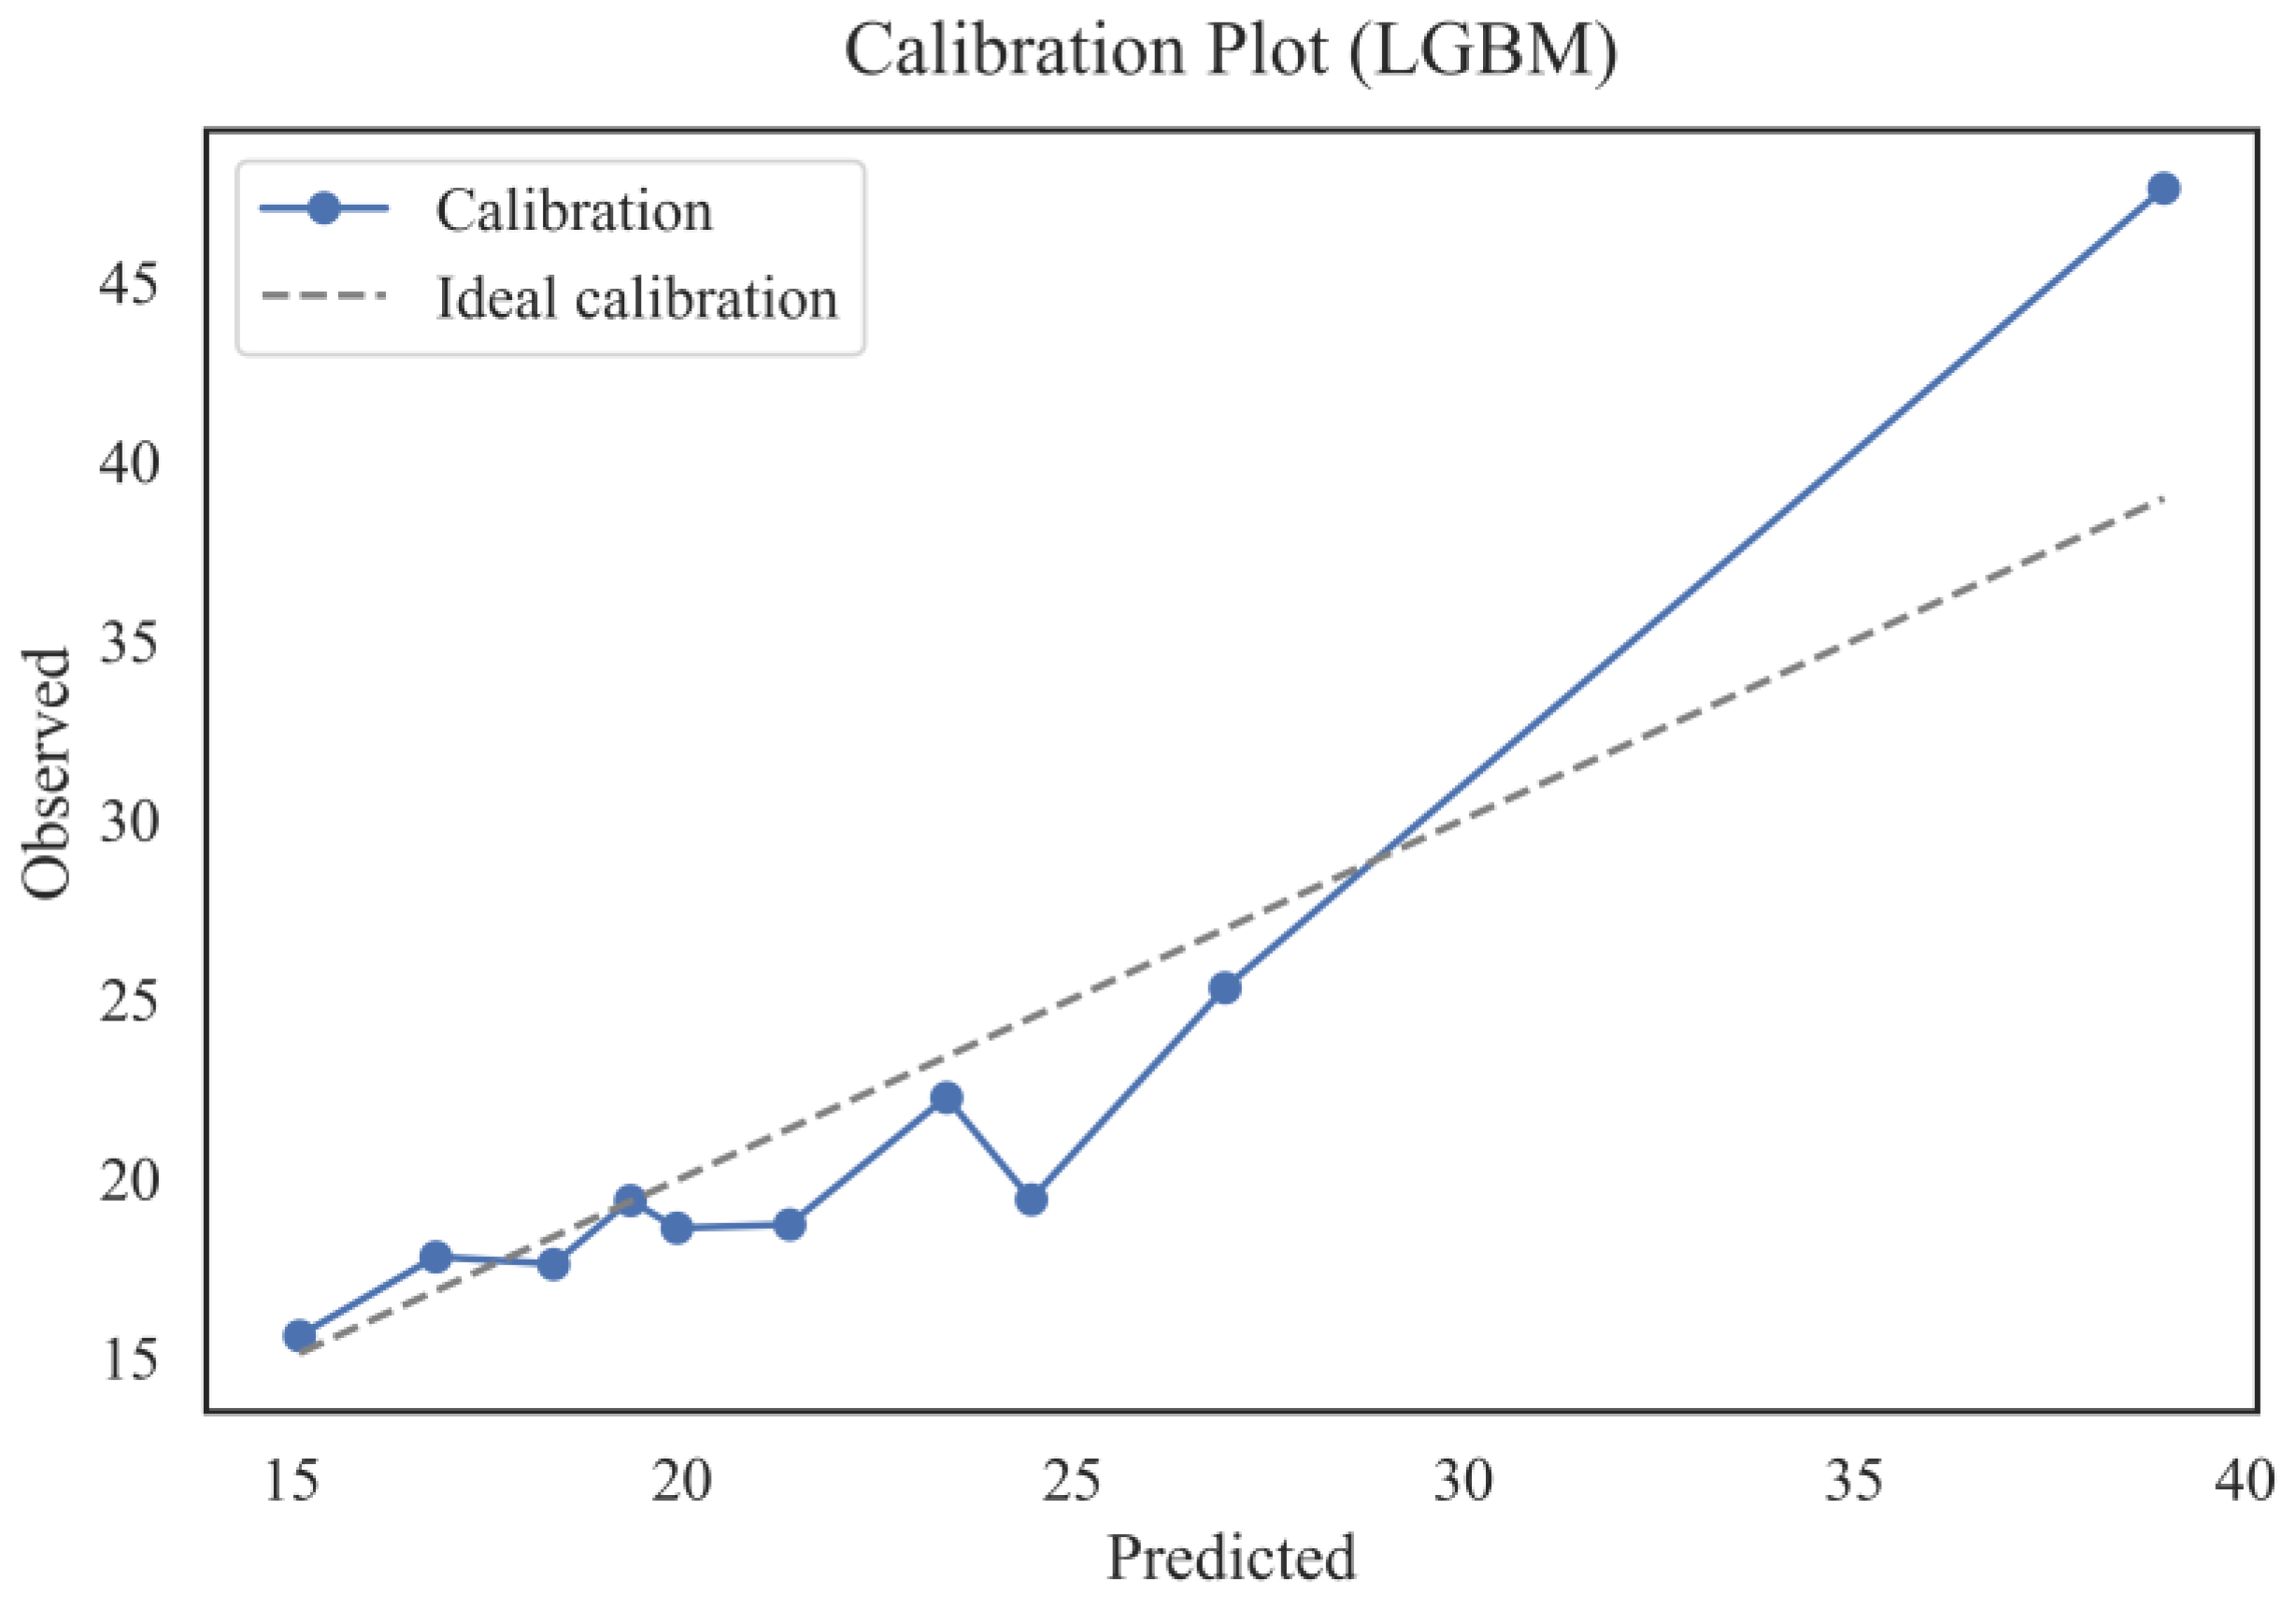
Figure 17.
ROC curve (AUC=1.000) – ability to identify patients with elevated AST.
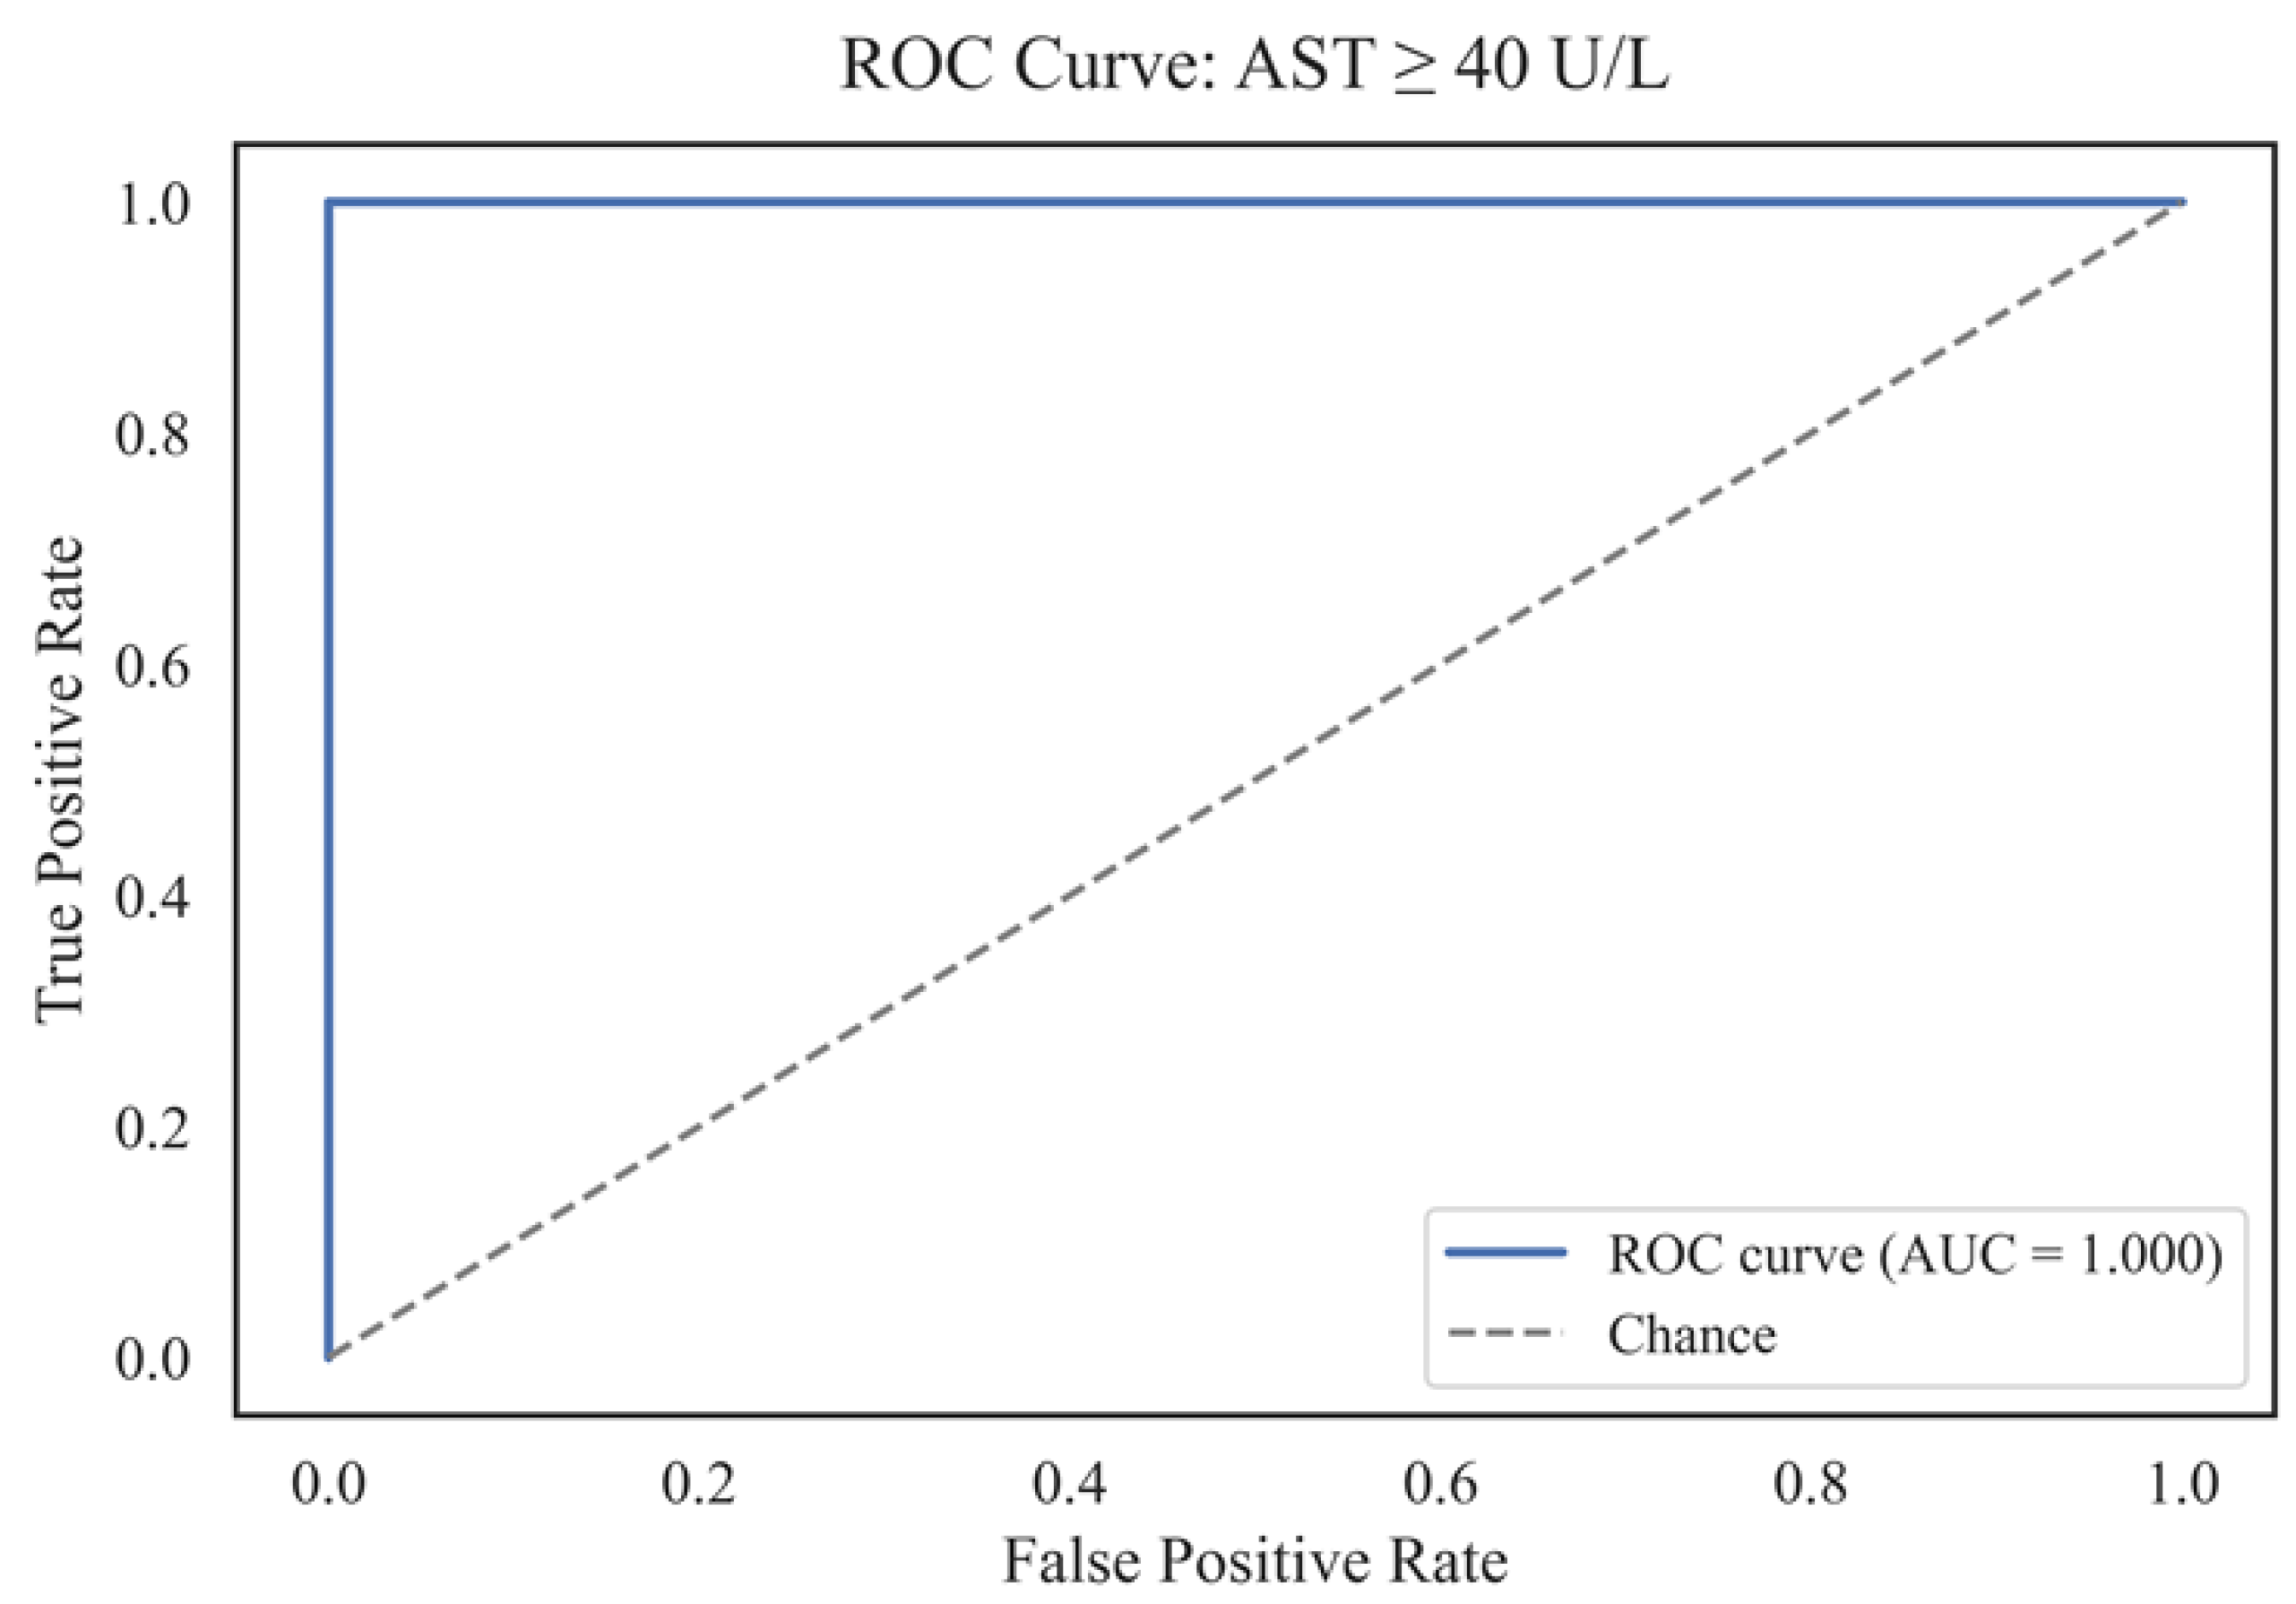
Figure 18.
Precision-Recall-curve (AP=1.000).
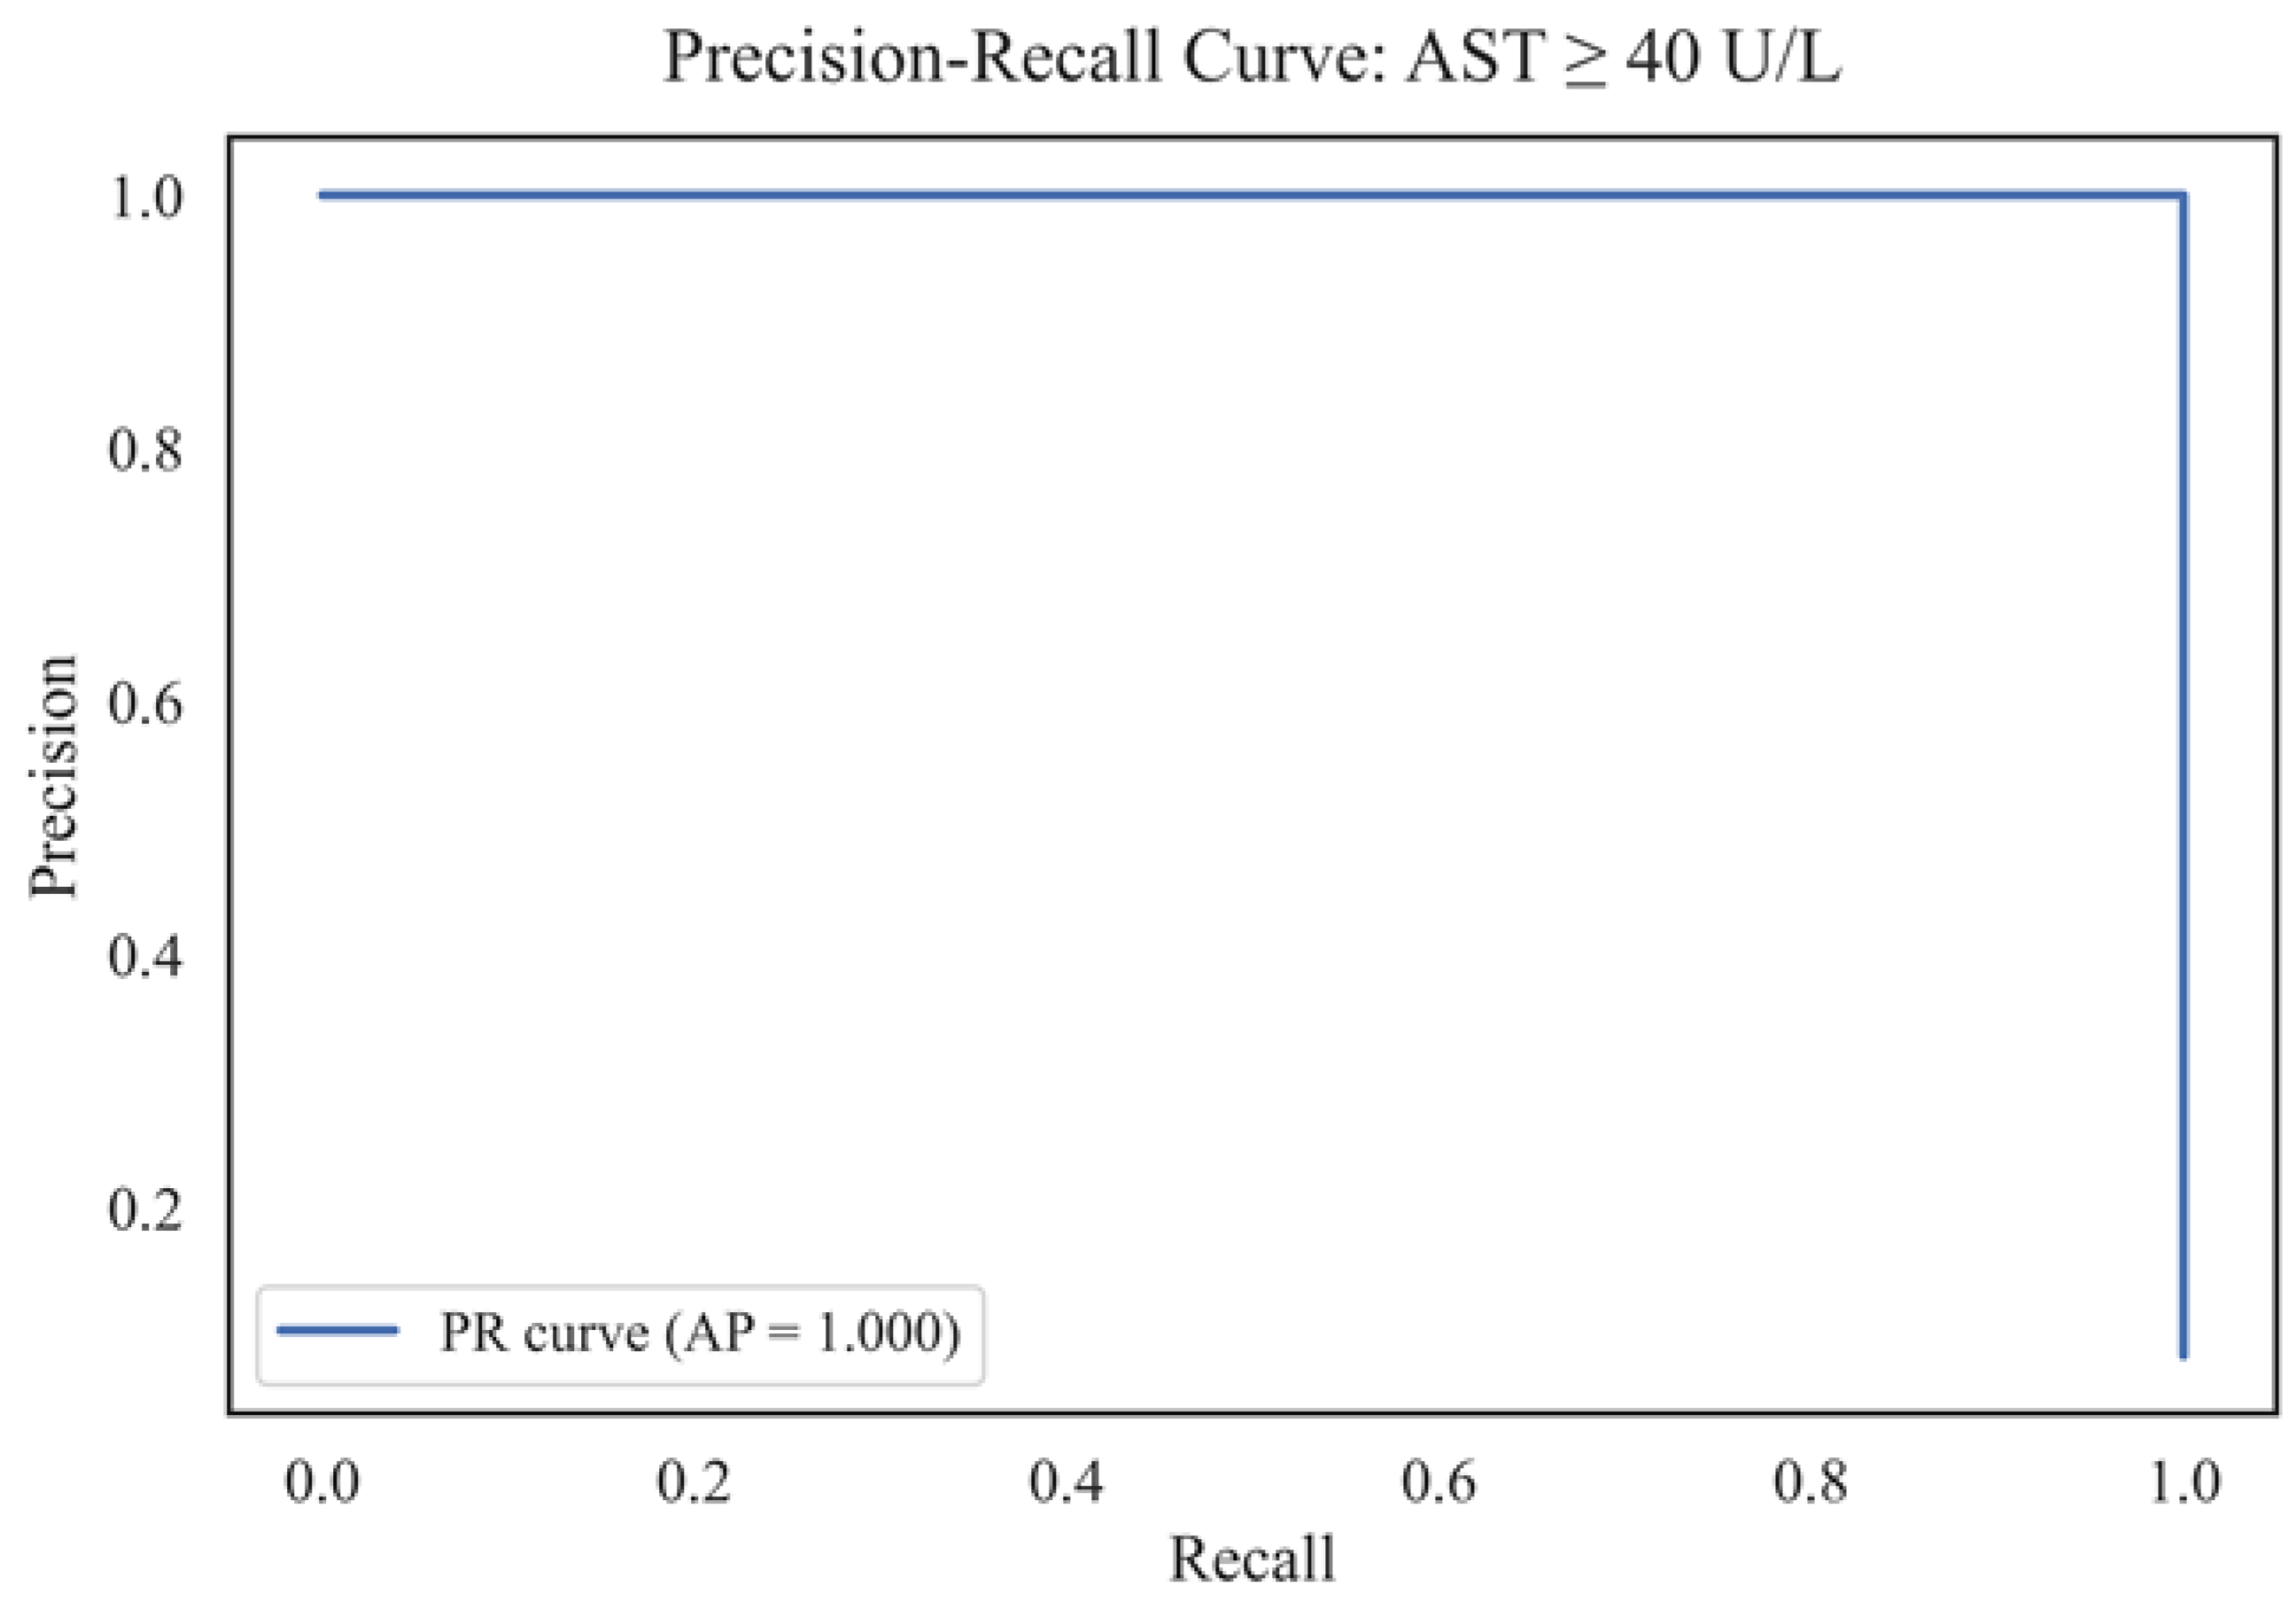

Table 1.
Comparative review of studies on the application of machine learning methods for disease prediction associated with biomarkers (including AST).
Table 1.
Comparative review of studies on the application of machine learning methods for disease prediction associated with biomarkers (including AST).
| Ref. | Study Focus | Methods | Key Findings | Identified Gaps |
|---|---|---|---|---|
| [19] | Predicting liver enzyme elevation in RA patients on methotrexate | Random Forest classifier on EHR data | ML model accurately predicts transaminase elevation | Specific to RA patients; limited generalizability |
| [20] | ML models for MASLD prediction using demographic and clinical data | Comparison of 10 ML algorithms, including XGBoost and Random Forest | High accuracy in MASLD screening; accessible features | Did not focus on AST-specific prediction |
| [21] | ML with SHAP for NAFLD prediction | ML models with SHAP interpretability | Robust predictive tool for NAFLD; high accuracy and generalizability | Lacks longitudinal data and lifestyle factors |
| [22] | ML models for cardiovascular disease diagnosis using routine blood tests | Logistic Regression, Random Forest, SVM, XGBoost, DNN | Effective diagnosis using accessible blood data; SHAP for interpretation | Focused on cardiovascular diseases, not liver-specific |
| [23] | ML models in liver transplantation prognostication | A systematic review of ML applications | ML models outperform traditional scoring systems in predicting post-transplant complications | Emphasis on transplantation, not general AST prediction |
| [24] | Early liver disease prediction using deep learning | Deep learning algorithms | A promising approach for rapid and accurate liver disease diagnosis | Requires further validation and integration into clinical practice |
| [25] | Comparison of ML models for liver disease detection using big data | Evaluation of three ML models on 32,000 records | Enhanced prediction and management of liver diseases | Specific models and features not detailed |
| [26] | ML model to predict liver-related outcomes post-hepatitis B cure | ML-based risk prediction model | Accurate forecasting of liver-related outcomes after functional cure | Focused on hepatitis B, not general AST prediction |
| [27] | Comparative analysis of ensemble learning techniques for fatigue life prediction | Boosting, stacking, bagging vs. linear regression and KNN | Ensemble models outperform traditional methods in prediction tasks | Application in fatigue life; relevance to AST prediction indirect |
Table 2.
Description of variables used in the aspartate aminotransferase (AST) level prediction model.
Table 2.
Description of variables used in the aspartate aminotransferase (AST) level prediction model.
| Variable | Description |
|---|---|
| RIDAGEYR | Age of respondent (years) |
| RIAGENDR | Gender (1 - male, 2 - female) |
| BMXWT | Body weight (kg) |
| BMXHT | Height (cm) |
| LBXFER | Ferritin (mcg/L) |
| LBXHCY | Homocysteine (µmol/l) |
| LBXTC | Total cholesterol (mmol/l) |
| LBDLDL | Low-density lipoproteins (mmol/l) |
| LBXGLU | Fasting glucose (mmol/l) |
| LBXHGB | Hemoglobin (g/l) |
| LBXSCR | Creatinine (µmol/l) |
| LBXCRP | hs-CRP (mg/L) |
| LBXSAPSI | Alkaline phosphatase (U/L) |
| LBXSGTSI | Gamma-glutamyl transferase (U/L) |
| LBXSLDSI | LDH (U/L) |
| LBXSBU | Urea (mmol/L) |
| LBXSUA | Uric acid (mmol/L) |
| LBXWBCSI | Leukocytes (10^9/L) |
| ALQ130 | Average number of alcoholic drinks per day |
| PAD615 | Physical activity level (min/week) |
| LBXSASSI | AST (target, U/L) |
Table 3.
Main parameters of the models and the structure of the ensembles.
| Model | Brief Description | Key parameters |
|---|---|---|
| Linear Regression | Basic Interpretable Model | default |
| Random Forest | Decision Tree Ensemble | n_estimators=300, max_depth=8, random_state=42 |
| XGBoost | Gradient Boosting | n_estimators=300, max_depth=8, learning_rate=0.05, objective='reg:squared error, random_state=42 |
| CatBoost | Robust Gradient Boosting | iterations=1200, depth=6, learning_rate=0.03, loss_function='Huber:delta=2.0', random_state=42 |
| Stacking_v1 | Linear + RF + XGBoost | meta=Linear Regression |
| Stacking_v2 | CatBoost + LGBM + ExtraTrees | meta=Ridge Regression (alpha=1.0) |
| Stacking_v3 | CatBoost + LGBM + XGB + RF + high_AST | meta=LGBM (huber), passthrough=True, регрессoр “high_AST”: LGBM (objective='huber', n_estimators=400) |
| Advanced Stacking | Specialized regressor for high_AST | LGBM (separately on the subsample with high AST) |
Table 4.
Results of mediator analysis of the influence of biomarkers and lifestyle factors on aspartate aminotransferase (AST) levels.
Table 4.
Results of mediator analysis of the influence of biomarkers and lifestyle factors on aspartate aminotransferase (AST) levels.
| Mediator | Path | Coef. | SE | p-value | 95% CI (low) | 95% CI (upper) | Significance | Description of the effect |
|---|---|---|---|---|---|---|---|---|
| LBXFER Ferritin |
Direct | 0.0231 | 0.0040 | 1.20e-8 | 0.0155 | 0.0309 | Yes | Major contribution via direct path (significant) |
| Indirect | -0.0003 | 0.0010 | 0.672 | -0.0026 | 0.0013 | No | The indirect effect is not significant. | |
| Total | 0.0229 | 0.0040 | 3.58e-8 | 0.0150 | 0.0309 | Yes | The overall effect remains | |
| LBXSGTSI Gamma-GT |
Direct | 0.0138 | 0.0041 | 9.42e-4 | 0.0057 | 0.0218 | Yes | Significant direct influence |
| Indirect | 0.0092 | 0.0027 | 0.000 | 0.0047 | 0.0154 | Yes | The indirect effect is statistically significant. | |
| Total | 0.0229 | 0.0040 | 3.58e-8 | 0.0150 | 0.0309 | Yes | Overall mediation effect | |
| BMXHT Height (cm) |
Direct | 0.0201 | 0.0042 | 2.55e-6 | 0.0119 | 0.0284 | Yes | Significant direct path |
| Indirect | 0.0028 | 0.0019 | 0.008 | 0.0004 | 0.0078 | Yes | The indirect effect is significant. | |
| Total | 0.0229 | 0.0040 | 3.58e-8 | 0.0150 | 0.0309 | Yes | The overall effect is maintained | |
| LBXSBU Urea (BUN) |
Direct | 0.0262 | 0.0042 | 1.97e-9 | 0.0179 | 0.0345 | Yes | The main effect is direct. |
| Indirect | -0.0033 | 0.0015 | 0.000 | -0.0071 | -0.0013 | Yes | The indirect effect is statistically significant. | |
| Total | 0.0229 | 0.0040 | 3.58e-8 | 0.0150 | 0.0309 | Yes | The final effect is confirmed | |
| LBXGLU Fasting glucose |
Direct | 0.0241 | 0.0040 | 7.70e-9 | 0.0162 | 0.0320 | Yes | The direct effect is clearly expressed. |
| Indirect | -0.0011 | 0.0007 | 0.008 | -0.0035 | -0.0002 | Yes | The indirect effect is expressed. | |
| Total | 0.0229 | 0.0040 | 3.58e-8 | 0.0150 | 0.0309 | Yes | The overall effect is confirmed | |
| LBXSLDSI |
Direct | 0.0198 | 0.0039 | 6.32e-7 | 0.0122 | 0.0274 | Yes | Significant direct contribution |
| Indirect | 0.0031 | 0.0019 | 0.004 | 0.0009 | 0.0082 | Yes | The indirect effect is statistically significant. | |
| Total | 0.0229 | 0.0040 | 3.58e-8 | 0.0150 | 0.0309 | Yes | The overall effect is expressed | |
| PAD615 activity in min | Direct | 0.0238 | 0.0040 | 8.59e-9 | 0.0159 | 0.0316 | Yes | The main contribution is direct. |
| Indirect | -0.0008 | 0.0008 | 0.240 | -0.0030 | 0.0003 | No | The indirect effect is insignificant. | |
| Total | 0.0229 | 0.0040 | 3.58e-8 | 0.0150 | 0.0309 | Yes | The final effect is confirmed. |
Disclaimer/Publisher’s Note: The statements, opinions and data contained in all publications are solely those of the individual author(s) and contributor(s) and not of MDPI and/or the editor(s). MDPI and/or the editor(s) disclaim responsibility for any injury to people or property resulting from any ideas, methods, instructions or products referred to in the content. |
© 2025 by the authors. Licensee MDPI, Basel, Switzerland. This article is an open access article distributed under the terms and conditions of the Creative Commons Attribution (CC BY) license (http://creativecommons.org/licenses/by/4.0/).
Copyright: This open access article is published under a Creative Commons CC BY 4.0 license, which permit the free download, distribution, and reuse, provided that the author and preprint are cited in any reuse.


