Submitted:
26 June 2025
Posted:
26 June 2025
You are already at the latest version
Abstract
The paper deals with the analysis of living standards in the context of economic performance of OECD countries. The main goal of this work is to provide an analysis of living standards in selected OECD countries for the period 2005 to 2019. We analyze the impact of GDP growth on the development of indicators measuring living standards. The third part of the work deals with proposals to improve the living standards and economy of the specific countries. In the work, we analyzed three indices measuring the standard of living, the human development index, the health care index and the global happiness index. We compared the development of the indices with the development of GDP in selected countries by statistical evaluation through the Pearson correlation coefficient. The economies of the V4 and Scandinavian countries grew during the period under review. The performance of the Scandinavian economies is at a much higher level than that of the V4 economies. The results can be used to provide suggestions and measures to improve the standard of living in the countries concerned, as well as for futher research of indicators, influecing development of the analyzed indexes.
Keywords:
OECD
; standard of living
; economic growth
; unemployment rate
; gross domestic product
; human development index
1. Introduction
Standard of living is a concept that each of us has encountered. All governments in the world deal with the issue of standard of living and in various ways try to ensure good living conditions and conditions for the growth of the standard of living for their citizens. In the presented contribution, we deal with the impact of economic performance on the standard of living in selected OECD countries. We provide a statistical analysis of the connections between the impact of GDP growth and the growth of the standard of living. The task of the work is to identify the connection between economic performance and the growth of the standard of living. A significant part of the work is the statistical analysis of the impact of GDP on the development of individual indicators of the standard of living.
2. Present State of Problem Solving
Standard of living is closely connected to the competitiveness (Madzík et al., 2015), and economic factors, such as incomes and spending, the consumpiton of materila goods and services, living conditions and GDP (Sibirskaya et al., 2019). Moreover social factors should be considered (Emtseva et al., 2015). Yaprakli and Ozden (2021) added also environmental indicators, necessary for economic complexity in sustainable development of living standards. However, MacFeele et al. (2024) discussed GDP has outlived its usefulness, which arise from changes in the economy and society, arguing well-being and living standard should be rather connecte to the competitiveness. It is in accord with research of Jones et al. (2016), pointint welfare is highly correlated with GDP per capita, when deviations are often large in different regions. For example Western Europe looks considerably closer to the United States, emerging Asia has not caught up as much, and many developing countries are further behind.
In last worldwide development, Acheampong et al. (2022) focused their reserach on whether ICT and transport infrastructure enhance human development outcomes, finding positive impact in developing countries with smooth differences among South Asia, subSaharan Africa and Latin America-Caribbean. Moreover, according to Ahmad et al. (2023), human well-being is negatively impacted mostly in emerging nations by depletion of natural resources and financial risk, resulting in worldwide crisis. Therefore, green innovation and economic globalization positively contribute to the solving of mentioned problem.
This point out to the necessity to study presented area in across the regions. It results from the influence of globalization on different components of social spending that varies across welfare models in intensity (Santos and Simoes, 2021). Number of studies are provided for OECD countries, such as Bílková (2019), clustering countries according to the variables, influencing living standard, showing Czechia ranks alongside other post-communist countries (except Slovenia). The research continued by further clustering (Bílková, 2020), providing sufficient data for prediction of the standard of living development. Wage level is one of the most important indicators of the standard of living, mostly in Luxembourg, Switzerland, Iceland, the U.S., the Netherlands, Denmark, Norway and Austria (the highest average wage growth rate by 2022 being expected in the Baltic and some other post-communist countries) (Bílková, 2020b).
According to Balestra et al. (2018), the main factors, influencing living standard in OECD are jobs, housing, community, health, education, civic engagement, safety, life satisfaction and work-life balance. It means, living standards evaluation at the regional level demands multidimensional evaluation (Veneri and Murting, 2019), when metropolitan residnets experience higher level of living standards and income than in other regions. Guler (2018) with Turkey, finding that social expenditures in both regions have been considerably increased, compares OECD in study. Further, in OECD Bradoudakis et al. (2022) studied the relationship between productivity, economic efficiency and living standards and their findings show the impact of capital productivity on higher living standards depends on the evolutionary and institutional background of the economy at hand. Yang et al. (2024) evaluated living standard in OECD from the view of multidimensional connections between natural resources and the well-being of people. They found how crucial sustainable environmental practices, improved institutional quality, and balanced economic growth are to promoting overall development. Latest studies show that that the impact of labor productivity on human development differs significantly from the impact of investment decisions. The result shows that investment decisions will have a positive impact on human development when there is an insignificant capital fixed formation to boost the productivity of OECD economies. Further, the result shows that the organization governments through the provision of social security and essential services have a positive impact on the OECD human development (Akinyele, 2024).
Corejová et al. (2018) studied region of V4, finding similarities as well as differences in Slovakia, Czech Republic, Hungary and Poland. In China, Li et al. (2024) found that no individual factor of the ecosystems of doing business was necessary to achieve high living standards, but the high level of human capital, innovation capacity, financial access and market demand play a significant role in achieving high living standards.
3. Methodology
The main objective of the thesis is to evaluate the standard of living of selected countries in the period 2005 to 2019.
• Define the theoretical framework of the given issue
• Evaluate the state and development of the economies of the countries based on socio-economic indicators
• Identify the weaknesses and strengths of the standard of living
• Analyze the connection between GDP growth and the growth of the standard of living
• Discussion and suggestions
Based on data obtained from the Internet, we evaluated the development of macroeconomic indicators of selected countries and using indicators measuring the standard of living, we evaluated the impact of the country's economic growth on the standard of living. We chose two blocks of countries for the research - V4 countries and the Scandinavian countries. We chose the V4 countries and the Scandinavian countries because of the close cooperation of the V4 countries among themselves and the cooperation of the Scandinavian countries. These two groups of countries have common features, so we chose them for comparison. We calculated the statistical analysis of the relationship between living standards indicators and the development of gross domestic product in the statistical program Gretl. We verified the hypotheses using a statistical test - Pearson's correlation coefficient. The paper is based on the creation of a database of individual indicators in a specified horizon of years in the form of tables in the MS Excel program. Macroeconomic indicators come from the World Bank database and statistical databases of selected countries. Data on living standards indicators come from the Numbeo, CountryEconomy and GlobalEconomy databases.
The research had been done through a complex of living standard indicators. The standard of living can be defined as a measure of the quality of life or the level of material prosperity enjoyed by individuals, a specific demographic group or a geographical region, such as a country. In economics, the standard of living is usually used to determine the relative prosperity of the population of an entire country and is often compared with the standard of living enjoyed by residents in other countries (GRIMSLEY 2021). The standard of living describes material development, i.e. the quantity and quality of goods and services available. It is usually measured through the level of real income per person, the number of goods and services consumed or the equipment of households with certain products. The standard of living is one of the determinants of the quality of life.
The standard of living is a broad, complicated socio-economic category characterizing the achieved level of development and satisfaction of the physical, spiritual and material needs of a person and the conditions under which these needs are satisfied. In statistics, we express the standard of living quantified, i.e. in measurable quantities. It is characterized mainly by income, expected consumption per person, etc., i.e. real wages, or pensions of the population, a factor that is in constant dynamic movement and is changing over time. In general, we can characterize the standard of living as the level of satisfaction of the population's vital needs and the sum of the conditions under which they are satisfied (Knausová 2005).
3.1. Index of Human Development
States, institutions and individuals are interested in information about the achieved economic level of a given country, with which we can compare the economic level of individual regions. Nowadays, the most important and most widely used indicator with which we can measure and interpret the achieved level of human development is the Human Development Index – HDI. When calculating the HDI, the following factors are also taken into account (Matúš, Bednárik, Fašiang 2016):
• life expectancy of the population of a given country,
• achieved educational level of the population of a given country,
• quality of life of people expressed by real GDP per capita.
The HDI determines the maximum and minimum levels for each sub-indicator, e.g. for real GDP per capita - expressed in US dollars converted through purchasing power parity - the minimum level is $100 and the maximum level is $40,000. For the adult literacy rate, the minimum value is 0% and the maximum value is 100%. In the 21st century, a developed country is considered a state that creates conditions for its citizens to achieve a long and healthy life, to achieve the highest possible education, and to create conditions for them to obtain the resources necessary to achieve an average life expectancy (Bednárik and Fašiang, 2016). The Human Development Index (HDI) is a comprehensive measure of human development. It measures the average achievement of a country in three main dimensions of human development: a long and healthy life, access to knowledge and a decent standard of living. The Human Development Index is the geometric mean of normalized indices measuring achievement in each dimension (The world bank 2021). The HDI is used to produce a global assessment of human development. This annual classification allows, on the one hand, tracking a country’s development over time and, on the other hand, to compare its situation with that of other countries. In this way, governments can better understand their growth potential and international aid can be allocated more judiciously (Iberdrola 2021).
The HDI is the geometric mean of the three dimensions mentioned above, with the indices calculated separately for each country using data on life expectancy, education and per capita income. The result always gives a value between 0 and 1, which, according to the UNDP, defines four levels of human development, detailed below (Iberdrola 2021):
• Very high: countries with an HDI above 0.80,
• High: countries with an HDI between 0.70 and 0.80,
• Medium: countries with an HDI between 0.55 and 0.70,
• Low: countries with an HDI below 0.55.
The HDI was created to emphasize that people and their capabilities should be the ultimate criterion for evaluating a country’s development, not just economic growth. The HDI can also be used to challenge domestic policy decisions and ask how two countries with the same level of GNI per capita can end up with different human development outcomes. Such contrasts can stimulate debate about government policy priorities. The Human Development Index (HDI) is a summary measure of average achievement in key dimensions of human development: a long and healthy life, information, and a decent standard of living. The HDI is the geometric mean of normalized indices for each of the three dimensions (Institute of Financial Policy, 2021). The HDI is used to capture the attention of the media, policymakers, and non-governmental organizations and to shift the focus from routine economic statistics to human outcomes. It was created to re-emphasize that people and their capabilities should be the ultimate criterion for evaluating a country’s development, not economic growth (World Health Organization 2021). The HDI is also used to explore how two countries with the same level of per capita income can have very different human development outcomes. For example, two countries may have similar per capita incomes but differ significantly in life expectancy and literacy rates, so that one country has a much higher HDI than the other. These contrasts stimulate discussion about government policies related to health and education to explore why what can be achieved in one country is beyond the reach of another (World Health Organization 2021). The HDI is also used to highlight differences within countries, between provinces or states, and between genders, ethnic groups, and other socioeconomic groupings. Highlighting internal differences in this regard has sparked national debate in many countries (World Health Organization 2021).
3.2. Index of Health Care
The term “healthcare” refers to the combined operation of public health services and personal health care services. The health system encompasses all activities and structures whose primary purpose is to influence health in the broadest sense. This term is consistent with the WHO’s use of the term health system: “all activities whose primary purpose is to promote, restore or maintain health” (Arah, Westert, Hurst, Klazinga 2006). Many people and governments consider access to health care to be a basic human right. People who do not have access to quality health care often have a poorer quality of life and a shorter life expectancy than people who have access to a stable, accessible and affordable health care system. Countries with effective health care systems have better overall health outcomes than countries whose health care systems are lagging behind (World Population Revies 2021).
Quality of healthcare is a key factor in the performance of a health system. Quality of healthcare means that the care provided is (Organization for Economic Cooperation and Development 2021):
• Effective: achieving desired outcomes, assuming the correct provision of evidence-based healthcare services to all who could benefit from it, but not to those who would not benefit from it
• Safe: reducing harms caused in the provision of healthcare
• Patient-centred: placing the patient/user at the centre of healthcare provision.
The Health Care Index is a statistical analysis of the overall quality of a health care system, including healthcare infrastructure, the competence of health workers (doctors, nurses and other health professionals), costs, availability of quality medicines and government preparedness. It also takes into account other factors such as the environment, hygiene, access to clean water, and government preparedness to impose fines for risks such as tobacco use and obesity. The ranking focuses on 89 countries around the world according to five different health variables, namely (Ireland 2021):
• Infrastructure
• Professionals
• Costs
• Availability of medicines
• Government preparedness
The quality of healthcare is determined by considering a vast range of factors including the process of care (preventive care measures, safe care, coordinated care, and patient involvement and preferences), access (affordability and timeliness), administrative efficiency, equity and healthcare delivery, outcomes (population health, healthcare-attributable mortality), and disease-specific health outcomes (World Population Review 2021).
3.3. World Hapinnes Index
The World Happiness Index (WHI) is a benchmark survey of global happiness that assesses 156 countries (Mäsiarová 2021). Looking at how people live their lives in other countries can be fascinating. Especially when we look at how happy individual countries are collectively. The goal of humanity is to strive for happiness, and while people become happy in their own individual ways, there are ways to measure overall happiness in a given area. Since 2012, the UN has had a World Happiness Report that measures the happiness of all participating countries in the world (LifehackK 2019). In order to properly compare each country’s data, the researchers created an imaginary country they called Dystopia. They populated Dystopia with “the least happy people in the world.” They then set Dystopia as the lowest possible value in each of the six categories and measured the scores of real-world countries against that value. All six variables were then mixed together to create a single combined score for each country (World Population Review 2022).
When creating the World Happiness Report, a ranking of countries is created according to various indicators. The following are taken into account when evaluating countries (Mäsiarová 2021):
• GDP per capita,
• Social support,
• Healthy life expectancy,
• Freedom to make life decisions,
• Generosity,
• Perception of corruption.
3.4. Difference Between Standard of Living and Quality of Life
Standard of living and quality of life are two very similar and related concepts. While standard of living mainly includes financial components, quality of life also includes non-financial components such as happiness, health and security (Pediaa 2020). The terms standard of living and quality of life are often confused and misunderstood terms. There are many people who consider these terms synonymous, due to the fact that they associate material success in life with a high quality of life. However, wealth and possession of valuable things do not guarantee a happy and satisfied life, which is closer to the concept of quality of life (Sawakinome 2021). The feeling of well-being and happiness form the basis of quality of life. This means that when assessing the quality of life, not only wealth and material goods are taken into account, but also the health of the country's inhabitants, the level of education, the means of recreation and the way they spend their free time. These are some of the factors that are taken into account when deciding on the quality of life of the country's citizens (Strephonsays 2021). It is obvious that many indicators that determine the quality of life are of a nature that cannot be measured quantitatively and therefore are not easy to compare. For example, there may be people who have a very high standard of living, but may have a low quality of life because they are not happy or satisfied with their lives.
Quality of life can be defined as an individual’s view of their position in life in relation to the cultural and value system to which they belong and includes both positive and negative aspects of life (Surbhi 2021).
• It is based on the individual’s life situations.
• It includes a person’s physical and psychological health, along with their degree of independence, social associations, and the way they interact with their surroundings.
• It can be measured by both objective and subjective indicators, but is generally measured using descriptive measures such as satisfaction and happiness.
The main differences between standard of living and quality of life are (Surbhi 2021):
1. Standard of living is used to refer to the level of income, necessities, services and other material well-being that are readily available to the inhabitants of a particular country. On the other hand, quality of life can be defined as the kind of life that a person or group lives with regard to their physical and psychological well-being, independence and social relationships.
2. Standard of living needs a macro perspective, as it talks about the way of life of the total population in a certain geographical area. On the other hand, quality of life needs a micro perspective, which takes into account the circumstances and perceptions of individuals.
3. While standard of living determines the material well-being of the citizens of a country, i.e. the pursuit of comfort and luxury in life, quality of life expresses the well-being of a person, i.e. how happy, peaceful or satisfied a person is with his life.
4. The factors that influence the standard of living remain the same for all countries, while the factors that influence the quality of life vary from one person to another, which means that the definition of quality of life for one person may not be the same for another person.
5. The standard of living is based solely on the level of income, i.e. the higher the level of income, the higher the standard of living would be. Conversely, the quality of life is not based solely on the level of income, i.e. higher income does not necessarily mean better quality of life.
6. The standard of living can be expressed in the level of consumption and purchasing power, with higher levels of consumption and purchasing power indicating a high standard of living. Conversely, the quality of life can be expressed in the degree of freedom, freedom of choice, civil liberties that are available to people.
4. Results
4.1. Development of Indicators Measuring Living Standards
During the research, we resulted from the development of the analyzed indexes. As shown in the graph in Figure 1, Development of the Human Development Index in the Scandinavian and V4 countries, the index recorded in analyzed period increase mostly in all analyzed countries.
The index in Slovakia has been rising regularly every year. Its value increased from 0.796 in 2005 to 0.86 in 2019. According to the HDI value, Slovakia is among the countries with a very high level of human development. In Poland, the index increased from 0.813 in 2005 to 0.88 in 2019. The only drop was in 2012, when it fell from 0.845 to 0.842. Immediately after this drop, it recorded a sharp increase to 0.856 a year later. Looking at the values achieved by Poland, we can say that it belongs to the countries with a very high level of human development. The index in the Czech Republic shows an increasing trend. In 15 years, it increased by almost 0.05 points from 0.843 in 2005 to 0.9 in 2019. The Czech Republic belongs to the countries with a very high level of human development. Human development in Hungary is increasing. Over the monitored period, it increased from 0.805 to 0.854. Apart from 2011 and 2014, when it fell compared to the previous year, it has been growing steadily. According to the human development value, we can state that Hungary is among the countries with a very high level of human development. For Norway, it has increased by almost three tenths of a point in 15 years. If we take into account the value that Norway had in 2005, this is a solid growth. Looking at the human development value, we can state that Norway is among the countries with a very high level of human development and it is the country leading in this rating. Sweden is another country that achieves high values in measuring human development. The value of 0.945, which Sweden achieved in 2019, is among the highest among all participating countries. Since 2005, this index has gained more than 0.04 points. This makes Sweden a country with a very high level of human development. Finland's HDI has increased almost every year, except for 2009. In 2005, Finland scored 0.908 points and by 2019, it had improved by 0.03 points and scored 0.938 points. According to the assessment, Finland is among the countries with a very high level of human development. In Denmark, the Human Development Index has increased almost every year, except for 2007, 2009 and 2015 when it slightly decreased compared to the previous year. Denmark scored 0.94 points in 2019, which is 0.03 points more than it had in 2005. According to the obtained value, we classify Denmark as a country with a very high level of human development.
Following Figure 2 illustrates development of health care in analyzed countries, which show smooth decrease with fluctuating trend.
Although Slovakia's HDI shows an increasing standard of living, as evidenced by the increasing life expectancy in Slovakia, healthcare in Slovakia has not been developing in the best way. The healthcare index, which in 2012 had a value of 70.73 points, which was 30th place, jumped over the years to 51st place in 2013, 41st place in 2014, and in 2015 Slovakia fell to 70th place. After this drop, the index started to rise again, and in 2019 Slovakia ranked 54th, ahead of Poland and Hungary. The health status of Slovaks is improving, but most health indicators remain below the EU average.
Healthcare in Poland is stagnating, as evidenced by the Healthcare Index, which has barely budged since 2012, when Poland ranked 55th. In 2019, it reached 62.15 points, an increase of 5 places compared to 2012. When asked "how is your health," 60% of Poles answered that it was good. This is below the OECD average, but it indicates positive future developments.
The index in the Czech Republic grew quite intensively until 2013, when it fell. According to the value in 2019, 74.71 points, the Czech Republic ranked just outside the top 10 in the HCI ranking. Since 2012, we have seen a significant increase of almost 10 points and 30 positions, from which we can conclude that the Czech healthcare system is at a high level.
The situation in Hungary is improving significantly and we can expect similar developments in the near future. According to the Healthcare Index, Hungary is not doing well. In 2012, the index was 59.95, which represented 47th position, but in 2019, Hungary was ranked 80th with 48.24 points.
We see that the Norwegians have improved. In 2012 they were ranked 20th and in 2019 they were five places higher. Norway therefore has one of the best healthcare systems in the world. Overall, Norwegians can enjoy good health, which is also contributed by high-quality healthcare.
Sweden has a downward trend. We can see from the graph that in 2012 they scored 86.76 points, which was 10th place, while in 2019 they scored only 70.95 points, which was 25th place. This is a significant jump for the worse. Despite this, Sweden's healthcare system is well-funded and of a high standard.
Finland has dropped by 3.5 points compared to 2012. However, this does not mean that its healthcare system has deteriorated or that it has been ranked worse. In this ranking, Finland reached 22nd position in 2012 and was in 17th position in 2019. Finland is a country with a high level of social and living conditions, a low poverty rate. It has high-quality, decentralized healthcare.
Denmark has a very high level of healthcare. This claim is confirmed by the HCI, according to which Denmark ranked fifth overall in 2019. It has held this position essentially since 2012. Healthcare spending represents 10.1% of Denmark's GDP, which is above the EU average.
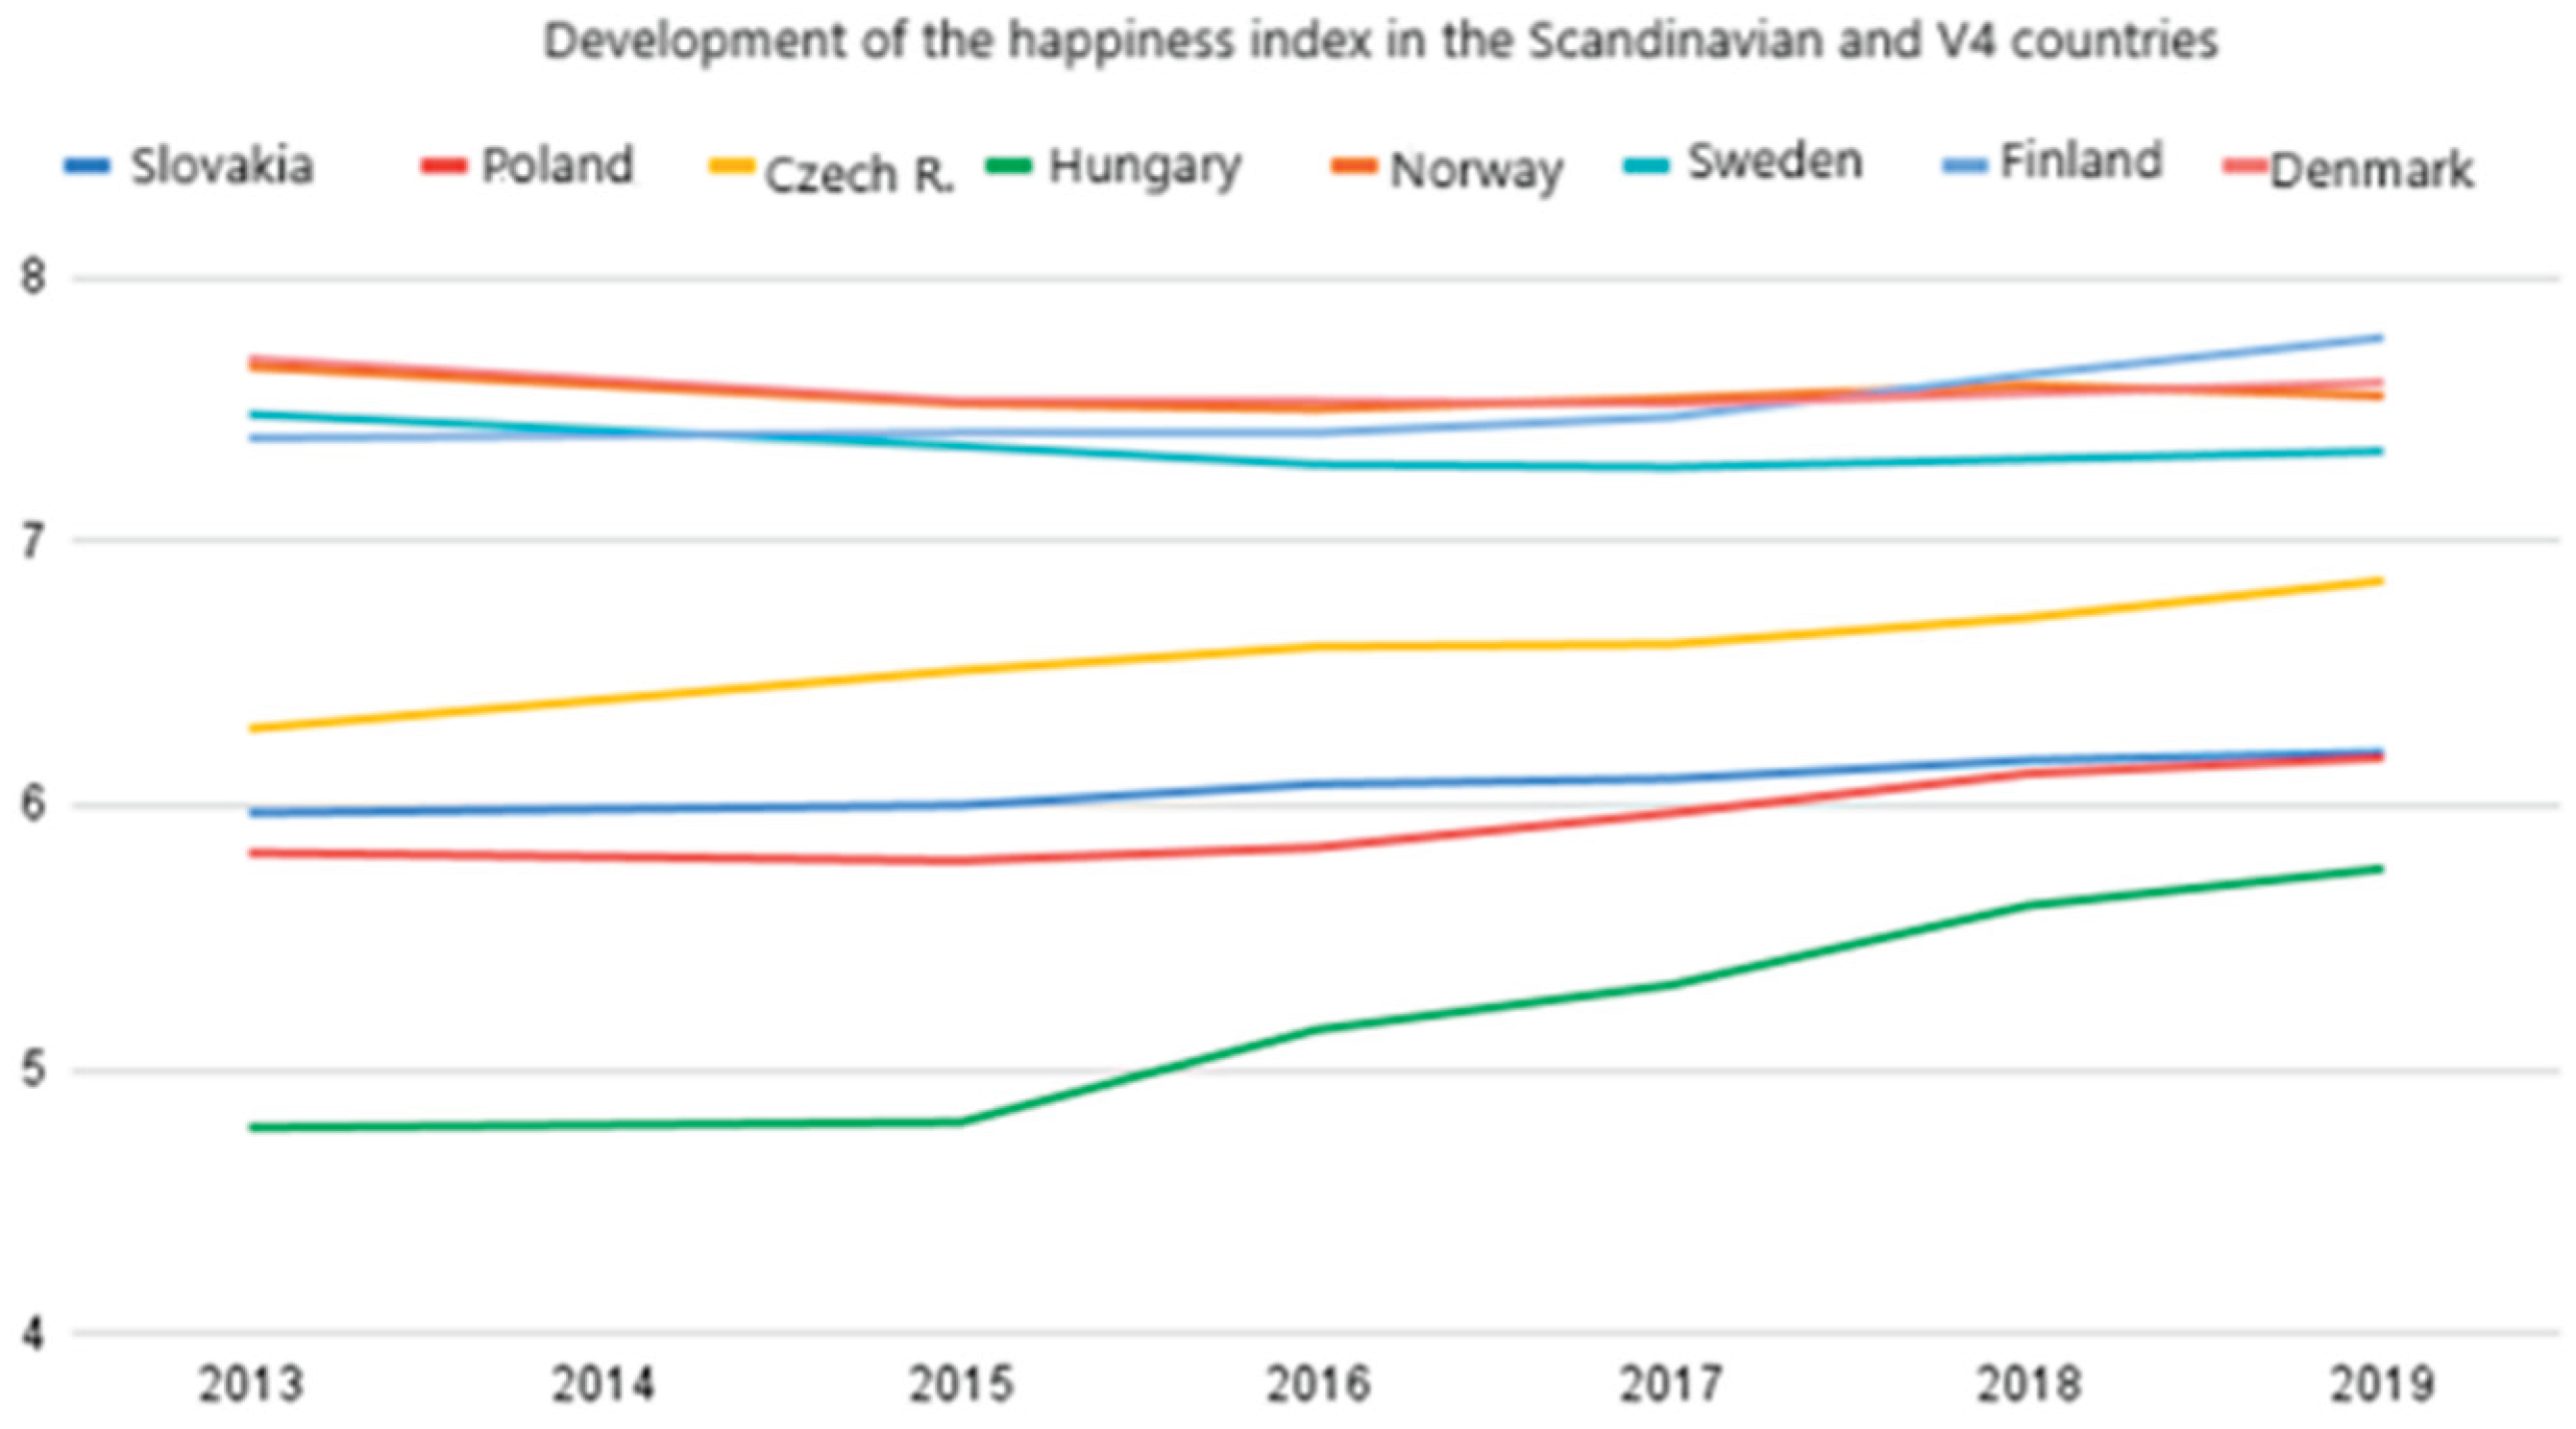
The next index, providing data for statistical evaluation of relationship between living standards and GDP growth, is world hapinnes index (see Figure 3). Figure 3 illustrates fluctuating trend of the index development in all analyzed countries.
The World Happiness Index also shows that the standard of living in Slovakia is increasing every year. The index grows regularly every year. Since the inception of this index, Slovakia has moved from a value of 5.96 and 47 places to a value of 6.2 in 2019, which represented 38th place. From a V4 perspective, Slovakia ranked ahead of Poland and Hungary, only the Czech Republic is better, but compared to Norway, Sweden, Finland and Denmark, Slovakia is significantly behind. If we look at how happy Poles are, in 2019 the World Happiness Index for Poland had a value of 6.18 points. Since the start of the measurement in 2013, this is an increase of more than 0.3 points. We can say that this is the average value for OECD countries. The Czechs scored 6.85 points in 2019, which is significantly above average. Since 2012, they have added 0.5 points, which makes the Czech Republic a country with a happy population. This is also indicated by the HDI, and high economic growth with a low unemployment rate. Hungarians scored 5.76 points in 2019, which is the average for OECD countries. Looking at the development, we see a significant improvement compared to 2013, when they scored 4.76 points. The fact that Hungary is happier is also indicated by the economic boom, low unemployment and wage growth. Norway's values have a decreasing trend. Norway reached the highest value right at the beginning of the measurement, namely 7.66 points, and in 2019, it had a value of 7.55. Regardless of the fact that the index has decreased, Norwegians are among the happiest countries among all countries. They are well above the average by almost two points. In Sweden, like Norway, the index showed a better value at the beginning of the measurement than at the end, we can say that the Swedes are a happy nation. In 2019, the happiness index for Sweden scored 7.34 points, which is well above average. If we look at how happy the Finns are, according to the World Happiness Index, the Finns scored 7.77 points in 2019, which is well above average and earned them the title. However, they have not always been the happiest country in the world. In 2013, they scored “only” 7.39 points in the WHI rating. The graph in Figure 3 shows an interesting development in Denmark. After the highest value in 2013, index fell slightly and has not reached the initial value. Nevertheless, the values achieved each year are well above the world average. In fact, Denmark has been in the top three since the beginning of the measurement of world happiness. In 2019, a score of 7.6 secured it second place. In fact, we can say that the Danes are a very lucky country and we can expect that they can overtake Finland and take the lead in the near future.
4.2. Statistical View of the Relationship Between Living Standards and GDP Growth
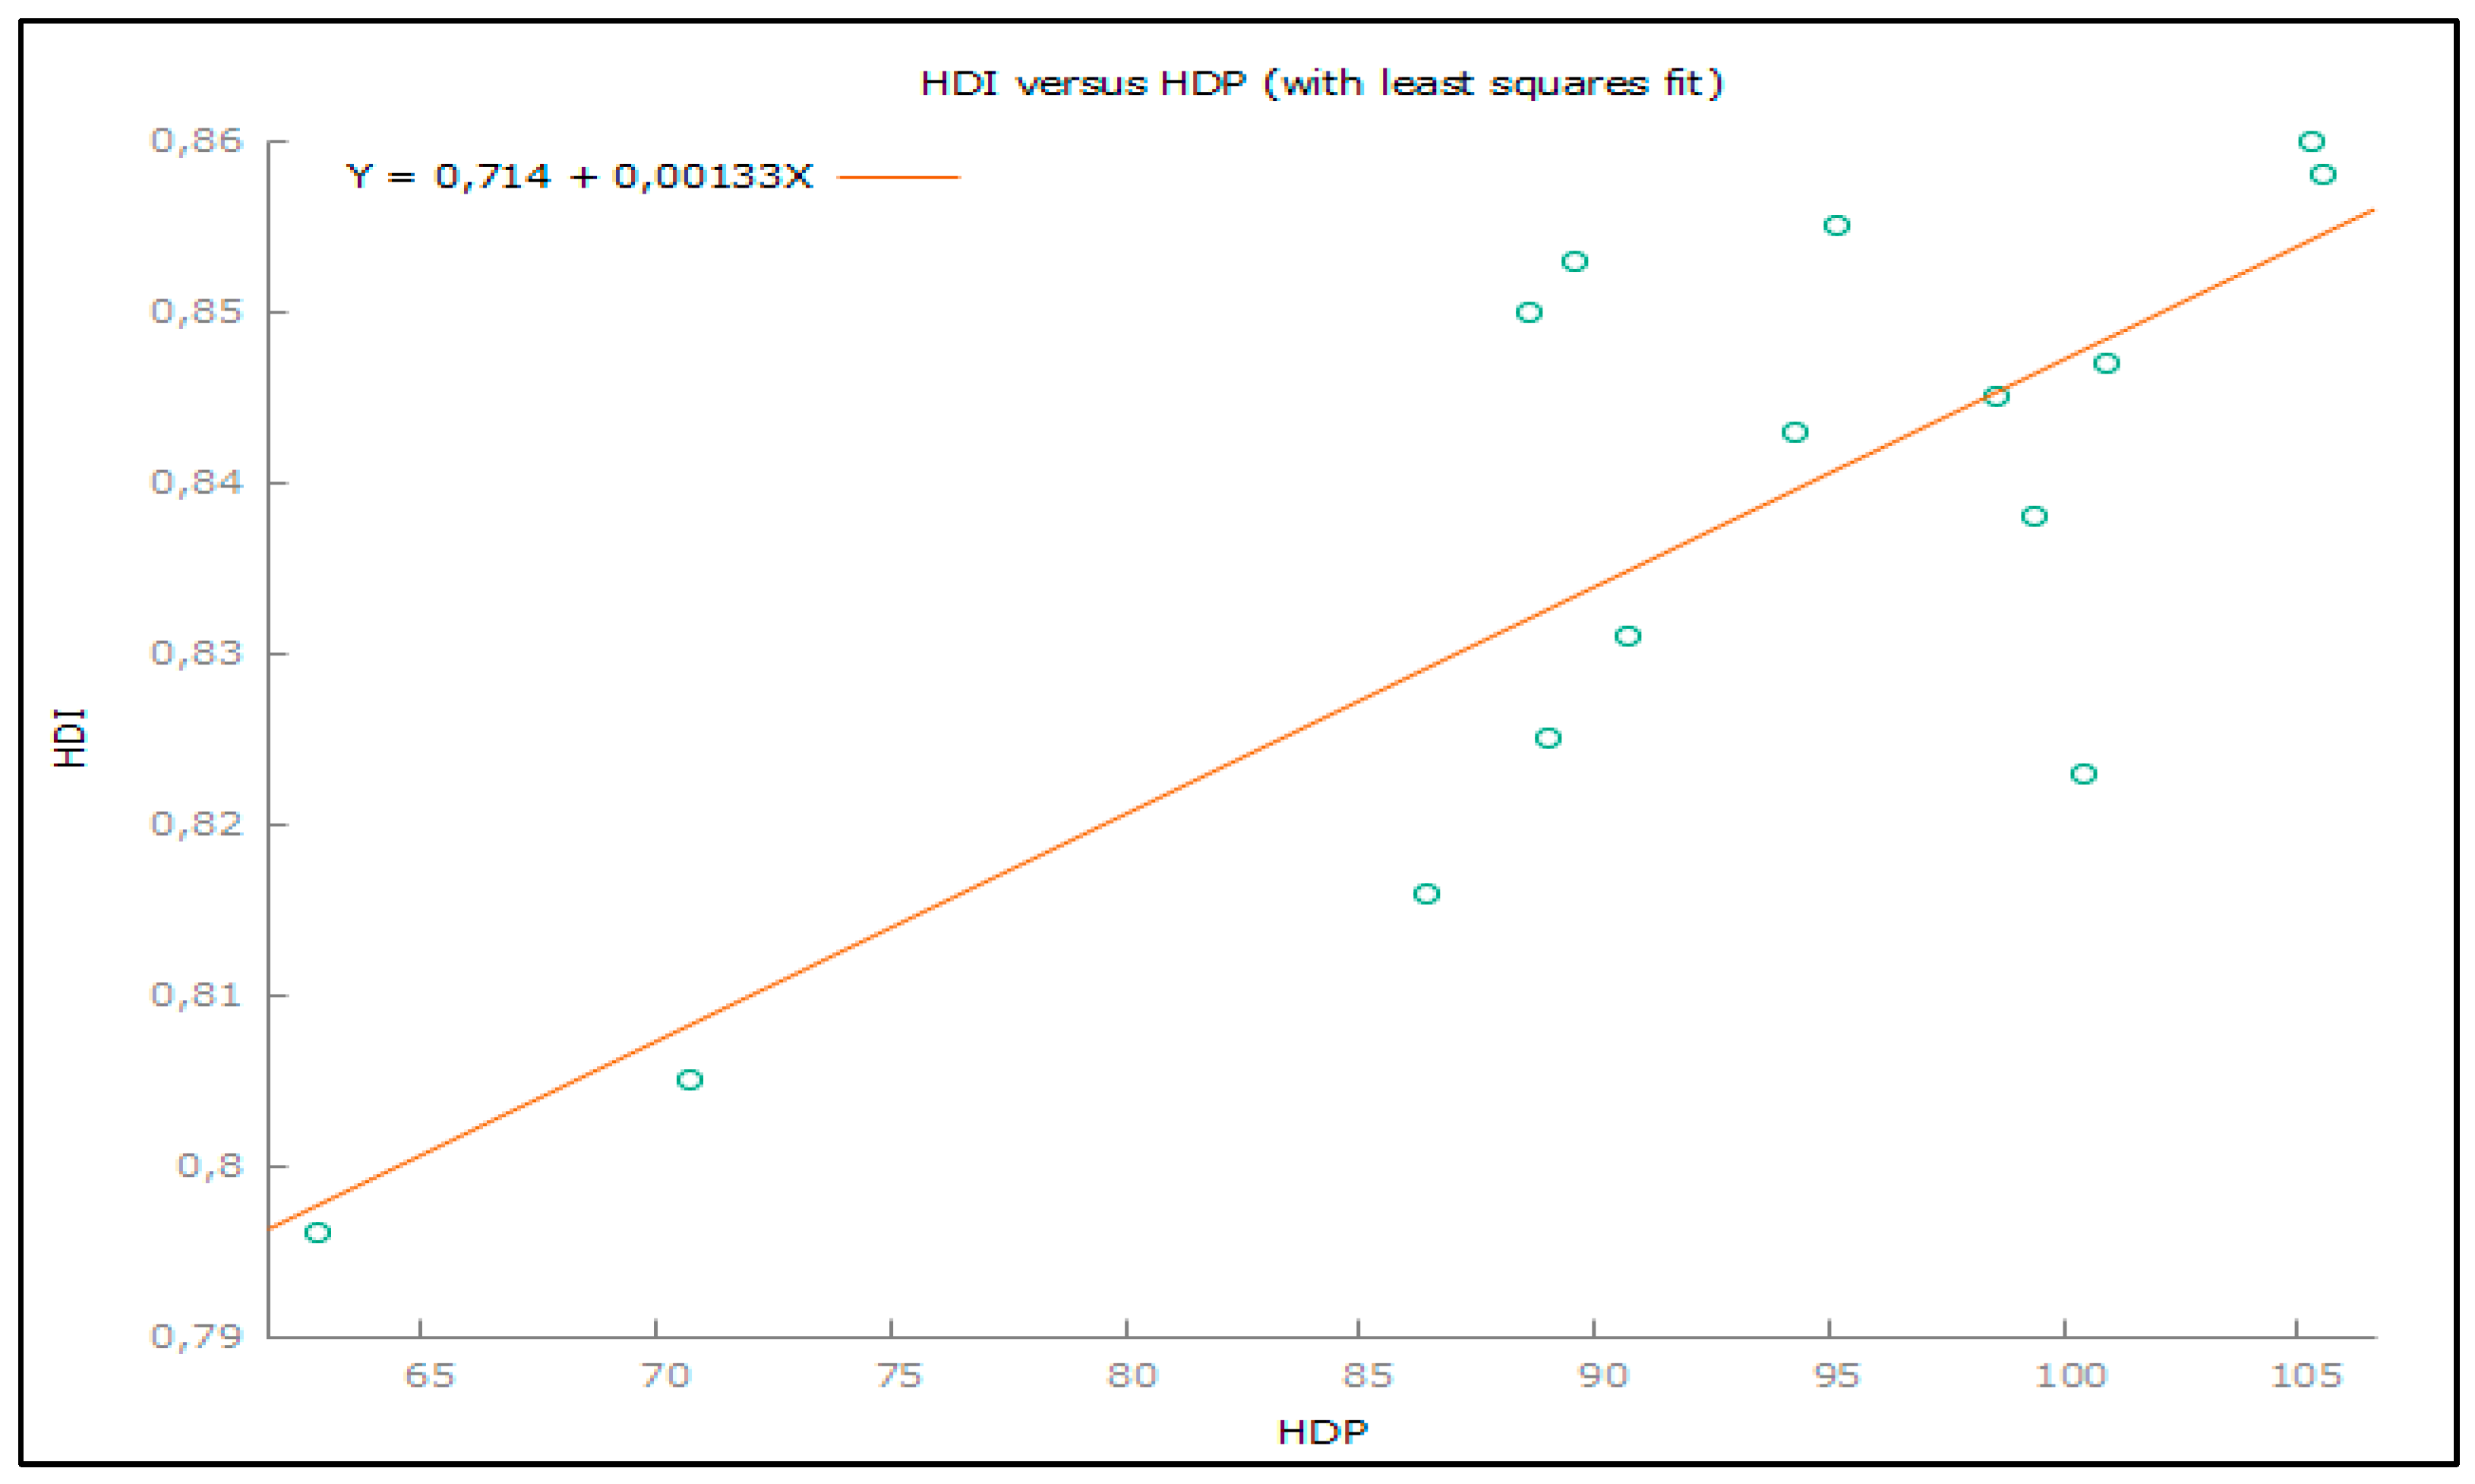
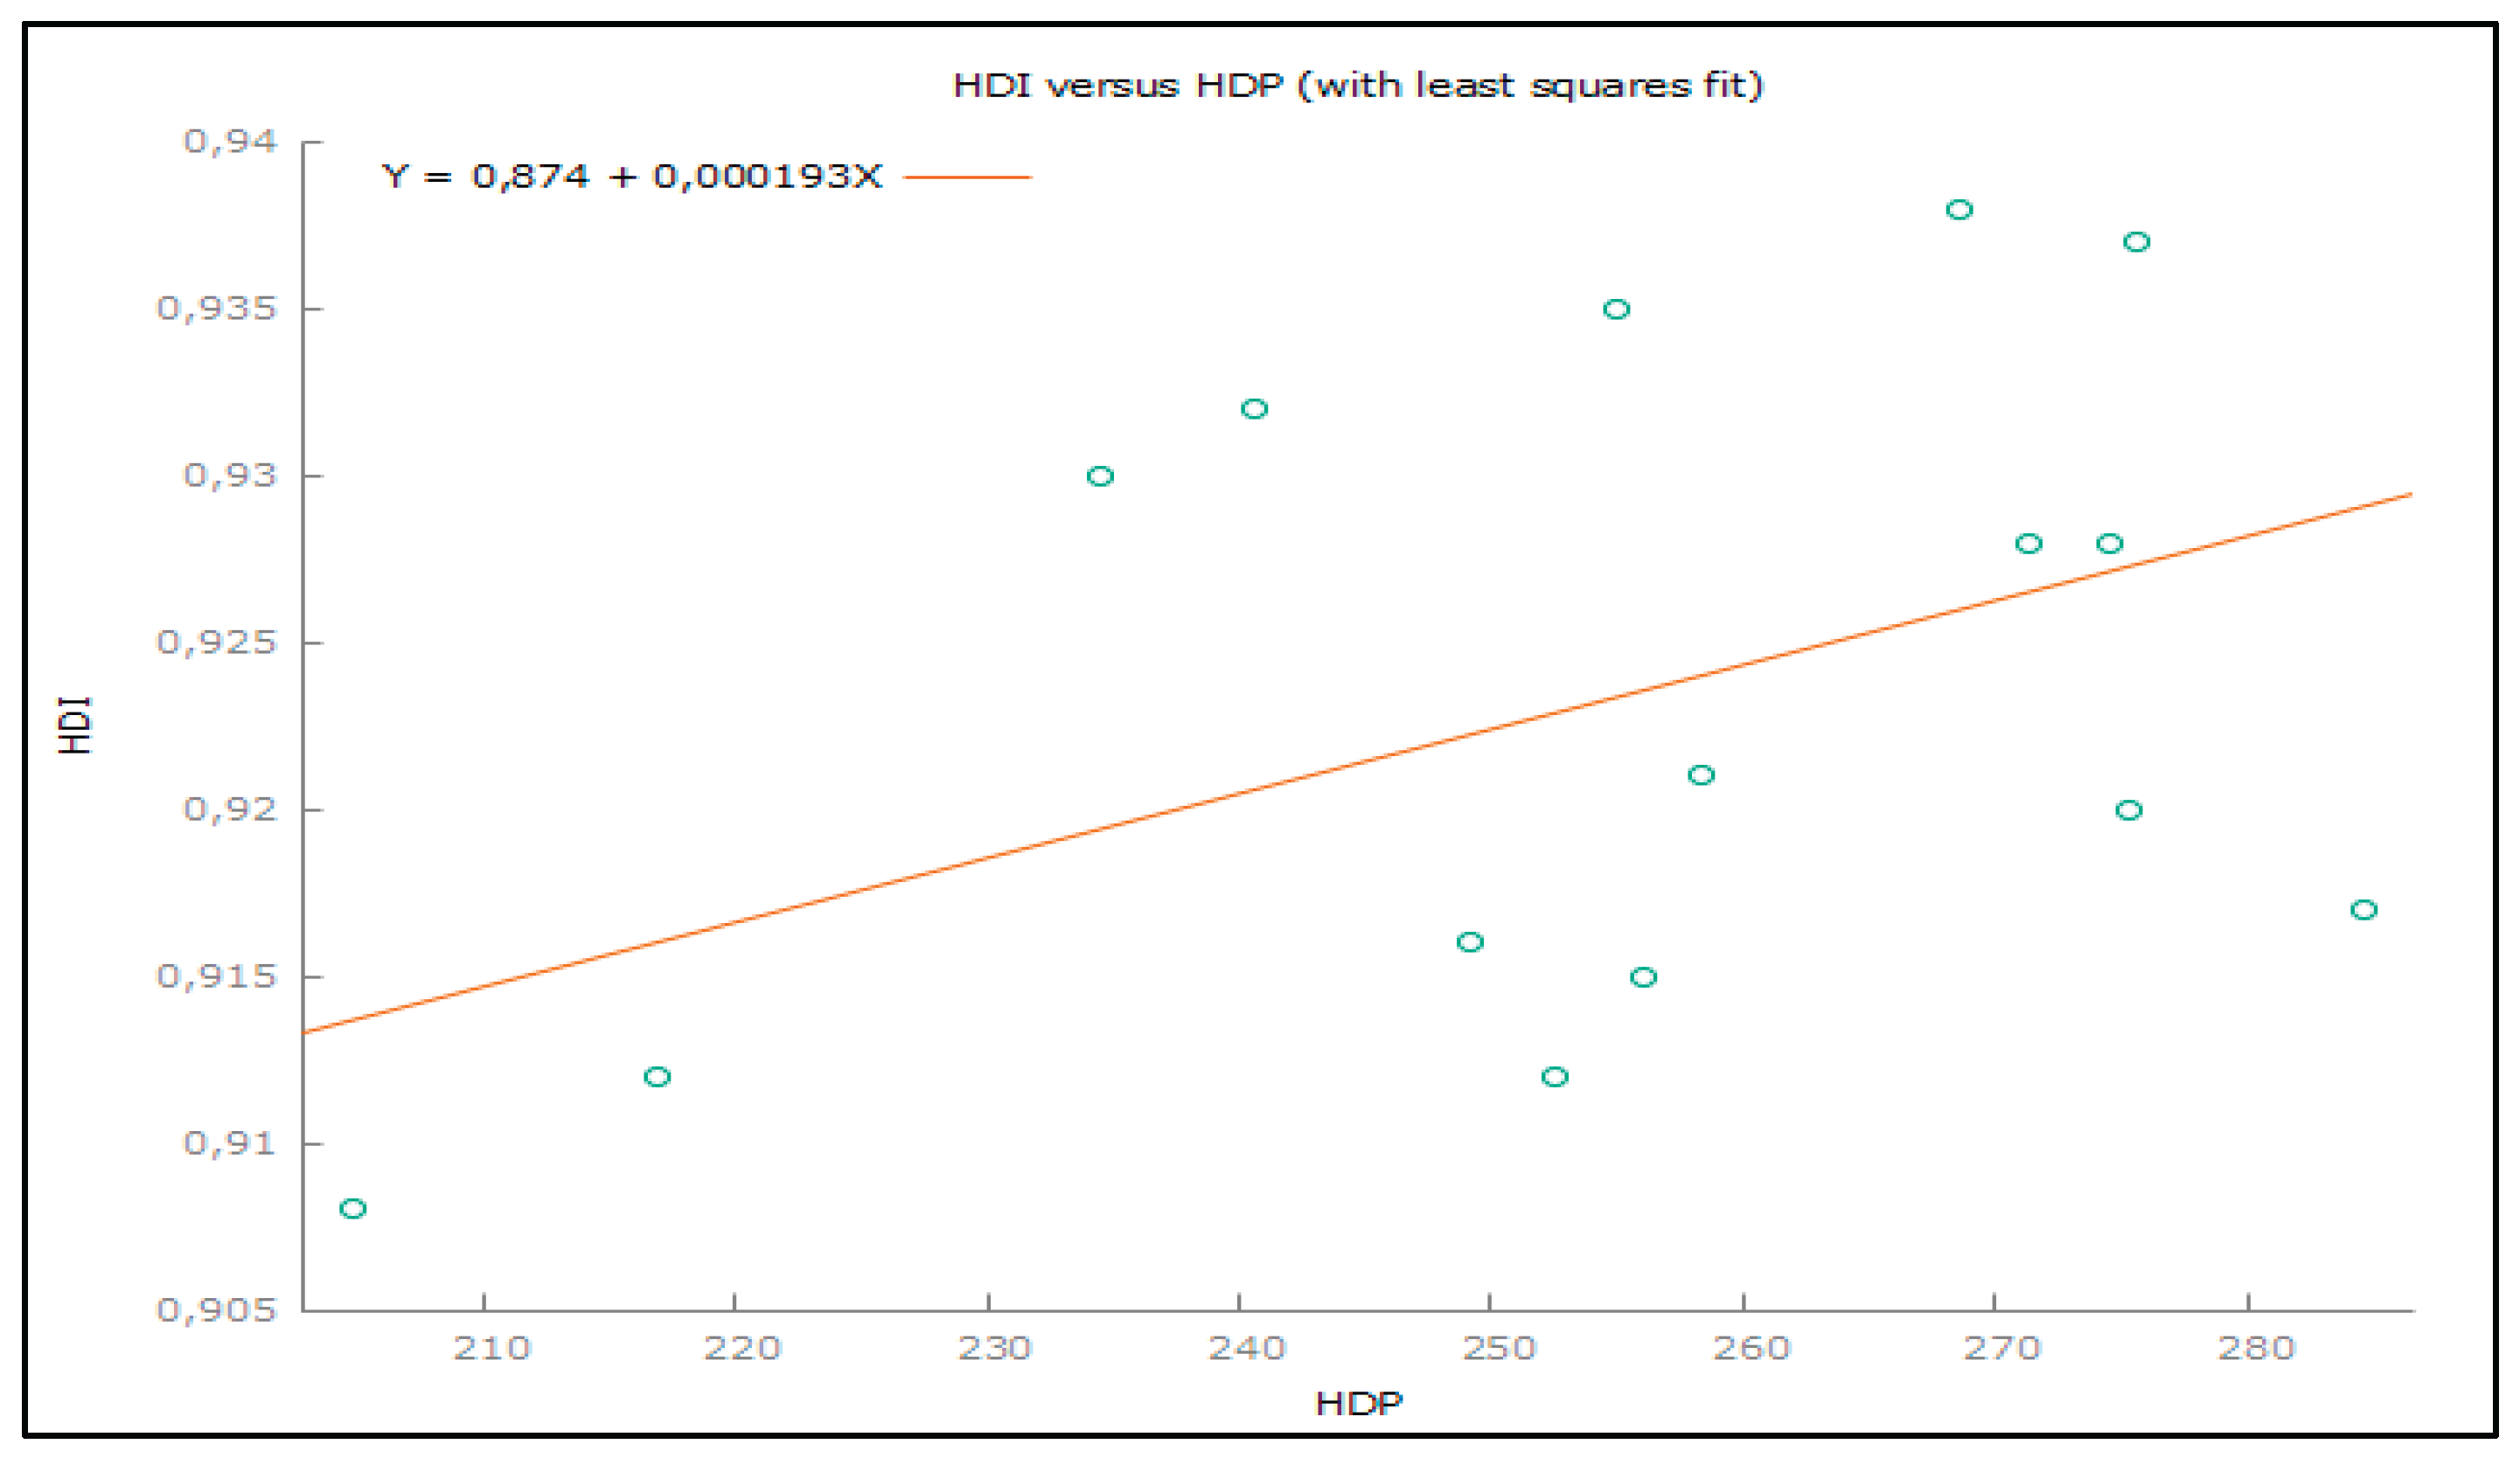
Hypothesis 1: We assume that in the Slovak Republic there is a statistically significant connection between the development of GDP and the development of indicators measuring the standard of living.

Table 1.
Pearson correlation coefficient for Slovakia.
| GDP coefficient | p - value | Importance of the coefficient | |
|---|---|---|---|
| r (HDI) | 0,80473616 | 0,0003 | Statistically important |
| r (WHI) | 0,66431995 | 0,1501 | Statistically not important |
| r (HCI) | 0,25298125 | 0,5455 | Statistically not important |
A statistically significant relationship between GDP and health was not confirmed for two indicators, the Health Care Index (HCI) and the World Happiness Index (WHI). The hypothesis was confirmed only for the Human Development Index (HDI). According to Cohen's interpretation of the strength of the relationship, this relationship is large.
Figure 1.
Development of GDP and HDI relation in Slovakia .
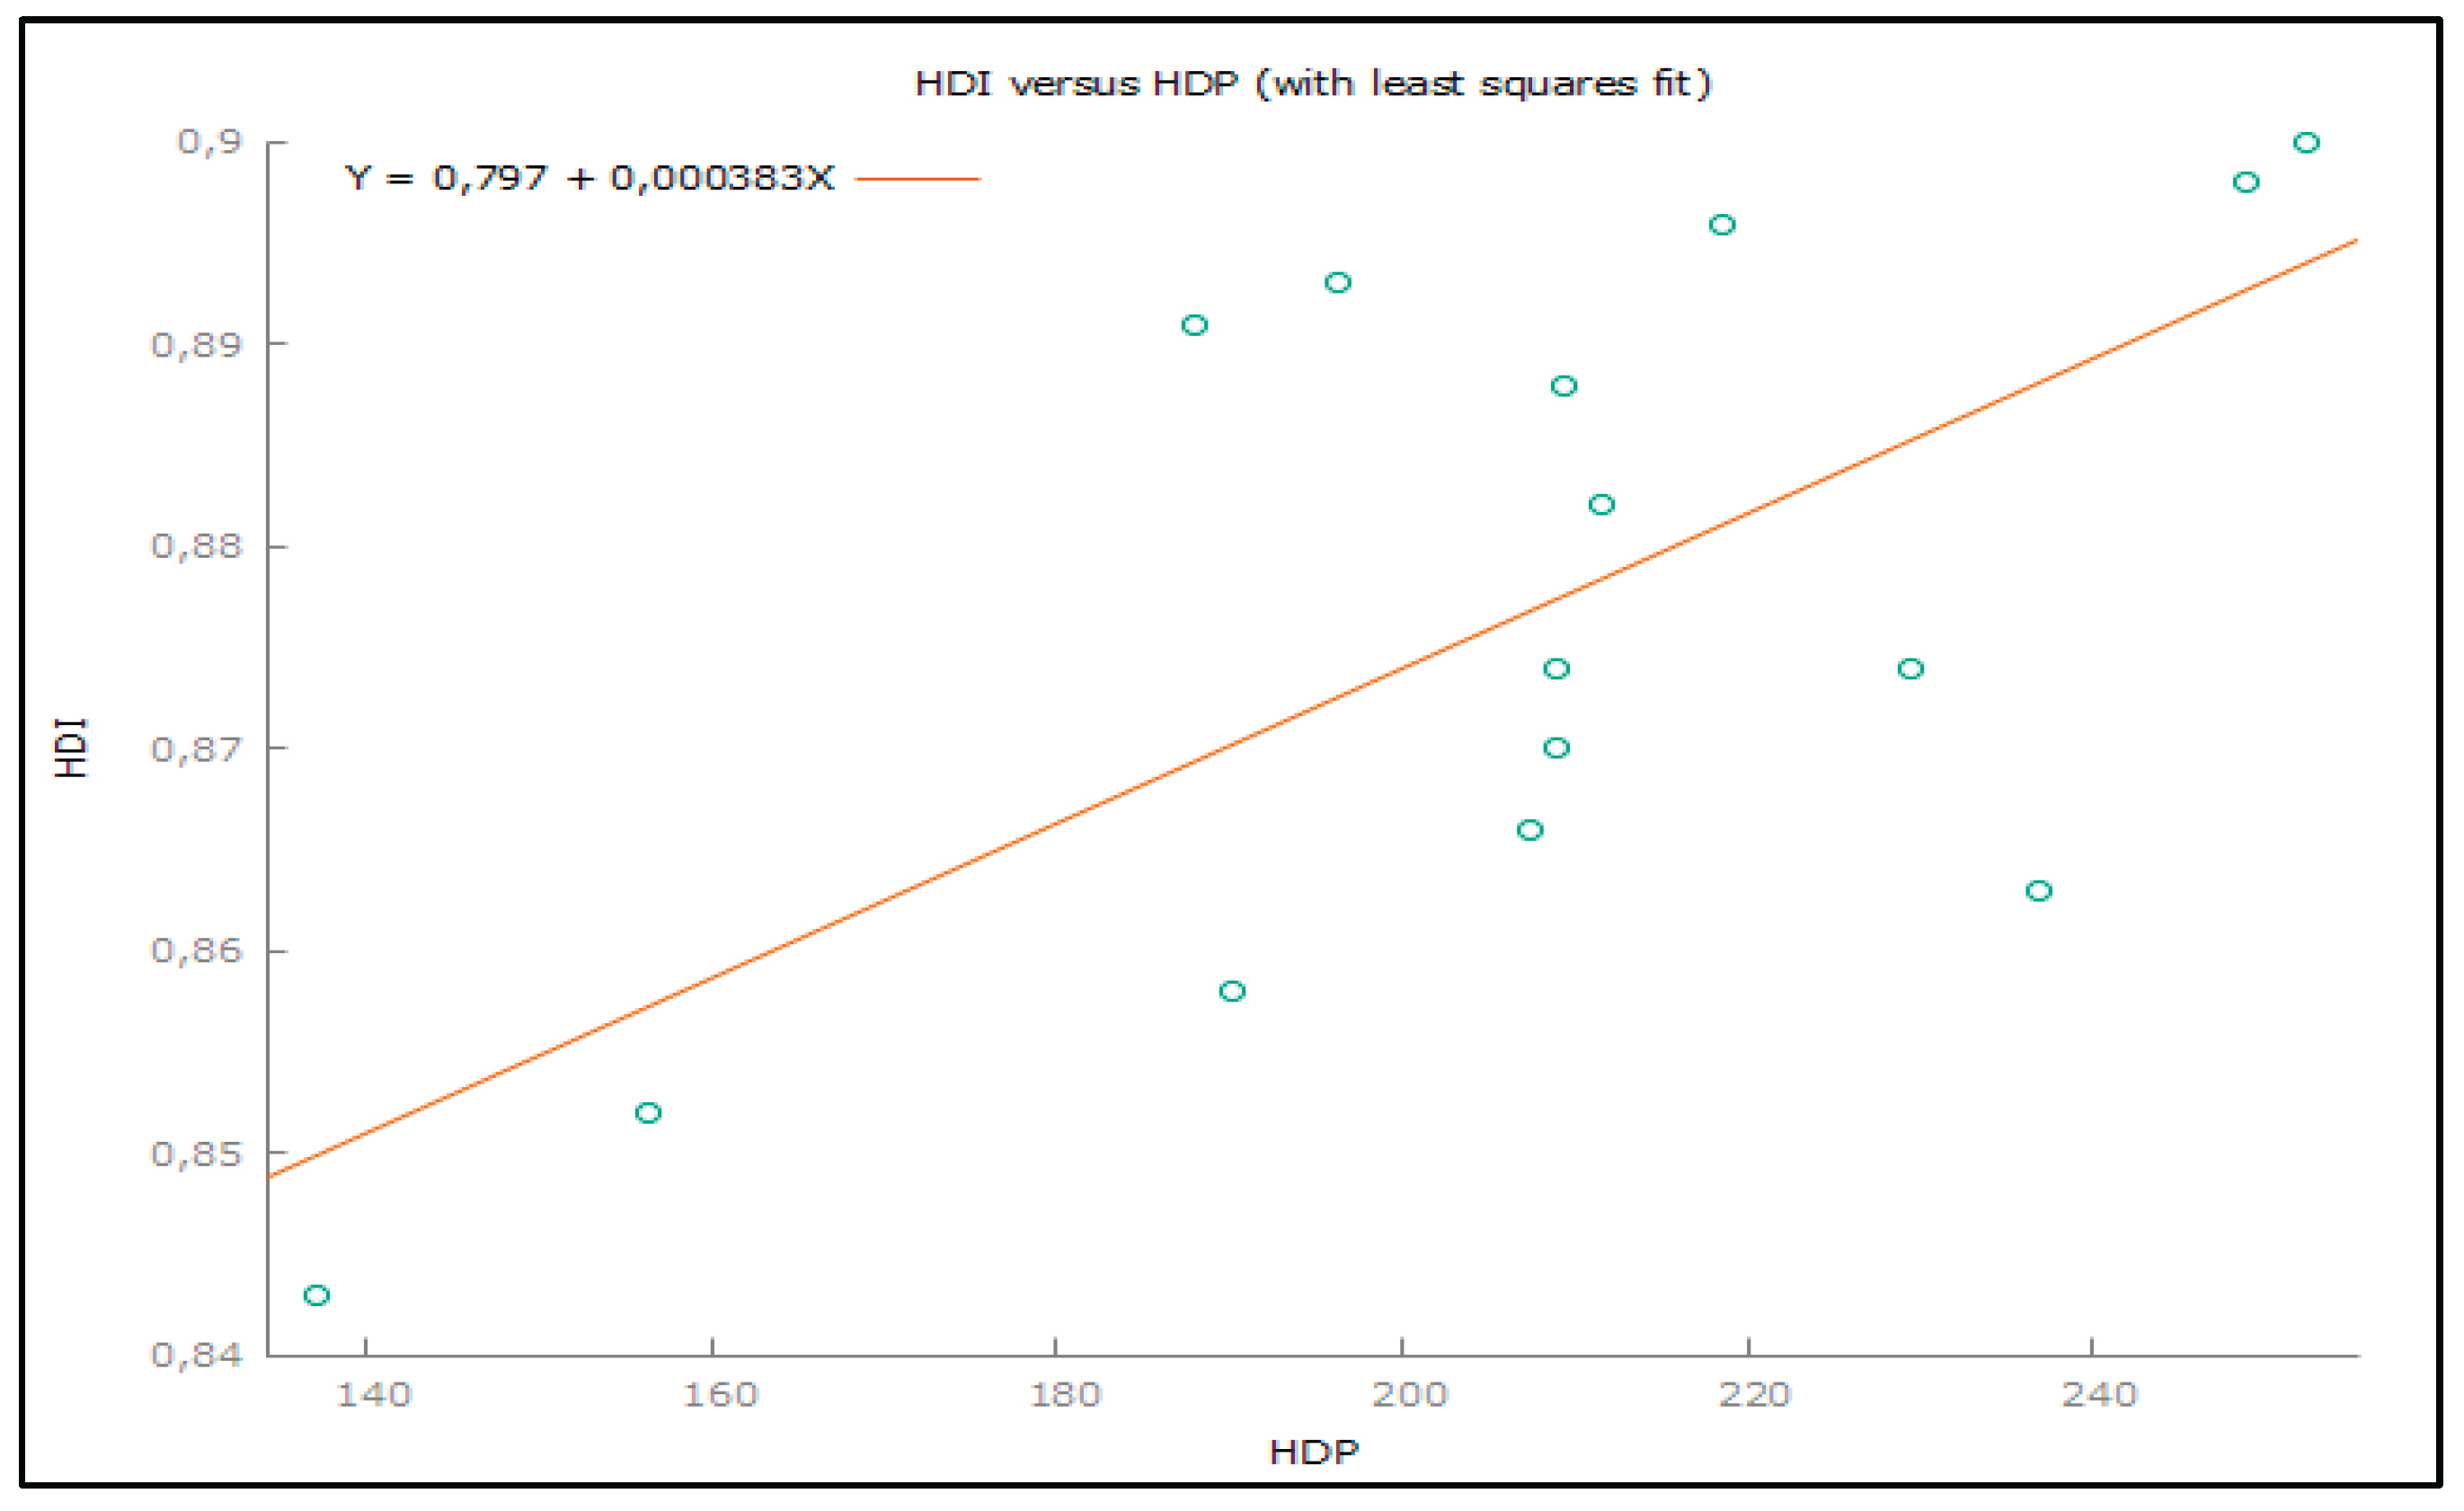
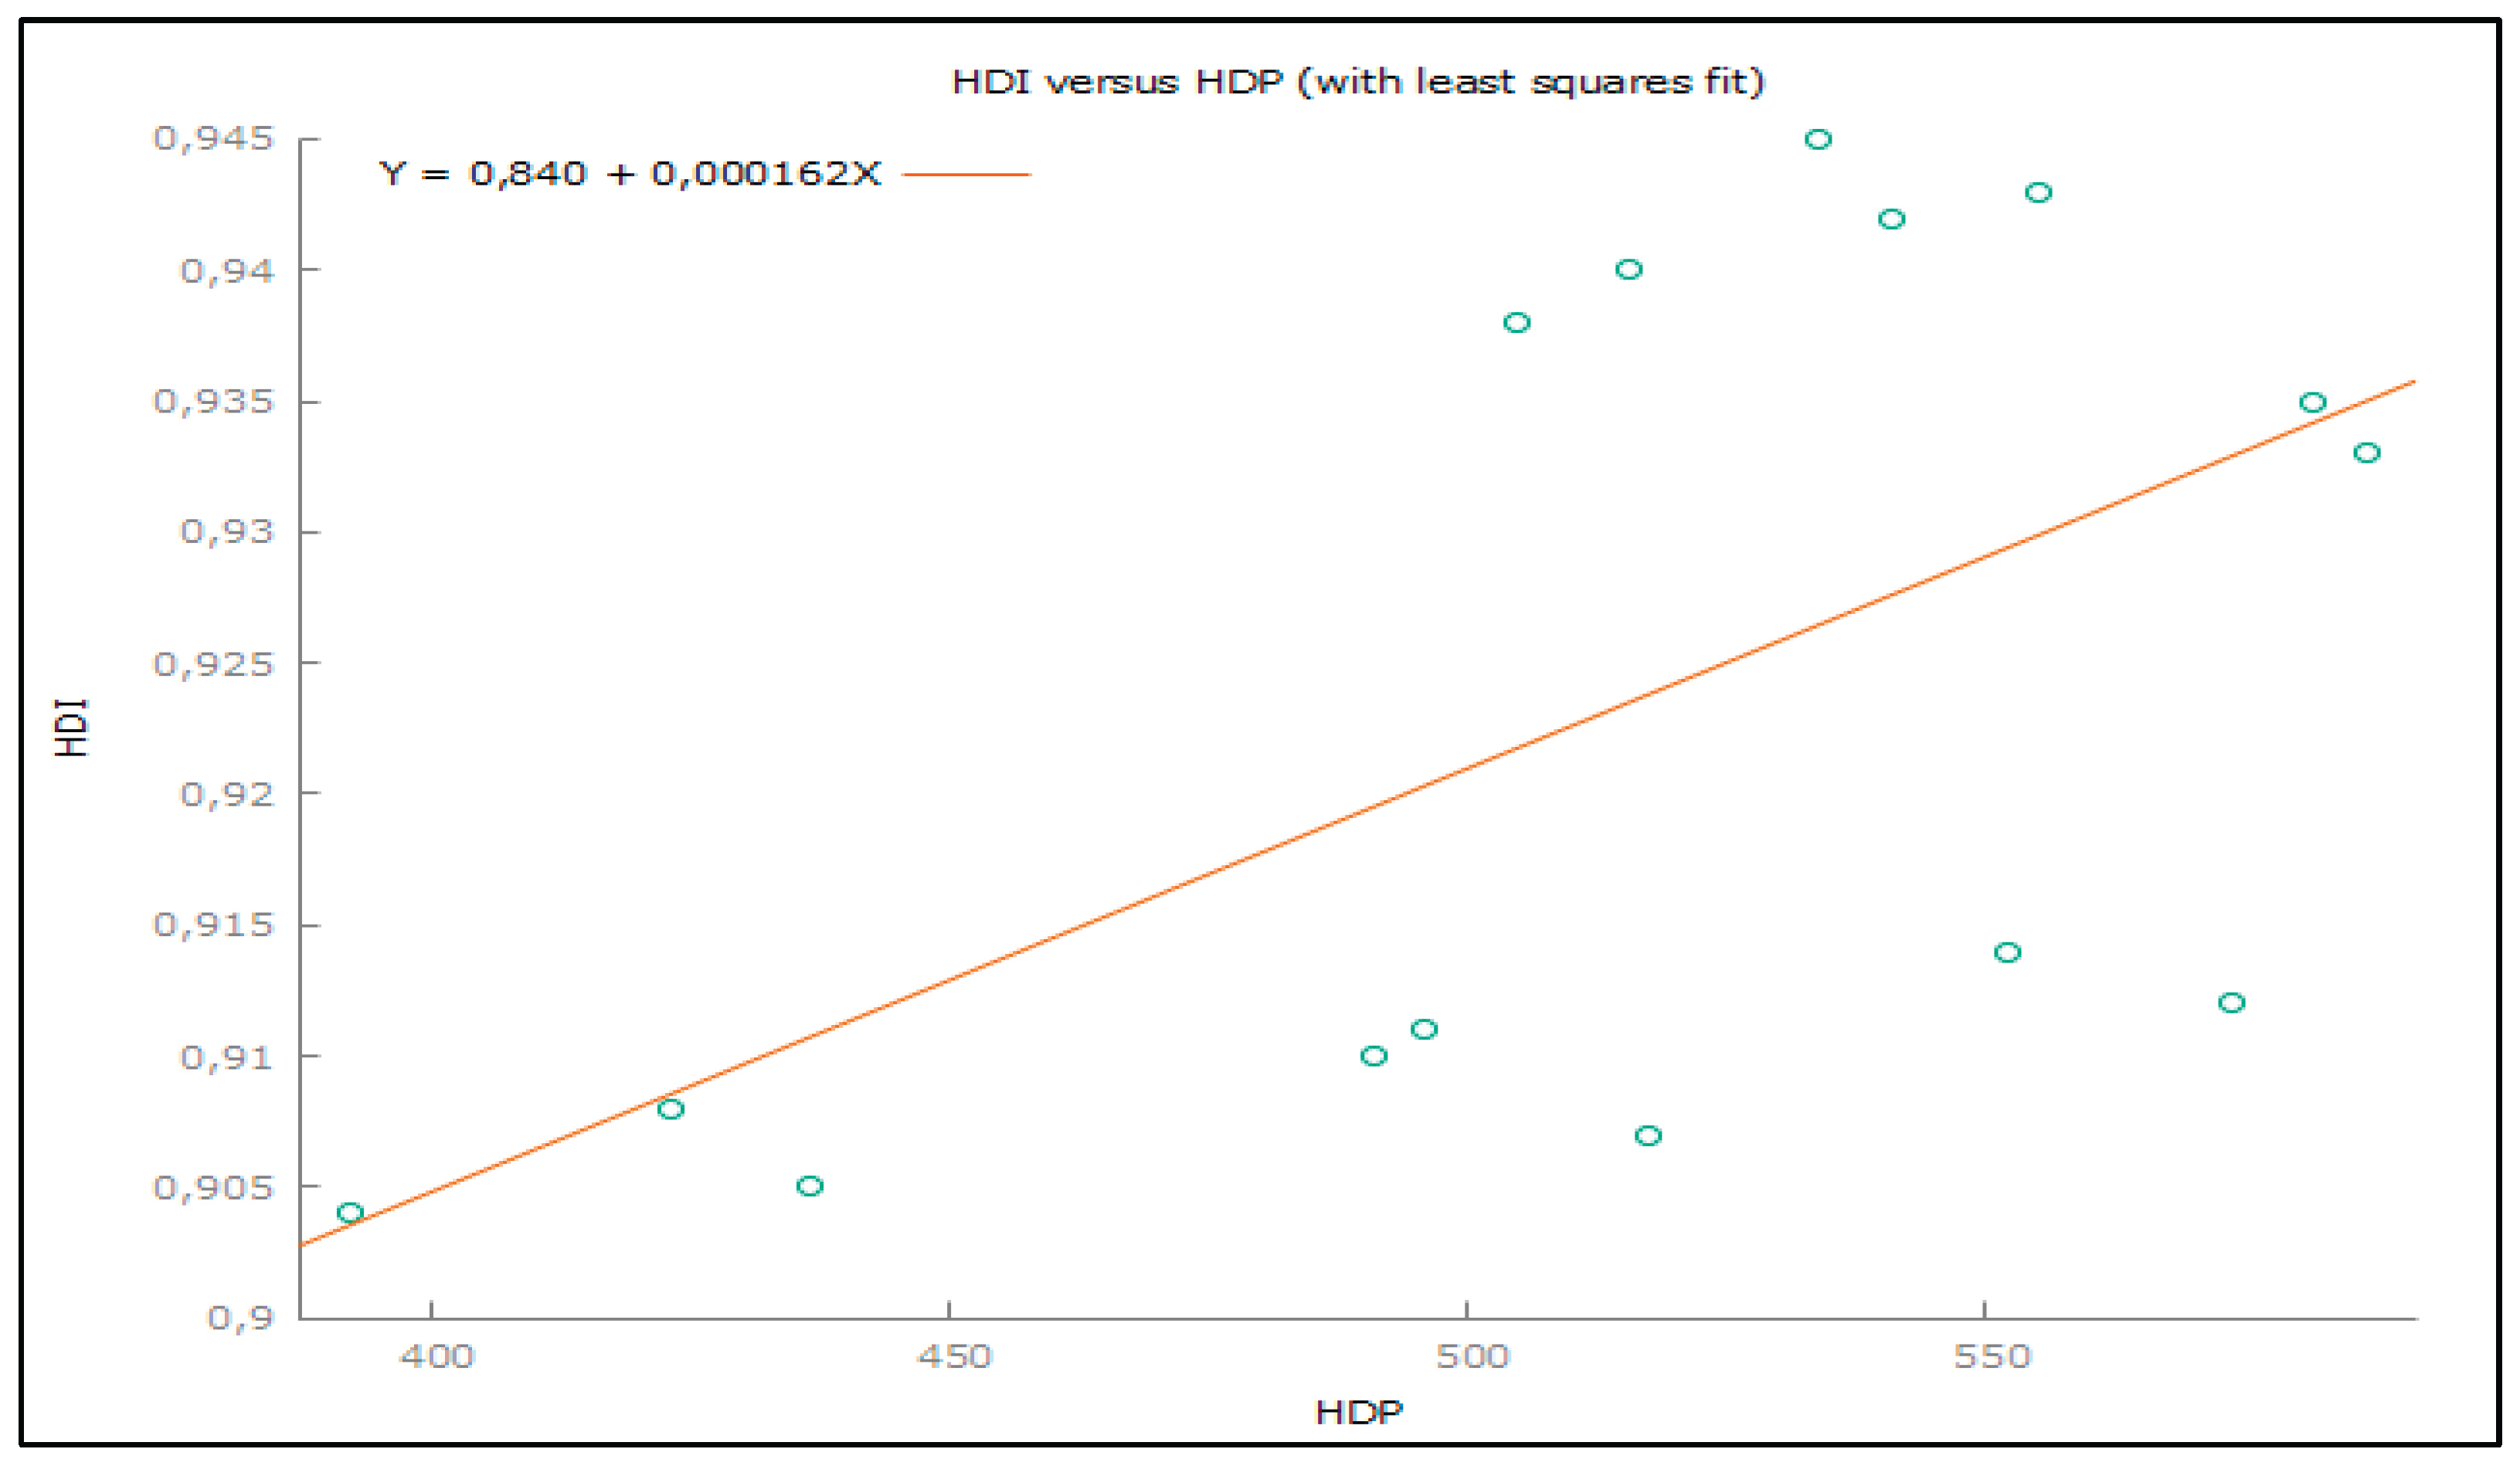
Hypothesis 2: We assume that in the Czech Republic there is a statistically significant connection between the development of GDP and the development of indicators measuring the standard of living.
Table 2.
Pearson correlation coefficient in Czech Republic.
| GDP coefficient | p - value | Importance of the coefficient | |
|---|---|---|---|
| r (HDI) | 0,66956972 | 0,0063 | Statistically important |
| r (WHI) | 0,66431680 | 0,1501 | Statistically not important |
| r (HCI) | 0,59240481 | 0,1218 | Statistically not important |
For the Czech Republic, the hypothesis was confirmed for the Human Development Index (HDI). It was not confirmed for the World Happiness Index (WHI) and the Health Care Index (HCI). The strength of the relationship between gross domestic product (GDP) and the Human Development Index (HDI) is strong.
Figure 2.
Development of GDP and HDI relation in Czech Republic.
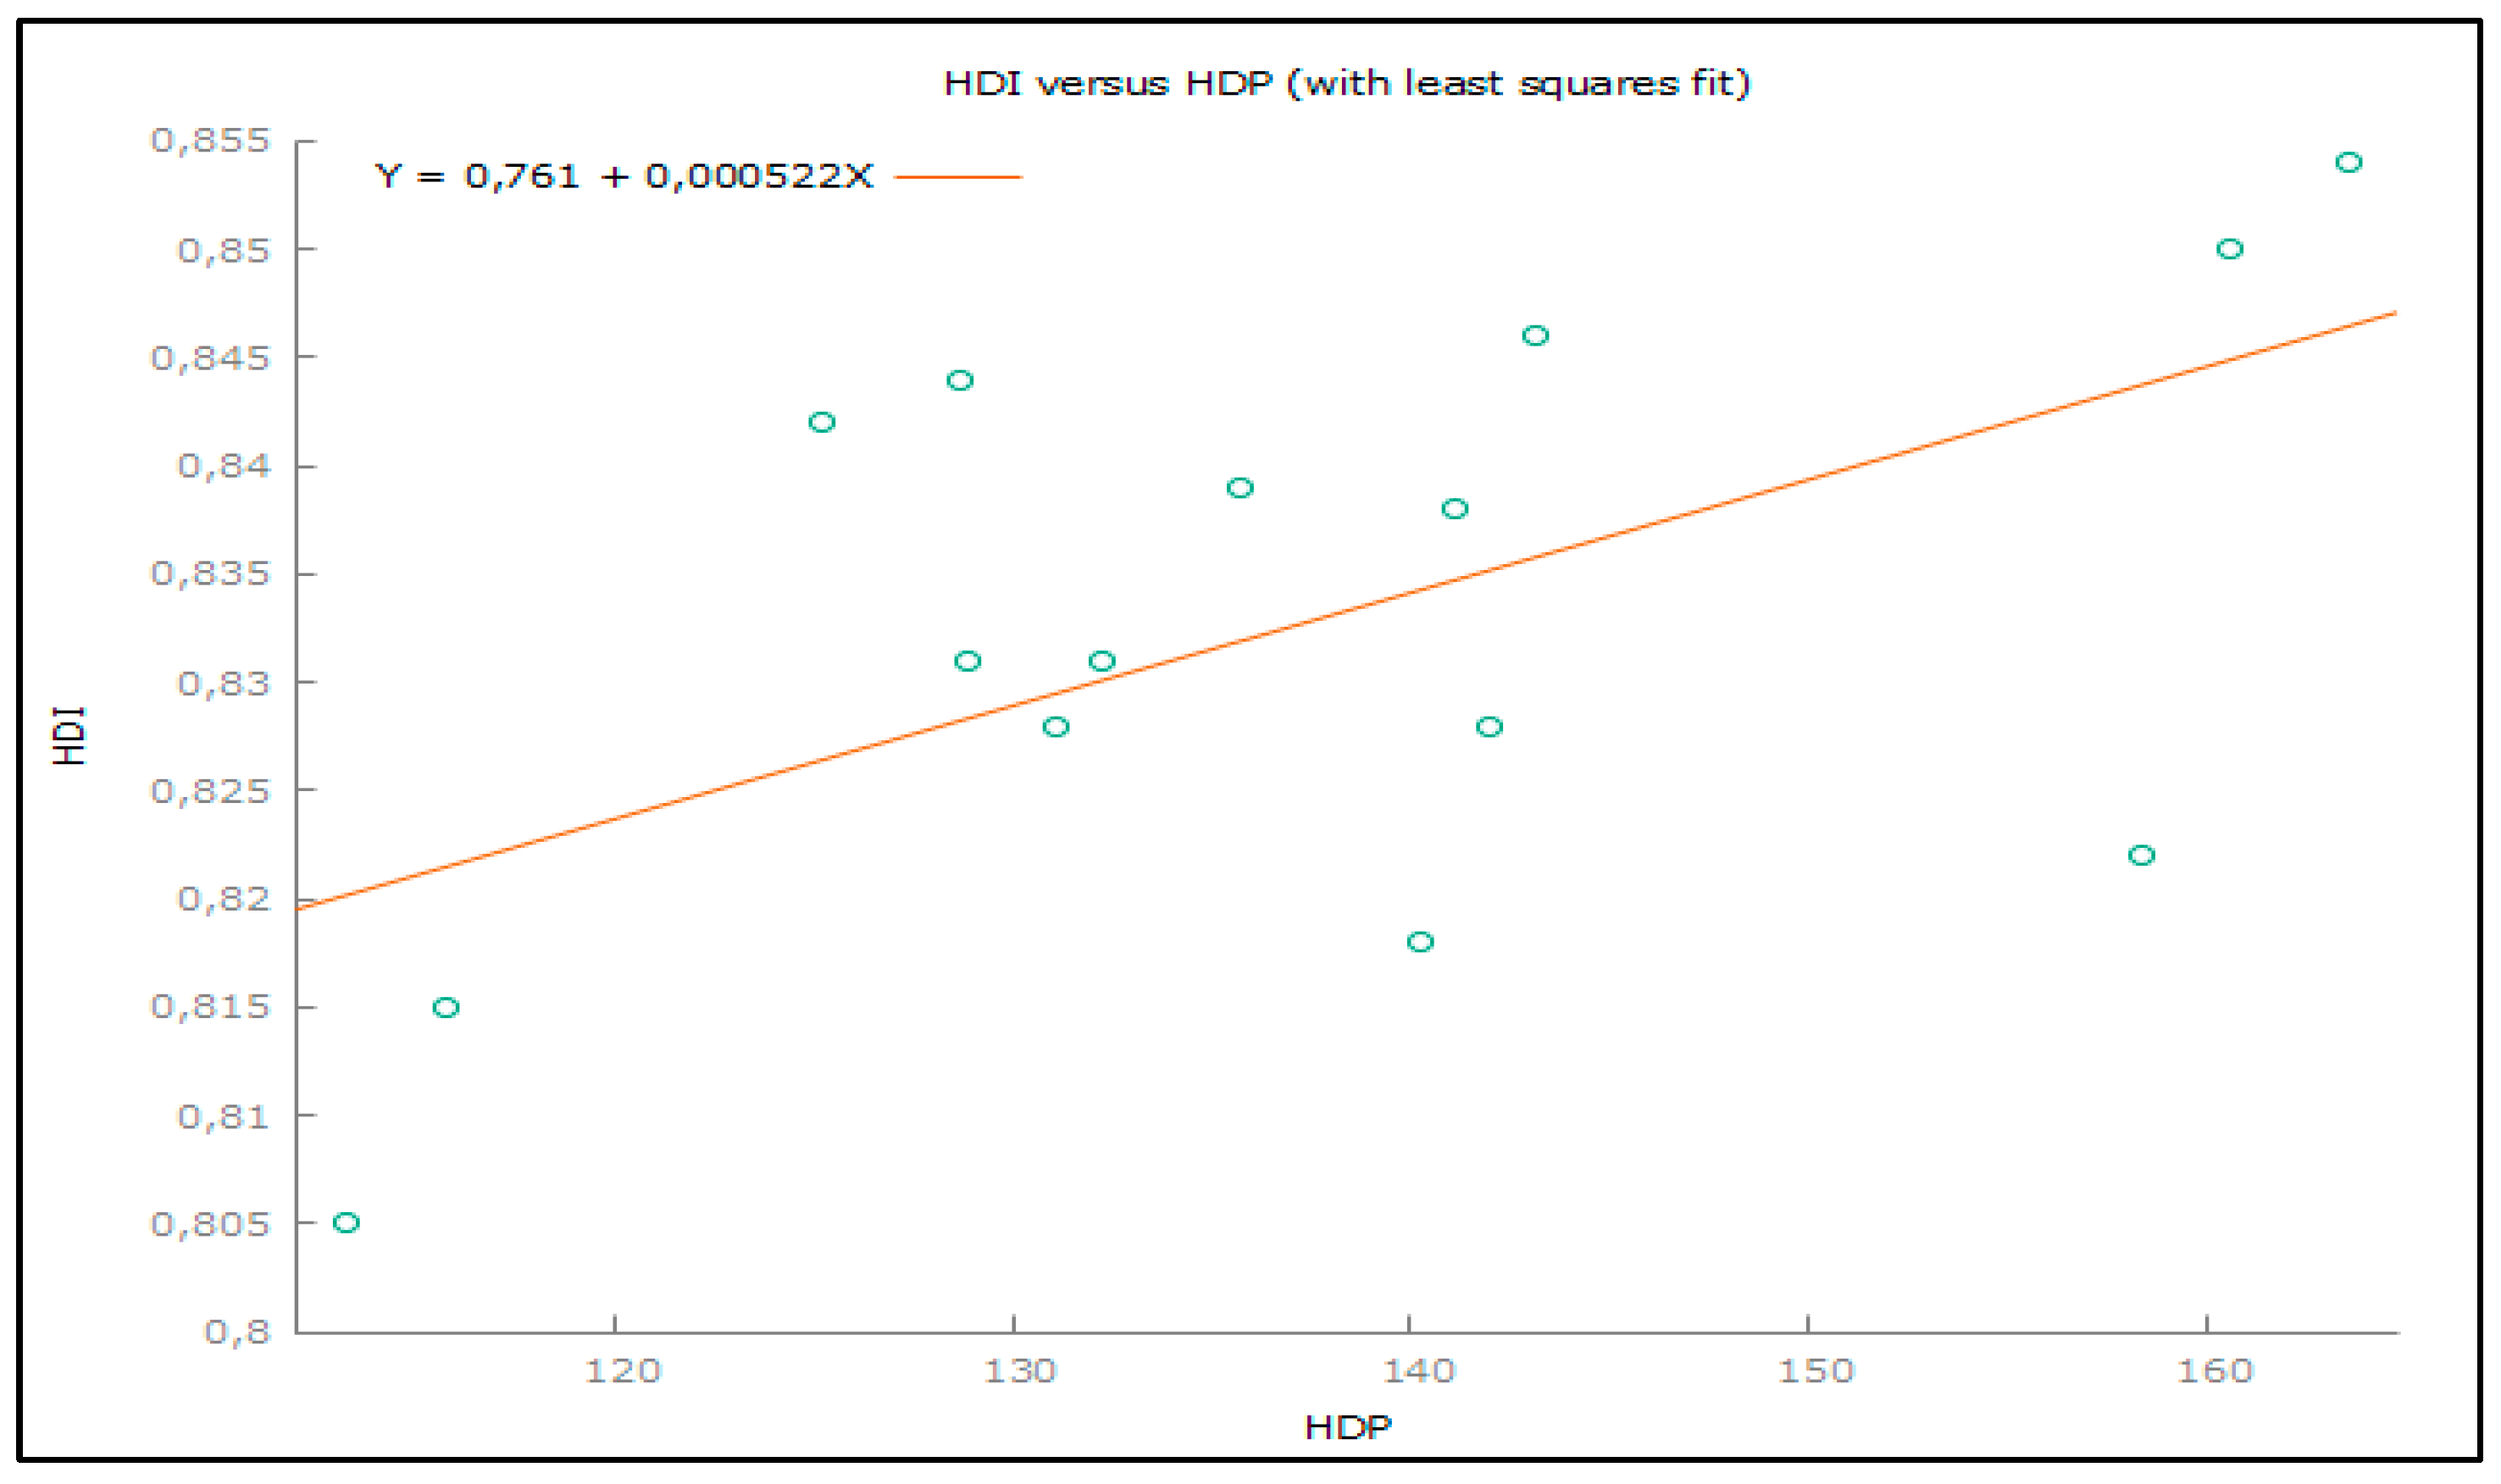
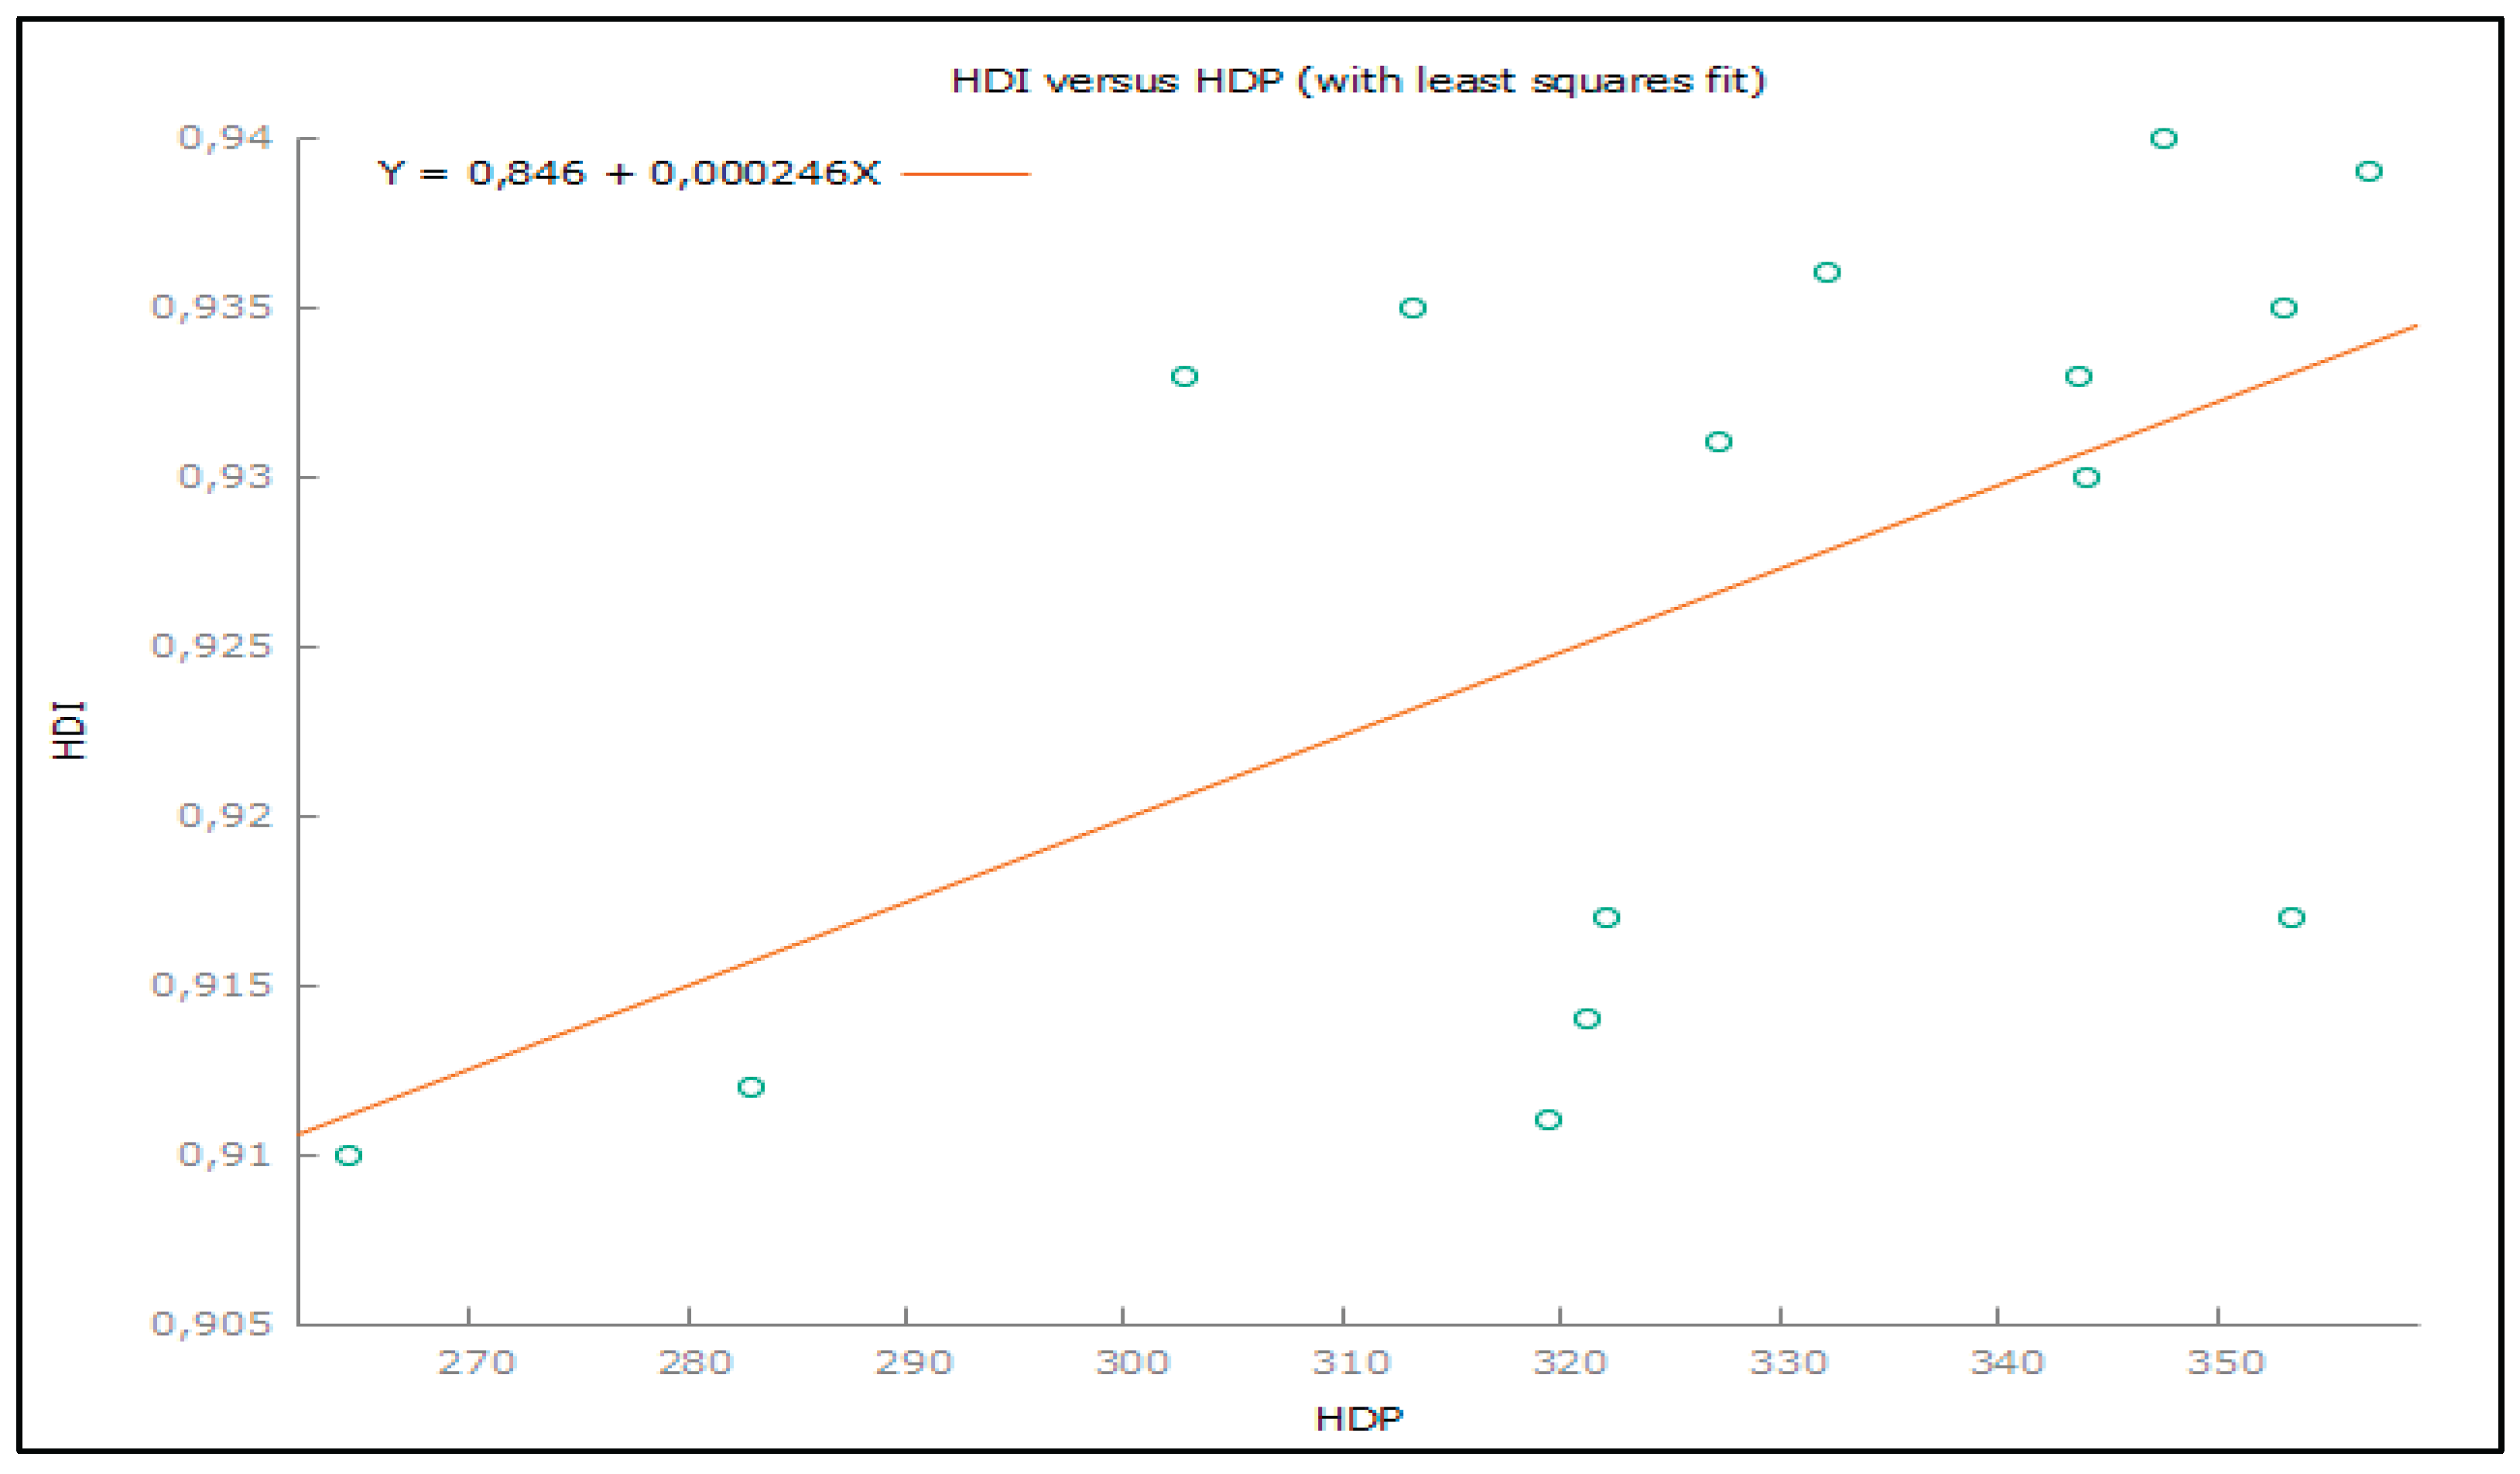
Hypothesis 3: We assume that in Hungary there is a statistically significant connection between the development of GDP and the development of indicators measuring the standard of living.
Table 3.
Pearson correlation coefficient in Hungary.
| GDP coefficient | p - value | Importance of the coefficient | |
|---|---|---|---|
| r (HDI) | 0,56760526 | 0,0273 | Statistically important |
| r (WHI) | 0,90361201 | 0,0135 | Statistically important |
| r (HCI) | 0,63881543 | 0,0882 | Statistically not important |
For Hungary, the hypothesis of a statistically significant relationship was confirmed in two cases. In the case of the Human Development Index (HDI) and in the case of the World Happiness Index (WHI). A statistically significant relationship was not confirmed in the case of the Health Care Index (HCI). According to Cohen, the strength of the relationship between gross domestic product (GDP) and the Human Development Index (HDI) is strong, and in the case of the WHI it is a direct correlation, since r = 0.9.
Figure 3.
Development of GDP and HDI relation in Hungary.
Hypothesis 4: We assume that in Poland there is a statistically significant connection between the development of GDP and the development of indicators measuring the standard of living.
Table 4.
Pearson correlation coefficient in Poland.
| GDP coefficient | p – value | Importance of the coefficient | |
|---|---|---|---|
| r (HDI) | 0,78014547 | 0,0006 | Statistically important |
| r (WHI) | 0,93910121 | 0,0055 | Statistically important |
| r (HCI) | 0,46940890 | 0,2406 | Statistically not important |
The hypothesis was confirmed in the case of Poland in two cases. A statistically significant relationship was found between gross domestic product (GDP) and the Human Development Index (HDI) and between GDP and the World Happiness Index (WHI). The hypothesis was not confirmed in the case of the Health Care Index (HCI). The strength of the relationships according to Cohen is large in both cases, and in the case of the WHI it is a direct correlation.
Figure 4.
Development of GDP and HDI relation in Poland.

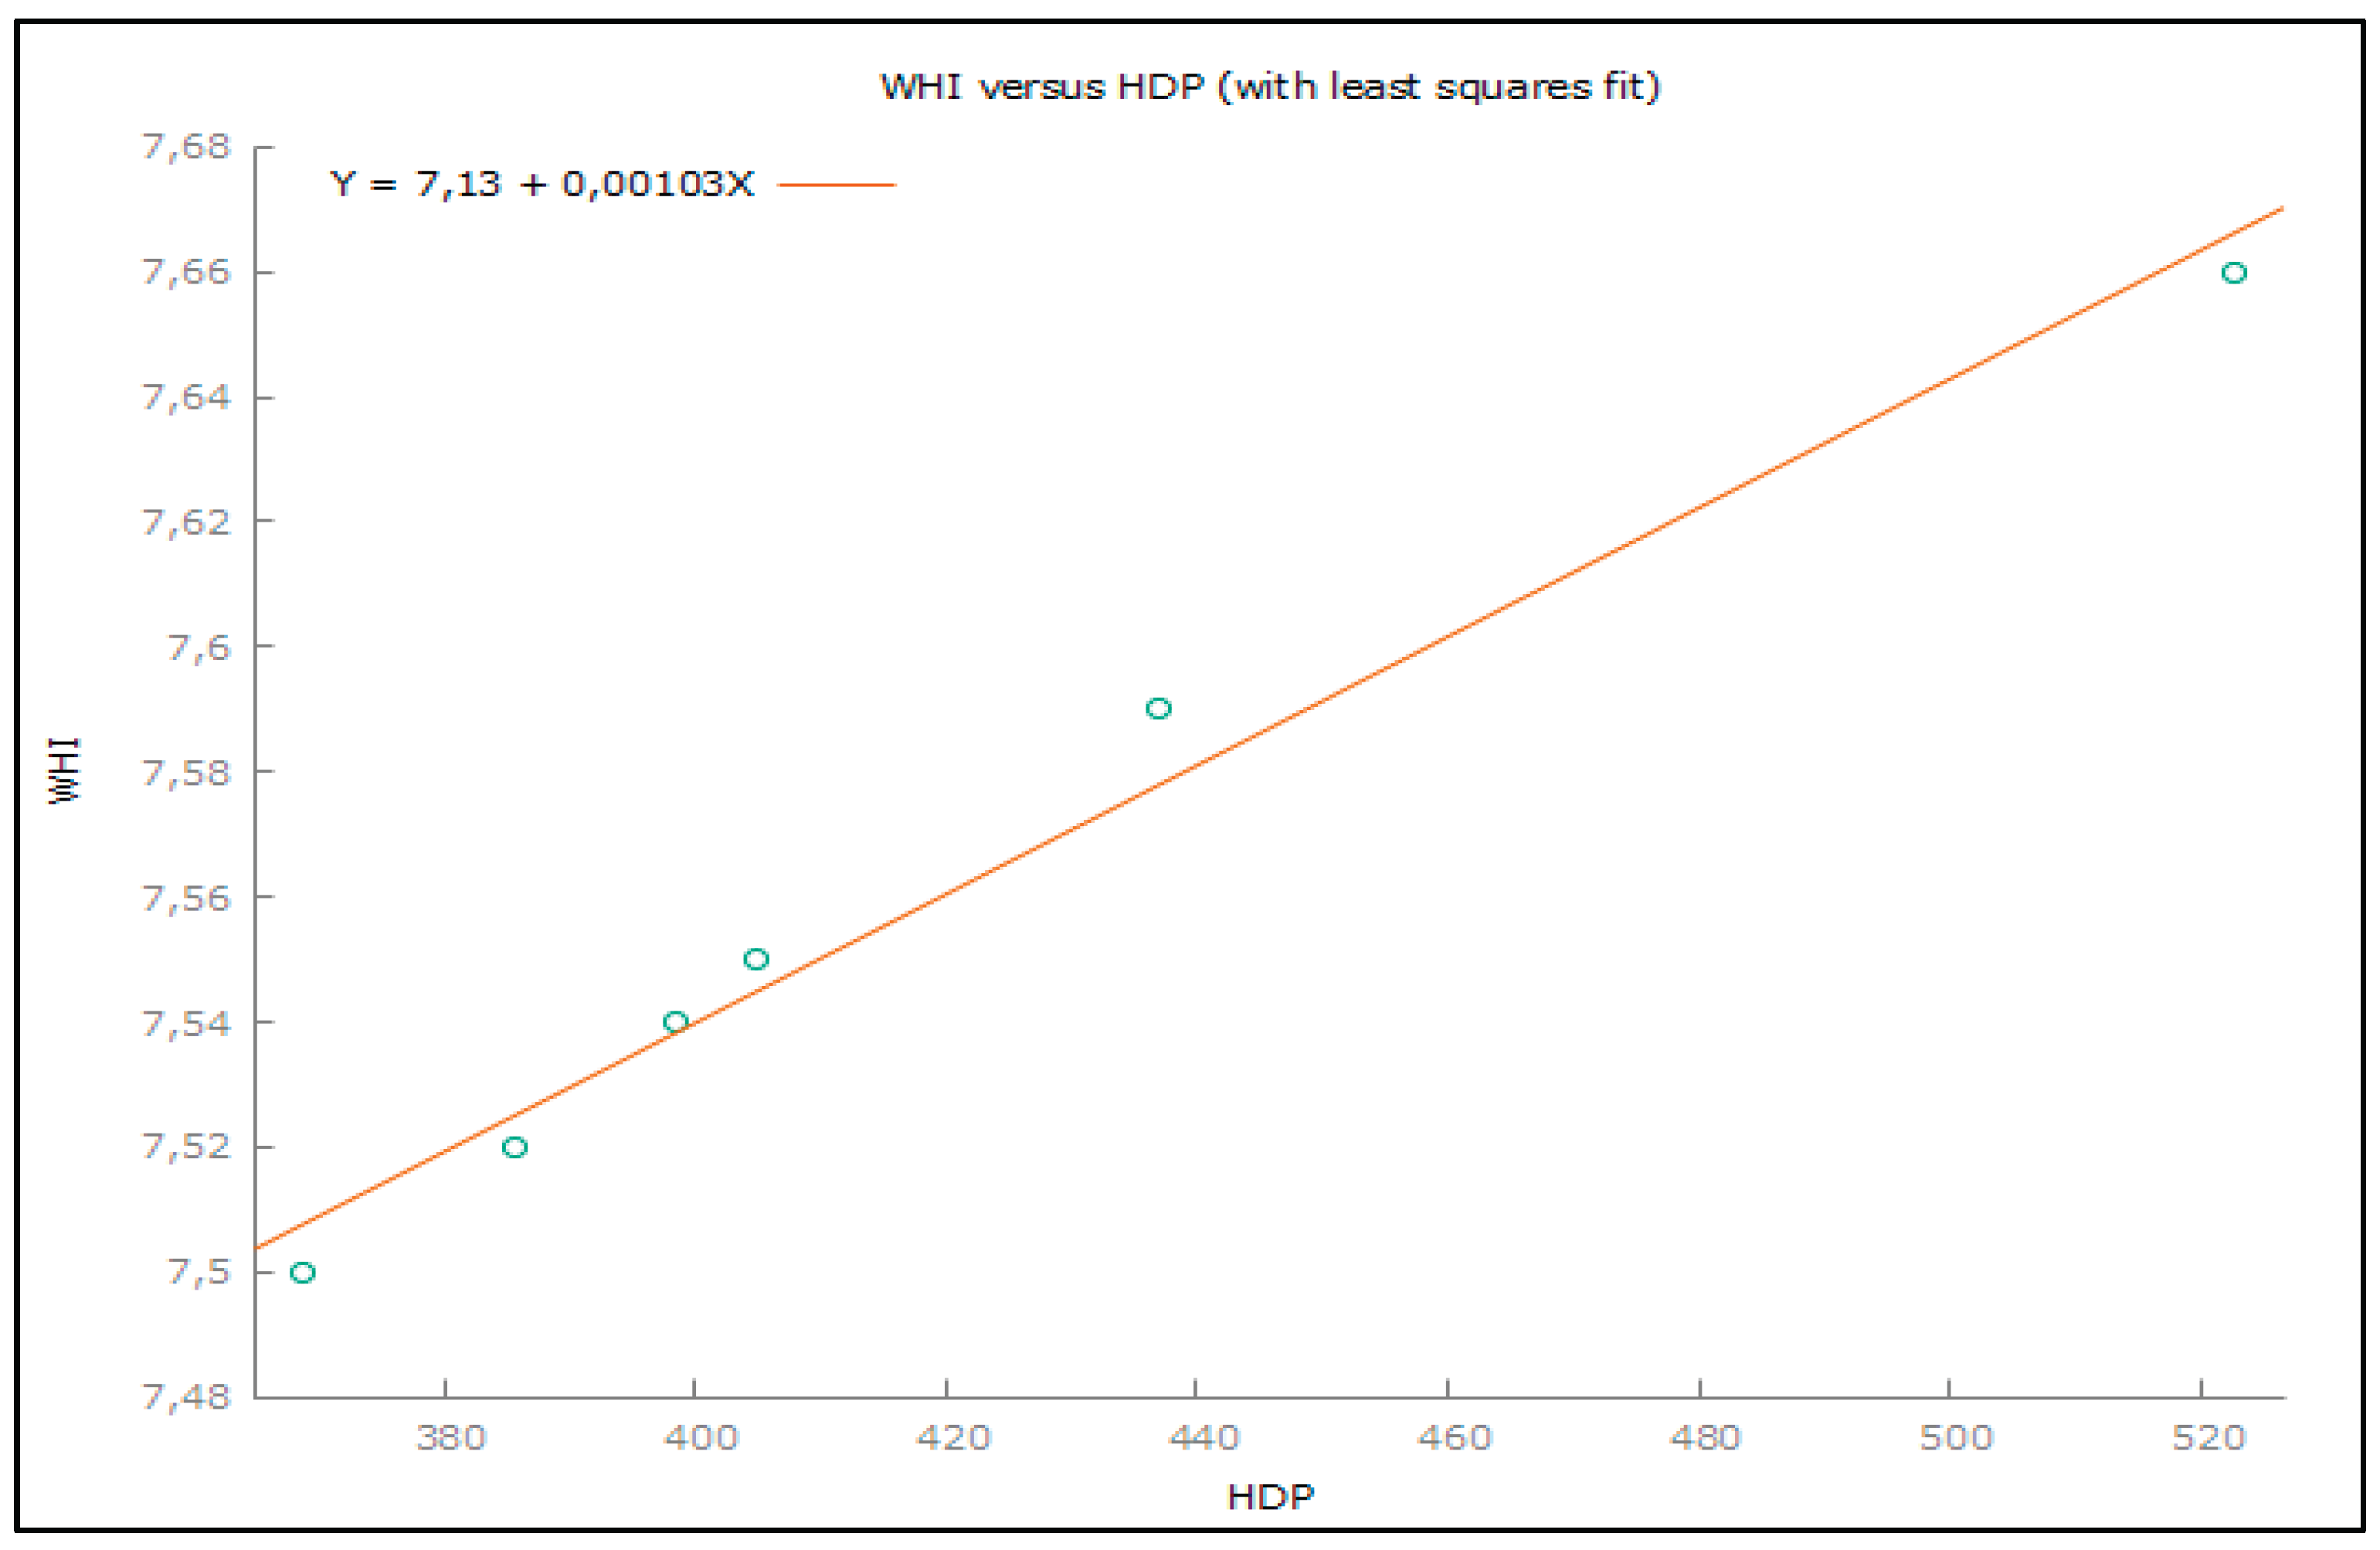
Hypothesis 5: we assume that for Norway there is a statistically significant connection between the development of GDP and the development of indicators measuring the standard of living.
Table 5.
Pearson correlation coefficient in Norway.
| GDP coefficient | p - value | Importance of the coefficient | |
|---|---|---|---|
| r (HDI) | 0,17287005 | 0,5378 | Statistically not important |
| r (WHI) | 0,99090182 | 0,0001 | Statistically important |
| r (HCI) | 0,83289404 | 0,0103 | Statistically important |
The hypothesis was confirmed in the case of Norway in two cases. The Pearson correlation coefficient showed a relationship for the World Happiness Index (WHI) and the Health Care Index (HCI). The relationship was not shown for the Human Development Index (HDI). The strength of the relationships according to Cohen's interpretation of the strength of relationships for the WHI and HCI is large. The r (WHI) value is close to 1, which means that it is a perfect direct correlation, which can also be seen in Graph 11 Development of Norway's relationship between GDP and WHI.
Figure 5.
Development of GDP and WHI relation in Norway.
Hypothesis 6: We assume that in Finland there is a statistically significant connection between the development of GDP and the development of indicators measuring the standard of living.
Table 6.
Pearson correlation coefficient in Finland.
| GDP coefficient | p - value | Importance of the coefficient | |
|---|---|---|---|
| r (HDI) | 0,44123641 | 0,0997 | Statistically not important |
| r (WHI) | 0,56901035 | 0,2386 | Statistically not important |
| r (HCI) | 0,20360625 | 0,6287 | Statistically not important |
In the case of Finland, the hypothesis of a statistically significant relationship between the development of GDP and the development of indicators measuring the standard of living was not proven. There was no statistically significant relationship between gross domestic product (GDP) and the Human Development Index (HDI), the World Happiness Index (WHI) or the Health Care Index (HCI).
Figure 6.
Development of GDP and HDI relation in Finland.
Hypothesis 7: We assume that in Sweden there is a statistically significant connection between the development of GDP and the development of indicators measuring the standard of living.
Table 7.
Pearson correlation coefficient in Sweden.
| GDP coefficient | p - value | Importance of the coefficient | |
|---|---|---|---|
| r (HDI) | 0,58258566 | 0,0227 | Statistically important |
| r (WHI) | 0,61077159 | 0,1978 | Statistically not important |
| r (HCI) | 0,20642348 | 0,6238 | Statistically not important |
For Sweden, a statistically significant relationship between GDP development and the development of indicators measuring living standards was confirmed for the Human Development Index. It was not confirmed for the Health Care Index (HCI) and the World Happiness Index (WHI). The strength of the relationship, according to Cohen, is large.
Figure 7.
Development of GDP and HDI relation in Sweden.
Hypothesis 8: We assume that in Denmark there is a statistically significant connection between the development of GDP and the development of indicators measuring the standard of living.
Table 8.
Pearson correlation coefficient in Denmark.
| GDP coefficient | p - value | Importance of the coefficient | |
|---|---|---|---|
| r (HDI) | 0,58918122 | 0,0208 | Statistically important |
| r (WHI) | 0,51655004 | 0,2941 | Statistically not important |
| r (HCI) | 0,01129331 | 0,9788 | Statistically not important |
The hypothesis was confirmed in one case for Denmark. A statistically significant relationship between GDP development and the development of indicators measuring living standards occurred for the Human Development Index. The hypothesis was not confirmed for the World Happiness Index and the Health Care Index (HCI). According to Cohen's interpretation of the strength of relationships, the strength of the relationship between GDP and HDI is large, since it takes a value higher than 0.5.
Figure 8.
Development of GDP and HDI relation in Denmark.
5. Discussion
Based on the data obtained in this work, we can conclude that the monitored countries differ in economic performance and the level of living standards achieved. Verkuleviciute (2006) confirms such teritorial differences also. The performance of the Scandinavian economies is at a much higher level than the performance of the economies of the V4 countries.
Except for the financial crisis that broke out in 2008 and 2009, all economies recorded GDP growth. The only exception was Norway, whose economic growth was affected not only by the financial crisis in 2008 and 2009 but also by the turbulence in the oil market, mainly between 2014 and 2016. The unemployment rate also developed similarly, except for the years of the financial crisis, when the unemployment rate grew, it fell every year, mainly in the V4 countries. Wages grew steadily throughout the entire period under review, except for 2008 and 2009, when growth slowed down and even stopped in some countries, such as Hungary or Denmark. Similar development is registered due to COVID-19 pandemic, such as research by Bilas et al. (2022); Ulpiani et al. (2021).
The development of the human development index in the V4 countries has a stable growth trend, which we can expect in the coming years, given favorable economic development. Compared to the Scandinavian countries, the V4 countries are much worse off, especially Hungary, Poland and the Slovak Republic. The Czech Republic is slowly approaching the Scandinavian countries. According to the human development index, the Scandinavian countries are among the best in the world, for this reason they are only ahead of each other, which will be in first place in a given year. The same is true of the world happiness index, where the Scandinavian countries occupy the first places and are generally ranked among the countries with the happiest people in the world. Therefore, their development during the monitored period was not exponential like that of the V4 countries, for the reason that if they have already reached an imaginary limit that they cannot overcome, they will stand still in the future, while other countries will approach them. In the healthcare index, the V4 countries achieve below-average OECD standard values, while the Scandinavian countries achieve at least average OECD standard values. Similar results are provided by Soltés et al. (2018) in comparing V4 with Romania (also post-communist country), finding that life satisfaction of citizens increases. The development of indexes are connected with development of material living standard, psychological stress, etc. For example, Foulds et al (2014), pointed people with a low material living standard experience more psychological distress than those with a high living standard.
6. Conclusions
The aim of the paper was to assess the development of living standards and identify the connection between economic development and the development of living standards in order to evaluate the state and development of the economies of selected countries. The economies of the V4 countries and the Scandinavian countries grew during the monitored period.
We performed the statistical analysis in the Gretl program. The hypotheses were confirmed and therefore there is a connection between GDP growth and the growth of the standard of living. In most cases, we found a connection between at least one indicator of the standard of living. First of all, it was the human development index. Only in the case of Norway was there no connection between GDP growth and HDI growth, the connection was confirmed only in the case of WHI and HCI. This was mainly due to the development of Norwegian GDP, which was abrupt but HDI grew smoothly.
As in the Scandinavian countries, so in the V4 countries, the biggest problem is the aging of the population and the reduction of the workforce. The solution could be a reform of the retirement age, which would shift depending on the development of average life expectancy. I would also recommend increasing healthcare spending, especially in the V4 countries, to the level of the OECD average. In the Scandinavian countries, I would recommend focusing on immigrants and low-skilled people, the government should help them get better vocational education so that they have better opportunities on the labor market. I would also recommend that the V4 countries invest in education and research and transform the economy into an economy based on higher technologies. One of the biggest problems of the Scandinavian countries is high taxes and the associated tax evasion. The Scandinavian countries have many rich people who do not like to pay such high taxes, and therefore the governments lose a lot of tax revenue. Therefore, I would suggest taxing millionaires and billionaires individually.
The research is limited to total indexes development. Development of individual indexes are influenced by various indicators. For example, index of Human Development can be further studied through development of life expectancy at birth, average expected length of study, GDP development per inhabitant, etc. In case of health care there would be necessary to make further research in the area of health care financing, prevention and unhealthy lifestyle, alcohol consumption, smoking and obesity.
The results can be used to provide suggestions and measures to improve the standard of living in the countries concerned. As in the Scandinavian countries, so in the V4 countries, the biggest problem is the aging of the population and the reduction of the workforce. The solution could be a reform of the retirement age, which would shift depending on the development of life expectancy. I would also recommend increasing healthcare spending, especially in the V4 countries, to the level of the OECD average. In the Scandinavian countries, I would recommend focusing on immigrants and low-skilled people, the government should help them get better vocational education so that they have better opportunities on the labor market. I would also recommend that the V4 countries invest in education and research and transform the economy into an economy based on higher technologies. One of the biggest problems of the Scandinavian countries is high taxes and the associated tax evasion. Scandinavian countries have many rich people who do not like paying high taxes; therefore, governments lose a lot of tax revenue. That is why I would suggest taxing millionaires and billionaires individually.
Funding
This article is one of the outputs of the research project „Research of alternative energy sources‘ implementation impact on industries of energy management processes“ supported by Operational Program Integrated Infrastructure (ITMS: 3131011T564) and research project KEGA 010PU-4/2023 “Innovation of the Course Entrepreneurship in Small and Medium-Sized Enterprises in the Context of Sustainability and Circularity”.
Institutional Review Board Statement
Not applicable.
Informed Consent Statement
Not applicable.
Acknowledgments
This article is one of the outputs of the research project „Research of alternative energy sources‘ implementation impact on industries of energy management processes“ supported by Operational Program Integrated Infrastructure (ITMS: 3131011T564) and research project KEGA 010PU-4/2023 “Innovation of the Course Entrepreneurship in Small and Medium-Sized Enterprises in the Context of Sustainability and Circularity”.
Conflicts of Interest
The authors declare no conflicts of interest.
References
- Acheampong, A. O., Opoku, E. E. O., Dzator, J., & Kufuor, N. K. (2022). Enhancing human development in developing regions: Do ICT and transport infrastructure matter?. Technological Forecasting and Social Change, 180, Art no 121725. [CrossRef]
- Ahmad, M., Ahmed, Z., Yang, X.Y., & Can, M. (2023). Natural Resources Depletion, Financial Risk, and Human Well-Being: What is the Role of Green Innovation and Economic Globalization? Social Indicators Research, 167(1-2), 269-288. [CrossRef]
- Akinyele, O. D. (2024). Assessing the determinants of human development in OECD economies: evidence from labor productivity and investment decisions. Journal of Economic Studies, 51(8), 1664-1676. [CrossRef]
- Arah, O., Westert, G., Hurst, J., & Klazinga, N. (2006). A conceptual framework for the OECD Health Care Quality Indicators Project. Available online: https://academic.oup.com/intqhc/article/18/suppl_1/5/1798473.
- Bilas, V., Bosnjak, M., & Franc, S. (2022). Globalisation in the Era of Covid-19 Pandemic and Post-Pandemic Period. Casopis za Ekonomiju I Trzisne Komunikacije 12(1), 186-194. [CrossRef]
- Bílková, D. (2019). Living Standard in OECD Member Countries. Liberec Economic Forum 2019, 163-171. 14th International Conference on Liberec Economic Forum, Technicka Universita Liberec, Fac Econ, Liberec, Czech Republic.
- Bílková, D. (2020). Evaluation of Standard of Living in OECD Countries. Hradec Economic Days 2020, 10(1), pp. 50-60. [CrossRef]
- Bilkov, D. (2020). Wage Level as One of the Most Important Indicators of the Quantitative Aspect of the Standard of Living of the Population and Selected Indicators of Economic Maturity in OECD Member Countries. Inzinerine Ekonomika-Engineering Economics, 31(3), pp. 334-344. [CrossRef]
- Balestra, C., Boarini, R., & Tosetto, E. (2018). What Matters Most to People? Evidence from the OECD Better Life Index Users' Responses. Social Indicators Research, 136(3), 907-930. [CrossRef]
- Bragoudakis, Z., Kasimati, E., Pierros, C., Rodousakis, N., & Sokllis, G. (2022). Measuring Productivities for the 38 OECD Member Countries: An Input-Output Modelling Approach. Mathematics, 10(13), Article Number 2332. [CrossRef]
- Corejova, T., Al Kassiri, M., & Madudova, E. (2018). Globalization and Better Live Index Level in V4 Countries. Globalization and its Socio-economic Consequences, pp. 2469-2475. 18th International Scientific Conference on Globalization and Its Socio-Economic Consequences, Rajecke Teplice, Slovakia.
- Countryecomony (2022). Human Development Index - HDI. Available online: https://countryeconomy.com/hdi.
- Emtseva E. D., Morozov V. O., & Cherkasova E. Z. (2015). Econometric Studies of Correlation GDP and Quality of Life. Fundamental research, 11(6), pp. 1175-1179.
- Foulds, J., Wells, J. E., & Mulder, R. (2014). The association between material living standard and psychological distress: Results from a New Zealand population survey. International Journal of Social Psychiatry, 60(8), 766-771. [CrossRef]
- Grimsley, S. (2021). Životná úroveň: definícia a meranie. [online]. [cit. 2021-12-10]. Dostupné z: https://study.com/academy/lesson/standard-of-living-definition-measurement-quiz.html.
- Guler, H. (2018). The Impact of Financial Globalization on the Social Expenditures in Turkey and OECD Countries. Maliye Degrisi, 174, 219-239.
- Iberdrola (2021). What is the Human Development Index and why has it fallen for the first time since 1990? Available online: https://www.iberdrola.com/social-commitment/human-development-index.
- Ireland, S. (2021). Revealed: Countries With The Best Health Care Systems. Available online: https://ceoworld.biz/2021/04/27/revealed-countries-with-the-best-health-care-systems-2021/.
- Jones, Ch. I., & Klenow, P. J. (2016). Beyond GDP? Welfare across Countries and Time. American Economic Review, 106(9). pp. 2426–57. [CrossRef]
- Knausová, I. (2005). Vybrané kapitoly ze sociální politiky. Olomouc: Univerzita Palackého, ISBN 80-244-1021-4.
- Lifehack. (2019). Správa o svetovom šťastí: index šťastia. Available online: https://sk.lifehackk.com/world-happiness-report.
- Li, J.X., Du, Y.Z., Sun, N., & Xie, Z.M. (2024). Ecosystems of doing business and living standards: a configurational analysis based on Chinese cities. Chinese Management Studies, 18(5), 1302-1323. [CrossRef]
- MacFeely S., & Van de Ven P, Peltola A. (2024). To GDP and beyond: The past and future history of the world’s most powerful statistical indicator. Statistical Journal of the IAOS, 40(3), pp. 685-711. [CrossRef]
- Madzík, P., Piteková, J., & Danková, A. (2015). Standard of Living as a Factor of Countries' Competitiveness. International Scientific Conference: Business Economics and Management (BEM2015), 34, 500-507. [CrossRef]
- Mäsiarová, J. (2021). Ako sa dá merať šťastie a kde žijú najšťastnejší ľudia? Available online: https://www.unitedlife.sk/ako-sa-da-merat-stastie-a-kde-ziju-najstastnejsi-ludia/.
- Matúš, J., Bednárik, J., & Fašiang, T. (2016). Ekonómia - História, súčasnosť a budúcnosť. Prešov: Michal Vaško. ISBN 978-80-8105-813-4.
- Numbeo (2022), Health Care Index by Country 2012. Available online: https://www.numbeo.com/health-care/rankings_by_country.jsp?title=2012-Q1.
- Pediaa, (2020). What is the Difference Between Standard of Living and Quality of Life. Available online: https://pediaa.com/what-is-the-difference-between-standard-of-living-and-quality-of-life/.
- Santos, M., & Simoes, M. (2021). Globalisation, Welfare Models and Social Expenditure in OECD Countries. Open Economies Review, 32(5), 1063-1088. [CrossRef]
- Sawakinome, (2021). Rozdiel medzi životnou úrovňou a kvalitou života. Available online: https://sk.sawakinome.com/articles/business/difference-between-standard-of-living-and-quality-of-life-2.html.
- Sibirskaya, E. V., Oveshnikova, L. V., Mikheykina, L. A., & Lyapina, I. R. (2019). Statistics of Living Standards of Population. In: Economic Systems Analysis: Statistical Indicators. Studies in Systems, Decision and Control, vol 158. Springer, Cham. [CrossRef]
- Soltés, V., Nováková, B., & Szabo, Z. K. (2018). A Comparative Study on Satisfaction with Current Standard of Living and its Effects on Overall Life Satisfaction: Case of Romania, V4 and EU-15. Quality Innovation Prosperity – Kvalita Inovacia Prosperita, 22(1), 58. [CrossRef]
- Strephonsays, (2021). Rozdiel medzi životnou úrovňou a kvalitou života. Available online: https://sk.strephonsays.com/standard-of-living-and-vs-quality-of-life-2626.
- Surbhi, S. (2021). Difference Between Standard of Living and Quality of Life. Available online: https://keydifferences.com/difference-between-standard-of-living-and-quality-of-life.html.
- The Global Economy (2022). Happiness index - Country rankings. Available online: https://www.theglobaleconomy.com/rankings/happiness/.
- The World Bank (2021). Metadata Glossary. Available online: https://databank.worldbank.org/metadataglossary/africa-development-indicators/series/UNDP.HDI.XD.
- Ulpiani, G., Nazarian, N., Zhang, F. Y., & Pettit, C. J. (2021). Towards a Living Lab for Enhanced Thermal Comfort and Air Quality: Analyses of Standard Occupancy, Weather Extremes, and COVID-19 Pandemic. Frontiers in Environmental Science, 9, Art No 725974. [CrossRef]
- Veneri, P., & Murtin, F. (2019). Where are the highest living standards? Measuring well-being and inclusiveness in OECD regions. Regional Studies, 53(5), 657-666. [CrossRef]
- Verkuleviciute, D. (2006). Living standards in Lithuania: Changes and territorial differences. Changes in Social and Business Environment, 2018-223.
- World Health Organization (2021). Human Development Index. Available online: https://www.who.int/data/nutrition/nlis/info/human-development-index.
- World Population Review (2022). Happiest Countries in the World 2022. Available online: https://worldpopulationreview.com/country-rankings/happiest-countries-in-the-world.
- Yang, H.F., Feng, Q., Yu, W.Q., & Lyu, J. (2024). Exploring the interplay of resource utilization, human capital, and FDI in enhancing national well-being: Evidence from OECD countries. Resources Policy, 90, Art no 104684. [CrossRef]
- Yaprakli, S., & Ozden, E. (2021). The Effect of Sustainable Development on Economic Complexity in OECD Countries. International and Multidisciplinary Journal of Social Sciences-Rimcis, 10(2), 51-80. [CrossRef]
Figure 1.
Human Development Index in Scandinavian and V4 countries.
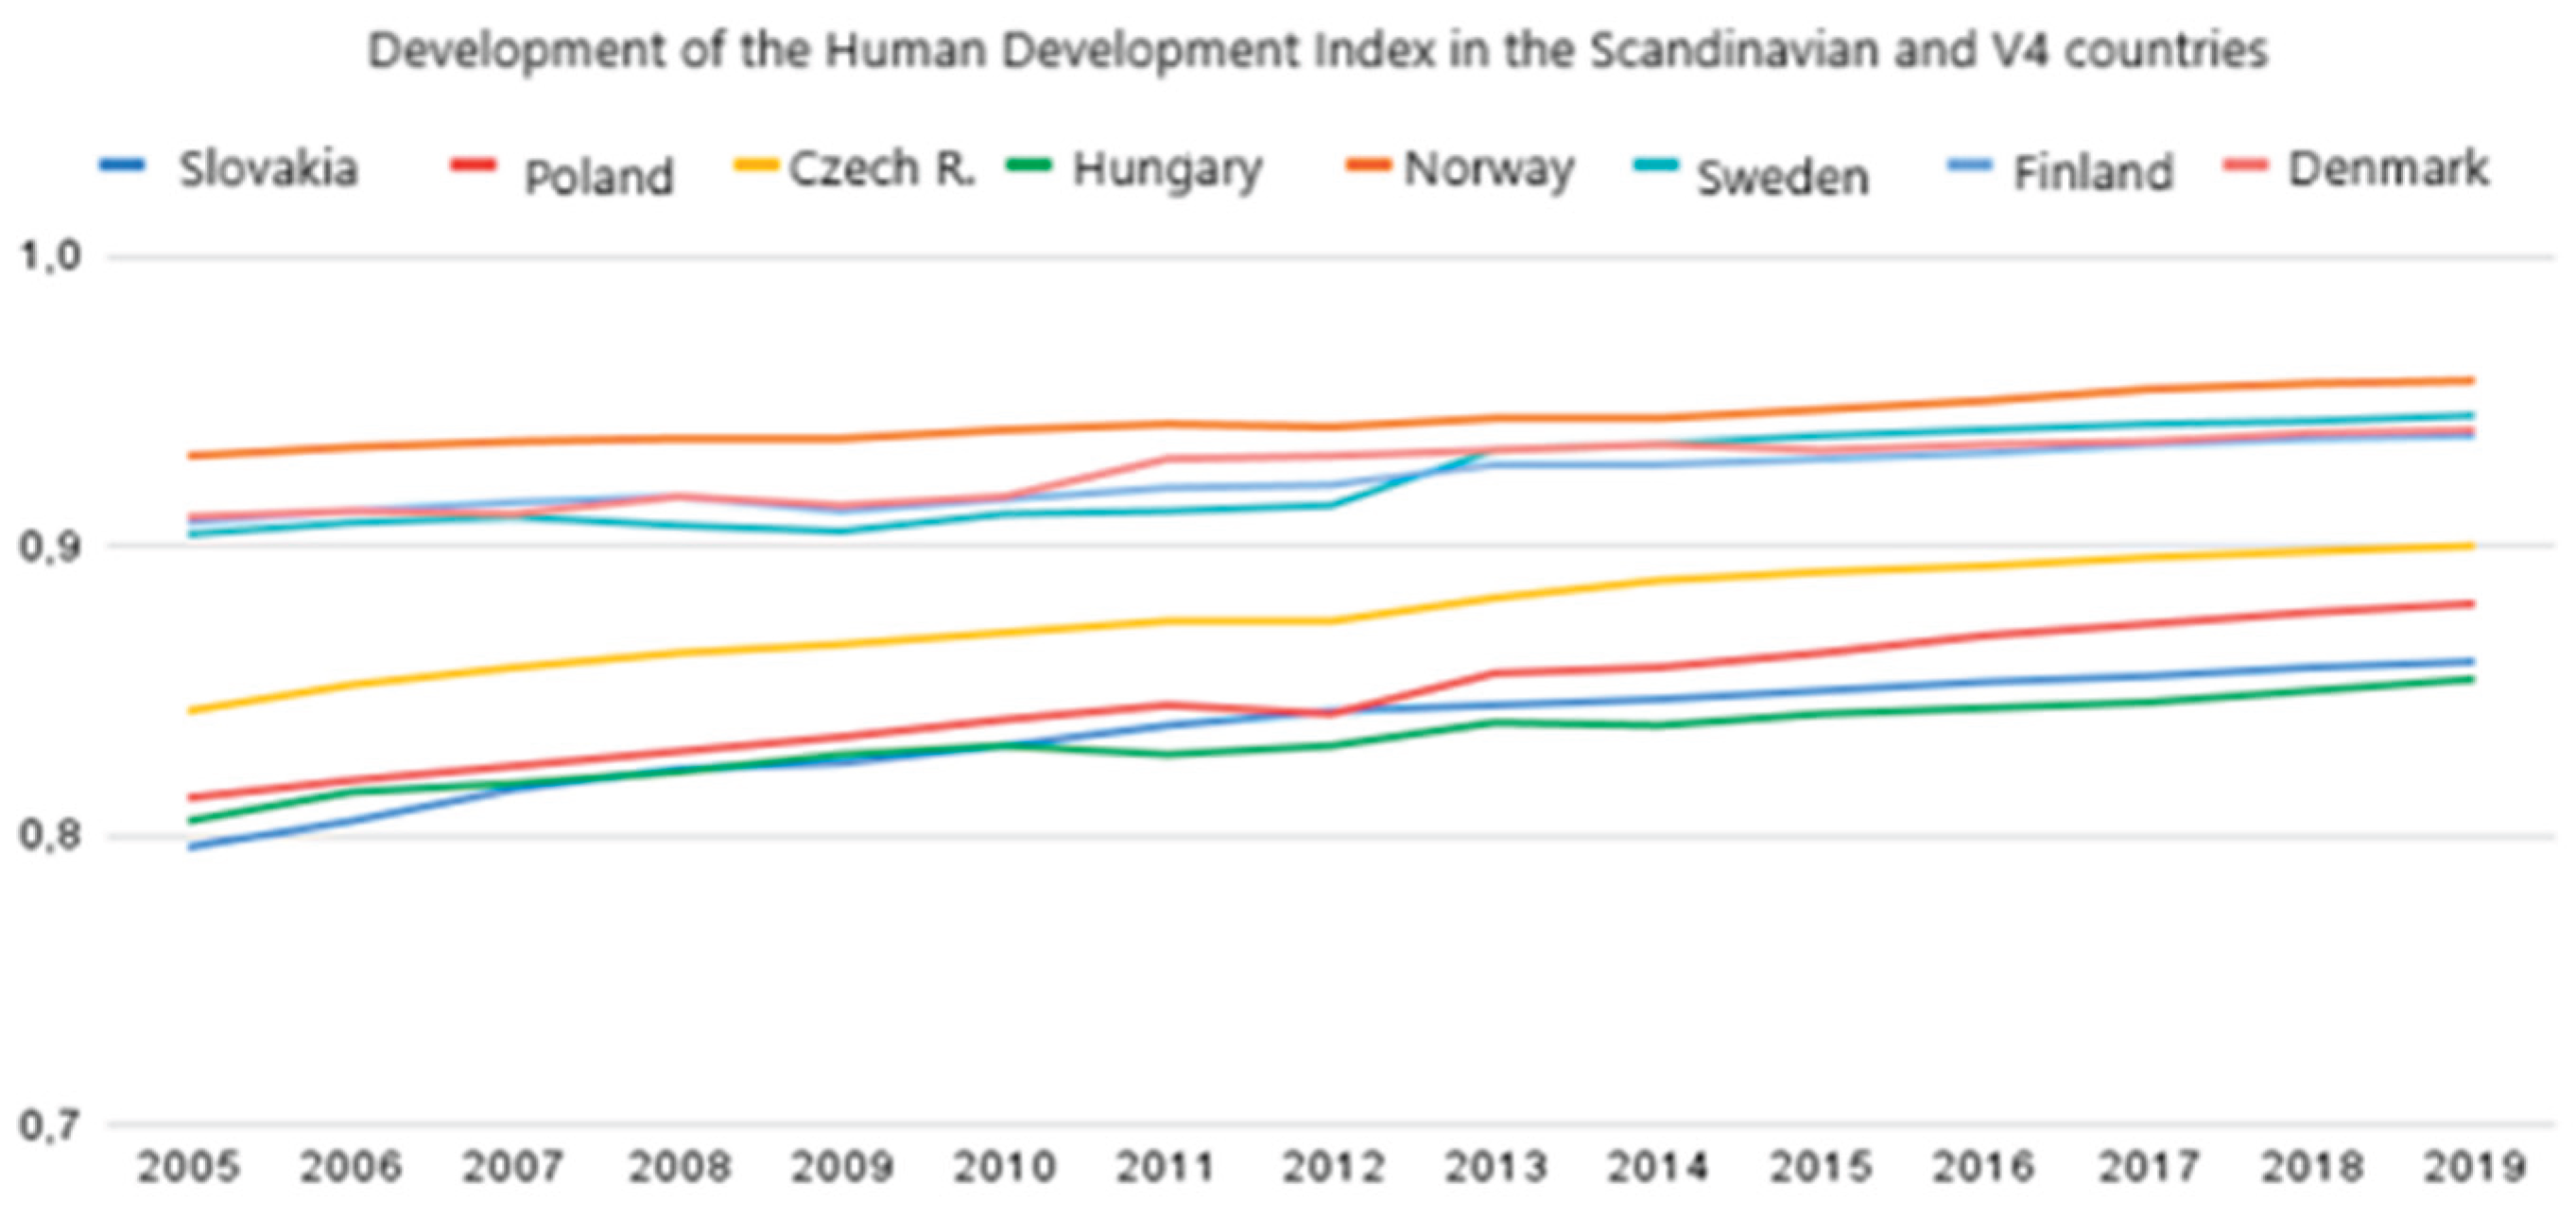
Figure 2.
Development of Healthcare Index in Scandinavian and V4 countries.
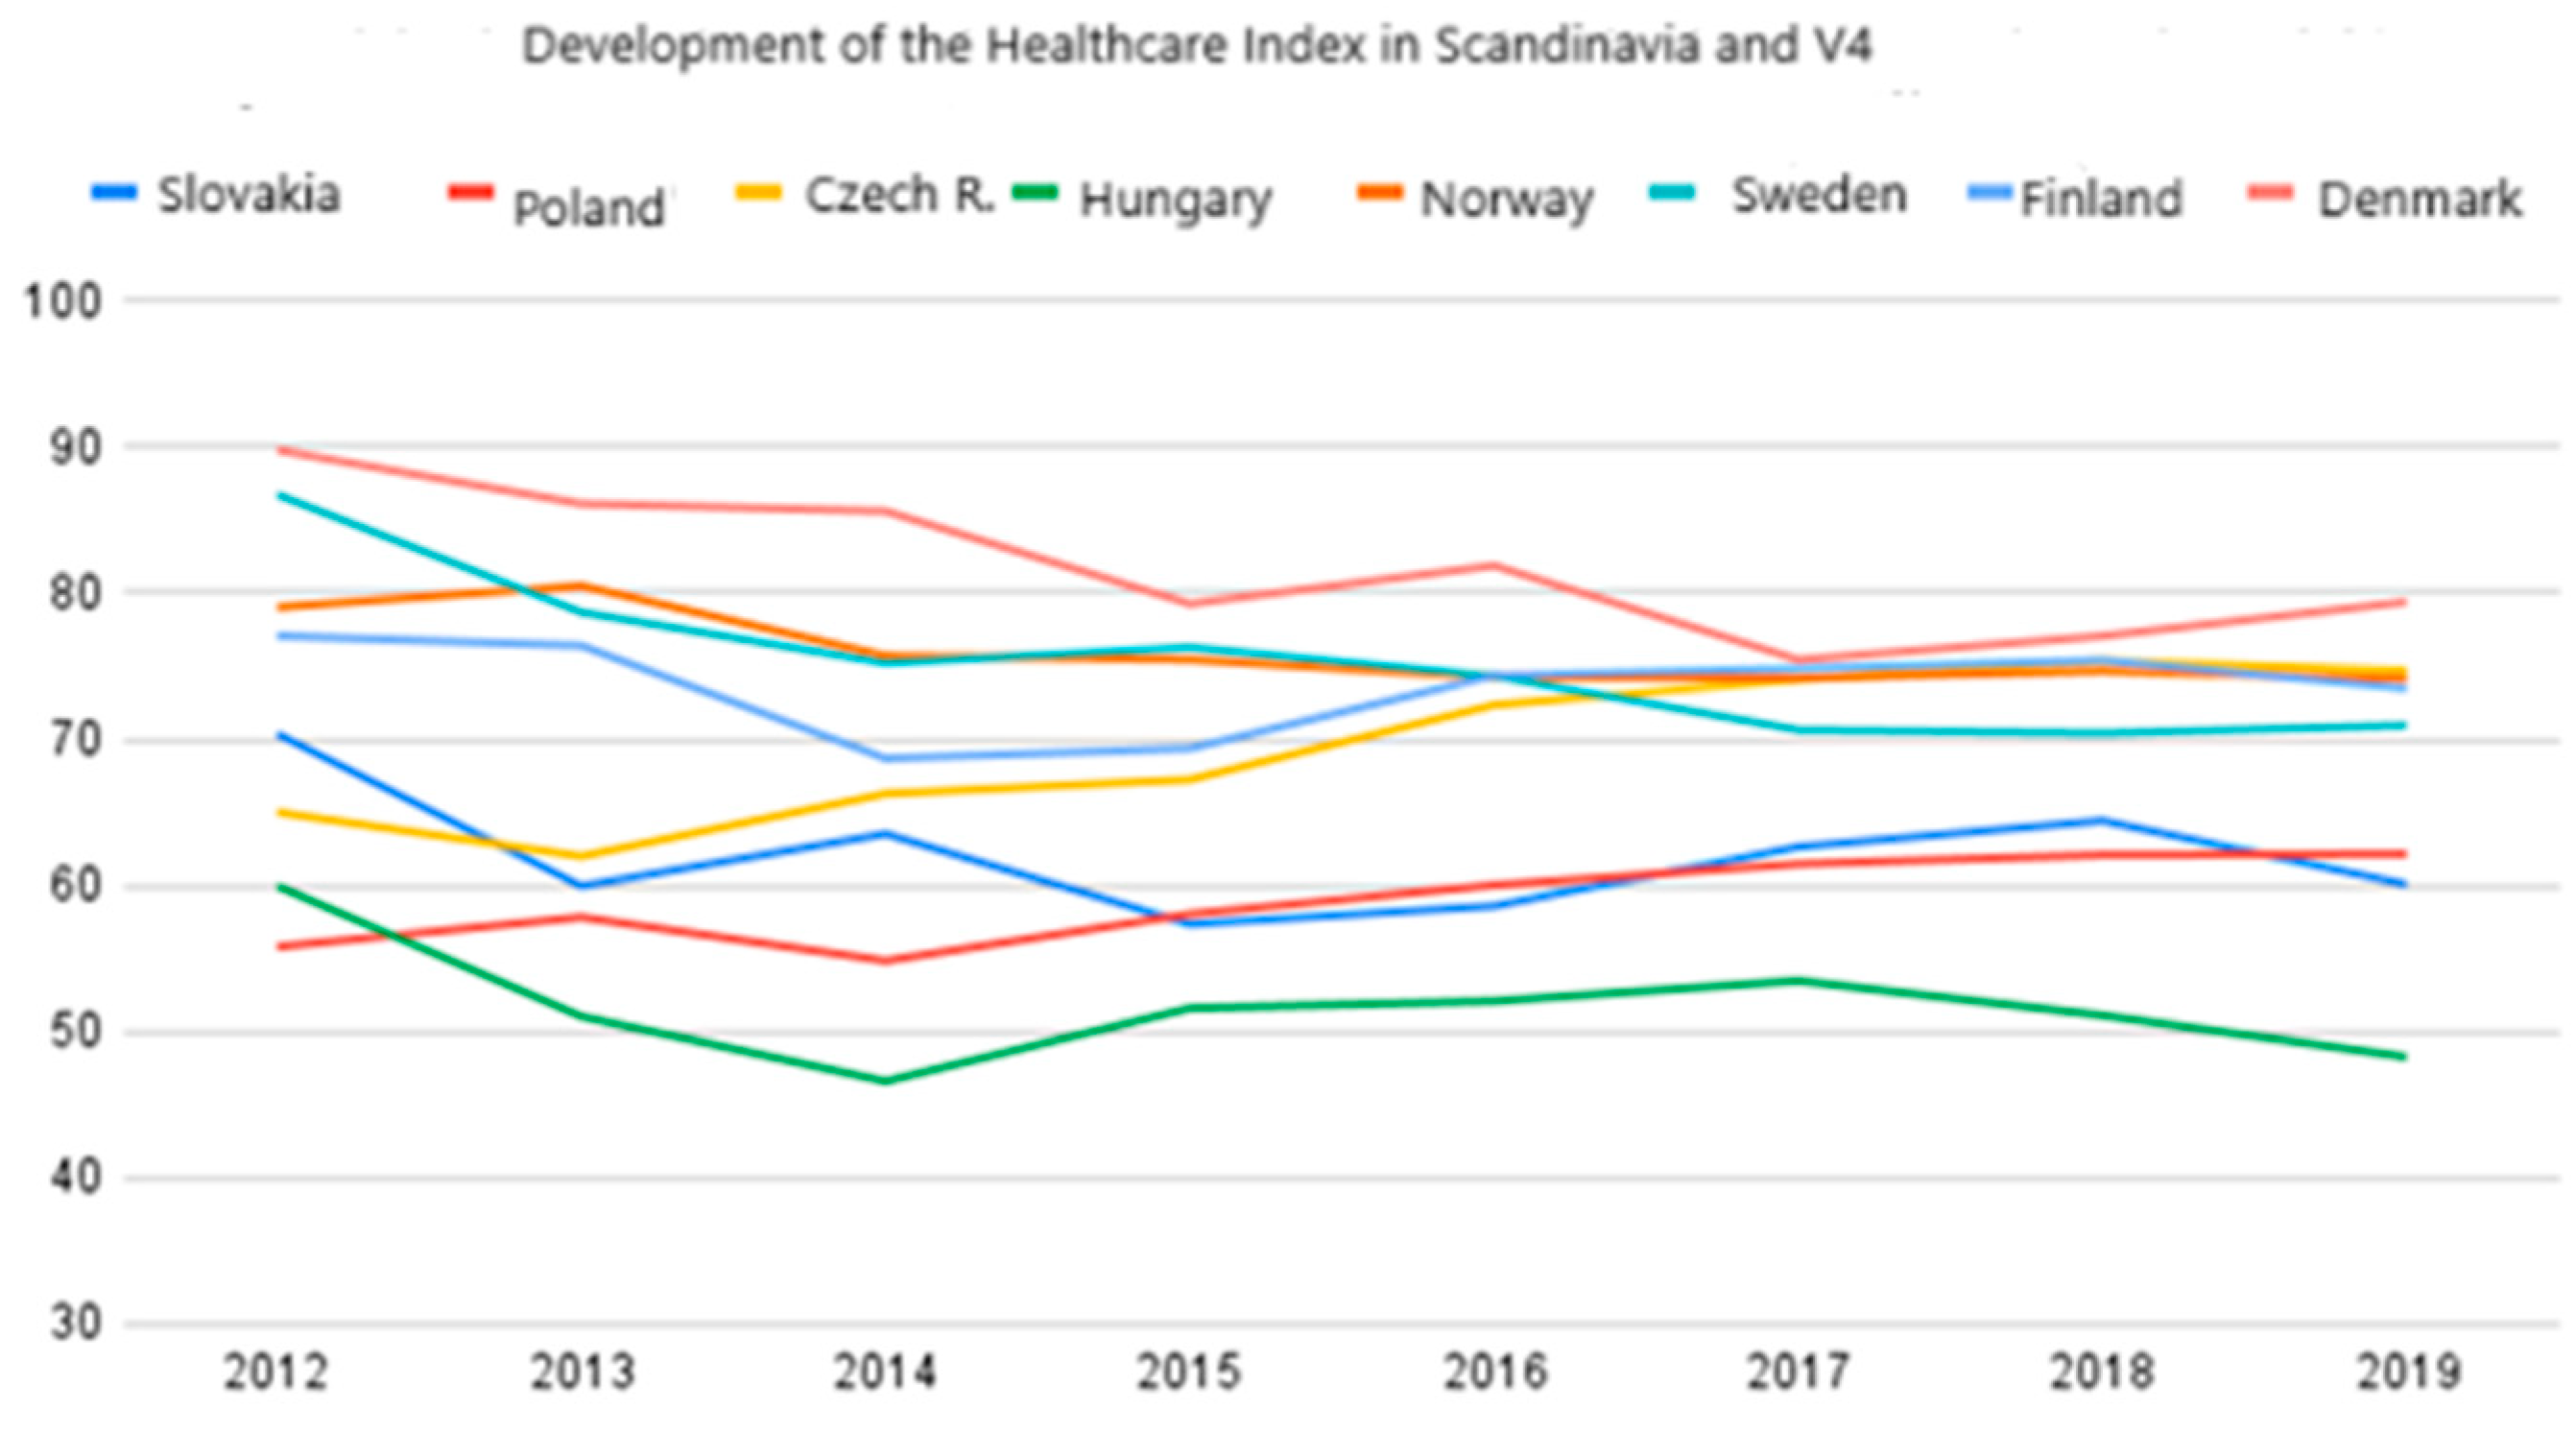
Figure 3.
Development of World Happiness Index in Scandinavian and V4 countries.
Disclaimer/Publisher’s Note: The statements, opinions and data contained in all publications are solely those of the individual author(s) and contributor(s) and not of MDPI and/or the editor(s). MDPI and/or the editor(s) disclaim responsibility for any injury to people or property resulting from any ideas, methods, instructions or products referred to in the content. |
© 2025 by the authors. Licensee MDPI, Basel, Switzerland. This article is an open access article distributed under the terms and conditions of the Creative Commons Attribution (CC BY) license (http://creativecommons.org/licenses/by/4.0/).
Copyright: This open access article is published under a Creative Commons CC BY 4.0 license, which permit the free download, distribution, and reuse, provided that the author and preprint are cited in any reuse.


