Submitted:
25 June 2025
Posted:
27 June 2025
You are already at the latest version
Abstract
With growing global attention on animal welfare and food safety, humane and effi-cient slaughtering methods in the poultry industry have increasing demands. Tradi-tional manual inspection methods are labor-intensive and seeking the need for auto-mated solutions. Most studies on electrical stunning focus on white broilers, whose optimal stunning conditions are not suitable for red-feather Taiwan chickens. This study introduces a smart, safe, and humane poultry slaughtering system designed to enhance animal welfare and integrate intelligent automation into modern slaughter house operations for red-feather Taiwan chickens. The system enables real-time mon-itoring and smart management of the poultry stunning process using image recogni-tion technologies for dynamic object tracking. Focusing on red-feathered Taiwan chickens, the system applies a dynamic tracking objects based with YOLO-v4 model to accurately identify stunned and un-stunned chickens, ensuring compliance with ani-mal welfare principles and improving the overall efficiency and hygiene of poultry processing. In this study, the dynamic tracking object recognitions compose object de-tection, motion prediction, and identity recognition over time. To enhance model per-formance, image amplification techniques were integrated into the training process. Prior to image amplification, the YOLO-v4 model achieved an average precision (AP) of 83% for identifying un-stunned chickens and 96% for stunned chickens. After am-plification, AP improved significantly to 89% and 99%, respectively. The model achieved a mean Average Precision (mAP) of 94% and processed images at 39 frames per second, demonstrating its suitability for real-time dynamic tracking objects appli-cations. In parallel, the system architecture integrates IoT-enabled modules to support real-time monitoring, sensor-based classification, and cloud-compatible decision sup-port. A digital twin simulation was also developed to replicate the physical slaughter-ing process, allowing synchronized control of processing stages and enabling stage-aware data collection. This deep learning-based recognition system was suc-cessfully deployed in a real slaughterhouse environment for dynamic tracking object recognition. Overall, this smart slaughtering system represents a practical and scalable application of AI technology in the poultry industry.
Keywords:
IoT
; poultry slaughter
; image recognition
; dynamic tracking object
1. Introduction
The growing global population has led to continual increases in demand for high quality protein from poultry. Consequently, conventional slaughtering practices face the challenge of ensuring that strict hygiene standards are met at every step of the process to prevent meat contamination and to minimize food safety risks [1, 2]. At the same time, social awareness regarding animal welfare has increased; people are increasingly realizing that raising production efficiency should not be at the expense of animal welfare [3, 4]. In addition, regulations have been enacted to safeguard the welfare of poultry during the raising, transportation, and slaughter processes [5, 6]. According to Taiwan’s Animal and Plant Health Inspection Agency, the annual number of broilers slaughtered in Taiwan has increased consistently in recent years. Smart production technologies are an integral component of improving production efficiency while protecting animal welfare; in particular, image recognition technology has offered new options for the poultry-slaughtering process. Conventional slaughter practices can be rife with problems such as improper operations, animal suffering, and low production efficiency. Real-time monitoring and smart management achieved through image recognition technology can improve the quality and efficiency of poultry slaughtering [7-9]. Because of increased social attention to food safety and animal welfare, poultry slaughterhouses require intelligent, scientific, and humane solutions. Recent advances in poultry processing have demonstrated that IoT-enabled platforms and cloud-integrated monitoring can significantly improve the transparency, responsiveness, and efficiency of slaughterhouse operations [10-12]. Machine vision and image recognition technologies can offer innovative solutions to these problems. IoT-based sensor networks—especially those analyzing behavioral and physiological data—have been proven effective in detecting stress, monitoring poultry welfare, and enhancing slaughter [13-15].
A stress response in an animal before slaughter can induce muscle metabolism, which affects the quality of the meat. The effects of transport induced stress on blood metabolism, glycolytic potential, and meat quality for broilers were evaluated [16]. According to their results, long term transport caused muscle fibers to decrease in area and increase in density, meaning that texture was affected. The meat qualities of broilers that had been stunned with those that had not been stunned were compared prior to slaughter out of 40 180-day-old female black bone chickens raised in identical conditions and slaughtered by the same butcher [17]. According to their results, the carcasses of the broilers that were stunned and then slaughtered had lower shear force values and less bleeding and produced higher quality meat compared with the un-stunned broilers. 42-day-old broilers with each weighing 2.4 ± 0.8 kg were stunned, with pulsed direct currents (DCs) of 5 V, 15 V, 25 V, 35 V, and 45 V at 700 Hz to examine the effects of different voltages on characteristics such as meat quality and protein solubility. The results indicated that some voltages had significant effects on the quality of the chicken meat; in particular, 5 V, 35 V, and 45 V result-ed in the most damage, and 5V and 45 V accelerated the postmortem pH decline rate, diminishing the water holding capacity and shear force [18].
With the advancement of agricultural technology, the poultry-farming industry has progressed toward high efficiency and smart developments. Image recognition technologies have provided poultry farmers with many innovative solutions that improve the cost, precision, and efficiency of poultry farming. Through model training, image recognition can monitor the behavior of poultry, in particular their eating and resting habits, at all times, as well as their health status. Analysis of potential diseases enables poultry farmers to apply corrective measures immediately in order to minimize the spread of disease and loss of life. Intelligent management of poultry can promote production efficiency and economic benefits. Smart poultry systems also benefit from digital twin modeling, which enables synchronized simulation of physical environments in parallel with edge and fog computing frameworks to ensure low-latency response and system dependability [19, 20] . The YOLO-v4 was proposed for a CSPDarknet53 architecture combining Cross-Stage-Partial connections (CSP) and Darknet-53 to markedly improve the perceptiveness and accuracy of the network [21]. Also, the YOLO-v4 algorithm was proposed to identify images of dead chickens with a chicken removal system [22]. The designed system reached 95.24% for precision and dead chickens were successfully moved to the storage cache of a chicken removal system. In addition, image enhancement techniques can be employed to improve the generalization capability of YOLO-v4, including crop-ping, scaling, and rotation. Experimental results have revealed that YOLO-v4 is capable of considerable processing speeds while maintaining high accuracy. YOLO-v5 and YOLO-v6 with respect to their performances were tested and compared in identifying dead birds [23]. This study verified that litter and feather coverage and camera height affected the precision of the image recognition model. When the camera was placed within poultry housing with no feather coverage, the YOLO-v5 model achieved a mean average precision (mAP)@0.50 score of 99.4% and a precision score of 98.4%. The results indicated that YOLO-v5 outperformed YOLO-v6 in precision, recall, processing speed, and training duration. The Faster R-CNN and MobileNet v3 architecture were proposed to identify the reproductive behaviors of Muscovy ducks. The training set was preprocessed with techniques including image enhancement and blurring to determine whether a preprocessed training set could enhance the accuracy of the model. According to the results, before preprocessing, model accuracy was 82% for mating behavior, 74% for non-mating behavior, and 88% for egg laying; after preprocessing, accuracy increased to 86% for mating behavior, 80% for non-making behavior, and 94% for egg laying [24]. That is, preprocessing of training images improved algorithm precision.
These technologies collectively signal a shift from reactive to predictive animal welfare management in poultry slaughterhouses, driven by real-time, IoT-integrated decision architectures [10, 12, 20]. The objective of this study was to build a smart and humane poultry slaughtering system for monitoring, determining, and managing the electrical stunning of red-feathered Taiwan chickens by using dynamic tracking objects recognition. This system uses brainwaves and manual comparisons to identify stunned and un-stunned red-feathered Taiwan chickens after electrical shocking in order to train the image recognition model and thus achieve automated monitoring, identification, and interpretation of chickens during the electrical stunning and slaughter processes. To ensure remote operability and responsive automation, the system architecture incorporates IoT-enabled components for sensor integration, real-time data acquisition, and cloud-compatible monitoring throughout the stunning process. YOLO-v4 is considered suitable for AI slaughtering applications due to its high accuracy, real-time processing speed, and strong generalization capabilities. Its CSPDarknet53 backbone improves network accuracy and perceptiveness, while the integration of Spatial Pyramid Pooling (SPP) and Path Aggregation Network (PANet) enables effective detection of poultry at varying scales and positions along the slaughter line. So, stunned and un-stunned chickens in dynamic real-world conditions can be reliably identified. Additionally, image enhancement techniques (e.g., cropping, scaling, rotation) can be supported in the model improving robustness and adaptability to varied slaughterhouse environments. Given its strengths in immediacy, accuracy, and efficiency, YOLO-v4 is well-suited for real-time, humane poultry monitoring in automated slaughter systems. Also, the system is expected to help prevent infringements related to the welfare of red-feathered chickens during the electrical stunning process in the event of insufficient electrical charge (possibly resulting in the chicken remaining conscious while being slaughtered) or excessive electrical charge killing the chicken immediately. The primary goal of this study was therefore to ensure that the animal welfare rights of Taiwan chickens could be upheld during the slaughtering process. The secondary goal of this study was to increase the level of intelligence in local poultry slaughtering processes. Replacing conventional and manual post-stunning detection techniques with image recognition techniques performed by computers could help to improve the efficiency and accuracy of chicken stunning. It could also enable the immediate discovery and handling of critical situations when they occur, thereby reducing labor costs while increasing production line efficiency. By monitoring the stunning conditions of native chickens, stress responses induced by electrical stunning and even death due to excessive electric shock can be detected and corrected immediately to improve the quality of the carcass. Furthermore, reducing personnel’s contact with the production line would likely improve hygiene standards and thus reduce the risk of infection.
2. Materials and Methods
2.1. Smart Humane Poultry Slaughter System Processes
The proposed system for the smart humane slaughter of red-feathered Taiwan chickens comprised bird reception, an electrified water bath, head cutting, voltage and current controls, chicken plucking, Camera A capturing the bird reception section, Camera B capturing the bloodletting, a computer, and wireless router; see Figure 1 for a detailed schematic of the system. The approval animal number for this research is 111-008R3. The age is 16 weeks of red-feathered Taiwan chickens. The slaughter process of red-feathered Taiwan chickens is described as follows:
- During reception, red-feathered Taiwan chickens waiting to be slaughtered are hung by their feet from an overhead conveyor to be transported upside-down to the water bath for electrical stunning. Shackles ensure that the chickens are firmly secured to the overhead conveyor, preventing the chickens from falling from the conveyor when immersed in the electrified water bath and damaging equipment or harming personnel. This design guarantees the safety of the slaughter process and maximizes work efficiency by securing the chickens’ feet to the overhead conveyor and confirming that the chickens’ bodies are in the proper position. This operational procedure ensures that the red-feathered Taiwan chickens move smoothly through the slaughter process while minimizing risks.
- During the electrified water bath, the red-feathered chickens are electrically stunned. More specifically, the chickens are shocked for 7 ± 0.6 s with a constant voltage DC to render them unconscious. The positive electrode of the constant voltage DC is connected to the water bath, and the negative electrode is connected to the overhead conveyor. This setup ensures that the red-feathered Taiwan chickens are fully stunned and prevents situations in which any chicken remains conscious because the electrical current did not pass through their body completely. In addition, this design reduces the risk of electrical shock to operators, thereby ensuring the safety of the slaughter process.
- The head-cutting area is the area where slaughterers cut the throats of the red-feathered Taiwan chickens. After being stunned by the electrified water baths, the unconscious chickens are killed and bled in this area to complete the slaughter process. In this study, Camera B was positioned in this area to capture images of successfully and unsuccessfully stunned red-feathered Taiwan chickens; these images were subsequently used to train the identification model. The trained model was then used for real-time stunning identification to ensure that the treatment of the red-feathered chickens met animal welfare requirements prior to slaughter. In addition to images, brainwaves were also collected in the head cutting area; these data can contribute to a deeper understanding of the physiological responses of red-feathered Taiwan chickens during the electrical stunning process and further guarantee the proper stunning effect and animal welfare. To proceed with data collection and real-time monitoring, this study employed high-resolution cameras and a high-speed router to ensure that the collected images and data could be transmitted to the computer via Wi-Fi instantly and accurately. The collection and analysis of these data can help to improve and optimize the electrical stunning process and ensure that every red-feathered Taiwan chicken can be rendered properly unconscious before being slaughtered, thereby minimizing their suffering. In addition, these technological measures can enhance the safety and efficiency of the slaughter process, preventing risks to operators.
- Red-feathered chickens that are confirmed to have no vital signs are transported by the overhead conveyor to the complete-bloodletting area and continue to bleed during transport. All red-feathered chickens in this area are dead and are released automatically from the overhead conveyor onto a bench.
- The slaughterers place the bled chickens into the chicken pluckers for feather removal. First, the carcasses of the red-feathered Taiwan chickens are scalded to warm them up and thus facilitate subsequent defeathering. The carcasses are continually tumbled in the pluckers to ensure that the red-feathered Taiwan chickens are sufficiently heated in the drum, which is padded with soft plastic columns. When a red-feathered Taiwan chicken carcass is dumped into the drum, the soft plastic columns collide with the carcass, and the force from the high-speed rotations plucks the feathers from the carcass. When feather removal is complete, the carcass is ejected from the plucker.
Following the final step, each red-feathered Taiwan chicken carcass goes through subsequent processes, including evisceration and packaging. Defeathering ensures the clean and attractive appearance of the carcass and improves the efficiency and quality of subsequent processing. The scaling and plucking durations of the plucker can be adjusted according to the broiler species.
2.2. Image Recognition System Equipment and Architecture
The training of the model for identifying stunned red-feathered Taiwan chickens requires a high-performance computer to enhance the training effect and training speed. During image recognition and data storage in the slaughterhouse, the system must have stable operating performance and high-speed processing capabilities; hence, a computer with high-performance processors and high storage capacity was chosen for this study. Furthermore, to meet the processing demands for large amounts of data, the training and inference processes of the deep learning model were accelerated using a high-speed solid-state drive (SSD) and a powerful graphics processing unit (GPU). The central processing unit (CPU) was a high-performance multicore processor that ensured the rapid processing of complex computing tasks in multiple execution environments. In this study, the CPU was used to preprocess the training set by adjusting the image sizes and rotating and enhancing the images. Model evaluation and system management were performed simultaneously to ensure the high-performance operation of the image recognition model processes. In this study, the training process was accelerated by the GPU, whose large number of cores and parallel computing capability are particularly well suited to the efficient execution of large-scale matrix operations and deep learning calculations, meaning that it can rapidly iterate models and optimize parameters. Random-access memory (RAM) enables the efficient storage of and access to large quantities of data during the training of large-scale models. In this study, RAM enabled the storage of an entire batch of data in one action, ensuring that the training process was continuous and efficient. The hard drive was an SSD, which was used to read and write data rapidly and to minimize bottlenecking during data transmission. A large-storage drive was used to store the training data in this study. The specifications of all the equipment used in this study are presented in Table 1.
This study required the collection of images of stunned red-feathered Taiwan chickens through cameras to train the identification model. At the same time, images of the slaughter line also needed to be captured by the cameras and transmitted to the computer via the Wi-Fi router to facilitate real-time image recognition in subsequent applications. As part of an IoT-based acquisition system, this data transmission infrastructure enables the integration of edge devices and wireless communication to support real-time recognition and feedback. Training data were collected from two different angles: Camera A was positioned 30 cm from the bird reception area and focused on capturing the appearance of the red-feathered Taiwan chickens before being immersed in the electrified water bath; Camera B was positioned 60 cm from the bloodletting area. Together, these two cameras captured images of the red-feathered Taiwan chickens from different angles before and after the chickens were electrically shocked, providing images for both labelling and training. Consequently, high-speed transfers and high-definition image quality were necessary in this study to guarantee the accuracy and timeliness of the data. To this end, high-resolution cameras were utilized to ensure that clear and detailed images could be captured in order to maximize the accuracy of the model. Moreover, selecting a Wi-Fi router that supports high-speed transfers enabled the immediate feedback of images; the router employed in this study supports a typical broadband network and 4G SIM cards, enabling it to switch between the two and thus preventing connectivity problems from hindering system operations while satisfying real-time identification requirements. These components collectively form the edge layer of the proposed IoT architecture, ensuring that the stunning process is continuously monitored and analyzed with minimal latency. The proper use of the aforementioned equipment is expected to significantly enhance training the stunned red-feathered Taiwan chicken identification model which can ensure that each chicken is slaughtered in compliance with animal welfare standards, minimizing stress and pain during the slaughter process. Beyond image-based detection, the integration of IoT simulation and remote monitoring capabilities enhances system intelligence and supports closed-loop animal welfare verification.
2.3. IoT Integration and Digital Twin Simulation
To complement the image recognition component, an IoT-based simulation framework was developed to represent a digital twin of the poultry slaughtering process. Using MATLAB/Simulink, a virtual conveyor model was built to simulate time-dependent transitions between four key processing stages: reception, stunning, cutting, and plucking. Each stage was modeled with a defined transport delay to reflect realistic movement of poultry along the production line. This timing simulation, visualized via a stage-index signal (Figure 2a), enables stage-aware process monitoring in real time. In parallel, a logic-based EEG stunning detection subsystem was implemented to assess the consciousness state of chickens using threshold comparison. Dynamic EEG signals were processed and compared to a fixed threshold value of 12 mV. The output of this comparison generated a binary classification “stunned” or “not stunned”, which can be transmitted to IoT platforms such as ThingSpeak or MQTT-enabled dashboards for remote monitoring and decision support (Figure 2b). Such a system aligns with best practices in smart livestock architectures, where IoT-enabled sensors, data processing units, and cloud connectivity enable continuous monitoring and responsive control [25]. To ensure robustness and interoperability, data transmission in this system is modeled according to established frameworks for structured IoT data pipelines in smart farming [26].
Furthermore, a PID-based voltage control subsystem was developed to simulate adaptive control of stunning voltage based on variations in chicken weight. The simulated weight is compared with a setpoint voltage, and the resulting error is regulated by a PID controller to ensure that voltage remains within an effective and safe stunning range. The block diagram of this control structure is illustrated in Figure 2c, providing a foundation for future closed-loop IoT-controlled stunning systems.
2.4. Building the Stunned Red-Feathered Taiwan Chicken Dataset
To build an accurate identification model, data from 200 red-feathered Taiwan chickens—including those related to brainwaves, images, weight, and voltages—were collected to determine whether the stunned chickens had been successfully rendered unconscious. Brainwaves were used to accurately determine the current status of the red-feathered Taiwan chickens while judging the training data. In this study, brainwaves were divided into three intervals: 10–20 s (P1), 20–30 s (P2), and 30–40 s (P3). Differences in brainwave energy values before and after electric shock treatment were used to determine whether each red-feathered Taiwan chicken had been successfully stunned: If the post-stunning brainwave energy value was 10% of the pre-stunning value or lower, the chicken was determined to have been successfully stunned. When selecting the training dataset, to prevent the model from being trained on erroneous data, judgments were made on the basis of both brainwaves and visual determinations; simultaneous judgments could enhance the accuracy of the stunned red-feathered Taiwan chicken dataset. To validate and label the data, red-feathered Taiwan chicken consciousness was divided into the following four scenarios. Table 2 shows the brainwave data sheet of electric shocks for red-feathered Taiwan chickens including four scenarios. Also, table 3 shows the visual criteria for red-feathered Taiwan chickens inclusive of raising its head, opening its eyes, moving its wings, its weight and the voltage.
Scenario 1: The chicken is determined by sight and by brainwaves to have been stunned; Figure 3(a) depicts a red-feathered Taiwan chicken in this state.
Scenario 2: The chicken is visually determined not to have been stunned, yet the brainwaves indicate unconsciousness; see Figure 3(b).
Scenario 3: The chicken is determined by sight and by brainwaves not to have been stunned; see Figure 3(c).
Scenario 4: The chicken is visually determined to have been stunned, yet the brainwaves indicate consciousness; see Figure 3(d).
2.5. Dynamic Tracking Object Recognition for the YOLO-v4 Red-Feathered Taiwan Chicken Image Recognition Model
The YOLO-v4 image recognition model is a supervised learning algorithm that requires the use of labeled data for model training. These data include the location, size, shape, and attributes of the target object, and these labels teach the model how to accurately identify the target object. The YOLO-v4 backbone utilized in this study was constructed with Darknet, an open-source neural network framework primarily used in machine vision and object detection tasks. The two versions of Darknet are Darknet-19 and Darknet-53, the main difference these two versions being that Darknet-19 is composed of 19 layers, namely convolutional layers and max pooling layers, whereas Darknet-53 is composed of 53 layers, namely convolutional layers and fully connected layers. Darknet-19 is relatively lightweight and is well suited to situations with limited hardware resources; however, Darknet-53 demonstrates greater precision thanks to its larger and deeper model framework. The YOLO-v4 model employed in this study was constructed using a CSPDarknet-53 framework, which improves on the original Darknet-53 framework by incorporating the cross-stage partial network in order to enhance the model’s learning ability and computing speed.
Use deep learning based feature extractor ,
where is deep neural network. is the object image. For similarity matching,
Based on data association, dynamic object can be tracked simultaneously as following,
where is measurement state from YOLO-v4. is predict object state. is covariance from Kalman filter.
This study adopted MATLAB software for dataset creation and model training and execution. Datasets created in MATLAB software can be stored in Workspace and immediately accessed for model training and model testing without the need to create another file. In addition, MATLAB’s built-in Deep Network Designer application enables the construction of networks in the form of block diagrams; compared with the conventional practice of constructing and adjusting networks with text files, this approach is quicker and more intuitive. In this study, the pretrained CSPDarknet-53 framework was selected as the backbone. The parameters used to train the YOLO-v4 stunned red-feathered Taiwan chicken identification model are presented in Table 4. The Initial Learning Rate parameter was set to 0.0001 in this study; when training a YOLO-v4 model, the learning rate can be dynamically adjusted. The Learn Rate Schedule parameter was set to piecewise. The Learn Rate Drop Period was set to 90, and the Learn Rate Drop Factor was set to 0.1; the Mini Batch Size refers to the size of the model training input after each round of training set segmentation. In this study, the Mini Batch Size is 3. To prevent model overfitting, L2 Regularization is to add an additional item to the loss function to improve the model’s performance and reduce its complexity. In this study, L2 Regularization is 0.0005. Max Epochs is the maximum training epoch, with one epoch being the time required to complete training once with a complete training set. In this study, Max Epochs is 120. Shuffle was set to every-epoch, indicating that after every epoch, the training set would be shuffled and entered into the model for training again. Verbose Frequency is the cycle of the output training data and was set to 10, meaning that every 10 Mini Batch Sizes would produce one output to provide insight into the current model training data. The Plots parameter was set to training-progress to enable the real-time monitoring of the validation loss and training loss of the current model training. Finally, the Output Network parameter was set to best-validation, meaning that after all the training epochs were completed, the model with the best validation loss performance would serve as the final output.
The dataset of 1024 labeled photographs comprised 444 images of unstunned red-feathered Taiwan chickens and 580 images of stunned red-feathered Taiwan chickens. This dataset was segmented, at a ratio of 3:1:1, into 614 images in the training set, 205 images in the testing set, and 205 images in the validation set. The YOLO-v4 model trained in this study employs transfer learning, using a pretrained model as the foundation for training the stunned red-feathered Taiwan chicken identification model; this approach was employed to minimize the training duration and number of training iterations by eliminating the need to adjust the initial values of the model. The model training process involved continuous feedback regarding the training loss and validation loss. Training loss can be used to measure the performance of the model training set and reflects the difference between the training data and the actual labels; the lower the output value, the more effective is the model. Validation loss reflects the model’s performance in relation to the validation set during the training process. Comparing the validation loss with the training loss can determine whether the model is overfitted. If the training loss continues to decrease while the validation loss increases, the model is overfitted. In addition, validation loss can reveal the optimal number of epochs for the training set. In this study, the model with the best validation loss within the set number of epochs was chosen to be the study’s output model. At the outset of model training, the training loss was 19,843.082, and the validation loss was 19,136.562; both losses then decreased steadily as the number of epochs increased, dropping to 0.105 and 0.105, respectively, by the time the final training was completed. Figure 4 depicts the changes in training and validation losses.
2.6. Enhancing Images of Stunned Red-Feathered Taiwan Chickens
After being labeled, the training images were enhanced to increase the variety of the training set. Three image enhancement techniques were performed on the training set. Figure 5 (a) shows the original image of the stunned chicken. The first was HSV color dithering, which adjusts the hue, saturation, and value of the training set images; see Figure 5 (b). The second technique was horizontal flipping, which enables the model to learn the opposite features of the original image and thus correctly identify when the chicken is convulsing because of a stress response; see Figure 5 (c). The third technique is larger scaling for 10 %; see Figure 5 (d). The growth of the red-feathered Taiwan chickens in this study may not have been consistent, and such inconsistency may have resulted in varying physical sizes upon their entry to the slaughter line. Random scaling enabled the model to adapt red-feathered Taiwan chickens of varying size. The images in the training set were enhanced to expand the training set to 3072 images that were to be fed into the model for training.
3. Results and Discussion
3.1. Performance Criteria of the Stunned Red-Feathered Taiwan Chicken Identification Model
Metrics including precision, recall, intersection over union (IoU), average precision (AP), and mAP (mean average precision) were used to evaluate the performance of the red-feathered Taiwan chicken identification model. Figure 6 shows the overlap area (A) and the union area (B) between the predicted boundary box and the actual boundary box.
IoU can be expressed as
where is the overlap area between the predicted boundary box and the actual boundary box. is the union area between the predicted boundary box and the actual boundary box. Evaluating a model on the basis of its IoU requires presetting a threshold; when the IoU is greater than this threshold, the overlap between the prediction result and the actual labeled result is sufficiently high, and the prediction can therefore be considered accurate. Setting an IoU threshold enabled true positives (TPs) and false positives (FPs) to be distinguished. Typically, the IoU threshold is set to 0.5 or higher. In this study, the threshold was set to 0.75. Table 5 illustrates the determination criteria between actual targets and predicted targets of the image recognition model for the red-feathered Taiwan chicken as a confusion matrix.
Precision was defined as the proportion of correct identification among all identified chickens by the model and was calculated using Equation 5:
Recall refers to the proportion of correct identification among all predicted targets and was calculated using Equation 6:
After calculation of the precision and recall, a Precision–Recall curve could be plotted; such a curve clearly shows precision values for various recall rates. In addition, mAP can be expressed as follows:
where is numbers of classification identified targets, and is the category of identified targets. In this study, inclusive of unconscious and conscious red-feathered Taiwan chickens.
3.2. Results of the YOLO-v4 Stunned Red-Feathered Taiwan Chicken Identification Model
Table 6 shows the confusion matrix of the YOLO-v4 stunned red-feathered Taiwan chicken identification model. As illustrated in Figure 7, in IoU is 0.75, the YOLO-v4 stunned red-feathered Taiwan chicken identification model without image amplification demonstrated AP scores of 83% for unstunned chickens and 96% for stunned chickens. After image amplification shown in Figure 8, these scores increased by 6% to 89% for unstunned chickens and by 3% to 99% for stunned chickens; the mAP was 94% and the image processing speed was 39 frames per second.
The effectiveness of image amplification in enhancing model precision was evident, particularly in improving the detection of unstunned chickens. This enhancement demonstrates the contribution of data augmentation to model generalization and stability.
Evidently, in this study, image amplification of the training set improved the precision of the model. These results verify the effectiveness of image amplification techniques in improving model performance, particularly in the identification of stunned and unstunned red-feathered Taiwan chickens. The application of image amplification techniques in model training significantly improved the accuracy of the YOLO-v4 model, enhancing its reliability and stability in practical applications.
The virtual conveyor simulation (Figure 2a) successfully replicated the stage-wise progression of poultry through the slaughtering process. Over a 10-second simulation period, transitions from idle to reception, stunning, cutting, and plucking were accurately modeled. The stage index signal output (Figure 9a) confirmed correct sequencing, with the index values incrementing from 0 to 4 in alignment with real-time process logic. These results validate the model’s ability to capture and represent synchronized physical stages in accordance with digital twin principles.
The EEG-based stunning detection subsystem (Figure 2b) employed a 12 mV threshold to evaluate the consciousness state of the chickens. As illustrated in Figure 9b, the simulated EEG signal fluctuated within the range of 8–20 mV but consistently remained above the threshold. Consequently, the system continuously classified the subject as “not stunned.” This outcome demonstrates the reliability and responsiveness of the classification logic, supporting its application in sensor-driven, IoT-enabled animal welfare monitoring frameworks.
Figure 2c presents the PID-based voltage control structure, which was developed to simulate adaptive voltage regulation in response to real-time weight variations. The corresponding output (Figure 9c) shows a steady increase in stunning voltage from approximately 13 V to 26 V, reflecting the controller’s effective regulation across the simulation window. These findings support the feasibility of integrating real-time closed-loop control mechanisms within smart stunning systems designed for IoT-based poultry processing environments.
Finally, the model was deployed and tested in a real slaughterhouse environment. Figure 10 shows the dynamic tracking object recognition for the red-feathered Taiwan chicken in real slaughtering environment. In this figure, the stunned accuracy is about 0.97. This confirms its robustness and suitability for real-time object tracking applications in industrial poultry processing.
5. Conclusions
This proposed system minimizes manual labor, enhances production efficiency, and improves food safety during slaughterhouse operations. Also, the study successfully built a smart and humane poultry slaughter system to monitor and manage poultry on the slaughter line. By integrating cameras, the system enables real-time tracking poultry status, significantly reducing the need for manual inspection. A YOLOv4-based deep learning model was trained to recognize red-feathered Taiwan chickens, achieving 99% accuracy in detecting stunned chickens and 89% for unstunned ones, with a mean Average Precision (mAP) of 94% and an image processing speed of 39 frames per second. The system ensures humane slaughter practices and can be widely applied in modern poultry processing facilities and other chicken breeds to support animal welfare, hygiene standards, and automation. The inclusion of EEG-based stunning detection, PID voltage control, and real-time simulation modeling lays the groundwork for IoT-enabled remote management, predictive monitoring, and system scalability. Future research may focus on scaling the system for industrial applications and integrating feedback loops for continuous optimization.
Author Contributions
“Conceptualization, Hao-Ting Lin; methodology, Hao-Ting Lin; software, Hao-Ting Lin; validation, Hao-Ting Lin; writing—original draft preparation, Hao-Ting Lin; writing—review and editing, Hao-Ting Lin and Suhendra; supervision, Hao-Ting Lin; project administration, Hao-Ting Lin. All authors have read and agreed to the published version of the manuscript.”
Funding
This research was funded by Ministry of Agriculture, Taiwan, grant number 113 Agriculture Science-11.1.3-Poultry-01.”
Acknowledgments
The author would like to thanks for Prof. Yi-Chun Lin who is from Department of Animal Science in National Chung Hsing University to support this work.
Conflicts of Interest
“The authors declare no conflicts of interest.”
References
- Jainonthee, C.; Chaisowwong, W.; Ngamsanga, P.; Meeyam, T.; Sampedro, F.; Wells, S.J.; Pichpol, D. Exploring the influence of slaughterhouse type and slaughtering steps on Campylobacter jejuni contamination in chicken meat: A cluster analysis approach. Heliyon 2024, 10, e32345. [Google Scholar] [CrossRef] [PubMed]
- Zhou, Y.; Wang, N.-L.; Cen, J.-Q.; Han, J.-T.; Tang, Y.-X.; Xu, Z.-Q.; Zeng, H.; Houf, K.; Yu, Z. Comparative analyses of bacterial contamination and microbiome of broiler carcasses in wet market and industrial processing environments. Int. J. Food Microbiol. 2025, 426, 110937. [Google Scholar] [CrossRef] [PubMed]
- He, S.; Lin, J.; Jin, Q.; Ma, X.; Liu, Z.; Chen, H.; Ma, J.; Zhang, H.; Descovich, K.; Phillips, C.J.C.; et al. The Relationship between Animal Welfare and Farm Profitability in Cage and Free-Range Housing Systems for Laying Hens in China. Animals 2022, 12, 2090. [Google Scholar] [CrossRef] [PubMed]
- Iannetti, L.; Neri, D.; Torresi, M.; A Acciari, V.; Di Marzio, V.; Centorotola, G.; Scattolini, S.; Pomilio, F.; Di Giannatale, E.; Vulpiani, M.P. Can animal welfare have an impact on food safety? A study in the poultry production chain. Eur. J. Public Heal. 2020, 30. [Google Scholar] [CrossRef]
- Valkova, L.; Vecerek, V.; Voslarova, E.; Kaluza, M.; Takacova, D.; Brscic, M. Animal welfare during transport: comparison of mortality during transport from farm to slaughter of different animal species and categories in the Czech Republic. Ital. J. Anim. Sci. 2022, 21, 914–923. [Google Scholar] [CrossRef]
- Duval, E.; Lecorps, B.; von Keyserlingk, M.A.G. Are regulations addressing farm animal welfare issues during live transportation fit for purpose? A multi-country jurisdictional check. R. Soc. Open Sci. 2024, 11, 231072. [Google Scholar] [CrossRef]
- Tran, M.; Truong, S.; Fernandes, A.F.; Kidd, M.T.; Le, N. CarcassFormer: an end-to-end transformer-based framework for simultaneous localization, segmentation and classification of poultry carcass defect. Poult. Sci. 2024, 103, 103765. [Google Scholar] [CrossRef]
- Chen, Y.; Wang, S. Poultry carcass visceral contour recognition method using image processing. J. Appl. Poult. Res. 2018, 27, 316–324. [Google Scholar] [CrossRef]
- Chowdhury, E.U.; Morey, A. Application of optical technologies in the US poultry slaughter facilities for the detection of poultry carcase condemnation. Br. Poult. Sci. 2020, 61, 646–652. [Google Scholar] [CrossRef]
- Wu, F.; Miao, Z.; He, C. Remote Monitoring System for Intelligent Slaughter Production Line Based on Internet of Things and Cloud Platform. 2020 11th International Conference on Prognostics and System Health Management (PHM-2020 Jinan); pp. 538–542.
- Alkahtani, M.; Aljabri, B.; Alsaleh, A.; Alghamdi, H.; AlJuraiyed, O. IoT Implementation in Slaughterhouses Supply Chain: A Case Study of the Adahi Experiment in the Kingdom of Saudi Arabia. IEEE Access 2024, 12, 26696–26709. [Google Scholar] [CrossRef]
- Ahmed, M.M.; Hassanien, E.E.; Hassanien, A.E. A smart IoT-based monitoring system in poultry farms using chicken behavioural analysis. Internet Things 2023, 25. [Google Scholar] [CrossRef]
- Ali, W.; Din, I.U.; Almogren, A.; Rodrigues, J.J.P.C. Poultry Health Monitoring With Advanced Imaging: Toward Next-Generation Agricultural Applications in Consumer Electronics. IEEE Trans. Consum. Electron. 2024, 70, 7147–7154. [Google Scholar] [CrossRef]
- Shang, Z.; Li, Z.; Wei, Q.; Hao, S. Livestock and poultry posture monitoring based on cloud platform and distributed collection system. Internet Things 2024, 25. [Google Scholar] [CrossRef]
- Wang, P.; Wu, P.; Wang, C.; Huang, X.; Wang, L.; Li, C.; Niu, Q.; Li, H. Chicken body temperature monitoring method in complex environment based on multi-source image fusion and deep learning. Comput. Electron. Agric. 2024, 228. [Google Scholar] [CrossRef]
- Zhang, L.; Yue, H.; Zhang, H.; Xu, L.; Wu, S.; Yan, H.; Gong, Y.; Qi, G. Transport stress in broilers: I. Blood metabolism, glycolytic potential, and meat quality. Poult. Sci. 2009, 88, 2033–2041. [Google Scholar] [CrossRef]
- Li, W.; Yan, C.; Descovich, K.; Phillips, C.J.C.; Chen, Y.; Huang, H.; Wu, X.; Liu, J.; Chen, S.; Zhao, X. The Effects of Preslaughter Electrical Stunning on Serum Cortisol and Meat Quality Parameters of a Slow-Growing Chinese Chicken Breed. Animals 2022, 12, 2866. [Google Scholar] [CrossRef]
- Huang, J.C.; Yang, J.; Huang, M.; Chen, K.J.; Xu, X.L.; Zhou, G.H. The effects of electrical stunning voltage on meat quality, plasma parameters, and protein solubility of broiler breast meat. Poult. Sci. 2017, 96, 764–769. [Google Scholar] [CrossRef]
- Oliveira, F.; Pereira, P.; Dantas, J.; Araujo, J.; Maciel, P. Dependability Evaluation of a Smart Poultry House: Addressing Availability Issues Through the Edge, Fog, and Cloud Computing. IEEE Trans. Ind. Informatics 2023, 20, 1304–1312. [Google Scholar] [CrossRef]
- Rejeb, A.; Rejeb, K.; Abdollahi, A.; Al-Turjman, F.; Treiblmaier, H. The Interplay between the Internet of Things and agriculture: A bibliometric analysis and research agenda. Internet Things 2022, 19. [Google Scholar] [CrossRef]
- Bochkovskiy, A.; Wang, C.; Liao, H. ; YOLOv4: Optimal Speed and Accuracy of Object Detection. arXiv arXiv:2004.10934, 2020. [CrossRef]
- Liu, H.-W.; Chen, C.-H.; Tsai, Y.-C.; Hsieh, K.-W.; Lin, H.-T. Identifying Images of Dead Chickens with a Chicken Removal System Integrated with a Deep Learning Algorithm. Sensors 2021, 21, 3579. [Google Scholar] [CrossRef] [PubMed]
- Bist, R.B.; Subedi, S.; Yang, X.; Chai, L. Automatic Detection of Cage-Free Dead Hens with Deep Learning Methods. Agriengineering 2023, 5, 1020–1038. [Google Scholar] [CrossRef]
- Saenong, A.; Zainuddin, Z.; Niswar, M. Identification of Poultry Reproductive Behavior Using Faster R-CNN with MobileNet V3 Architecture in Traditional Cage Environment. 2023 International Seminar on Intelligent Technology and Its Applications (ISITIA). pp. 456–461.
- Mishra, S.; Sharma, S.K. Advanced contribution of IoT in agricultural production for the development of smart livestock environments. Internet Things 2023, 22, 100724. [Google Scholar] [CrossRef]
- Debauche, O.; Trani, J.-P.; Mahmoudi, S.; Manneback, P.; Bindelle, J.; Mahmoudi, S.A.; Guttadauria, A.; Lebeau, F. Data management and internet of things : A methodological review in smart farming. Internet Things 2021, 14. [Google Scholar] [CrossRef]
Figure 1.
Schematic of the smart humane poultry slaughter system.
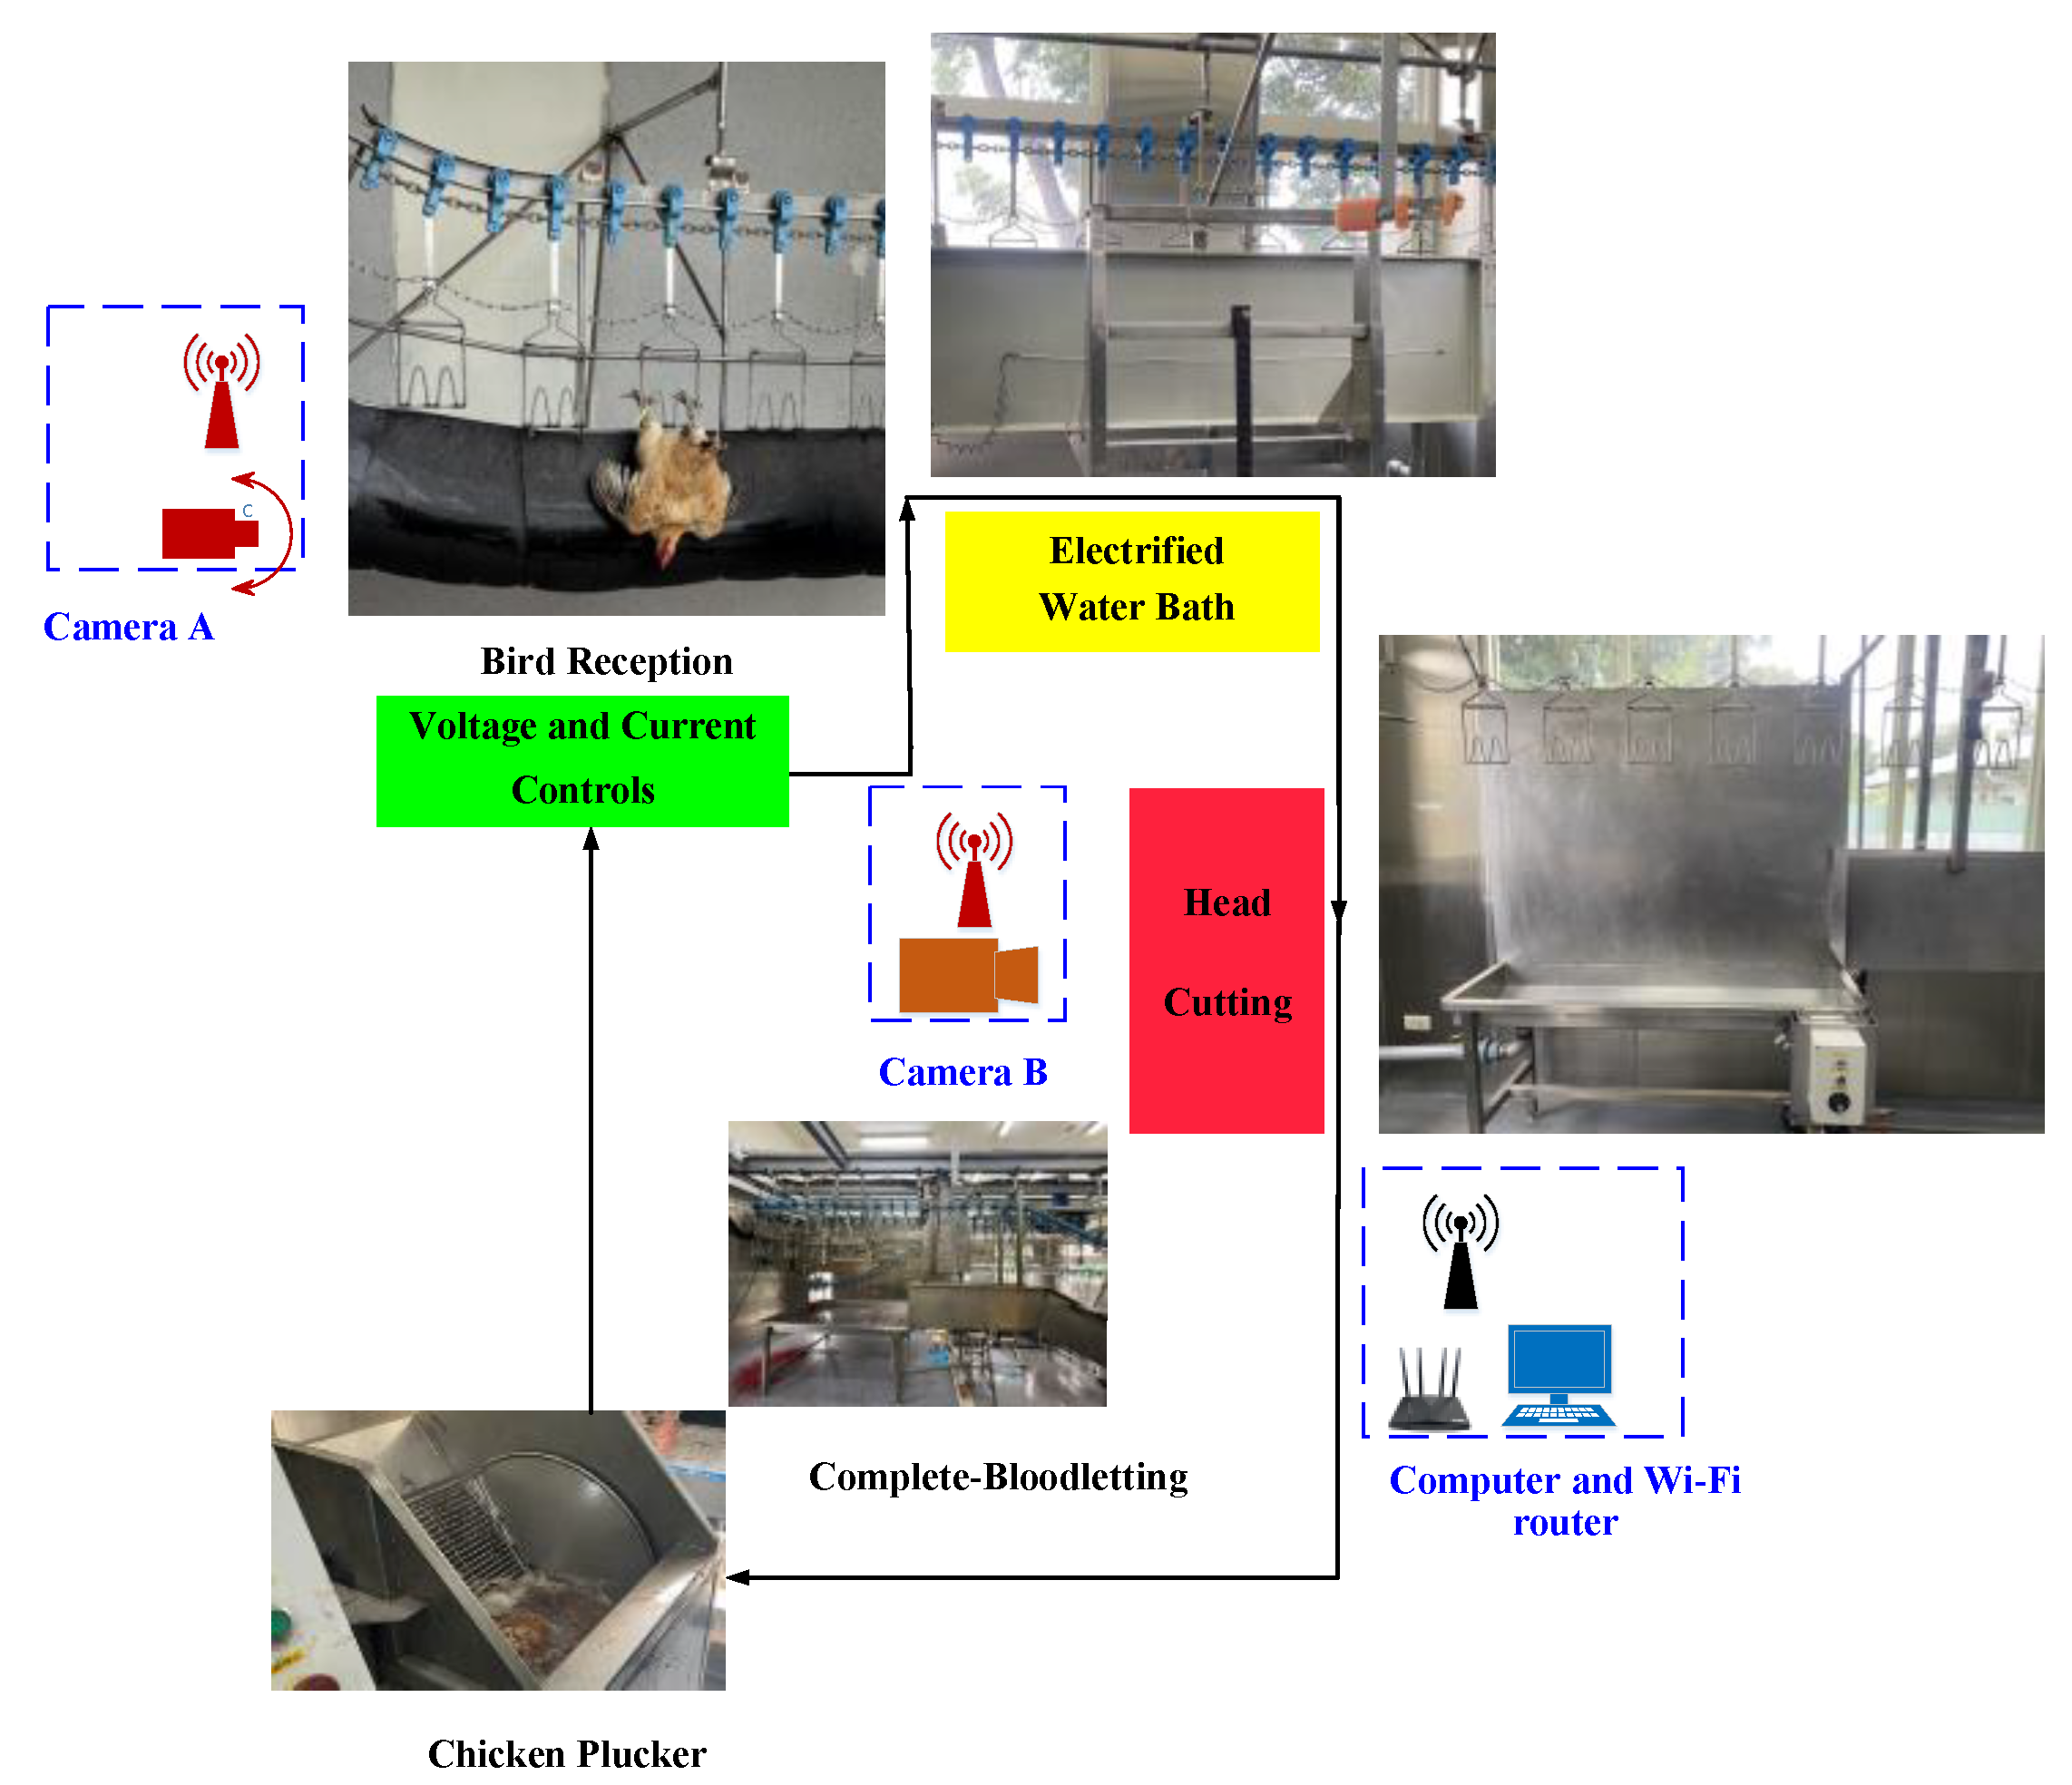
Figure 2.
(a) block diagram of the virtual poultry slaughtering process; (b) EEG-based stunning detection logic in Simulink; (c) PID-based voltage control system structure.
Figure 2.
(a) block diagram of the virtual poultry slaughtering process; (b) EEG-based stunning detection logic in Simulink; (c) PID-based voltage control system structure.
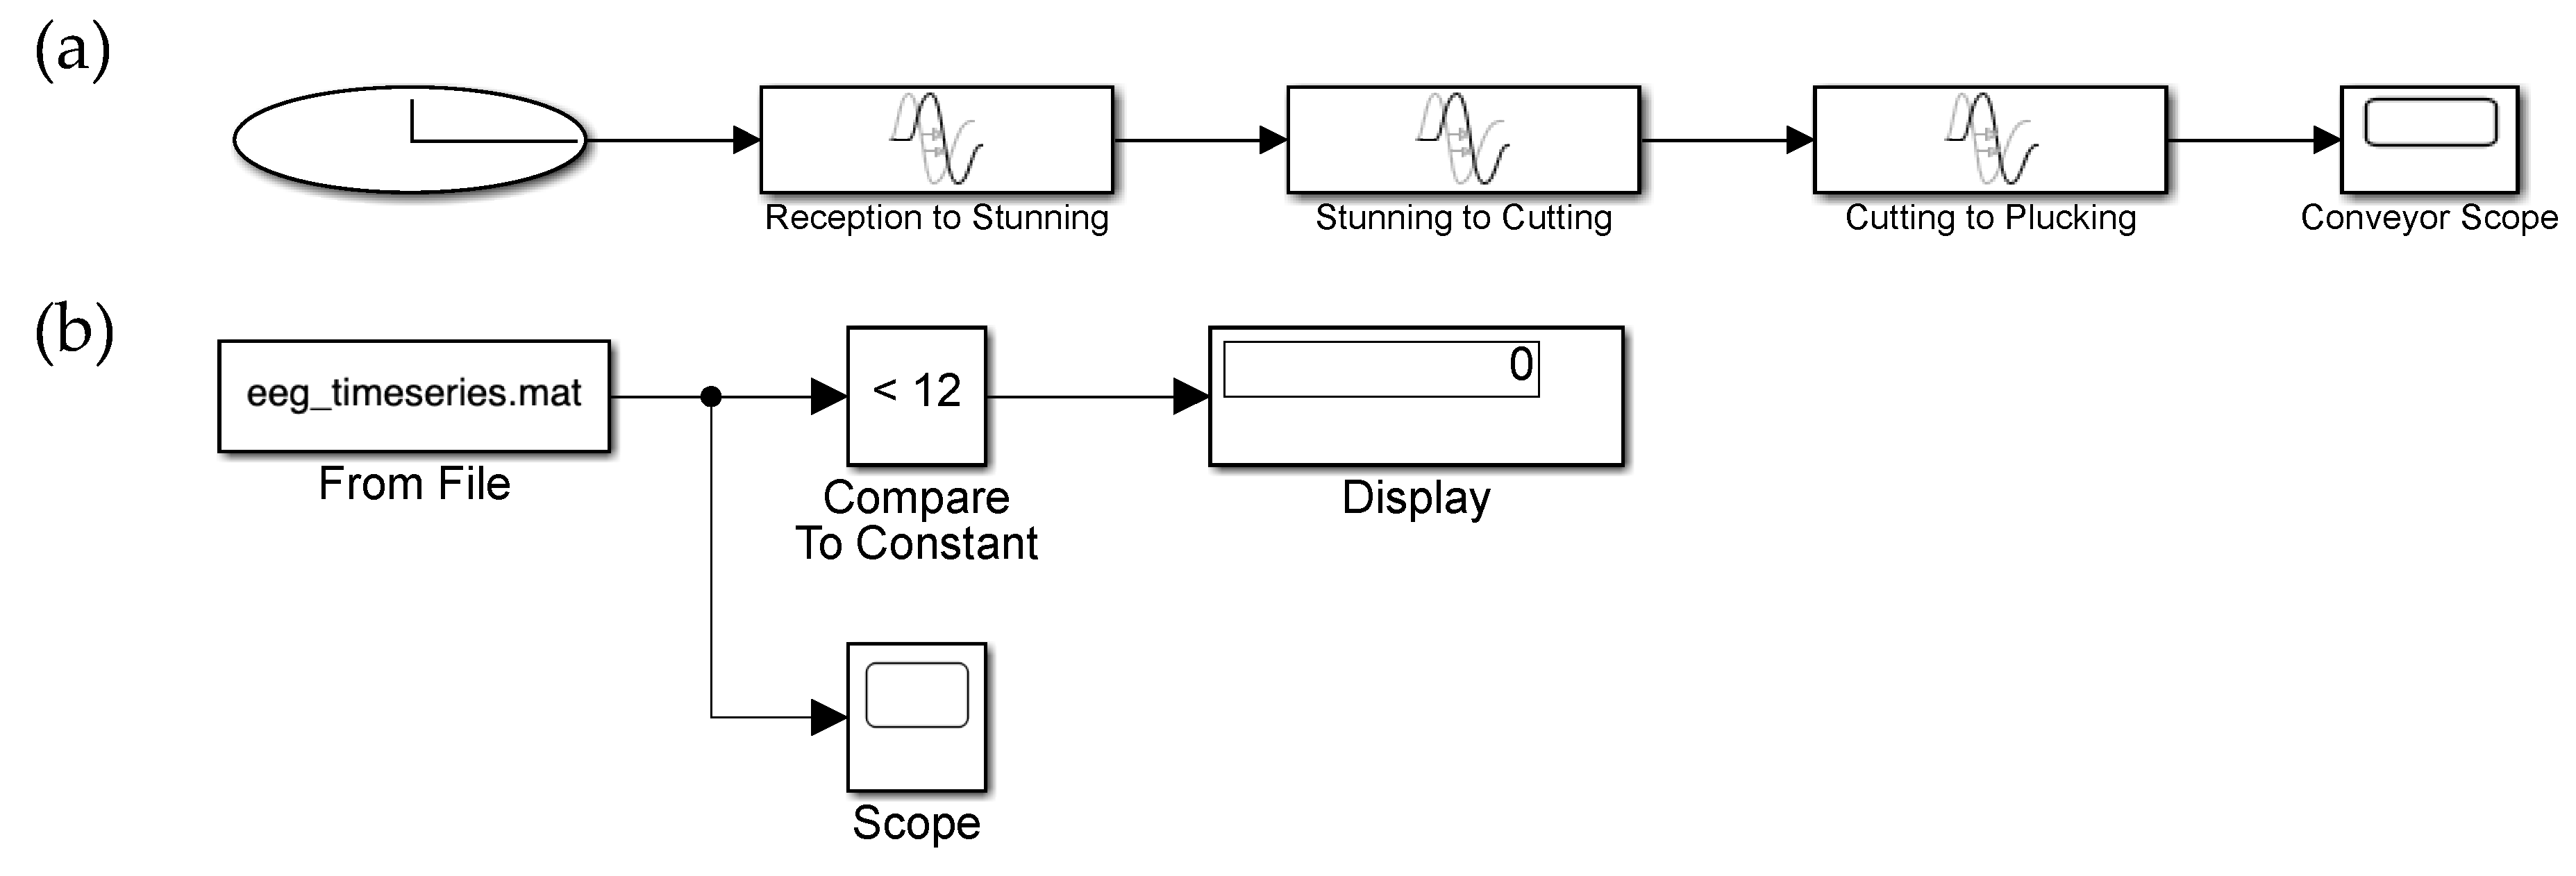
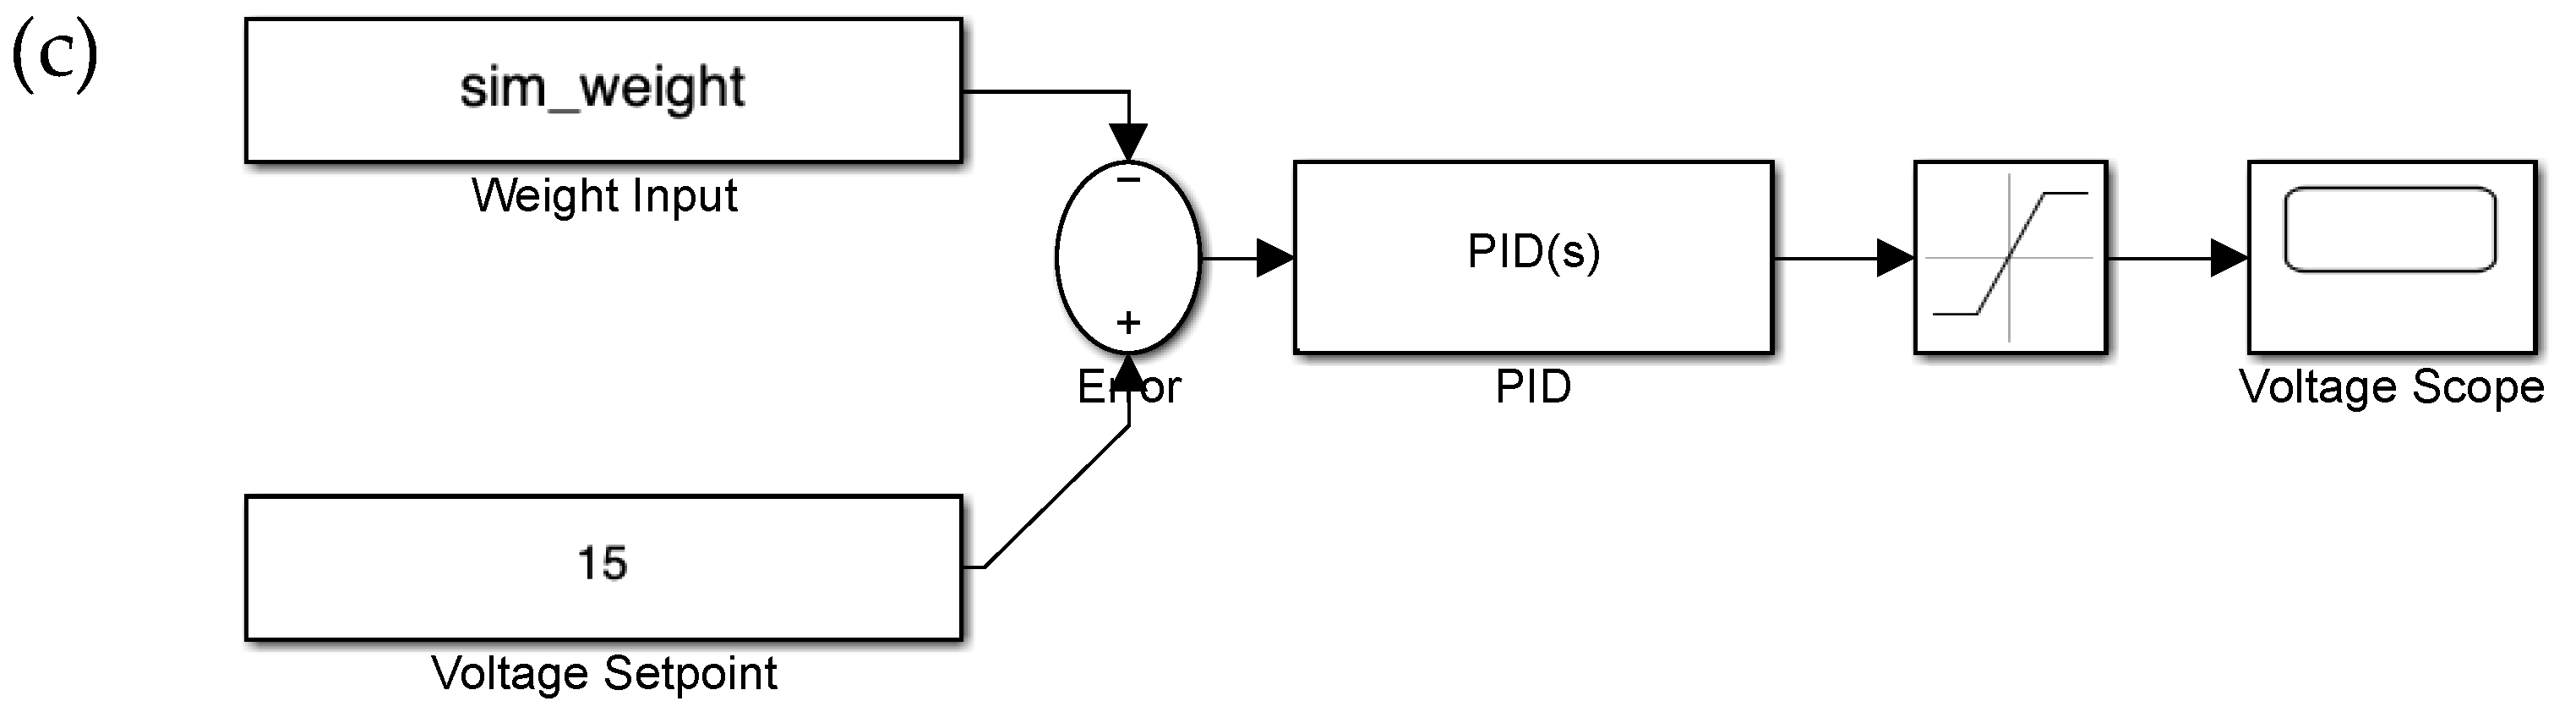
Figure 3.
Red-feathered Taiwan chicken post-stunning (a) deemed unconscious by sight and brainwaves (b) deemed conscious by sight but unconscious by brainwaves (c) deemed conscious by sight and brainwaves (d) deemed unconscious by sight but conscious by brainwaves.
Figure 3.
Red-feathered Taiwan chicken post-stunning (a) deemed unconscious by sight and brainwaves (b) deemed conscious by sight but unconscious by brainwaves (c) deemed conscious by sight and brainwaves (d) deemed unconscious by sight but conscious by brainwaves.
Figure 4.
Changes in training loss and validation loss.
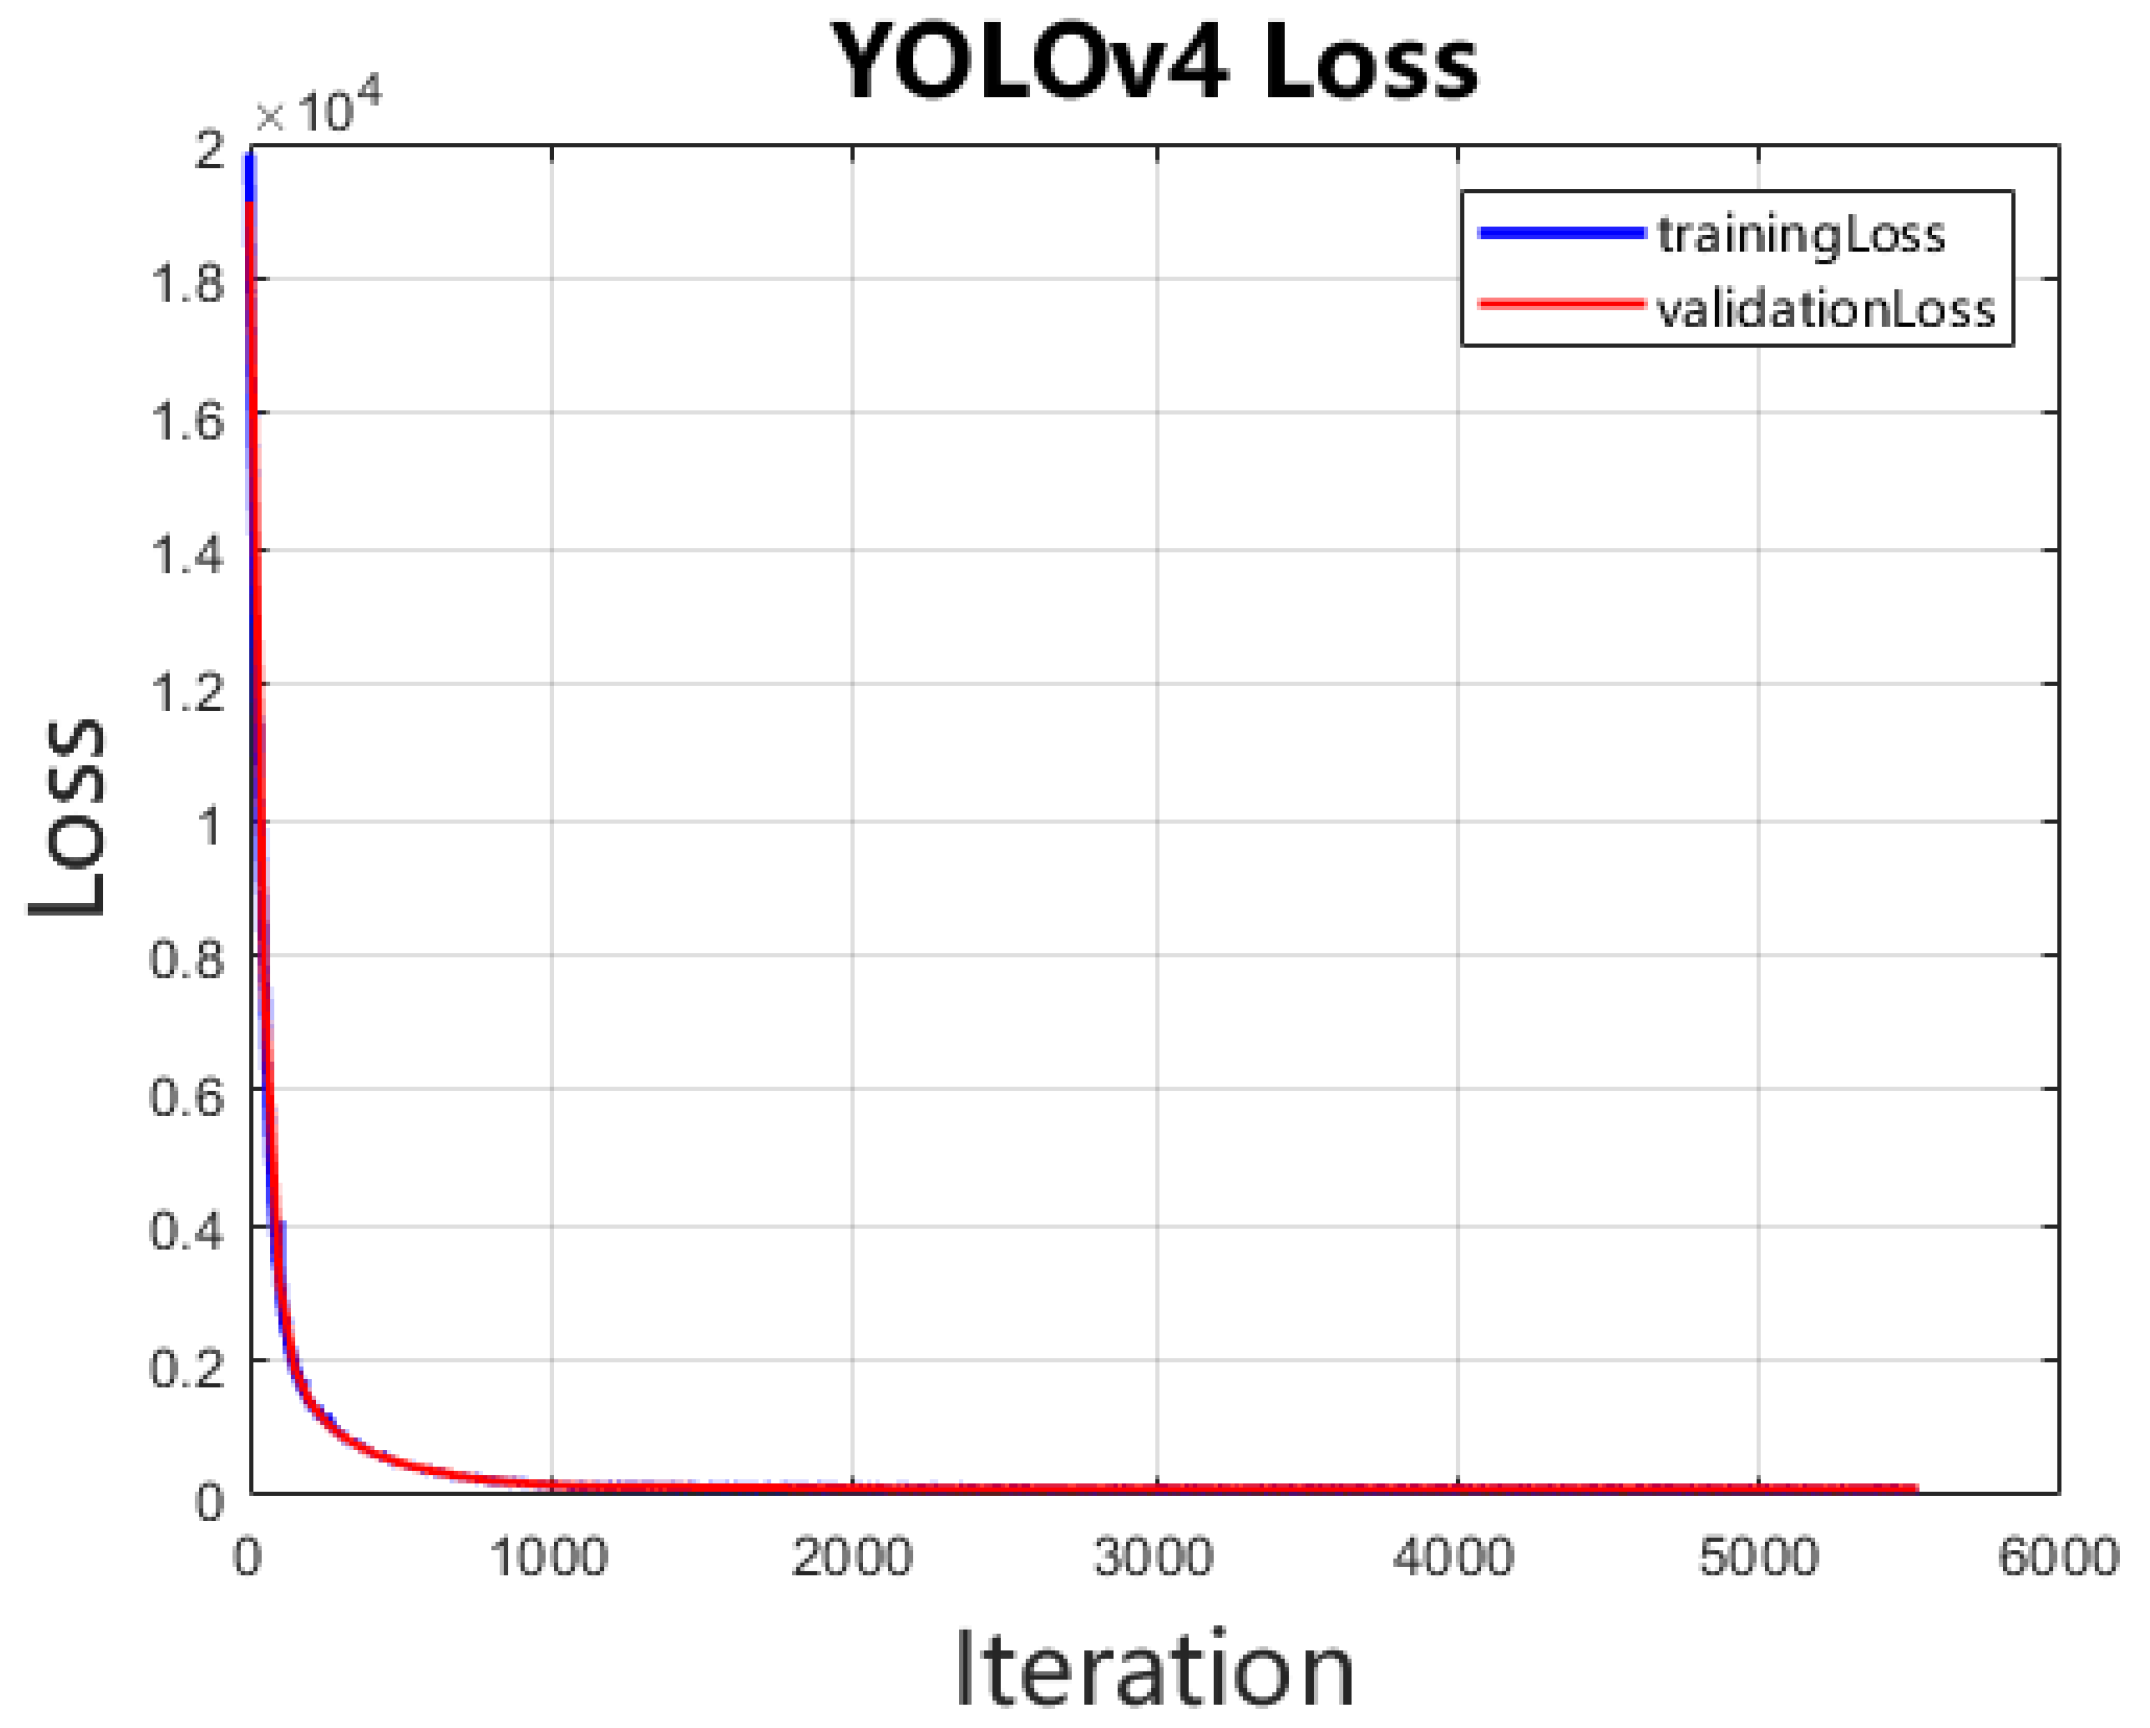
Figure 5.
Images captured before and after enhancement techniques (a) Original image (b) Enhanced image after HSV dithering (c) Enhanced image after horizontal flipping (d) Enhanced image after larger scaling for 10 %.
Figure 5.
Images captured before and after enhancement techniques (a) Original image (b) Enhanced image after HSV dithering (c) Enhanced image after horizontal flipping (d) Enhanced image after larger scaling for 10 %.
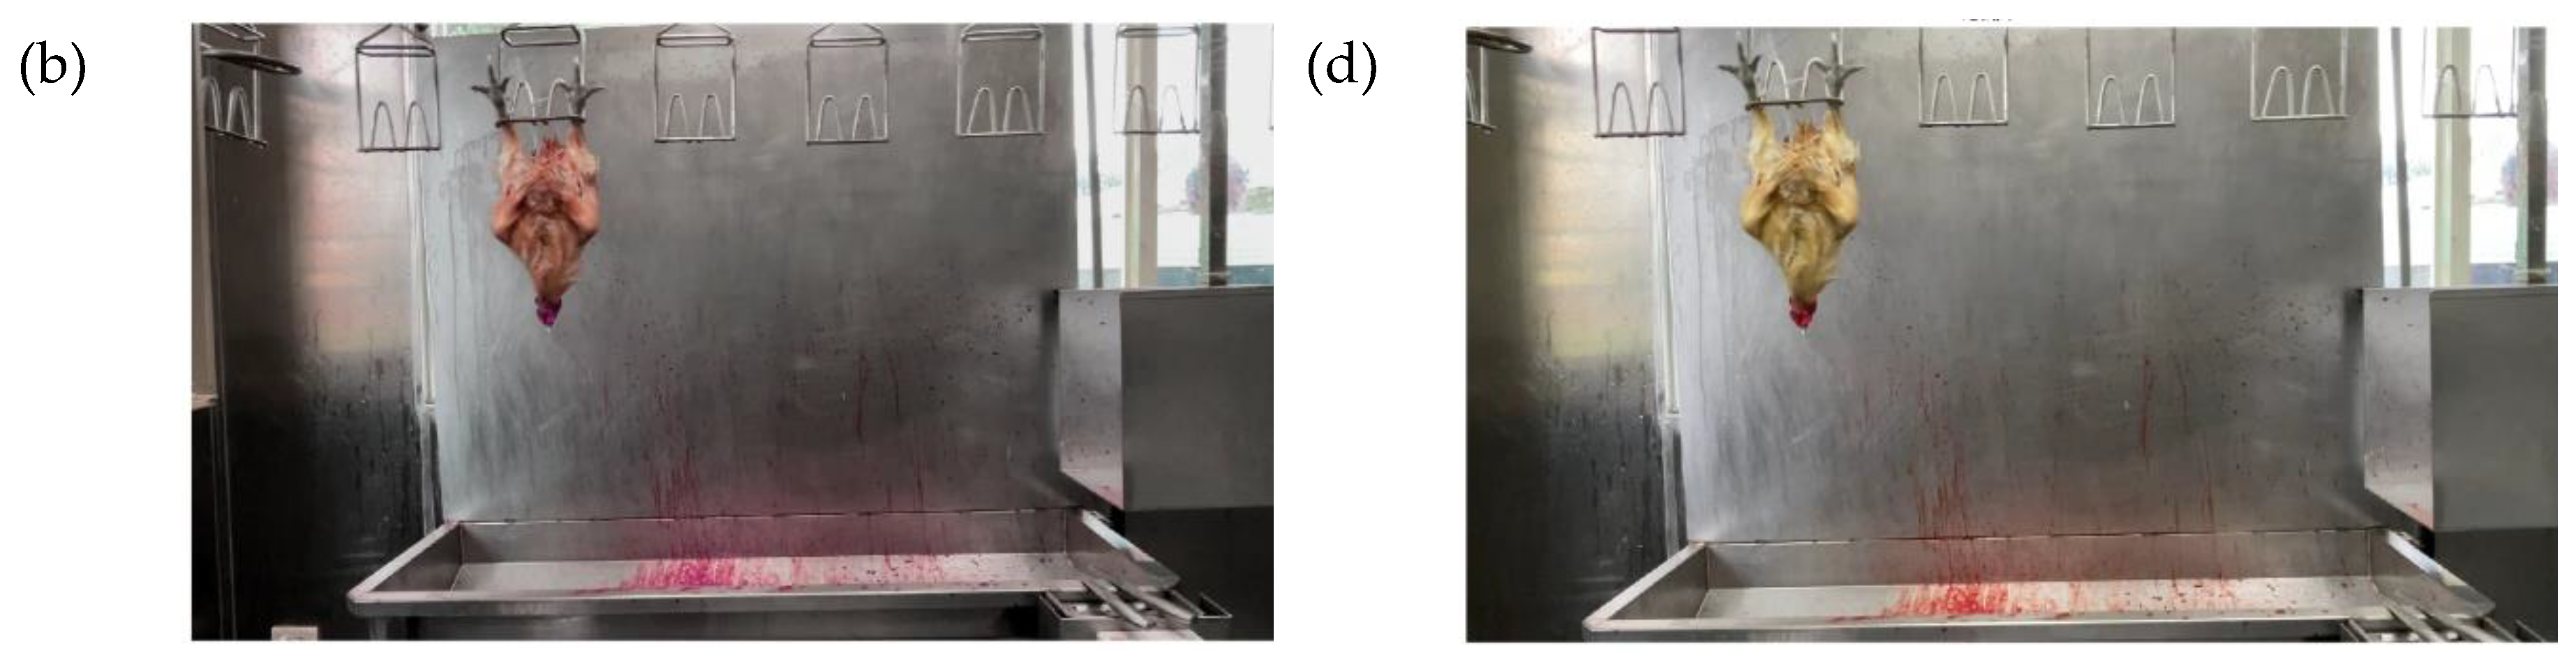
Figure 6.
The overlap area (A) and the union area (B) between the predicted boundary box and the actual boundary box.
Figure 6.
The overlap area (A) and the union area (B) between the predicted boundary box and the actual boundary box.
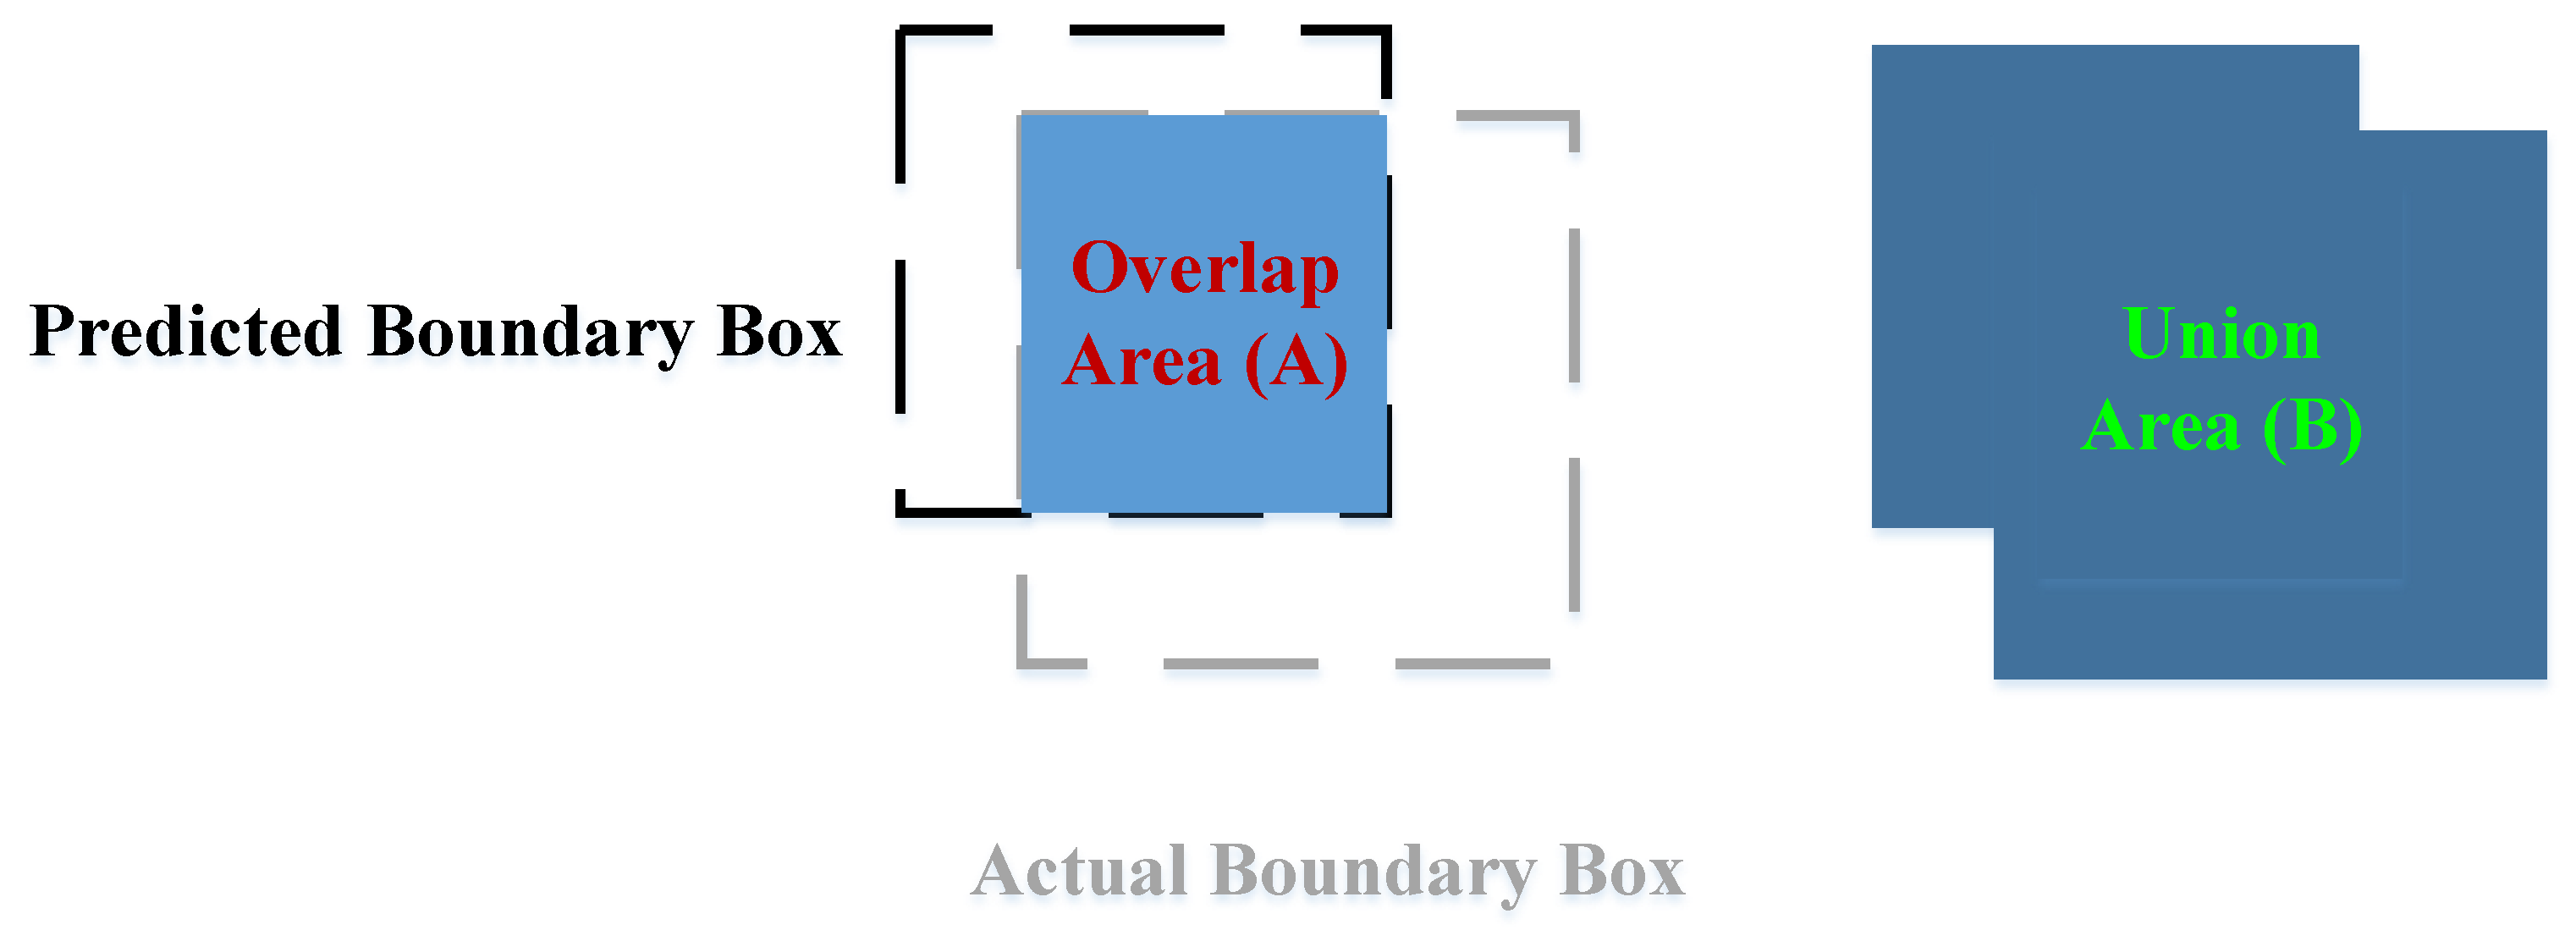
Figure 7.
YOLO-v4 model without image amplification.
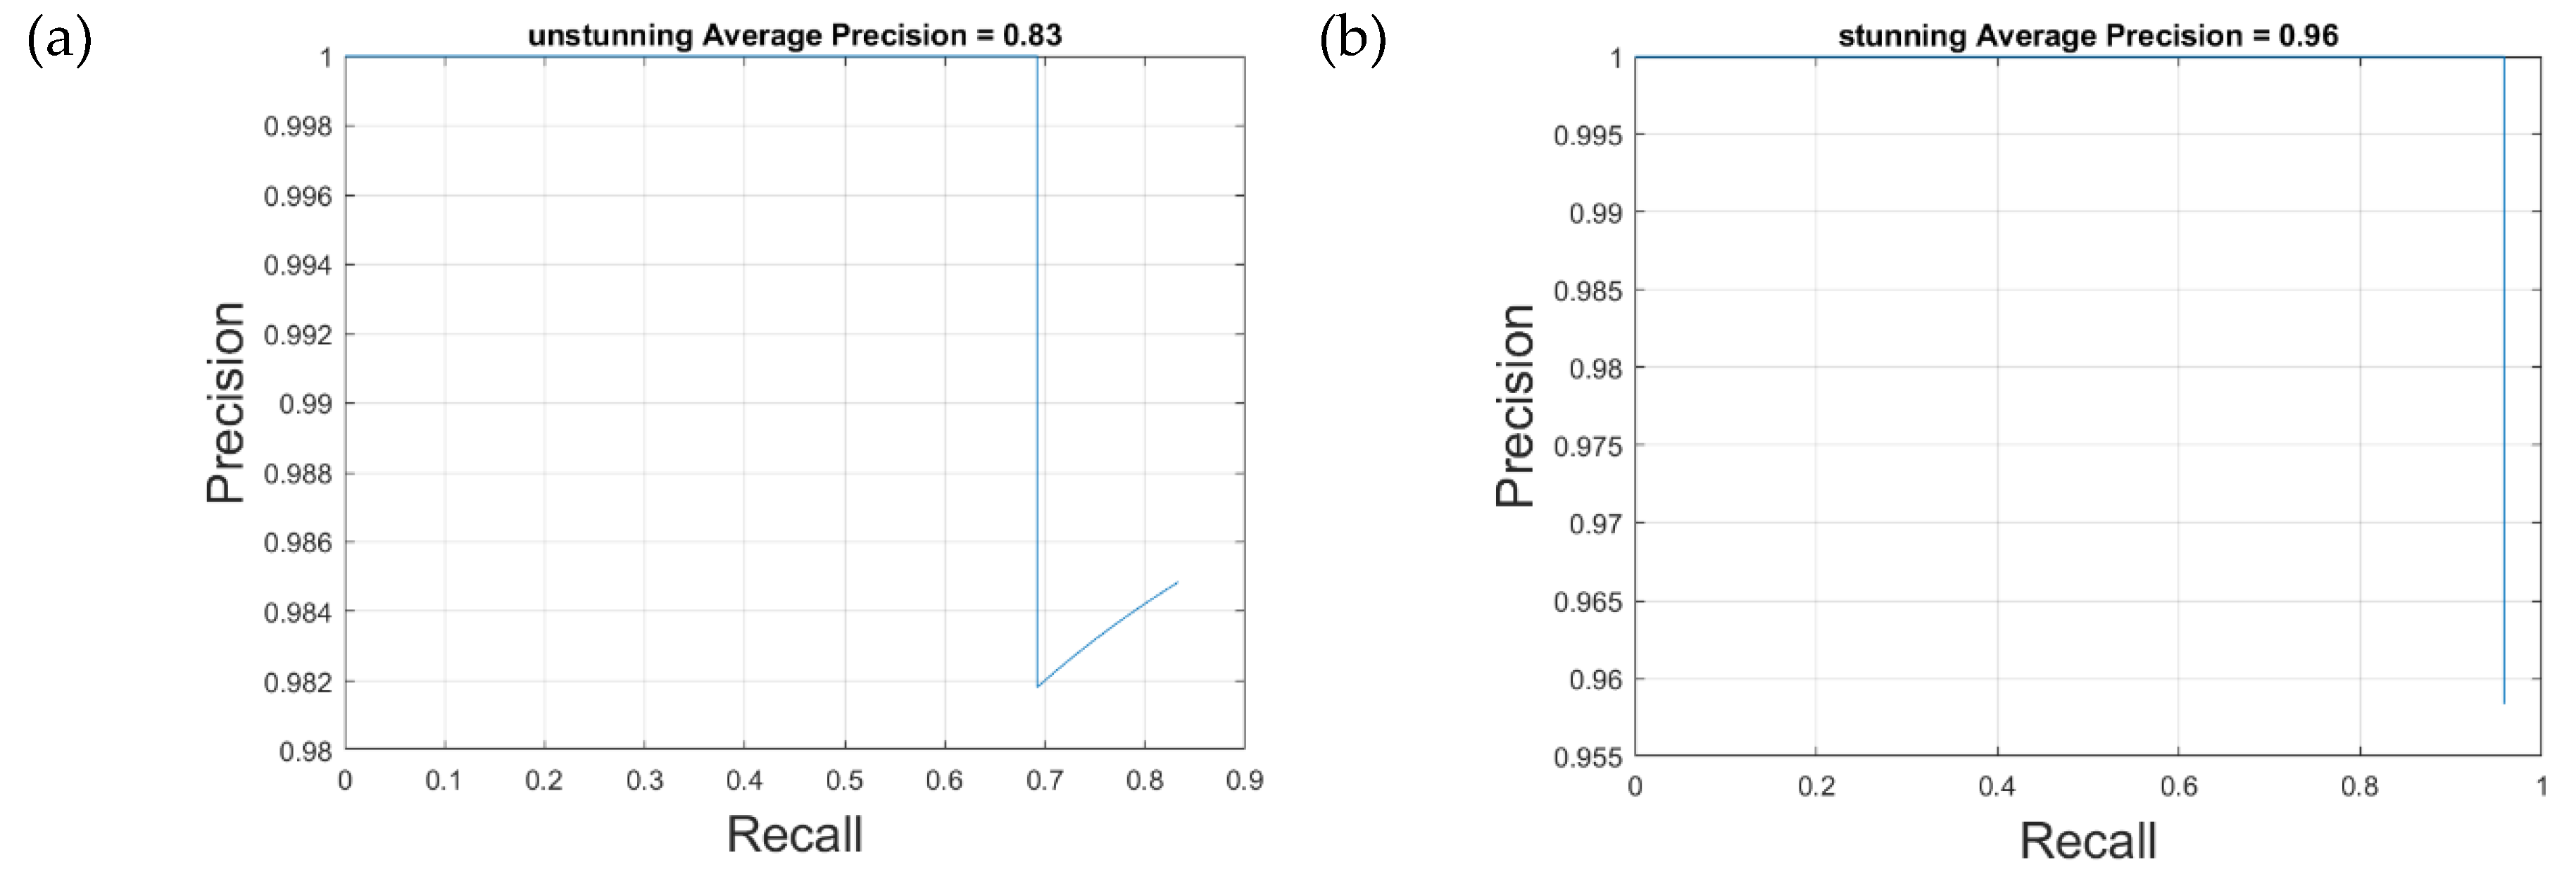
Figure 8.
YOLO-v4 model with image amplification.
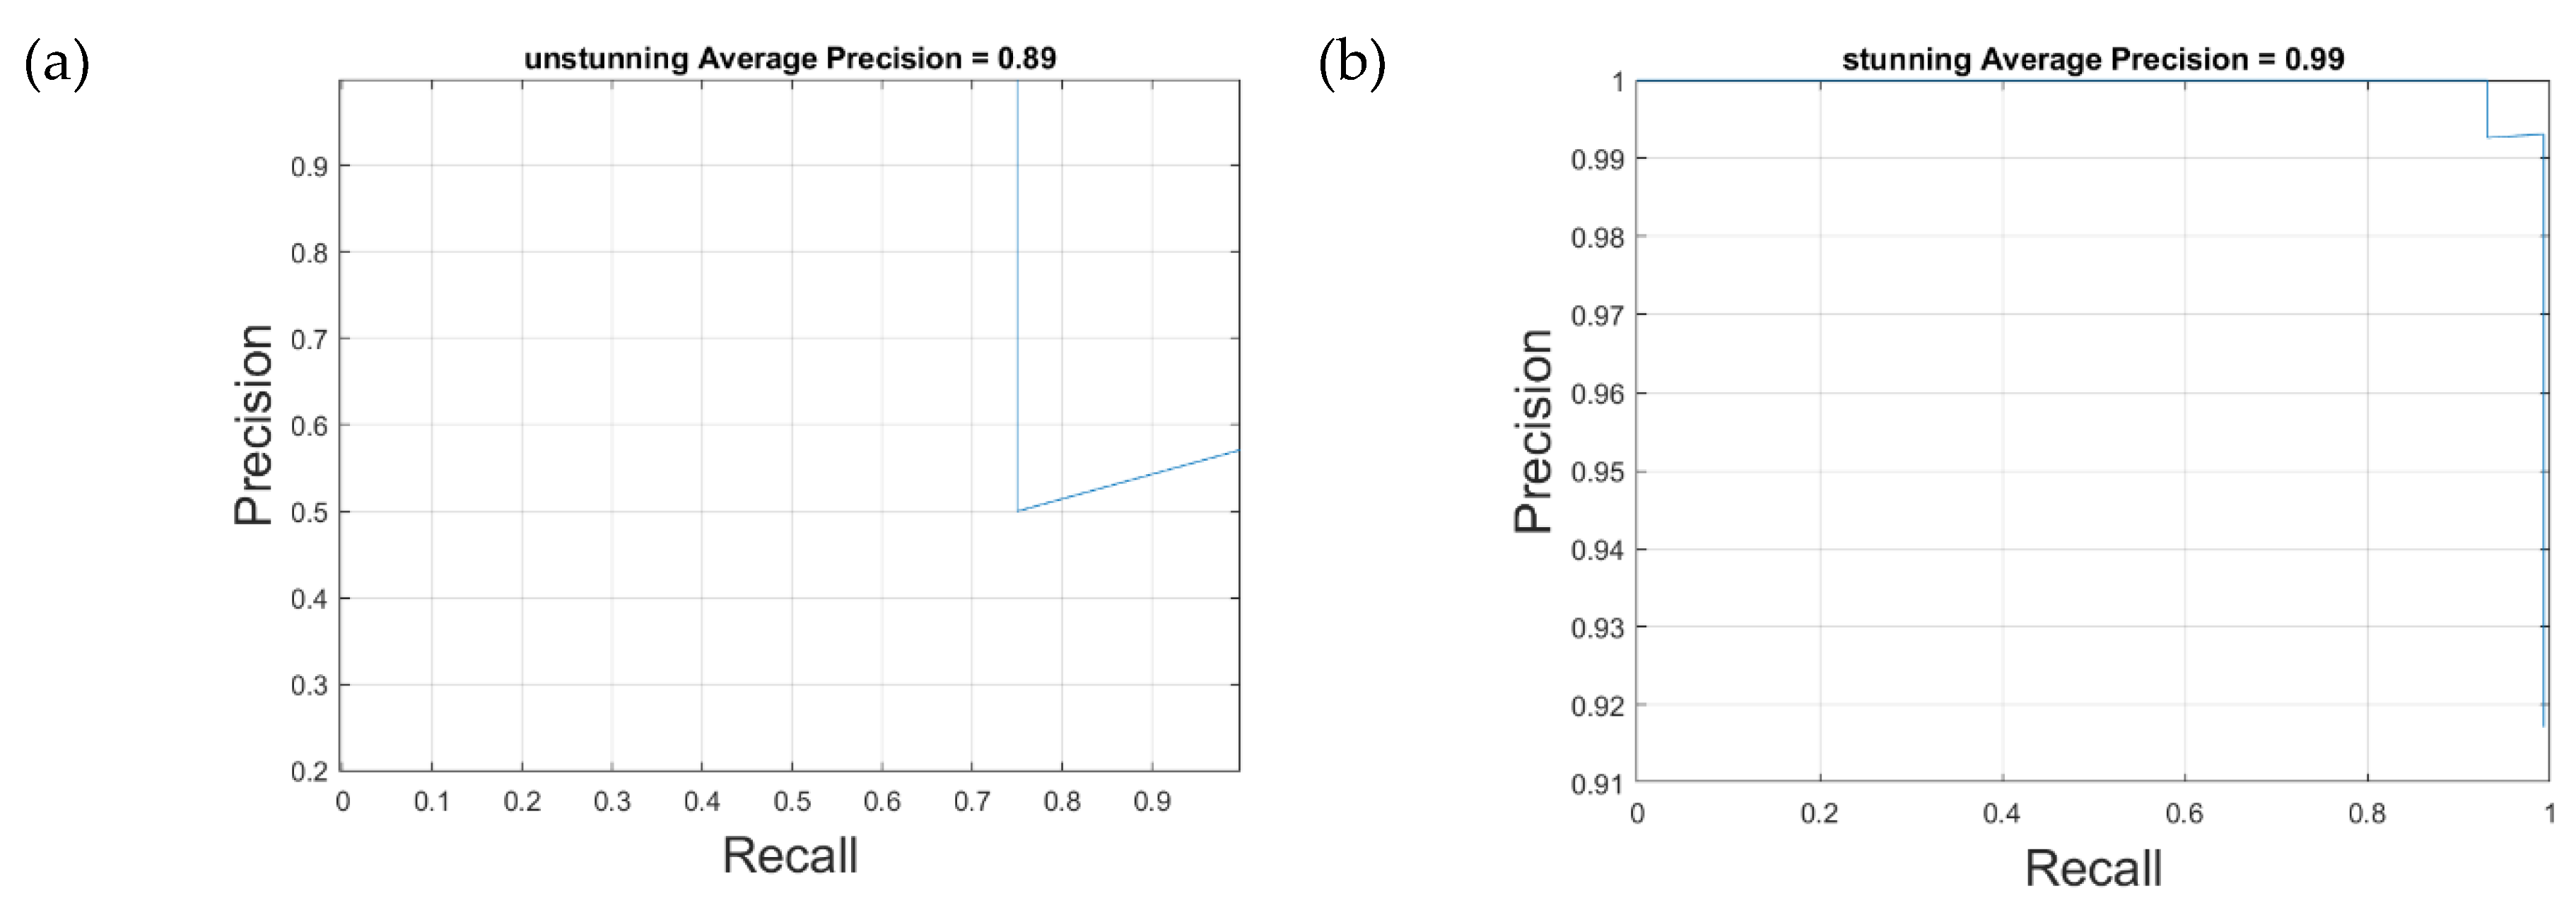
Figure 9.
(a) process stage progression output from virtual conveyor simulation; (b) EEG signal time series and threshold evaluation result; (c) stunning voltage output from PID controller (Voltage vs. Time).
Figure 9.
(a) process stage progression output from virtual conveyor simulation; (b) EEG signal time series and threshold evaluation result; (c) stunning voltage output from PID controller (Voltage vs. Time).
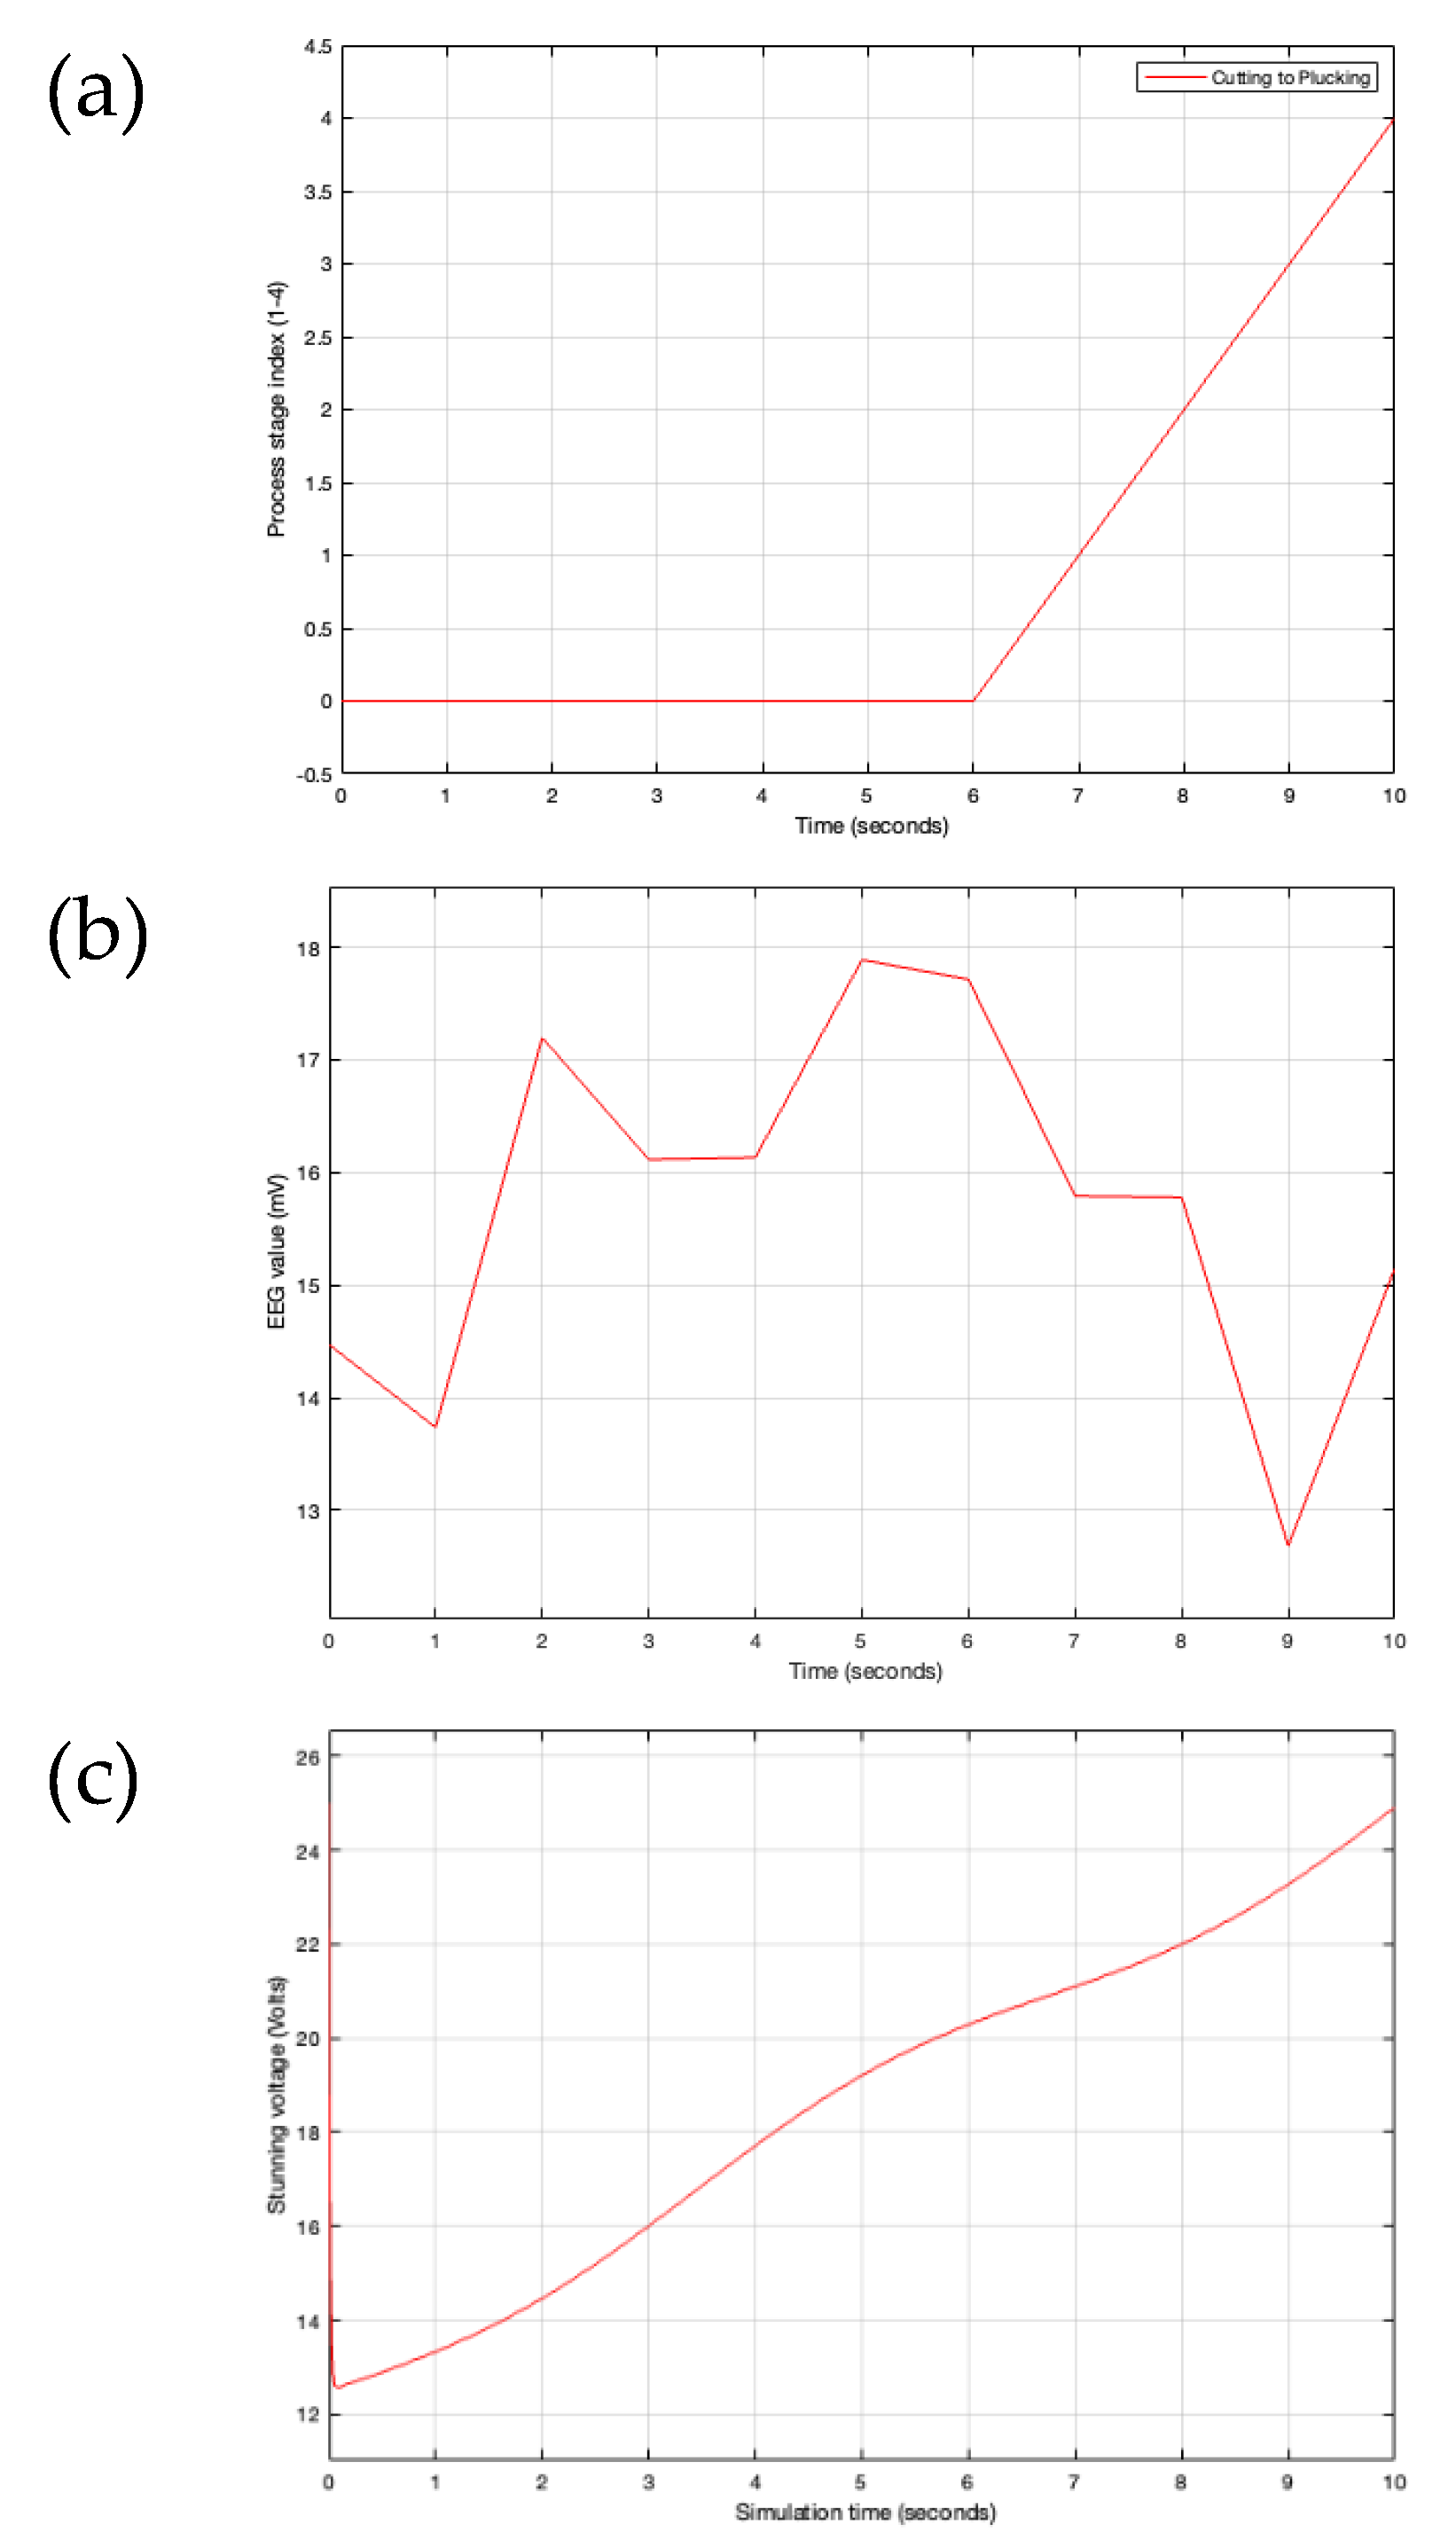
Figure 10.
Dynamic tracking object recognition for real environment.
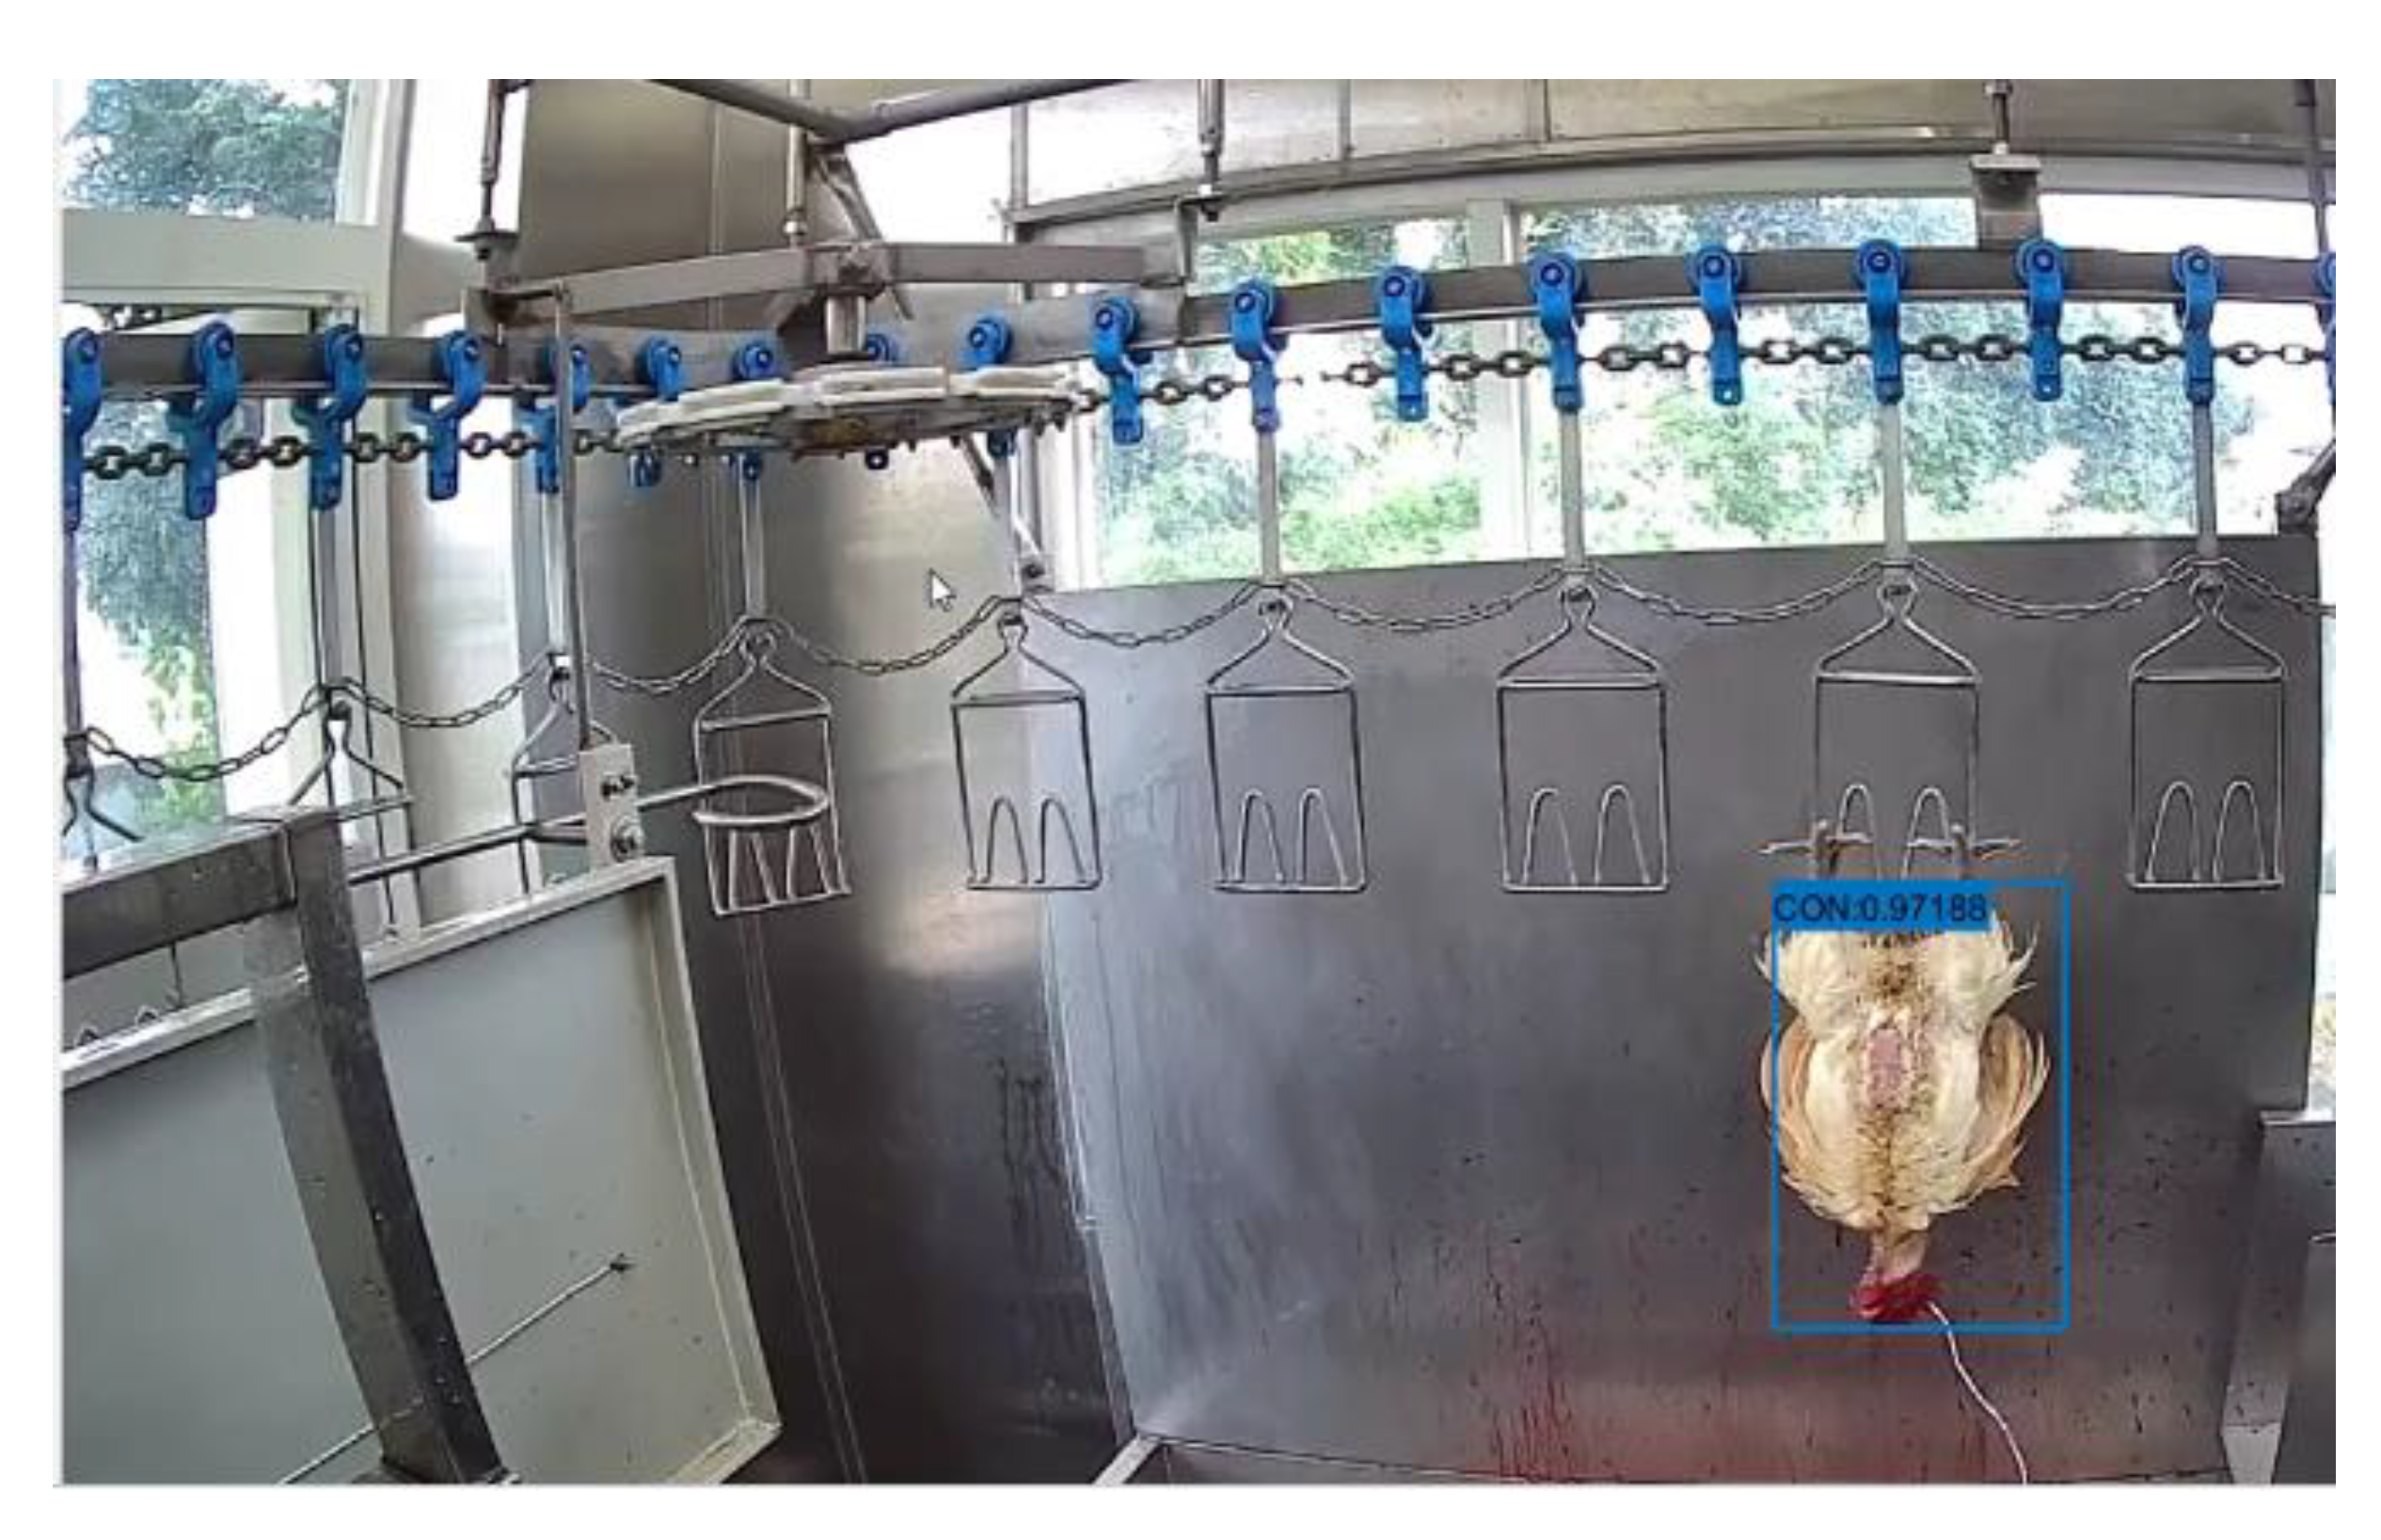

Table 1.
System equipment specifications.
| Equipment item | Brand | Model | Specification |
|---|---|---|---|
| CPU | Intel | i7-14700K | Cores: 20 Threads: 28 |
| GPU | NVDIA | RTX 4080 Super | Memory: 16 GB, GDDR6X Memory speed: 23 Gbps Memory bandwidth: 736 GB/s Base clock rate: 2295 MHz |
| Random Access Memory (RAM) | Kingston | DDR5-5600 | 32 GB |
| Hard Drive | Western Digital | SN770 SSD | 1 TB |
| Operating System | Microsoft | Windows 11 | Business Editions |
| Wi-Fi Router | D-Link | DWR-953 | Integrated SIM card slot 4G LTE Fail-safe Internet with fixed line and mobile Internet support |
| Camera A | Xiaomi | AW200 | Resolution: 1920 × 1080 Camera angles: 120° Memory: 256 G |
| Camera B | Xiaomi | C300 | Resolution: 2304 × 1296 Lens movement: 360° horizontally, 108° vertically Memory: 256 G |
Table 2.
Brainwaves data sheets of electric shocks for red-feathered Taiwan chickens.
| scenario | Total brainwave energy pre-stunning | Post-stunning criterion of unconsciousness | P1 | P2 | P3 |
|---|---|---|---|---|---|
| Brainwave energy | Brainwave energy | Brainwave energy | |||
| 1 | 4.81 | 0.48 | 0.03 | 0.04 | 0.07 |
| 2 | 3.22 | 0.32 | 0.04 | 0.15 | 0.06 |
| 3 | 6.23 | 0.62 | 3.05 | 2.11 | 3.05 |
| 4 | 2.77 | 0.28 | 5.58 | 6.95 | 7.15 |
Table 3.
The visual judgements for red-feathered Taiwan chickens.
| Raise Head | Open Eyes | Move Wing | Weight | Voltage |
| No | No | No | 2.33kg | 160V |
| No | Yes | No | 3.01kg | 100V |
| Yes | Yes | No | 2.84kg | 80V |
| No | No | No | 2.82kg | 100V |
Table 4.
Training parameters of the YOLO-v4 stunned red-feathered Taiwan chicken identification model.
Table 4.
Training parameters of the YOLO-v4 stunned red-feathered Taiwan chicken identification model.
| Parameter | Settings |
|---|---|
| Input Size | [] |
| Gradient Decay Factor | 0.9 |
| Squared Gradient Decay Factor | 0.999 |
| Initial Learn Rate | 0.0001 |
| Learn Rate Schedule | Piecewise |
| Learn Rate Drop Period | 90 |
| Learn Rate Drop Factor | 0.1 |
| Mini Batch Size | 3 |
| L2 Regularization | 0.0005 |
| Max Epochs | 120 |
| Shuffle | every-epoch |
| Verbose Frequency | 10 |
| Plots | training-progress |
| Output Network | best-validation |
Table 5.
The determination criteria between actual targets and predicted targets of the image recognition model for the red-feathered Taiwan chicken.
Table 5.
The determination criteria between actual targets and predicted targets of the image recognition model for the red-feathered Taiwan chicken.
| Determination Result | Actual Target | Predicted Target |
|---|---|---|
| TP_1 | Stunned chicken | Stunned chicken |
| TP_2 | Unstunned chicken | Unstunned chicken |
| FP_1 | Unstunned chicken | Stunned chicken |
| FP_2 | Stunned chicken | Unstunned chicken |
| FP_3 | Background | Stunned chicken |
| FP_4 | Background | Unstunned chicken |
| FN_1 | Stunned chicken | Background |
| FN_2 | Unstunned chicken | Background |
| FN_3 | Background | Stunned chicken |
| FN_4 | Background | Unstunned chicken |
| TN | Background | Background |
Table 6.
The confusion matrix of the YOLO-v4 stunned red-feathered Taiwan chicken identification model.
Table 6.
The confusion matrix of the YOLO-v4 stunned red-feathered Taiwan chicken identification model.
| YOLO-v4 IOU=0.75 |
Actual Stunned Chicken | Actual Unstunned Chicken | Actual Background |
|---|---|---|---|
| Predicted Stunned Chicken | TP_1=104 | FP_1=1 | FN_3=0 |
| Predicted Unstunned Chicken | FP_2=1 | TP_2=99 | FN_4=0 |
| Predicted Background | FN_1=0 | FN_2=0 | TN=0 |
Disclaimer/Publisher’s Note: The statements, opinions and data contained in all publications are solely those of the individual author(s) and contributor(s) and not of MDPI and/or the editor(s). MDPI and/or the editor(s) disclaim responsibility for any injury to people or property resulting from any ideas, methods, instructions or products referred to in the content. |
© 2025 by the authors. Licensee MDPI, Basel, Switzerland. This article is an open access article distributed under the terms and conditions of the Creative Commons Attribution (CC BY) license (http://creativecommons.org/licenses/by/4.0/).
Copyright: This open access article is published under a Creative Commons CC BY 4.0 license, which permit the free download, distribution, and reuse, provided that the author and preprint are cited in any reuse.


