
Submitted:
25 June 2025
Posted:
26 June 2025
You are already at the latest version
Abstract
The ability to accurately predict future time series behavior in multiple steps, known as multi-horizon forecasting, is a vital aspect in various industries, including retail sales, energy consumption, server load, healthcare, weather, and others. We have proposed, in this paper, the use of statistical forecasters as covariates in a Deep Neural Network (DNN) model and evaluated its impact on forecast metrics. Our analysis covered four diverse datasets: M5, Stallion, Stock Market, and Synthetic. The results demonstrated that the inclusion of statistical predictors in the DNN model led to varying degrees of improvement in forecast performance, depending on the dataset and the evaluation metric chosen. In general, our findings suggest that the incorporation of statistical prediction as a covariate can be a valuable approach to improving multi-horizon prediction, especially in scenarios with data scarcity and intermittence.
Keywords:
Forecast
; Time Series Prediction
; Retail
; LSTM
; Hybrid Forecasting
1. Introduction
Time series forecasting assumes a critical role across diverse domains such as finance, retail, energy [1], and healthcare, wherein precise anticipations of future values serve as imperative inputs for informed decision-making [2], strategic planning, and optimization endeavors [3]. However, the task of time series forecasting is not without its challenges. Many real-world time series exhibit intermittent [4], erratic, and short-term behavior, making them particularly difficult to predict [5,6]. Traditional statistical methods have been widely used, but they may struggle to capture the complex patterns and irregularities present in such time series [7].
In recent years, machine learning techniques have been popularized as powerful tools for time series forecasting [8,9]. Some deep learning models, such as recurrent neural networks (RNNs) and convolutional neural networks (CNNs), have shown promise in capturing intricate temporal dependencies and patterns in time series data [10,11,12]. Furthermore, these models can automatically extract relevant features from the input, eliminating the need for manual feature engineering, and have the capacity to handle large-scale and high-dimensional data [13,14].
Despite the success of deep learning in time series forecasting, challenges persist, particularly when dealing with intermittent and erratic time series. These challenges include handling missing data, modeling seasonality and trend, and accounting for the uncertainty inherent in forecasting [15,16,17]. Additionally, selecting the appropriate architecture and hyperparameters for a deep learning model can be a complex and time-consuming process [18].
This paper introduces a novel approach to address the challenges of forecasting intermittent, erratic, and short time series. Our proposed method combines deep neural networks (DNNs) with statistical forecasters as covariates. The hypothesis we aim to test is as follows:
[]: Incorporating statistical forecasters as covariates in a DNN model will improve forecast metrics.
[]: Incorporating statistical forecasters as covariates in a DNN model does not improve its forecasting metrics.
To validate this hypothesis, we will conduct extensive experiments using real-world time series data and compare the performance of our proposed method against traditional statistical methods, pure DNN models, and state-of-the-art forecasting techniques. By leveraging the strengths of both statistical and deep learning approaches, we aim to provide a more robust and accurate solution for forecasting challenging time series data.
2. Related Work
In this section, we provide a comprehensive overview of previous work on time series forecasting and how it has influenced the development of this study.
2.1. Statistical Models
Researchers and practitioners have used statistical prediction methods for centuries to predict the future of a set of observations [19]. These methods comprise a collection of equations and algorithms that generate predictions for the subsequent time steps in the sequence when applied to a set of observation points. Because well-formed equations or instructions can easily describe statistical methods, they are widely used and well-accepted in business environments. Additionally, this deterministic form facilitates the interpretability of the model. In other words, it is easier to understand why the model has given the said prediction.
However, statistical models often can only be used on one time series and require fine-tuning their parameters. As stated in Section 1, this is a problem in many modern uses. To mitigate this problem, authors have developed tools for forecasting several time series automatically, such as the R packages AutoARIMA [19] and AutoETS [20], and the Python package statsforecast.
These tools facilitate and enable statistical methods to remain relevant forecasting tools to this day. However, statistical models are frequently outperformed by DNN models when the dataset is noisy, non-linear, and non-stationary [9]. However, to make a prediction, the statistical model needs to obtain some information about the time series. This is one of the motivations for the proposed model in this paper; we expect to harness the different ways each statistical model interprets the original time series and use it to enhance the capabilities of DNN-based models, improving their forecasting metrics.
2.2. Deep Neural Network Models
DNN models have gained significant popularity in time series forecasting due to their ability to capture complex patterns and relationships within data [9]. Unlike statistical models, DNN models can effectively handle noisy, nonlinear, and nonstationary datasets [21]. Various types of DNN architecture have been applied to time-series forecasting, including recurrent neural networks (RNNs), long-short-term memory (LSTM) networks [22], and Convolutional Neural Networks (CNNs), and models based on transformers [23].
RNNs, in particular, are well-suited for sequential data and have been widely used in forecasting tasks [24]. As observed by [25], LSTMs tend to perform better compared to other DNN architectures, mainly because they can learn time-dependent features without suffering from the vanishing gradient problem, unlike vanilla RNNs.
One of the main advantages of DNN models is their ability to learn and train on different time series [26]. This makes them suitable for scenarios where a single model is needed, which can predict a wide variety of time series [9]. Despite their advantages, DNN models can be computationally intensive and require a large dataset to achieve optimal performance [27,28,29]. Another problem is overfitting, where the model memorizes the training data and performs poorly on unseen data [30].
As presented in [31] DNN models can be applied for medical applications, especially considering time series [32]. It also is applied to violence recognition [33], power systems [34,35,36], industry applications [37,38], and so on. The use of hybrid methods for time series forecasting is increasing [39] given its potential to denoising high frequencies [40] and a combination of more advantages of several techniques [41], where ensemble learning methods are outstanding [42].
2.3. Dropout
To address the problem of overfitting, most DNN models apply a regularization technique called Dropout, which randomly sets the input elements to zero with a specified probability () [43]. The remaining elements are multiplied by to maintain the sum of all elements in the time series. The primary purpose of the dropout layer is to prevent overfitting and improve the generalizability of the model, in other words, to improve the accuracy of the model when forecasting unseen data [44]. This is possible because setting previous random inputs to zero ensures the model cannot over-rely on specific input data.
As discussed in [45], most DNN models use dropout layers only during the training phase and leave them inactive during inference. This is done to reduce the probability of overfitting and improve generalization but at the same time to get consistent inferences. However, another way of using the dropout normalization is to place it after each layer of the DNN, and not turn it off during inference. As a result, after running the model forward several times, we get a Gaussian distribution centered on the model prediction. This is due to the random nature of dropout normalization [45]. As can be observed in Figure 1, the resulting prediction after a thousand forward passes for a prediction in one step follows a Gaussian distribution.
The spread of this Gaussian distribution could be interpreted as the uncertainty of the model [45]. In other words, it would represent how confident the model is about its prediction. We have incorporated this technique into the proposed model, not only because it significantly improves the generalization ability of the model [44], but also makes it easier to interpret the predictions.
2.4. Hybrid Models
Hybrid models occupy an intermediate position between the two preceding classes [46]. Here, the model uses both neural networks and statistical forecasters, usually in a meta-ensemble model. The concept is that ensemble methods can mitigate the weaknesses of each individual forecaster, and therefore improve the overall accuracy. This technique was proven to work during the M4 Kaggle competition, where the most successful submissions involved some kind of hybrid model [47].
In addition to assembling methods, statistical forecasters can also be used to perform data augmentation or even as direct input to the DNN [48]. As stated in the initial hypothesis, the idea is that the modeled behavior of the time series that each statistical forecaster creates may contain useful information that the DNN can learn, and therefore generate more accurate predictions [49]. Section 3.3 provides comprehensive details on the architecture of the proposed model.
3. Methodology
In this section, we will discuss our methodology for testing the hypothesis and provide a detailed overview of the DNN used and each of its layers.
3.1. Datasets
This research utilized three real-world datasets and one synthetic dataset, as described in the following items:
- M5 competition: This dataset contains monthly sales data for 3049 SKUs and 10 stores. It can be downloaded at https://www.kaggle.com/c/m5-forecasting-uncertainty.
- Stallion competition: This dataset contains monthly sales data for 24 SKUs and 58 agencies. It can be downloaded at https://www.kaggle.com/datasets/utathya/future-volume-prediction.
- Stock market: This dataset contains daily stock data (Volume, High, Low, and Closing Price) for all NASDAQ, S&P500, and NYSE listed companies. It can be downloaded at https://www.kaggle.com/datasets/paultimothymooney/stock-market-data.
- Synthetic data: This dataset is generated by the sum of four components, namely; (i) seasonality, modeled by a sine wave with random amplitude, phase, and frequency. (ii) trend, modeled by a random linear coefficient, either positive, negative, or null. (iii) noise, modeled by Gaussian white noise. The dataset contains 500 time series with 60 time steps each. And lastly, (iv) gain, which is a random scalar value that multiplies the entire series.
Those datasets have been selected because they contain all the problems stated in Section 1, namely: intermittence, high gains and variance, and non-linearities. Making it a challenging and realistic scenario for training and evaluating the performance of the model.
3.2. Preprocessing
The first step in the proposed model process is to generate the statistical predictions that will be used as covariates. To organize this step and make it easier to use. A Preprocessor() class has been implemented. This class has a function make_dataset() that takes as arguments the following items:
- forecast_horizon: How many time steps ahead will be predicted;
- season_length: The expected length of the seasonality, for instance, in a monthly aggregated, a reasonable seasonality length would be 12 time steps;
- date_freq: The pandas string to represent the frequency of the dataset, for instance, "MS" for monthly aggregated time series;
- train_split: The portion of the data that should be used for training.
- models: A list of statistical models that will be used to generate the covariates, any model that implements a fit() and predict() method can be used.
- fallback_model: If an error happened when trying to predict with one of the models, the class will fall back to this model instead;
- verbose: If the process should verbose the progress.
In this research, the following statistical forecasters were used: ARIMA [19], ETS [20], and Linear Regression [50]. These models have been selected based on their broad acceptance and usage in various domains of time series forecasting. Implementing these models was carried out with the statsforecast and scikit-learn [50] libraries.
3.2.1. ARIMA
The ARIMA (Autoregressive Integrated Moving Average) method is a widely used time series forecasting technique [51]. It combines the concepts of autoregressive (AR), differencing (I), and moving average (MA) models to capture the temporal patterns and predict the future values of a time series.
The AR component represents the autoregressive part and models the relationship between the current observation and a linear combination of the previous observations. It is defined by the equation:
where is the current observation at time t, c is a constant term, () are the autoregressive coefficients, and is the random error term.
The I component represents differencing and is used to remove the trend or seasonality from the time series. It is defined by the equation:
where represents the differenced series.
The MA component represents the moving average part and models the relationship between the current observation and a linear combination of past forecast errors. It is defined by the equation:
where is the mean of the time series, () are the moving average coefficients, and is the random error term.
The ARIMA method combines these components to model the time series, the values of p, d, and q are automatically calculated using the statsforecast library. In summary, the ARIMA method provides a flexible and reliable approach for time series forecasting, capturing both autoregressive and moving average patterns while handling trends and seasonality through differencing.
3.2.2. ETS
The ETS (Exponential Smoothing) method is a widely used time series forecasting technique that applies a weighted average of past observations to predict future values [52]. It is based on the assumption that recent observations are more important in forecasting than older ones. The ETS method includes three main components: level, trend, and seasonality.
The level component represents the current estimated level of the time series and is denoted by . It is updated on the basis of a weighted average of the previous level and the recent observation. The equation for updating the level is:
where represents the current observation at time t, is the estimated trend at time , and is the smoothing parameter.
The trend component represents the estimated trend of the time series and is denoted by . It is updated on the basis of a weighted average of the previous trend and the difference between the current level and the previous level. The equation for updating the trend is:
where is the smoothing parameter for the trend component.
The seasonality component represents the seasonal pattern in the time series and is denoted by . It is updated on the basis of a weighted average of the previous seasonal component and the recent observation. The equation for updating the seasonality is:
where m is the length of the seasonal cycle and is the smoothing parameter for the seasonality component.
The forecasted value for the next time period is calculated by combining the level, trend, and seasonality components:
The ETS method can handle different variations and combinations of the level, trend, and seasonality components, such as additive or multiplicative models, the parameters for the model are also automatically found with the statsforecast library. In summary, the ETS method provides a flexible and intuitive approach for time series forecasting by dynamically adjusting the weights of past observations based on their recency and importance.
3.2.3. Linear Regression
Linear regression is a widely used supervised learning algorithm for modeling the relationship between a dependent variable and one or more independent variables [50]. It fits a linear equation to the given data by minimizing the sum of squared residuals.
The linear regression model assumes a linear relationship between the dependent variable y and the independent variables X, and it can be represented as:
where y is the dependent variable, () are the independent variables, () are the coefficients to be estimated, and is the error term.
In this research, we applied the LinearRegression class from scikit-learn library to fit the linear regression model by estimating the coefficients using the Ordinary Least Squares (OLS) method. It minimizes the residual sum of squares between the observed and predicted values.
Once the model is fitted, it can be used to make predictions for new input data by simply computing the dot product between the input variables and the estimated coefficients. Linear regression is widely used for various applications, including predictive modeling, trend analysis, and relationship exploration.
3.3. Model Architecture
The different interpretations of the data by each of the statistical forecasters are expected to improve the stability and accuracy of DNN. Because of this, the proposed model consists of several input-branches, where each branch receives as input either the original data, or the statistical forecast of one of the selected models. Each branch has a single fully connected layer, referred to as a dense layer in this paper. Then each branch is multiplied by a trainable parameter called weight, and averaged, essentially performing a weighted average of the branches. By applying this approach, the model can learn which input is the most influential for prediction [15].
After all the branches have been consolidated into a single tensor, this resulting tensor is forwarded to a stack of convolution and max-pooling layers, followed by an LSTM layer. An overview of the model is represented in Figure 2 and the detailed formulae of all the layers are explained in the following sections.
3.3.1. Dense Layer
As implemented in the Keras Python package, dense layers are conventional fully connected neural network layers. They consist of a set of weights and biases , where a denotes the input size and represents the output size [14]. The forward pass of a Dense layer can be described as follows:
where , with representing any dimension, and represents an activation function. The primary role of an activation function is to introduce non-linearity between the input and output of the Dense layer. Several functions, such as Sigmoid [14], Hyperbolic Tangent () [53], Rectified Linear Unit (ReLU) [54] and Scaled Exponential Linear Unit (SELU) [55], are commonly used as activation functions. Their effectiveness varies depending on the application and network architecture.
The proposed model uses Dense layers in three different parts of its architecture. The first is at the root of each branch, as described in Section 3.2. The last dimension of each input X is 1. Since the Dense operates on the last dimension, the output of this last layer will be .
3.3.2. Convolutional Layer
Convolutional layers are the fundamental building block of convolutional neural networks (ConvNets), widely used in image and video analysis tasks. A convolutional layer applies a small filter to the input data, sliding it over to compute the dot product between the data and the filter weights. The filter applies the same weights to every position in the input data, resulting in a new sequence. In this sequence, each element represents a weighted combination of a local region from the input data [56].
Essentially, by learning essential features with the filter, the model is no longer bounded by spatial dependency. In other words, the model can locate important features anywhere in the input data [56]. This property is particularly advantageous in image analysis, where it is crucial to recognize objects like water bottles regardless of their position within the image. However, it is also beneficial in time series forecasting, as it enables the recognition of recurring patterns, such as seasonal patterns, at any point along the temporal axis.
In image analysis tasks, the convolutional layer typically operates in two dimensions, representing the width and height of the image [57]. In video analysis tasks, the convolutional layer commonly operates in three dimensions, including an additional dimension for the temporal axis. However, a one-dimensional convolution (Conv1D) is used for time series data with only one axis.
Given an input to a Conv1D layer, where t is the length of the time series, and n is the number of channels in the input data, and a filter of size . The Conv1D layer computes the dot product of the filter weights and the input X at each position, adds a bias term , and applies an activation function to the result, as shown in the following equation:
where i ranges from 0 to , additionally, the Conv1D layer has two more parameters: padding and stride. The padding parameter allows for padding the starting and leading data points out of the input data. In contrast, the stride parameter controls the increment of the filter position during the sliding process [56].
Typically, after a convolutional layer, there is a pooling layer. Its primary purpose is to downsample the feature maps by retaining only the most critical information while discarding the rest [56]. The approach to performing the pooling operation can differ between models. However, recent studies have shown a preference for MaxPooling over other pooling methods due to its superior results and more stable training process [58]. MaxPooling performs a sliding operation of a fixed-size window on the input feature map, retaining the maximum value within each window while discarding all other values.
By retaining only the maximum value, MaxPooling ensures the preservation of the most vital feature within each window. This process effectively reduces the dimensionality of the feature maps and improves the computational efficiency of ConvNet by reducing the number of parameters that need to be learned. Recent studies have favored MaxPooling over other pooling methods due to its superior results and more stable training process [58].
3.3.3. Long Short-Term Memory
LSTM is a Recurrent Neural Network (RNN) architecture widely used in sequence-to-sequence tasks [10]. Unlike traditional RNNs, LSTMs have a mechanism to handle the vanishing gradient problem, which is the tendency of gradients to decrease exponentially as the number of layers in a neural network increases. Because of this, LSTMs are a popular choice for time series forecasting due to their ability to capture long-term dependencies and patterns in sequential data [24].
A traditional LSTM cell, as shown in Figure 3, has three inputs: the Current Input , the Previous Hidden State , where h is the number of units in the hidden state, and the Previous Cell State . The hidden and cell states are updated at each time step, allowing the LSTM to remember information from the previous steps [10].
In addition to the inputs, the LSTM cell incorporates four gates. The first gate is the Forget Gate , which is described by the equation:
here, the Sigmoid activation function denoted by is used. The weight matrix of the Forget Gate is represented by , and the bias is denoted by . As implied by its name, the Forget Gate controls which information should be retained (passed to the cell state) and which should be forgotten. This gate accomplishes this by learning the optimal weight matrix . The resulting matrix is then multiplied by the Previous Cell State . In cases with no previous cell states (i.e., the first time step), it is assumed that . The next gate is the Input Gate , which is defined as follows:
where is the weight matrix of the Input Gate, and is the bias, resulting in . Parallel to the Input Gate is the Cell Gate defined by:
different from the previous gates, is a scalar defined by , as well as the bias , the resulting Cell Gate is . The Input Gate is then multiplied by the Cell Gate , and the resulting multiplication is then summed with the multiplication of the Previous Cell State and the Forget Gate , resulting in the Cell State , as follows:
The Input Gate and Cell Gate control which part of the input should be retained in the Cell State and which part should be ignored. Lastly, the Output Gate can be calculated as:
where is the weight matrix of the Input Gate, and is the bias, resulting in , the function of the Output Gate is to control what goes to the next Hidden State, and, simultaneously, controls what should be the output of the current cell [22]. Then, the Hidden State can be calculated as:
In practice, stacked LSTM cells form an LSTM layer. This set of equations for the states and gates of an LSTM cell controls the flow of information within the cell and allows the LSTM to decide which information to store and which to discard. The number of LSTM cells in an LSTM layer and the number of LSTM layers in a network can be tuned as hyperparameters to optimize performance for a given task [10].
3.4. Metrics
In this section, we discuss the evaluation metrics used to evaluate the performance of our predictive model. We employ four commonly used metrics: Mean Absolute Error (MAE), Mean Squared Error (MSE), and Symmetric Mean Absolute Percentage Error (SMAPE). All of these metrics are widely used in both academic and practical applications [17], and were chosen to evaluate the proposed hypothesis because each metric prioritizes a different characteristic of the time series.
3.4.1. Mean Absolute Error – MAE
The Mean Absolute Error (MAE) measures the average absolute difference between the predicted values and the actual values y. It is defined as:
MAE is widely used because it provides a simple and intuitive measure of the average prediction error. It is particularly useful when the magnitude of errors is important and outliers or extreme values in the dataset should not be severely penalized [17].
3.4.2. Mean Squared Error – MSE
The Mean Squared Error (MSE) calculates the average of the squared differences between the predicted values and the actual values y. It is given by:
MSE is a commonly used metric that emphasizes larger errors due to the squaring operation. It provides a measure of the average squared deviation between the predicted and actual values. Contrary to MAE, MSE heavily penalizes outliers and extreme predictions [17].
3.4.3. Symmetric Mean Absolute Percentage Error (SMAPE)
The Symmetric Mean Absolute Percentage Error (SMAPE) computes the average percentage difference between the predicted values and the actual values y, considering the mean of their magnitudes in the denominator. It is given by:
SMAPE is a symmetric variant of the Mean Absolute Percentage Error (MAPE). The main difference is the denominator, where MAPE uses only y as the denominator, and SMAPE uses the average between y and . This is done to avoid a possible division by zero when [59]. SMAPE is a useful metric because it represents the overall error as a percentage, allowing for comparison of the accuracy of a model in multiple domains with heterogeneous time series [16]. A general overview of the metrics is summarized in Table 1.
These metrics allow us to quantitatively evaluate the performance of our predictive model from different angles. MAE and MSE provide information on the magnitude of errors, while SMAPE offers information on the relative percentage deviations.
3.5. Hypothesis Test
The methodology for testing the alternative hypothesis () consists of training two seemingly identical DNN models, where the only difference lies in the input of each model. The first model, named (Model A), was trained on the dataset as is, without any feature engineering. The second model, named (Model B), was trained on a dataset with the statistical forecasters as covariates, as shown in Figure 4. Both models had the same training configuration and parameters.
Each model was evaluated with the three proposed metrics (MAE, MSE and SMAPE) for each dataset (M5, Stallion, Stock Market, and Synthetic), resulting in 12 evaluation matrices for each model. Next, we performed a two-sample paired t-test (also known as Student’s t-test). The objective of this test is to measure whether the mean of two samples with the same origin shows a significant difference [60]. The two-sample paired test is often used to measure the influence that an event had on the samples. For example, it could be applied to a group of students to measure their grades before and after they studied a subject and to determine how effective the study was.
This is achieved by calculating the t-statistic (t) between the observations of the samples, where t represents the difference in terms of standard deviations () between them. To calculate t, it is necessary first to calculate the difference between the two paired observations (d), where , with x as the first observation and y as the second. Next, the mean difference between pairs () can be defined as:
The next step is to calculate the standard deviation of the differences (), defined as:
Finally, t can be defined as:
Here, a large and positive value of t indicates that the first observation of the pair is significantly different from the second, and vice versa. After obtaining the t-statistic (t), a lookup table or specialized software can be used to find its corresponding p-value. The p-value represents the probability of obtaining a statistic as extreme or more extreme than that observed in the experiment [60].
3.5.1. Significance Level
It is important to note that the Student t-test assumes that the null hypothesis () is true. Therefore, the resulting conclusion of the test provides either proof that is, in fact, true or evidence that is not true, in which case can be assumed to be true [60].
Since the p-value is essentially the probability that is true, if we want evidence that is true, we need a very low probability that is true. Due to this, it is safe to assume a Significance Level () of 0.05, as demonstrated in Figure 4 [61].
Although, as discussed by many authors over the decades, the meaning of the p-value and its associated thresholds is abstract and has received many criticisms over the years [62,63,64]. Because of this, we will adopt a region of uncertainty where can be neither accepted nor denied, formalized as:
Using the methodology outlined in this section, we successfully tested the proposed model and assessed the hypothesis presented in Section 1. The results will be detailed in the following section.
4. Discussion of Results
The results obtained from the evaluation of the predictive model in different datasets are presented in Table 2. The table shows the metrics (MAE, MSE, and SMAPE) for both Model A (without covariates) and Model B (with covariates), along with the p-value and the t-statistic obtained from the two-sample paired t-test. Let us discuss the implications of these results and their significance.
4.1. M5 Dataset
For the M5 dataset, Model B with covariates showed slightly lower MAE and MSE compared to Model A without covariates. However, the performance difference between the two models was not statistically significant based on the p-value, which is greater than . The t-statistic is also negative, indicating that Model B performed slightly better than Model A on average. In particular, the SMAPE metric showed a statistically significant improvement in performance for Model B. The relatively low p-value and the negative t-statistic suggest that including covariates in the model resulted in a more accurate percentage-based error estimation.
4.2. Stallion Dataset
For the Stallion dataset, Model B with covariates exhibited slightly lower MAE and MSE compared to Model A without covariates. However, similar to the M5 dataset, the performance difference was not statistically significant, as indicated by the p-value greater than . The t-statistic is also close to zero, indicating that there is no significant difference between the two models. It is important to note that the SMAPE metric showed a notable improvement in performance for Model B. While the p-value for SMAPE is greater than 0.05, the relatively low value indicates that the difference might be significant with a larger dataset.
4.3. Stock Market Dataset
Similar to the Stallion and M5 datasets, the improvement in MAE and MSE for the Stock market dataset was not statistically significant; however, for this dataset the difference was basically negligible. On the contrary, there was a massive improvement in the SMAPE metric for Model B.
4.4. Synthetic Dataset
The Synthetic dataset showed the most significant improvement when using covariates. Both MAE and SMAPE exhibited substantial improvements, with p-values close to zero, indicating high statistical significance. The negative t-statistics further support the conclusion that Model B significantly outperformed Model A. The large improvement in SMAPE is noteworthy, as it suggests that the inclusion of covariates allowed for a better representation of the relative percentage error.
4.5. Overall Implications
The results indicate that the inclusion of covariates in the predictive model showed varying degrees of impact on performance, depending on the data set and the evaluation metric chosen. In some cases, such as the Stock Market and Synthetic datasets, including covariates significantly improved the model’s performance. However, for the M5 and Stallion datasets, the impact of covariates was not statistically significant.
The varying results could be attributed to several factors, such as the nature of the time series data, the quality and relevance of the selected statistical forecasters, and the size of the datasets. However, it could be noted that performance never decreased in all scenarios due to the usage of statistical covariates. This is due to the weighted average of the inputs, as observed in Figure 2. Due to the nature of back-propagation in a DNN, the model can learn to ignore inputs that are not contributing to the overall improvement of the metrics. Issues related to hardware security and performance will be considered, as per the work described in [65,66,67,68].
Another key observation is that the best improvements were observed with the SMAPE metric. This was not unexpected, since this is the metric most sensible to outliers, therefore, any minor difference in the outputs results in a large difference in the metric. Finally, we observed that the performance of Model B over Model A was most prominent in the synthetic dataset.
5. Conclusion
In this paper, we address the challenge of improving multihorizon forecasting in scenarios with limited data and functional covariates. We proposed the usage of statistical forecasters as covariates in a Deep Neural Network (DNN) model and evaluated its impact on forecast metrics. Our analysis covered four diverse datasets: M5, Stallion, Stock Market, and Synthetic.
The results demonstrated that the inclusion of statistical forecasters as covariates in the DNN model led to varying degrees of improvement in forecast performance, depending on the dataset and evaluation metric. In general, our findings suggest that the incorporation of statistical forecasters as covariates in a DNN model can be a valuable approach to improving multihorizon forecasting, especially in scenarios with data scarcity and intermittence. However, the effectiveness of this approach may depend on the nature of the data and the specific forecasting task at hand.
In future research, further investigations could explore the selection of different statistical forecasters, evaluate additional neural network architectures, and assess the impact of varying the granularity of the data. Additionally, the analysis could be extended to include other evaluation metrics and larger datasets to gain deeper insight into the generalizability and robustness of this approach.
In conclusion, our study contributes to the advancement of multi-horizon forecasting techniques in challenging real-world scenarios and paves the way for more effective forecasting models in industries such as retail, finance, and energy, where accurate predictions of future time series behavior are crucial for decision-making and planning.
Not applicable.
Author Contributions
Writing—original draft, R.O.K.; writing—review and editing, software, methodology, validation, L.O.S. W.D.P., R.L.S.D.; writing—review and editing, supervision, A.M.R.R., D.C.G., and G.V.G. All authors have read and agreed to the published version of the manuscript.
Funding
The authors sincerely thank the Foundation for Research and Innovation of the State of Santa Catarina (FAPESC) for providing the Master’s scholarship that supported the research presented in this paper. Without the financial support of FAPESC, this work would not have been possible. This work is part of the project Self-adaptive platform based on intelligent agents for the optimization and management of operational processes in logistic warehouses (PLAUTON) PID2023-151701OB-C21, funded by MCIN/AEI/10.13039/501100011033/FEDER, EU.
Informed Consent Statement
Not applicable.
Data Availability Statement
Available upon request to the authors.
Conflicts of Interest
The authors declare no conflict of interest.
References
- Zuege, C.V.; Stefenon, S.F.; Yamaguchi, C.K.; Mariani, V.C.; Gonzalez, G.V.; dos Santos Coelho, L. Wind speed forecasting approach using conformal prediction and feature importance selection. International Journal of Electrical Power & Energy Systems 2025, 168, 110700. [Google Scholar] [CrossRef]
- Stefenon, S.F.; Seman, L.O.; Sopelsa Neto, N.F.; Meyer, L.H.; Mariani, V.C.; Coelho, L.d.S. Group method of data handling using Christiano-Fitzgerald random walk filter for insulator fault prediction. Sensors 2023, 23, 6118. [Google Scholar] [CrossRef] [PubMed]
- Lim, B.; Zohren, S. Time-series forecasting with deep learning: a survey. Philosophical Transactions of the Royal Society A 2021, 379, 20200209. [Google Scholar] [CrossRef] [PubMed]
- Lopes, H.; Pires, I.M.; Sánchez San Blas, H.; García-Ovejero, R.; Leithardt, V. PriADA: Management and Adaptation of Information Based on Data Privacy in Public Environments. Computers 2020, 9, 77. [Google Scholar] [CrossRef]
- Kourentzes, N.; Athanasopoulos, G. Elucidate structure in intermittent demand series. European Journal of Operational Research 2021, 288, 141–152. [Google Scholar] [CrossRef]
- Tian, X.; Wang, H.; Erjiang, E. Forecasting intermittent demand for inventory management by retailers: A new approach. Journal of Retailing and Consumer Services 2021, 62, 102662. [Google Scholar] [CrossRef]
- Jain, G.; Mallick, B. A study of time series models ARIMA and ETS. Available at SSRN 2898968 2017. [Google Scholar] [CrossRef]
- Lim, B.; Arık, S.Ö.; Loeff, N.; Pfister, T. Temporal fusion transformers for interpretable multi-horizon time series forecasting. International Journal of Forecasting 2021, 37, 1748–1764. [Google Scholar] [CrossRef]
- Salinas, D.; Flunkert, V.; Gasthaus, J.; Januschowski, T. DeepAR: Probabilistic forecasting with autoregressive recurrent networks. International Journal of Forecasting 2020, 36, 1181–1191. [Google Scholar] [CrossRef]
- Hochreiter, S.; Schmidhuber, J. Long short-term memory. Neural computation 1997, 9, 1735–1780. [Google Scholar] [CrossRef]
- Chevalier, G. LARNN: linear attention recurrent neural network. arXiv preprint arXiv:1808.05578 2018.
- Bui, V.; Le, N.T.; Nguyen, V.H.; Kim, J.; Jang, Y.M. Multi-behavior with bottleneck features LSTM for load forecasting in building energy management system. Electronics 2021, 10, 1026. [Google Scholar] [CrossRef]
- Ranganathan, A. The levenberg-marquardt algorithm. Tutoral on LM algorithm 2004, 11, 101–110. [Google Scholar]
- Gardner, M.W.; Dorling, S. Artificial neural networks (the multilayer perceptron)—a review of applications in the atmospheric sciences. Atmospheric environment 1998, 32, 2627–2636. [Google Scholar] [CrossRef]
- Zhang, X.; Xu, M.; Li, Y.; Su, M.; Xu, Z.; Wang, C.; Kang, D.; Li, H.; Mu, X.; Ding, X.; et al. Automated multi-model deep neural network for sleep stage scoring with unfiltered clinical data. Sleep and Breathing 2020, 24, 581–590. [Google Scholar] [CrossRef] [PubMed]
- Gustriansyah, R.; Ermatita, E.; Rini, D.P. An approach for sales forecasting. Expert Systems with Applications 2022, 207, 118043. [Google Scholar] [CrossRef]
- González-Sopeña, J.; Pakrashi, V.; Ghosh, B. An overview of performance evaluation metrics for short-term statistical wind power forecasting. Renewable and Sustainable Energy Reviews 2021, 138, 110515. [Google Scholar] [CrossRef]
- Akiba, T.; Sano, S.; Yanase, T.; Ohta, T.; Koyama, M. Optuna: A next-generation hyperparameter optimization framework. In Proceedings of the Proceedings of the 25th ACM SIGKDD international conference on knowledge discovery & data mining; 2019; pp. 2623–2631. [Google Scholar]
- Hyndman, R.J.; Khandakar, Y. Automatic time series forecasting: the forecast package for R. Journal of statistical software 2008, 27, 1–22. [Google Scholar] [CrossRef]
- Hyndman, R.; Koehler, A.B.; Ord, J.K.; Snyder, R.D. Forecasting with exponential smoothing: the state space approach; Springer Science & Business Media, 2008.
- da Silva, E.C.; Finardi, E.C.; Stefenon, S.F. Enhancing hydroelectric inflow prediction in the Brazilian power system: A comparative analysis of machine learning models and hyperparameter optimization for decision support. Electric Power Systems Research 2024, 230, 110275. [Google Scholar] [CrossRef]
- Klaar, A.C.R.; Stefenon, S.F.; Seman, L.O.; Mariani, V.C.; Coelho, L.S. Optimized EWT-Seq2Seq-LSTM with attention mechanism to insulators fault prediction. Sensors 2023, 23, 3202. [Google Scholar] [CrossRef]
- Stefenon, S.F.; Seman, L.O.; da Silva, L.S.A.; Mariani, V.C.; dos Santos Coelho, L. Hypertuned temporal fusion transformer for multi-horizon time series forecasting of dam level in hydroelectric power plants. International Journal of Electrical Power & Energy Systems 2024, 157, 109876. [Google Scholar] [CrossRef]
- Stefenon, S.F.; Seman, L.O.; Aquino, L.S.; dos Santos Coelho, L. Wavelet-Seq2Seq-LSTM with attention for time series forecasting of level of dams in hydroelectric power plants. Energy 2023, 274, 127350. [Google Scholar] [CrossRef]
- Khaldi, R.; El Afia, A.; Chiheb, R.; Tabik, S. What is the best RNN-cell structure to forecast each time series behavior? Expert Systems with Applications 2023, 215, 119140. [Google Scholar] [CrossRef]
- Stefenon, S.F.; Silva, M.C.; Bertol, D.W.; Meyer, L.H.; Nied, A. Fault diagnosis of insulators from ultrasound detection using neural networks. Journal of Intelligent & Fuzzy Systems 2019, 37, 6655–6664. [Google Scholar] [CrossRef]
- Stefenon, S.F.; Singh, G.; Yow, K.C.; Cimatti, A. Semi-ProtoPNet deep neural network for the classification of defective power grid distribution structures. Sensors 2022, 22, 4859. [Google Scholar] [CrossRef]
- Starke, L.; Hoppe, A.F.; Sartori, A.; Stefenon, S.F.; Santana, J.F.D.P.; Leithardt, V.R.Q. Interference recommendation for the pump sizing process in progressive cavity pumps using graph neural networks. Scientific Reports 2023, 13, 16884. [Google Scholar] [CrossRef] [PubMed]
- Stefenon, S.F.; Seman, L.O.; Klaar, A.C.R.; Ovejero, R.G.; Leithardt, V.R.Q. Hypertuned-YOLO for interpretable distribution power grid fault location based on EigenCAM. Ain Shams Engineering Journal 2024, 15, 102722. [Google Scholar] [CrossRef]
- Stefenon, S.F.; Seman, L.O.; Singh, G.; Yow, K.C. Enhanced insulator fault detection using optimized ensemble of deep learning models based on weighted boxes fusion. International Journal of Electrical Power & Energy Systems 2025, 168, 110682. [Google Scholar] [CrossRef]
- Salazar, L.H.A.; Leithardt, V.R.Q.; Parreira, W.D.; da Rocha Fernandes, A.M.; Barbosa, J.L.V.; Correia, S.D. Application of Machine Learning Techniques to Predict a Patient’s No-Show in the Healthcare Sector. Future Internet 2022, 14, 3. [Google Scholar] [CrossRef]
- Fernandes, F.; Stefenon, S.F.; Seman, L.O.; Nied, A.; Ferreira, F.C.S.; Subtil, M.C.M.; Klaar, A.C.R.; Leithardt, V.R.Q. Long short-term memory stacking model to predict the number of cases and deaths caused by COVID-19. Journal of Intelligent & Fuzzy Systems 2022, 6, 6221–6234. [Google Scholar] [CrossRef]
- Vieira, J.C.; Sartori, A.; Stefenon, S.F.; Perez, F.L.; de Jesus, G.S.; Leithardt, V.R.Q. Low-Cost CNN for Automatic Violence Recognition on Embedded System. IEEE Access 2022, 10, 25190–25202. [Google Scholar] [CrossRef]
- Larcher, J.H.K.; Stefenon, S.F.; dos Santos Coelho, L.; Mariani, V.C. Enhanced multi-step streamflow series forecasting using hybrid signal decomposition and optimized reservoir computing models. Expert Systems with Applications 2024, 255, 124856. [Google Scholar] [CrossRef]
- Ribeiro, M.H.D.M.; da Silva, R.G.; Moreno, S.R.; Canton, C.; Larcher, J.H.K.; Stefenon, S.F.; Mariani, V.C.; dos Santos Coelho, L. Variational mode decomposition and bagging extreme learning machine with multi-objective optimization for wind power forecasting. Applied Intelligence 2024, 54, 3119–3134. [Google Scholar] [CrossRef]
- Stefenon, S.F.; Seman, L.O.; Yamaguchi, C.K.; Coelho, L.D.S.; Mariani, V.C.; Matos-Carvalho, J.P.; Leithardt, V.R.Q. Neural Hierarchical Interpolation Time Series (NHITS) for Reservoir Level Multi-Horizon Forecasting in Hydroelectric Power Plants. IEEE Access 2025, 13, 54853–54865. [Google Scholar] [CrossRef]
- Stefenon, S.F.; Seman, L.O.; Schutel Furtado Neto, C.; Nied, A.; Seganfredo, D.M.; Garcia da Luz, F.; Sabino, P.H.; Torreblanca González, J.; Quietinho Leithardt, V.R. Electric field evaluation using the finite element method and proxy models for the design of stator slots in a permanent magnet synchronous motor. Electronics 2020, 9, 1975. [Google Scholar] [CrossRef]
- Stefenon, S.F.; Cristoforetti, M.; Cimatti, A. Automatic digitalization of railway interlocking systems engineering drawings based on hybrid machine learning methods. Expert Systems with Applications 2025, 281, 127532. [Google Scholar] [CrossRef]
- Branco, N.W.; Cavalca, M.S.M.; Stefenon, S.F.; Leithardt, V.R.Q. Wavelet LSTM for Fault Forecasting in Electrical Power Grids. Sensors 2022, 22, 8323. [Google Scholar] [CrossRef]
- Stefenon, S.F.; Kasburg, C.; Freire, R.Z.; Silva Ferreira, F.C.; Bertol, D.W.; Nied, A. Photovoltaic power forecasting using wavelet neuro-fuzzy for active solar trackers. Journal of Intelligent & Fuzzy Systems 2021, 40, 1083–1096. [Google Scholar] [CrossRef]
- Seman, L.O.; Stefenon, S.F.; Mariani, V.C.; dos Santos Coelho, L. Ensemble learning methods using the Hodrick–Prescott filter for fault forecasting in insulators of the electrical power grids. International Journal of Electrical Power & Energy Systems 2023, 152, 109269. [Google Scholar] [CrossRef]
- Stefenon, S.F.; Bruns, R.; Sartori, A.; Meyer, L.H.; Ovejero, R.G.; Leithardt, V.R.Q. Analysis of the ultrasonic signal in polymeric contaminated insulators through ensemble learning methods. IEEE Access 2022, 10, 33980–33991. [Google Scholar] [CrossRef]
- Corso, M.P.; Stefenon, S.F.; Singh, G.; Matsuo, M.V.; Perez, F.L.; Leithardt, V.R.Q. Evaluation of visible contamination on power grid insulators using convolutional neural networks. Electrical Engineering 2023, 105, 3881–3894. [Google Scholar] [CrossRef]
- Baldi, P.; Sadowski, P.J. Understanding dropout. Advances in neural information processing systems 2013, 26. [Google Scholar]
- Gal, Y.; Ghahramani, Z. Dropout as a bayesian approximation: Representing model uncertainty in deep learning. In Proceedings of the international conference on machine learning. PMLR; 2016; pp. 1050–1059. [Google Scholar]
- Stefenon, S.F.; Ribeiro, M.H.D.M.; Nied, A.; Mariani, V.C.; Coelho, L.S.; Leithardt, V.R.Q.; Silva, L.A.; Seman, L.O. Hybrid wavelet stacking ensemble model for insulators contamination forecasting. IEEE Access 2021, 9, 66387–66397. [Google Scholar] [CrossRef]
- Smyl, S. A hybrid method of exponential smoothing and recurrent neural networks for time series forecasting. International Journal of Forecasting 2020, 36, 75–85. [Google Scholar] [CrossRef]
- Javeri, I.Y.; Toutiaee, M.; Arpinar, I.B.; Miller, J.A.; Miller, T.W. Improving Neural Networks for Time-Series Forecasting using Data Augmentation and AutoML. In Proceedings of the 2021 IEEE Seventh International Conference on Big Data Computing Service and Applications (BigDataService); 2021; pp. 1–8. [Google Scholar] [CrossRef]
- Stefenon, S.F.; Seman, L.O.; da Silva, E.C.; Finardi, E.C.; Coelho, L.d.S.; Mariani, V.C. Hypertuned wavelet convolutional neural network with long short-term memory for time series forecasting in hydroelectric power plants. Energy 2024, 313, 133918. [Google Scholar] [CrossRef]
- Pedregosa, F.; Varoquaux, G.; Gramfort, A.; Michel, V.; Thirion, B.; Grisel, O.; Blondel, M.; Prettenhofer, P.; Weiss, R.; Dubourg, V.; et al. Scikit-learn: Machine Learning in Python. Journal of Machine Learning Research 2011, 12, 2825–2830. [Google Scholar]
- Box, G.E.; Jenkins, G.M.; Reinsel, G.C.; Ljung, G.M. Time series analysis: forecasting and control; John Wiley & Sons, 2015.
- Hyndman, R.J.; Athanasopoulos, G. Forecasting: principles and practice; OTexts, 2018.
- Abdelouahab, K.; Pelcat, M.; Berry, F. Why TanH is a hardware friendly activation function for CNNs. In Proceedings of the Proceedings of the 11th international conference on distributed smart cameras; 2017; pp. 199–201. [Google Scholar]
- Dubey, A.K.; Jain, V. Comparative study of convolution neural network’s relu and leaky-relu activation functions. In Proceedings of the Applications of Computing, Automation and Wireless Systems in Electrical Engineering: Proceedings of MARC 2018; Springer, 2019; pp. 873–880. [Google Scholar]
- Huang, Z.; Ng, T.; Liu, L.; Mason, H.; Zhuang, X.; Liu, D. SNDCNN: Self-normalizing deep CNNs with scaled exponential linear units for speech recognition. In Proceedings of the ICASSP 2020-2020 IEEE International Conference on Acoustics, Speech and Signal Processing (ICASSP); IEEE, 2020; pp. 6854–6858. [Google Scholar]
- LeCun, Y.; Bengio, Y.; Hinton, G. Deep learning. nature 2015, 521, 436–444. [Google Scholar] [CrossRef] [PubMed]
- Borré, A.; Seman, L.O.; Camponogara, E.; Stefenon, S.F.; Mariani, V.C.; Coelho, L.S. Machine fault detection using a hybrid CNN-LSTM attention-based model. Sensors 2023, 23, 4512. [Google Scholar] [CrossRef]
- Nagi, J.; Ducatelle, F.; Di Caro, G.A.; Cireşan, D.; Meier, U.; Giusti, A.; Nagi, F.; Schmidhuber, J.; Gambardella, L.M. Max-pooling convolutional neural networks for vision-based hand gesture recognition. In Proceedings of the 2011 IEEE international conference on signal and image processing applications (ICSIPA); IEEE, 2011; pp. 342–347. [Google Scholar]
- Makridakis, S. Accuracy measures: theoretical and practical concerns. International journal of forecasting 1993, 9, 527–529. [Google Scholar] [CrossRef]
- Montgomery, D.C.; Runger, G.C. Applied statistics and probability for engineers; John wiley & sons, 2020.
- Wasserstein, R.L.; Lazar, N.A. The ASA statement on p-values: context, process, and purpose, 2016.
- Goodman, S.N. Toward evidence-based medical statistics. 1: The P value fallacy. Annals of internal medicine 1999, 130, 995–1004. [Google Scholar] [CrossRef]
- Dixon, P. The p-value fallacy and how to avoid it. Canadian Journal of Experimental Psychology/Revue canadienne de psychologie expérimentale 2003, 57, 189. [Google Scholar] [CrossRef]
- Bertolaccini, L.; Viti, A.; Terzi, A. Are the fallacies of the P value finally ended? Journal of Thoracic Disease 2016, 8, 1067. [Google Scholar] [CrossRef] [PubMed]
- Saraiva, D.A.F.; Leithardt, V.R.Q.; de Paula, D.; Sales Mendes, A.; González, G.V.; Crocker, P. PRISEC: Comparison of Symmetric Key Algorithms for IoT Devices. Sensors 2019, 19. [Google Scholar] [CrossRef] [PubMed]
- Lopes, H.; Pires, I.M.; Sánchez San Blas, H.; García-Ovejero, R.; Leithardt, V. PriADA: Management and Adaptation of Information Based on Data Privacy in Public Environments. Computers 2020, 9. [Google Scholar] [CrossRef]
- Noetzold, D.; Rossetto, A.G.d.M.; Barbosa, J.; Leithardt, V.R.Q. Investigation and Optimization of StringDeduplication with Custom Heuristic in Different Versions of the JVM. IEEE Latin America Transactions 2025, 23, 43–49. [Google Scholar] [CrossRef]
- Noetzold, D.; de Moraes Rossetto, A.G.; Silva, L.A.; Crocker, P.; Leithardt, V.R.Q. JVM optimization: An empirical analysis of JVM configurations for enhanced web application performance. SoftwareX 2024, 28, 101933. [Google Scholar] [CrossRef]
Figure 1.
Gaussian distribution of the one-step-ahead prediction of a stacked LSTM model with in-between dropout layers, the resulting distribution was obtained after a 1000 inferences with dropout.
Figure 1.
Gaussian distribution of the one-step-ahead prediction of a stacked LSTM model with in-between dropout layers, the resulting distribution was obtained after a 1000 inferences with dropout.
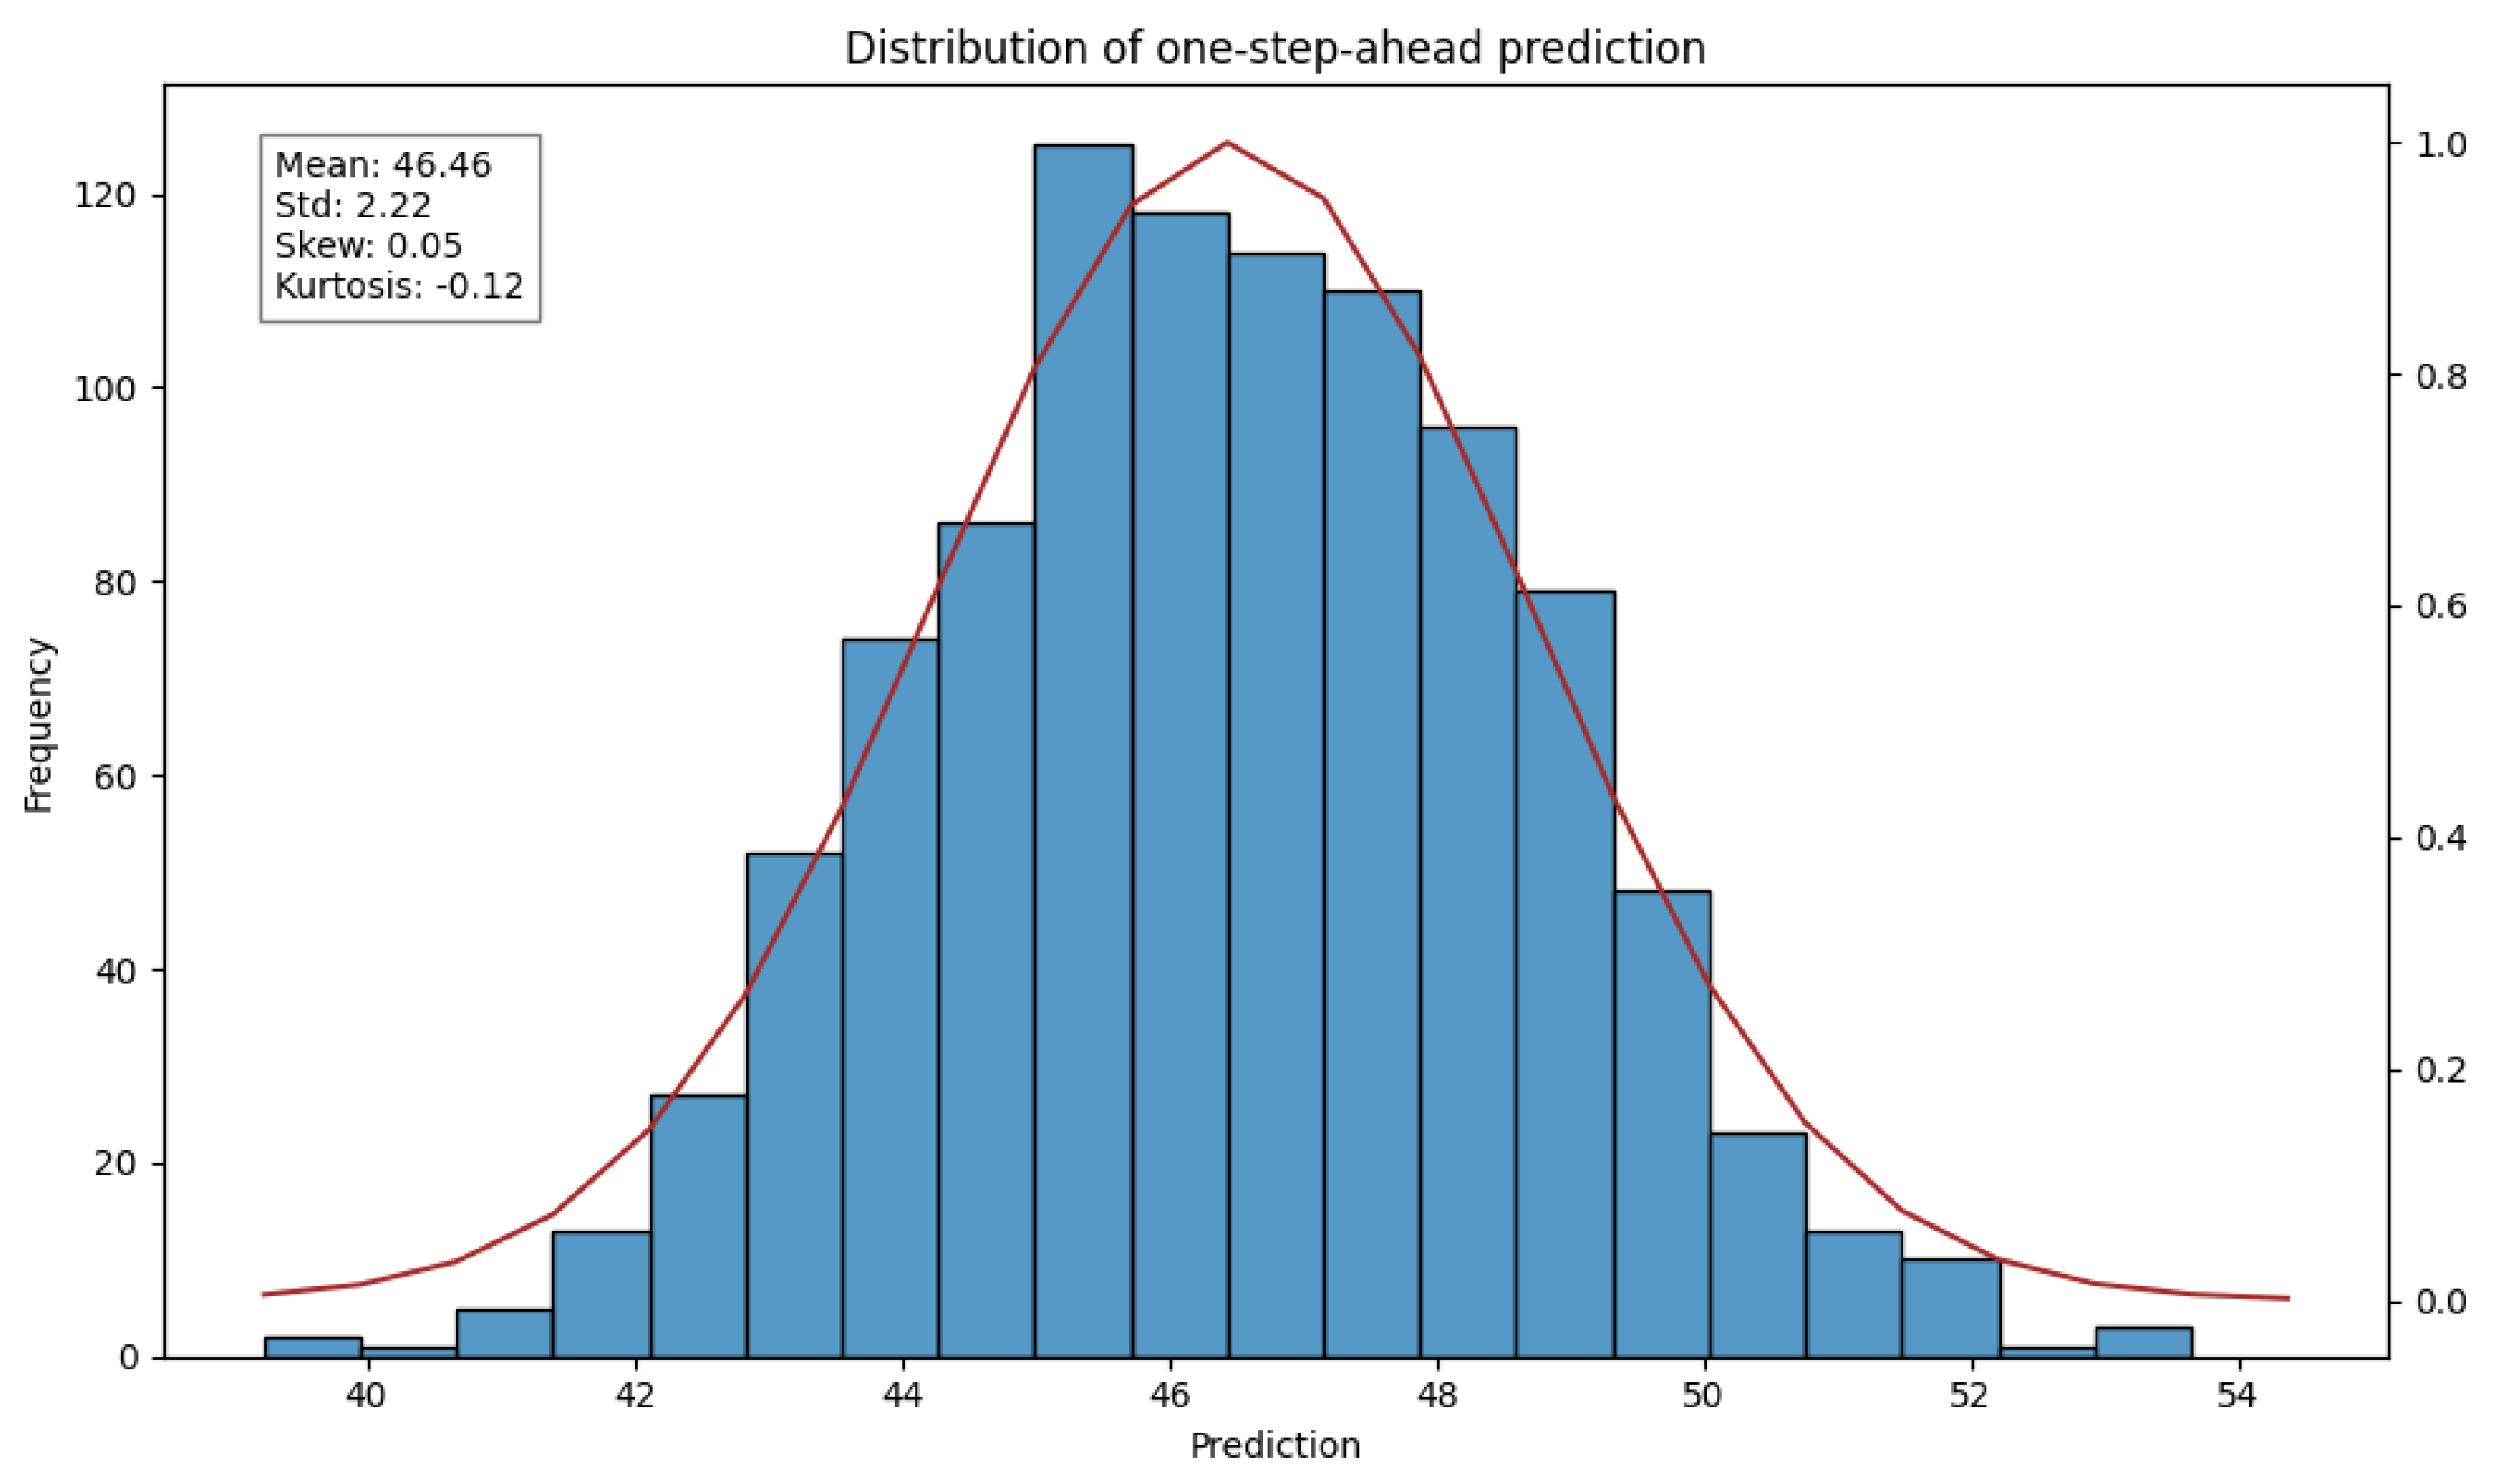
Figure 2.
Model Architecture with n input branches.
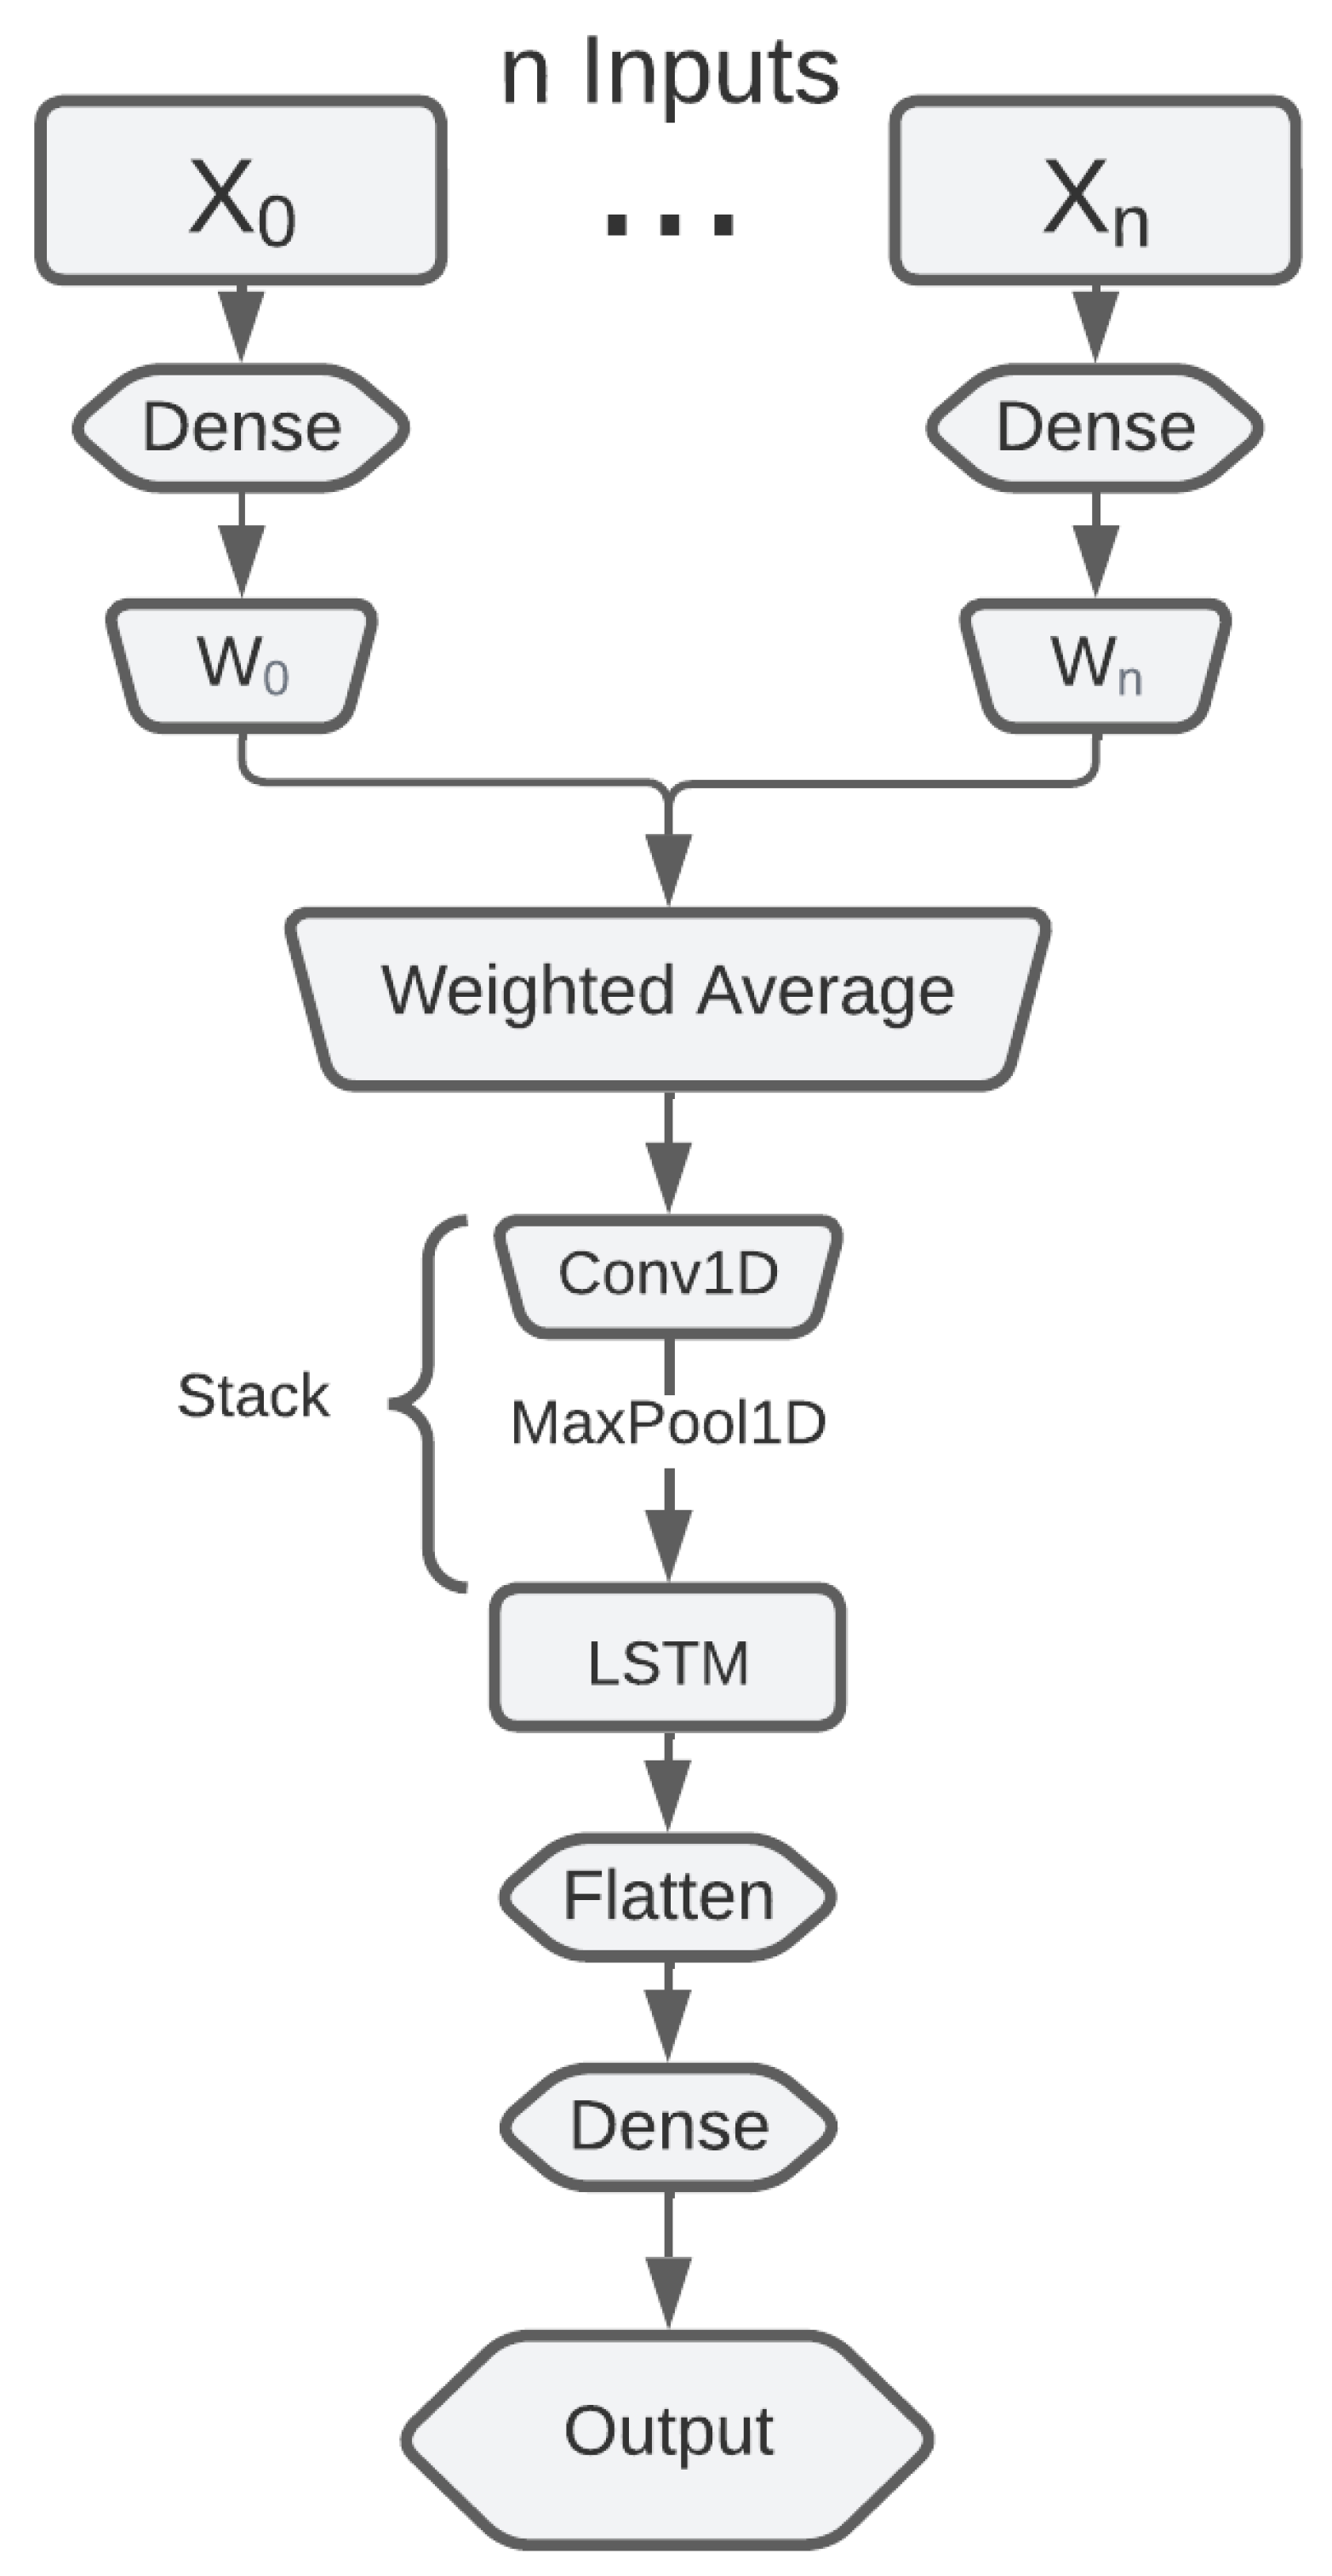
Figure 3.
LSTM cell diagram, with omitted bias component to improve readability
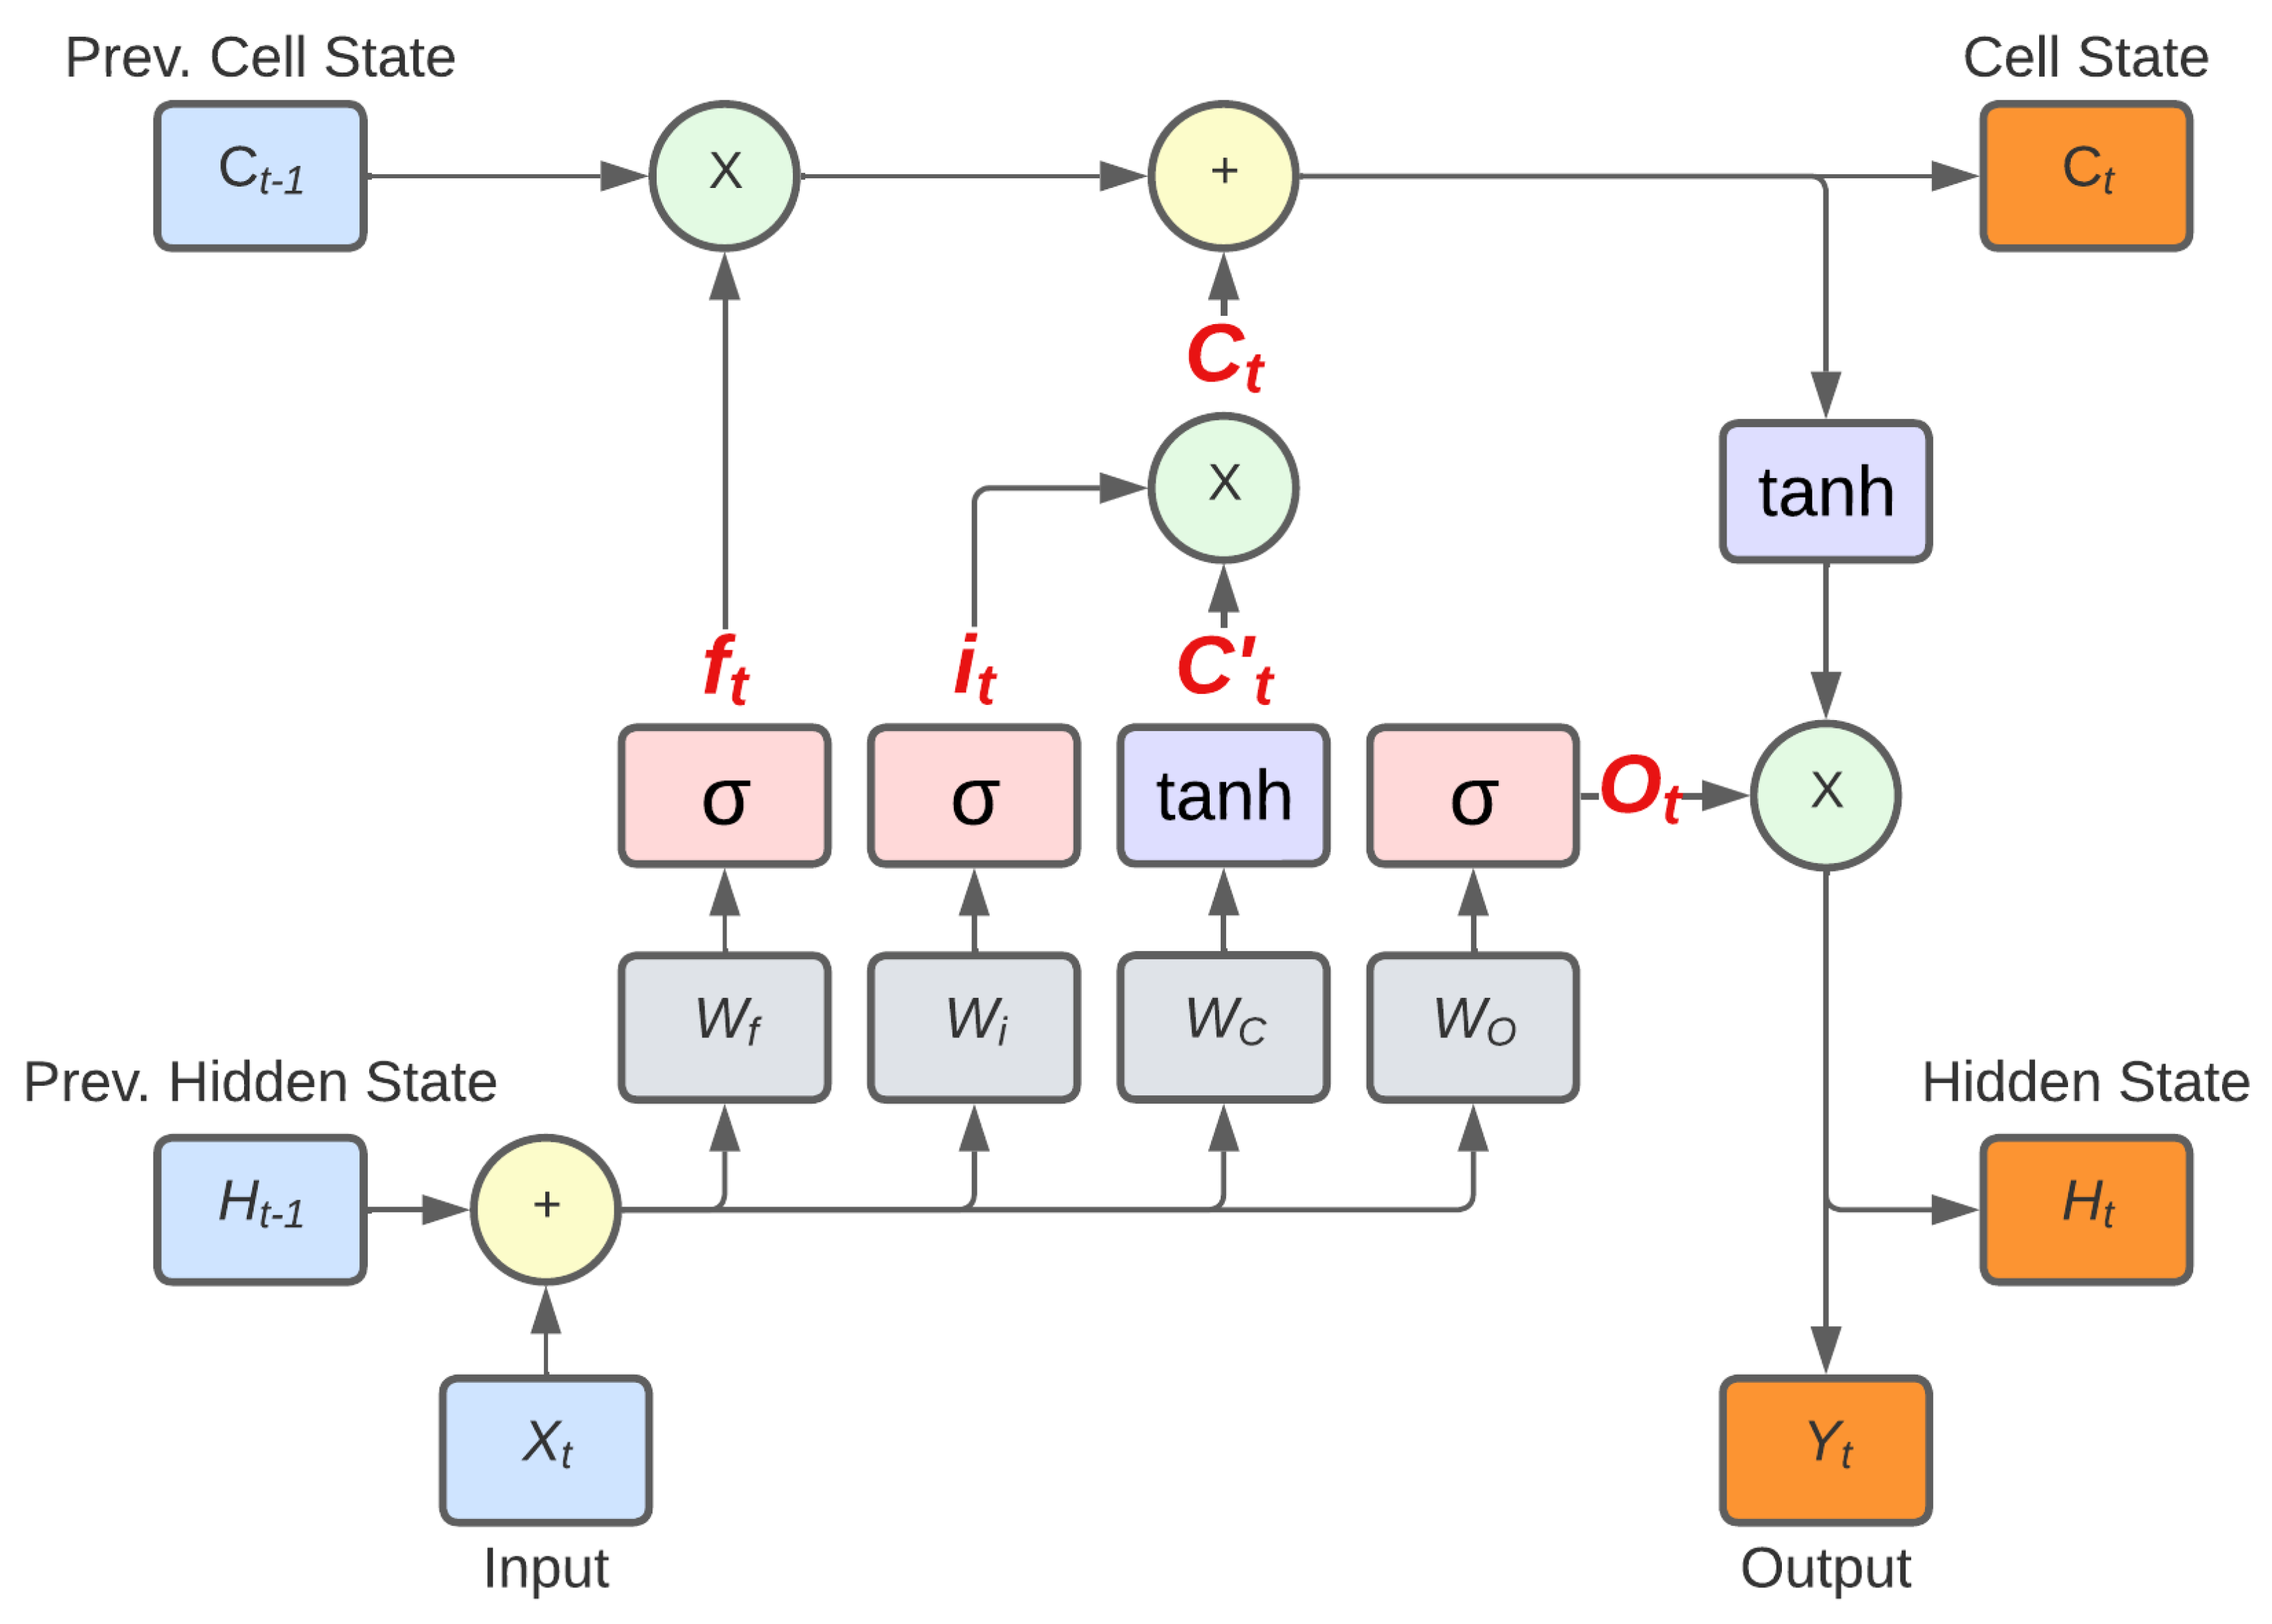
Figure 4.
Methodology for the hypothesis test.
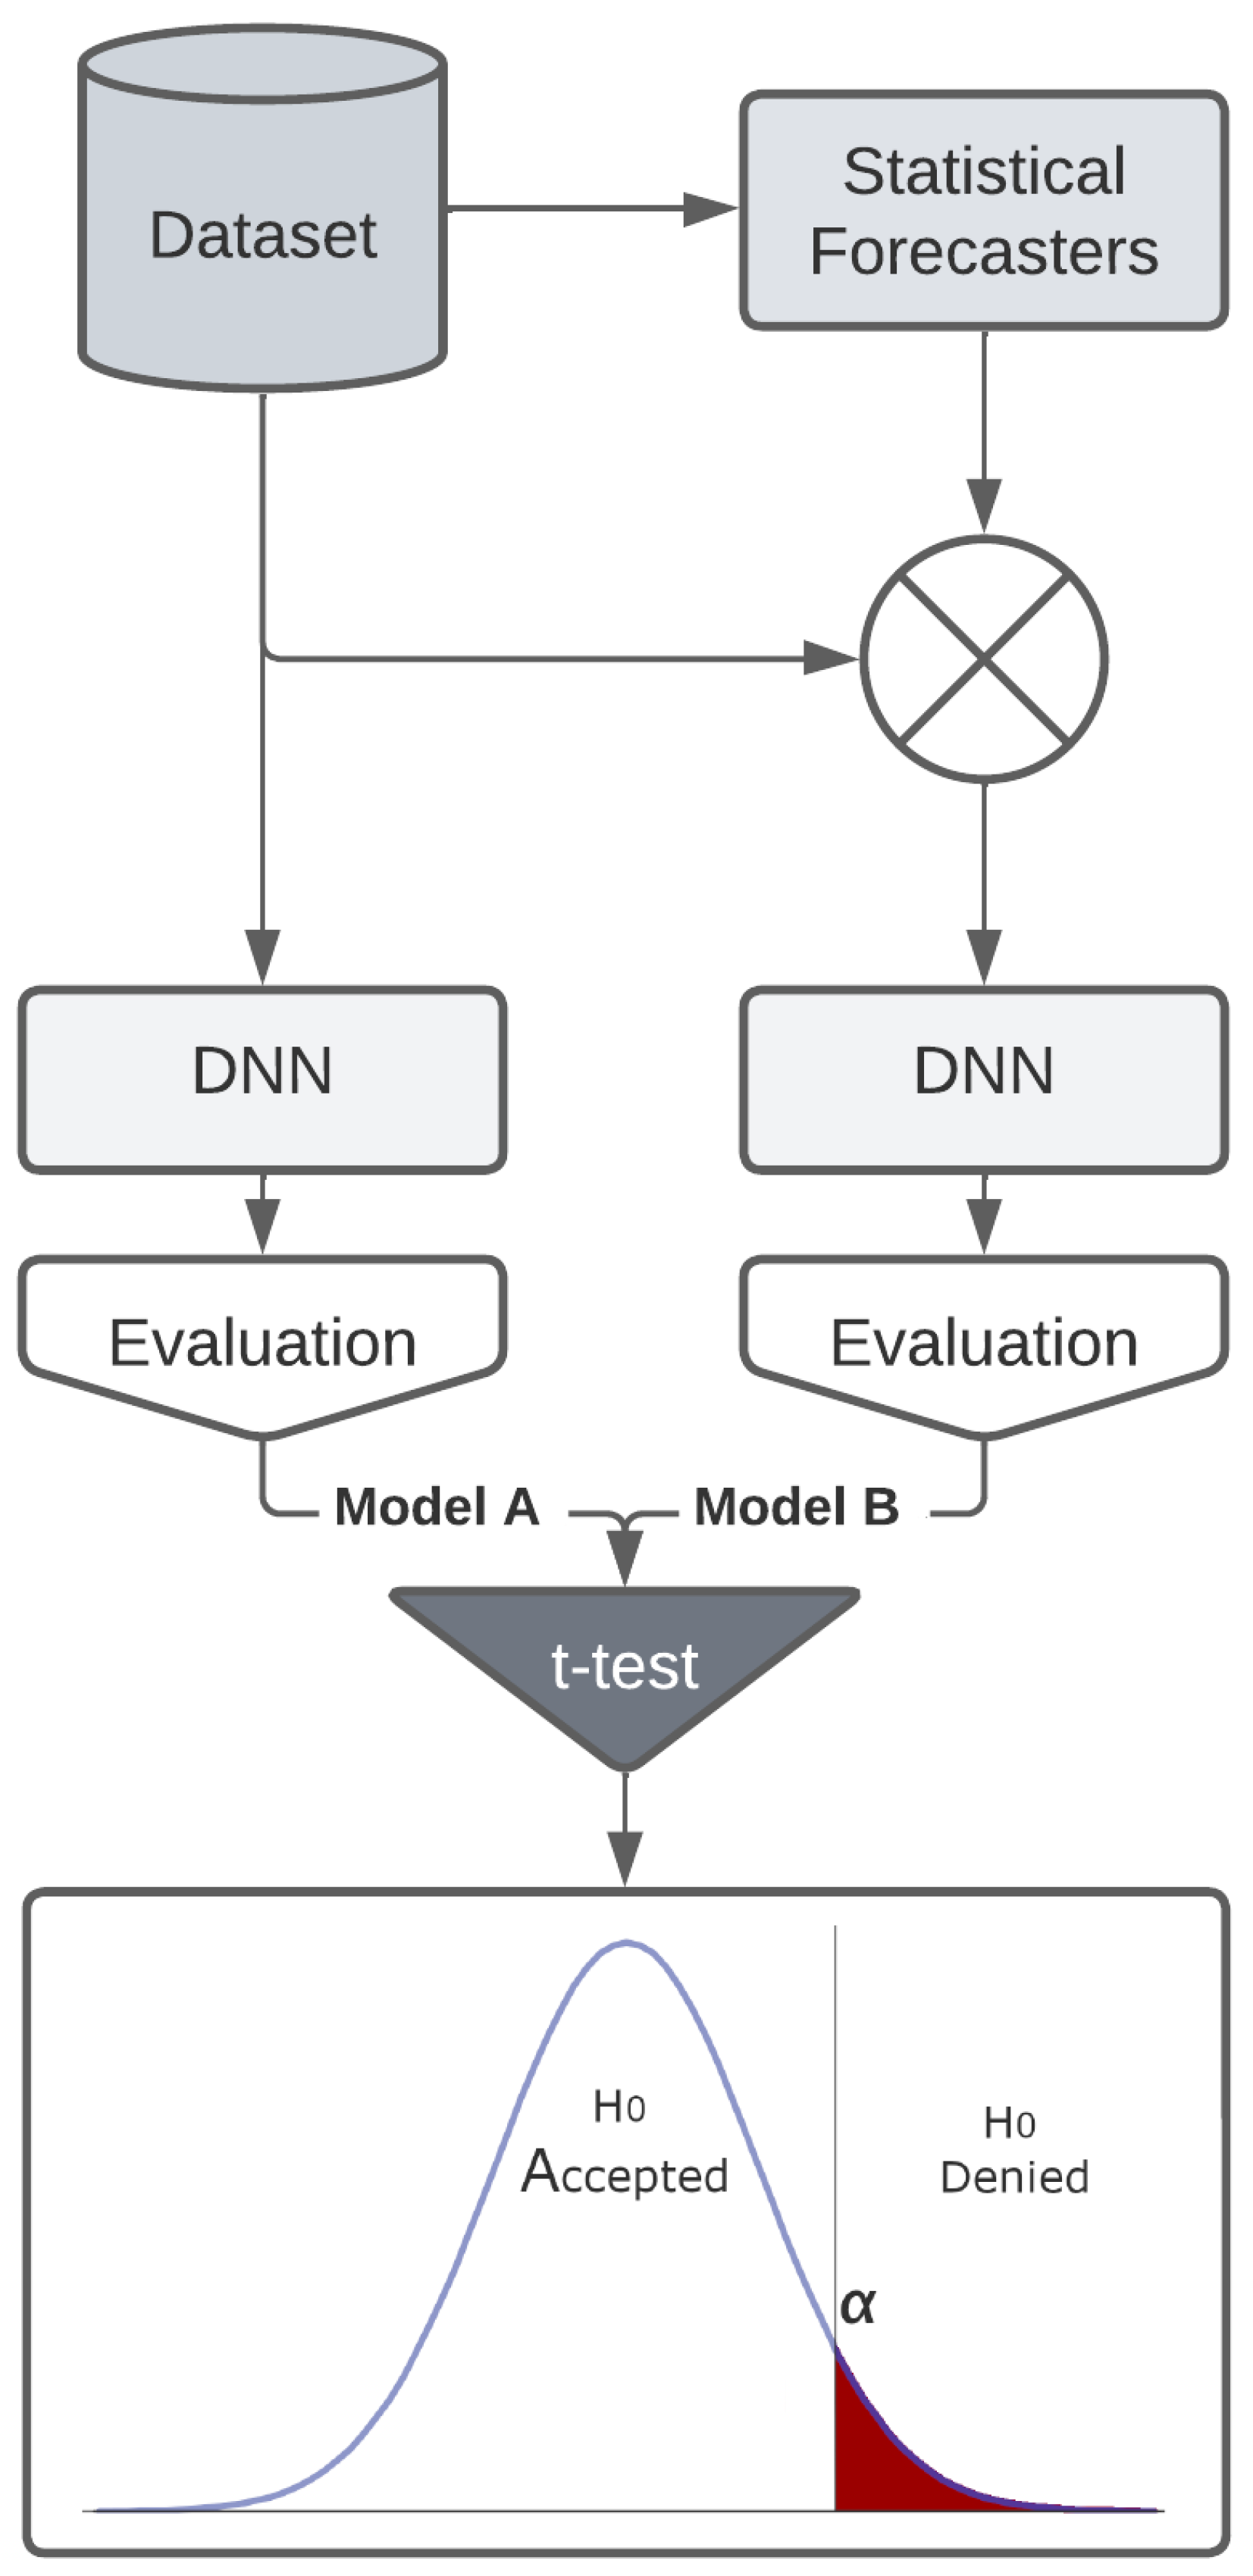

Table 1.
In this table, Sensitivity to outliers refers to how much the metric is impacted by the presence of an outlier in the dataset; Explainability refers to how easy it is to explain the metric in non-technical terms; and Interpretability refers to how easy it is to evaluate a model based on this metric alone. All these three interpretations are qualitative terms defined by the authors to summarize the metrics.
| Sensitivity to outliers | Explainability | Interpretability | |
|---|---|---|---|
| MAE | Low | Medium | Easy |
| MSE | Medium | Hard | Easy |
| SMAPE | High | Easy | Hard |
Table 2.
Summary of Predictive Model Evaluation Results Across Various Datasets.
| Model A | Model B | p-value | t-statistic | ||
|---|---|---|---|---|---|
| MAE | |||||
| MSE | |||||
| M5 | SMAPE | ||||
| MAE | |||||
| MSE | |||||
| Stallion | SMAPE | ||||
| MAE | |||||
| MSE | |||||
| Stock Market | SMAPE | ||||
| MAE | |||||
| MSE | |||||
| Synthetic | SMAPE |
Disclaimer/Publisher’s Note: The statements, opinions and data contained in all publications are solely those of the individual author(s) and contributor(s) and not of MDPI and/or the editor(s). MDPI and/or the editor(s) disclaim responsibility for any injury to people or property resulting from any ideas, methods, instructions or products referred to in the content. |
© 2025 by the authors. Licensee MDPI, Basel, Switzerland. This article is an open access article distributed under the terms and conditions of the Creative Commons Attribution (CC BY) license (http://creativecommons.org/licenses/by/4.0/).
Copyright: This open access article is published under a Creative Commons CC BY 4.0 license, which permit the free download, distribution, and reuse, provided that the author and preprint are cited in any reuse.


