Submitted:
25 June 2025
Posted:
26 June 2025
You are already at the latest version
Abstract
Hurricane Helene made landfall near Perry (Latitude 30.1N) in the Big Bend area of Florida with a central pressure of 939hPa. It moved northwards creating devastating damage and loss of life; however, the greatest damage and number of fatalities occurred well to the north around the City of Ashville (Latitude 35.6N) where extreme rainfall fell and some of the strongest wind gusts were reported. This paper describes the change in the hurricane’s structure as it tracked northwards, how it gathered tropical moisture from the Atlantic and a turning wind profile between the 850hPa and 500hPa elevations which led to such extreme rainfall. This turning wind profile is shown to be associated with extreme rainfall and loss of life from drowning and landslides around the globe. The area around Ashville suffered 157 fatalities which is a significant proportion of the 250 fatalities so far recorded in the whole United Stares from Helene. This is of extreme concern and should be investigated in detail as the public generally expect the greatest impact from hurricanes to be confined to coastal areas near the landfall site. It is another example of increased death tolls from tropical cyclones moving inland and generating heavy rainfall. As the global population increases and inland centres become more urbanised, run off from such rainfall increases which causes greater devastation.
Keywords:
Global extreme rainfall
; high moisture
; wind change
; elevation
; wind gusts
; floods
; landslides
; run off
1. Introduction
The Black Mountains are a range in Western North Carolina in the southeastern United States. They are part of the Blue Ridge Province of the southern Appalachian Mountains and are the highest mountains in the Eastern United States. The southern and western extremes of the Black Mountains run along the Buncombe County line which suffered most damage and loss of life from Helene.
Highest Measured Wind Gusts in the Appalachian Mountains from Hagen et al 2025 were in
The Black Mountains in Yancey County at Mt. Mitchell (Elevation: 2,037m Prominence: 1,856 m) at 1227UTC 27 September 2024, where gusts of 92knots and sustained I minute wind of 70knots were measured. At Watauga County Banner Elk at 1200UTC 27 September 2024 the readings were, 88knots gust (sustained wind 55knots), and in Haywood County Frying Pan Mountain at 1152UTC 27 September 2024 76knots gust (sustained wind 55knots). Gusts were a little weaker In South Carolina where Laurens County Laurens recorded 67knots, Beaufort County Beaufort 65knots, Anderson County Anderson 63knots, Aiken County Aiken 63knots and Pickens County Sassafras Mountain 63knots.
Mt Mitchell is the highest peak in mainland North America east of the Mississippi River, and the 92knots (47.4metres per second) gust recorded there was the second-highest wind gust from Hurricane Helene. The highest measured wind gust was slightly more at 93knots (47.8 metres per second) in the United States recorded during Helene, was measured by a buoy offshore from Florida's west coast.
2. Fatalities in the United States Mainland from Hurricane Helene and ex Hurricane Helene
From Hagen et al 2025, Florida had 18 direct fatalities 16 indirect fatalities totalling 34; Georgia had 28 direct fatalities 9 indirect fatalities and totalling 37; South Carolina 26 direct fatalities 24 indirect fatalities totalling 50; North Carolina 86 direct fatalities 21 indirect fatalities and totalling 107; Tennessee 15 direct fatalities 3 indirect fatalities and totalling 18 ; Virginia 2 direct fatalities 1 indirect fatalities and totalling 3; Indiana 1 direct fatality and nationwide totalled 176 direct fatalities 74 indirect fatalities resulting in 250 fatalities.
Helene is the most devastating natural disaster in western North Carolina’s history and Coast Guard personnel rescued at least 865 people in western North Carolina, mostly from floodwaters. Media reports indicate that the storm damaged or destroyed more than 125,000 housing units across western North Carolina. The North Carolina Forest Service estimated 822,000 acres of damaged timberland, which resulted in $214 million in damages to North Carolina forests. In extreme examples, trees on entire mountainsides were blown down in the higher elevations of North Carolina
2.1. Wind Structure Associated with Inland Freshwater Flooding Around the Globe
Below the following analyses is from Callaghan J. 2017b detailing disastrous events (fatalities 10 or more) which were caused by winds turning in an anti-cyclonic sense with height between 850hPa and 500hPa levels with the wind data obtained from radiosonde data. The exception being the Hurricane Mitch case where the wind data was obtained from reanalyses data. Studies showed that the stronger the winds resulted in heavier rainfall and the anti-cyclonic turning of the winds were between 850 hPa and 500 hPa, the low-level winds had a high moisture content, and the turning angle was approximately 90° or less. Examination of individual events showed that there was a tendency for the turning angle to be smaller than 90° for high rainfall amounts.
2.2. Examples of Extreme Rainfall
Mumbai (Santacruz) recorded 944.mm with 481.2mm in the 4hours to 1300UTC 26 July 2005 and then 708.6mm in the following 7 hours. This extreme rainfall caused 445 fatalities.
Hurricane Mitch slowly moved over land dropping historic amounts of rainfall in Honduras, Guatemala and Nicaragua during October 1998 causing 19,325 deaths.
Seoul 26-28 July 2011 69 fatalities.
Jeddah Saudi Arabia 25 November 2009 122 fatalities and 350 missing.
Zixing China Typhoon Bilis 15 July 2006 843 fatalities.
Chennai India 1 December 2015 280 fatalities.
Chuuk Island Pacific Ocean 2 July 2002 791 fatalities.
Hue and Danang Vietnam 1-4 November 1999 48 fatalities.
Kagoshima Japan 6 August 1993 48 fatalities.
Rapid City South Dakota US 9-10 June 1972 238 fatalities.
Big Thomson River Colorado US 31 August- 1 July 1976 145 fatalities.
Athens Greece 2 November 1977 36 fatalities.
Nimes France 3 October 1988 9 fatalities.
Nimes France 8 September 2002 37 fatalities.
Lisbon Portugal 19 November 1983 10 fatalities.
Casablanca Morocco 29-30 November 2010 32fatalities.
Samsun Turkey 3July 2012 12 fatalities.
Beijing China 21 July 2012 79 fatalities.
Shanghai and Hangzhou 6-8 October 2013 12 fatalities.
Wenjiang China 10 July 2013 73 fatalities 180 missing.
Hyderabad India 23-24 August 1980 140 fatalities.
Hyderabad India 8-9 August 2008 30 fatalities.
Hanoi 30-32 October 2008 66 fatalities.
2.3. Other Examples of Extreme Rainfall
Hurricane Ida (2021) caused catastrophic flooding in New York City and New Jersey where the hourly rainfall record was broken at Central Park Manhatton. The GFS winds at 00Z 2 Sept 2021 over Central Park in New York were 850 hPa 160/50knots, 700 hPa 180/60knots and 500 hPa 195/60knots which is of course very strong turning in an anti-cyclonic sense. The nearest radiosonde station at Upton on Long Island at 0000UTC 2 September 2021 had the same vertical turning structure but from the model data further to the east of the maximum winds near Central Park on Manhattan :-
850 hPa 175/26knots 700 hPa 190/48 knots 220/52knots.
Central Park recorded rainfall of 80.01mm in 1hr to 0151UTC 2 Sept 2021. Forty-Five people drowned in the floods generated by this extreme rainfall.
Below are references to other extreme rainfall events in Australia and the United States associated with this wind structure.
3. Methods, Analysis of Vertical Wind Structure and Buoyancy
We have investigated winds turning anticyclonic (anticlockwise in the Southern Hemisphere or clockwise in the Northern Hemisphere) from the 850hPa level up to the 500hPa level. This wind structure is associated with tropical cyclone intensification in the tropics and extreme rainfall both in the tropics and in higher latitudes. For brevity we call this wind structure Warm Air Advection (WAA) due to it having similar turning with height characteristics of Quasi Geostrophic warm air advection (Holton 2004). Examples of this wind structure causing extreme rainfall and being associated with tropical cyclone intensification can be found in Tory 2014, Callaghan and Tory 2014, Callaghan and Power 2016 and Callaghan 2017a, 2017b, 2018, 2019a, 2019b, 2020a ,2021a, 2021b, 2022c, 2022, 2023 and 2024. Such WAA has a wind structure that produces streamwise vorticity (Davies-Jones 1985) encouraging rotating updrafts which separate updrafts from the destructive effects of downdrafts. Shallower WAA to 700hPa in tropical air masses can also produce extreme rainfall and flooding from enhanced thunderstorms (Callaghan and Power 2016 and Callaghan 2017b).
The common summer wind pattern off the Northeast Australian Coast is the opposite to the WAA pattern and we refer to it as cold air advection (CAA) and this wind structure which contributes to convective suppression. This was illustrated in Figure 2 of Callaghan (2021b) which shows the winds turning clockwise (cyclonic SH) with height over the area on average through January, February, and March. The rainfall associated with this pattern is light rain with the heavy rain located further north in the monsoon trough across the Gulf of Carpentaria and Cape York. The author spent the active La Nina 1973/1974 summer on Willis Island Meteorological station in the Coral Sea and with monotonous regularity when south of the monsoon trough, the radar balloon flight showed a CAA structure with low level southeast winds turning clockwise with height through southerly winds up to south-westerly at 500hPa. During this time only light rainfall was observed. It was only when a vortex developed, or an upper trough system extended up into the tropics (see example Appendix I Callaghan 2021b) that a pattern conducive to heavy rainfall was observed. In those cases, because the most common 850 to 500hPa vertical wind shear was westerly, a dipole structure was produced with WAA and ascent in the east and CAA and descent in the west.
In the Queensland Severe Weather Section of the Bureau of Meteorology a diagnostic for WAA and heavy rain and TC intensification was developed using 850hPa, 700hPa and 500hPa winds from the European Forecasting Model. This became possible from the 1990s when computer forecasting models became freely available. This clearly showed to us the relationship between WAA and heavy rain and TC intensification. This relationship was first posted in Callaghan and Tory 2014 and the paper used data from Holland (1984) to show that intensifying tropical cyclones in the Australian/southwest Pacific region had an asymmetric convective structure associated with WAA when considering the climatological winds at 850hPa and 500hPa and moisture data.
Previous studies (Callaghan and Tory 2014; Tory 2014; Callaghan and Power 2016) examined winds associated with extreme rainfall in both the tropics and the mid-latitudes of Australia. Further studies (Callaghan 2017a, 2019) found this to apply in many cases around the globe. Theoretical arguments (Tory 2014) suggest, assuming gradient wind balance, that isentropic uplift is likely to be associated with winds that turn anticyclonically with height in most heavy rain-bearing systems, including the tropics and subtropics. Two Australian studies (Callaghan and Power 2014, 2016) examined extreme rainfall and major flooding events in coastal catchments and more broadly over southeastern Australia. Using radiosonde and reanalysis data they examined the vertical structure of these systems in the period for which upper wind data became available and found WAA wind patterns were associated with extreme rainfall.
The two forcing terms in the Quasi Geostrophic Omega equation are the vertical derivative of cyclonic vorticity advection and the thermal advection term. The vorticity terms tend to dominate except when there is a slope to the system under investigation and then thermal advection dominates in forcing up motion (Trenberth 1978). This can be understood considering a vertical stacked system would consist of unidirectional winds and have no turning winds with height and when the system slopes the winds that begin to turn anticyclonic with height on one side of the system producing the WAA structure . Holton 2004 came to similar results when he analysed winds in a sloping 3-layered model.
4. Results
4.1. The track of Hurricane Helene
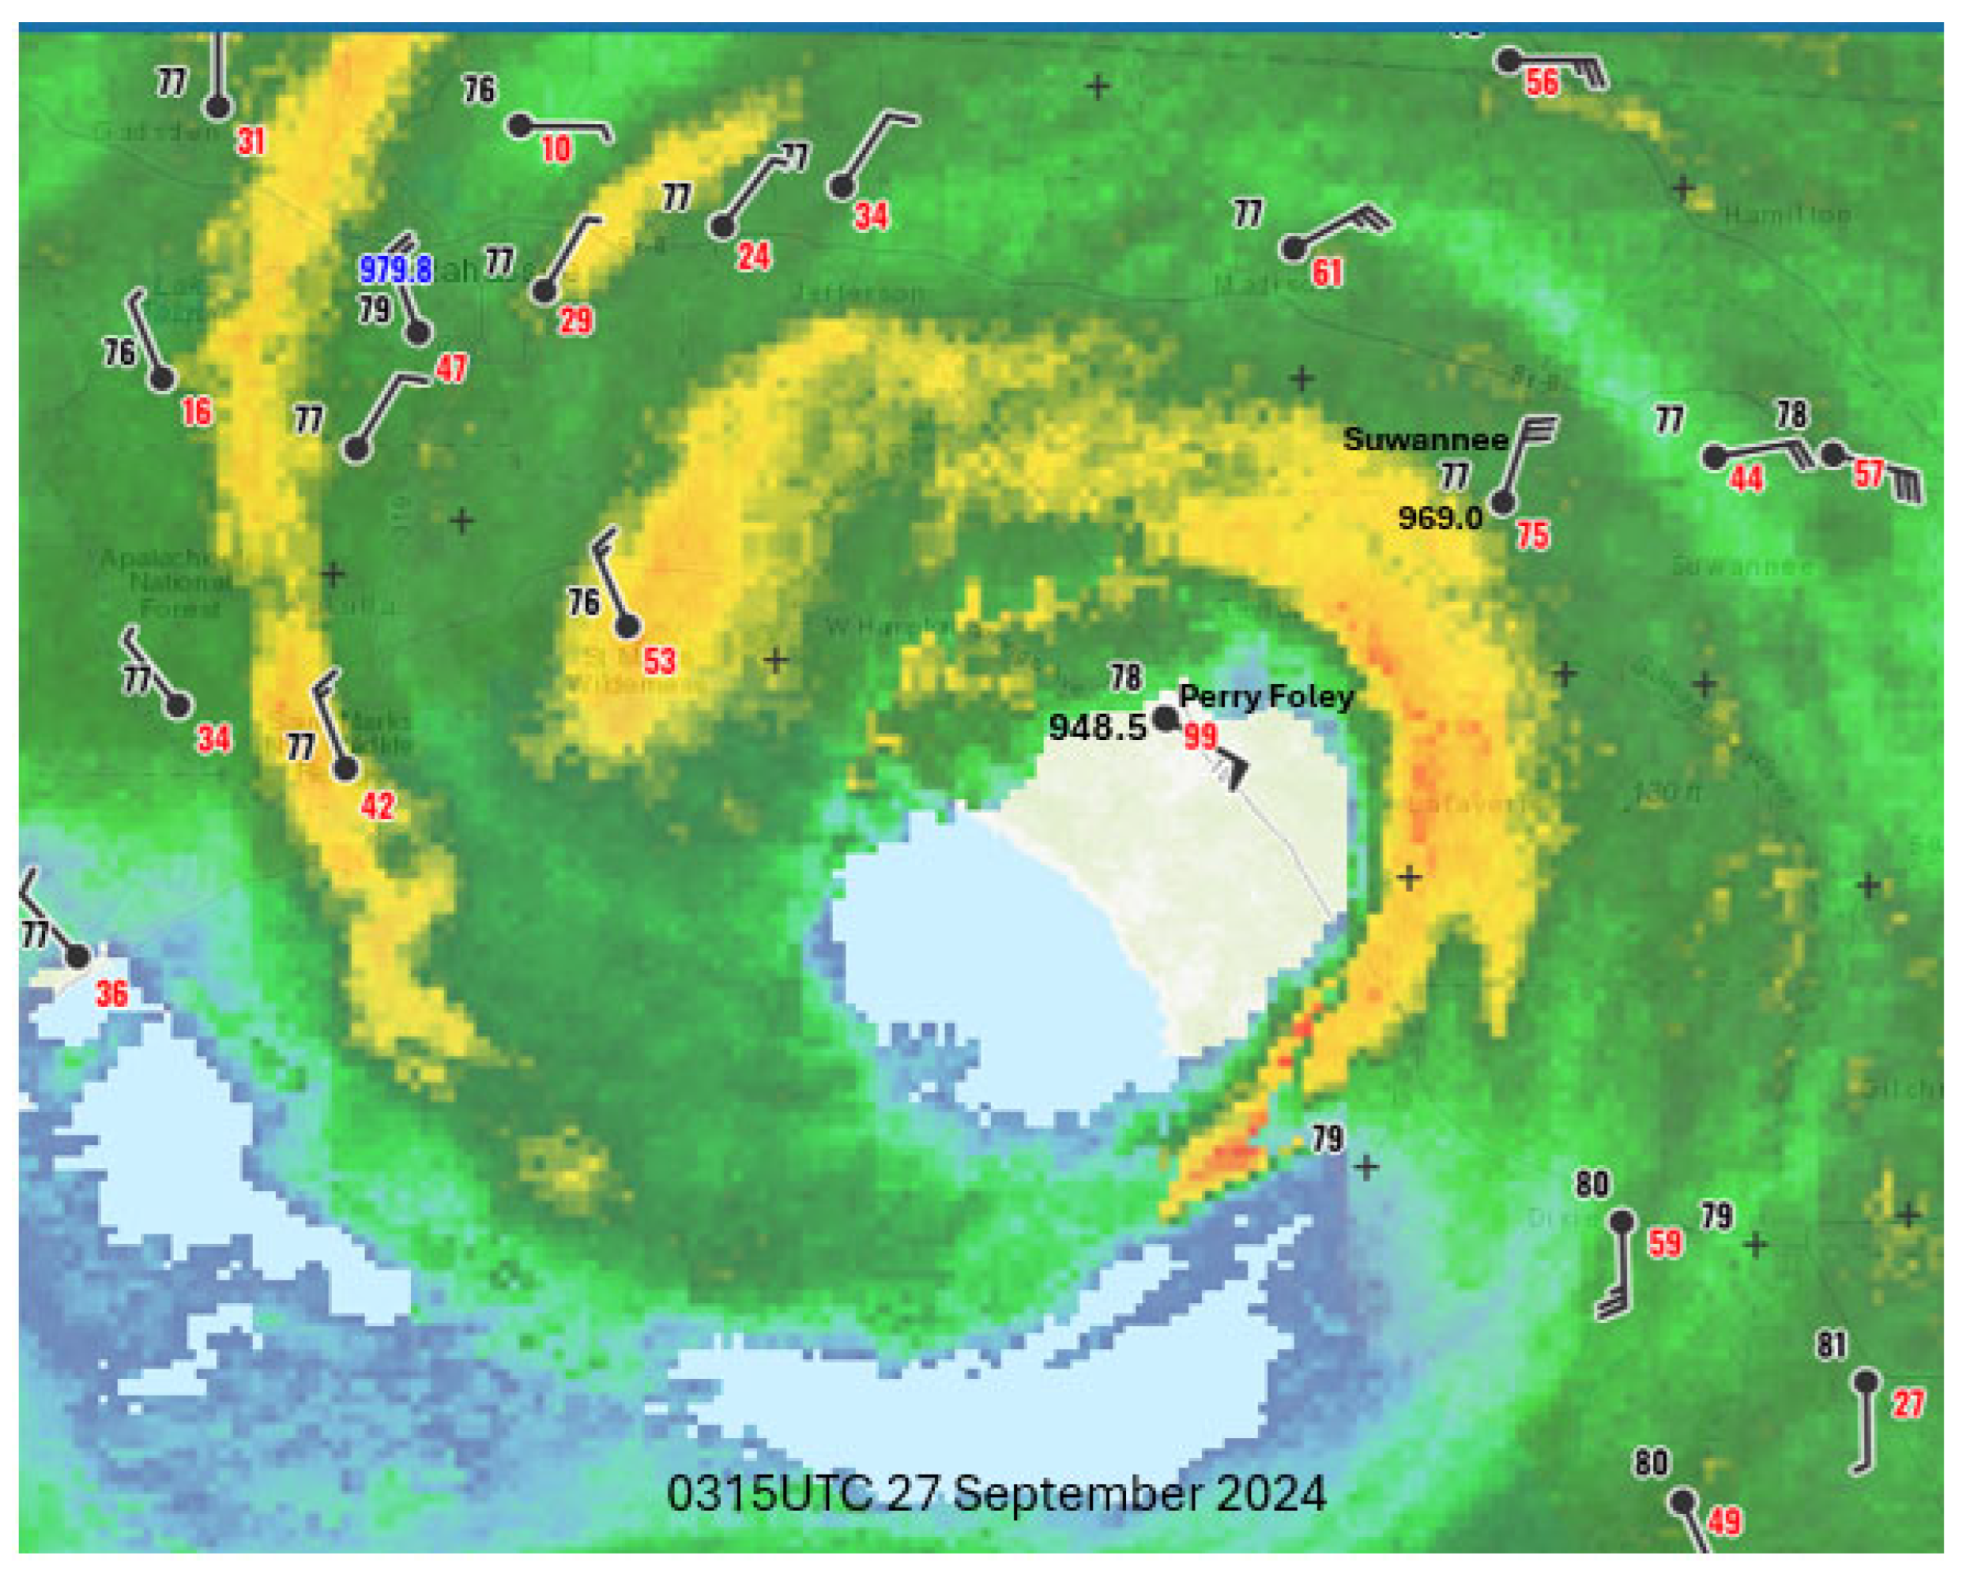
The track of Helene showing its intensity at various intervals is shown in Figure 1 indicating it lost hurricane intensity as it passed Savanah (Georgia) and weakened further as it crossed the Appalachians despite this region suffering the most damage from the storm. Hurricane Helene reached peak intensity with a minimum barometric pressure of 938 hectopascals at 3:10 UTC on September 27 as it made landfall around 16m west-southwest of Perry Florida. Figure 2 shows the eye just after it began moving over Perry with the mean sea level pressure there reading 948.5hPa. Helene then moved towards the north northeast and then northwards into Georga claiming 37 lives and causing severe damage. however, this study focusses on the impact of Helene on Northwest Carolina and nearby eastern Tennessee.
Figure 1.
of Hurricane Helene from the Gulf of Mexico across the Appalachians up to Kentucky. Solid circles mark the position of Helene as a hurricane where open circles mark its positions post hurricane. Each position is notated with the date time (UTC) and the central pressure (hPa) and maximum wind speeds in knots.

Figure 2.
The eye of Helene at 0315UTC 27 September 2024 shortly after landfall with the observation at Perry Foley Airport.
Figure 2.
The eye of Helene at 0315UTC 27 September 2024 shortly after landfall with the observation at Perry Foley Airport.
In Figure 3 the centre at 0800UTC 27 September 2024 was located near the town of Eastman in Georgia where the mean sea level pressure was recorded as 967.8hPa. The surface dewpoint isopleths are plotted, and high moisture (23degrees Celsius) reached Greenville in South Carolina. Overall tropical moisture can be seen over Georgia, Carolina and Northern Florida. An hour later Helene was moving through Northern Georgia with the tropical moisture creeping towards the Blue Ridge Mountains (Figure 4). By 1200UTC 27 September (Figure 5) the storm begins to move over the Blue Ridge Mountains and south southwest of Asheville dragging the tropical moisture with it.
4.2. Rainfall and Flooding in the Asheville Area
The heavy rainfall in the Asheville area is highlighted in Figure 6. Asheville is the centre of Buncombe County and as of Oct. 27, major damage has been reported to 601 residential and 241 commercial buildings in Buncombe County. Another 294 residential and 153 commercial buildings in the county were destroyed. Located 30.6km northeast of Asheville is Mount Mitchell. This is the highest peak of the Appalachian Mountains (Elevation: 2,037m Prominence: 1,856 m) and the highest peak in mainland North America east of the Mississippi River. Wind gusts reached 92knots (47.4metres per second) on Mount Mitchell which was the second-highest wind gust from Hurricane Helene. The highest wind gust was slightly more at 93knots (47.8 metres per second) in the United States recorded during Helene, was measured by a buoy offshore from Florida's west coast.
The heaviest rainfall recorded during Helene was from Busick on the east-southeast slopes of Mount Mitchell. Water from the Mount Mitchell area drained southwards into the Swannanoa River and northwards into the Nolichucky River. South of Asheville in Figure 6 heavy rain can be seen to have been recorded which drained into the French Broad River which met the flow from the Swannanoa River at Asheville. This confluence of major floods in these two rivers produced catastrophic conditions at Asheville. During the height of the storm the French Broad River crested at 24.67 ft (7.52 m), and the Swannanoa River reached 26.1 ft (8.0 m), both higher than the all-time records set by the Flood of 1916.
The highest observed rainfall total was in Busick, North Carolina, where 30.78 inches (781.8mm) recorded from 1200 UTC 25 September to 1200 UTC 28 September. From Hagen et al (2025) an NWS Cooperative Observer Program (COOP) observer near Celo, North Carolina measured 26.65 inches (676.9mm) of rain. Both of those sites are in Yancey County. Farther south, a rainfall total of 29.98 inches (761.5mm) was measured in Transylvania County, a short distance north of the South Carolina border. A Hydrometeorological Automated Data System (HADS) site at Sunfish Mountain in Greenville County, South Carolina, measured 21.66 inches (550.2m) of rain. Available observations indicate that rainfall amounts more than of 18 inches (457.2mm) occurred across portions of Transylvania, Henderson, Buncombe, Polk, McDowell, Yancey, Mitchell, Burke, Avery and Watauga Counties in North Carolina, as well as in northern Pickens and northern Greenville Counties in South Carolina.
A large area stretching from northwestern South Carolina into western North Carolina and southwestern Virginia received 3-day rainfall totals that had less than a 1 in 1000(<0.1% ) chance of occurring in any given year.
A few other notable rainfall maxima occurred with Helene. Amounts as high as 12 to 13 inches were observed within the Atlanta metro area, which has just a 0.2% to 0.5% chance of occurring in any given year. Atlanta Airport recorded 105mm from 1800UTC 26 September to 0600UTC 27 September and 82.1mm 0600UTC to 1200UTC 27 September. The radiosonde data in the vicinity of Atlanta (station identifier FFC) shows a WAA pattern 0000UTC 26 September (Figure 11 below) and at 0000UTC 27 September (Figure 13).
Figure 7 records the fatalities in the Counties in Northwest Carolina and note that they are mostly clustered around the Asheville area in Buncombe. The heavy rain from the Mount Mitchell region as mentioned above flowed into the Nolichucky River which surged into Tennessee and from Figure 8 the highest number of fatalities there were at Erwin on the Nolichucky River. Ultimately the French Broad River and Nolichucky Rivers merged and became the Tennessee River eventually flowing into the Mississippi. The Catawba and Broad Rivers marked in Figure 6 eventually flowed into South Carolina and Figure 9 shows the fatalities in Counties in that state. They resulted mostly from the rivers draining out of Northwest North Carolina (Saluda, Broad and Catawba Rivers). The Source of the Saluda River was near Rocky Bottom in Pickens County (see Figure 9) which recorded 21.66 inches (550mm) during Hurricane Helene. Rocky Bottom lies just inside the border of South Carolina south of Transylvania County in North Carolina. Various cities and towns in Pickens County received the highest level of rainfall in South Carolina. Table Rock experienced a total of 16.51 (419mm) inches of rain and Liberty saw 13.12 inches (333mm).
5. Vertical Wind Structure of the Rainfall
Figure 11 shows the reanalysis charts at 0000UTC 26 September 2024 with wind corresponding observations from radiosonde data and the station identification highlighted in red indicate ascent from the winds turning clockwise (anticyclonic) in direction from 850hPa up to 500hPa. The rainfall station of Busick (maximum known rainfall) is highlighted in white. Reanalysis wind plot near Busick show the wind turning from southerlies at 850hPa to south-southwesterlies at 700hPa to a more south-westerly direction at 500hPa which indicated ascent in the vicinity of Busick. The position of Helene is denoted by a black X.
Figure 12 shows the reanalysis charts at 1200UTC 26 September 2024 with wind corresponding observations from radiosonde data and the station identification highlighted in red indicate ascent from the winds turning clockwise (anticyclonic) in direction from 850hPa up to 500hPa. Reanalysis wind plot near Busick show weakened ascent winds with contrary turning from 850hPa to 700hPa and nearby radio stations indicate lack of an ascent structure. This was occurring during the lowest rainfall at Busick and from Figure 9 the lowest rainfall intensity occurred around this time with 1.81ins (45.9mm) in the 6hours to 1017UTC 26 September 2024 and 0.18 ins (4.6mm) on 26 September from 1317UTC to 1417UTC. Further south radiosonde stations indicated ascent as did the reanalysis winds.
Figure 11.
Reanalysis winds for 0000UTC 26 September 2024 at 850hPa (top left ) 700hPa (top right) and 500ha (lower frame) with radiosonde station winds plotted and ascent denoted by station identification in red. Wind plots highlighted near Busick for clarity.
Figure 11.
Reanalysis winds for 0000UTC 26 September 2024 at 850hPa (top left ) 700hPa (top right) and 500ha (lower frame) with radiosonde station winds plotted and ascent denoted by station identification in red. Wind plots highlighted near Busick for clarity.
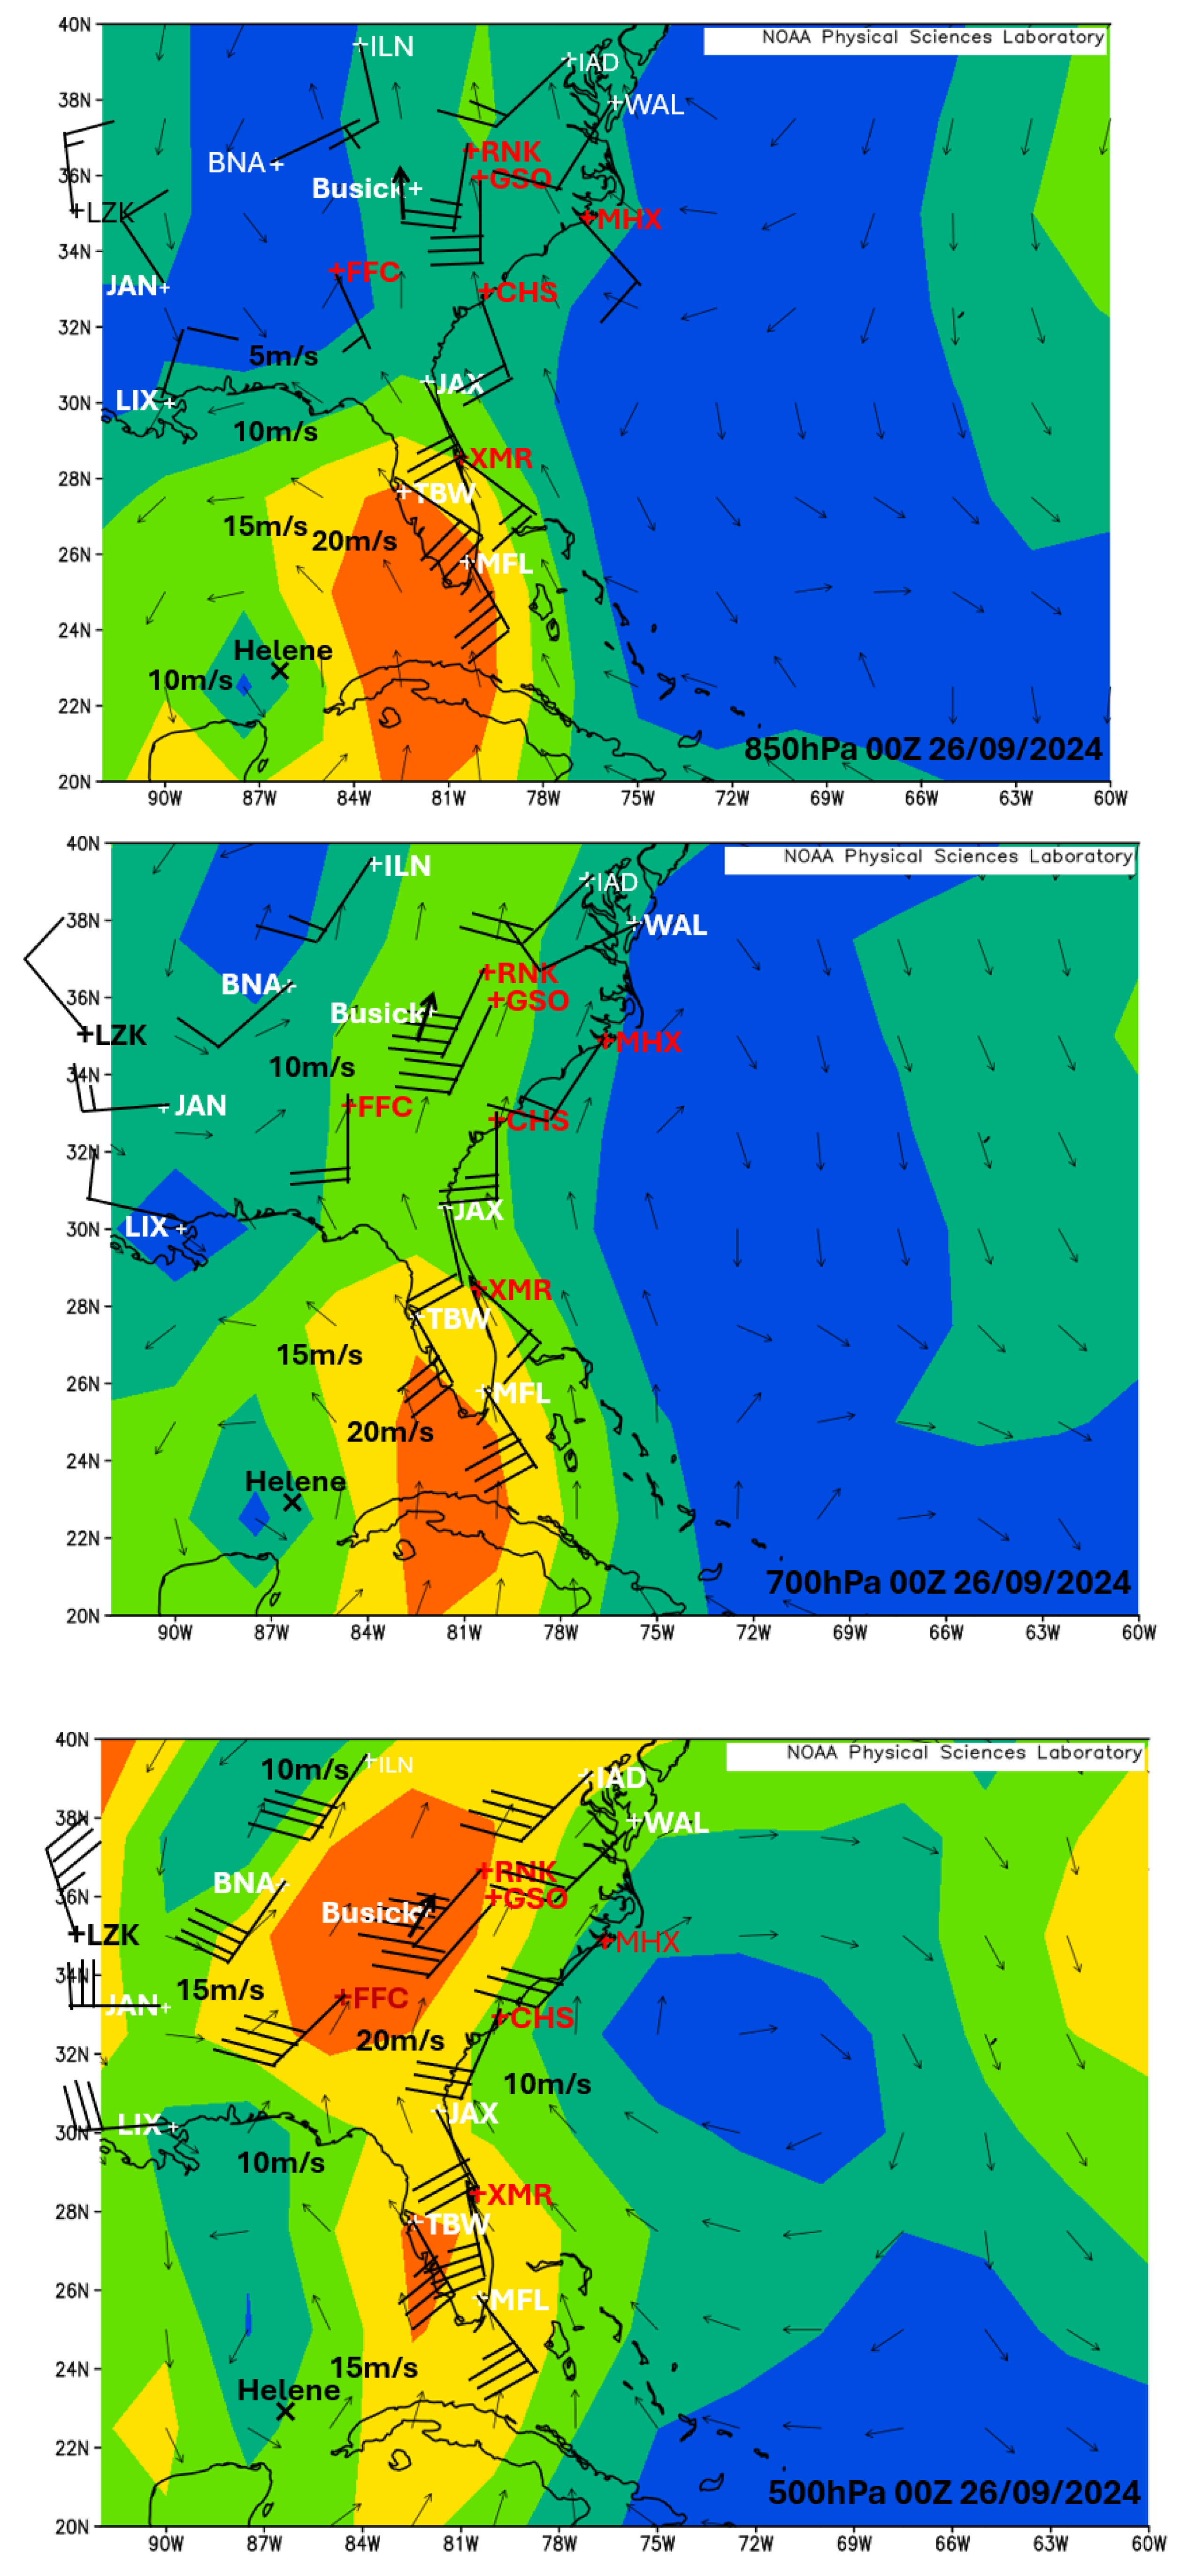
Figure 12.
Reanalysis winds for 1200UTC 26 September 2024 at 850hPa (top left ) 700hPa (top right) and 500ha (lower frame) with radiosonde station winds plotted and ascent denoted by station identification in red. Wind plots highlighted near Busick for clarity.
Figure 12.
Reanalysis winds for 1200UTC 26 September 2024 at 850hPa (top left ) 700hPa (top right) and 500ha (lower frame) with radiosonde station winds plotted and ascent denoted by station identification in red. Wind plots highlighted near Busick for clarity.
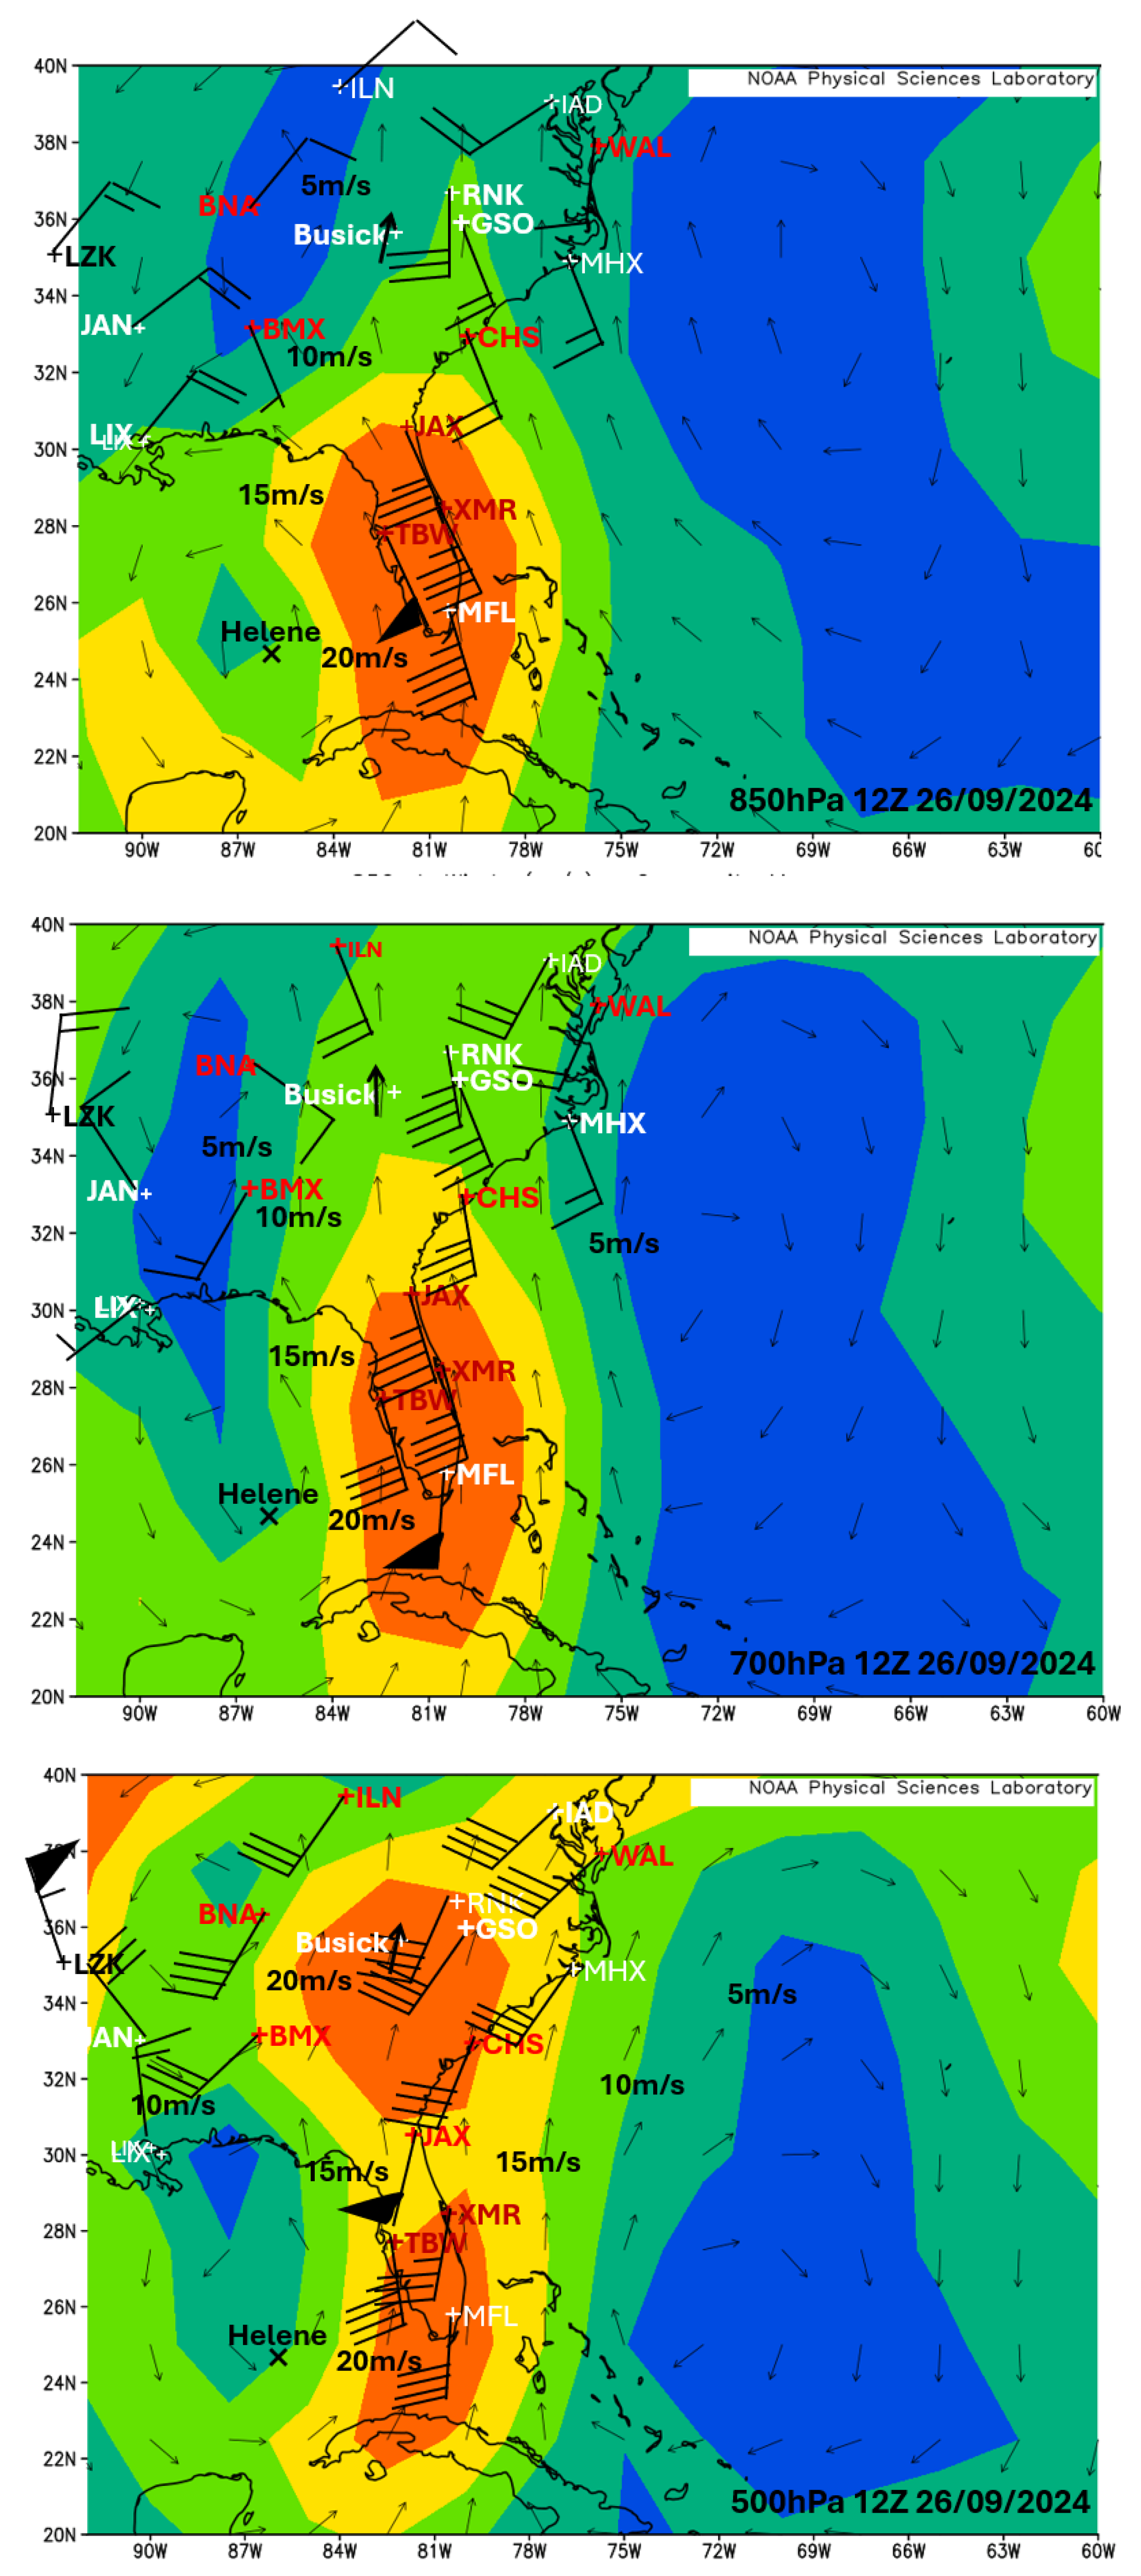
Figure 13.
Reanalysis winds for 0000UTC 27 September 2024 at 850hPa (top left ) 700hPa (top right) and 500ha (lower frame) with radiosonde station winds plotted and ascent denoted by station identification in red. Wind plots highlighted near Busick for clarity.
Figure 13.
Reanalysis winds for 0000UTC 27 September 2024 at 850hPa (top left ) 700hPa (top right) and 500ha (lower frame) with radiosonde station winds plotted and ascent denoted by station identification in red. Wind plots highlighted near Busick for clarity.
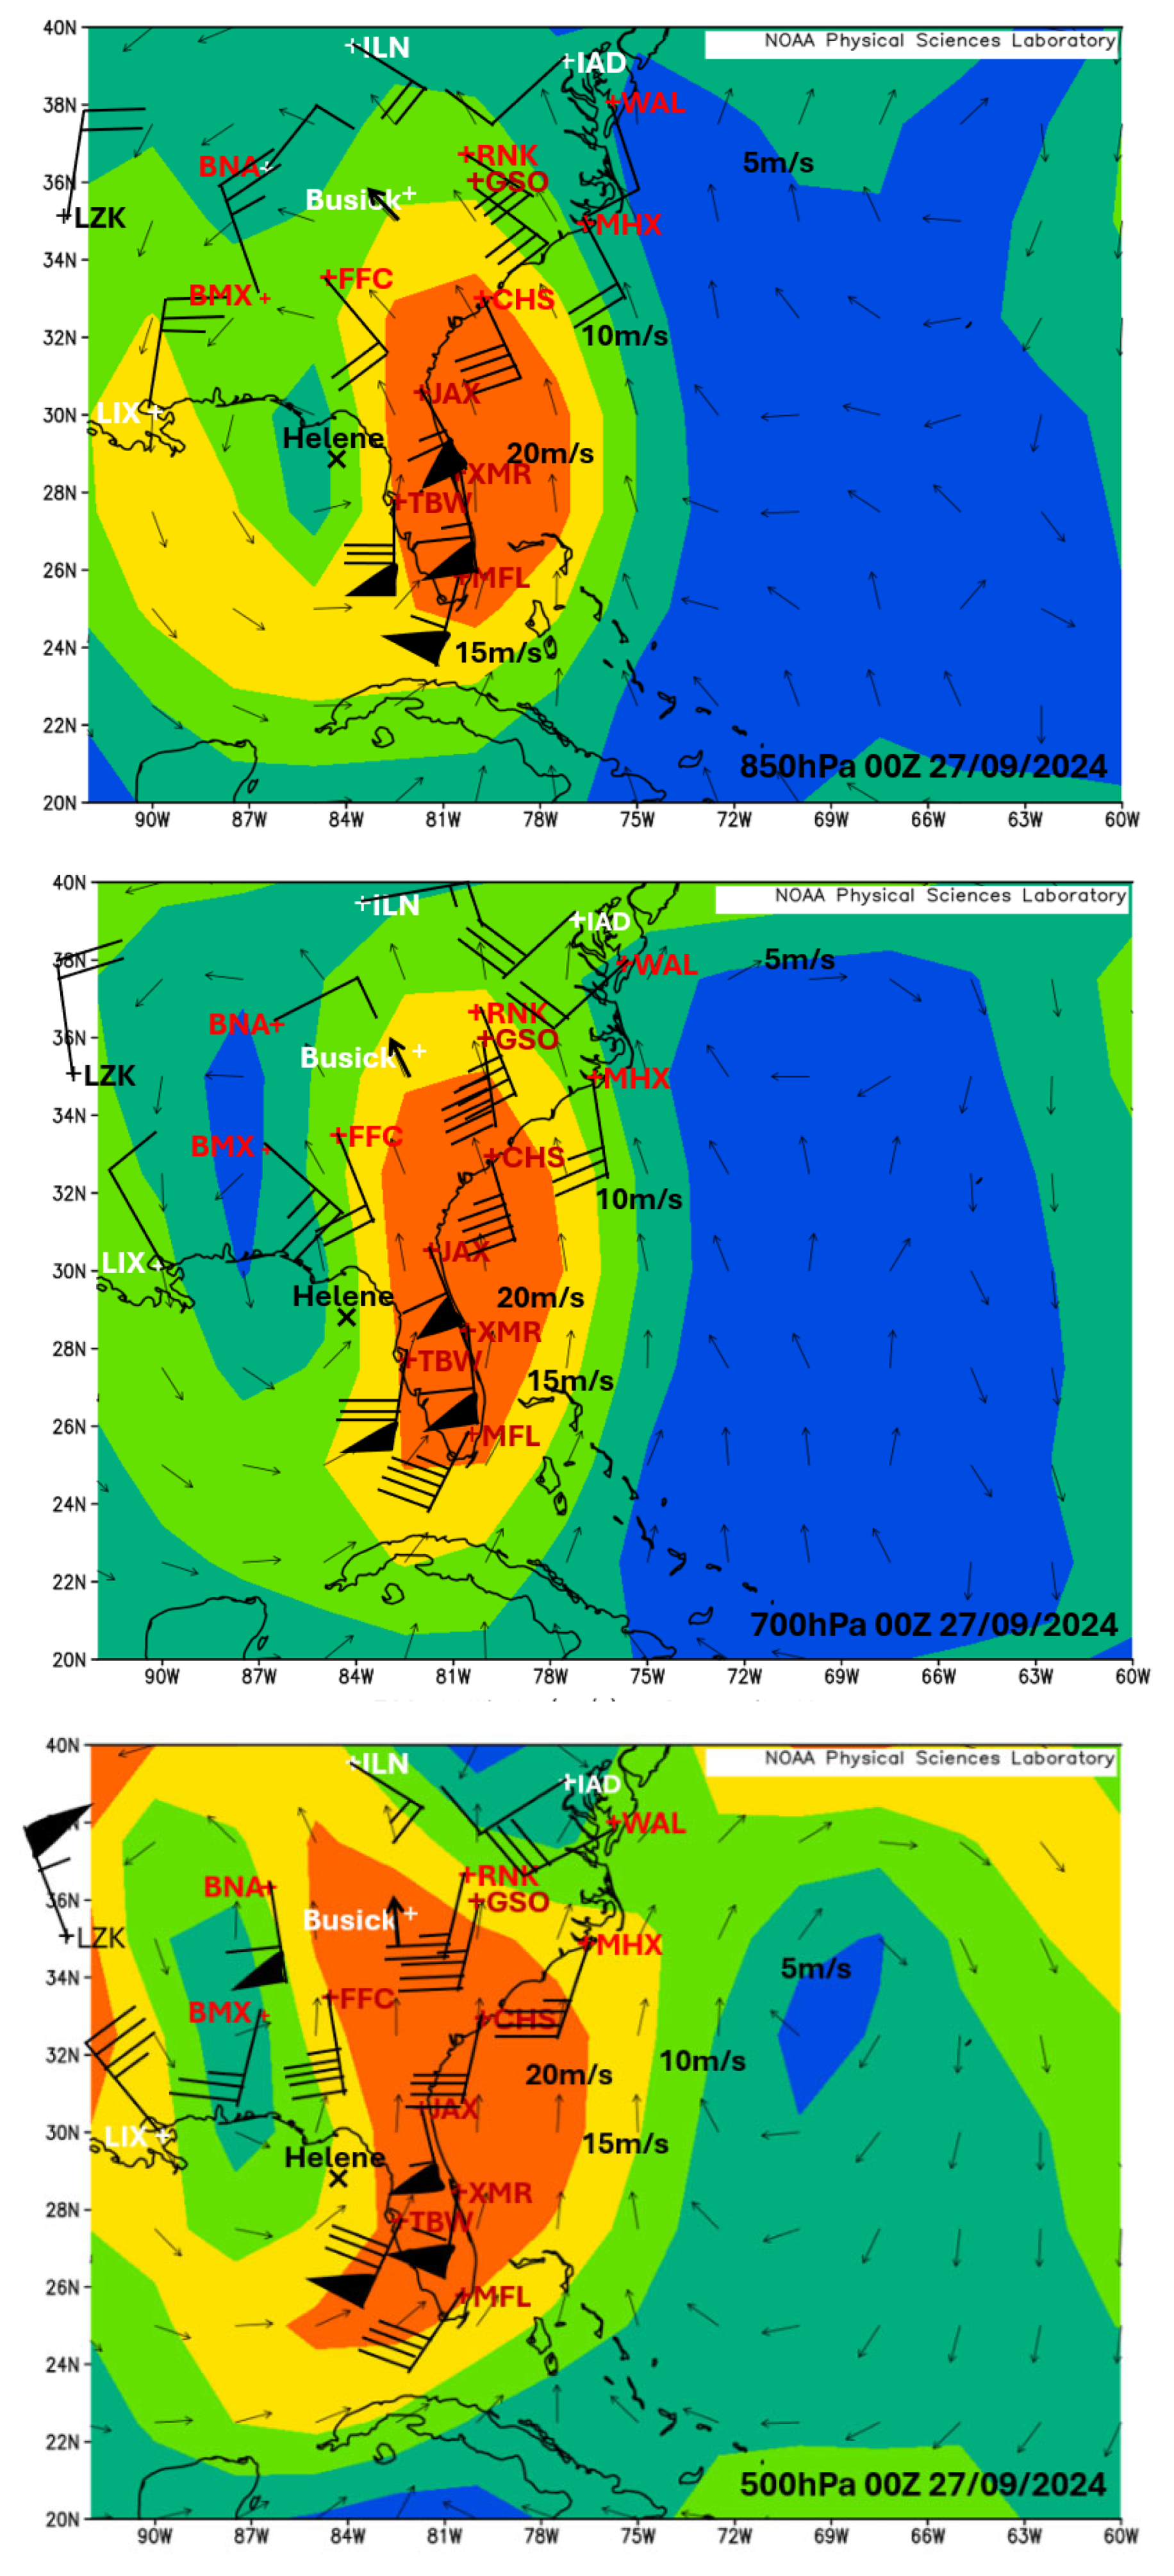
From Figure 13 the ascent type wind structure at 0000UTC 27 September 2024 resumed in the reanalysis winds at Busick (southeast winds turning to south-southeast to southerly winds from 850hPa up to 500hPa). The surrounding radiosonde stations also indicated ascent all the way south to Florida. From the hourly rainfall data at Busick heavy rain there was recorded there with 5.73ins (145.5mm) in 9hr to 0717UTC 27/09/2024.
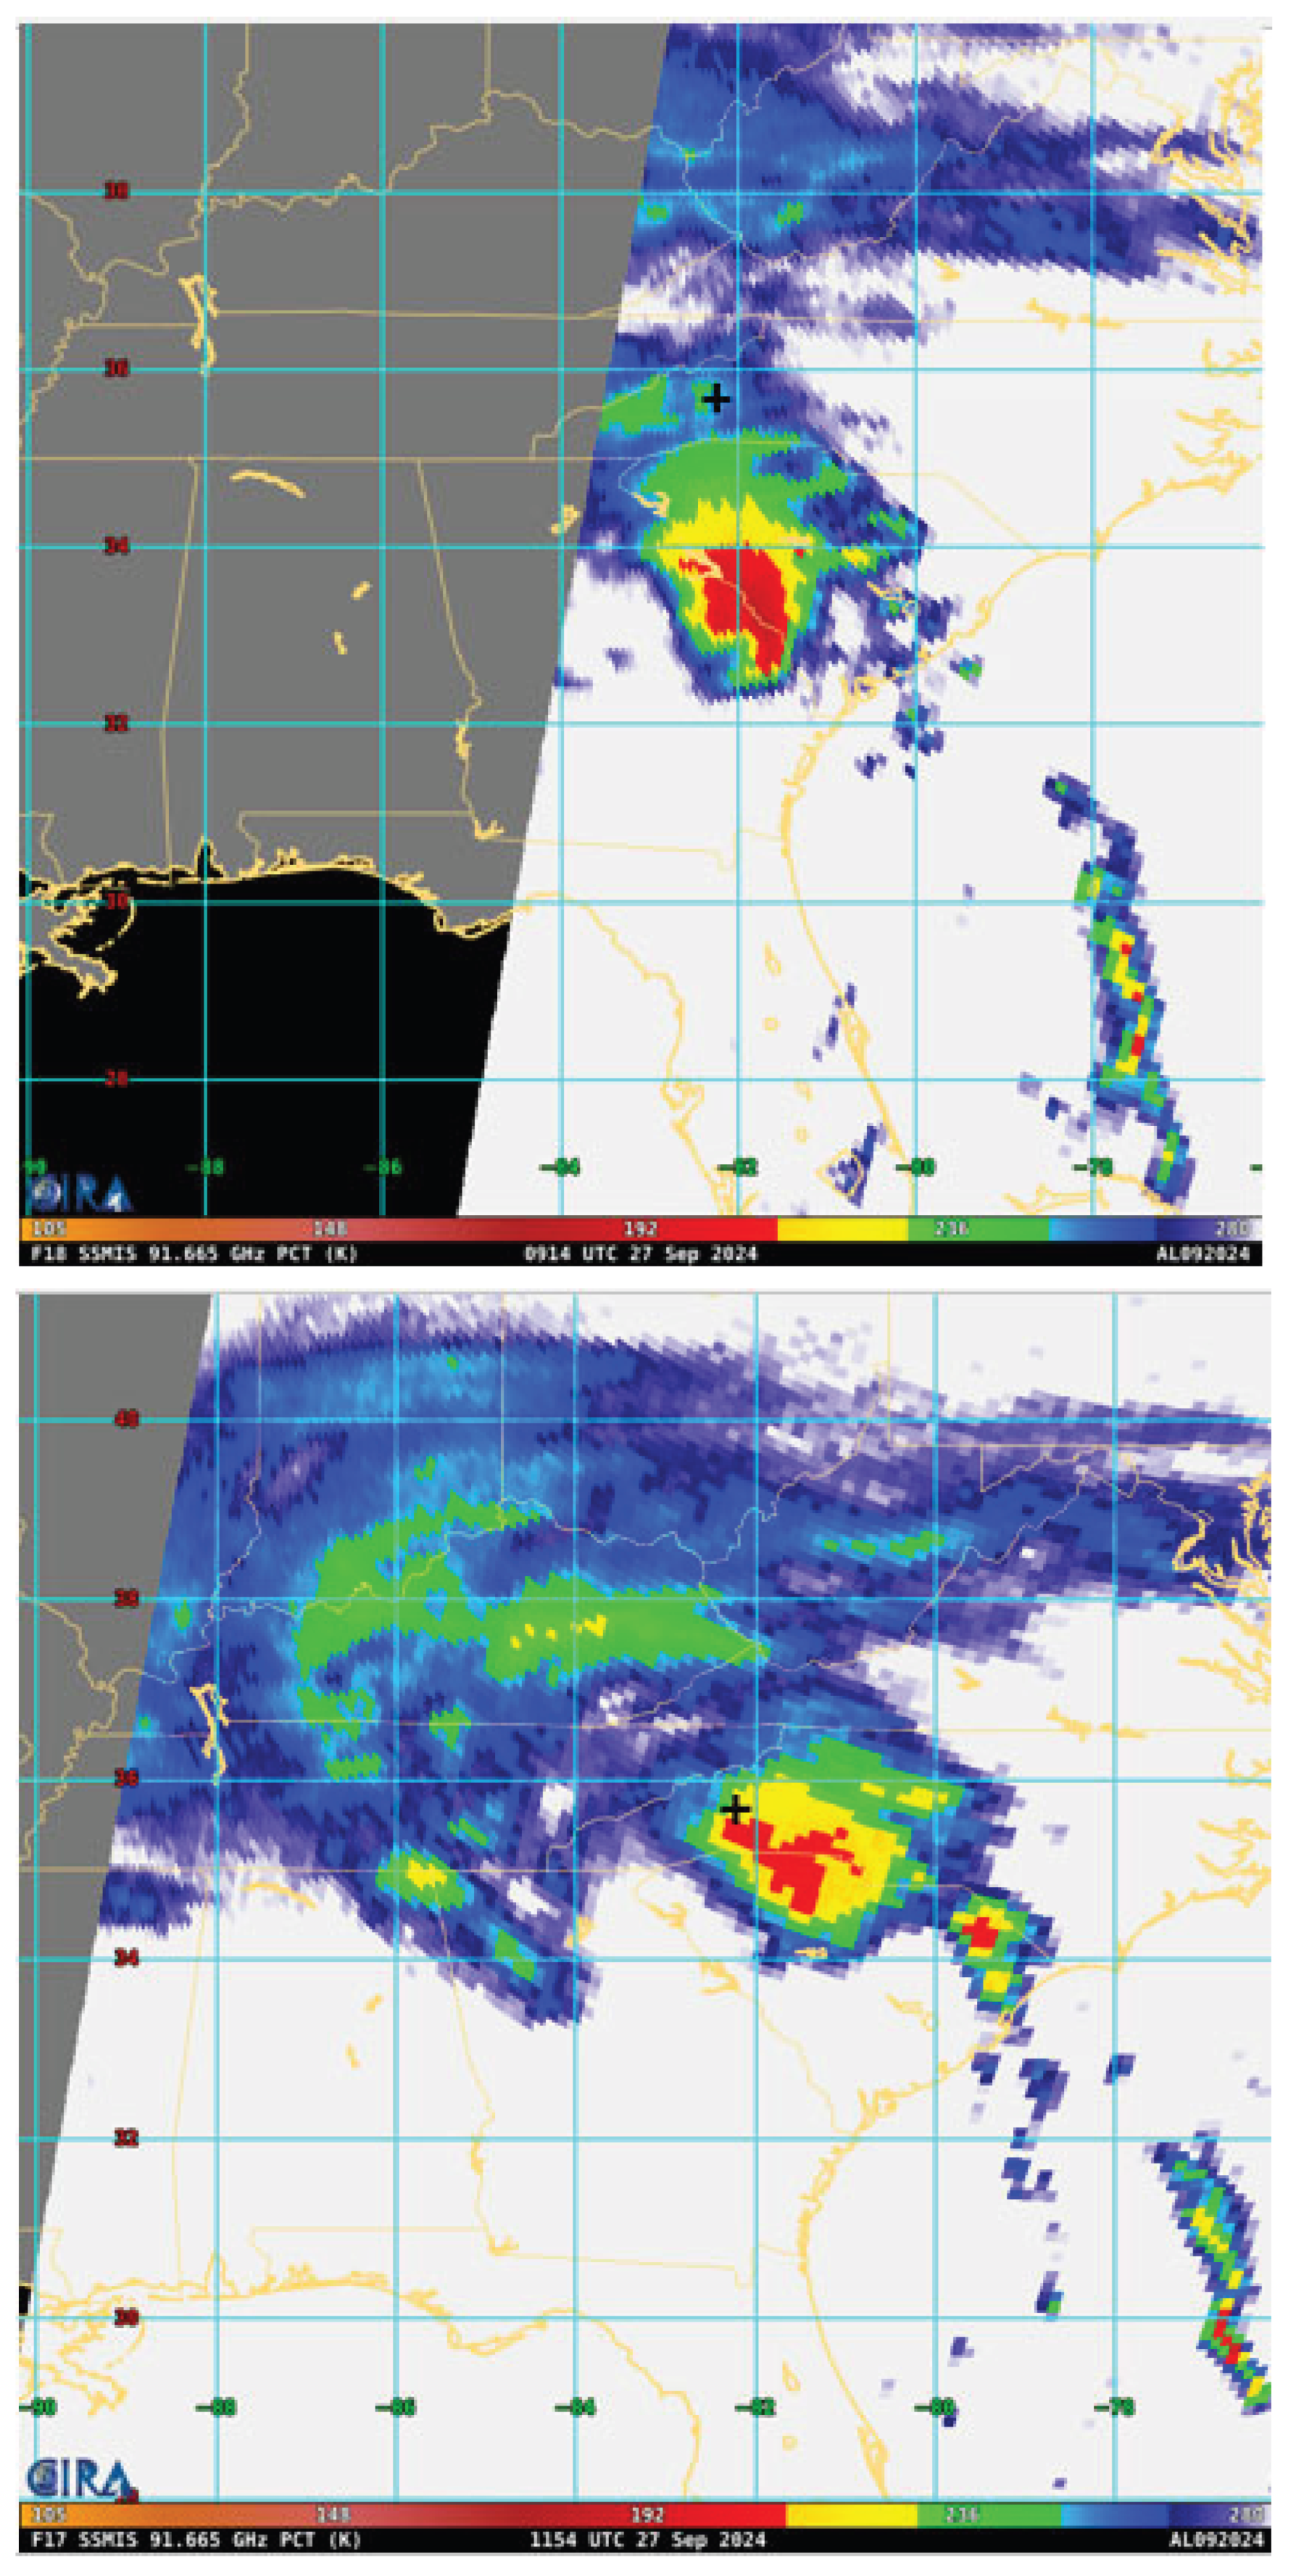
From Figure 14 the ascent type wind structure at 1200UTC 27 September 2024 continued in the reanalysis winds at Busick (southeast winds turning to south-southeast to southerly winds from 850hPa up to 500hPa). The surrounding radiosonde stations with ascent were now located further north. From the hourly rainfall data this was the heaviest rainfall at Busick 10.31inches (261.9mm) in 6hrs to 1417UTC 27 September 2024. From Figure 14 images of 85 – 92 GHz Polarization-Corrected Brightness Temperature an area of intense convection (extreme rainfall in the green to yellow to red area) can be seen to move up to Busick coincident with the heaviest rainfall.
6. Discussion and Conclusion
As Helene tracked up to Northwest Carolina it developed a very strong deep cyclonic circulation up to the 500hPa level with intense warm air advection from the radiosonde data at RNK(Blacksburg Viginia), GSO(Greensboro North Caroline) and MHX(Newport North Caroline) and from the reanalysis data at Busick North Carolina. This can be seen in Figure 11 and Figure 13 and in Figure 15 satellite data shows a large area of intense convection move up towards Northwest Carolina. As this occurred from Figure 3, Figure 4andFigure 5 tropical air (dewpoints to 23C) advanced up towards Ashville and the southern Appalachians. Therefore, the extremely unusual weather pattern associated with Helene brought very strong winds which extended up to middle levels of the troposphere and had a wind structure exhibiting a warm air advection pattern conducive to extreme rainfall particularly as the air mass developed tropical characteristics as it moved northwards.
Data. Availability
The data that support this study will be shared upon reasonable request to the corresponding author.
Funding
This research did not receive any specific funding.
Conflicts of Interest
The author declare that they have no conflicts of interest.
References
- Callaghan J. 2024. Development of strong asymmetric convection leading to rapid intensification of tropical cyclones. Tropical Cyclone Research and Review. [CrossRef]
- Callaghan J. 2023 The Eastern Australian Floods of February 2022 and Its Relationship with Climate Change Journal of Energy and Power Technology 2023, Volume 5, Issue 2. [CrossRef]
- Callaghan J. 2022 Development of strong convection in the inner core of tropical cyclones during intensification. GJSFR-H Volume 22 Issue 2 Version 1.0.
- Development of Strong Convection in the Inner Core of Tropical Cyclones during Intensification (globaljournals.org).
- Callaghan J. (2021a) East coast lows and extratropical transition of tropical cyclones, structures producing severe events and their comparison with mature tropical cyclones. Journal of Southern Hemisphere Earth Systems Science 71, 229-265. [CrossRef]
- Callaghan J (2021b) Weather systems and extreme rainfall generation in the 2019 north Queensland floods compared with historical north Queensland record floods. Journal of Southern Hemisphere Earth Systems Science 71, 123-146. https://www.publish.csiro.au/ES/pdf/ES20005.
- Callaghan, J. 2021c A Climatology of Heavy Rain and Major Flood Events in Victoria 1876-2019 and the Effect of the 1976 Climate Shift. Journal of Geographical Research | Volume 04 | Issue 03 | July 2021. [CrossRef]
- Callaghan J. 2020a A comparison of weather systems in 1870 and 1956 leading to extreme floods in the Murray–Darling Basin Journal of Southern Hemisphere Earth Systems Science 69(1) 84 – 115 A comparison of weather systems in 1870 and 1956 leading to extreme floods in the Murray-Darling Basin (csiro.au).
- Callaghan J 2020 Extreme rainfall and flooding from Hurricane Florence Trop. Cyclone. Res. Rev. [CrossRef]
- Callaghan J. 2019a The interaction of Hurricane Michael with an upper trough leading to intensification right up to landfall. Trop. Cyclone. Res. Rev., 8 (2019), pp. 95-102. [CrossRef]
- Callaghan, J. 2019b: A short note on the intensification and extreme rainfall associated with hurricane Lane Tropical Cyclone Research and Review 8 (2019) pp. 103-107. [CrossRef]
- Callaghan, J. 2018: A Short Note on the Rapid Intensification of Hurricanes Harvey and Irma. Tropical Cyclone Research and Review, 7(3), 164-171. [CrossRef]
- Callaghan J. 2017a. Asymmetric Inner Core Convection Leading to Tropical Cyclone Intensification, Tropical Cyclone Research and Review. 6:55-66. https://doi.org/10.6057/2017TCRRh3.02.
- Callaghan J. 2017b. A Diagnostic from Vertical Wind Profiles for Detecting Extreme Rainfall, Tropical Cyclone Research and Review. 6:41-54. [CrossRef]
- Callaghan J. and S. B. Power 2016. A vertical wind structure that leads to extreme rainfall and major flooding in southeast Australia, Journal of Southern Hemisphere Earth Systems Science (2016) 66:380-401. [CrossRef]
- Callaghan J. and S. Power 2014a; Major coastal flooding in south-eastern Australia 1860–2012, associated deaths and weather systems Australian Meteorological and Oceanographic Journal 64/3, 183-213.
- Callaghan J. and S. Power 2014b; Major coastal flooding in south-eastern Australia 1860–2012, Supplementary appendix - details on severe weather systems over southeast Australia, 1799-2013.
- Callaghan J. and K. Tory. 2014. On the use of a system-scale ascent/descent diagnostic for short-term forecasting of Tropical Cyclone development, intensification, and decay. Tropical Cyclone Research and Review. 2014, 3 (2): 78-90. [CrossRef]
- Tory, K 2014: The turning winds with height thermal advection rainfall diagnostic: why does it work in the tropics? Australian Meteorological and Oceanographic Journal, 64/3, 231-238.
- Hagen, Andrew B., John P. Cangialosi, Marc Chenard1, Laura Alaka, and Sandy Delgado. 2025.
- TROPICAL CYCLONE REPORT HURRICANE HELENE (AL092024) 24–27 September 2024 National Hurricane Centre 8 April 2025.
- Holland, G.J., 1984: On the climatology and structure of tropical cyclones in the Australian/southwest Pacific region. Aust. Met. Mag., 32, 1-46.
- Holton, J. R., 2004: An introduction to dynamic meteorology. Elsevier Academic Press, 535 pp.
- Trenberth, Kevin, E., 1978 On the Interpretation of the Diagnostic Quasi-Geostrophic Omega Equation, Monthly Weather Review 106, 131-137. [CrossRef]
Figure 3.
NWS Weather and Hazards map NWS Weather & Hazards for 0800UTC 27 September 2024 with last closed isobar 966hPa and dewpoint contours in dashed red.
Figure 3.
NWS Weather and Hazards map NWS Weather & Hazards for 0800UTC 27 September 2024 with last closed isobar 966hPa and dewpoint contours in dashed red.
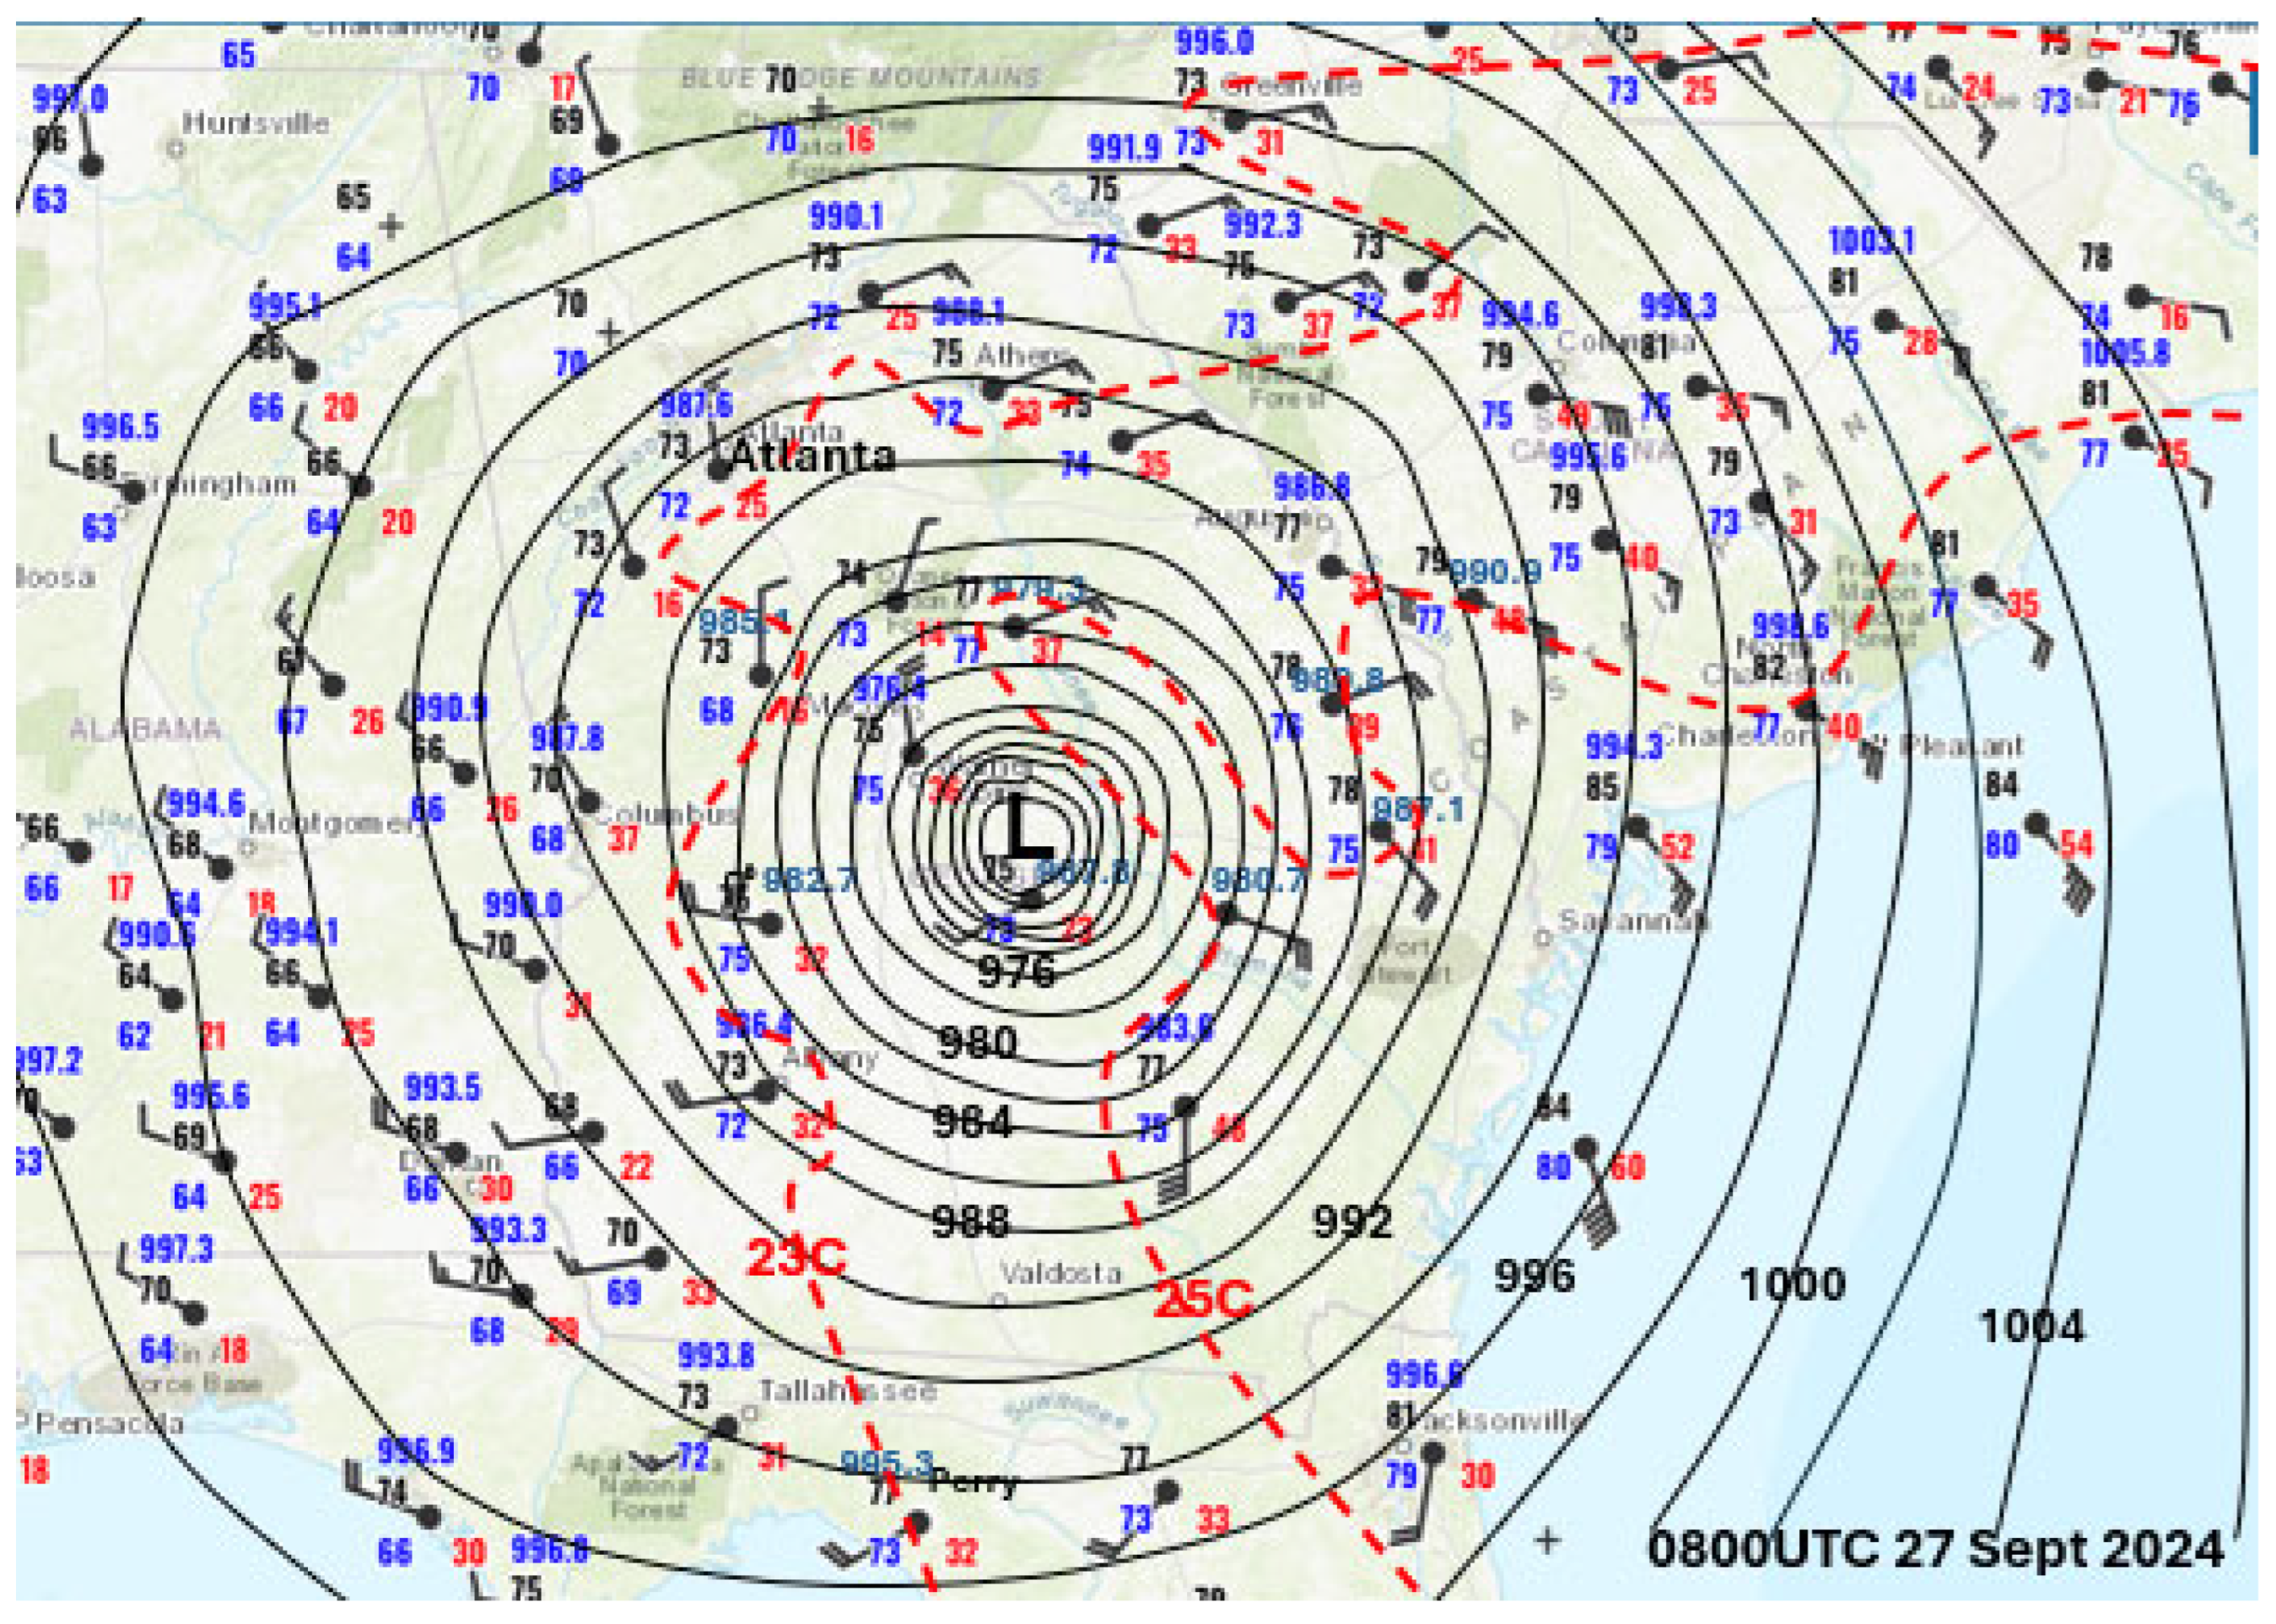
Figure 4.
NWS Weather and Hazards map NWS Weather & Hazards for 0900UTC 27 September 2024 with last closed isobar 972hPa and dewpoint contours in dashed red.
Figure 4.
NWS Weather and Hazards map NWS Weather & Hazards for 0900UTC 27 September 2024 with last closed isobar 972hPa and dewpoint contours in dashed red.
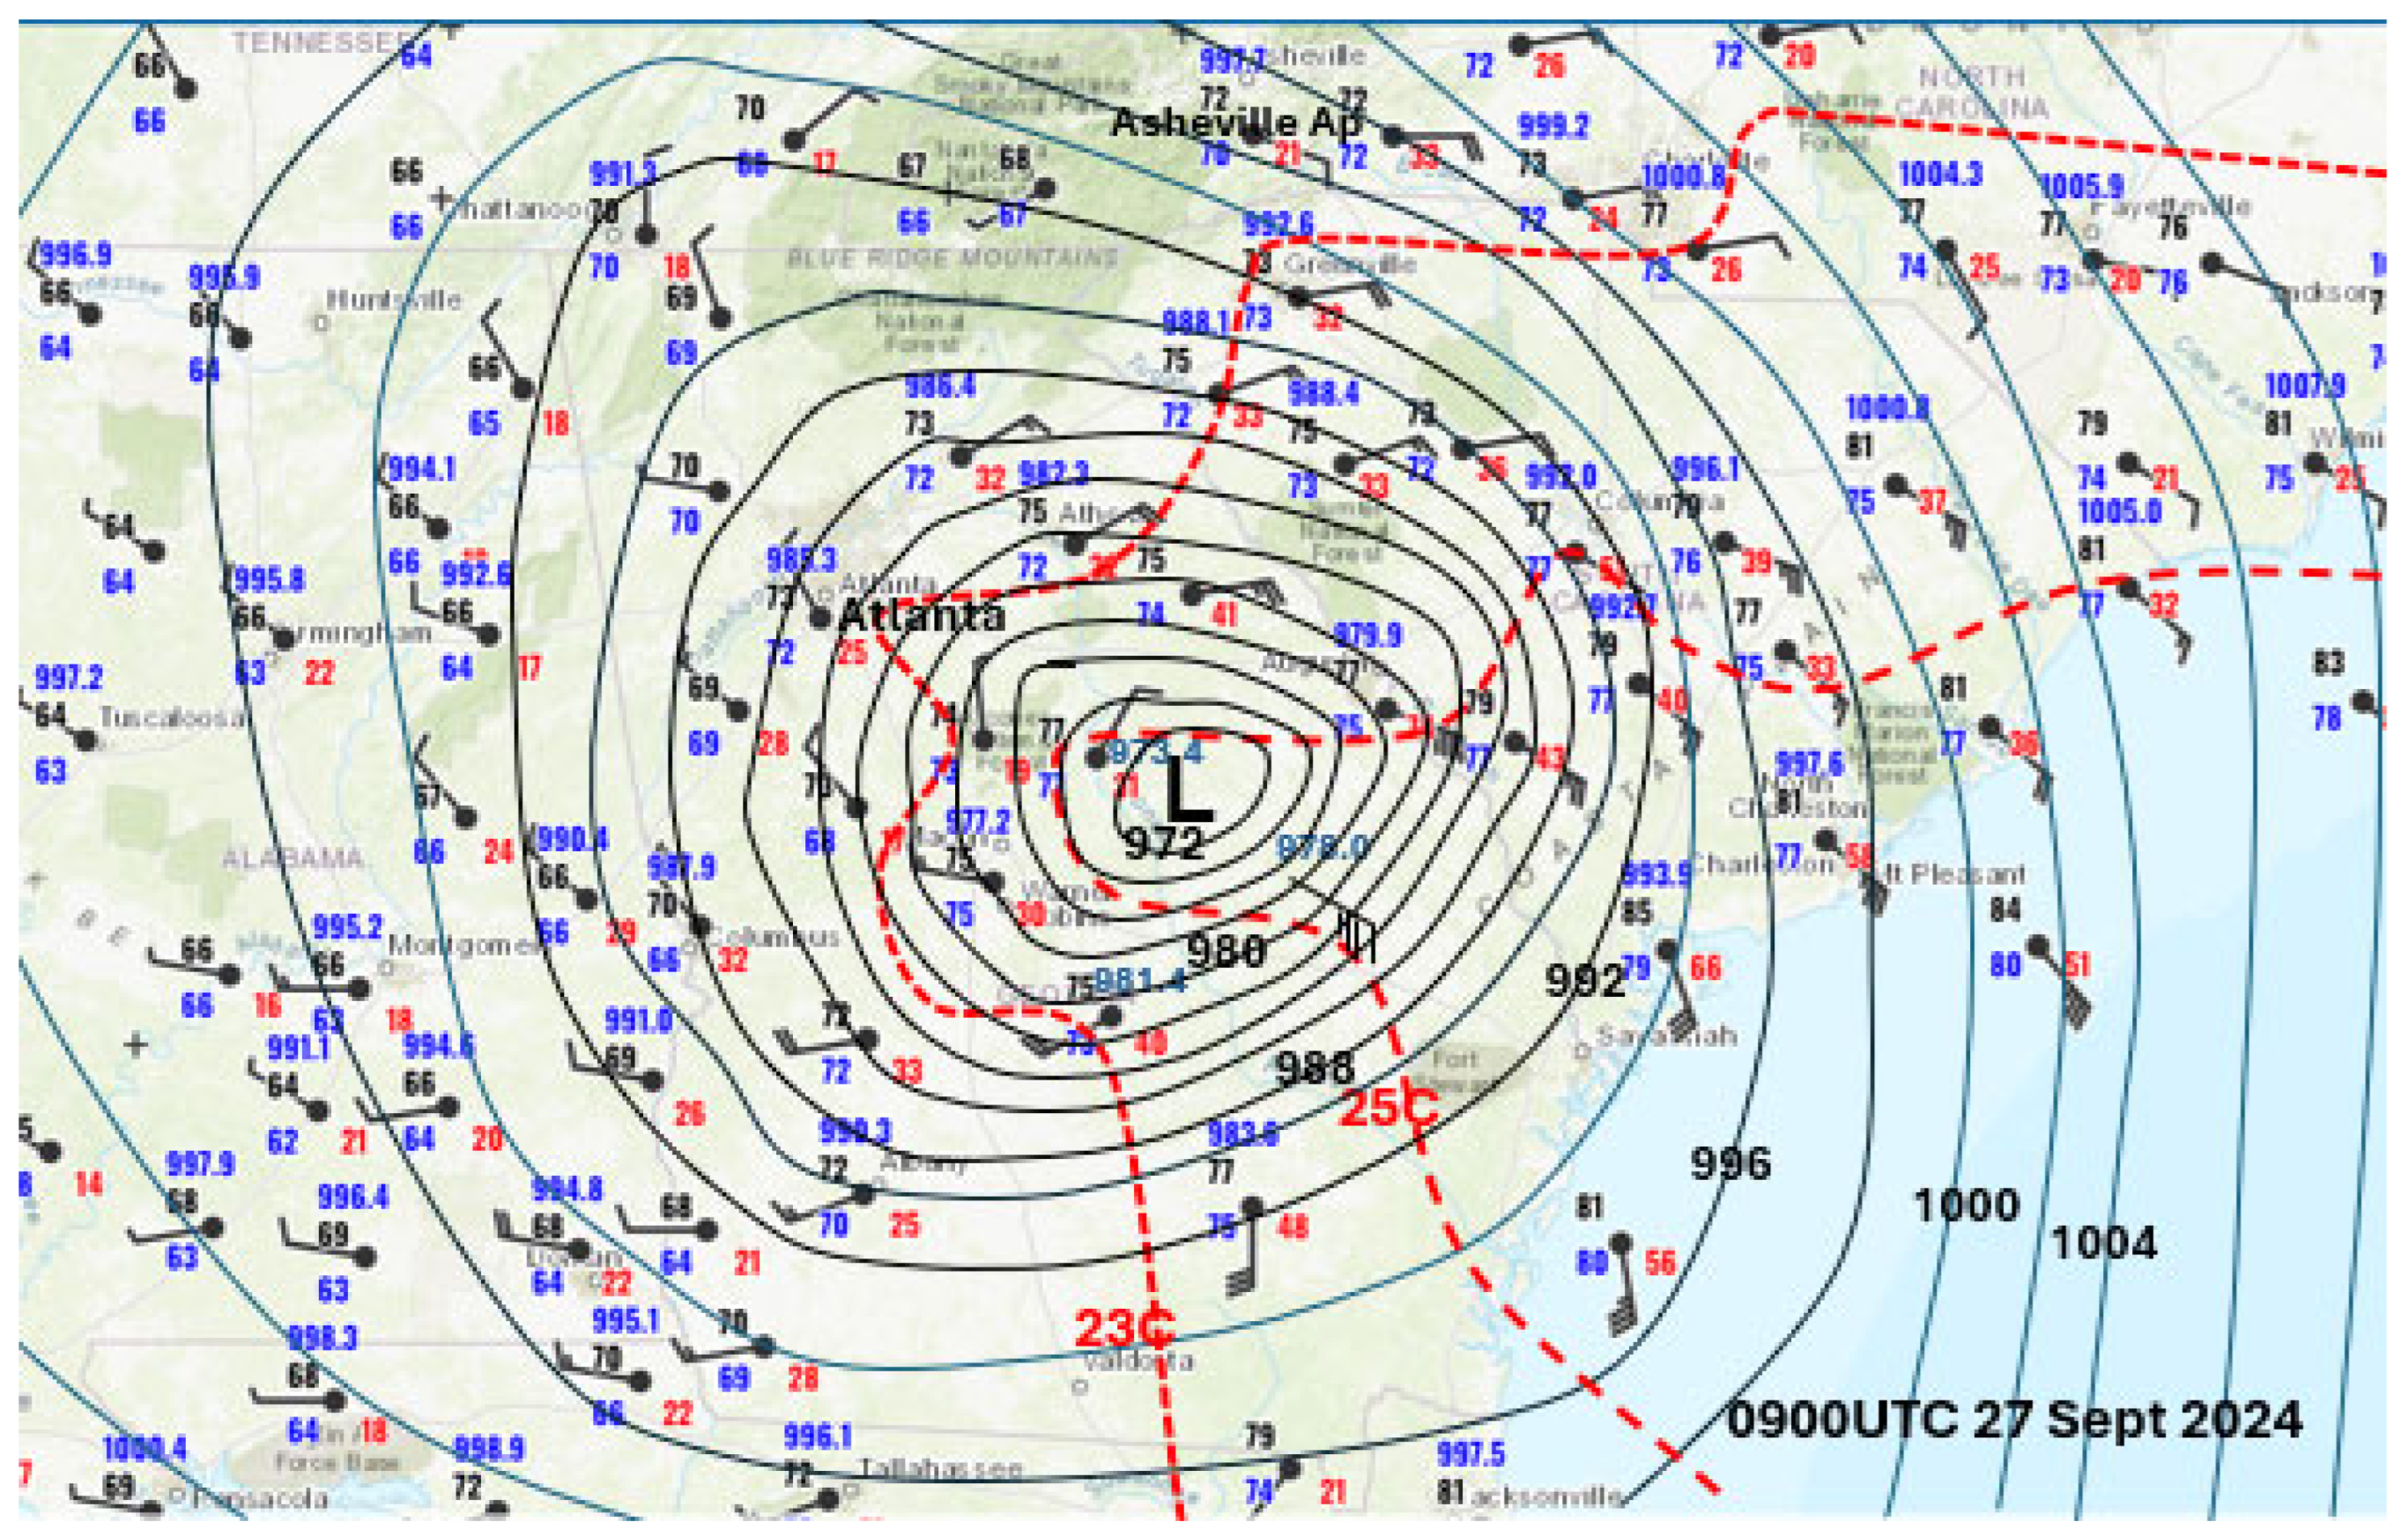
Figure 5.
NWS Weather and Hazards map NWS Weather & Hazards for 1200UTC 27 September 2024 with last closed isobar 976hPa and dewpoint contours in dashed red.
Figure 5.
NWS Weather and Hazards map NWS Weather & Hazards for 1200UTC 27 September 2024 with last closed isobar 976hPa and dewpoint contours in dashed red.

Figure 6.
Accumulative rainfall in the Asheville area and showing paths of the French Broad, Swannanoa, and Broad Rivers. Red line drawn to show scale.
Figure 6.
Accumulative rainfall in the Asheville area and showing paths of the French Broad, Swannanoa, and Broad Rivers. Red line drawn to show scale.
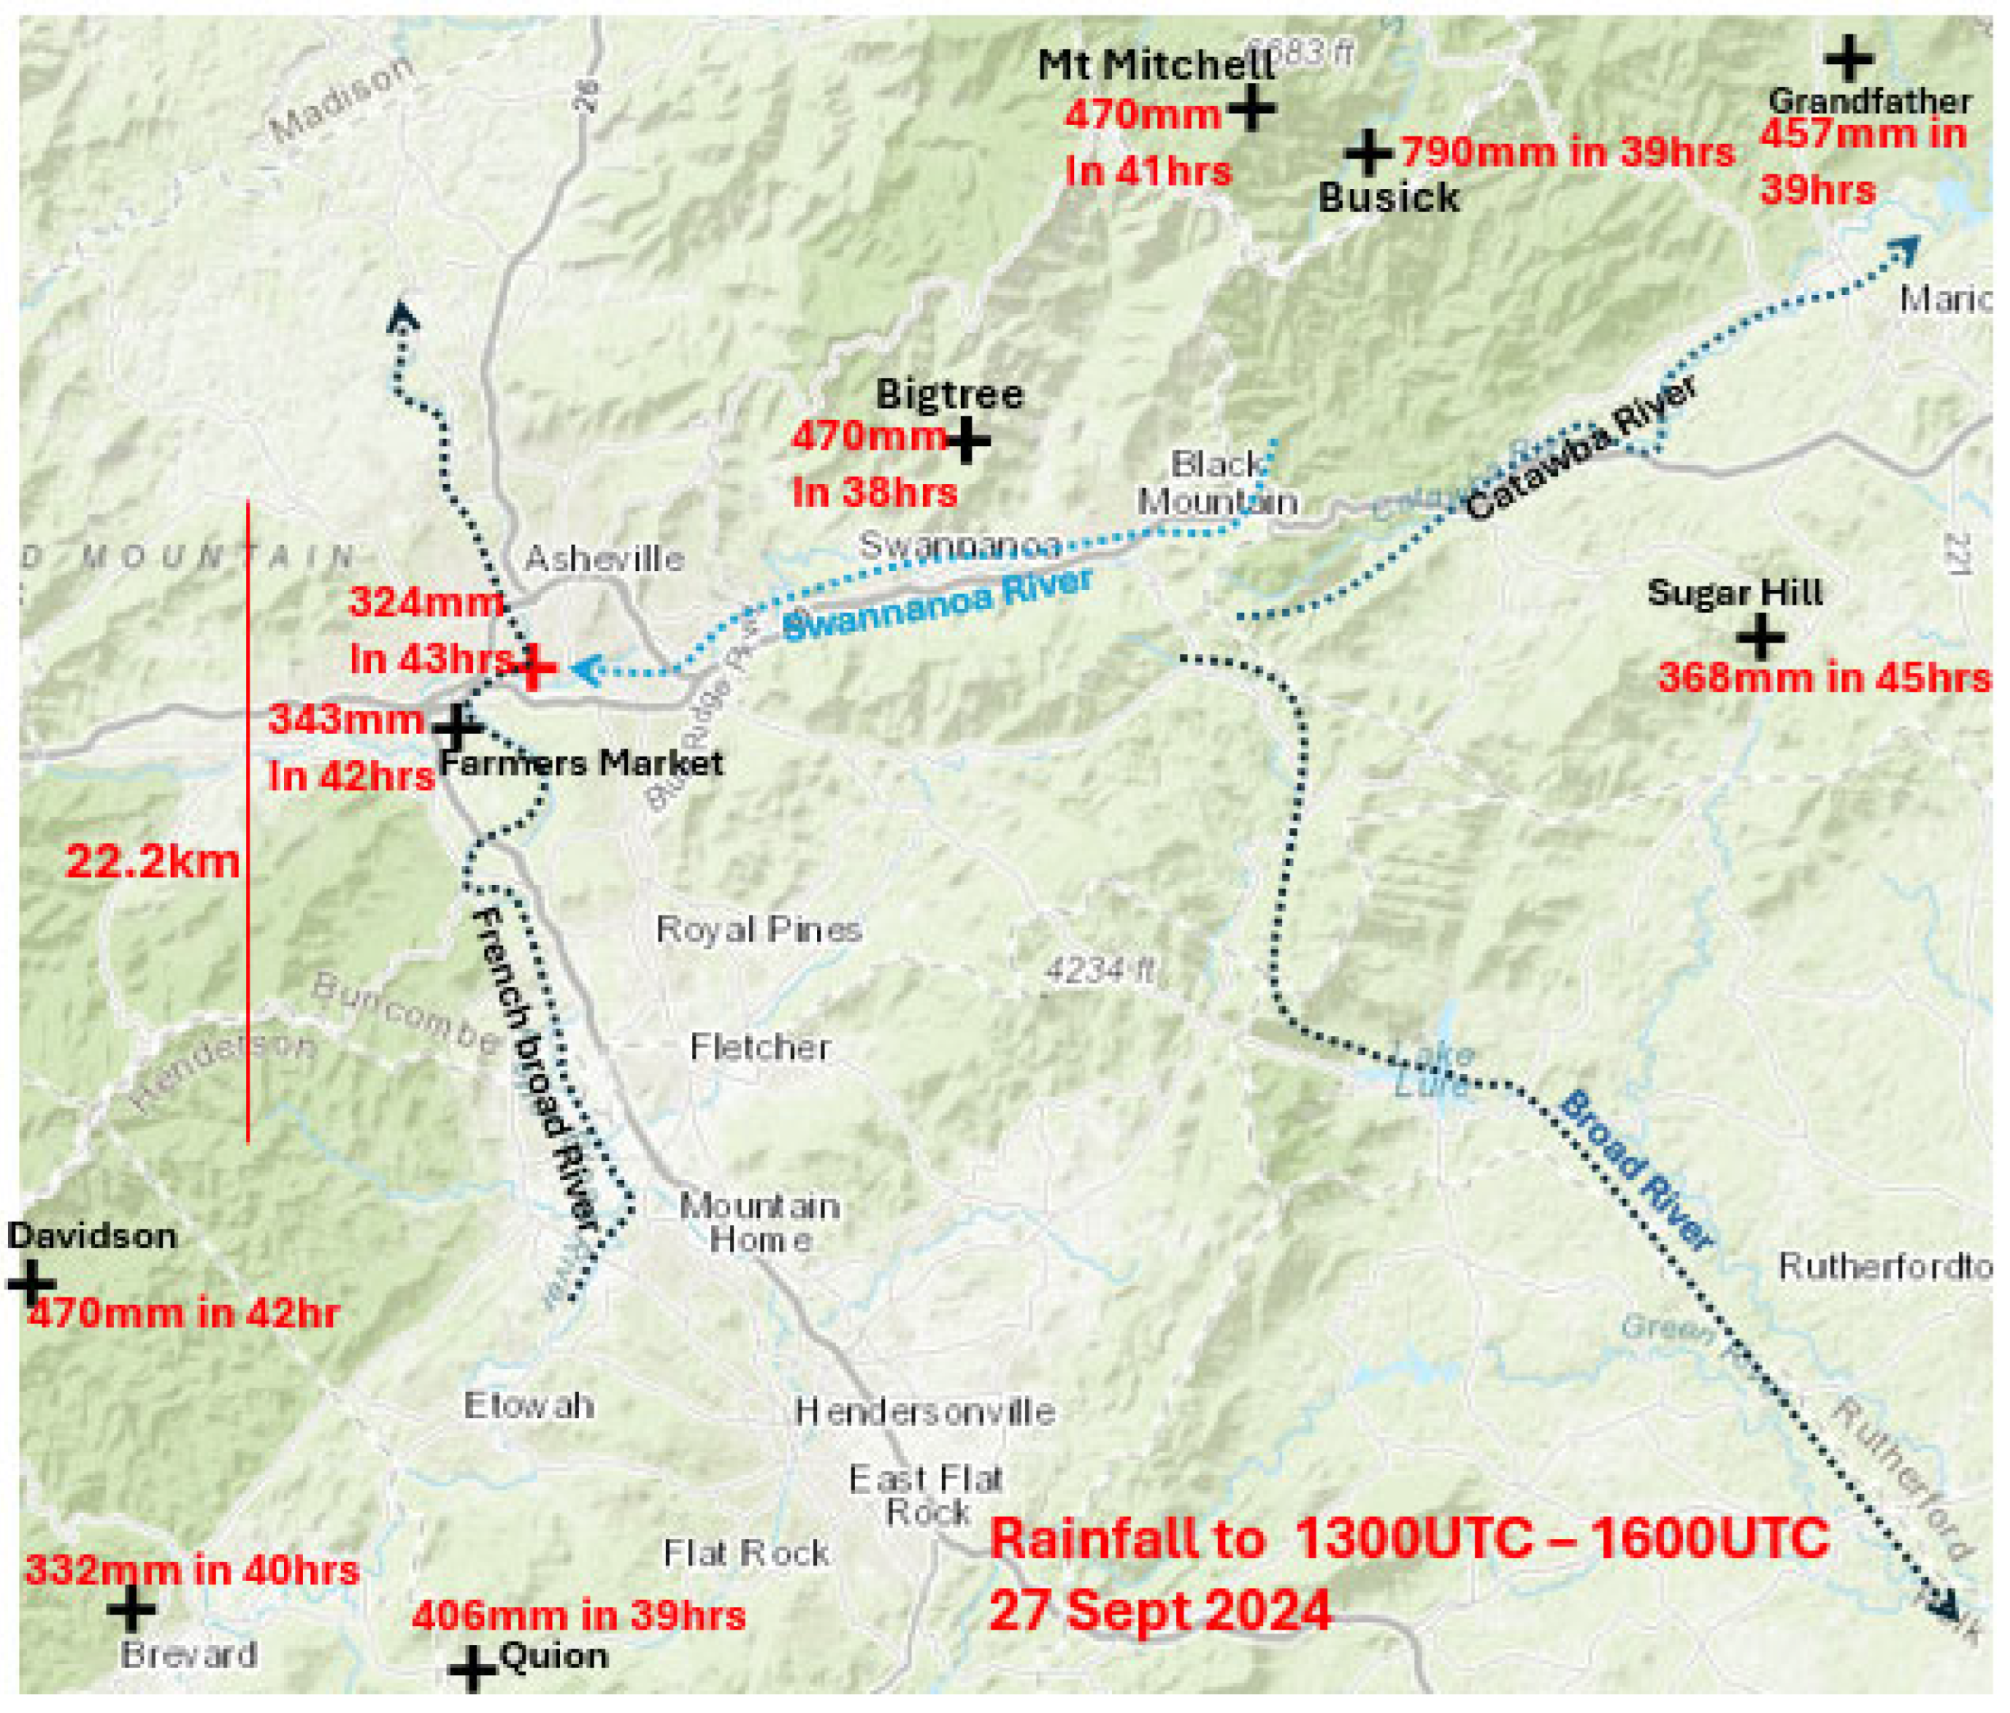
Figure 7.
Number of fatalities Northwest Carolina counties from Hurricane Helene (as of 14 October 2024).
Figure 7.
Number of fatalities Northwest Carolina counties from Hurricane Helene (as of 14 October 2024).
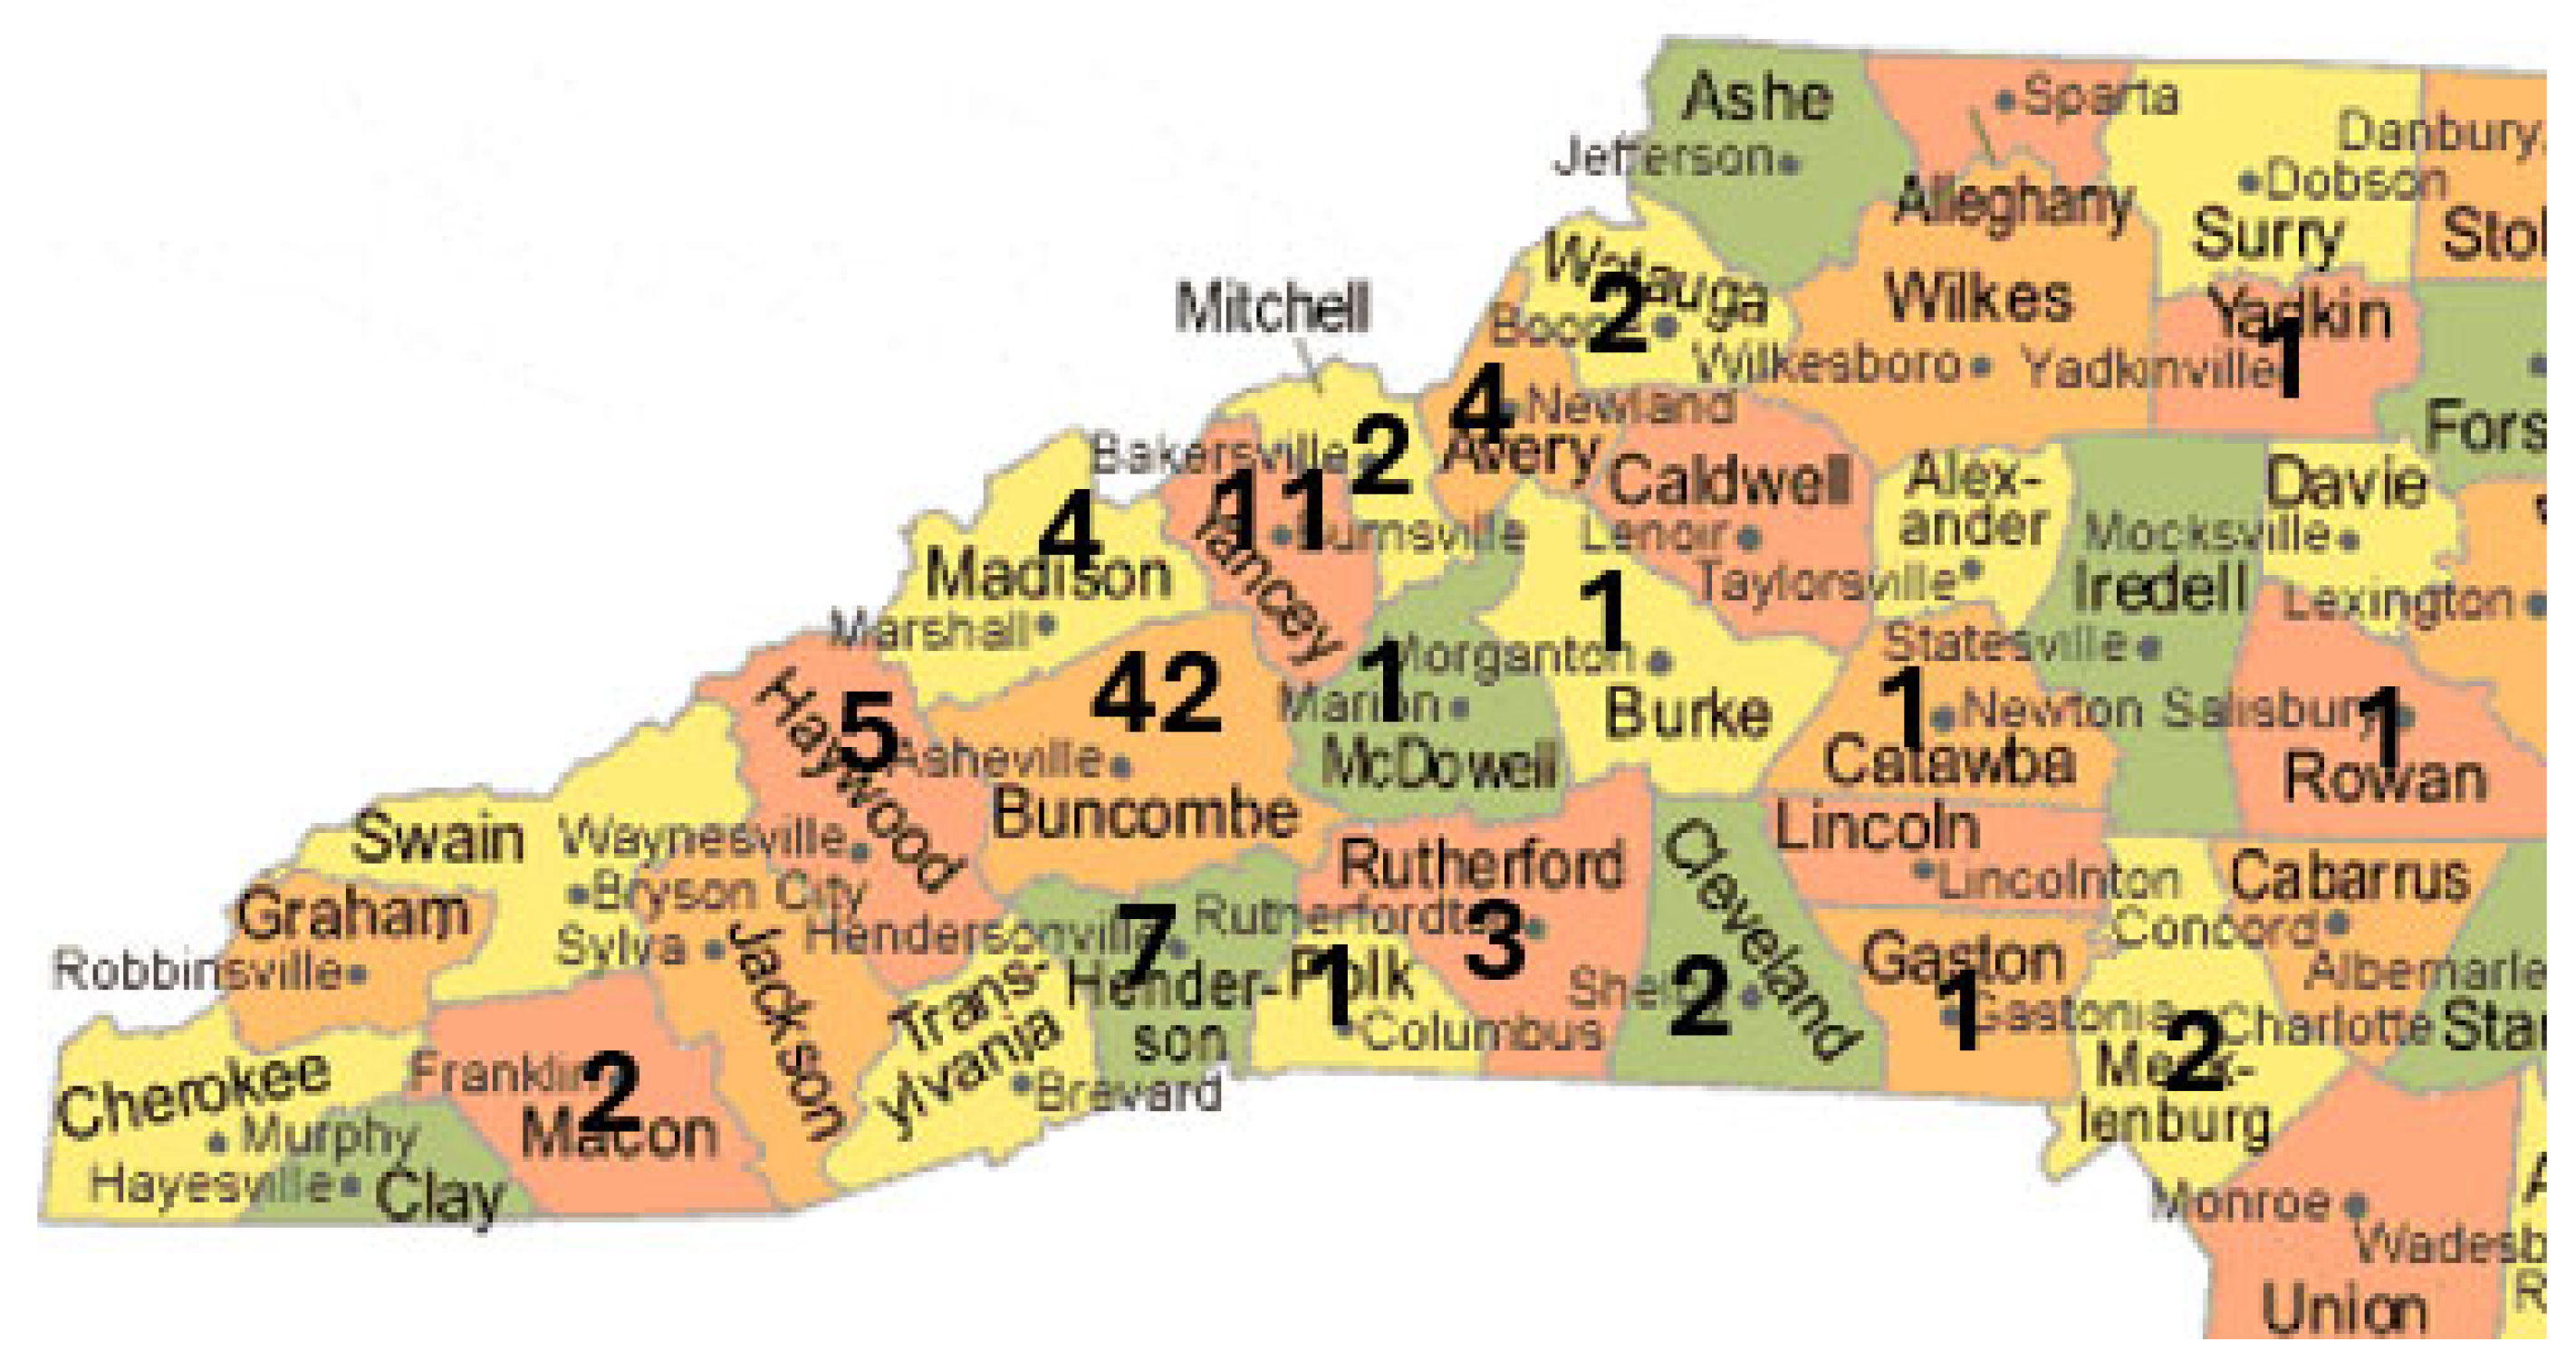
Figure 8.
Number of fatalities Eastern Tennessee counties from Hurricane Helene (as of 14 October 2024).
Figure 8.
Number of fatalities Eastern Tennessee counties from Hurricane Helene (as of 14 October 2024).
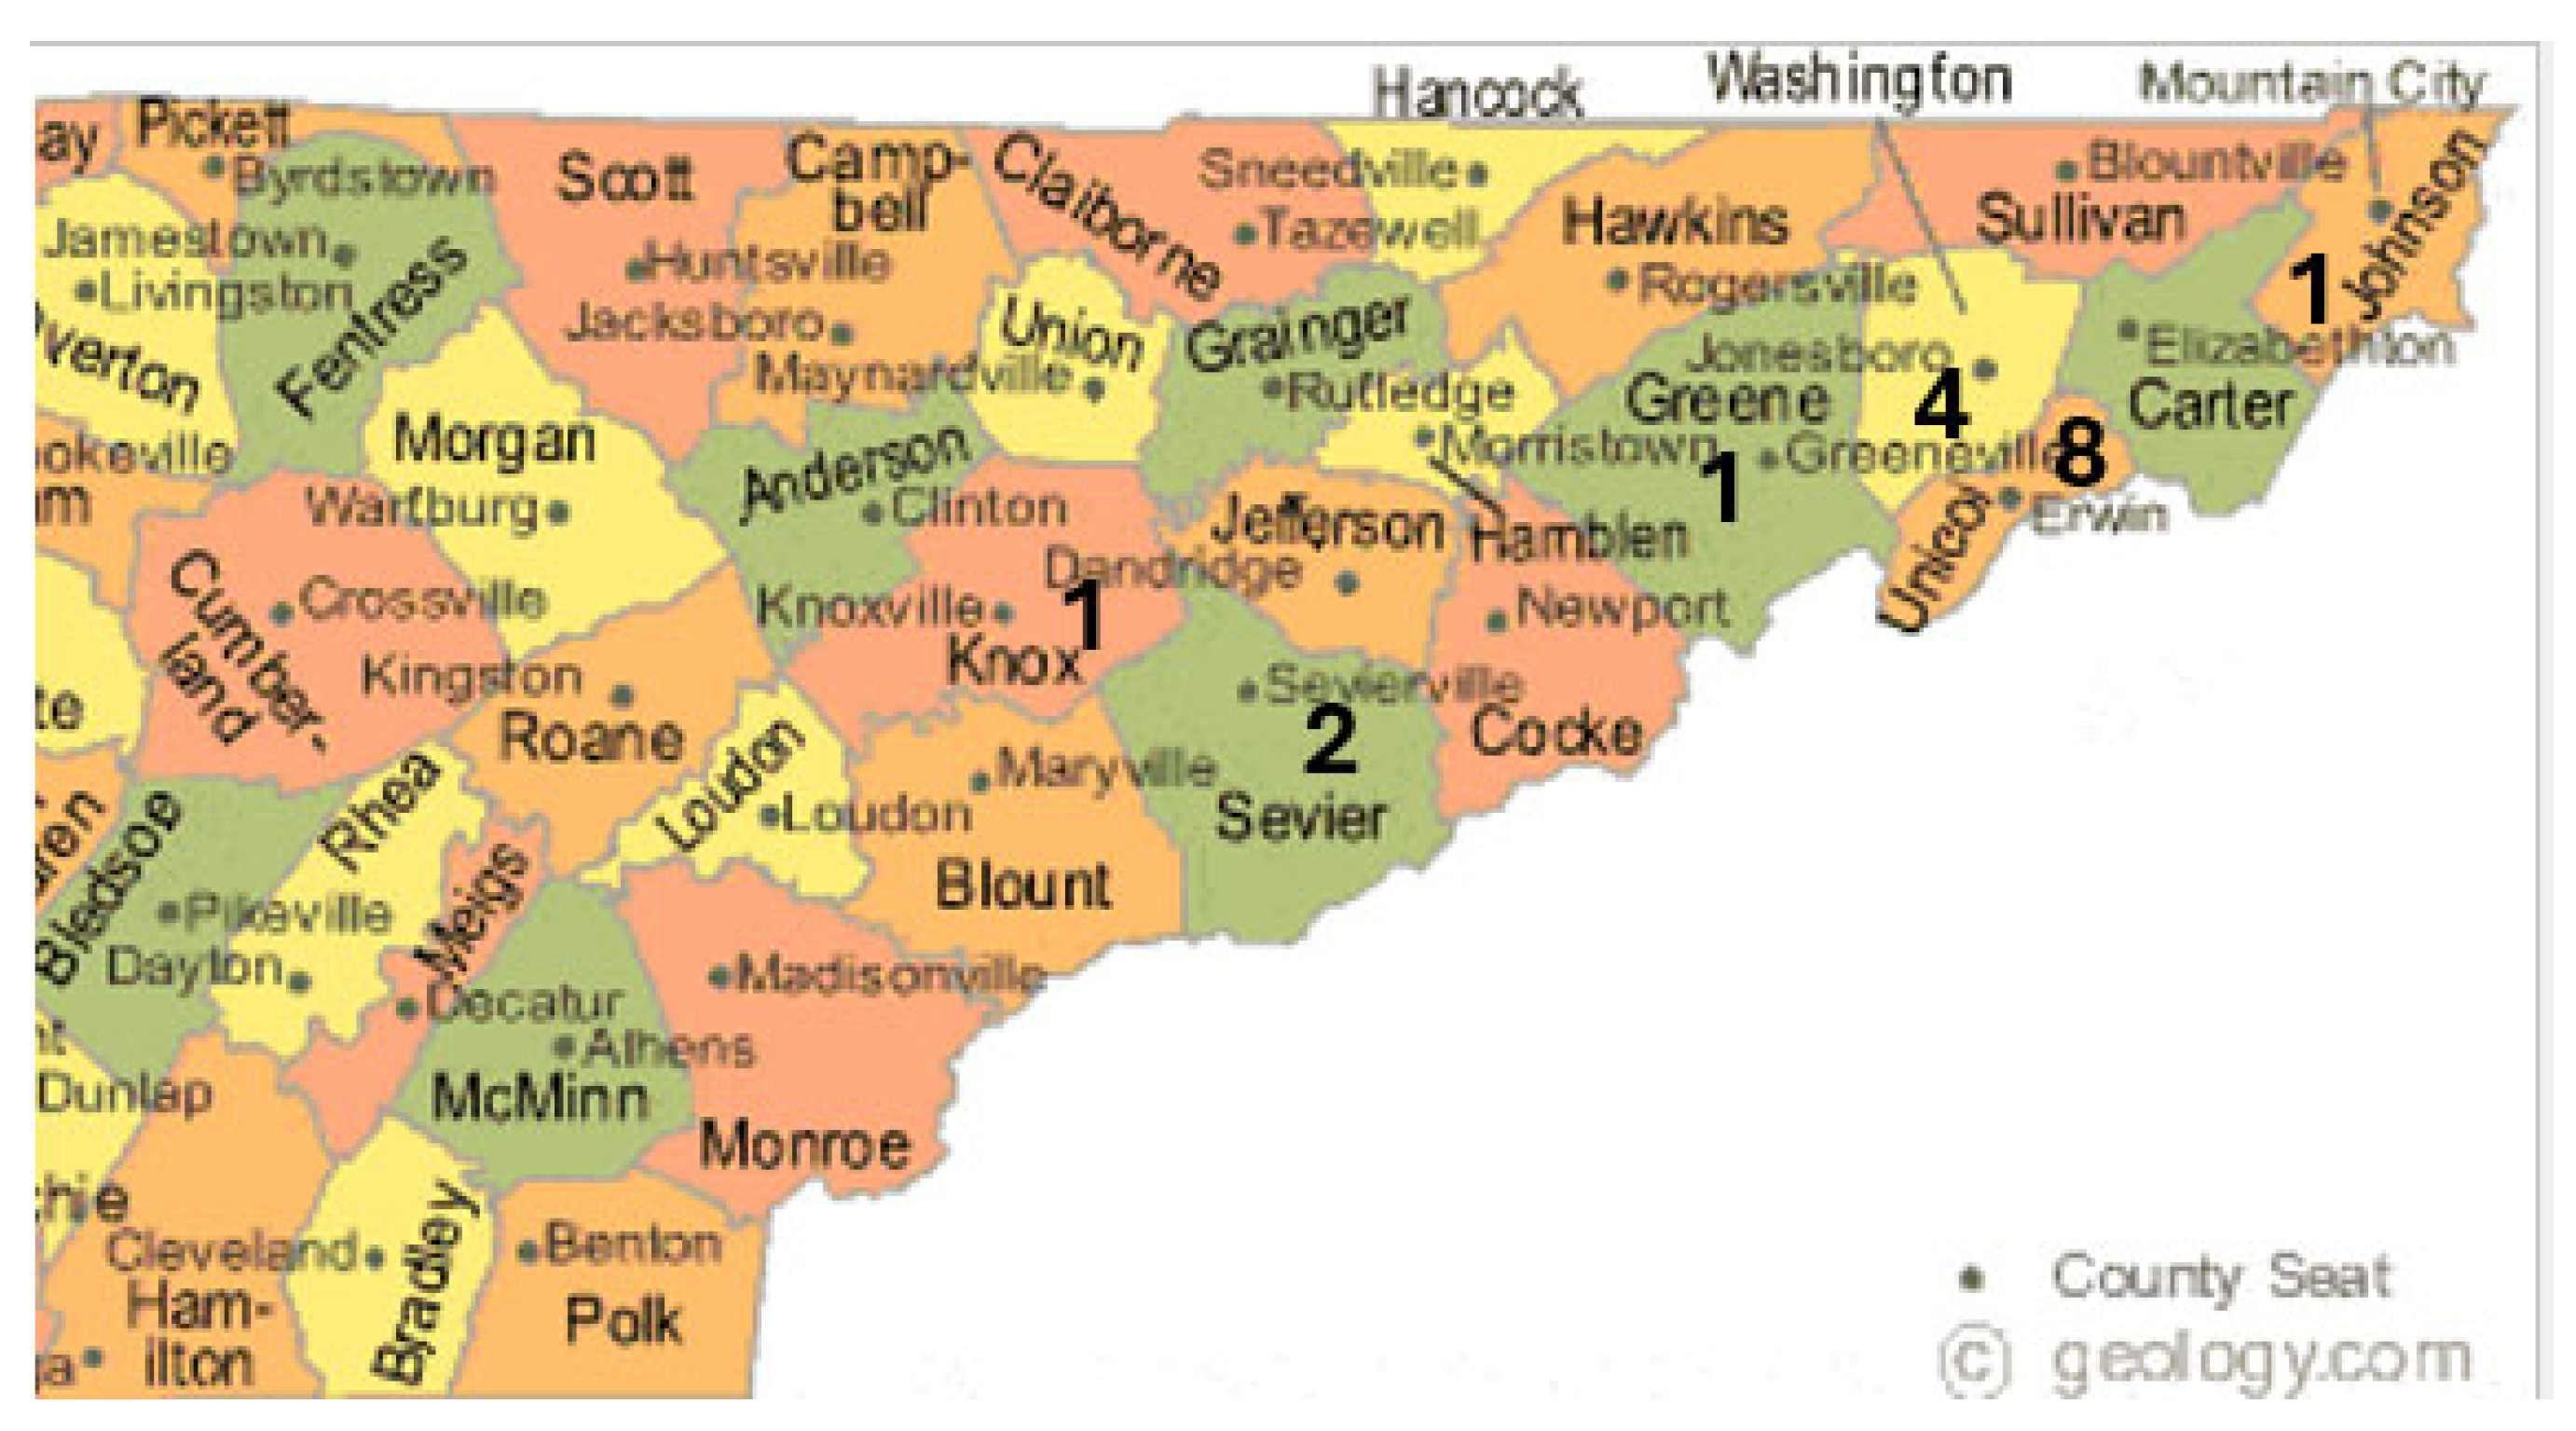
Figure 9.
Number of fatalities South Carolina counties from Hurricane Helene (as of 14 October 2024).
Figure 9.
Number of fatalities South Carolina counties from Hurricane Helene (as of 14 October 2024).
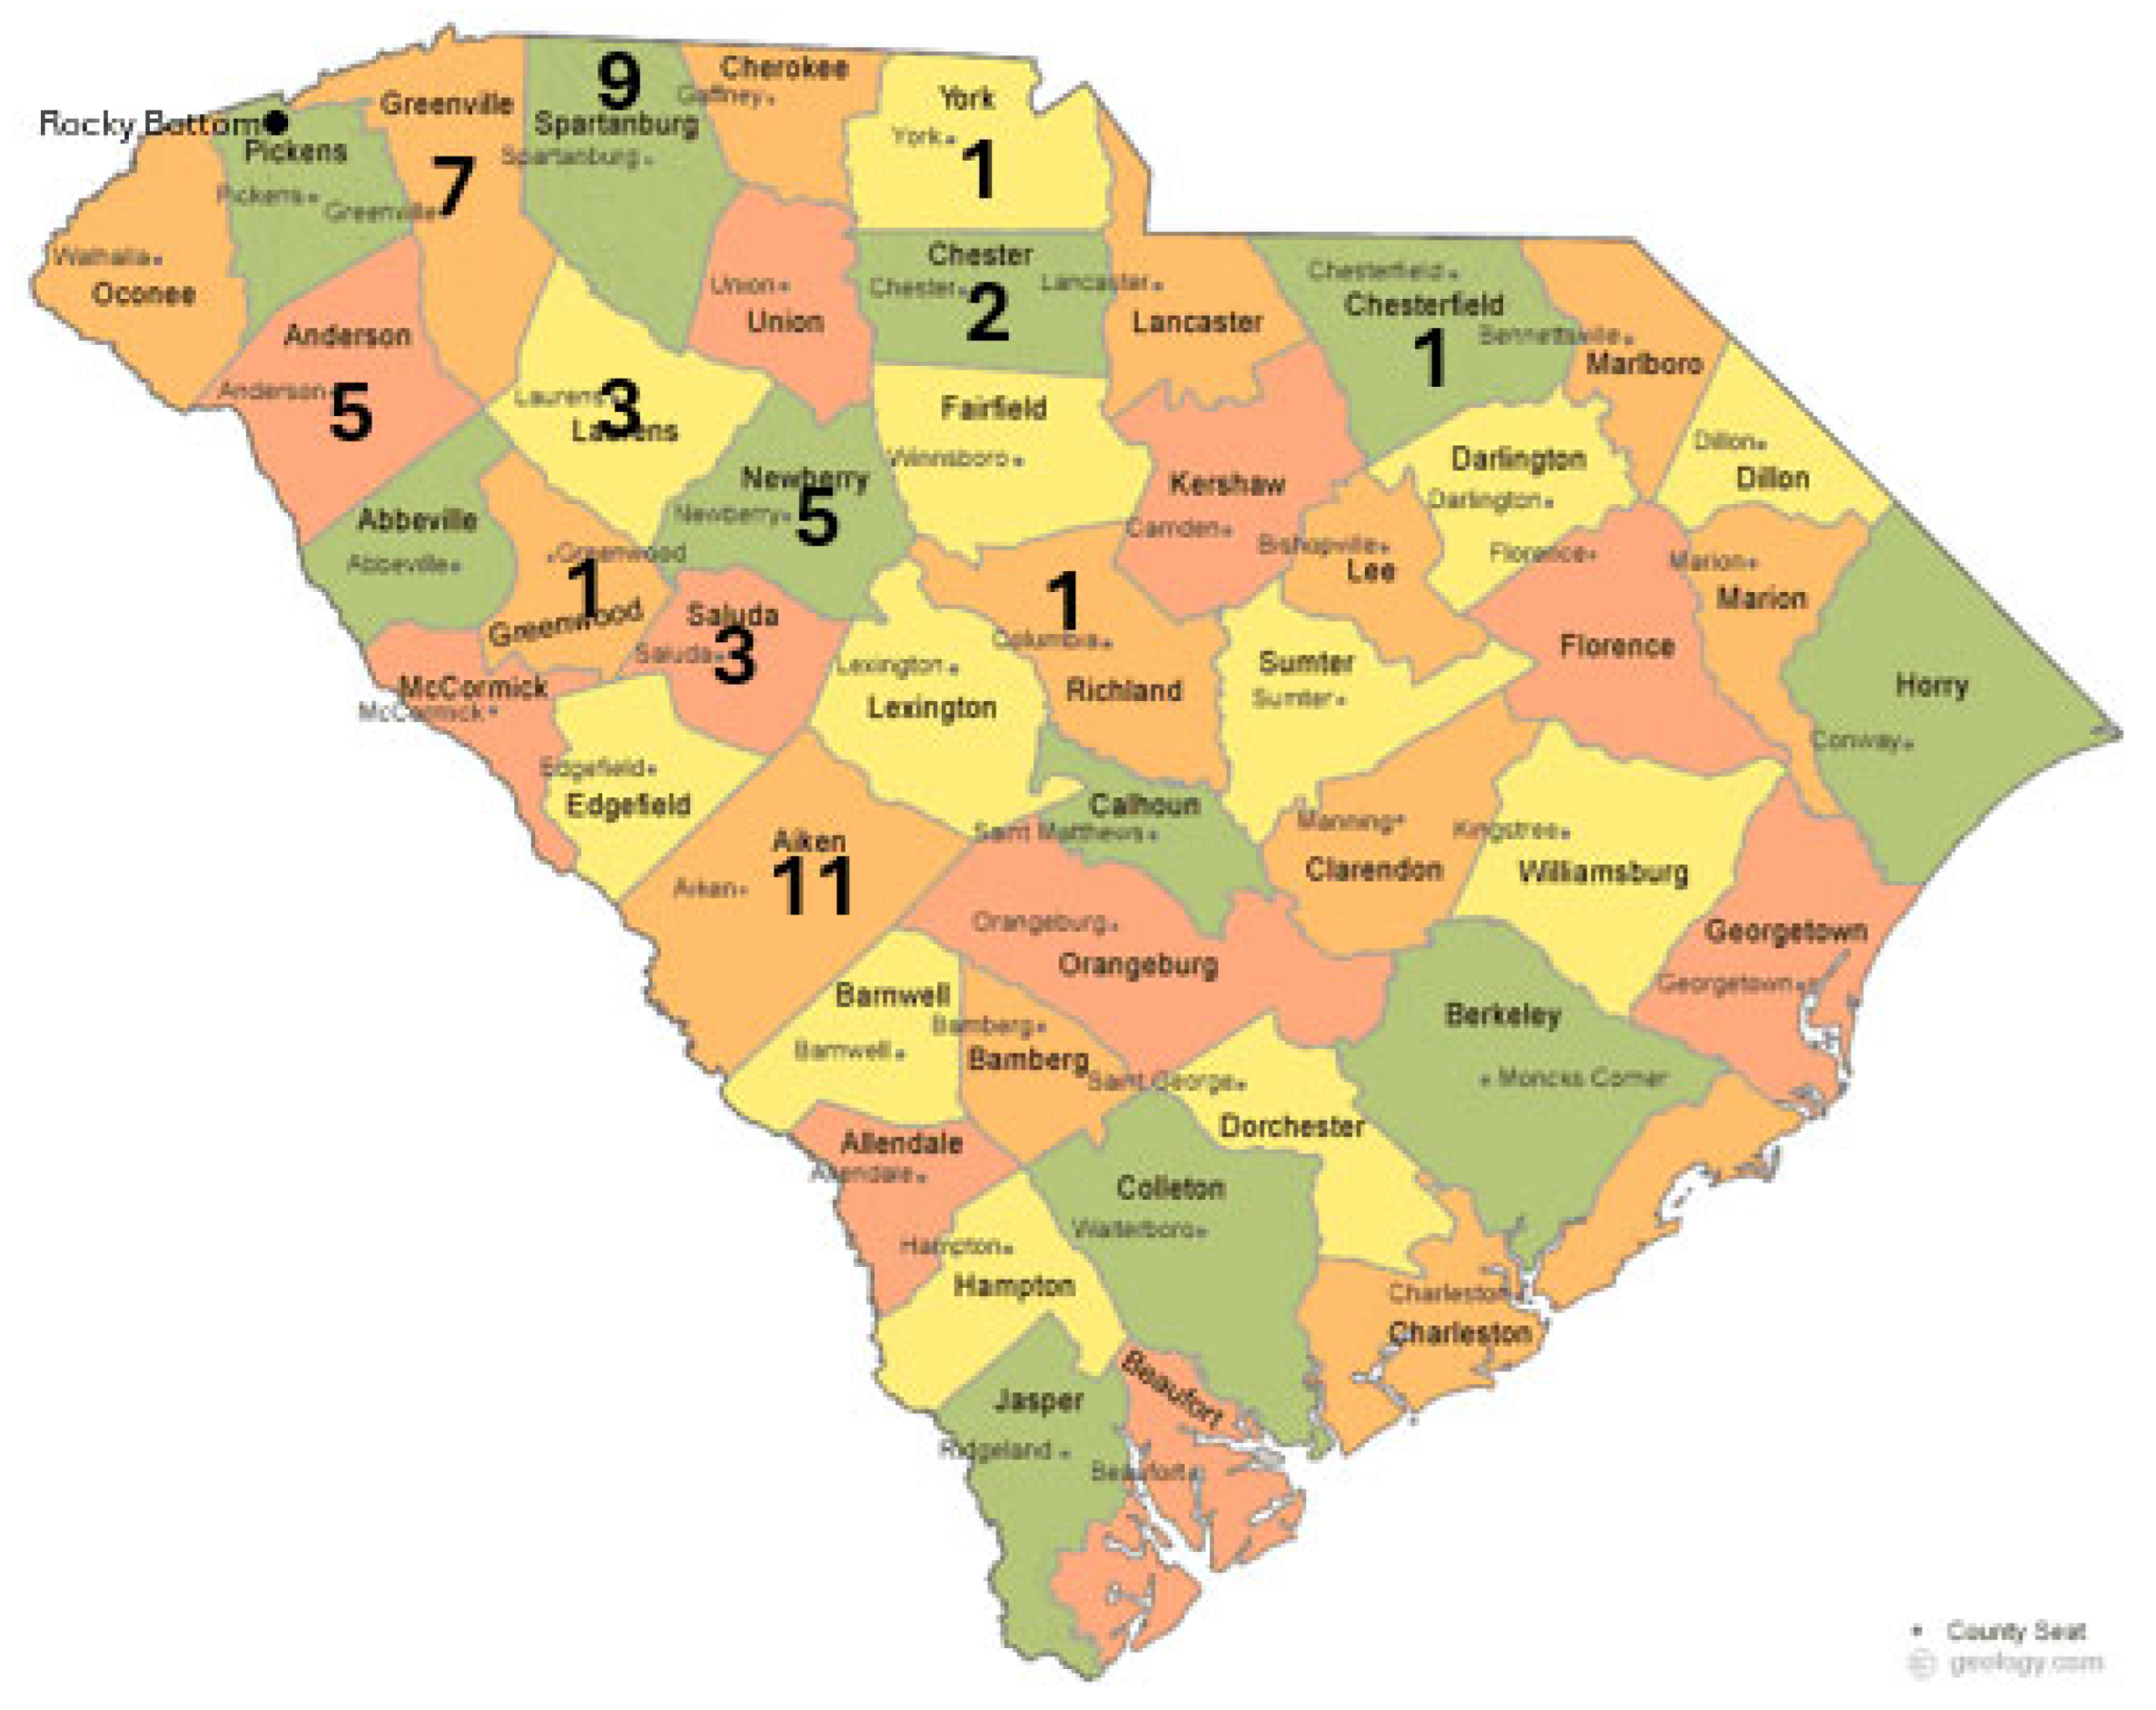
Figure 10.
shows the accumulative rainfall at Busick which recorded the heaviest rainfall in the region. From the hourly observations the highest intensity overall was 10.31inches (261.9mm) in 6hrs to 1417UTC 27 September 2024 Lowest intensities were 1.81ins (45.9mm) in 6hr to 1017UTC 26 September 2024 and 26 September 1317Z to 1417Z, only 0.18inch (4.6mm) was recorded.
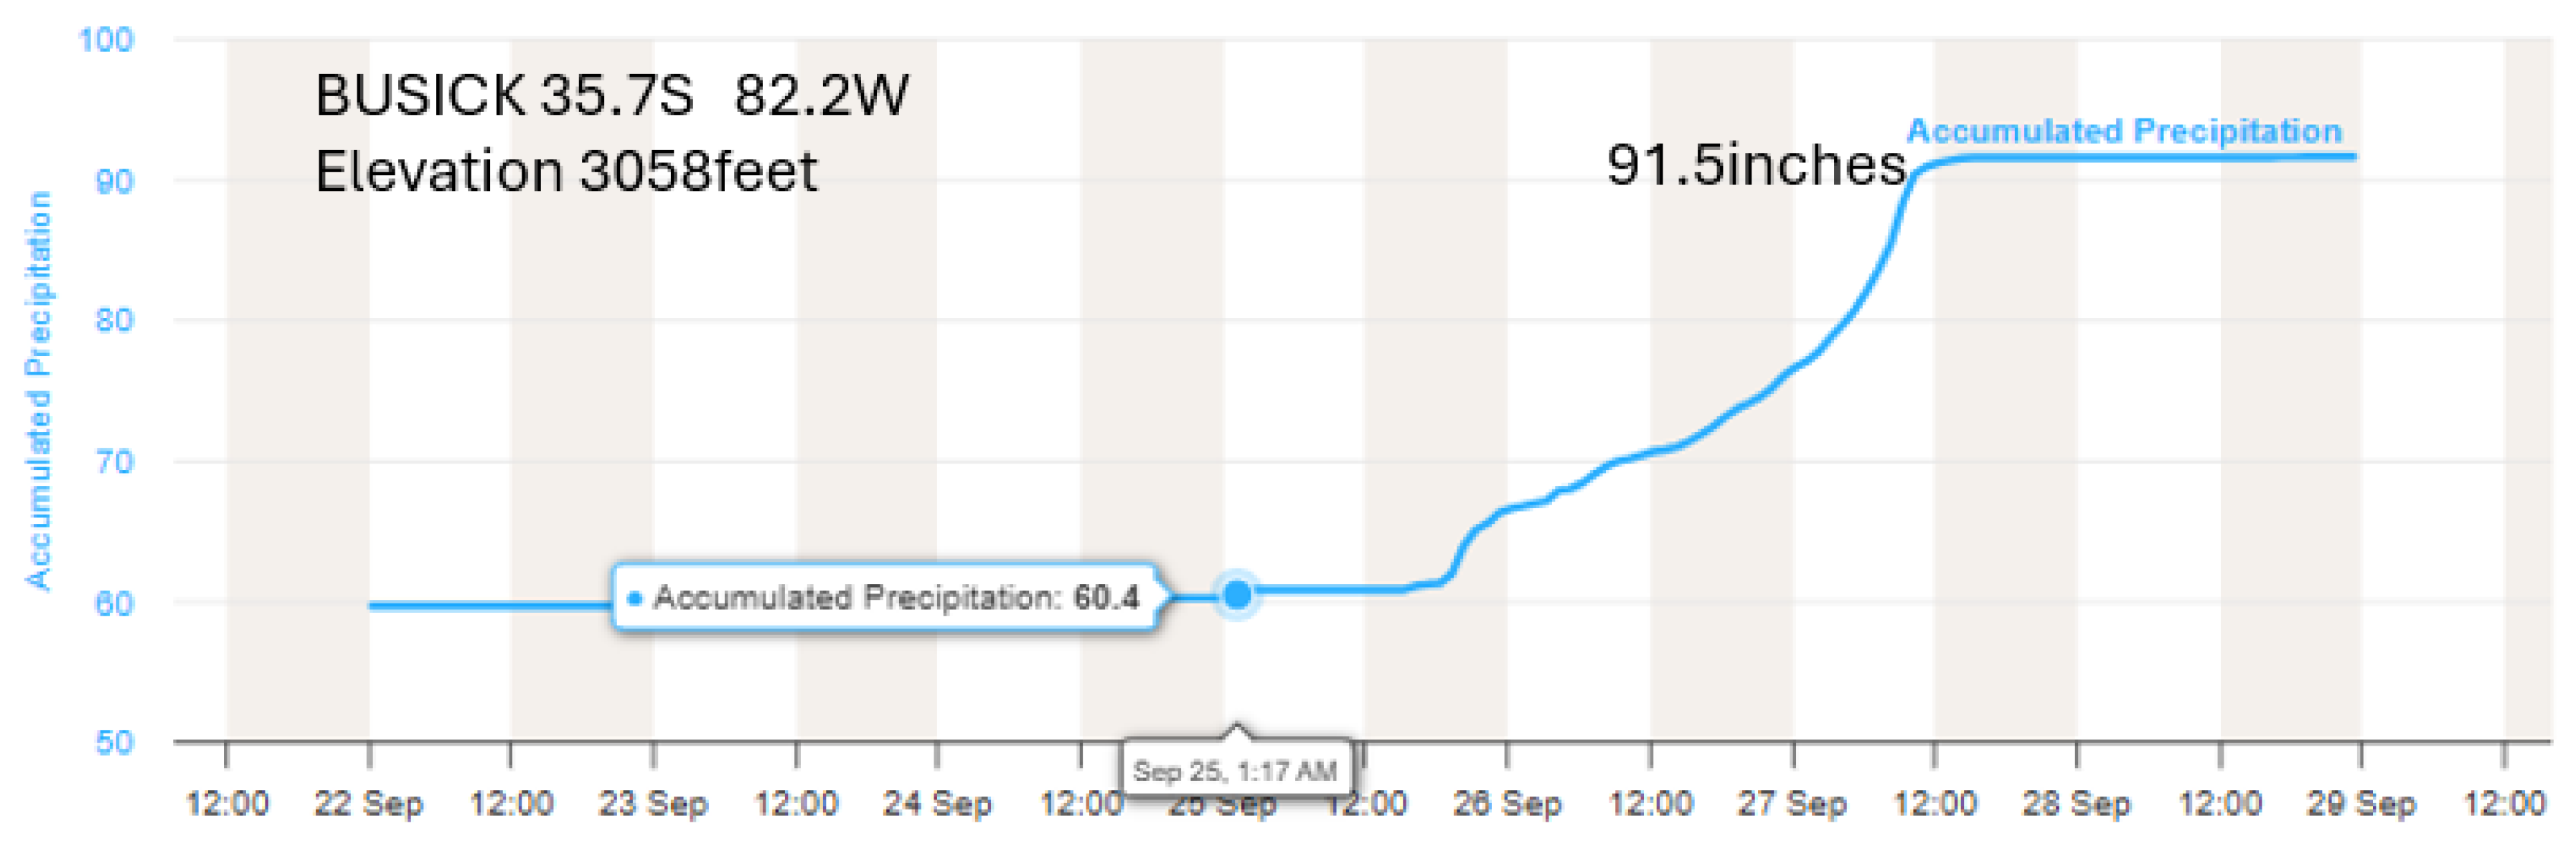
Figure 14.
Reanalysis winds for 1200UTC 27 September 2024 at 850hPa (top left ) 700hPa (top right) and 500ha (lower frame) with radiosonde station winds plotted and ascent denoted by station identification in red. Wind plots highlighted near Busick for clarity.
Figure 14.
Reanalysis winds for 1200UTC 27 September 2024 at 850hPa (top left ) 700hPa (top right) and 500ha (lower frame) with radiosonde station winds plotted and ascent denoted by station identification in red. Wind plots highlighted near Busick for clarity.
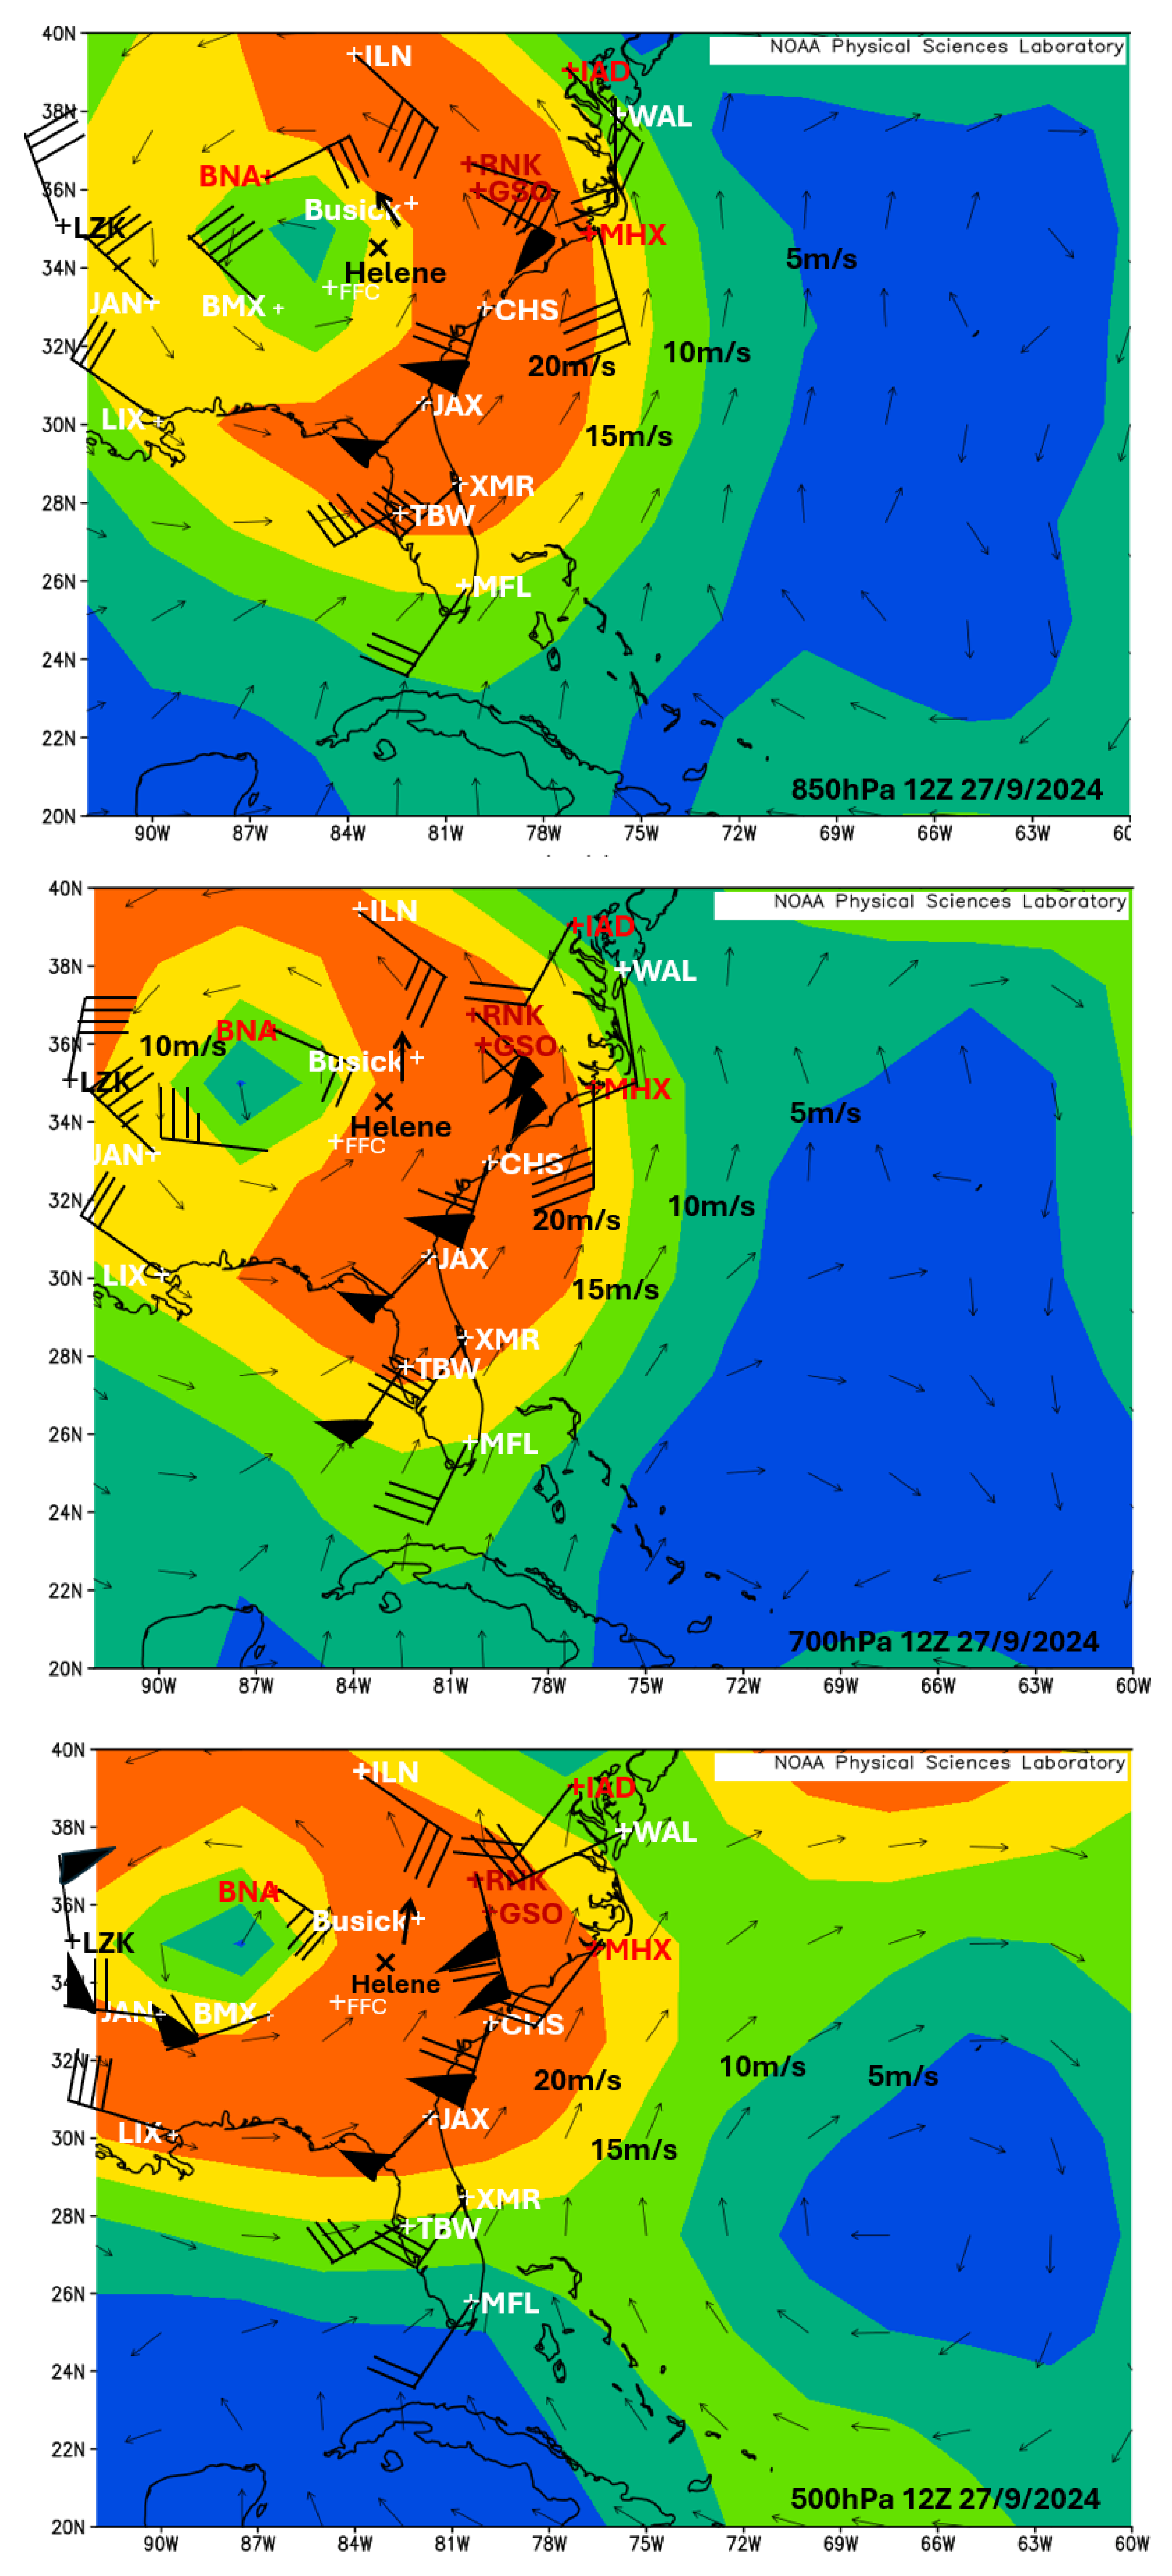
Figure 15.
F17 SSMIS 91.655 GHz (K) 0914UTC 27 September 2024 (top) and 1154UTC 27 September 2024 (bottom) + marks the position of Busick. From RAMMB: TC Real-Time: Real-Time Tropical Cyclone Products - 2024 Season.
Figure 15.
F17 SSMIS 91.655 GHz (K) 0914UTC 27 September 2024 (top) and 1154UTC 27 September 2024 (bottom) + marks the position of Busick. From RAMMB: TC Real-Time: Real-Time Tropical Cyclone Products - 2024 Season.
Disclaimer/Publisher’s Note: The statements, opinions and data contained in all publications are solely those of the individual author(s) and contributor(s) and not of MDPI and/or the editor(s). MDPI and/or the editor(s) disclaim responsibility for any injury to people or property resulting from any ideas, methods, instructions or products referred to in the content. |
© 2025 by the authors. Licensee MDPI, Basel, Switzerland. This article is an open access article distributed under the terms and conditions of the Creative Commons Attribution (CC BY) license (http://creativecommons.org/licenses/by/4.0/).
Copyright: This open access article is published under a Creative Commons CC BY 4.0 license, which permit the free download, distribution, and reuse, provided that the author and preprint are cited in any reuse.


