
Submitted:
24 June 2025
Posted:
25 June 2025
You are already at the latest version
Abstract
With the increasing digitalization and connectivity of transportation systems, there are many opportunities for data-based approaches in transportation planning and management. In this context, data quality management has a special role to play, including the systematic quality assessment of data assets. Data quality is particularly crucial for emerging data that has not yet been widely researched from a quality perspective. Emerging data is often found in Smart Parking Systems (SPSs). Until today, it remains unclear how SPS-generated data can be exploited by potential data consumers, such as municipal parking managers. One reason is the lack of knowledge about the quality of available data sources and the data provided. This paper presents an approach to assessing and defining data quality in the field of on-street parking. It examines relevant quality issues in this field and consolidates the findings into relevant quality indicators. The methodology includes a cross-check analysis of data sources and an inductive taxonomy development. The cross-check analysis provided empirical findings through qualitative analyses of available parking data in Hamburg, Germany, considering various conventional and SPS-based data sources. Based on this, a set of relevant quality criteria and quality metrics was developed.
Keywords:
intelligent transportation systems
; smart parking systems
; data quality management
1. Introduction
In recent years, there has been a growing proliferation of concepts and products in the field of Smart Parking Systems (SPSs), being a sub-discipline of Intelligent Transportation Systems (ITS).
SPSs aim to optimize parking infrastructure management and to provide new services for road users. SPSs are mainly based on new information and communication technologies, including emerging data sources and data processing methods [1]. Emerging data sources include new types of transaction data, parking space sensors and user-generated data.
Data generated by SPSs have the potential to support road travellers who are looking for parking spaces, as well as actors of parking management, usually dealing with planning and operation of public parking infrastructure [2]. Crucial data for parking managers, such as local parking occupancies, are predominantly collected using costly and error-prone manual methods. Thus, SPS data can complement or even replace existing collection methods [3]. A concrete use case with SPS-generated data was shown in the context of transport modelling, including an approach to induce new information on parking-search patterns in urban road networks [4].
However, the usability of related data sources depends heavily on the quality of data itself, as well as the efforts required to access and process the data. The quality issue has previously been raised in conventional traffic management [5]. It appears to be relevant for parking management as well, with new data sources and technologies arising in the context of SPSs.
To date, there is a notable scarcity of scientific literature addressing the quality of parking data, e.g., quality-related studies or guidelines, as shown in the following literature review. Potential quality questions concern, among other things, the scope, reliability, and value of parking-related data from the perspective of potential data consumers.
This situation creates a paradox: on the one hand, there is a growing market of data sources about parking. These sources include conventional methods and emerging ones, such as those based on SPSs. There are even constellations where multiple data sources cover the same elements of the parking system, like on-street parking spaces along public roads. On the other hand, there is a lack of transparent and comprehensive quality descriptions concerning these data sources, leading to uncertainty for data consumers on how to exploit this data. This paradox has been explored in the sector of Open Data, indicating that the value of a data set is correlated with its quality, and thus should be properly evaluated [6].
To fill this gap, this work elaborates how data in the parking sector can be assessed from a quality perspective. In particular, it presents a recent study on the quality of on-street parking data, including definitions of applicable quality criteria and approaches to assess such criteria.
On-street parking data can be quite heterogenous due to the different methods used for data collection and processing in this sector, along with the complexity of parking situations, especially in urban environments. Thus, it might be challenging to capture quality aspects of heterogenous parking data in one common framework. To gain deeper insights into this issue, this study is based on a cross-check analysis of parking data, i.e., a comparative analysis of several, independent data sources about the parking situation in a real-life urban context. This analysis uncovered specific quality observations and issues, which were then generalised into quality criteria for parking data. These criteria capture various quality aspects via concrete quantitative and qualitative metrics. The criteria were further validated via the data collected.
The work builds upon quality definitions that have been introduced for information systems in general, and for transportation systems, in particular ITS. Such definitions are interpreted and refined for the parking sector, considering specific aspects of the parking system and related data sources.
The innovative aspect of this work lies in its demonstration of a bottom-up approach to establish a quality framework via an analysis of real-life data, whereas other frameworks tend to adopt a top-down approach. Another innovation is the integrative quality analysis of multiple data sources, including some emerging sources based on SPS.
The study was conducted in collaboration with the State Transport Authority (Landesbetrieb Verkehr, LBV) Hamburg, which is responsible for parking management in Hamburg, Germany.
This paper is organised as follows: The second section provides a literature review on parking data, looking at existing typologies, typical use cases, and identified quality issues thus far. It also presents previous quality frameworks and definitions in information systems, ITS, and the parking sector. The third section explains the methodology applied, namely the cross-check analysis in Hamburg, Germany, the post-processing of this data, and the derivation of applicable quality definitions. The fourth section compiles exemplary quality implications from the cross-check analysis, i.e., concrete lessons learned about quality aspects in the analysed data sources. This section also presents a proposed set of quality criteria and metrics for the on-street parking data sector. The last two sections discuss and conclude the outcome and applicability of the proposed quality definitions.
2. Literature Review
2.1. Parking Data: Typologies, Uses Cases, Quality Issues
Driven by recent developments in SPSs, parking data exhibits a high degree of diversity in terms of content, use cases, and technologies. To provide orientation in this domain, a taxonomy for parking data was developed, showing how parking data can be classified at different levels [7]. It compiles, among other things, techniques for the collection of parking data, as well as the information content that is covered by parking data. One of the terms in this taxonomy, which is also applied later in this paper, is transaction data, which commonly includes parking fee payment data from parking meters and mobile phone applications.
As previously stated, emerging data is supposed to support local actors in parking management. For that reason, many studies investigated whether and how emerging data sources generate management-related information, e.g., the local occupancy situation.
Table 1 contains a compilation of various literature dealing with different data sources and associated use cases.
With regard to the first data source mentioned, transaction data, all researchers report discrepancies between the actual parking demand and the parking demand derived from such transaction data. Accordingly, there is an under-reporting of occupancy rates in some US cities in the range of 6% to 55% when only transactions are considered [10]. Even after fusing multiple data sources regarding the parking occupancy situation, a significant discrepancy between the measured occupancy situation and the transaction data remains with a correlation level of 0.60 [8]. The “under-reporting rates” or correlation numbers clearly indicate a quality issue.
Most of the other cited studies also reveal quality implications, e.g., the accuracy of sensor data or deviations in GPS localization. In any case, quality issues might hinder the intermediate usage by data consumers. In contrast, intense efforts for data post-processing are expected. These efforts include data analytics, fusing various data sources, and properly interpreting the derived information. For a potential data consumer, it is important to foresee such efforts by knowing in advance the quality level of a data source, which is the topic of the rest of this paper.
2.2. Quality Frameworks and Definitions in Information Systems, ITS and the Parking Sector
Traditional quality management focuses on the assessment of individual objects on the basis of quality aspects and the fulfilment of certain requirements in relation to these aspects [20]. Within the assessment, the quality of objects is determined via one or multiple quality criteria (sometimes also called quality characteristics, dimensions, measures, or objects), which explain specific aspects of the object. For practical reasons, quality criteria are often concretised via one or several quality metrics (sometimes called quality indicators). Examples of such metrics include statistical error indicators. A quality framework defines concrete quality metrics to be applied for a certain domain, but also the procedures for quality assessment, i.e., methods and algorithms to determine such metrics. Such definitions are important to promote a common understanding of quality issues in multi-actor environments. This can, for example, support a holistic quality management in a specific organization [21].
Quality definitions have been presented in numerous publications related to the quality management of data and information. A review and consolidation of past definitions works in academia, practice, and industry indicates that finding a common quality understanding among various actors in information ecosystems remains a challenge [22]. As an exemplary reference for the industry sector, quality definitions were established for commercial business environments, including proposals on concrete metrics including calculation methods and examples [23]. A recent consolidation of quality definitions, also based on a literature review, leads to a grouping of the most frequently cited quality dimensions [24].
In the transportation sector, especially for the area of ITS, quality definitions have been further specified. A European ITS stakeholder group developed a quality framework for the sector of multimodal traveller information services, as a concrete ITS application [25]. A similar framework from the USA compiles methods and guidelines for data quality measurement for different applications in road traffic management [5]. In terms of standardization, quality definitions are found in ISO elaborations, namely for the domains of ITS and geodata [26,27]. These works aim to support quality descriptions when providing ITS data or geodata, respectively, via open interfaces.
Table 2 compiles relevant quality criteria, as identified in the above references.
When comparing the criteria cited in the above references, it is evident that there is frequent overlap, e.g., for “completeness”. However, a detailed analysis shows that these references still have very different approaches to grouping and structuring quality aspects. Furthermore, many of these references do not provide guidance on how deploy these quality criteria in real-life assessments.
Some literature deals with quality aspects in a data exchange environment, i.e., when data is exchanged between data providers and data consumers via data portals. In the mobility sector, a study examined several US mobility data portals and introduced evaluation metrics for such portals, such as the openness of the data, quality of the data set description, user-friendliness, and others [28].
The above references are considered generic quality frameworks, i.e., they provide rather universal definitions which need to be concretised to specific (sub-)sectors and use-cases of data and information. There are some quality elaborations on subsectors of transportation, such as for roadside traffic-monitoring sensors [29] or crowd-sourced speed data [30]. For the parking sub-sector, however, only very few references to quality criteria or evaluations are identified.
One study qualitatively assessed various parking data sources based on the following aspects: time, personnel, and financial resources needed to acquire and process data; the geographic coverage of provided data; ability to transfer (or to extrapolate) information from reported locations to other locations; reference to parking demand groups (e.g., residents, employees, etc.); and updatability [9]. The study, however, lacks a further quantification or a scientific validation of such aspects.
Another study assesses the quality of information provided in parking information apps, via a ground-truth test in German and US cities [31]. This study examines the correctness of data attributes such as parking locations, price information, etc., i.e., if they correspond with findings from the ground-truth test.
The quality criteria and definitions identified here are reused later in this paper, i.e., refined and extended as quality criteria and metrics for the topic of parking data.
3. Materials and Methods
The main method applied in this study was a cross-check analysis, i.e., a comparative analysis of multiple independent data sources about a given subject. Cross-check analyses were previously used to improve the data base for mobility studies [32], or to gain quality insights about provided data sets [33].
For the cross-check analysis in this research, data from various emerging and conventional sources were collected in a defined study area in Hamburg, Germany, during the week September 12 to 18, 2022. The focus was on public on-street parking. For the data collection, a sequence of streets in the Hamburg district of Rotherbaum with a total length of approx. 2.1 km was selected. Figure 1 shows the study area as a hatched area.
Various external sources were used and supplemented with a manual survey. This survey is considered ground truth and is used for comparison with the external sources. Figure 2 symbolically shows the data sources used. The data sources and the collection methods are described in more detail below.
Transaction data were obtained from both parking meters and mobile phone applications. Meter data represent parking ticket sales by meters in the area, each with parking start times and parking durations. Transaction data from mobile phone applications represent ticket sales via mobile phone applications. The data indicate individual start and end times of paid parking tickets and the corresponding mobile phone zone.
Sensor data are provided by ground sensors which have been installed for live occupancy detection at individual on-street parking spaces. The ground sensors were installed as a pilot project for the Hamburg ITS strategy. The sensor operator, T-Systems International GmbH, provided a data set with raw sensor data, as well as a digital map with the sensor installation locations.
Parking API data relates to commercial data services via internet-based, application programming interfaces (APIs). INRIX, Inc., provided access to its parking data API covering the Hamburg study area The data contain locations and conditions of individual parking facilities, as well probabilities of finding a free spot at these facilities. The data were retrieved via a REST API in 5-minute intervals.
The Hamburg Geoportal is a website offering various georeferenced data from the city administration. The data is organised in different data sets, including information on residential parking areas, handicapped parking spaces, parking meter locations, and an inventory of public parking space. The data sets are provided as open data, so they could be easily downloaded.
The manual survey followed established procedures, as applied by German municipalities for on-street parking surveys. The study area was divided into 27 street sections, which were observed daily, each at three times of the day. In this way, different demand situations were recorded. Information on both parking supply and parking demand was collected via paper spreadsheets and then processed via Excel. In the surveyed area, 546 public on-street parking spaces were identified.
The data from the mentioned sources was harmonised and overlaid with a Geographic Information System (GIS). A base map from the city administration was used as the GIS basis. Data analyses were performed with QGIS software and a PostgreSQL database system with a PostGIS extension.
Next, several analyses of the harmonised and overlaid data were conducted. The goal was to generate statements on the local parking situation from the various data sources and to gain insights on their quality, which would subsequently serve as the basis for defining quality criteria. One focus of the analyses was on whether the various data are suitable for determining local parking demand, which is crucial information for parking managers. Specifically, the analysis examined whether and how the data sources can explain the magnitude and dynamics of parking demand over space and time.
The empirical observations from the cross-check analysis were then used to develop a set of quality criteria and metrics in the domain of on-street parking data and corresponding data sources. This approach approximates an inductive taxonomy development which is defined by “observing empirical cases, which are then analysed to determine dimensions and characteristics in the taxonomy” [34].
As a last step, these criteria and metrics were validated by applying them for the individual data sources used for the cross-check analysis.
4. Results
4.1. Exemplary Quality Implications
4.1.1. The Correctness Issue
This analysis compared how data on parking supply are represented by selected data sources. In particular, locations and amounts of physically available on-street parking spaces were considered, both from the Parking API and the Geoportal Hamburg. As a reference, the manual survey was taken as ground truth. The term "available" refers to physical availability, not occupancy. This value can change over the course of the day if parking regulations (e.g., parking bans) apply at certain times of the day.
It was found there are significant differences in the way individual on-street parking spaces are reported. Figure 3 shows a critical example: public parking in a side bay of a main road is captured quite differently. The manual survey (depicted on the left with a Google Earth snapshot which was recorded one month before the manual survey) reveals marked parking spaces, partially being affected by construction site. The Geoportal shows all theoretical parking sports, implying a higher availability of parking than actually exists. The Parking API does not show any parking spaces at all.
Similar disparities emerged across various locations in the study area. However, there was no consistent trend that one data source was always better than another one. Upon further examination, several explanations for deviations on reported parking spaces become apparent, including outdated information about unavailable parking due to construction sites, simplifications in parking space declaration in case of unmarked parking, etc.
Figure 4 shows the total number of available parking spaces in the entire area per data source, and in each case for three different times within a day. Values from the Parking API are 11% to 16% lower (depending on the time) than the manual survey. The values from the Geoportal, on the other hand, are 7% to 13% higher (depending on the time) compared to the manual survey. However, explicit patterns for such deviations cannot be derived. On the contrary, the deviations vary depending on the road section. In some sections there are no serious deviations at all.
Later in this paper, a proposal is given for capturing such deviations via correctness metrics.
4.1.2. The coverage Issue
The next analysis focused on the content coverage, i.e., the availability and the presentation of certain content elements within the data offering. A content element might be static information such as the locations of parking spaces, or dynamic information such as occupancy indicators. Content elements can be observed via the data schema, denoting the coverage as well as the structure (e.g., the granularity or the formatting) of individual content elements. Details of such schema analysis were noted in a tabular format. Table 3 shows an excerpt of such analysis.
Accordingly, both the coverage and the structure vary considerably per data source. Looking at the coverage, all data sources are populated differently in terms of content elements. Some data sources (such as the Geoportal) are broadly populated, i.e., they contain a large amount of different information, whereas other data sources are limited to a few content elements.
Data structure also varies by data sources, even if comparable information is available. For example, the time spans for parking regulations are sometimes entered as free text (e.g., "daily 9-20") or as differentiated value pairs (e.g., "Mondays from": "09:00"; "Mondays to": "20:00" etc.). The latter is considered more suitable for automated processing.
Lastly, some data sources reveal the same content elements via different outputs. For example, the amount of available parking spaces can be derived directly from explicit numbers, or indirectly by counting individual polygons given in a data source. For data consumers, this implies different efforts to data post-processing.
It was further analysed to which extent certain real-world entities are covered by a data set. In particular, it was tested whether transaction data can accurately reflect the total parking demand over time. Parking transactions from all parking meters located along the manually surveyed route segments were considered. Based on that, average occupancy values per hour were determined, being the average of active tickets for each minute of the respective hour. For comparison, occupancy data from the manual survey was again considered (here, data was extrapolated from isolated counts during selected hours to the entire day). The results were shown in occupancy profiles, noting average occupancies over one day. Figure 5 shows an example occupancy profile for September 13, 2022.
It is evident that transaction data only explains a small portion of occupancy numbers throughout the day, in comparison to the manual survey. Based on transaction data, the profile shows maximum occupancy values of around 50 vehicles, whereas the manual survey indicates around 350 parked vehicles in corresponding hours. This observation is similar to those of previous studies assessing the suitability of transaction data, see the literature review. The discrepancies in this case are mostly due to non-paying parking customers, in particular residents with resident parking permits. Furthermore, transaction data has an obvious gap in night-time hours, when parking tickets are generally not mandatory.
From a quality perspective, it is important to identify an adequate measure to explain the observed discrepancies. Consequently, a coverage metric is introduced later in this paper.
4.2. Definition of Quality Criteria and Metrics
4.2.1. Approach
Quality criteria assist quality assessments for one or more data offerings. Each quality criterion refers to a single viewpoint; there are usually several such criteria. Each criterion is associated with one or more metrics, each of which expresses quality values of a quantitative or qualitative nature.
A general prerequisite for quality criteria is that they should have general validity and transferability to different evaluation objects. Thus, different sources of parking data, different types of content data, and different local conditions (e.g., neighbourhoods or cities) should be assessable with the proposed criteria.
Further, the criteria definitions need to be related to the type of object being assessed. Previous definitions consider different data levels as assessment objects: attribute values, tuples, relations as well as entire databases [23]. This approach was simplified by introducing only two levels of assessment objects.
First, a data offering as a whole is considered. This contains one or more content data records, and additionally describes higher-level aspects such as the data schema used, access paths to the data, metadata, etc.
Second, a content data record is considered. This usually compiles information about one real-world entity or event, which is defined by the nature of the data source. For example, a data record might be a description of one individual parking facility, a time-stamped report from one parking sensor, etc. Each data record, in return, contains a set of distinct values. For the sensor example, this might be an ID, a time stamp, an event type, etc.
In the following subsections, definitions for individual quality criteria, associated metrics, and associated types of assessment objects are proposed.
Most of the definitions were adapted from previous quality frameworks cited in the literature review. However, these were reframed for the parking sector by revising and concretizing the existing definition attempts.
4.2.2. Coverage and Completeness
A data consumer may like to know whether and to what degree a data offering covers the desired data content before obtaining the data. There might be different reasons for the lack of the desired data content: systematic coverage gaps due to the detection methods, e.g., because some required data is never measured; or incomplete data, e.g., because of temporary interruptions of detectors. Thus, there are different approaches to capturing coverage and completeness, each represented by a different metric.
First, it is interesting to understand the coverage of content elements in any given data offering. In the cross-check analysis, it was discovered that each of the data sources covers different content elements in their data schemas. For example, some data sources offer localization data on individual parking spaces, whereas other data sources do not offer such localization at all, or only indirectly or on an aggregated level.
A Content Element Coverage Rate (CECR) is introduced. This provides a numerical statement of whether and how a certain content is available, according to the given data schema, see Equation 1.
With:
: content elements
: relative expressiveness of
: relative weight of
The expressiveness states whether an information element is present at all within a data offering. In case it is present, it says whether a direct or an indirect statement about the information element is possible, based on the input value. The latter is the case, if the desired information must be derived or interpreted from the input value by the data consumer.
For the expression of , the following values are proposed, see Table 4. The intermediate values 0.3 and 0.7 are defined intuitively, but can be determined based on the specific needs of the data consumers.
The relative weight can be used to consider whether and with which priority the data consumer requires certain content elements, e.g., because these elements are required for certain services or analyses. In that sense, the values are to be specified by the data consumer.
Second, another coverage metric is derived from the above-mentioned observation that transaction data only represent a portion of total parking demand. It is therefore important to capture two dimensions: the discrepancy of reported entities and the temporal trend of such discrepancies, as evidenced by the hourly occupancy profiles presented.
For this reason, a Temporal Occurrence Coverage Rate (TOCR) is introduced. This provides a numerical statement of whether a certain real-life occurrence is reported in a temporal context, whereas an occurrence might be an entity or event (ideally represented as a data record), see Equation 2.
With:
: a time unit
: total of time units
: number of occurrences being reported per time unit i
: number of occurrences in reality per time unit i
This metric first considers the ratios of reported vs. expected amounts of occurrences per assessed time unit, and then harmonizes the sum of these ratios for all time units under assessment.
Third, completeness is understood in terms of the existence of data records, in comparison to the expected amount of data records. A Data Record Completeness Rate (DRCR) is introduced, see Equation 3.
With:
: reported amount of data records
: expected amount of data records
All three metrics are calculated at the level of a data offering. The output value of these metrics is in the range between 0 and 1.
Looking at the latter metrics, it is necessary to clarify the difference between the coverage metric and the completeness metric . is considered an ex-ante measurement. Referring to the previous example where transaction data excluded some portions of parking demand, this measure will ex-ante capture such exclusions. The circumstances behind such exclusions (e.g., the fact that resident permits are never captured by transaction data) should be noted with this metric, to explain to the data consumer the reasons behind deficient coverage. In contrast, explains any missing data records which are supposed to be ex-post present in a data offering. For example, when only a portion of installed sensors provide data in a data offering, perhaps due to temporary malfunction, this metric will account for this portion. It is subject to change over time and should be measured regularly.
4.2.3. Correctness
Correctness is the deviation of the data in a data offering compared to reality. In the area of parking data, deviations are almost always to be expected due to the dynamics of parking conditions. Thus, the magnitude of deviations is mostly relevant when describing the correctness. For this purpose, various statistical metrics explaining the existence and character of deviations are introduced.
One starting point is the percentage deviation of value pairs. The deviation is to be calculated by comparing a ground truth and a comparison data offer, which is the data source under assessment. Thus, the ground truth will provide measured values , and the comparison data comparative values .
The calculation of a percentage deviation depends on the definition of the aggregate for which the deviations are calculated. In the above example from the cross-check analysis, deviations on available parking spaces for the entire area were shown. However, these aggregate numbers are biased as they do not reveal some small-scale or local effects. For example, values might be higher than values in one street segment, and vice versa in another street segment, so the area aggregate would even out both deviations.
Consequently, statistical metrics are introduced which look at individual deviations of value pairs within one data offering.
The Mean Absolute Error (MAE) and the Root Mean Squared Error (RMSE) consider the average error in the comparison between and , see Equations 4 and 5.
Both metrics are determined in the range between 0 and ∞ and are independent of the error direction. They are negatively oriented values, which means that lower values are better. However, with RMSE, taking the square root has an interesting effect: since the errors are squared before being averaged, RMSE gives high weight to large deviations. This underscores the special importance of RMSE holds in highlighting large deviations.
The metrics introduced above can now be calculated for any pair of values. A common use-case will be parking space counts (either as capacities or occupancies) in areas or street segments.
However, these metrics neglect the fact that the spatial units under consideration can vary greatly in parking capacity, which in turn can affect the quality score. For example: a deviation of 5 parking spaces is significant for a facility with a total of 20 parking spaces, while the same deviation is tolerable for a facility with a total of 200 parking spaces. Thus, it appears useful to employ a metric that evaluates deviations differently for "small" facilities compared to "large" facilities.
A variant of the above RMSE metric considers the size of the parking supply in the spatial unit to be evaluated. The quantity used is not the parking capacity, as this may be unknown, but the length of the street segment that applies to the value pair under consideration. Such lengths are usually easy to determine since data about on-street parking is often georeferenced to a street network including length information.
The length-weighted variant of the RMSE metric is formulated as Equation 6.
With:
: length of street segment
In the case of off-street parking facilities, such as parking lots, the street segment length could be replaced in the formula with an area figure.
Overall, some, or even all of the previously mentioned metrics can be used for the correctness evaluation of individual data offerings.
4.2.4. Timeliness
In terms of temporal aspects of data quality, there are two different concepts: the timely availability of data, and the freshness (or aging) of data.
The first concept captures the time offset for data availability, i.e., the time after which a data consumer can retrieve a requested information. A metric is proposed, defined as the time lag between the temporal validity of content data and the time of (earliest) availability to the data consumer.
This metric is highly relevant if the data is provided via automated interfaces, e.g., via an API, and has a real-time component. In such case, temporal dynamics have to be considered when calculating the metric. For example, for a data offer with real-time parking availability from sensor installations, it is recommended to measure several times (e.g., for each sensor message), and to provide statistical values (e.g., as mean values or 95% percentiles for the last month).
The age of the data considers the probability that values are still up to date when being assessed. Such probability has two influences: the data-collection date, derived from the temporal reference of the content data; and the decline rate, determining the portion of attribute values which is expected to be outdated in the time span between the data-collection date and the date of assessment. The latter aspect is considered relevant for parking data, as there might be significant differences in decline rates depending on the data type. Image parking availability data with a high decline probability vs. parking fee data with a lower decline probability. Former definitions are reused which apply a probabilistic approach to capture the influences of the data-collection date and the decline rate [35].
Accordingly, the metric is introduced on the data record level, see Equation 7. This metric examines the currency levels per content element (each in the range between 0 and 1) and averages them across all content elements. Both inputs, decline rates and ages, should be of the same temporal unit (e.g., years). It is proposed to apply average values for these inputs from, e.g., empirical evidence. This metric is rather suitable for data that are collected once and provided retrospectively.
With:
: content elements
: total of content elements
4.2.5. Exploitability
In addition to data-inherent aspects addressed by the previous criteria, it is worthwhile to explore data-subsistent aspects such as data access and reuse. These are less concerned with the data content itself and rather more focused on the abilities and possible efforts required for data consumers to obtain the data and utilize it for their own purposes.
Depending on the data sources, data access can be straightforward and self-explanatory or, on the other hand, time-consuming and requiring explanation. Data reusage refers to the ability of a data consumer to analyse the obtained data or to build services using the obtained data. This capacity can be either unrestricted or, conversely, subject to limitations.
describes the usability of the access route to the data, e.g.: is the content data sufficiently described via metadata?
describes the organizational requirements for obtaining and utilizing the data, e.g.: are standard licenses used?
describes the technical requirements for obtaining and using the data, e.g.: is the API well documented?
These three metrics describe a data offering via statements about the presence of certain features . They state whether a particular feature is present (=1) or not (=0). The statements are based on the usefulness from the point of view of the data consumer, so a "1" means a positive, and "0" a negative consumer experience.
Each of these three metrics is formed by the sum of such statements, see Equations 8-10.
Features are defined as follows, see Table 5, Table 6 and Table 7. In practice, a specific weight could be added to each feature, accounting for specific needs of data consumers. For example, the existence of an API () could be prioritised over the corresponding API documentation (). For reasons of simplification, the formulae above do not include such a weighting.
4.2.6. Validation
The quality criteria and metrics, as introduced above, were validated using real data sources from the Hamburg cross-check analysis. As far as possible, all metrics were formulated as concrete quality statements for all examined data offerings or their data records.
The metric was determined based on data schema from the manual survey, the Parking API and the Geoportal, which contain over a range of content elements. The relative weights were arbitrarily set. In a real quality assessment, these would have to be agreed upon in advance with real data consumers. Table 8 compiles the results. It is obvious that the Parking API gets the highest ranking, mostly because it presents most content elements in a direct way.
The metric was calculated from the above comparison of parking demand represented by transaction data vs. the total parking demand. Using data from September 13, 2022, the metric is calculated as 0.062, indicating a rather poor coverage.
The metric was based on parking meter data. It was checked whether all parking meters physically located in the study area were also covered in the corresponding data set. In fact, out of the 23 meters, one was missing from the data set, resulting in the metric calculation of 0.957.
Below, various correctness metrics for data from the Parking API and the Geoportal are documented. The focus of this analysis was the number of legally available parking spaces, i.e., the net capacity. The measured values are based on the manual survey, the comparative values are based on Parking API and the Geoportal, respectively. The analysis considers 36 street segments as spatial units, i.e., 36 value pairs are compared. Table 9 compiles the correctness metric results.
Here, the peculiarity of becomes clear: the Parking API is rated worse than the Geoportal in all cases, but the gap of the quality values decreases with , as the length weighting relatively improves the rating for the Parking API.
The metric was captured exemplarily for the Geoportal data source. The temporal reference for this source is unknown: the corresponding metadata only refer to "continuous updating." Based on internet research, a parking-data collection campaign by the City of Hamburg was carried out in 2015. Thus, the age of the Geoportal data is assumed to be 7 years, when taking the 2022 analysis as the reference point. Decline rates for selected data elements presented by the Geoportal were also assumed. In practice, they should be quantified from sample tests, for example.
Table 10 compiles the results. This example reveals the influence of data elements with high decline rates (in particular, capacity), decreasing significantly the overall average result for the entire data source.
The metric could be only partially captured. The manual collection further imposed a manual data post-processing time of approximately one week, which is equivalent to the availability latency. For the Parking API, the latency is close to zero, as the API provides a nearly latency-free data response for any data queries (subject to technical delays due to web services etc.). Availability latencies could not be quantified for the transaction and sensor data because all data sources were obtained with a certain time lag relative to the period of September 12-18, 2022. In practice, however, minimum latencies are expected, but these would need to be independently verified with the data providers.
Finally, the exploitability metrics were determined by checking the presence or absence of certain features. Overall, the calculation appears straightforward due to the binary characteristics of such features. Table 11 compiles the exploitability metric results. As a result, the Geoportal appears to be the best rated data source.
5. Discussion
This study established a foundation for quality assessment in the domain of parking data by defining applicable quality criteria and associated metrics. Such quality definitions aim to enable data providers to make robust quality statements about their data offerings, and to empower potential data consumers to evaluate a data source before procuring the data. Furthermore, the criteria and metrics aim to enable the comparison of different data offerings.
The quality definitions were derived from a cross-check analysis, i.e., a comparative analysis of available data about the parking situation in the study area in Hamburg, Germany. Six independent data sources were compared and analysed with respect to pre-defined research questions. The focus was on new types of data sources, particularly transaction data, sensor data, and data from a commercial Parking API. This analysis resulted in various findings regarding the coverage, informative value, and other quality aspects of parking data. Further, a set of universal quality criteria and quality metrics was derived from this analysis. Finally, the proposed quality metrics were validated by applying them to the analysed data sources in the cross-check analysis.
The validation provided some quantitative and transparent statements about the quality of the studied data sources. In most cases, unambiguous and interpretable values could be calculated. Considering the significant quality discrepancies identified for the data sources in Hamburg, the metrics can adequately capture such quality variations. Overall, the proposed quality criteria and the corresponding metrics appear to be suitable for future quality assessments in the on-street parking sector.
The validation further revealed no single data source with overall “best” quality levels. Instead, all the sources have some pros and cons when looking at specific metrics. For example, data from the Geoportal appears to have good coverage, but demonstrates some weaknesses regarding its up-to-datedness. Eventually, it depends on the individual assessment of a data consumer to find a preference for a particular data source, based on prioritization of certain metrics, or on minimum values for some metrics. A possible constellation for data consumers may be that two or more data sources need to be obtained and combined, to meet their quality needs.
A lingering concern pertains to defining the ground truth. Throughout the cross-check analysis, the manual survey values were often used as reference values in the calculation of quality metrics. However, it is unrealistic to assume that the manual survey is error-free and can be used unambiguously. For example, in certain street sections, it was not always straightforward to quantify the number of available parking spaces due to, for instance, unmarked spaces. Furthermore, the occupancy situation can change continuously during the survey and distort the survey results. Overall, a certain degree of uncertainty remains in reference values.
In practice, it is recommended to pay special attention to the trustworthiness of the ground truth source. This might include, e.g., a double reporting and inter-rated agreement tests to identify the extent of disagreement. It is also recommended to take account of such uncertainties when providing related quality criteria, e.g., by performing sensitivity analyses and by calculating related metrics as ranges.
6. Conclusions
The work presented follows an approach that other researchers have found beneficial for assessing data in unexplored data domains [6]. More concretely, it applies a bottom-up methodology to define relevant quality aspects in the data domain of on-street parking, based on a concrete data exploration.
As a result, the work provided a specialised quality framework for on-street parking data, in contrast to rather generic quality frameworks which have been presented before. Such specialization considers unique characteristics of data sources and data contents, which might be neglected in generic quality frameworks. This way, the presented work provides a ready-to-use basis for quality assessments in the field of on-street parking.
For future research on parking data quality, it is recommended to extend the validation tests to further demonstrate the suitability of the quality criteria proposed in this paper. Further validation could include additional types of parking data sources, or a larger sample of data with longer observation periods to account for the fact that parking demand may depend on seasonal effects or other factors. Moreover, the proposed quality definitions might be expanded or converted to similar sectors, such as off-street parking, park & ride facilities, or other elements of the transportation system.
For application of the proposed quality framework, it is recommended to reflect relevant data consumers and data use cases within a specific quality assessment, as suggested in other frameworks (Battelle et al., 2004). This means that the presented quality framework needs to be further concretised by selecting the appropriate quality metrics, prescribing ways to calculate and document these metrics, and defining acceptable or target levels for these metrics. In this context, it is worth noting that the “right” levels of quality depend on the abilities of data providers, on the one hand (e.g., technological efforts and advances of data collecting and processing), and the requirements of data consumers, on the other hand. In this sense, an intense dialogue between data providers and data consumers is suggested, via quality workshops conducted at stakeholder organizations, dedicated quality evaluations as part of pilot projects, and structured data requirements analyses on the data-consumer side.
As a final conclusion, quality criteria should be considered alongside metadata, which ideally accompany any data offering [5]. These provide additional information about the data provider, the geographical reference, licensing conditions, and more. This way, (potential) data consumers can use both quality criteria and metadata to assess the suitability and quality of a data source for their purposes. Various efforts have been made to include quality information in metadata descriptions [36]. It is recommended to adopt a similar approach for transportation and parking data, whenever related data sources are described via metadata.
Funding
Financial support was provided by European Commission as part of the NAPCORE project. NAPCORE is an EU-cofunded Programme Support Action under the GRANT AGREEMENT No MOVE/B4/SUB/2020-123/SI2.852232.
Data Availability Statement
The data presented in this study are available on request from the corresponding author due to restrictions given by third-party data providers who contributed to the cross-check data analysis.
Acknowledgments
The author thanks LBV for providing access to the data sources applied in the Hamburg cross-check analysis, and for providing insights into the practice of parking management; and Fraunhofer Institute for Transport and Infrastructure Systems IVI for support in data processing in GIS analysis.
Conflicts of Interest
The funders had no role in the design of the study; in the collection, analyses, or interpretation of data; in the writing of the manuscript; or in the decision to publish the results.
Abbreviations
The following abbreviations are used in this manuscript:
| API | Application Programming Interface |
| CECR | Content Element Coverage Rate |
| DRCR | Data Record Completeness Rate |
| GIS | Geographic Information System |
| ITS | Intelligent Transportation System |
| LBV | Landesbetrieb Verkehr |
| MAE | Mean Absolute Error |
| MDPI | Multidisciplinary Digital Publishing Institute |
| RMSE | Root Mean Squared Error |
| SPS | Smart Parking System |
| TOCR | Temporal Occurrence Coverage Rate |
References
- Ogás, M.G.D.; Fabregat, R.; Aciar, S. Survey of Smart Parking Systems. Applied Sciences (Switzerland) 2020, 10. [Google Scholar]
- Bonsall, P.W. The Changing Face of Parking-Related Data Collection and Analysis: The Role of New Technologies. Transportation (Amst) 1991, 18. [Google Scholar] [CrossRef]
- Arnd, M.; Cré, I. Local Opportunities for Digital Parking; Brussels, 2018.
- Lubrich, P. Analysis of Parking Traffic in Cologne, Germany, Based on an Extended Macroscopic Transport Model and Parking API Data. Case Stud Transp Policy 2023, 11. [Google Scholar] [CrossRef]
- Battelle; Cambridge_Systematics; Texas_Transportation_Institute Traffic Data Quality Measurement. Federal Highway Administration 2004.
- Sadiq, S.; Indulska, M. Open Data: Quality over Quantity. Int J Inf Manage 2017, 37. [Google Scholar] [CrossRef]
- Lubrich, P. Smart Parking Systems: A Data-Oriented Taxonomy and a Metadata Model. Transportation Research Record: Journal of the Transportation Research Board 2021, 2675, 1015–1029. [Google Scholar] [CrossRef]
- Dey, S.S.; Darst, M.; Dock, S.; Pochowski, A.; Sanchez, E.C. Asset-Lite Parking: Big Data Analytics in Development of Sustainable Smart Parking Solutions in Washington, D.C. Transp Res Rec 2016, 2559. [Google Scholar] [CrossRef]
- Hagen, T.; Schäfer, P.; Scheel-Kopeinig, S.; Saki, S.; Nguyen, T.; Wenz, K.-P.; Bellina, L. Ganglinien Als Grundlage Für Eine Nachhaltige Parkraumplanung; Frankfurt a.M. 2020. [Google Scholar]
- Yang, S.; Qian, Z. (Sean) Turning Meter Transactions Data into Occupancy and Payment Behavioral Information for On-Street Parking. Transp Res Part C Emerg Technol 2017, 78. [Google Scholar] [CrossRef]
- Schäfer, P.K.; Lux, K.; Wolf, M.; Hagen, T.; Celebi, K. Entwicklung von Übertragbaren Erhebungsmethoden Unter Berücksichtigung Innovativer Technologien Zur Parkraumdatengenerierung Und Digitalisierung Des Parkraums – ParkenDigital; Frankfurt am Main, Germany, 2019.
- Hagen, T.; Saki, S.; Scheel-Kopeinig, S. Start2park – Determining, Explaining and Predicting Cruising for Parking.
- Nawaz, S.; Efstratiou, C.; Mascolo, C. Parksense: A Smartphone Based Sensing System for on-Street Parking. In Proceedings of the Proceedings of the Annual International Conference on Mobile Computing and Networking, MOBICOM; 2013.
- Margreiter, M.; Orfanou, F.; Mayer, P. Determination of the Parking Place Availability Using Manual Data Collection Enriched by Crowdsourced In-Vehicle Data. In Proceedings of the Transportation Research Procedia; 2017; Vol. 25. [Google Scholar]
- Mathur, S.; Jin, T.; Kasturirangan, N.; Chandrashekharan, J.; Xue, W.; Gruteser, M.; Trappe, W. ParkNet: Drive-by Sensing of Road-Side Parking Statistics. In Proceedings of the MobiSys’10 - Proceedings of the 8th International Conference on Mobile Systems, Applications, and Services; 2010.
- Hellekes, J.; Kehlbacher, A.; Díaz, M.L.; Merkle, N.; Henry, C.; Kurz, F.; Heinrichs, M. Parking Space Inventory from above: Detection on Aerial Images and Estimation for Unobserved Regions. IET Intelligent Transport Systems 2023, 17. [Google Scholar] [CrossRef]
- Louen, C.; Föhrenbach, L.; Seitz, I.; ter Smitten, V.; Pielen, M. Analyse Der Merkmale Des Städtischen Parkens; 2022.
- Piovesan, N.; Turi, L.; Toigo, E.; Martinez, B.; Rossi, M. Data Analytics for Smart Parking Applications. Sensors (Switzerland) 2016, 16. [Google Scholar] [CrossRef]
- Gomari, S.; Domakuntla, R.; Knoth, C.; Antoniou, C. Development of a Data-Driven On-Street Parking Information System Using Enhanced Parking Features. IEEE Open Journal of Intelligent Transportation Systems 2023, 4. [Google Scholar] [CrossRef]
- Neumann, T.; Dalaff, C.; Niebel, W. Was Ist Eigentlich Qualitaet? - Versuch Einer Begrifflichen Konsolidierung Und Systematik Im Verkehrsmanagement / What Is Quality? - Terms and Systematization in Context of Traffic Management. Straßenverkehrstechnik 2014, 9, 601–606. [Google Scholar]
- Weigel, N. Datenqualitätsmanagement — Steigerung Der Datenqualität Mit Methode. In Daten- und Informationsqualität; 2009.
- Jayawardene, V.; Sadiq, S.; Indulska, M. The Curse of Dimensionality in Data Quality. In Proceedings of the Proceedings of the 24th Australasian Conference on Information Systems; 2013.
- Heinrich, B.; Klier, M. Datenqualitätsmetriken Für Ein Ökonomisch Orientiertes Qualitätsmanagement. In Daten- und Informationsqualität; 2015.
- Carvalho, A.M.; Soares, S.; Montenegro, J.; Conceição, L. Data Quality: Revisiting Dimensions towards New Framework Development. Procedia Comput Sci 2025, 253, 247–256. [Google Scholar] [CrossRef]
- Niculescu, M.; Jansen, M.; Barr, J.; Lubrich, P. Multimodal Travel Information Services (MMTIS) - Quality Package, Deliverable by EU EIP Sub-Activity 4.1; 2019.
- International Organization for Standardization Intelligent Transport Systems -- Integrated Transport Information, Management and Control -- Data Quality in ITS Systems (ISO/TR 21707:2008); 2008;
- International Organization for Standardization Geographic Information, Data Quality, Part 1: General Requirements (ISO 19157-1:2023); 2023;
- Venkatachalapathy, A.; Sharma, A.; Knickerbocker, S.; Hawkins, N. A Rubric-Driven Evaluation of Open Data Portals and Their Data in Transportation. Journal of Big Data Analytics in Transportation 2020, 2. [Google Scholar] [CrossRef]
- Jessberger, S.; Southgate, H. Innovative Individual Vehicle Record Traffic Data Quality Analysis Methods. Transportation Research Record: Journal of the Transportation Research Board 2023, 2677, 70–82. [Google Scholar] [CrossRef]
- Hoseinzadeh, N.; Liu, Y.; Han, L.D.; Brakewood, C.; Mohammadnazar, A. Quality of Location-Based Crowdsourced Speed Data on Surface Streets: A Case Study of Waze and Bluetooth Speed Data in Sevierville, TN. Comput Environ Urban Syst 2020, 83. [Google Scholar] [CrossRef]
- SBD Automotive Germany GmbH Global Parking Lot Data Accuracy Assessment: ParkMe vs. Parkopedia; 2016.
- Lenormand, M.; Picornell, M.; Cantú-Ros, O.G.; Tugores, A.; Louail, T.; Herranz, R.; Barthelemy, M.; Frías-Martínez, E.; Ramasco, J.J. Cross-Checking Different Sources of Mobility Information. PLoS One 2014, 9. [Google Scholar] [CrossRef]
- Berrebi, S.J.; Joshi, S.; Watkins, K.E. Cross-Checking Automated Passenger Counts for Ridership Analysis. J Public Trans 2021, 23. [Google Scholar] [CrossRef]
- Nickerson, R.C.; Varshney, U.; Muntermann, J. A Method for Taxonomy Development and Its Application in Information Systems. European Journal of Information Systems 2013, 22. [Google Scholar] [CrossRef]
- Heinrich, B.; Kaiser, M.; Klier, M. Metrics for Measuring Data Quality Foundations for an Economic Data Quality Management. In Proceedings of the ICSOFT 2007 - 2nd International Conference on Software and Data Technologies, Proceedings; 2007; Vol. ISDM. [Google Scholar]
- Hyvonen, E.; Albertoni, R.; Isaac, A. Introducing the Data Quality Vocabulary (DQV). In Proceedings of the Semantic Web; 2020; Vol. 12. [Google Scholar]
Figure 1.
Study area (shown as hatched area) for data collection in Hamburg, Germany (© background map: LBV Hamburg).
Figure 1.
Study area (shown as hatched area) for data collection in Hamburg, Germany (© background map: LBV Hamburg).
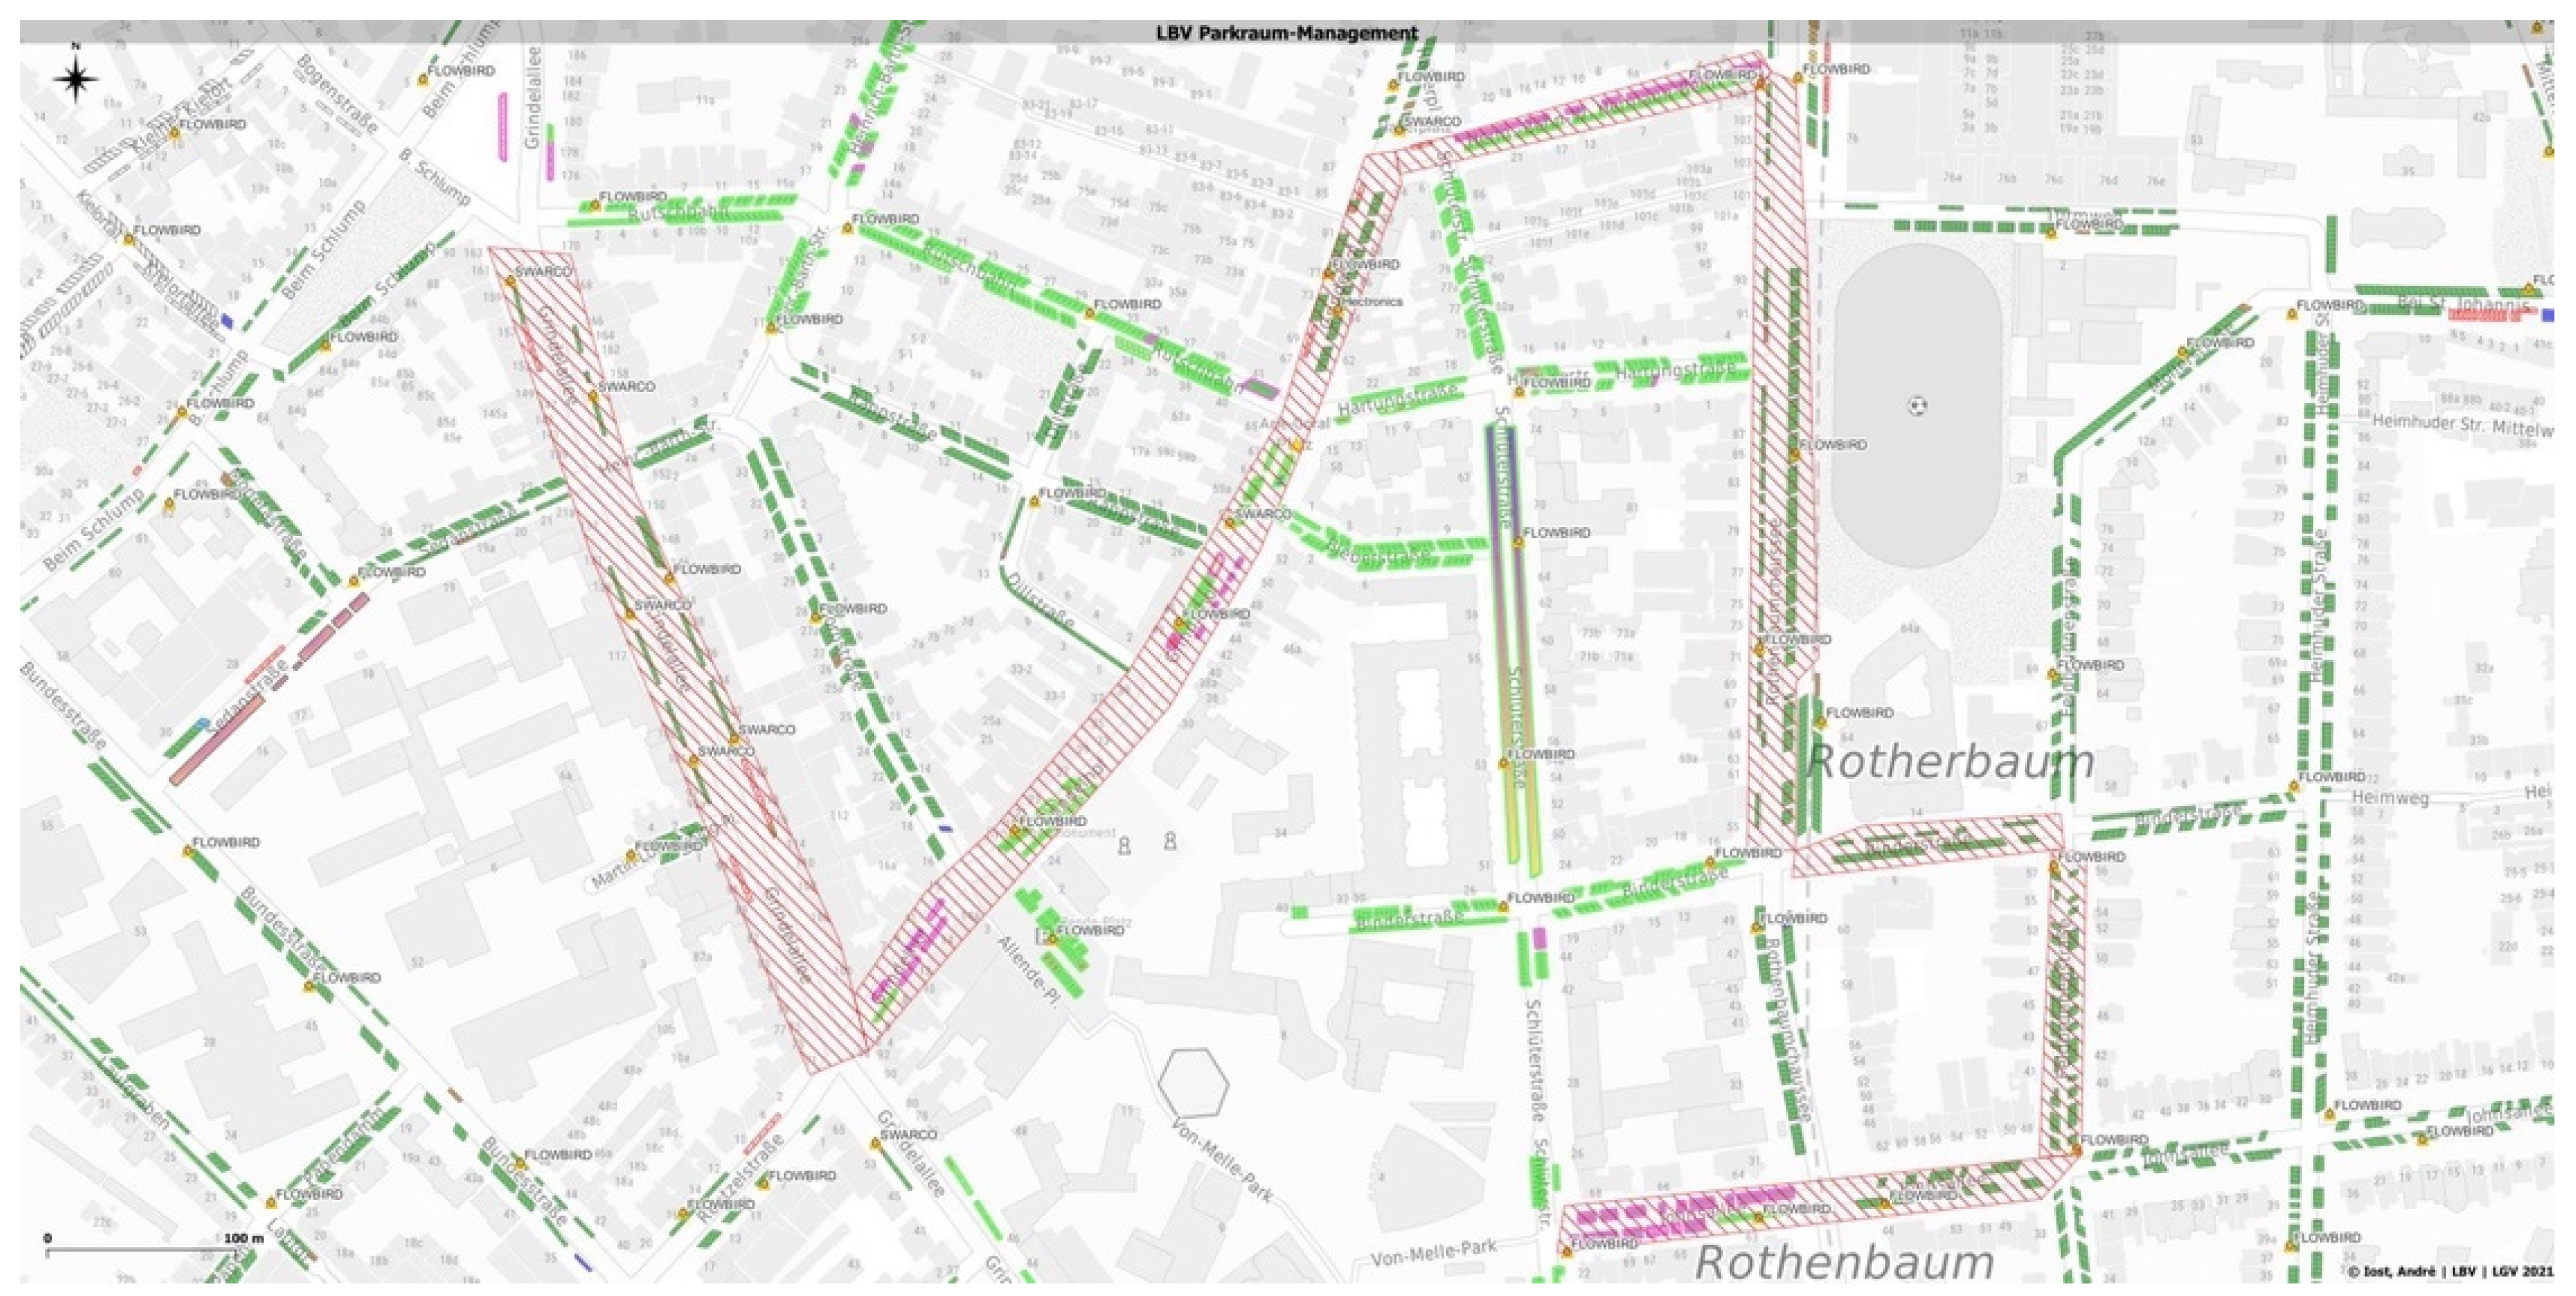
Figure 2.
Data sources used for cross-check analysis (© Smartparking; INRIX, Inc.; Landesbetrieb Geoinformation und Vermessung Hamburg; Peter Lubrich).
Figure 2.
Data sources used for cross-check analysis (© Smartparking; INRIX, Inc.; Landesbetrieb Geoinformation und Vermessung Hamburg; Peter Lubrich).
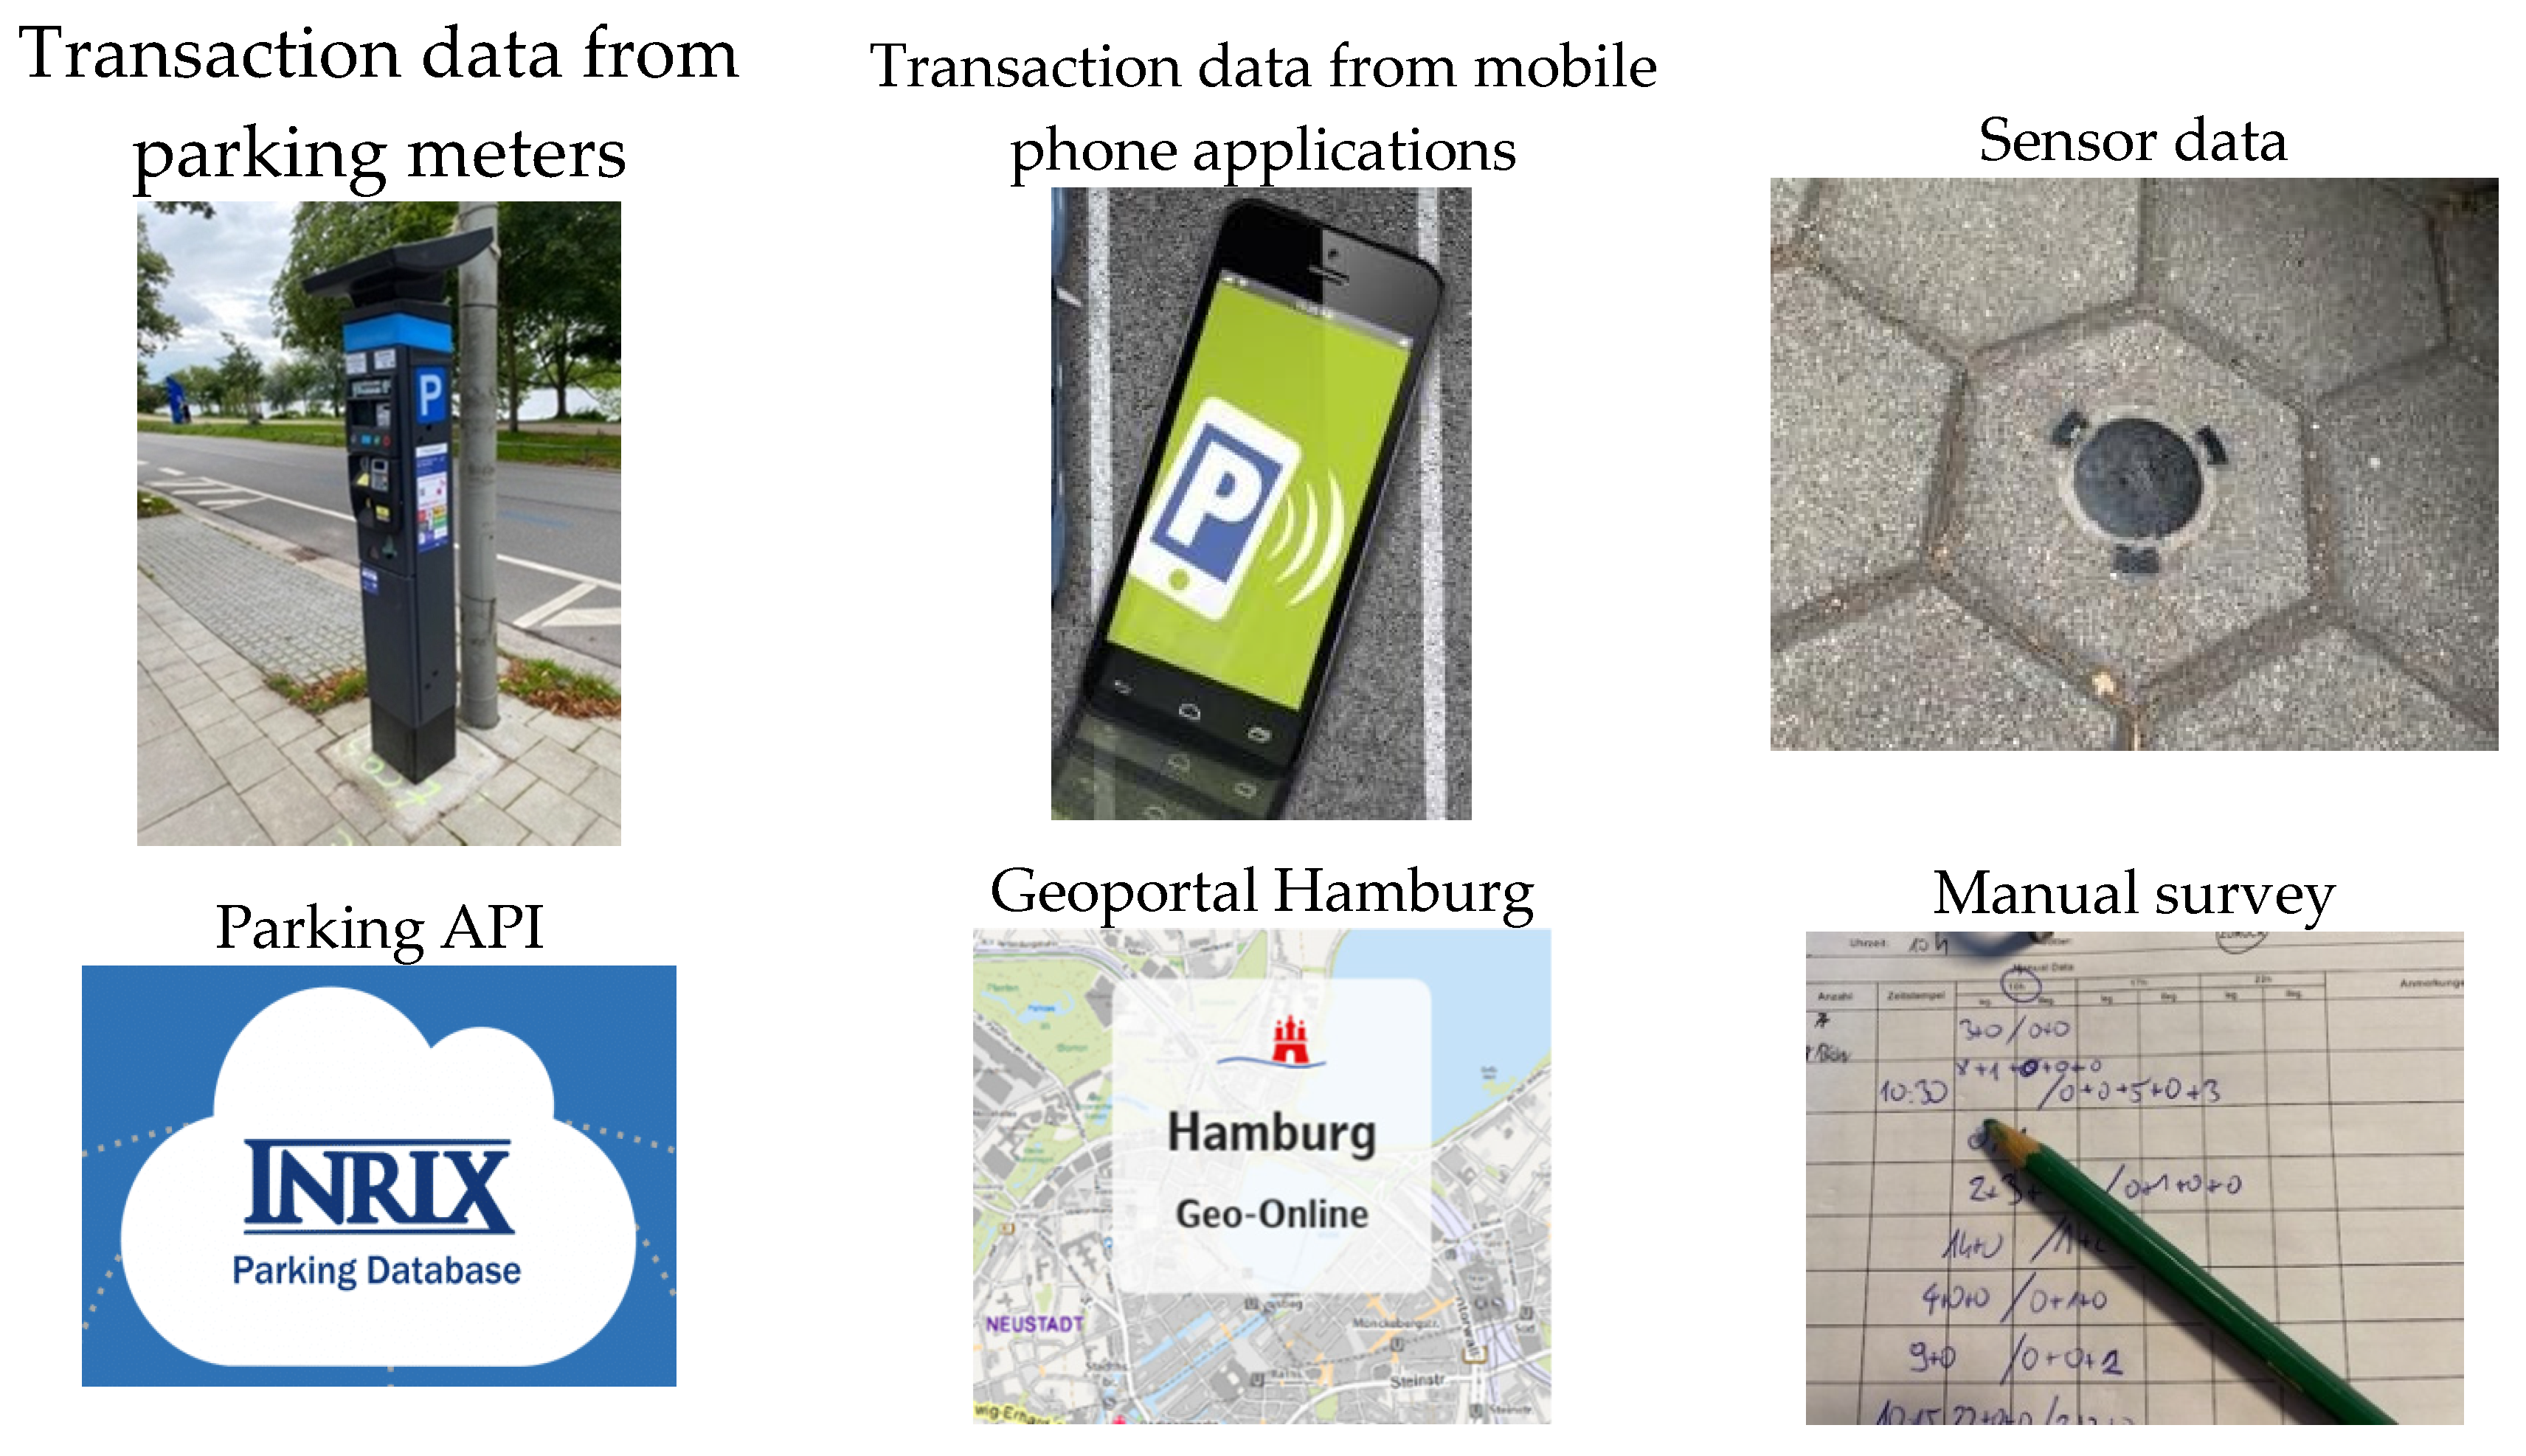
Figure 3.
Example on different representations of on-street parking spaces (© 2022 Google; Landesbetrieb Geoinformation und Vermessung Hamburg; INRIX, Inc.)
Figure 3.
Example on different representations of on-street parking spaces (© 2022 Google; Landesbetrieb Geoinformation und Vermessung Hamburg; INRIX, Inc.)
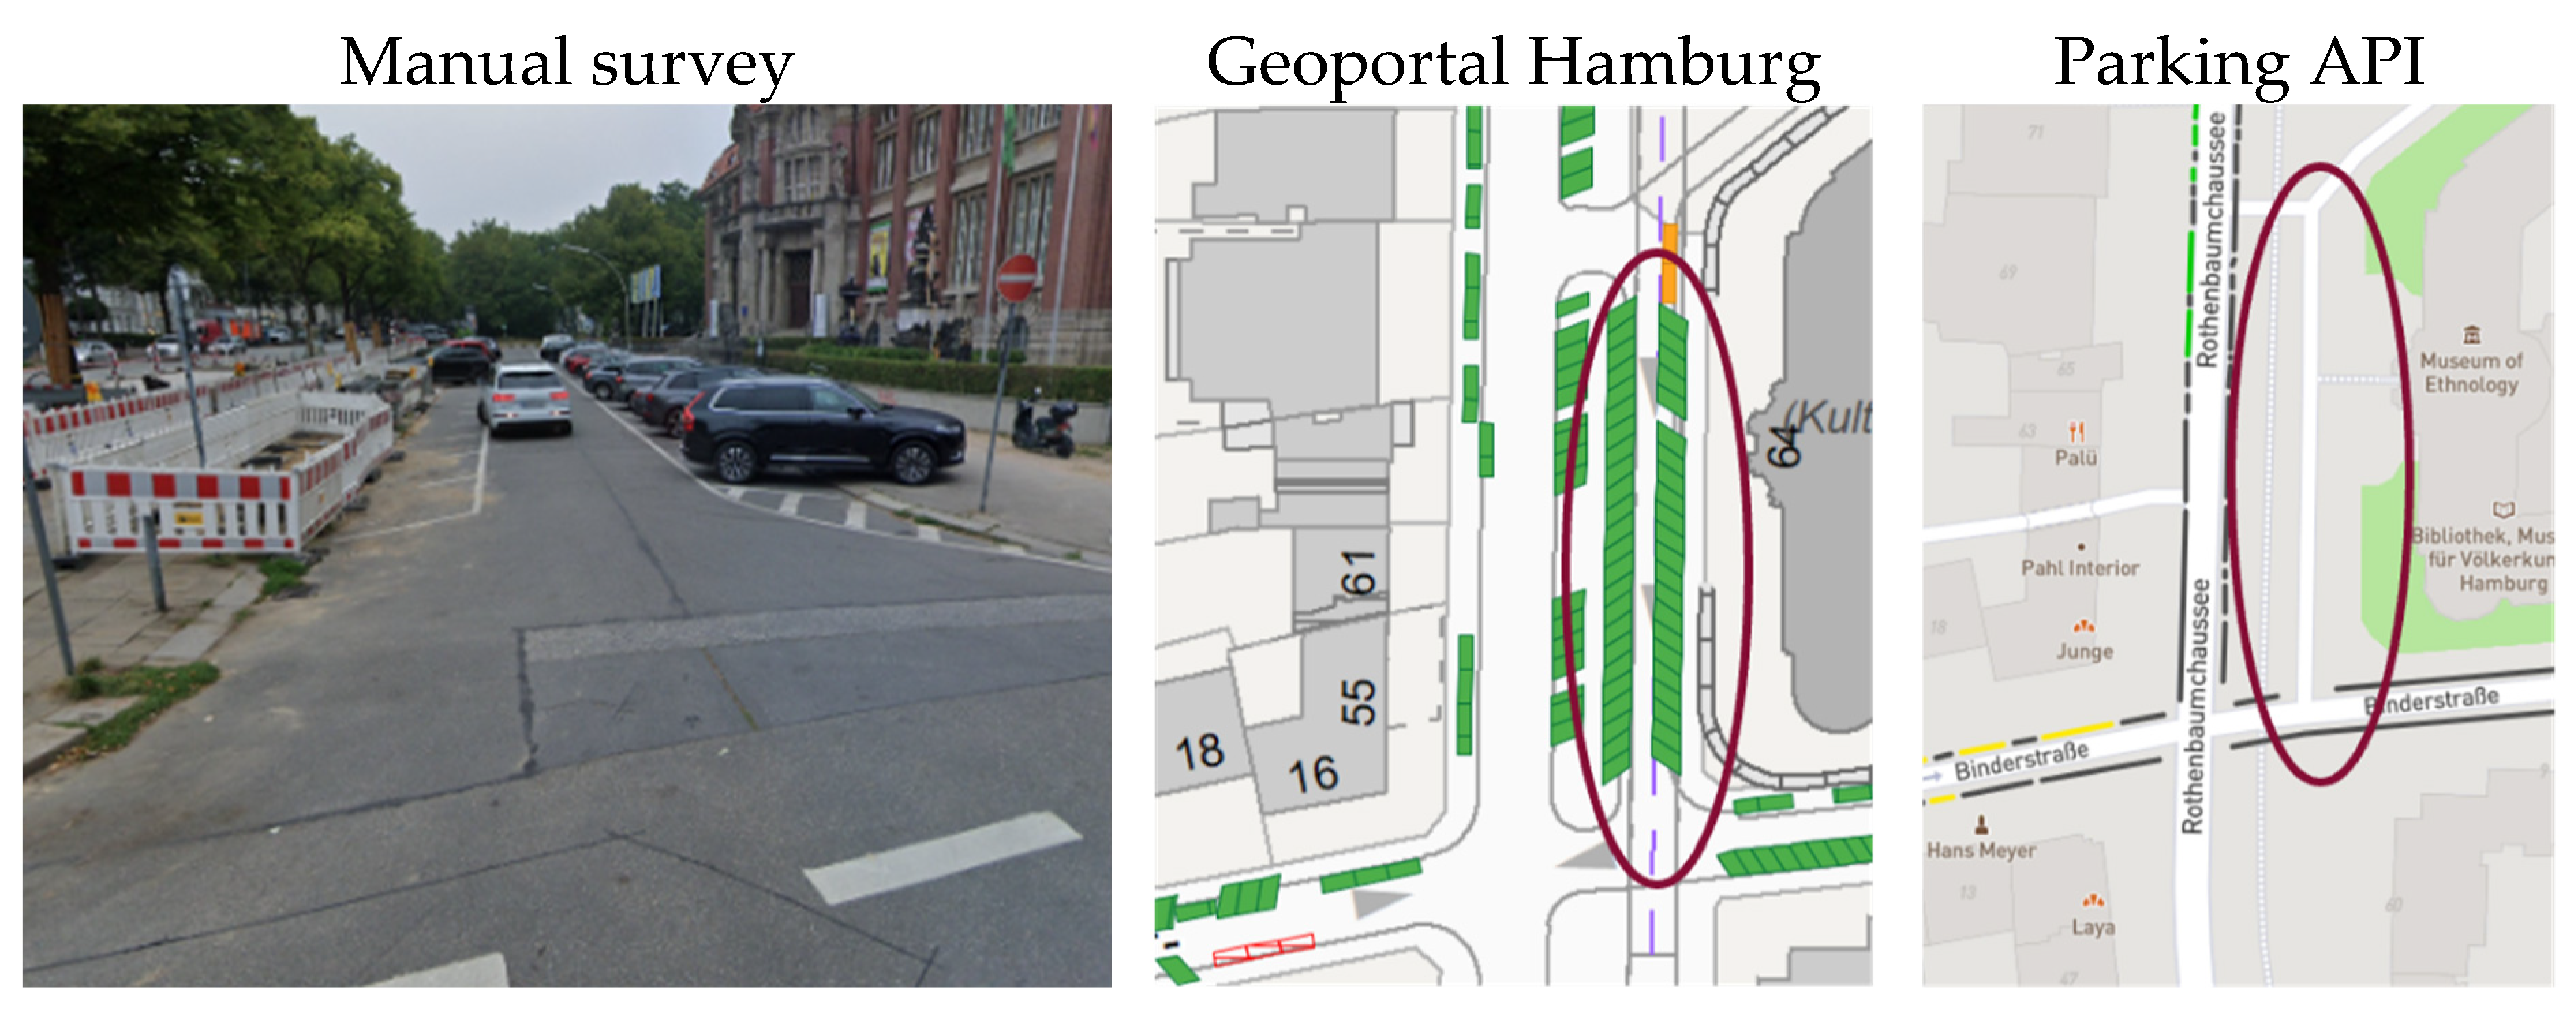
Figure 4.
Example on different representations of on-street parking spaces.
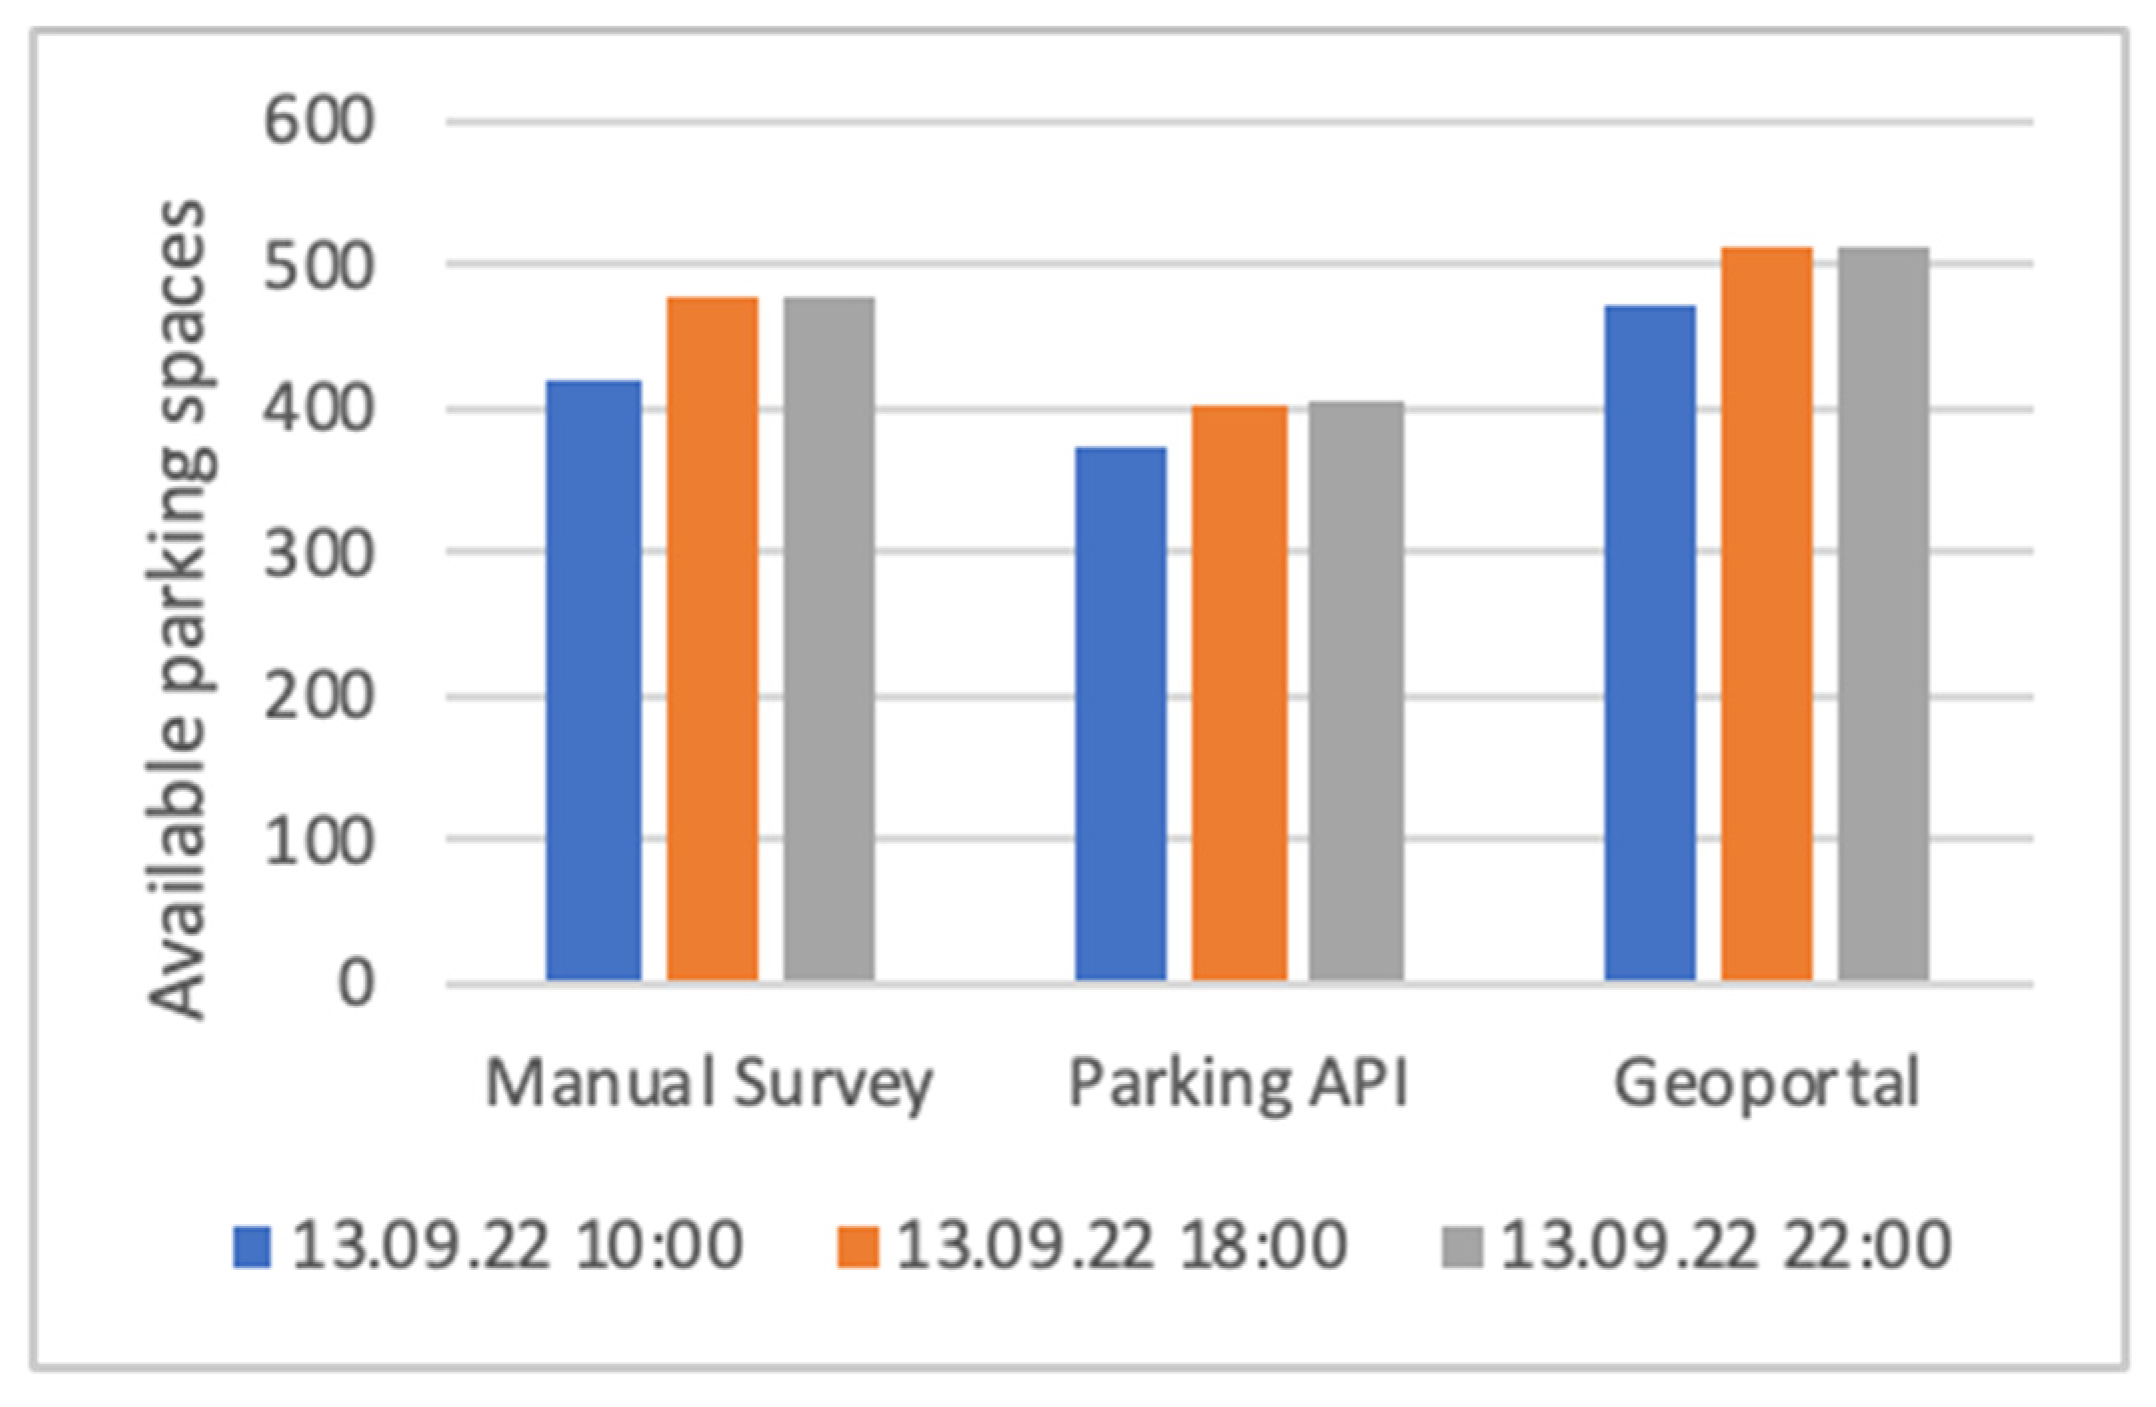
Figure 5.
Occupancy profile for September 13, 2022, derived from transaction data (in orange) and from manual survey (in blue).
Figure 5.
Occupancy profile for September 13, 2022, derived from transaction data (in orange) and from manual survey (in blue).
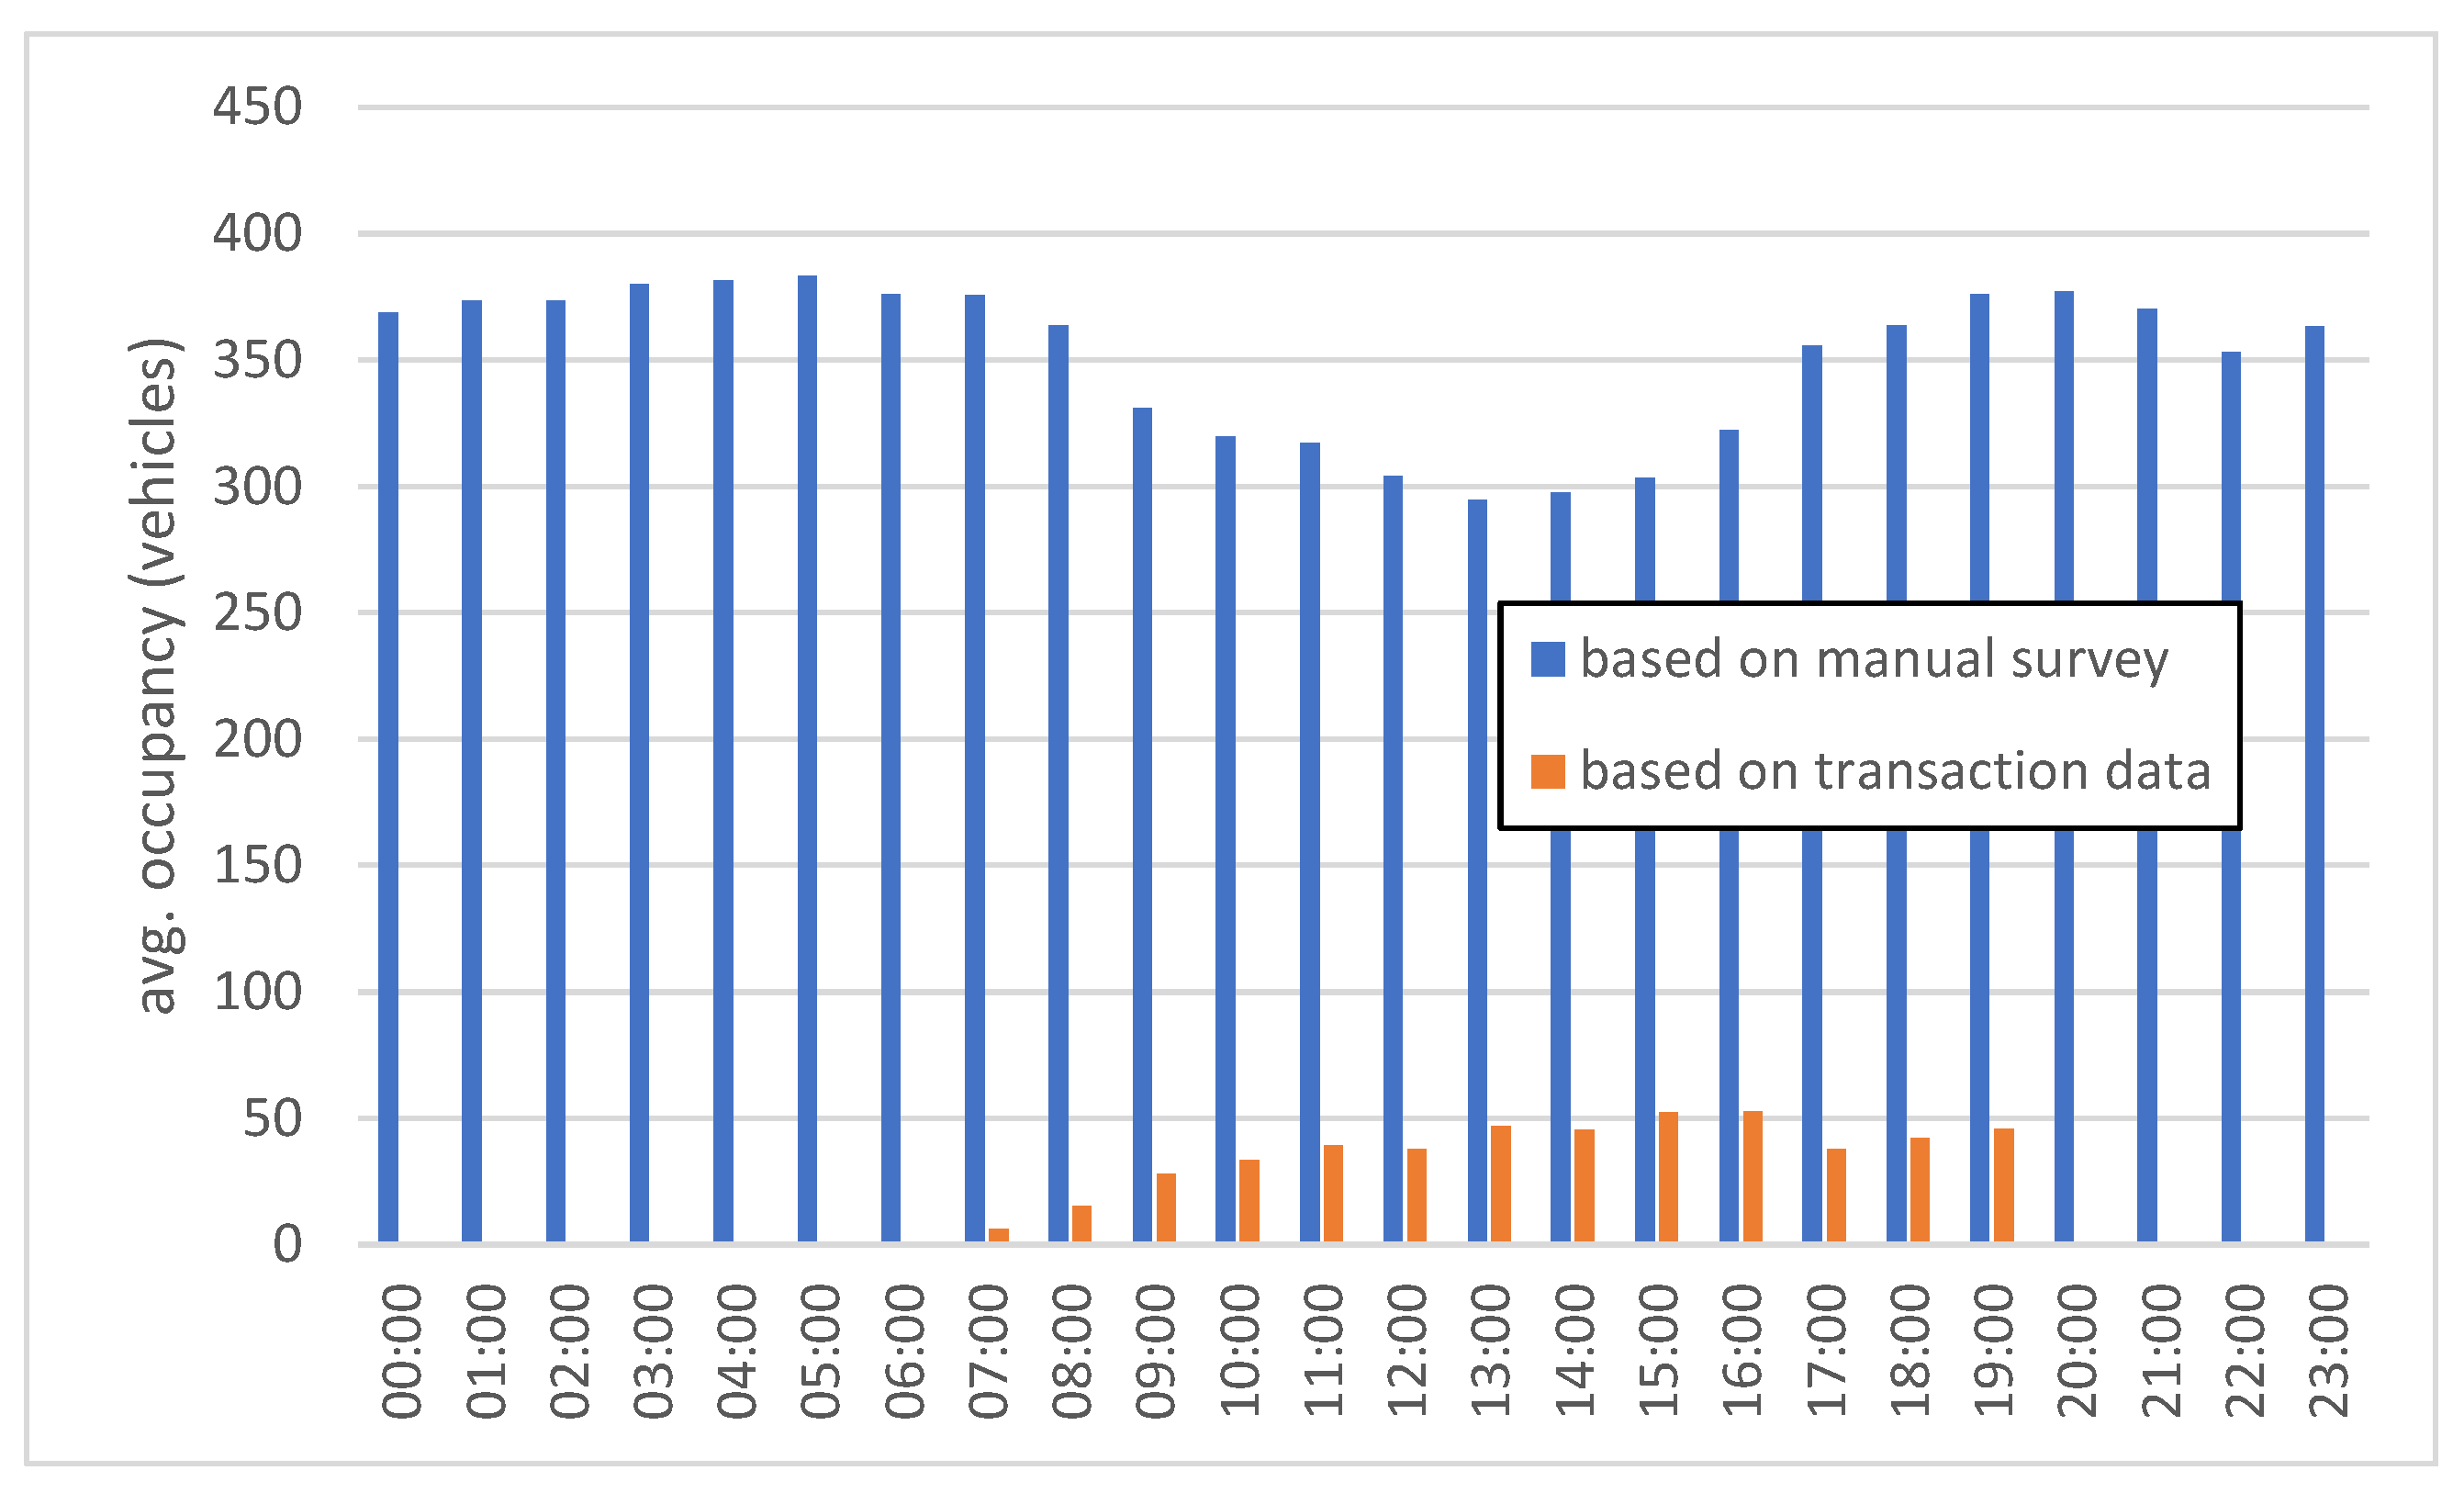

Table 1.
Use of emerging data sources in pilot and research projects about parking.
| Data Source | Use Case | Reference |
| Transaction data (parking meters) | Describe local parking demand including its temporal dynamics | [8,9,10] |
| Parking violation records | Derive parking supply data (location and type of on-street parking spaces) | [11] |
| Smartphone-based data | Record parking events and parking-search traffic | [12,13] |
| Vehicle-based data via ultrasonic sensors | Locate on-street parking spaces and their occupancy | [14,15] |
| GPS trip data | Determine parking demand and its temporal dynamics | [9] |
| Satellite imagery and land use data | Map public and private parking supply | [16] |
| Stationary, on-street sensors | Determine occupancy situation, with statistical methods to identify data anomalies and clusters of sensors with comparable demand patterns | [17,18] |
| Parking-event messages from connected vehicles | Predict occupancy of on-street parking spaces | [19] |
Table 2.
Relevant quality criteria from literature.
| The curse of dimensionality in data quality [22] | Data quality metrics for economically oriented quality management [23] | FHWA Traffic Data Quality Measurement [5] | EU EIP Quality Package [25] | ISO/TR 21707:2008 (International Organization for Standardization, 2008) [26] | ISO 19157-1:2023 [27] |
| Completeness Availability & accessibility Currency Accuracy Validity Reliability and Credibility Consistency Usability and Interpretability |
Completeness Freedom from errors Consistency Up-to-datedness |
Accuracy Completeness Validity Timeliness Coverage Accessibility |
Geographical coverage Availability Timeliness Reporting period Latency Location accuracy Classification correctness Error Rate Event coverage Report coverage |
Service completeness Service availability Service grade Veracity Precision Timeliness Location measurement Measurement source Ownership |
Completeness Logical consistency Positional accuracy Temporal quality Thematic quality |
Table 3.
Data schema analysis (excerpt).
| Content element | |||||||||||
| Data source | Information on parking regulations | Parking fees | Amount of parking spaces | Geometry of parking spaces | Parking space layout | Marked parking space | Surface type | Loading zones | Spaces reserved for disabled | Spaces reserved for taxi | Spaces reserved for Car Sharing |
| Manual survey |
T 1 | N/A | N | N/A | T | N/A | N/A | N | N | N | N |
| Parking API | Indirectly from fee information | N | N | G (street segments) |
N/A | N/A | N/A | N/A | N/A | N/A | N |
| Geoportal | T | N/A | Indirectly from geometry | G (individual spaces) | T | B | T | G | G | N/A | G |
| 1 N/A: Not available; T: Textual format; N: Numeric format; B: Boolean format; G: Geometry format | |||||||||||
Table 4.
Values of the expressiveness parameter for the Content Element Coverage Rate metric.
| Values of | Definition |
| 1 | Content element can be used directly without conversions and interpretations. |
| 0.7 | Content element must be converted (e.g., from a string to a float value). |
| 0.3 | Content element must be interpreted (e.g., the "number of parking spaces" must be derived from a geometric value). |
| 0 | Content element is not available. |
Table 5.
Feature definition for User Friendliness.
| Feature | Definition |
| Metadata is listed on an online portal. | |
| Metadata can be searched via an online portal. | |
| Content data can be searched via an online portal. | |
| Content data can be filtered via an online portal. | |
| There is a preview of the content data via an online portal. | |
| There are statistical functions for analysing content data via an online portal. |
Table 6.
Feature definition for Organizational Effort.
| Feature | Definition |
|---|---|
| Standard licenses are used (e.g., Creative Commons licenses) or the data can be used without any legal restrictions. | |
| No contracts need to be concluded between the data provider and the data consumer. |
Table 7.
Feature definition for Technical Effort.
| Feature | Definition |
|---|---|
| A web-based access mechanism (e.g., a programming interface/API) is available. | |
| A web-based access mechanism (e.g., a programming interface/API) is documented. | |
| Standard data formats are used. | |
| Data access is unlimited in terms of data volume and the number of data retrievals. | |
| Transparent information is provided on calculation methods and original data sources. | |
| Technical support is available. |
Table 8.
Content Element Coverage Rate results.
| Expressivenessper content element | QCECR | |||||||||
| Data source | Location =1) | Access conditions =1) | Payment methods =1) | Capacity =1) | Resident-only restrictions =0,5) | Loading bays =0,5) | Disabled parking =0,5) | Taxi stands =0,5) | Car Sharing stands =0,5) | |
| Manual survey | 0,5 | 0,5 | 0 | 1 | 1 | 1 | 1 | 1 | 1 | 4,08 |
| Parking API | 1 | 1 | 1 | 1 | 1 | 0 | 1 | 0 | 1 | 5,08 |
| Geoportal | 1 | 0,3 | 0,5 | 0,3 | 0 | 0,5 | 0,5 | 0 | 0,5 | 2,64 |
Table 9.
Correctness metrics results.
| Data source | |||
|---|---|---|---|
| Parking API | 11,17 | 15,84 | 14,58 |
| Geoportal | 5,19 | 6,18 | 6,25 |
Table 10.
Currency results for the Geoportal data source.
| Location | Access conditions | Payment methods | Capacity | Resident-only restrictions | Loading bays | Disabled parking | Taxi stands | Car Sharing stands | |
| (years) | 7 | 7 | 7 | 7 | 7 | 7 | 7 | 7 | 7 |
| (1/year) | 0 | 0,5 | 0,3 | 2 | 0,3 | 0,5 | 0,5 | 0,5 | 0,5 |
| 1,000 | 0,030 | 0,122 | 0,001 | 0,122 | 0,030 | 0,030 | 0,030 | 0,030 | |
| 0,155 | |||||||||
Table 11.
Exploitability metrics results.
| Data source | |||||||||||||||||
| Transaction data (parking meters) | 0 | 0 | 0 | 0 | 0 | 0 | 0 | 1 | 1 | 2 | 0 | 0 | 0 | 1 | 0 | 0 | 1 |
| Transaction data (mobile phone applications) | 0 | 0 | 0 | 0 | 0 | 0 | 0 | 1 | 1 | 2 | 0 | 0 | 0 | 1 | 0 | 0 | 1 |
| Sensor data | 0 | 0 | 0 | 0 | 0 | 0 | 0 | 0 | 0 | 0 | 1 | 0 | 0 | 1 | 0 | 0 | 2 |
| Parking API | 1 | 0 | 1 | 1 | 1 | 0 | 4 | 0 | 0 | 0 | 1 | 1 | 0 | 0 | 0 | 1 | 3 |
| Geoportal | 1 | 1 | 1 | 1 | 1 | 0 | 5 | 1 | 1 | 2 | 1 | 1 | 0 | 1 | 0 | 1 | 3 |
| Manual survey | 0 | 0 | 0 | 0 | 0 | 0 | 0 | 1 | 1 | 2 | 0 | 0 | 0 | 1 | 1 | 0 | 2 |
Disclaimer/Publisher’s Note: The statements, opinions and data contained in all publications are solely those of the individual author(s) and contributor(s) and not of MDPI and/or the editor(s). MDPI and/or the editor(s) disclaim responsibility for any injury to people or property resulting from any ideas, methods, instructions or products referred to in the content. |
© 2025 by the authors. Licensee MDPI, Basel, Switzerland. This article is an open access article distributed under the terms and conditions of the Creative Commons Attribution (CC BY) license (http://creativecommons.org/licenses/by/4.0/).
Copyright: This open access article is published under a Creative Commons CC BY 4.0 license, which permit the free download, distribution, and reuse, provided that the author and preprint are cited in any reuse.


