
Submitted:
23 June 2025
Posted:
25 June 2025
You are already at the latest version
Abstract
The objective of this study was to evaluate the temporal trend of suicide deaths and the disparities in the occurrence of the event between Indigenous and non-Indigenous populations. This ecological study analyzed deaths from intentionally self-inflicted injuries in the Southern Region of Brazil (states of Paraná, Santa Catarina and Rio Grande do Sul) from 2010 to 2019. The variables analyzed included annual frequency of events, age, sex, marital status, and education level. Descriptive analysis, association measures, and verification of temporal trends were performed. The average age-standardized suicide mortality rate for both populations was approximately 9.0 per 100,000 inhabitants, with a predominance among males (80%), single individuals (65%) and youth (37%). When only the state of Paraná was considered, the mortality rate during the period was 12.41 among the Indigenous population versus 6.94 per 100,000 inhabitants in the non-Indigenous population. In this state, the probability of the event was found to be almost twice as high among Indigenous men and women, with 13 times greater odds of death among Indigenous children and youth. A statistically significant temporal increase in the number of cases was observed only in the non-Indigenous population. An annual seasonal pattern of events among Indigenous individuals was suggested. The findings indicate a high suicide rate among the Indigenous population, particularly in Paraná, especially among young, single individuals, with a growing trend over the years.
Keywords:
suicide
; population groups
; indigenous people
; time series studies
Introduction
The World Health Organization (WHO) estimates that more than 800,000 people die by suicide each year, equivalent to one person every 40 seconds. In 2019, there were approximately 703,000 suicide deaths—exceeding the number of deaths caused by homicide or war. This corresponds to a global age-standardized suicide rate of 9.0 per 100,000 inhabitants [1].
In Brazil, the age-standardized suicide rate for 2019 was estimated at 6.4 per 100,000 inhabitants, with significant differences between sexes: 2.8 among women and 10.3 among men [1]. These disparities are not limited to sex; other variables, particularly socioeconomic and cultural factors, are also important, especially among vulnerable groups such as Indigenous peoples.
Researchers have urged the WHO to address what they describe as a universal phenomenon of elevated suicide rates among Indigenous populations [2]. Notable examples include alleged epidemics in Inuit communities in North America, Amazonian tribes in the Guianas, and Aboriginal peoples in Australia [2].
In Brazil, several studies have documented increasing suicide rates among the Guarani Kaiowá and Guarani Nandeva Indigenous communities in the state of Mato Grosso do Sul (Central-West Region). From 2000 to 2003, 194 suicides were reported, representing 50% of all deaths due to external causes and about 10% of total deaths in the studied population [3]—which is well above expected levels for the general population.
A systematic review examined, in addition to sociodemographic elements, risk factors such as poverty, family and cultural disorganization, alcohol problems, and land conflicts [4]. The review included data from populations in the North and Central-West regions (Terena, Kadiweu, Guató, Ofaié-Xavante, Guarani, Guarani-Kaiowá, and Guarani-Nandeva), but offered no information on Indigenous populations from the South of Brazil [4].
The Southern Region of Brazil comprises the states of Paraná, Santa Catarina, and Rio Grande do Sul, where approximately 75,000 individuals self-identify as Indigenous. There are four main ethnic groups: Guarani, Kaingang, Xokleng, and Xetá [6]. The Guarani are the second-largest Indigenous group in Brazil, followed by the Kaingang [7]. The last two reside in territories belonging to the others and are on the verge of cultural extinction [6].
Given the importance of the topic, the scarcity of studies, and the vulnerability and invisibility of these populations, this study aimed to analyze the temporal trend in deaths from self-inflicted injuries among Indigenous and non-Indigenous populations in Southern Brazil, assessing disparities across different sociocultural variables.
Materials and Methods
This is an ecological time-series study analyzing trends in suicide mortality in the Southern Region of Brazil
Suicide data were obtained from the Mortality Information System (SIM), maintained by the Health Surveillance Secretariat (SVS), using the TABNET tool of the Department of Informatics of the Brazilian Unified Health System (DATASUS). Within this tool, in the “Vital Statistics” section, data on deaths from external causes were collected for the region of interest from 2010 to 2019. The group “Intentionally self-inflicted injuries” in the International Statistical Classification of Diseases and Related Health Problems (ICD-10) corresponds to codes X60 through X84. The analyzed variables included, in addition to the number of events, sex, age, marital status, and educational attainment. The comparison was made between the Indigenous population and the non-Indigenous population of each state, the latter defined as the total population minus the number of individuals who self-identify as Indigenous in official statistical surveys (in Brazil, this is indicated by the “race/color” variable).
The national population census conducted by the Brazilian Institute of Geography and Statistics (IBGE) was disrupted due to the COVID-19 pandemic in 2020. The Indigenous population was estimated using the geometric growth rate of the general population. Age- and sex-specific Indigenous population estimates were based on their relative share in the total population, following methodologies used in official studies [8]. Mortality data were then age-standardized using the direct standardization method, based on the WHO standard population [9]. Standardization consists of a weighted average of age-specific mortality rates for the population of interest, reflecting the expected values if the age distributions were identical.
Descriptive analyses were conducted to generate frequency tables and graphs characterizing the study population. Absolute and relative frequencies were used for categorical variables.
To assess the presence of trends in suicide rate series, the Mann-Kendall trend test was used, with a significance level of α = 0.05. Trend verification also included graphical analysis of each time series and linear trend lines generated through linear regression models. This approach was chosen due to the small number of observations across time, which limits the application of more sophisticated time-series models. The odds ratio (OR) was used as the measure of association. A significance level of α = 0.05 was adopted, corresponding to a 95% confidence interval.
All statistical analyses were performed using Microsoft Excel® and the R statistical computing environment (R Development Core Team), version 3.5.
As this study involved the use of public, non-identifiable epidemiological data, it was not subject to review by the Ethics Committee (CEP/CONEP), in accordance with Article 1, Sole Paragraph, of Resolution No. 510, of April 7, 2016, of the Brazilian National Health Council.
Results
During the analyzed period, approximately 25,000 suicide deaths were recorded in the Southern Region of Brazil, of which 68 occurred among the Indigenous population, representing 0.27% of deaths. This proportion is similar to the share of individuals who self-identify as Indigenous in the region, which is 0.28% (Table 1).
The age-standardized suicide mortality rate over the decade was 89.15 per 100,000 inhabitants for the Indigenous population and 92.90 for the non-Indigenous population. Paraná was the only state where a comparatively higher rate was observed among the Indigenous population: 124.14 versus 69.43 per 100,000 inhabitants. Of all suicide deaths among Indigenous people in the Southern Region, 47% occurred in Paraná.
Males were more affected in both populations and across all states. Paraná exhibited the highest suicide rates among Indigenous individuals, regardless of sex (Figure 1). The odds ratios between the populations were significant: suicide was almost twice as likely among Indigenous males (OR = 1.69; 95% CI: 1.13–2.53) and females (OR = 2.25; 95% CI: 1.13–4.52) (Table 2).
When analyzing age, Indigenous individuals died by suicide at younger ages, with rates of 5.57 versus 0.93 per 100,000 in the 0–14-year age group, and 27.97 versus 4.77 in the 15–19-year age group. This corresponds to a sixfold greater risk among Indigenous children (OR = 6.02; 95% CI: 2.48–14.62). However, data suggest that being Indigenous above age 40 was a protective factor compared to the general population (Table 2).
Regarding educational attainment, literate Indigenous individuals who had not completed secondary school had the highest suicide rate: 68.48 per 100,000 inhabitants (OR = 1.87; 95% CI: 1.29–2.71). In both populations, the lowest rates were observed among those who had not completed primary school. Regarding marital status, the highest rates for the non-Indigenous population were among separated individuals. No suicide deaths were recorded among divorced Indigenous individuals—a subgroup that represented 5.5% of the total.
In 2010, there were 2,150 suicide deaths among non-Indigenous individuals in the Southern Region, increasing to 3,154 in 2019 (Figure 2). Among Indigenous individuals, the absolute number of deaths was small—4 in 2010 and 13 in 2019—representing a 325% increase, compared to a 45% increase among the non-Indigenous population. Notably, Rio Grande do Sul consistently had the highest annual suicide rate when considering the total population.
The Mann-Kendall trend test results indicated statistically significant increases over time (p < 0.01) in the non-Indigenous population. In contrast, no statistically significant trend was observed among the Indigenous population (Table 3). However, a curious seasonal pattern was noted in some states, as illustrated in the graphs (Figure 2).
Discussion
Numerous studies have addressed the phenomenon of suicide among Indigenous populations—whether in Brazil [4], Latin America [10], or other parts of the world [11]. Specifically in Brazil, previous research has analyzed the sociodemographic characteristics of vulnerable populations [12], with a focus on specific regions [13] or ethnic groups [14]. The present study examined suicide among the Indigenous population of Southern Brazil, a region with the highest general suicide mortality rate in the country over several decades [15].
Time-series studies are widely used and have consistently shown an upward trend in suicide mortality rates in Brazil [16,17]. Our findings corroborate this pattern in the general population of the Southern Region, with a clear upward trend. It is noteworthy that the amplitude of the values observed among Indigenous individuals was greater, although no statistically significant trend was identified using the applied statistical model. However, it must be considered that the number of events in the Indigenous group was very small (68 cases over 10 years), which may have limited the statistical power. The age-standardized suicide mortality rate among Indigenous people rose from 5.32 per 100,000 inhabitants in 2010 to 17.30 in 2019. This is not unprecedented; rapid increases have historically occurred among other Indigenous populations worldwide. For example, suicide rates increased by 800% among Aboriginal peoples and Torres Strait Islanders in Australia between 1981 and 2002, and by 1,600% among the Inuit of Greenland over approximately 100 years [18].
The seasonal pattern observed in suicide mortality among the Indigenous population of Southern Brazil is noteworthy, although it was not statistically evaluated in this study. Nonetheless, seasonal suicide patterns are well documented in the literature, typically within a single year, with some countries showing unimodal or bimodal peaks, often with higher incidence in April [19]. In this study, the observed pattern was annual, with years of peak incidence followed by marked declines. Although this could be a random finding due to the small number of events, three peaks were observed over a 10-year period. If this pattern proves consistent, two hypotheses may be considered: (1) the Werther effect [20], a phenomenon in which suicide rates increase following a specific and publicized event—also referred to as the copycat phenomenon; and (2) preventive responses, in which health and social support systems respond to sudden increases in suicide deaths by implementing targeted interventions.
Based on data from Indigenous Lands and Reserves (IL and IR, respectively) from the 2010 IBGE census [21], it is possible to compare suicide mortality rates by aiming deaths within municipalities where reserves are located and dividing by the respective populations. For example, in the Avá-Guarani IR (Ocoi), there were 630 inhabitants in 2010, and in the Faixinal IL, 605 inhabitants. The respective suicide rates between 2010 and 2019 were 634.92 (4 deaths) and 330.58 (2 deaths) per 100,000 inhabitants [22]. The primary difference between these two communities is ethnicity: Guarani Kaiowá in the former and Kaingang in the latter. A study conducted by Lazzarini et al. (2018) in villages near Dourados (State of Mato Grosso do Sul) examined the phenomenon among youth. In Bororo village, the suicide rate was 115 per 100,000 inhabitants. In Jaguapiru, where the Guarani population constitute less than 30% of the Indigenous population, the probability of suicide was five times lower [23].
Between 2010 and 2019, 25 suicide deaths (37%) occurred among Indigenous youth aged 15–19. Nationally, Indigenous children aged 10 to 14 have an 18-times higher suicide mortality rate compared to the general population of the same age and location, suggesting localized endemic patterns and intergenerational family histories [24]. Moreover, in cases involving Indigenous youth, there appears to be an intrafamilial pattern, with multiple occurrences at the same address, as suggested by clustering analyses [23]. It is well documented that a positive family history of suicide in a first-degree relative is a major risk factor for planned suicide attempts [25].
Regarding marital status, the highest prevalence of suicide deaths was among single Indigenous individuals, accounting for approximately 65% of cases in the study region. This likely overlaps with the age distribution, as most single individuals were younger. The “marriage protection” theory is well established. This protective factor appears stronger among men and young individuals and is not limited to suicide as a cause of death [26].
The limitations of this study stem primarily from outdated demographic data. The Brazilian census was conducted in 2010 [5], and it remains the most reliable source of population information. For this reason, alternative population estimation methods, such as interpolation between two known points, could not be applied. This limitation was addressed through estimation techniques consistent with those used in official studies [8].
Another relevant limitation is the geographic dispersion of the target population. Approximately half of the Indigenous population in the studied region lives in Indigenous lands [27], while the other half resides in urban centers. However, the results reflect cumulative events regardless of this distinction.
In summary, the greatest risk of suicide death was observed among Indigenous individuals who were male, young, and single, particularly those residing in the state of Paraná.
Conclusions
This study aimed to provide epidemiological data to improve the understanding of the suicide phenomenon in vulnerable populations. Indigenous peoples are particularly affected, highlighting the need for interventions tailored to the specific characteristics of each region and ethnic group.
The findings are consistent with studies from other regions of Brazil that report elevated suicide rate among Indigenous populations, which are substantially higher than those observed in the general population residing in the same area. These rates have shown an increasing trend over the years, especially among young people and with variation according to ethnicity. This is a particularly challenging issue, as it affects a population segment that would otherwise be expected to be productive and fertile, potentially contributing to population decline within the group itself.
Future studies should address the cultural understanding of psychiatric conditions and their epidemiology, as these are significant risk factors and crucial targets for prevention strategies.
Finally, it is important to emphasize that good scientific, medical, and psychosocial practices are essential for recognizing, preventing, and developing responses to this problem—efforts that must overcome not only cultural and linguistic barriers but also a history of conflict, which has generated distrust and segregation.
Acknowledgments
The authors would like to thank the National Council for Scientific and Technological Development (CNPq) for the support provided for this study.
References
- World Health Organization. Suicide worldwide in 2019: global health estimates. Geneva: WHO; 2021.
- Charlier, P.; Deo, S. The inexorable death of first peoples: an open letter to the WHO. Lancet Planetary Health. 2017, 1, e96. [Google Scholar] [CrossRef] [PubMed]
- Coloma, C.; Hoffman, J.S.; Crosby, A. Suicide Among Guaraní Kaiowá and Nandeva Youth in Mato Grosso do Sul, Brazil. Arch Suicide Res. 2006, 10, 191–207. [Google Scholar] [CrossRef] [PubMed]
- Souza, R.S.B.; Oliveira, J.C.; Alvares-Teodoro, J.; Teodoro, M.L.M. Suicide and Brazilian Indigenous peoples: a systematic review. Rev Panam Salud Publica. 2020, 44, e58. [Google Scholar] [PubMed]
- IBGE. Censo demográfico 2010: características gerais dos indígenas. Rio de Janeiro: IBGE; 2010.
- Tommasino, K. Os povos indígenas no Sul do Brasil e suas relações interétnicas. Cadernos CERU. 2002, 2, 37–46. [Google Scholar] [CrossRef]
- IBGE. O Brasil Indígena. Brasília: FUNAI; 2013.
- Ministério da Saúde. Mortalidade por suicídio na população indígena no Brasil, 2015 a 2018. Boletim Epidemiológico. 2020, 51, 1–12. [Google Scholar]
- Ahmad, O.B.; et al. Age standardization of rates: a new WHO standard. Geneva: WHO; 2001.
- Azuero, A.J.; et al. Suicide in the Indigenous Population of Latin America: A Systematic Review. Rev Colomb Psiquiatr. 2017, 46, 237–242. [Google Scholar] [CrossRef] [PubMed]
- Clifford, A.C.; et al. A systematic review of suicide prevention interventions targeting indigenous peoples. BMC Public Health. 2013, 13, 463. [Google Scholar] [CrossRef] [PubMed]
- Victal, V.J.R.C.; et al. Suicide and Indigenous Peoples in Brazil. Interfaces Científicas - Saúde E Ambiente. 2019, 7, 49–60. [Google Scholar]
- Souza, M.L.P.; Orellana, J.D.Y. Disparities in suicide mortality between Indigenous and non-Indigenous populations in Amazonas, Brazil. J Bras Psiquiatr. 2013, 62, 245–252. [Google Scholar] [CrossRef]
- CDC. Suicide trends among Guaraní Kaiowá and Nandeva—Mato Grosso do Sul, Brazil, 2000–2005. MMWR. 2007, 56, 7–9. [Google Scholar]
- Lovisi, G.M.; et al. Suicide epidemiology in Brazil: 1980–2006. Braz J Psychiatry. 2009, 31 Suppl 2, S86–S93. [Google Scholar] [CrossRef]
- Colombo-Souza, P.; et al. Suicide mortality in São Paulo: characteristics and social factors (2000–2017). Sao Paulo Med J. 2020, 138, 253–258. [Google Scholar] [CrossRef] [PubMed]
- Santos, A.D.; et al. Spatial and temporal trends of suicide mortality in Sergipe, Brazil (2000–2015). Trends Psychiatry Psychother. 2018, 40, 269–276. [Google Scholar] [CrossRef]
- Pollock, N.J.; et al. Global incidence of suicide among Indigenous peoples: a systematic review. BMC Med. 2018, 16, 1–17. [Google Scholar] [CrossRef] [PubMed]
- Yu, J.; et al. Seasonality of suicide: a multi-country observational study. Epidemiol Psychiatr Sci. 2020, 29, e163. [Google Scholar] [CrossRef] [PubMed]
- Phillips, D.P. The Werther Effect: Suggestion and suicide. Am Sociol Rev. 1974, 39, 340–354. [Google Scholar] [CrossRef] [PubMed]
- IBGE. Censo demográfico 2010: terras indígenas. https://censo2010.ibge.gov.br/terrasindigenas/.
- DATASUS. Health Information: TABNET. https://datasus.saude.gov.br/informacoes-de-saude-tabnet/.
- Lazzarini, T.A.; et al. Suicide in Brazilian Indigenous communities: clustering in children and adolescents. Rev Saude Publica. 2018, 52, 56. [Google Scholar] [CrossRef] [PubMed]
- Souza, M.L.P. Suicide mortality among Indigenous children in Brazil. Cad Saude Publica. 2019, 35 Suppl 3, e00019219. [Google Scholar] [CrossRef]
- Chaudhury, S.R.; et al. Clinical correlates of planned and unplanned suicide attempts. J Nerv Ment Dis. 2016, 204, 806–811. [Google Scholar] [CrossRef] [PubMed]
- Rendall, M.S.; et al. The protective effect of marriage on survival: a review. Demography. 2011, 48, 481–506. [Google Scholar] [CrossRef] [PubMed]
- IBGE. Censo demográfico 2010: características gerais dos indígenas. Rio de Janeiro: IBGE; 2010.
Figure 1.
Standardized suicide rates by state, age group, sex, and population group, Southern Brazil. Source: Authors’ elaboration based on SIM/DATASUS data.
Figure 1.
Standardized suicide rates by state, age group, sex, and population group, Southern Brazil. Source: Authors’ elaboration based on SIM/DATASUS data.
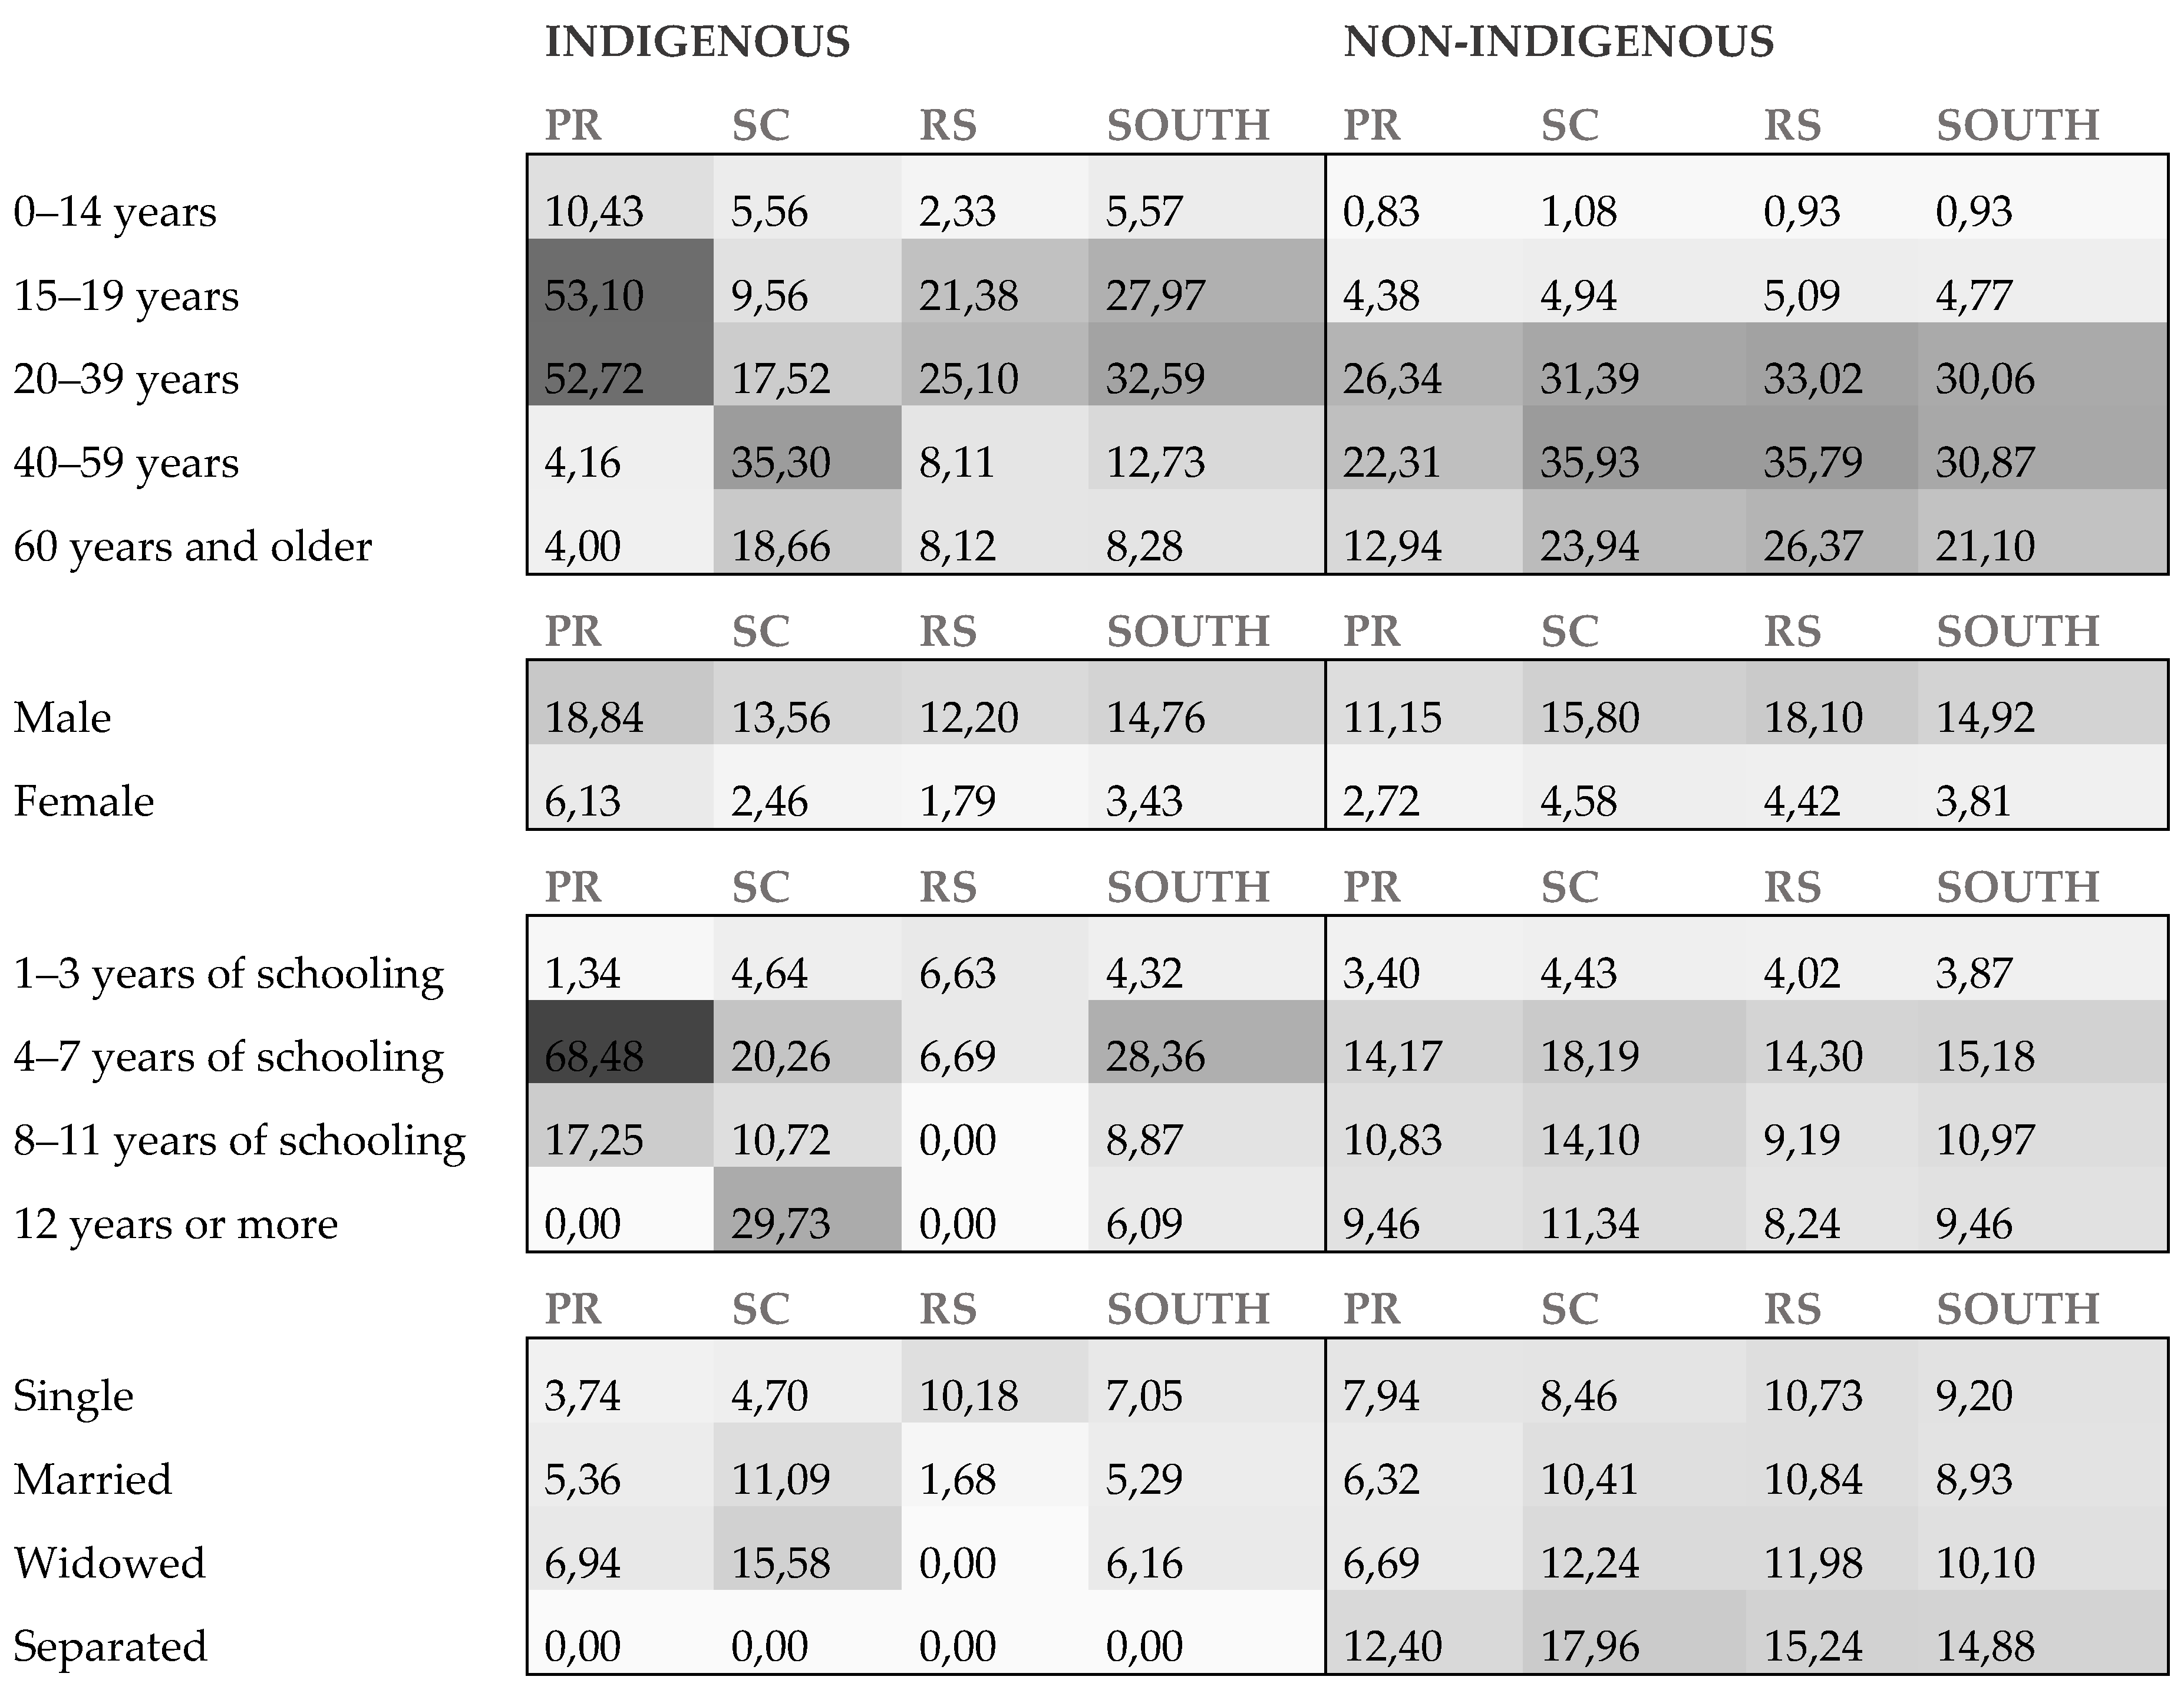
Figure 2.
Time series of annual crude suicide rates by state and population group, Southern Brazil, 2010–2019. Source: Authors’ elaboration based on SIM/DATASUS data.
Figure 2.
Time series of annual crude suicide rates by state and population group, Southern Brazil, 2010–2019. Source: Authors’ elaboration based on SIM/DATASUS data.
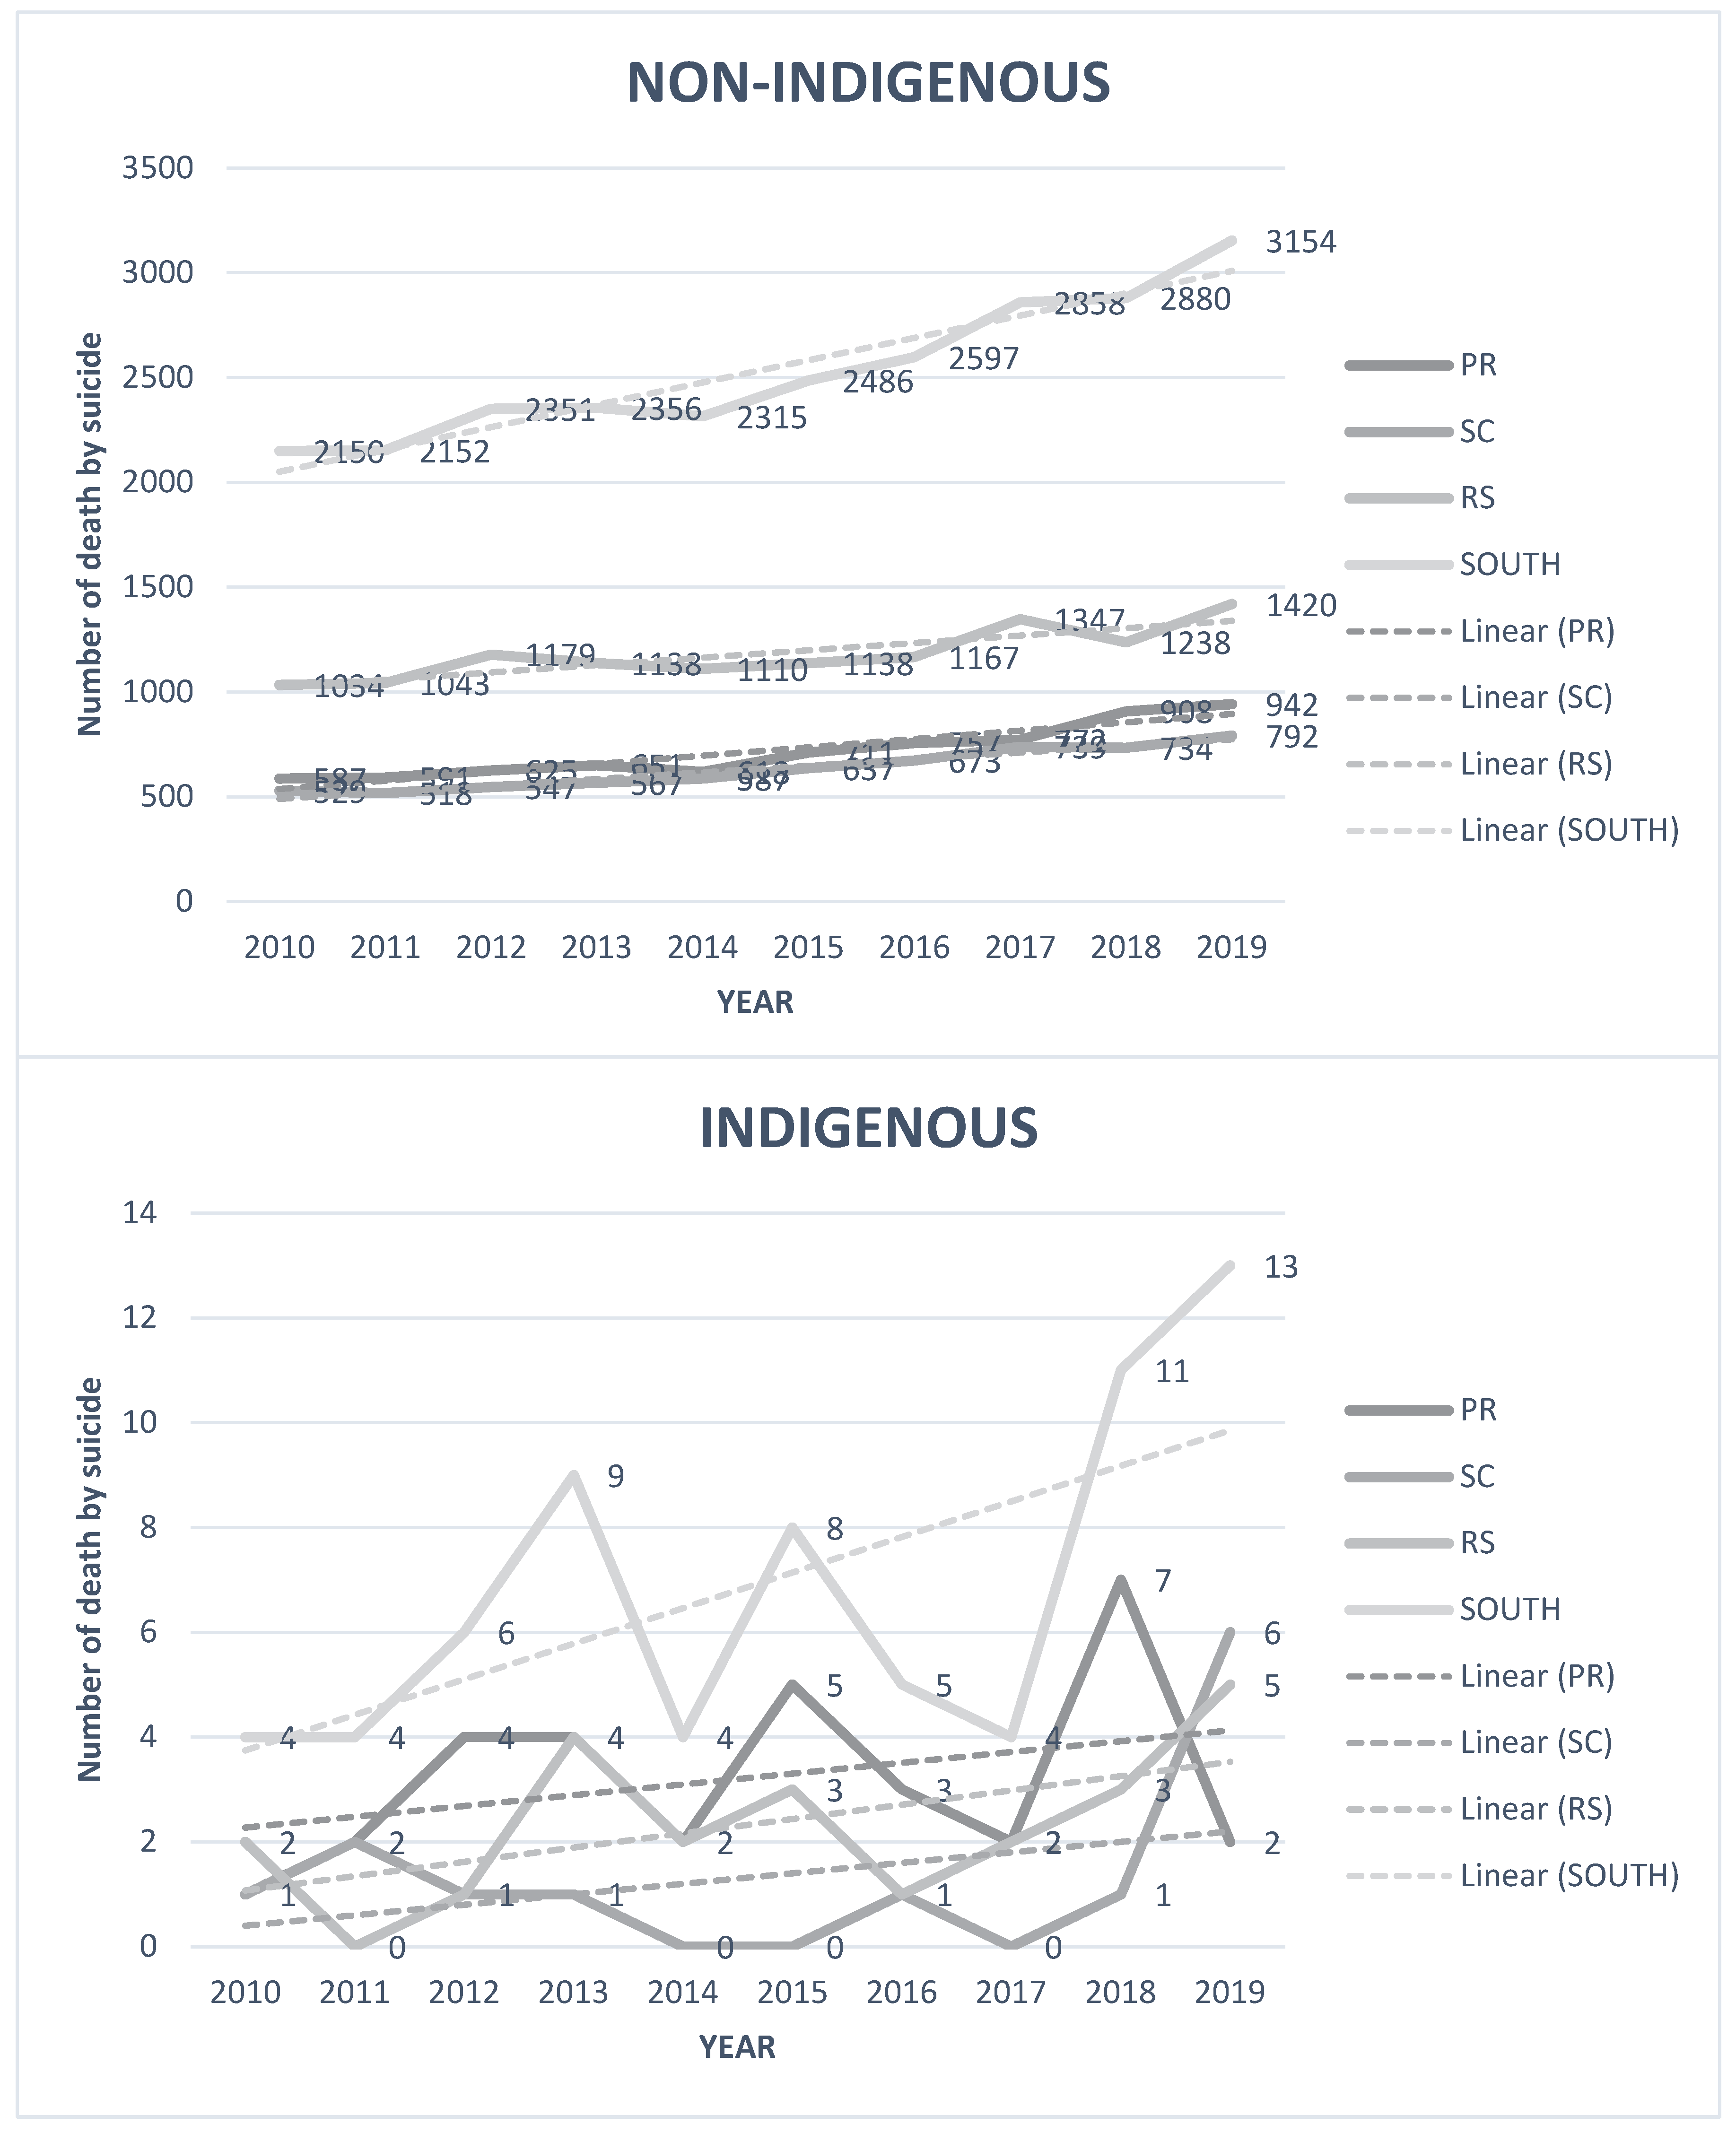

Table 1.
Frequency distribution of sociodemographic characteristics by population and state in the Southern Region of Brazil.
Table 1.
Frequency distribution of sociodemographic characteristics by population and state in the Southern Region of Brazil.
| Variable | State | South Region | ||||||
|---|---|---|---|---|---|---|---|---|
| PR | RS | SC | ||||||
| Indigenous | non-Indigenous | Indigenous | non-Indigenous | Indigenous | non-Indigenous | Indigenous | non-Indigenous | |
| Sex | ||||||||
| Female | 8 (25%) |
1451 (20,18%) | 3 (13,04%) | 2424 (20,48%) | 2 (15,38%) | 1440 (22,73%) | 13 (19,12%) | 5315 (20,95%) |
| Male | 24 (75%) |
5741 (79,82%) | 20 (86,96%) | 9413 (79,52%) | 11 (84,62%) | 4896 (77,27%) | 55 (80,08%) | 20050 (79,05%) |
|
Age |
||||||||
| 5–9 years | 0 (0%) |
1 (0,01%) |
1 (4,55%) |
2 (0,02%) |
0 (0,00%) |
1 (0,02%) |
1 (1,49%) |
4 (0,02%) |
| 10–14 years | 3 (9,38%) |
78 (1,07%) | 0 (0,00%) |
78 (0,66%) | 1 (7,69%) |
56 (0,88%) | 4 (5,97%) |
212 (0,83%) |
| 15–19 years | 14 (43,75%) | 493 (6,79%) | 9 (40,91%) | 533 (4,51%) | 2 (15,38%) | 319 (5,03%) | 25 (37,31%) | 1345 (5,29%) |
| 20–29 years | 9 (28,13%) | 1445 (19,89%) | 6 (27,27%) | 1650 (13,95%) | 2 (15,38%) | 1031 (16,27%) | 17 (25,37%) | 4126 (16,22%) |
| 30–39 years | 4 (12,50%) | 1463 (20,14%) | 2 (9,09%) |
1891 (15,98%) | 1 (7,69%) |
1114 (17,58%) | 7 (10,45%) |
4468 (17,57%) |
| 40–49 years | 0 (0,00%) |
1422 (19,58%) | 2 (9,09%) |
2171 (18,35%) | 5 (38,46%) | 1242 (19,60%) | 7 (10,45%) |
4835 (19,01%) |
| 50–59 years | 1 (3,13%) |
1095 (15,07%) | 0 (0,00%) |
2285 (19,31%) | 0 (0,00%) |
1259 (19,87%) | 1 (1,49%) |
4639 (18,24%) |
| 60–69 years | 0 (0,00%) |
748 (10,30%) | 1 (4,55%) |
1668 (14,10%) | 1 (7,69%) |
746 (11,77%) | 2 (2,99%) |
3162 (12,43%) |
| 70 years and older |
1 (3,13%) |
519 (7,14%) | 1 (4,55%) |
1553 (13,13%) | 1 (7,69%) |
568 (8,96%) | 3 (4,48%) |
2640 (10,38%) |
| Educational attainment | ||||||||
| None | 0 (0%) |
265 (3,68%) | 1 (4,35%) |
275 (2,32%) | 1 (7,69%) |
130 (2,05%) | 2 (2,94%) |
670 (2,64%) |
| 1–3 years | 2 (6,25%) |
1215 (16,89%) | 11 (47,83%) | 1537 (12,98%) | 3 (23,08%) | 960 (15,15%) | 16 (23,53%) | 3712 (14,63%) |
| 4–7 years | 20 (62,5%) | 2315 (32,18%) | 3 (13,04%) | 2526 (21,34%) | 5 (38,46%) | 1918 (30,27%) | 28 (41,18%) | 6759 (26,64%) |
| 8–11 years | 4 (12,5%) |
2226 (30,94%) | 0 (0%) |
2033 (17,17%) | 2 (15,38%) | 1891 (29,85%) | 6 (8,82%) |
6150 (24,24%) |
| 12 years or more | 0 (0%) |
822 (11,43%) | 0 (0%) |
665 (5,62%) | 1 (7,69%) |
595 (9,39%) | 1 (1,47%) |
2082 (8,21%) |
| Not reported | 6 (18,75%) | 351 (4,88%) | 8 (34,78%) | 4801 (40,56%) | 1 (7,69%) |
842 (13,29%) | 15 (22,06%) | 5994 (23,63%) |
|
Marital status |
||||||||
| Single | 22 (68,75%) | 3428 (47,65%) | 18 (78,26%) | 5140 (43,42%) | 4 (30,77%) | 2230 (35,2%) | 44 (64,71%) | 10798 (42,57%) |
| Married | 1 (3,12%) |
2332 (32,42%) | 1 (4,35%) |
3650 (30,84%) | 4 (30,77%) | 2265 (35,75%) | 6 (8,82%) |
8247 (32,51%) |
| Divorced | 0 (0%) |
597 (8,3%) | 0 (0%) |
892 (7,54%) | 0 (0%) |
572 (9,03%) | 0 (0%) |
2061 (8,12%) |
| Widowed | 0 (0%) |
324 (4,5%) | 0 (0%) |
684 (5,78%) | 1 (7,69%) |
329 (5,19%) | 1 (1,47%) |
1337 (5,27%) |
| Not reported | 5 (15,62%) | 190 (2,64%) | 3 (13,04%) | 1209 (10,21%) | 1 (7,69%) |
432 (6,82%) | 9 (13,24%) |
1831 (7,22%) |
| Other | 4 (12,5%) |
323 (4,49%) | 1 (4,35%) |
262 (2,21%) | 3 (23,08%) | 508 (8,02%) | 8 (11,76%) | 1093 (4,31%) |
|
ICD-10 code |
||||||||
| Not reported | 0 (0%) |
474 (6,59%) | 3 (13,04%) | 637 (5,38%) | 0 (0%) |
413 (6,52%) | 3 (4,41%) |
1524 (6,01%) |
| Other | 1 (3,12%) |
1806 (25,10%) | 3 (13,04%) | 2712 (22,91%) | 4 (30,77%) | 1227 (19,37%) | 8 (11,76%) | 5745 (22,65%) |
| X70 | 31 (96,88%) | 4914 (68,31%) | 17 (73,91%) | 8488 (71,71%) | 9 (69,23%) | 4696 (74,12%) | 57 (83,82%) | 18098 (71,34%) |
Note: The table presents the distribution of suicide deaths by sex, age group, education level, and marital status, comparing Indigenous and non-Indigenous populations across the states of Paraná (PR), Santa Catarina (SC), and Rio Grande do Sul (RS). Data are expressed in absolute numbers and percentages.
Table 2.
Odds ratios comparing suicide risk between Indigenous and non-Indigenous populations by age, sex, education, and marital status in Southern Brazil.
Table 2.
Odds ratios comparing suicide risk between Indigenous and non-Indigenous populations by age, sex, education, and marital status in Southern Brazil.
| Variable | State | South | |||
|---|---|---|---|---|---|
| PR | RS | SC | Region | ||
| SEX | MALE | 1,69 (1,13 - 2,53) | 0,86 (0,47 - 1,55) | 0,67 (0,43 - 1,04) | 0,99 (0,76 - 1,29) |
| FEMALE | 2,25 (1,13 - 4,52) | 0,54 (0,13 - 2,15) | 0,40 (0,13 - 1,16) | 0,90 (0,52 - 1,55) | |
| AGE | 0–14 years | 12,51 (3,95 - 39,66) | 5,16 (0,71 - 37,27) | 2,50 (0,35 - 17,96) | 6,02 (2,48 - 14,62) |
| 15–19 years | 13,19 (7,15 - 20,77) | 1,94 (0,48 - 7,78) | 4,21 (2,18 - 8,14) | 5,87 (3,95 - 8,73) | |
| 20–39 years | 2,00 (1,16 - 3,46) | 0,56 (0,18 - 1,73) | 0,76 (0,38 - 1,52) | 1,08 (0,73 - 1,62) | |
| 40–59 years | 0,19 (0,03 - 1,32) | 0,98 (0,41 - 2,36) | 0,23 (0,06 - 0,91) | 0,41 (0,21 - 0,82) | |
| 60 years and older | 0,31 (0,04 - 2,20) | 0,78 (0,19 - 3,12) | 0,31 (0,08 - 1,23) | 0,39 (0,16 - 0,94) | |
|
EDUCATIONAL ATTAINMENT |
1–3 years of schooling | 0,39 (0,10 - 1,58) | 1,05 (0,39 - 2,80) | 1,65 (0,93 - 2,91) | 1,12 (0,70 - 1,77) |
| 4–7 years of schooling | 4,86 (3,12 - 7,56) | 1,11 (0,46 - 2,68) | 0,47 (0,15 - 1,45) | 1,87 (1,29 - 2,71) | |
| 8–11 years of schooling | 1,59 (0,60 - 4,26) | 0,76 (0,19 - 3,04) | - | 0,81 (0,36 - 1,80) | |
| 12 years or more | - | 2,63 (0,37 - 18,73) | - | 0,64 (0,09 - 4,58) | |
| Not reported | 15,66 (6,68 - 36,70) | 0,22 (0,03 - 1,60) | 0,49 (0,24 - 0,99) | 0,87 (0,52 - 1,46) | |
| MARITAL STATUS | Single | 0,47 (0,18 - 1,26) | 0,56 (0,21 - 1,48) | 0,95 (0,60 - 1,51) | 0,77 (0,52 - 1,13) |
| Married | 0,85 (0,32 - 2,26) | 1,07 (0,40 - 2,84) | 0,16 (0,02 - 1,10) | 0,59 (0,31 - 1,14) | |
| Widowed | 1,04 (0,15 - 7,39) | 1,27 (0,18 - 9,09) | - | 0,61 (0,15 - 2,44) | |
| Divorced | - | - | - | - | |
| Note: The table shows crude odds ratios (OR) with 95% confidence intervals (CI) for various sociodemographic variables. An OR >1 indicates higher suicide risk among Indigenous individuals. Significant results are marked with an asterisk (p < 0.05). | |||||
Table 3.
Results of Mann-Kendall trend tests for suicide rates by state and population group, Southern Brazil, 2010–2019.
Table 3.
Results of Mann-Kendall trend tests for suicide rates by state and population group, Southern Brazil, 2010–2019.
| State | Indigenous | Non-Indigenous | ||
|---|---|---|---|---|
| Tau | P Value | Tau | P Value | |
| PR | 0,105 | 0,769 | 0,956 | <0,001* |
| RS | 0,424 | 0,120 | 0,778 | 0,002* |
| SC | 0,050 | 0,925 | 0,956 | <0,001* |
| SOUTH | 0,556 | 0,038 | 0,944 | 0,002* |
| Note: Tau values represent the correlation coefficient of trend direction. A statistically significant trend (p < 0.05) is marked with an asterisk. | ||||
Disclaimer/Publisher’s Note: The statements, opinions and data contained in all publications are solely those of the individual author(s) and contributor(s) and not of MDPI and/or the editor(s). MDPI and/or the editor(s) disclaim responsibility for any injury to people or property resulting from any ideas, methods, instructions or products referred to in the content. |
© 2025 by the authors. Licensee MDPI, Basel, Switzerland. This article is an open access article distributed under the terms and conditions of the Creative Commons Attribution (CC BY) license (http://creativecommons.org/licenses/by/4.0/).
Copyright: This open access article is published under a Creative Commons CC BY 4.0 license, which permit the free download, distribution, and reuse, provided that the author and preprint are cited in any reuse.


