

Submitted:
24 June 2025
Posted:
25 June 2025
Read the latest preprint version here
Abstract
Smart Formulation is a machine learning based platform designed to predict the Beyond Use Dates (BUDs) of compounded oral solid dosage forms by integrating molecular, formulation, and environmental parameters. Using a curated dataset of 3,166 active pharmaceutical ingredients (APIs), the model combines molecular descriptors with experimental stability data from Stabilis to train a tree 35 ensemble regression algorithm. This approach enables accurate prediction of API degradation under varying storage conditions, offering a scalable and cost-effective alternative to traditional stability testing. The analysis reveals a significant influence of formulation variables including the nature and number of excipients, and storage temperature on predicted stability. A negative correlation between LogP and BUD was identified, suggesting that hydrophilic APIs generally exhibit greater stability, especially when 40 formulated with a single excipient. Certain excipients such as cellulose, silica, sucrose, and mannitol were associated with enhanced stability. In contrast, excipients like HPMC and lactose, which have higher hydrogen bond donor and acceptor counts, were linked to faster degradation. The combination of two excipients instead of one often resulted in decreased stability, potentially due to moisture redistribution or phase separation effects. 45 Smart Formulation contributes to the field of computational pharmaceutics by bridging theoretical design and practical compounding. Its implementation in hospital and community pharmacies could mitigate drug shortages, streamline workflows, and support high-quality patient care. Future development will explore real-time stability monitoring and adaptive machine learning to further enhance predictive capabilities.
Keywords:
pharmaceutical stability
; beyond-use date prediction
; machine learning
; molecular descriptors
; drug compounding
; excipients
1. Introduction
The supply of medicines poses a significant challenge for healthcare systems globally, exacerbated by the increasing shortages of essential medicines [1,2]. In response to these challenges, hospital and community pharmacies play a vital role in ensuring continuity of care, often resorting to pharmaceutical compounding to mitigate the absence of certain licensed medicines [3,4].
While compounding offers a critical solution to drug shortages, formulation errors, contamination, and variability in quality may undermine patient safety and treatment efficacy. Studies have reported cases of compounding errors leading to adverse health outcomes, underscoring the need for stringent quality control measures [5,6]. Regulatory oversight is crucial to ensuring that compounded medications meet appropriate safety and efficacy standards, distinguishing pharmaceutical compounding from large-scale drug manufacturing [7]. The European Drug Shortages Formulary Project emphasizes this need by establishing a regulatory framework for the use of compounded preparations in shortage management [2].
In this context, the development of a formulation algorithm dedicated to pharmaceutical compounding of oral solid dosage form would represent a significant advance in optimizing the quality and safety of unlicensed preparations. By applying Quality by Design principles to pharmaceutical compounding, it becomes possible to pre-evaluate and improve stability of formulations while minimizing the risks associated with those preparations [7,8]. Such a tool would also facilitate the rapid adjustment of formulations to meet specific clinical needs and address fluctuations in raw material availability [9], bypassing the lengthy stability studies required by the International Council for Harmonisation (ICH) guidelines. Moreover, these long-term studies, which can take months to complete, are impractical in time-sensitive situations requiring immediate therapeutic solutions [10,11].
However, implementing such an algorithm requires strict adherence to existing standards and regulations, including those outlined in USP-NF 795 and 797 for non-sterile and sterile preparations (USP-NF, 2025) [12,13] as well as the European Pharmacopoeia (European Pharmacopoeia 11.4, 2024) [14]. By structuring data from scientific literature and pharmaceutical practices in both community and hospital settings, this algorithm could offer an innovative and effective solution to mitigate the impact of drug shortages while ensuring the quality and safety of unlicensed preparations.
Artificial intelligence (AI) has emerged as a transformative tool in pharmaceutical sciences, driving innovations in drug discovery (Huanbutta, 2024) [15], formulation development (Noorain, Varsha Srivastava, 2023) [16], drug delivery (Gholap, 2024; Wang Wei, 2021) [17,18], pharmaceutical dosage form testing (Vora, 2023) [19], and personalized medicine (Noorain, 2023) [16]. More specifically, AI technologies have demonstrated their utility in developming solid dosage forms [20,21] (Junhuang, 2022; Dong, 2021), predicting solid dispersion stability (Han, 2019) [22] and evaluating drug-excipient compatibility (Wang, 2021) [18]. AI-based models allow for the prediction and optimization of pharmaceutical formulations by leveraging large datasets from experimental stability studies and computational simulations. Like AI-driven platforms such as PharmSD (Dong, 2021) and FormulationAI (Dong, 2021), Smart Formulation employs machine learning techniques to identify the most stable active pharmaceutical ingredients (API)-excipient combinations, minimizing formulation failures and reducing refining the need for number of extensive experimental trials. Furthermore, Smart Formulation enables precise estimation of Beyond-Use Dates (BUD) under different storage conditions, thus enhancing patient safety and the reliability of unlicensed preparations.
Building on these advancements, Smart Formulation emerges as an AI-powered expert system designed to optimize pharmaceutical compounding by integrating over 3000 APIs, which were extracted from ChEMBL and PubChem web services [23,24]. The system also incorporates a selection of six commonly used excipients and three types of packaging materials (glass, plastic, and paper) [25,26,27]. The modeling protocol, which includes the curation of chemical and experimental data, was implemented in KNIME automate the stability prediction workflow [28,29]. Specifically, 53 stability data points of oral solid preparations were extracted from the Stabilis database [30] to form a training dataset, which was then used to develop a machine learning model within KNIME. The model's accuracy and relevance were evaluated by analyzing the correlation between predicted and experimental BUD values. Furthermore, the impact of API chemical properties in combination with one or two excipients on BUD prediction was assessed using the training dataset. To validate the approach, a portion of the Smart Formulation predictions was compared to those generated by the AI-driven FormulationAI platform [31]. Additionally, the predicted BUDs of 27 extemporaneous oral solid preparations were compared with against the reference values provided by official unlicensed preparations formularies, including the Belgian magistral therapeutic formulary (FTM) [32], the Dutch Formularium der Nederlandse Apothekers [33], the German Deutscher Arzneimittel-Codex/Neues Rezeptur-Formularium [34], the National Formulary of the French Pharmacopoeia [35]. Finally, the BUDs of preparations reported in scientific literature and pharmaceutical formularies will be compared to (i) those predicted by Smart Formulation and FormulationAI, (ii) the declared shelf-life of raw materials provided by manufacturers, and (iii) the expiration dates of commercially available pharmaceutical products. This comparative analysis will assess the robustness and relevance of the Smart Formulation predictive model.
2. Materials and Methods
2.1. Data Collection and Advanced Molecular Formulation Database (AMF-DB)
Fifty-five stability data points involving 23 APIs and six excipients, used alone or in combination with one other excipient, were collected from the Stabilis database as the primary data source [30]. The dataset covers a range of API content from less than 0.01% to 100% of the total unit dose mass, with storage temperatures spanning from -20°C to 40°C. Three types of packaging materials (glass vials, plastic vials, and paper) were included to assess formulation conditioning. The corresponding BUDs were also recorded. The Advanced Molecular Formulation Database (AMF-DB) was built from these experimental data, incorporating (i) common names and canonical simplified molecular input line entry system (SMILES) representations, (ii) formulation-specific information, and (iii) physicochemical molecular descriptors retrieved from public resources, including ChEMBL and PubChem databases [23,24]. The selected molecular descriptors included molecular weight (MW), n-octanol/water partition coefficient (LogP), number of rotatable bonds (RB), polar surface (PS) hydrogen bond donors (HBD), hydrogen bond acceptors (HBA), and aromatic rings (AR). An overview of the database is provided in Table 1. Similarly, the fundamental properties of excipients were retrieved from the ChEMBL and PubChem databases [23,24], while their functional roles, as detailed in the Handbook of excipients [36], summarized in Table 2. Additional information on shelf-life and the crystalline or amorphous nature of excipients was obtained directly from API suppliers.
To optimize machine learning predictions, these molecular descriptors, along with formulation parameters (API content, excipient composition), packaging type, and storage conditions, were systematically categorized to enhance model interpretability and performance. This categorization framework was consistently applied to all molecular and formulation descriptors to ensure consistency and facilitate machine learning model training. MW was divided into 25 classes, increasing in increments of 50 g/mol, ranging from values below 50 g/mol to those exceeding 1200 g/mol. LogP was categorized into 46 classes with 0.5-unit increments, covering values from less than -10 to greater than 12. The number of rotatable bonds (RB) was grouped into 8 classes, increasing by steps of three, from molecules with fewer than three RB to those with more than 20. PS followed a similar approach, classified into 21 classes with increments of 50 Ų, spanning values from below 50 Ų to beyond 1000 Ų. HBD and HBA were both divided into 8 classes, with 3-unit steps, ranging from values below 3 up to those exceeding 20. AR count was similarly categorized into eight classes, incrementing by 3 rings, covering molecules with fewer than three rings to those with more than 20. API content was classified into 10 levels, increasing by 10% increments, from formulations containing less than 10% API to those exceeding 90%. Packaging material was categorized into three types: glass, plastic, and paper. Temperature stability was divided into 15 classes, increasing in steps of 5°C, encompassing storage conditions from below -15°C to above 50°C. To enhance model interpretability, three composite indices were introduced by aggregating multiple parameters into broader predictive features. The molecule class (MC) was computed as the sum of the MW class, LogP class, and RB class. The molecular structure class (MSC) was obtained by summing the PS, HBD/HBA, and AR classes. Finally, the storage class was determined by combining the packaging, content, and temperature stability classes.
Excipient composition was encoded using a seven-element binary vector, where the presence or absence of a specific excipient was represented by either a 1 or 0. The excipients lactose, silica, cellulose, mannitol, sucrose, and hydroxypropyl methylcellulose (HPMC) were each assigned specific positions in the vector, with an additional reserved slot left for potential future excipients. For example, a formulation containing only lactose was represented as [1, 0, 0, 0, 0, 0, 0], while a formulation containing both lactose and cellulose was encoded as [1, 0, 1, 0, 0, 0, 0]. This structured encoding system provided a computationally efficient representation of excipient compositions, facilitating their integration into predictive machine learning models for the stability assessment of pharmaceutical formulations.
2.2. Smart Formulation Development
Seven conventional machine learning algorithms were tested to develop the predictive stability model using AMF-DB. These algorithms include single decision method (decision trees), ensemble methods (random forests, random forest regression, tree ensembles, tree ensembles regression), and boosting methods (gradient boosted trees, gradient boosted trees regression). By leveraging these diverse methodologies, the model effectively captured complex relationships between formulation parameters, molecular descriptors, and stability outcomes, improving predictive accuracy and robustness across various pharmaceutical formulations. AMF-DB and these algorithms were implemented using the KNIME platform, an open-source tool designed for data analytics, reporting, and integration. KNIME provides several distinct advantages in this context, making it particularly suitable for predicting the stability of APIs in pharmaceutical formulations [28,37,38]. The platform’s intuitive drag-and-drop interface allows constructing data workflows visually without the need for extensive programming experience, streamlining the process of model creation and analysis. KNIME integrates a wide array of machine learning algorithms, which is vital for optimizing the accuracy of stability predictions by comparing and refining models based on different approaches. Moreover, KNIME supports the integration of multiple data sources, combining empirical experimental data with molecular descriptors to generate comprehensive and robust predictive models. Additionally, KNIME’s scalability and flexibility enable it to manage large datasets efficiently, which is crucial for handling complex formulations with numerous variables. Its ability to process vast amounts of data ensures that models can be continuously updated and improved as more information becomes available. The platform also offers advanced data analytics and visualization tools, facilitating the exploration of trends and patterns within the data. This allows better interpretation machine learning model outputs, validate predictions, and ultimately make more informed decisions regarding the stability and formulation of APIs. The implementation of the machine learning workflow in Smart Formulation for predicting BUDs of oral solid dosage forms involved several stages, as depicted in Figure 1.
2.3. Model Evaluation
Figure 2 (A) illustrates a representative workflow of Smart Formulation developed using AMF-DB and the tree ensemble regression algorithm. In the “Partitioning” node, the dataset was divided into subsets using a linear selection approach, with 80% allocated to the training set. The learner node uses the "BUD" column (Table 1) as the target variable to train the model, which is then applied to the remaining 20% of the data in the predictor node. The "Scorer" node evaluates the results using a confusion matrix [28]. These subsets were integrated into the seven machine learning learner nodes. To ensure the reliability of predictions, the following statistical metrics were employed: coefficient of determination (R²), mean absolute error (MAE), mean squared error (MSE), root mean squared error (RMSE), mean signed difference (MSD), and mean absolute percentage error (MAPE). All evaluation metrics were computed using the "Numeric Scorer" node in KNIME, enabling a systematic and standardized assessment of model performance. Additionally, statistical analyses were conducted to assess correlations between molecular descriptors, formulation composition, conditioning parameters, storage conditions, and the predicted BUD of compounded APIs.
2.4. Model Validation and Performance Testing
To assess the generalizability of Smart Formulation, three independent validation tests were conducted using APIs not included in the training dataset. The first test set consisted of 15 APIs (MW: 129.17 to 776.87 g.mol-1, LogP: -0.92 to 5.39; initial content: 10%; packaging material: plastic), formulated in six pure excipients and 15 different binary excipient combinations. Predicted BUDs were compared across three reference conditions: (i) APIs as raw materials (supplier data), (ii) APIs in compounded preparations (predicted by Smart Formulation at 10% content, 25°C, and by FormulationAI), and (iii) APIs in commercial specialties (manufacturer data). A second independent test set included 27 APIs, where stability predictions were evaluated in three settings: (i) APIs as raw materials (supplier data), (ii) APIs in unlicensed preparations (predicted by Smart Formulation at 10% content, 25°C, and reported in the Magistral Therapeutic Formulary [32]), and (iii) APIs in licensed products (manufacturer data). Finally, 3,160 APIs (MW: 12.01 to 1461.43 g.mol-1; LogP: -12.01 to 17.16) were analyzed to assess the influence of excipients and storage conditions on stability. These APIs were formulated in six pure excipients (API content: 90% to 1%) and stored at 40°C, 25°C, and 4°C. The physicochemical properties and therapeutic classification of 3,166 APIs are detailed in Table 3. This multi-layered validation strategy provided a comprehensive assessment of the model's predictive accuracy across diverse pharmaceutical formulations and storage conditions.
2.5. Web Integration
In this study, a KNIME workflow was used to integrate molecular descriptors, formulation parameters, and storage conditions to assess the BUDs of 3,166 API-based unlicensed preparations. These APIs were formulated either with one of six pure excipients or with binary mixtures of two excipients and packaged in three types of containers. Considering four API content levels (1%, 10%, 50%, 90%) and three storage temperatures (4°C, 15°C, and 40°C), the total number of potential BUD predictions is estimated at approximately 1,700,000. Figure 2B presents a representative automated workflow of Smart Formulation, offering an interactive visualization of the data output.
3. Results and Discussion
Solid oral dosage forms continue to play a pivotal role in pharmaceutical development, offering advantages such as chemical and physical stability, ease of storage and transport, high patient acceptability, and cost-efficient mass production. Conventional manufacturing techniques—such as direct compression, wet or dry granulation, and capsule filling—remain well-established for producing robust, standardized formulations. Nonetheless, recent advances in three-dimensional printing have introduced transformative possibilities for personalized medicine, enabling on-demand production of dosage forms with customized release profiles, complex geometries, and precise drug loading [39]. The convergence of traditional manufacturing and additive technologies creates a unique framework for developing both scalable and patient-specific therapies.
3.1. AMF-DB and Smart Formulation Development and Model Evaluation
To assess the stability of pharmaceutical formulations, we developed the Smart Formulation predictive model using the AMF-DB database. AMF-DB integrates molecular descriptors, formulation parameters (including excipients and packaging types), and storage conditions to estimate BUDs. The predictive workflow was implemented in KNIME, leveraging machine learning techniques to enhance accuracy. The predictive accuracy of Smart Formulation was assessed by comparing predicted stability data with experimental values. Figure 3 illustrates the correlation between predicted and experimental stability data, showing a strong linear relationship (R² = 0.9761, p < 0.001). The model, based on a Tree Ensemble Regression approach, effectively predicted stability across different formulation conditions. Notably, APIs formulated with one or two excipients (n = 11) and those in pure or binary excipient mixtures (n = 14) demonstrated consistent predictability across glass, plastic, and paper packaging. A comparative analysis of seven machine learning models was conducted to evaluate predictive performance (Table 4). Among the tested models, Tree Ensemble Regression exhibited the highest accuracy (R² = 0.975) with the lowest Root Mean Squared Error (RMSE = 18.93) and Mean Absolute Error (MAE = 10.16). In contrast, other ensemble and boosting methods showed varying degrees of performance, with Gradient Boosted Trees Regression yielding suboptimal results (R² = -0.447, RMSE = 137.60). These findings validate the robustness of Smart Formulation in predicting drug stability under diverse formulation and storage conditions. The model effectively captures key interactions between API content, excipients, packaging, and temperature, making it a reliable tool for pharmaceutical stability assessment.
3.2. Model Validation and Performance Testing
To further evaluate the predictive capabilities of Smart Formulation, a correlation analysis was conducted to determine the influence of molecular descriptors, formulation parameters, packaging, and storage conditions on the predicted BUDs (Table 5). The analysis revealed that LogP (R = 0.503, p = 0.012) and LogP class (R = 0.502, p = 0.012) were significantly correlated with BUD predictions, suggesting that lipophilicity plays a key role in drug stability under various conditions. Additionally, molecule class exhibited a moderate correlation (R = 0.439, p = 0.032), indicating that structural characteristics of APIs contribute to their degradation profile. In contrast, most formulation and storage parameters showed weaker correlations, with main excipient (R = 0.041, p = 0.849) and packaging type (R = -0.200, p = 0.349) not significantly influencing BUD predictions. While temperature demonstrated a negative trend (R = -0.336, p = 0.109), it did not reach statistical significance, suggesting that its effect might be better captured through interaction terms or non-linear modeling approaches. These findings highlight the dominant role of molecular descriptors, particularly lipophilicity and structural classification, in predicting the stability of compounded APIs.
To further assess the predictive robustness of Smart Formulation, Figure 4 illustrates the stability predictions for 15 APIs under different storage conditions and excipient compositions. The model's performance was evaluated based on the relationship between predicted stability and the LogP of APIs, as well as the influence of excipient selection at varying temperatures and API contents. At 4°C and 10% API content (Figure 4A), the model identified a significant linear relationship between predicted stability and LogP in the presence of pure excipients such as cellulose, mannitol, silica, and sucrose (p < 0.01). Notably, stability predictions for APIs formulated with HPMC and lactose were significantly lower than those with other excipients (p < 0.0001), indicating a potential destabilizing effect of these excipients at low temperatures. At 25°C and 10% API content (Figure 4B), a similar trend was observed, with HPMC and lactose formulations showing significantly lower predicted stability compared to cellulose, silica, sucrose, and mannitol (p < 0.01). Interestingly, pure lactose formulations demonstrated a significant positive correlation between LogP and stability, indicating a potential temperature-dependent stabilization effect. Under accelerated conditions at 40°C (Figure 4C), the influence of excipient selection became more pronounced. Blends containing HPMC, lactose, silica, and sucrose exhibited significantly reduced stabilities (p < 0.0001), while pure cellulose, mannitol, silica, and sucrose offered greater stability. This suggests that some excipient blends may exacerbate degradation at high temperatures. Finally, at 25°C and a higher API content of 90% (Figure 4D), the model again demonstrated a strong correlation between LogP and predicted stability. However, formulations using blended excipients consistently resulted in significantly lower BUDs (p < 0.0001), underscoring the importance of excipient selection when scaling up API concentration. This result suggests that more lipophilic APIs tend to exhibit reduced stability in solid formulations, likely due to heterogeneous dispersion within the matrix, unfavorable interactions with residual moisture, and increased sensitivity to oxidation. This relationship is particularly pronounced in formulations containing hygroscopic excipients such as lactose or HPMC. These findings confirm that Smart Formulation captures the complex interplay between molecular properties, excipient composition, and storage conditions in predicting API stability. The relationships between LogP, excipient type, and temperature highlight the need for formulation strategies tailored to specific APIs and environmental factors.
Additionally, Smart Formulation was used to estimate BUD for a large dataset of 3,166 APIs stored at 25°C in plastic containers across a wide range of molecular weights (12.01–1461.43 g/mol) and LogP values (-12.01–17.16) (Figure 5). The predicted BUDs varied significantly depending on both API content and excipient composition. At high API content (90%), cellulose, mannitol, and silica appeared to promote longer stability, while those with HPMC and lactose resulted in shorter predicted BUDs. Similar trends were observed at 50% API content, although differences between excipients were less pronounced. At 10% and 1% API contents, the model identified significant excipient-related differences in predicted BUDs (80–170 days; p < 0.0001). However, within the 80–95 day range, no statistically significant differences were observed (Chi² test), suggesting a possible stabilization threshold beyond which excipient effects diminish.
Figure 6 presents radar charts illustrating the distribution of formulation categories with predicted BUDs between 80 and 170 days, based on API content (90%, 50%, 10%, 1%), storage temperature (4°C, 25°C, 40°C), and excipient type. All formulations were packaged in plastic containers. A key observation is that higher API content formulations (90% and 50%) consistently showed shorter BUDs, regardless of storage temperature, suggesting that increased molecular interactions, reduced excipient shielding, and solubility-related degradation may occur at higher concentrations. At 40°C, most high-content formulations (90% and 50%) fell within the 80–120 day range, while lower API content formulations (10% and 1%) exhibited a broader stability window with many BUDs in the 140–170 day range. These patterns were also seen at 25°C and 4°C, reinforcing the importance of dilution effects and excipient interactions in enhancing API stability during storage. Data analysis further indicates that oral solid formulations with a high API content generally exhibit shorter BUDs, regardless of the storage temperature profile (40°C, 25°C, or 4°C). This trend can be attributed to several factors: (i) the reduced proportion of stabilizing excipients, (ii) the increased surface area of the exposed drug, (iii) the lower capacity of the matrix to trap moisture or degradation catalysts, and (iv) changes in the thermodynamic properties of the formulation. Therefore, a high drug loading compromises stability by weakening the physico-chemical protection mechanisms offered by the excipients. These findings highlight the importance of optimizing API loading in conjunction with appropriate excipient selection to ensure long-term stability.
Table 6 and Table 7 provide a detailed comparison of the stability of 15 and 27 APIs, respectively, across different formulations. These include raw materials, compounded preparations (predicted by Smart Formulation with 10% API content at 25°C, and commercial specialty products (manufacturer data). The stability of these APIs is assessed using various metrics, including the shelf-life of the raw materials, the BUD for compounded preparations, and the expiration date for commercial specialties.
Table 6 compares the stability of different APIs across various formulations. For most APIs, Smart Formulation predicts BUD for compounded preparations that typically ranges from a few months to about 6 months. FormulationAI usually estimates a slightly longer BUD, around 180 days. In contrast, commercial specialty formulations generally have much longer shelf lives, often ranging from 2 to 5 years. This extended stability is primarily due to the substantial number of excipients (EXP) present in these formulations, which help stabilize the API. For example, acetaminophen follows this general trend. Smart Formulation estimates a BUD of 156 to 171 days for compounded acetaminophen preparations, while FormulationAI predicts a BUD of 180 days. However, for the commercial specialty version of acetaminophen, the shelf-life is significantly longer, reaching up to 5 years. The presence of a higher number of excipients in the specialty formulation likely accounts for this extended stability, which is consistent with the general observations across other APIs in the table. Moreover, the findings confirm also that log P is a critical determinant of the stability of APIs in solid oral formulations. The increased instability of lipophilic compounds (Log P > 3) in unprotected matrices justifies the widespread use of film coating techniques in industrial products, which are typically absent in hospital compounding, thereby limiting the BUD. This reinforces the value of predictive models incorporating lipophilicity to optimize the shelf-life of compounded preparations.
Building on these findings, Table 7 expands the analysis to include 27 APIs, providing a more comprehensive comparison across various formulations and excipients. This table further emphasizes the role of excipients, such as lactose and mannitol, in influencing the stability of compounded preparations. It also incorporates formulations in hard capsules, reflecting a broader spectrum of stability across different formulation types. For instance, acetazolamide and cetirizine exhibit varying stability depending on the excipient used, with the predicted BUDs for compounded preparations ranging from 60 to 180 days. The table also compares the BUDs predicted by Smart Formulation, those indicated in the MTF, and the expiration dates of raw materials and commercial formulations. For example, the BUDs for compounded acetaminophen preparations are estimated by Smart Formulation to be between 156 and 171 days, whereas the MTF indicates a BUD of 180 days. Commercial specialties typically have expiration dates ranging from 2 to 3 years. Interestingly, the BUD of spironolactone (25 mg) compounded in lactose/silica and lactose alone was found to be 60 and 180 days in the MTF and the French National Formulary, respectively, highlighting the impact of mono- and binary excipient combinations on BUD extension. Notably, the BUD of spironolactone (25 mg) in lactose-based preparations, as predicted by Smart Formulation (159–164 days; plastic packaging; 25°C), closely aligned with the French monograph value (https://ansm.sante.fr/uploads/2021/03/25/gelules-de-spironolactone-0-5-a-25-mg.pdf). Furthermore, Smart Formulation could help address gaps in BUD data for unlicensed preparations listed in national formularies. For example, in the French National Formulary, the predicted BUDs for unlicensed preparations of nadolol (1–50 mg) and amiodarone (5–200 mg) in mannitol hard capsules (No. 4 and 2) were 159–168 days and 156–170 days, respectively, at 25°C in plastic packaging. Moreover, this detailed comparison highlights the differences between raw material shelf-life, BUDs predicted by Smart Formulation, and actual expiration dates for commercial specialties, further demonstrating the influence of excipients on stability and the predictive accuracy of Smart Formulation when compared to real-world data.
Production conditions for compounded preparations in community and hospital pharmacies are less controlled than in the industrial sector. The crystallization or amorphization of APIs and excipients is typically not monitored, as quality control in solid oral forms primarily focuses on mass and content [40,41]. Similarly, water sorption by APIs and excipients is rarely investigated during compounding activities [42]. However, the revised BUD limit tables in USP-NF <795> have introduced the concept of water activity to evaluate the susceptibility of nonsterile preparations to microbial contamination and the potential for degradation through hydrolysis [12]. This lack of physicochemical oversight can lead to variations in BUDs. However, using only one or two excipients simplifies preparation, reducing material controls, procurement delays, and costs critical advantages amid drug and raw material shortages in Europe. Excipient selection significantly influences stability, solubility, and mechanical properties. Excipients such as cellulose, silica, sucrose, and mannitol provide superior stability, whereas HPMC and lactose, characterized by higher HDB, HAB, and MSC values (Table 2), tend to promote moisture uptake, accelerating API degradation. A clear inverse relationship exists between API hydrophilicity (low LogP) and extended stability, as hydrophilic APIs integrate more effectively into excipient matrices, reducing molecular mobility. Interestingly, formulations with two excipients exhibit systematically shorter BUDs, likely due to disrupted excipient interactions, moisture redistribution, and phase separation effects. Machine learning models integrating experimental stability data and molecular descriptors can enhance excipient-API compatibility predictions, optimizing formulation design and improving compounded preparation stability.
3.3. Web Integration
A key innovation of Smart Formulation lies in its integration of excipient variability into stability prediction. Unlike FormulationAI, which primarily focuses on API stability, our model allows users to predict stability while considering up to two excipients of their choice. Unlike FormulationAI, which centers primarily on active pharmaceutical ingredient (API) stability, Smart Formulation enables users to assess stability in the presence of one or two excipients of their choice. This capability is critical, as excipients significantly modulate degradation kinetics, solubility, and overall formulation robustness. By incorporating excipient interactions, the model delivers a more mechanistic and adaptable framework for predicting pharmaceutical stability.
Another differentiating feature is the model’s flexibility regarding environmental conditions. Whereas existing AI-based models often restrict predictions to a limited set of predefined storage scenarios, Smart Formulation allows dynamic exploration across a broader spectrum of storage temperatures and packaging configurations. This includes variable container types and closure systems, factors known to influence moisture ingress, oxygen permeability, and light exposure, thereby enhancing the model’s applicability to real-world storage conditions.
In contrast to the categorical outputs typical of current models (e.g., fixed intervals such as “3 months” or “6 months”), Smart Formulation provides time-continuous predictions expressed as beyond-use dates (BUDs) with associated standard errors in days. This enables fine-grained decision-making for formulation development, shelf-life assignment, and risk assessment.
The web-based interface (Figure 2B VI Output Data) reflects this user-centric design. Users can input multiple formulation variables, including API identity, excipient composition, storage temperature, packaging material, and API concentration, through a streamlined interface. The output section provides detailed metrics including predicted BUD, excipient effect magnitude, relevant molecular descriptors, and a confidence-weighted stability classification. This modular architecture makes Smart Formulation a practical and scalable tool for pharmaceutical scientists seeking data-driven guidance in formulation optimization.
4. Conclusion
This study demonstrates the feasibility of applying machine learning techniques to predict the stability of APIs in oral solid dosage forms. The tree ensemble regression algorithm effectively correlates molecular descriptors and formulation parameters with BUD, underscoring the pivotal influence of lipophilicity, particularly LogP, on degradation kinetics. The resulting model offers a predictive tool of high practical value for pharmaceutical development, presenting a cost-effective and time-efficient alternative to conventional long-term stability testing. These findings are consistent with recent advances in computational pharmaceutics that seek to bridge theoretical formulation strategies with real-world application. By embedding artificial intelligence into the formulation design process, Smart Formulation provides a robust framework to enhance prediction accuracy, streamline resource allocation, and strengthen the stability of extemporaneous preparations. Its integration into both community and hospital pharmacy workflows holds the potential to mitigate drug shortages, standardize compounding practices, and improve overall patient safety. Looking ahead, future developments may include real-time stability monitoring systems and adaptive machine learning models capable of refining predictions based on continuous data acquisition. These advancements would further consolidate Smart Formulation’s role as a cornerstone innovation in the evolving field of personalized, AI-assisted pharmaceutical formulation.
Declaration of Interest: The authors declare that they have no known competing financial interests or personal relationships that could have appeared to influence the work reported in this paper.
Data Availability Statement
The datasets were derived from sources in the public domain, including the following:
- Stabilis Database (https://www.stabilis.org): A reference platform for drug stability, used for extracting experimental BUD data.
- PubChem (https://pubchem.ncbi.nlm.nih.gov): For molecular structure and descriptor data of active pharmaceutical ingredients.
- DrugBank (https://go.drugbank.com): For physicochemical and pharmacological data on APIs.
- PubMed (https://pubmed.ncbi.nlm.nih.gov): For literature-derived stability data and formulation context.
- ChemBL(https://www.ebi.ac.uk/chembl/): For bioactivity and structural information related to APIs.
- Vidal Hoptimal® (https://www.vidal.fr/hoptimal): For pharmaceutical formulation components and hospital-use references.
All data were used in accordance with the terms of use of the respective databases and are publicly accessible at the time of this publication. Where applicable, data integration and curation were performed to standardize molecular descriptors and formulation parameters for model training and validation.
Declaration of generative AI and AI-assisted technologies in the writing process.
During the preparation of this work the authors used ChatGPT to improve the readability and language of the manuscript. After using ChatGPT, the authors reviewed and edited the content as needed and take full responsibility for the content of the published article.
Author Contributions
Conceptualization: FP; methodology: FP and AG; software: FP, AG and SH; data curation: FP and AG; writing - original draft preparation: FP and AG; writing - review and editing: all authors; supervision: FP; project administration: FP; funding acquisition: FP. All authors have read and agreed to the published version of the manuscript.
Institutional Review Board Statement
Not applicable.
Informed Consent Statement
Not applicable.
Data Availability Statement
Not applicable.
Acknowledgments
During the preparation of this manuscript, the authors used ChatGPT (OpenAI, version GPT-4o, 2025]) for assistance in reviewing and refining the manuscript text. The authors have reviewed and edited all outputs and take full responsibility for the content of this publication.
Conflicts of Interest
The authors declare no conflict of interest.
References
- Seghers, F.; Taylor, M.M.; Storey, A.; Dong, J.; Wi, T.C.; Wyber, R.; Ralston, K.; Nguimfack, B.D. Securing the Supply of Benzathine Penicillin: A Global Perspective on Risks and Mitigation Strategies to Prevent Future Shortages. Int. Health 2024, 16, 279–282. [Google Scholar] [CrossRef] [PubMed]
- European Drug Shortages Formulary Project: Approval of Framework and Procedure Documents - European Directorate for the Quality of Medicines & HealthCare - EDQM Available online:. Available online: https://www.edqm.eu/en/-/european-drug-shortages-formulary-project-approval-of-framework-and-procedure-documents (accessed on 26 March 2025).
- Mian, P.; Maurer, J.M.; Touw, D.J.; Vos, M.J.; Rottier, B.L. Pharmacy Compounded Pilocarpine: An Adequate Solution to Overcome Shortage of Pilogel® Discs for Sweat Testing in Patients with Cystic Fibrosis. J. Cyst. Fibros. Off. J. Eur. Cyst. Fibros. Soc. 2024, 23, 126–131. [Google Scholar] [CrossRef]
- Allen, L.V. PreScription: Shortages Continue--Compounding Pharmacies Fill the Gap…Again! Int. J. Pharm. Compd. 2023, 27, 180. [Google Scholar]
- Gudeman, J.; Jozwiakowski, M.; Chollet, J.; Randell, M. Potential Risks of Pharmacy Compounding. Drugs RD 2013, 13, 1–8. [Google Scholar] [CrossRef] [PubMed]
- Watson, C.J.; Whitledge, J.D.; Siani, A.M.; Burns, M.M. Pharmaceutical Compounding: A History, Regulatory Overview, and Systematic Review of Compounding Errors. J. Med. Toxicol. 2021, 17, 197–217. [Google Scholar] [CrossRef]
- Timko, R.J.; Crooker, P.E.M. Pharmaceutical Compounding or Pharmaceutical Manufacturing? A Regulatory Perspective. Int. J. Pharm. Compd. 2014, 18, 101–111. [Google Scholar]
- Timko, R.J. Applying Quality by Design Concepts to Pharmacy Compounding. Int. J. Pharm. Compd. 2015, 19, 453–463. [Google Scholar]
- Broughel, J. Allowing Compounding Pharmacies to Address Drug Shortages. Int. J. Pharm. Compd. 2022, 26, 100–109. [Google Scholar] [PubMed]
- Merienne, C.; Filali, S.; Marchand, C.; Lapras, B.; Paillet, C.; Pirot, F. Predictive Stability, Novel HPLC-MS Analysis and Semi-Automatic Compounding Process for the Emergency Implementation of a Production Line of Pancuronium in Injectable Solution. Eur. J. Pharm. Sci. Off. J. Eur. Fed. Pharm. Sci. 2023, 106464. [Google Scholar] [CrossRef]
- Patel, T.; Patel, M.; Shah, U.; Patel, A.; Patel, S.; Solanki, N.; Shah, S. Comprehensive Analysis of Aspirin and Apixaban: Thedevelopment, Validation, and Forced Degradation Studies of Bulk Drugs and in-House Capsule Formulations Using the RP-HPLC Method.
- . [CrossRef]
- USP-NF 〈797〉 Pharmaceutical Compounding—Sterile Preparations Available online:. Available online: https://online.uspnf.com/uspnf/document/1_GUID-A4CAAA8B-6F02-4AB8-8628-09E102CBD703_8_en-US?source=Search%20Results&highlight=797 (accessed on 26 March 2025).
- European Pharmacopoeia 11.4, E.D. European Pharmacopoeia 11.4, E.D. for the Q. of M.& H. 2619. Pharmaceutical Preparations 2024.
- Huanbutta, K.; Burapapadh, K.; Kraisit, P.; Sriamornsak, P.; Ganokratanaa, T.; Suwanpitak, K.; Sangnim, T. Artificial Intelligence-Driven Pharmaceutical Industry: A Paradigm Shift in Drug Discovery, Formulation Development, Manufacturing, Quality Control, and Post-Market Surveillance. Eur. J. Pharm. Sci. 2024, 203, 106938. [Google Scholar] [CrossRef]
- Noorain, *!!! REPLACE !!!*; Srivastava, V.; Parveen, B.; Parveen, R. Noorain; Srivastava, V.; Parveen, B.; Parveen, R. Artificial Intelligence in Drug Formulation and Development: Applications and Future Prospects. Curr. Drug Metab. 24. [CrossRef]
- Gholap, A.D.; Uddin, M.J.; Faiyazuddin, M.; Omri, A.; Gowri, S.; Khalid, M. Advances in Artificial Intelligence for Drug Delivery and Development: A Comprehensive Review. Comput. Biol. Med. 2024, 178, 108702. [Google Scholar] [CrossRef] [PubMed]
- Wang, W.; Ye, Z.; Gao, H.; Ouyang, D. Computational Pharmaceutics - A New Paradigm of Drug Delivery. J. Controlled Release 2021, 338, 119–136. [Google Scholar] [CrossRef]
- Vora, L.K.; Gholap, A.D.; Jetha, K.; Thakur, R.R.S.; Solanki, H.K.; Chavda, V.P. Artificial Intelligence in Pharmaceutical Technology and Drug Delivery Design. 2023.
- Jiang, J.; Ma, X.; Ouyang, D.; Robert O Williams, I.I.I. Emerging Artificial Intelligence (AI) Technologies Used in the Development of Solid Dosage Forms. Pharmaceutics 2022, 14, 2257. [Google Scholar] [CrossRef]
- Dong, J.; Gao, H.; Ouyang, D. PharmSD: A Novel AI-Based Computational Platform for Solid Dispersion Formulation Design. Int. J. Pharm. 2021, 604, 120705. [Google Scholar] [CrossRef] [PubMed]
- Han, R. Predicting Physical Stability of Solid Dispersions by Machine Learning Techniques. J. Controlled Release 2019. [Google Scholar] [CrossRef]
- Nowotka, M.; Gaulton, A.; Mendez, D.; Bento, A.; Hersey, A.; Leach, A. Using ChEMBL Web Services for Building Applications and Data Processing Workflows Relevant to Drug Discovery. Expert Opin. Drug Discov. 2017, 12, 1–11. [Google Scholar] [CrossRef]
- Takada, N.; Ohmori, N.; Okada, T. Mining Basic Active Structures from a Large-Scale Database. J. Cheminformatics 2013, 5, 15. [Google Scholar] [CrossRef] [PubMed]
- Taketomo, C.K.; Chu, S.A.; Cheng, M.H.; Corpuz, R.P. Stability of Captopril in Powder Papers under Three Storage Conditions. Am. J. Hosp. Pharm. 1990, 47, 1799–1801. [Google Scholar] [CrossRef]
- Helin, M.M.; Kontra, K.M.; Naaranlahti, T.J.; Wallenius, K.J. Content Uniformity and Stability of Nifedipine in Extemporaneously Compounded Oral Powders. Am. J. Health. Syst. Pharm. 1998, 55, 1299–1301. [Google Scholar] [CrossRef]
- Rughoo, L.; Vigneron, J.; Zenier, H.; May, I.; Demoré, B. Stability Study of Amiodarone Hydrochloride in Capsules for Paediatric Patients Using a High-Performance Liquid Chromatography Method. Ann. Pharm. Fr. 2012, 70, 88–93. [Google Scholar] [CrossRef]
- Joshi, R.; Zheng, Z.; Agarwal, P.; Hatmal, M.M.; Chang, X.; Seidler, P.; Haworth, I.S. KNIME Workflows for Applications in Medicinal and Computational Chemistry. Artif. Intell. Chem. 2024, 2, 100063. [Google Scholar] [CrossRef]
- Moreira-Filho, J.T.; Ranganath, D.; Conway, M.; Schmitt, C.; Kleinstreuer, N.; Mansouri, K. Democratizing Cheminformatics: Interpretable Chemical Grouping Using an Automated KNIME Workflow. J. Cheminformatics 2024, 16, 101. [Google Scholar] [CrossRef] [PubMed]
- Wagner, L.A.F.; Neininger, M.P.; Hensen, J.; Zube, O.; Bertsche, T. Avoiding Incompatible Drug Pairs in Central-Venous Catheters of Patients Receiving Critical Care: An Algorithm-Based Analysis and a Staff Survey. Eur. J. Clin. Pharmacol. 2023, 79, 1081–1089. [Google Scholar] [CrossRef]
- Dong, J.; Wu, Z.; Xu, H.; Ouyang, D. FormulationAI: A Novel Web-Based Platform for Drug Formulation Design Driven by Artificial Intelligence.
- Federal Agency for Medicines and Health Products (FAMHP) Magistral Therapeutic Formulary. Available online: https://www.afmps.be/en/authorisation/magistral_therapeutic_formulary (accessed on 27 March 2025).
- Royal Dutch Pharmacists Association (KNMP) Formulary of Dutch Pharmacists (FNA). https://www.knmp.nl/over-de-knmp/producten-en-diensten/productzorg-bereiding-en-toediening/fna-boek-2013. (accessed on 27 March 2025).
- Deutscher Arzneimittel-Codex® / Neues Rezeptur-Formularium® (DAC/NRF). Available online: https://www.deutscher-apotheker-verlag.de/Deutscher-Arzneimittel-Codex-Neues-Rezeptur-Formularium-DAC-NRF/9783774100442 (accessed on 27 March 2025).
- Lehmann, H. Le Formulaire National de La Pharmacopée Française, Au Service de La Fabrication et Du Contrôle Des Préparations Officinales. Actual. Pharm. 2017, 56, 34–36. [Google Scholar] [CrossRef]
- Sheskey, P.J.; Hancock, B.C.; Moss, G.P.; Goldfarb, D.J. Handbook of Pharmaceutical Excipients – Ninth Edition; Pharm. Press.; 2020; ISBN 978-0-85711-375-7.
- Falcón-Cano, G.; Molina, C.; Cabrera-Pérez, M.Á. ADME Prediction with KNIME: In Silico Aqueous Solubility Consensus Model Based on Supervised Recursive Random Forest Approaches. ADMET DMPK 2020, 8, 251–273. [Google Scholar] [CrossRef] [PubMed]
- Palazzotti, D.; Fiorelli, M.; Sabatini, S.; Massari, S.; Barreca, M.L.; Astolfi, A. Q-raKtion: A Semiautomated KNIME Workflow for Bioactivity Data Points Curation. J. Chem. Inf. Model. 2022, 62, 6309–6315. [Google Scholar] [CrossRef] [PubMed]
- Lamrabet, N.; Hess, F.; Leidig, P.; Marx, A.; Kipping, T. Exploring 3D Printing in Drug Development: Assessing the Potential of Advanced Melt Drop Deposition Technology for Solubility Enhancement by Creation of Amorphous Solid Dispersions. Pharmaceutics 2024, 16, 1501. [Google Scholar] [CrossRef]
- Nurzyńska, K.; Booth, J.; Roberts, C.J.; McCabe, J.; Dryden, I.; Fischer, P.M. Long-Term Amorphous Drug Stability Predictions Using Easily Calculated, Predicted, and Measured Parameters. Mol. Pharm. 2015, 12, 3389–3398. [Google Scholar] [CrossRef]
- Veith, H.; Wiechert, F.; Luebbert, C.; Sadowski, G. Combining Crystalline and Polymeric Excipients in API Solid Dispersions – Opportunity or Risk? Eur. J. Pharm. Biopharm. 2021, 158, 323–335. [Google Scholar] [CrossRef]
- Szakonyi, G.; Zelkó, R. The Effect of Water on the Solid State Characteristics of Pharmaceutical Excipients: Molecular Mechanisms, Measurement Techniques, and Quality Aspects of Final Dosage Form. Int. J. Pharm. Investig. 2012, 2, 18–25. [Google Scholar] [CrossRef]
- Yang, H.; Xu, L.; Hou, L.; Xu, T.C.; Ye, S.H. Stability of Vitamin A, E, C and Thiamine during Storage of Different Powdered Enteral Formulas. Heliyon 2022, 8, e11460. [Google Scholar] [CrossRef] [PubMed]
Figure 1.
Machine learning workflow used in Smart Formulation to predict the beyond-use date (BUD) of active pharmaceutical ingredients (APIs) in oral solid dosage forms. The approach relies on a Tree Ensemble Regression Algorithm, a powerful supervised learning method that captures complex nonlinear relationships between molecular properties, formulation parameters, and environmental conditions. The model is trained on a dataset comprising three categories of input descriptors: 1. API Descriptors (18 features) – Molecular properties such as molecular weight (MW), logP (lipophilicity), rotatable bonds (RB), polar surface area (PS), hydrogen bond donors (HBD), and acceptors (HBA), among others. 2. Formulation Descriptors (4 features) – Encoded excipient compositions, including lactose, silica, cellulose, mannitol, sucrose, and hydroxypropyl methylcellulose (HPMC), as well as API content percentage. 3. Conditioning and Storage Descriptors (5 features) – Packaging type (glass, plastic, paper), storage temperature, and classification of storage conditions. The tree ensemble regression algorithm processes these features to establish correlations between molecular properties, formulation parameters, and environmental conditions, ultimately predicting the BUD in days. Notably, the model identifies an inverse correlation between LogP and BUD, suggesting that higher lipophilicity is associated with reduced stability. This predictive approach enables formulators to estimate stability efficiently, reducing reliance on extensive real-time stability studies.
Figure 1.
Machine learning workflow used in Smart Formulation to predict the beyond-use date (BUD) of active pharmaceutical ingredients (APIs) in oral solid dosage forms. The approach relies on a Tree Ensemble Regression Algorithm, a powerful supervised learning method that captures complex nonlinear relationships between molecular properties, formulation parameters, and environmental conditions. The model is trained on a dataset comprising three categories of input descriptors: 1. API Descriptors (18 features) – Molecular properties such as molecular weight (MW), logP (lipophilicity), rotatable bonds (RB), polar surface area (PS), hydrogen bond donors (HBD), and acceptors (HBA), among others. 2. Formulation Descriptors (4 features) – Encoded excipient compositions, including lactose, silica, cellulose, mannitol, sucrose, and hydroxypropyl methylcellulose (HPMC), as well as API content percentage. 3. Conditioning and Storage Descriptors (5 features) – Packaging type (glass, plastic, paper), storage temperature, and classification of storage conditions. The tree ensemble regression algorithm processes these features to establish correlations between molecular properties, formulation parameters, and environmental conditions, ultimately predicting the BUD in days. Notably, the model identifies an inverse correlation between LogP and BUD, suggesting that higher lipophilicity is associated with reduced stability. This predictive approach enables formulators to estimate stability efficiently, reducing reliance on extensive real-time stability studies.
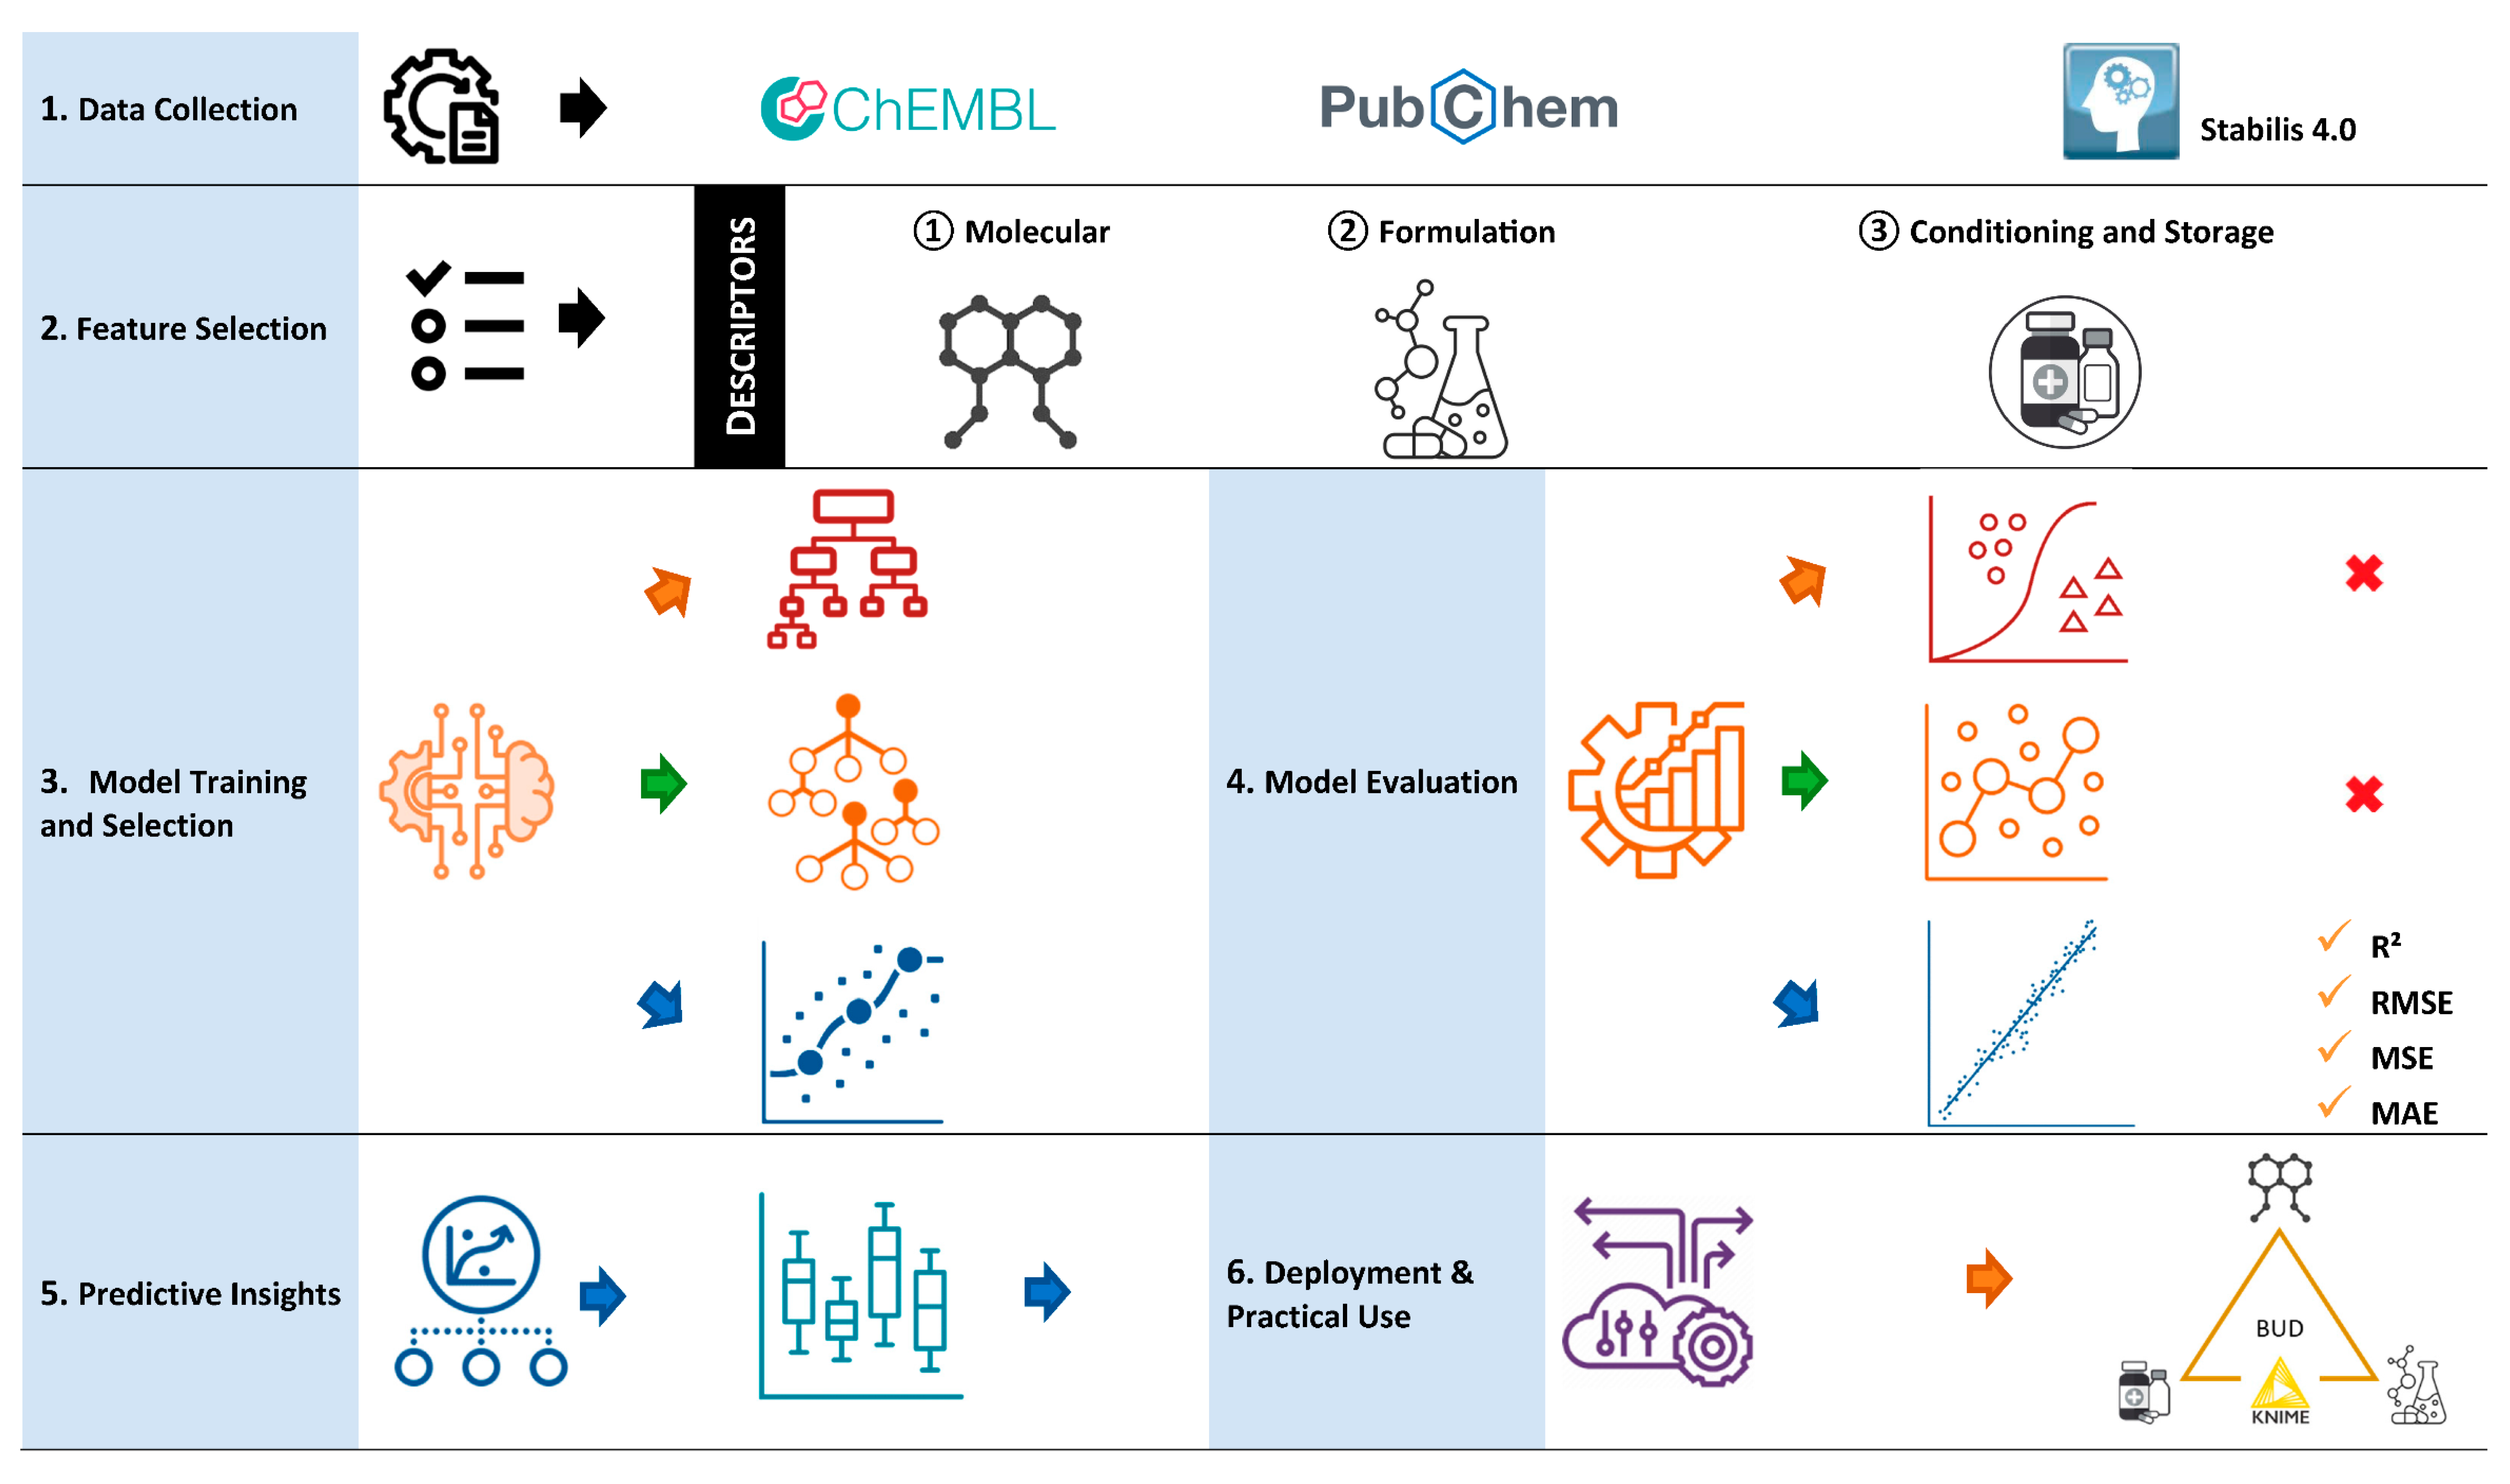
Figure 2.
(A) Predictive stability model of API using Tree Ensemble Regression learner algorithm in KNIME. (B) Automated workflow deployment for API stability prediction in compounded oral solid preparations, considering excipients, API content, packaging, and storage temperature. VI Ouput data Panel must be filled in https://www.knime.com/smart-formulation-data-app.
Figure 2.
(A) Predictive stability model of API using Tree Ensemble Regression learner algorithm in KNIME. (B) Automated workflow deployment for API stability prediction in compounded oral solid preparations, considering excipients, API content, packaging, and storage temperature. VI Ouput data Panel must be filled in https://www.knime.com/smart-formulation-data-app.
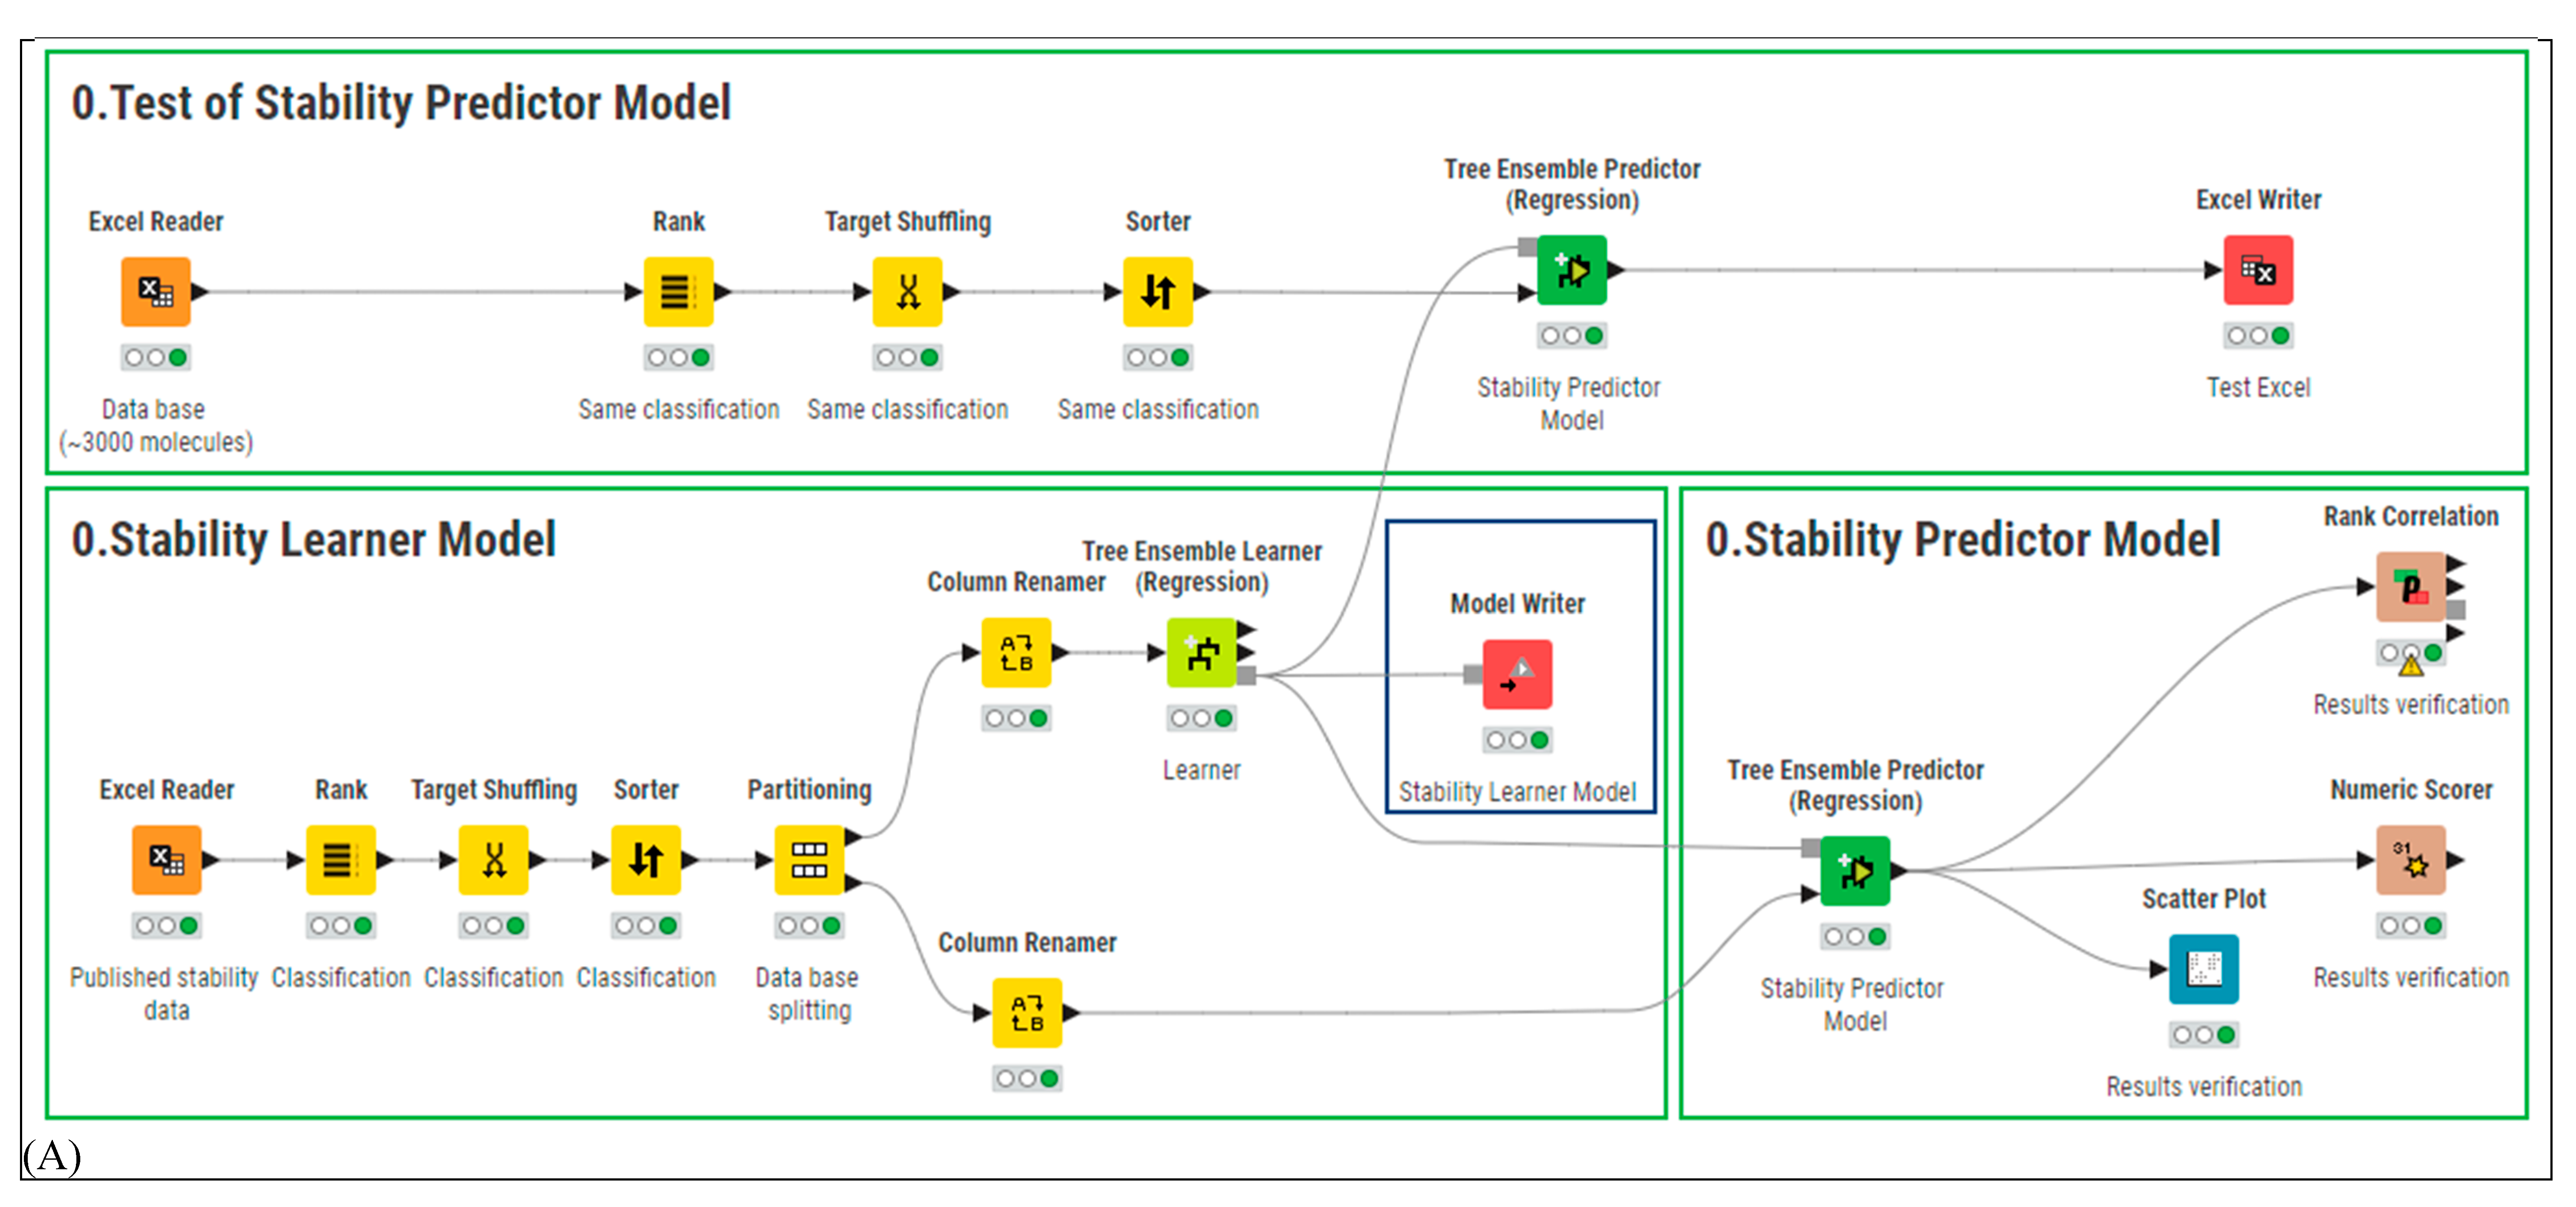
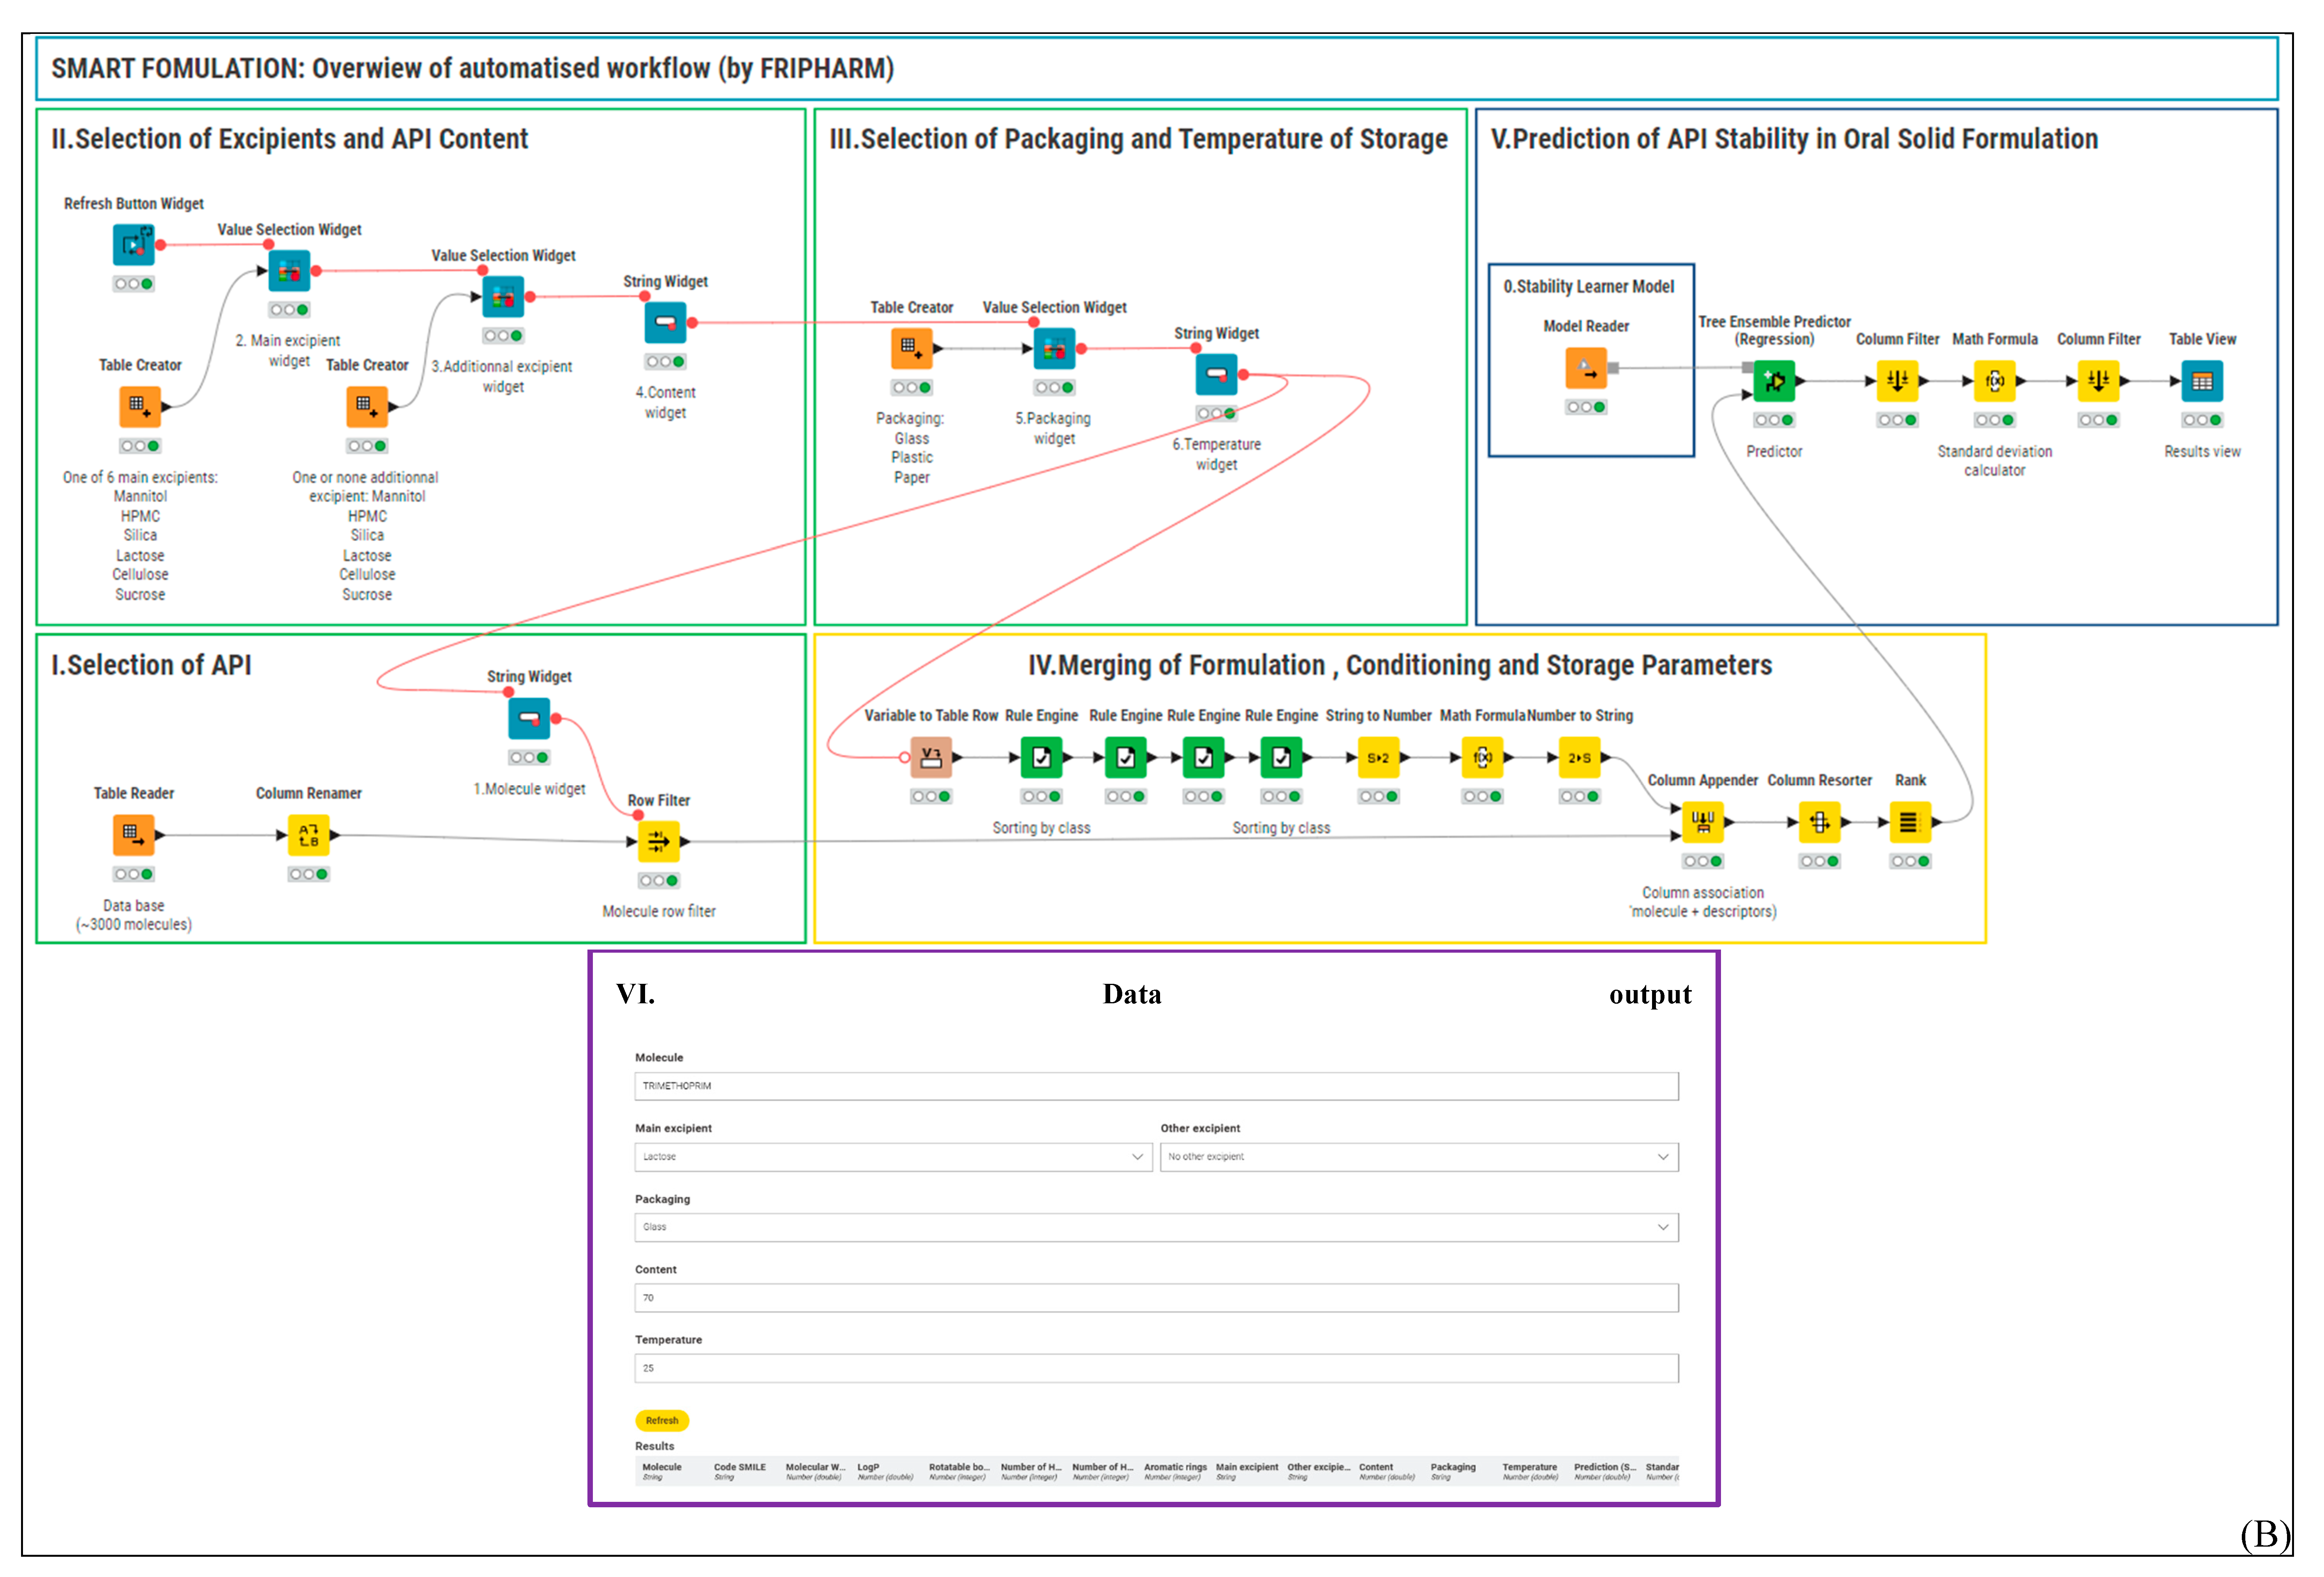
Figure 3.
Relationship between predicted and experimental stability data was significantly estimated by Tree Ensemble Regression learner and predictor-based model. (◯) excipients (pure or blended with one other excipient, n= 14 data points), (●) API (compounded with one or two excipients, n = 11 data points) conditioned in glass, plastic and paper packaging (cf. 0 Stability Predictor Model panel in figure 1). API content and temperature storage were between 0.2 to 100%, and 4°C, 25°C and 40°C, respectively.
Figure 3.
Relationship between predicted and experimental stability data was significantly estimated by Tree Ensemble Regression learner and predictor-based model. (◯) excipients (pure or blended with one other excipient, n= 14 data points), (●) API (compounded with one or two excipients, n = 11 data points) conditioned in glass, plastic and paper packaging (cf. 0 Stability Predictor Model panel in figure 1). API content and temperature storage were between 0.2 to 100%, and 4°C, 25°C and 40°C, respectively.
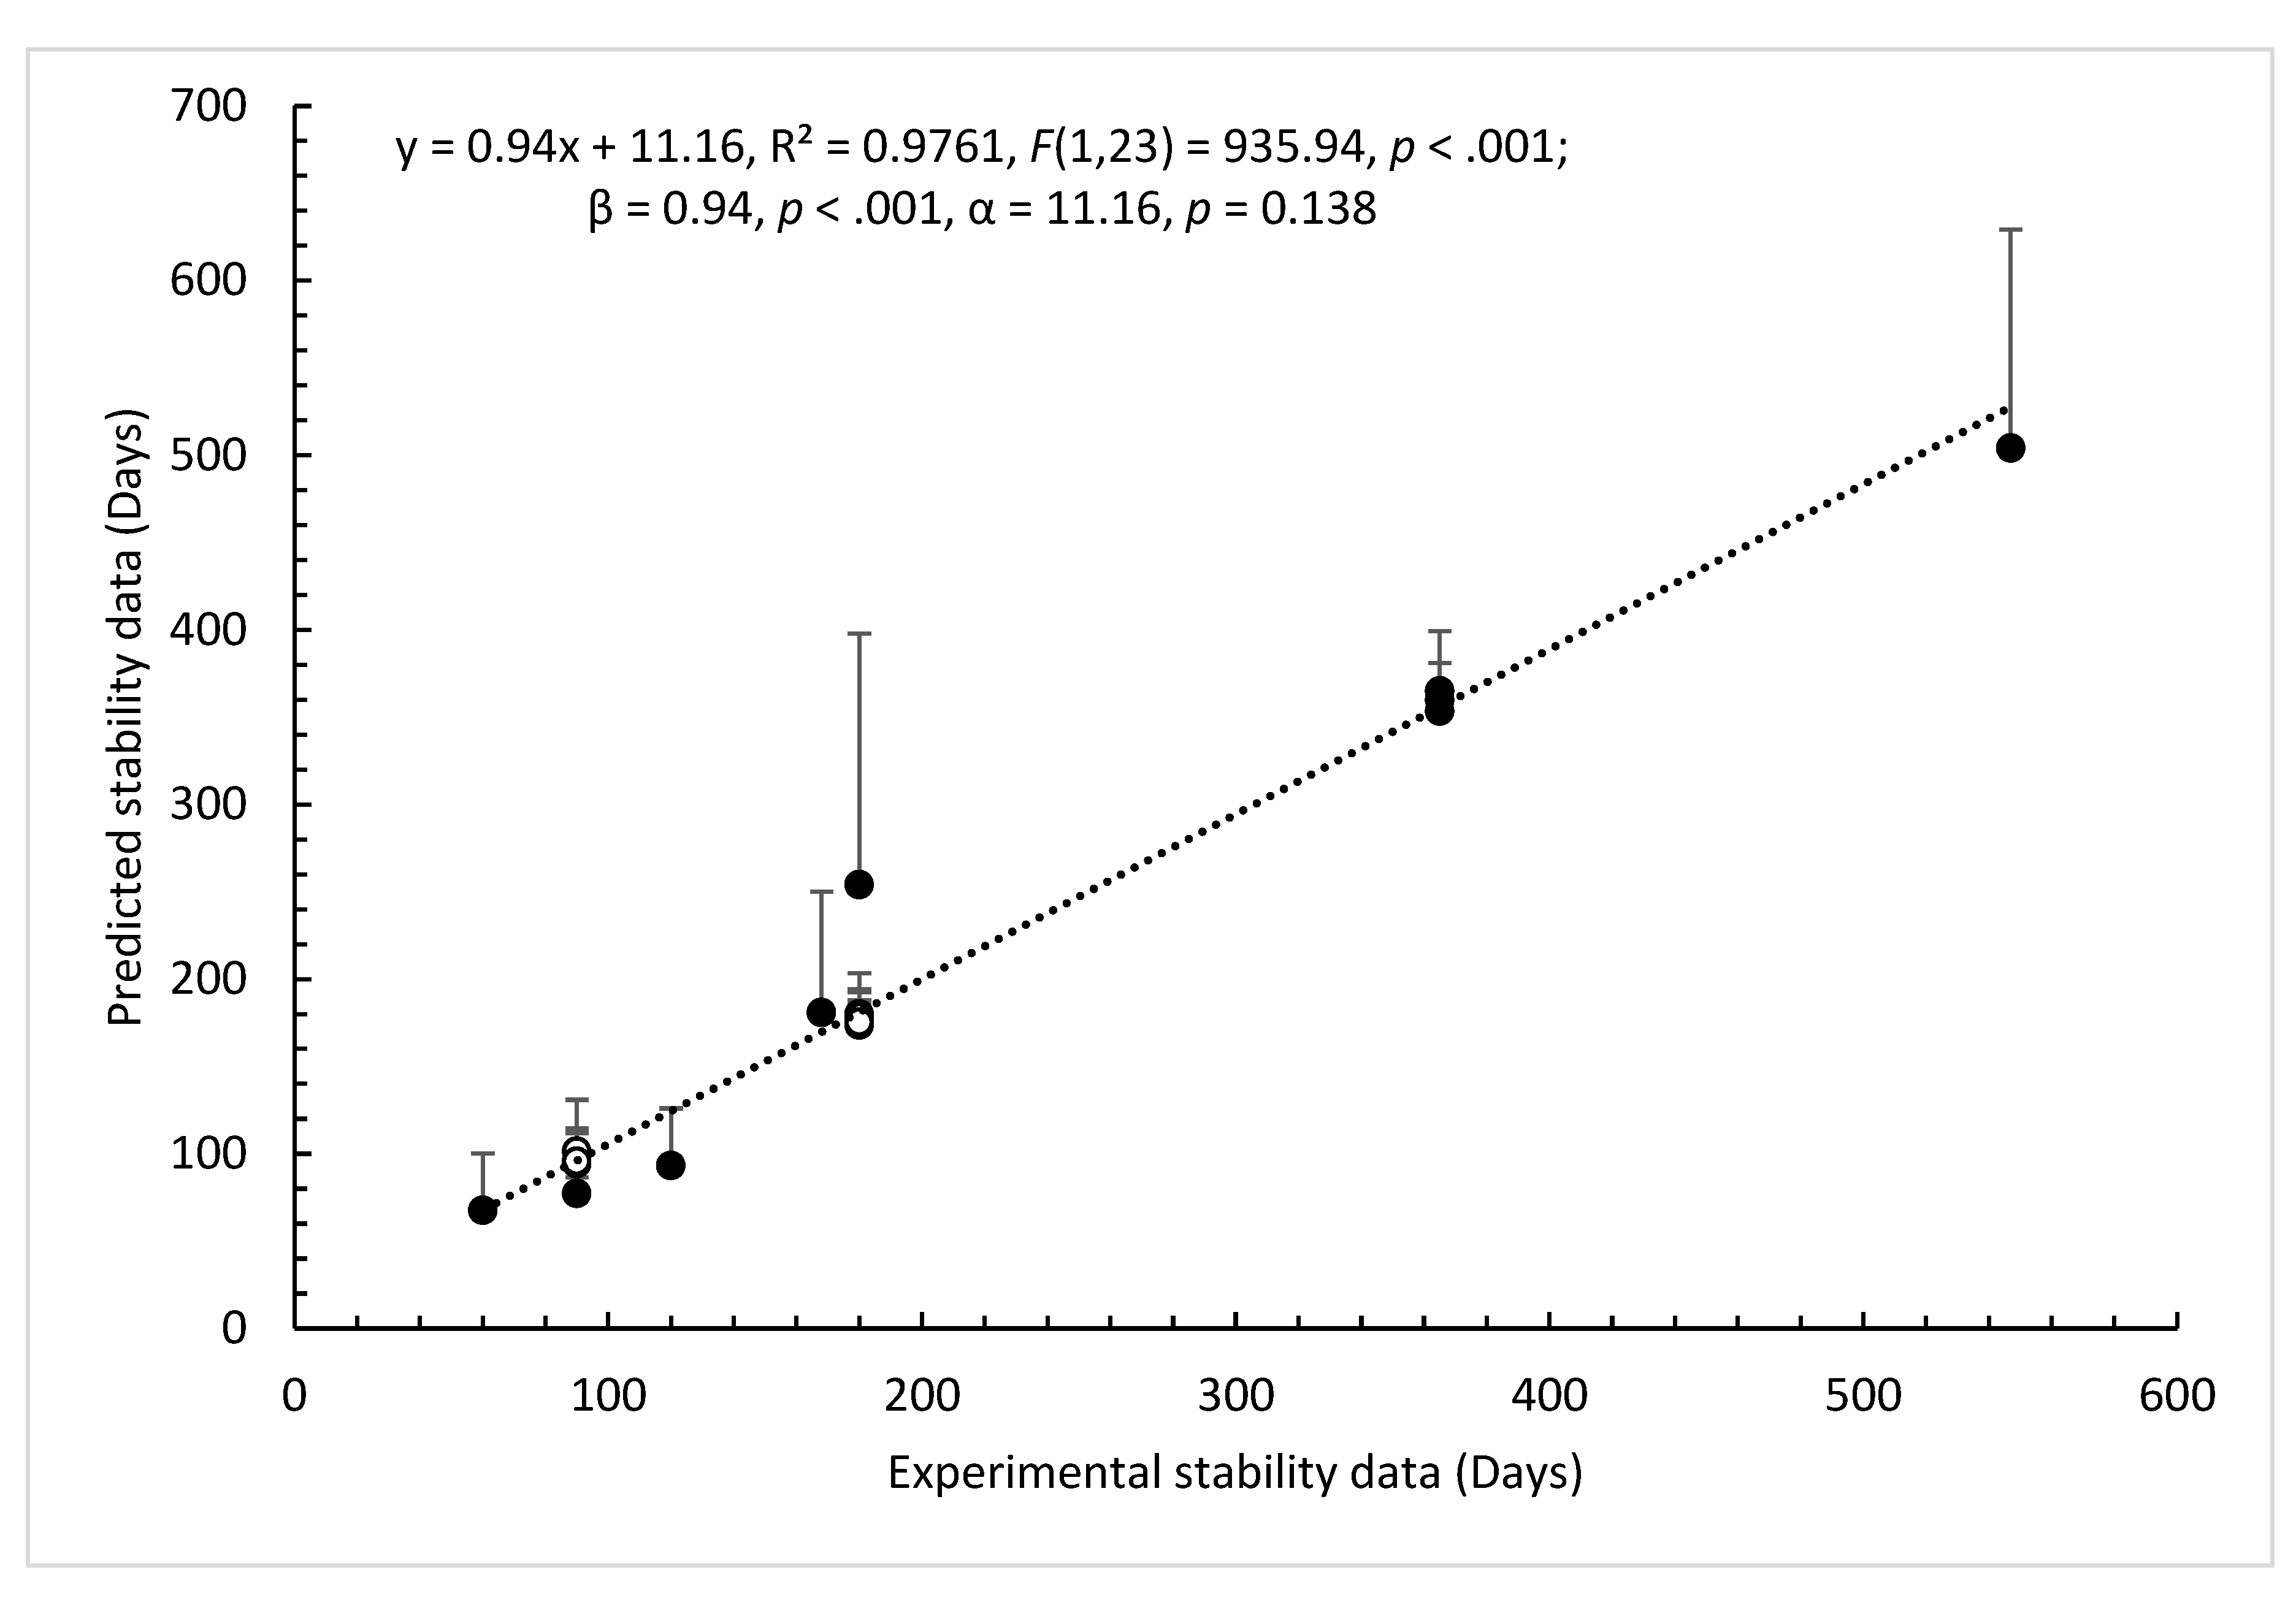
Figure 4.
Prediction of API (n = 15; MW: 129.17 to 776.87 g.mol-1, LogP: -0.92 to 5.39; initial content: 10%, conditioning: plastic) stability in 6 pure or 15 combinations of blended excipients as a function of temperature of storage. (◯) excipients, (●) API. (A): 4°C storage, API content: 10%, **: p < 0.01 as compared to HPMC and Lactose groups; ***: p < 0.0001 as compared to blend groups (ANOVA, post-hoc Tukey’s All pairs comparison. A significant linear relationship between prediction stability and LogP of API is shown in presence of either (◯) cellulose, mannitol, silica and sucrose pure excipients, or (●) HPMC and mannitol pure excipients. Shapiro-Wilk p-value > 0.05. (B): 25°C storage, API content: 10%, *p < 0.05 and **: p < 0.01 as compared to HPMC and Lactose groups; ***: p < 0.0001 as compared to blend groups. A significant linear relationship between prediction stability and LogP of API is shown in presence of either (◯) cellulose, silica and sucrose, (●) mannitol, (●) HPMC or (●) lactose pure excipients. Shapiro-Wilk p-value > 0.05. (C): 40°C storage, API content: 10%, a, **: p < 0.001 as compared to HPMC and Lactose groups; b,***: p < 0.0001 as compared to cellulose, HPMC, lactose, silica and sucrose blend groups. A significant linear relationship between prediction stability and LogP of API is shown in presence of either (◯) cellulose, mannitol, silica and sucrose pure excipients, or (●) HPMC and mannitol pure excipients. Shapiro-Wilk p-value > 0.05. (D): 25°C storage, API content: 90%, **: p < 0.01 and ***: p < 0.0001 as compared to blend groups. A significant linear relationship between prediction stability and LogP of API is shown in presence of either (◯) cellulose, silica and sucrose, (●) mannitol, (●)HPMC or (●) lactose pure excipients. Shapiro-Wilk p-value > 0.05.https://www.statskingdom.com/linear-regression-calculator.html.
Figure 4.
Prediction of API (n = 15; MW: 129.17 to 776.87 g.mol-1, LogP: -0.92 to 5.39; initial content: 10%, conditioning: plastic) stability in 6 pure or 15 combinations of blended excipients as a function of temperature of storage. (◯) excipients, (●) API. (A): 4°C storage, API content: 10%, **: p < 0.01 as compared to HPMC and Lactose groups; ***: p < 0.0001 as compared to blend groups (ANOVA, post-hoc Tukey’s All pairs comparison. A significant linear relationship between prediction stability and LogP of API is shown in presence of either (◯) cellulose, mannitol, silica and sucrose pure excipients, or (●) HPMC and mannitol pure excipients. Shapiro-Wilk p-value > 0.05. (B): 25°C storage, API content: 10%, *p < 0.05 and **: p < 0.01 as compared to HPMC and Lactose groups; ***: p < 0.0001 as compared to blend groups. A significant linear relationship between prediction stability and LogP of API is shown in presence of either (◯) cellulose, silica and sucrose, (●) mannitol, (●) HPMC or (●) lactose pure excipients. Shapiro-Wilk p-value > 0.05. (C): 40°C storage, API content: 10%, a, **: p < 0.001 as compared to HPMC and Lactose groups; b,***: p < 0.0001 as compared to cellulose, HPMC, lactose, silica and sucrose blend groups. A significant linear relationship between prediction stability and LogP of API is shown in presence of either (◯) cellulose, mannitol, silica and sucrose pure excipients, or (●) HPMC and mannitol pure excipients. Shapiro-Wilk p-value > 0.05. (D): 25°C storage, API content: 90%, **: p < 0.01 and ***: p < 0.0001 as compared to blend groups. A significant linear relationship between prediction stability and LogP of API is shown in presence of either (◯) cellulose, silica and sucrose, (●) mannitol, (●)HPMC or (●) lactose pure excipients. Shapiro-Wilk p-value > 0.05.https://www.statskingdom.com/linear-regression-calculator.html.
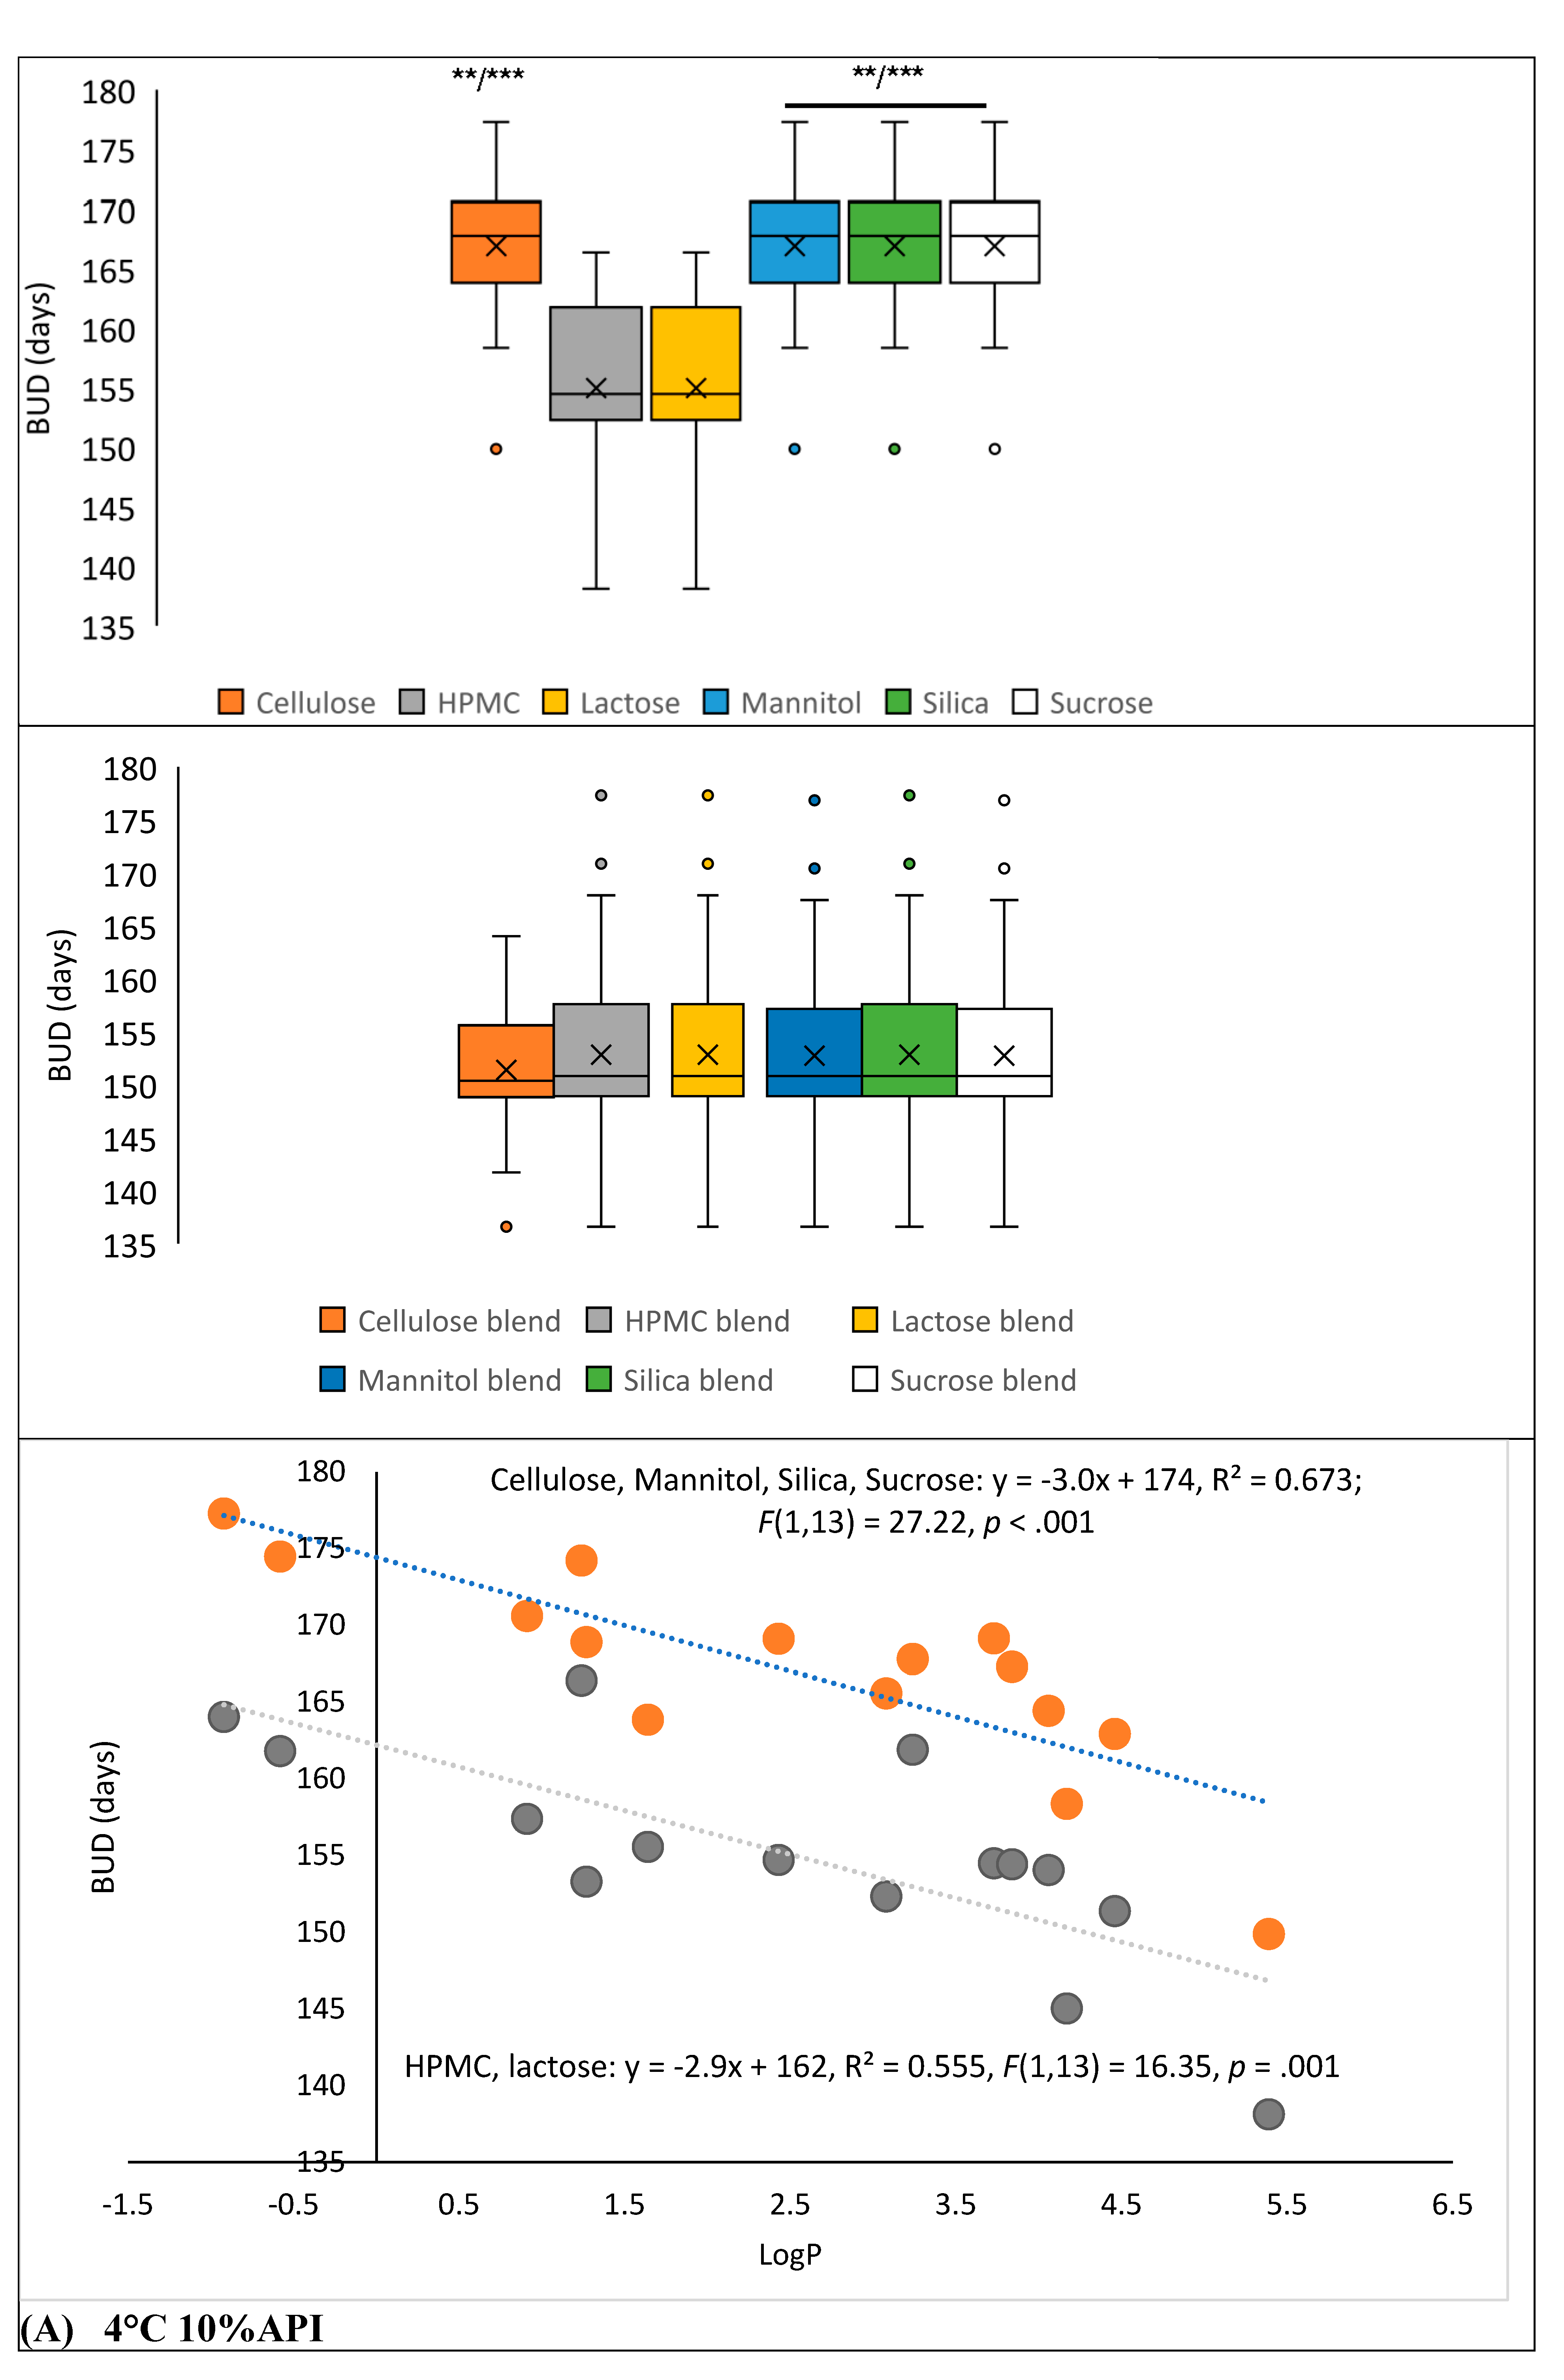
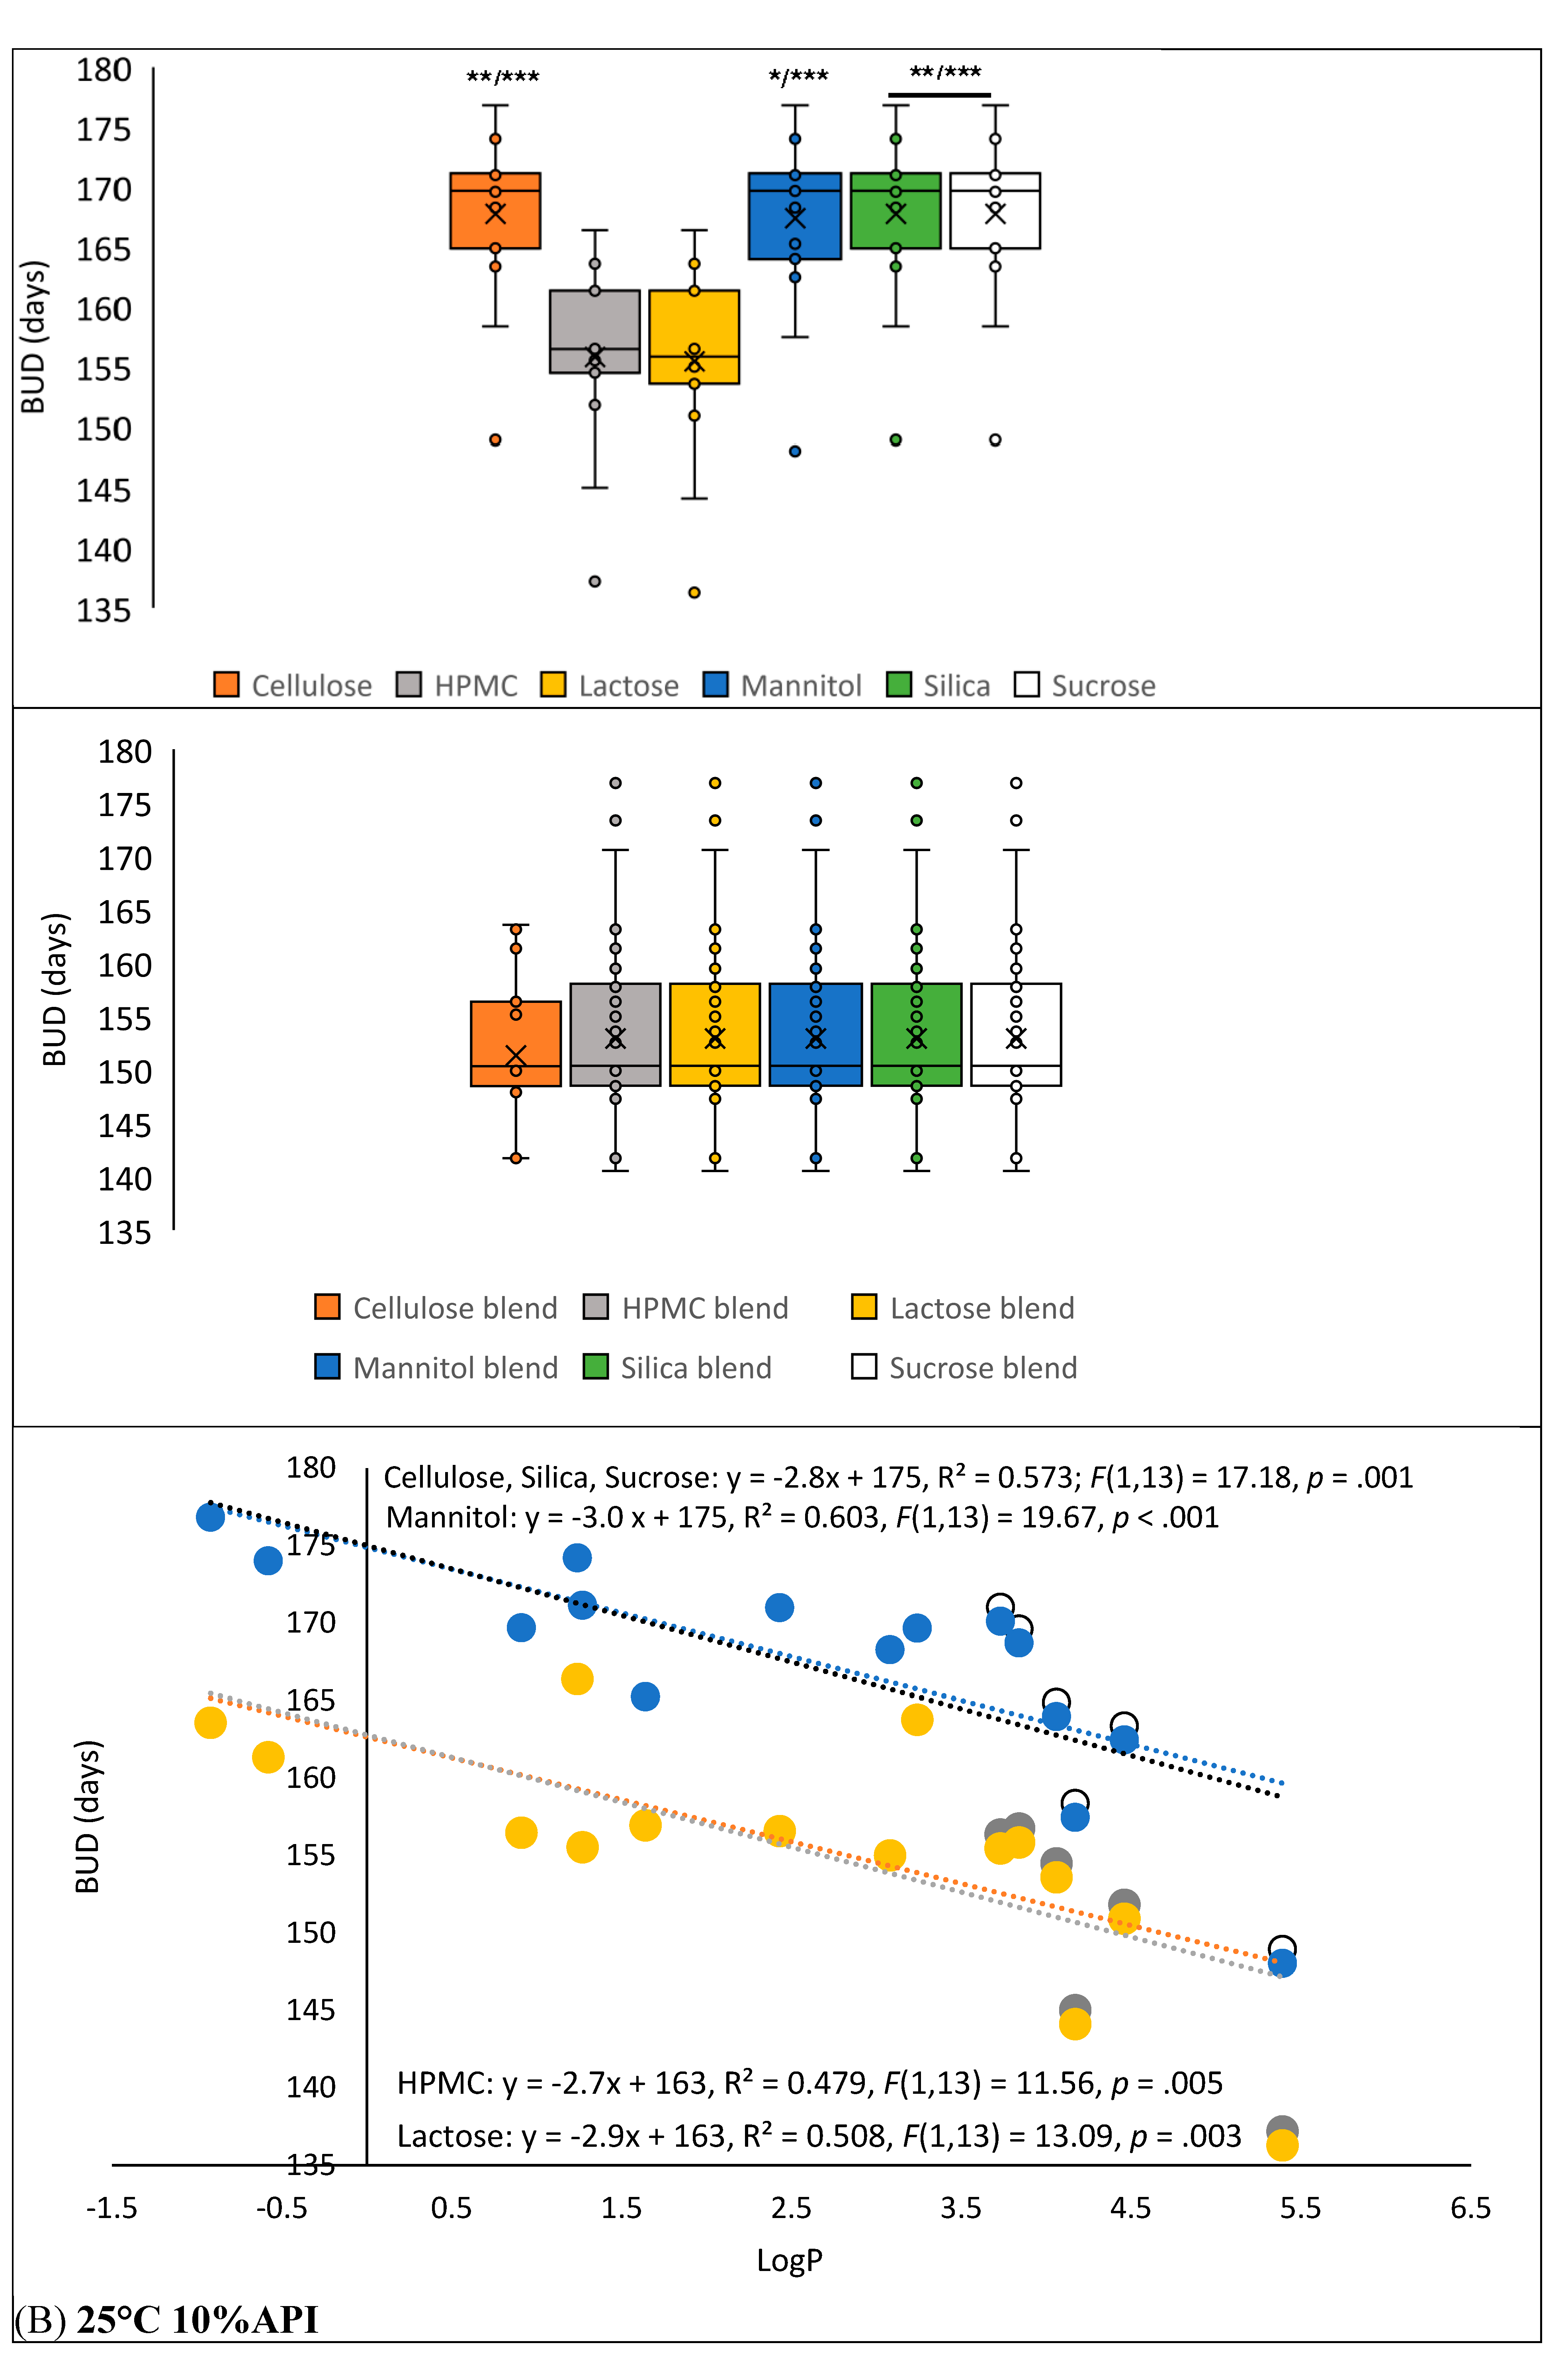
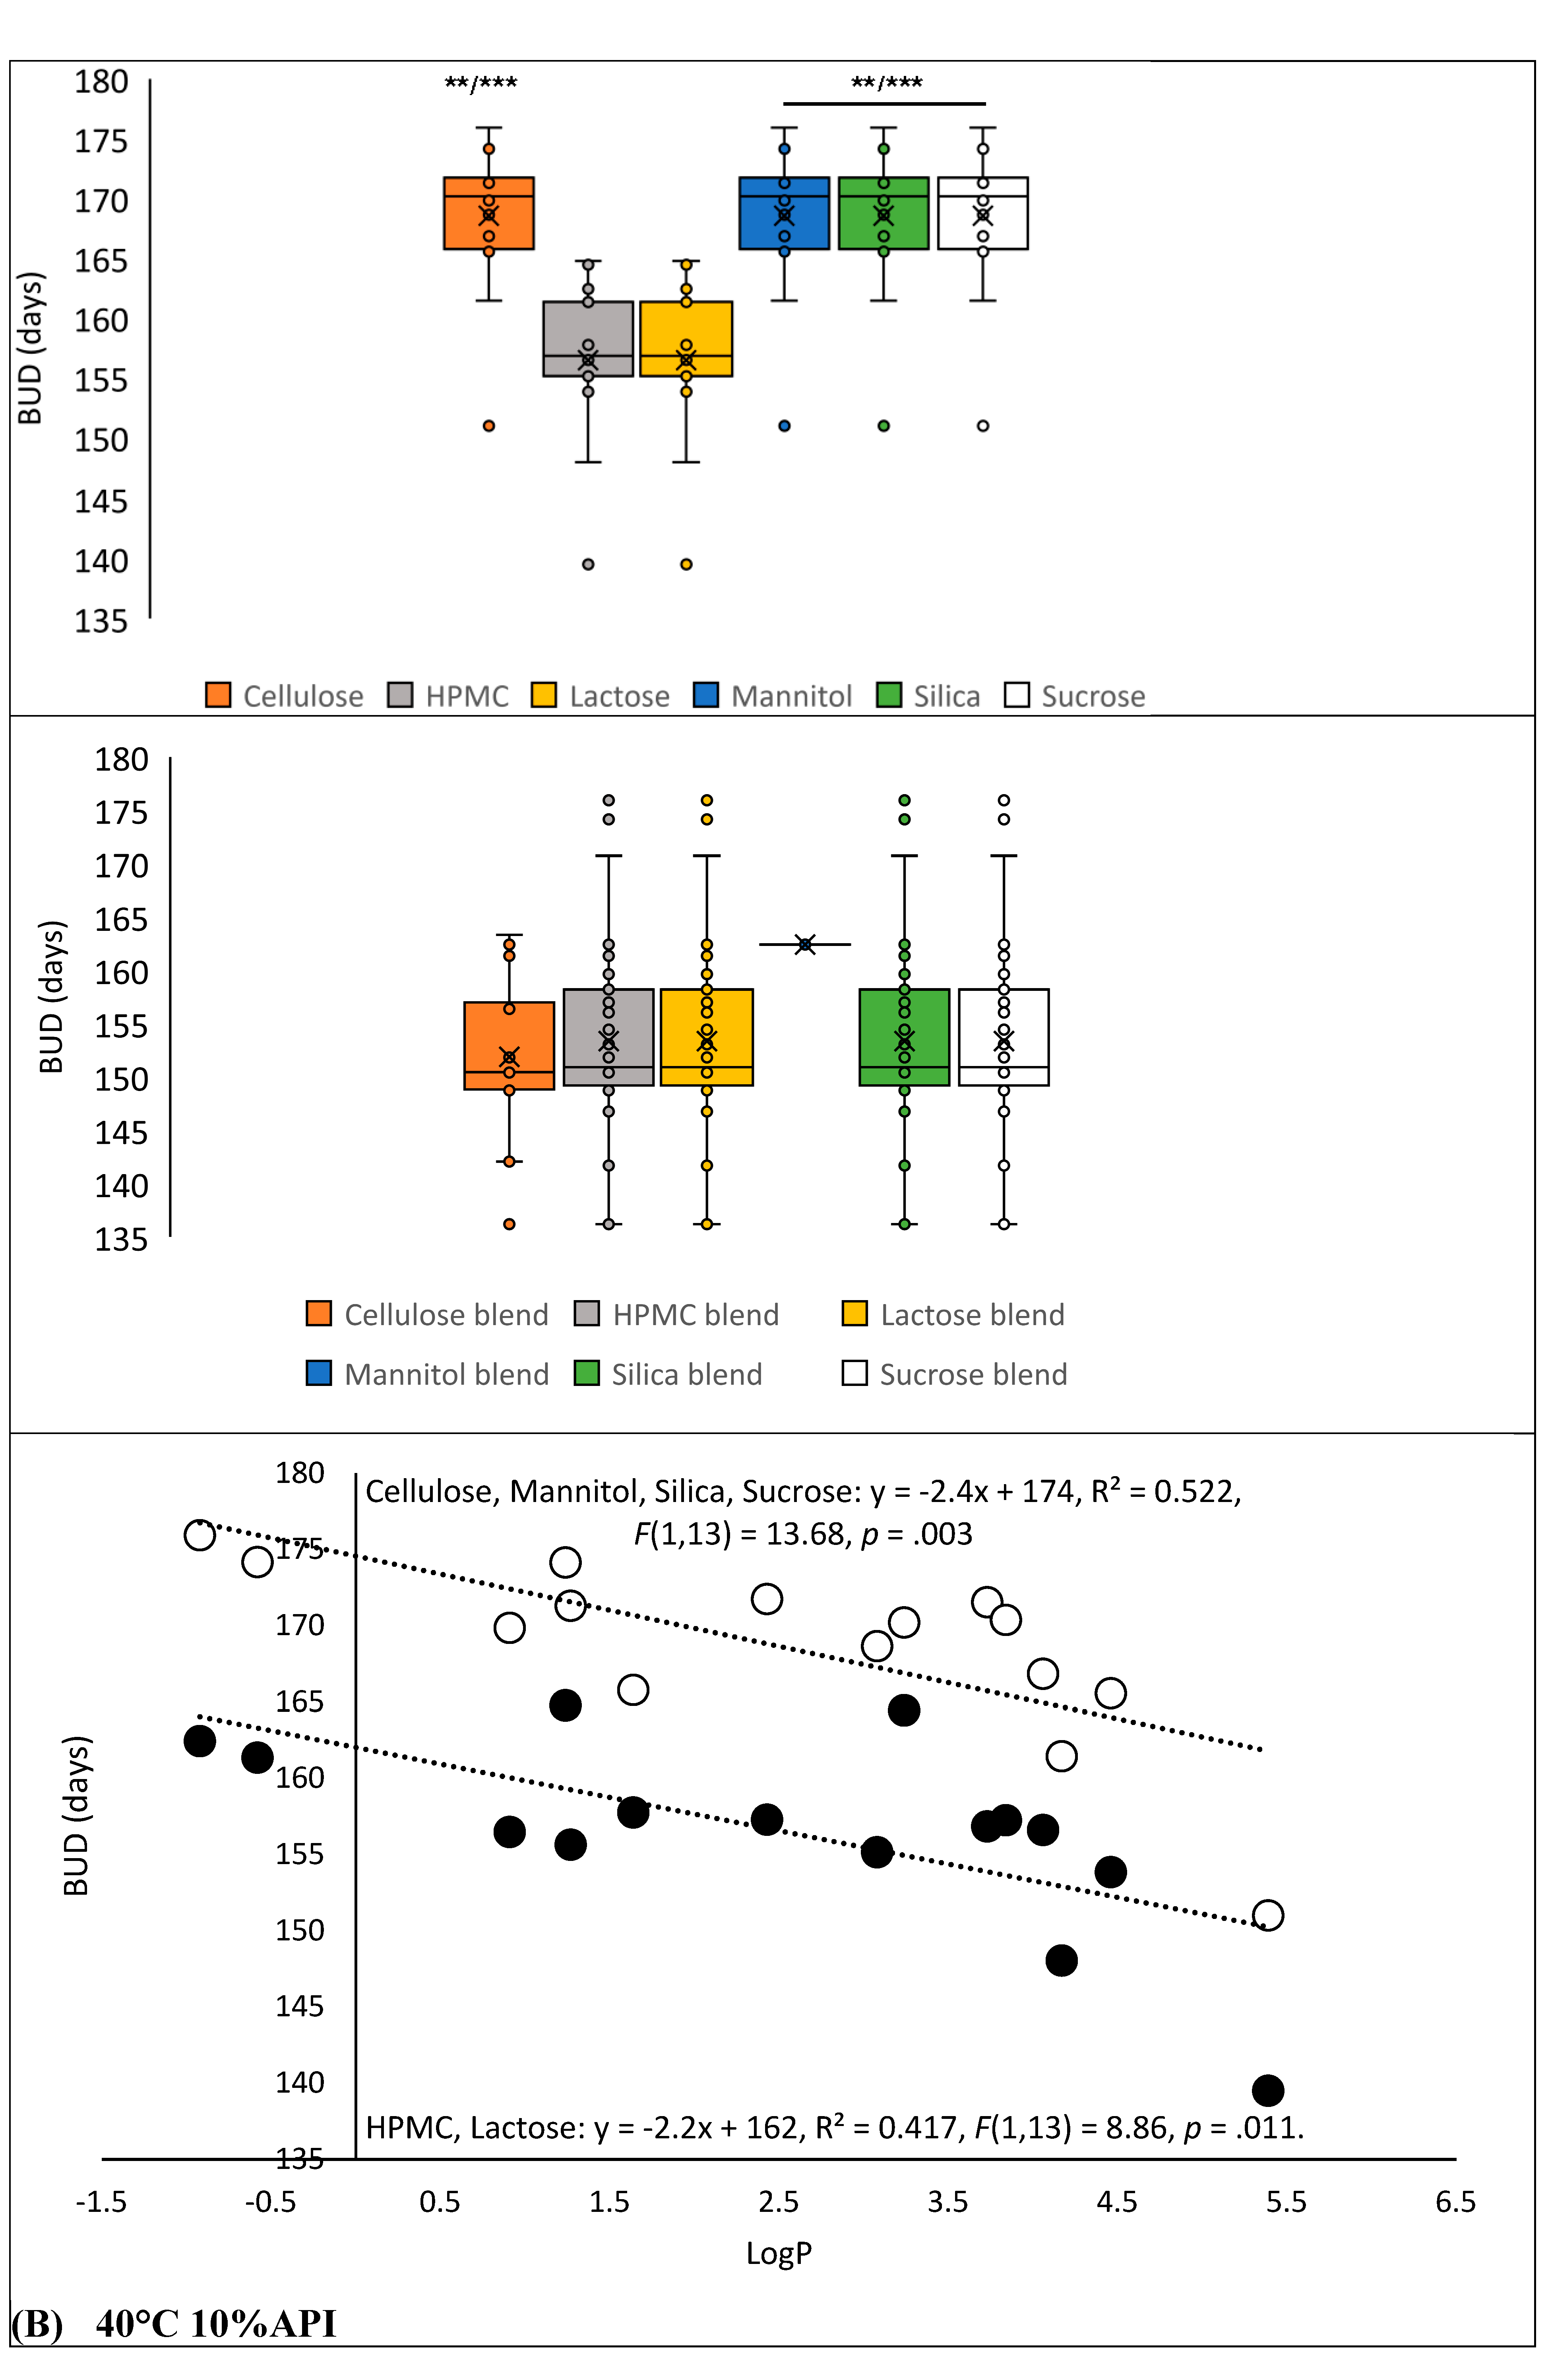
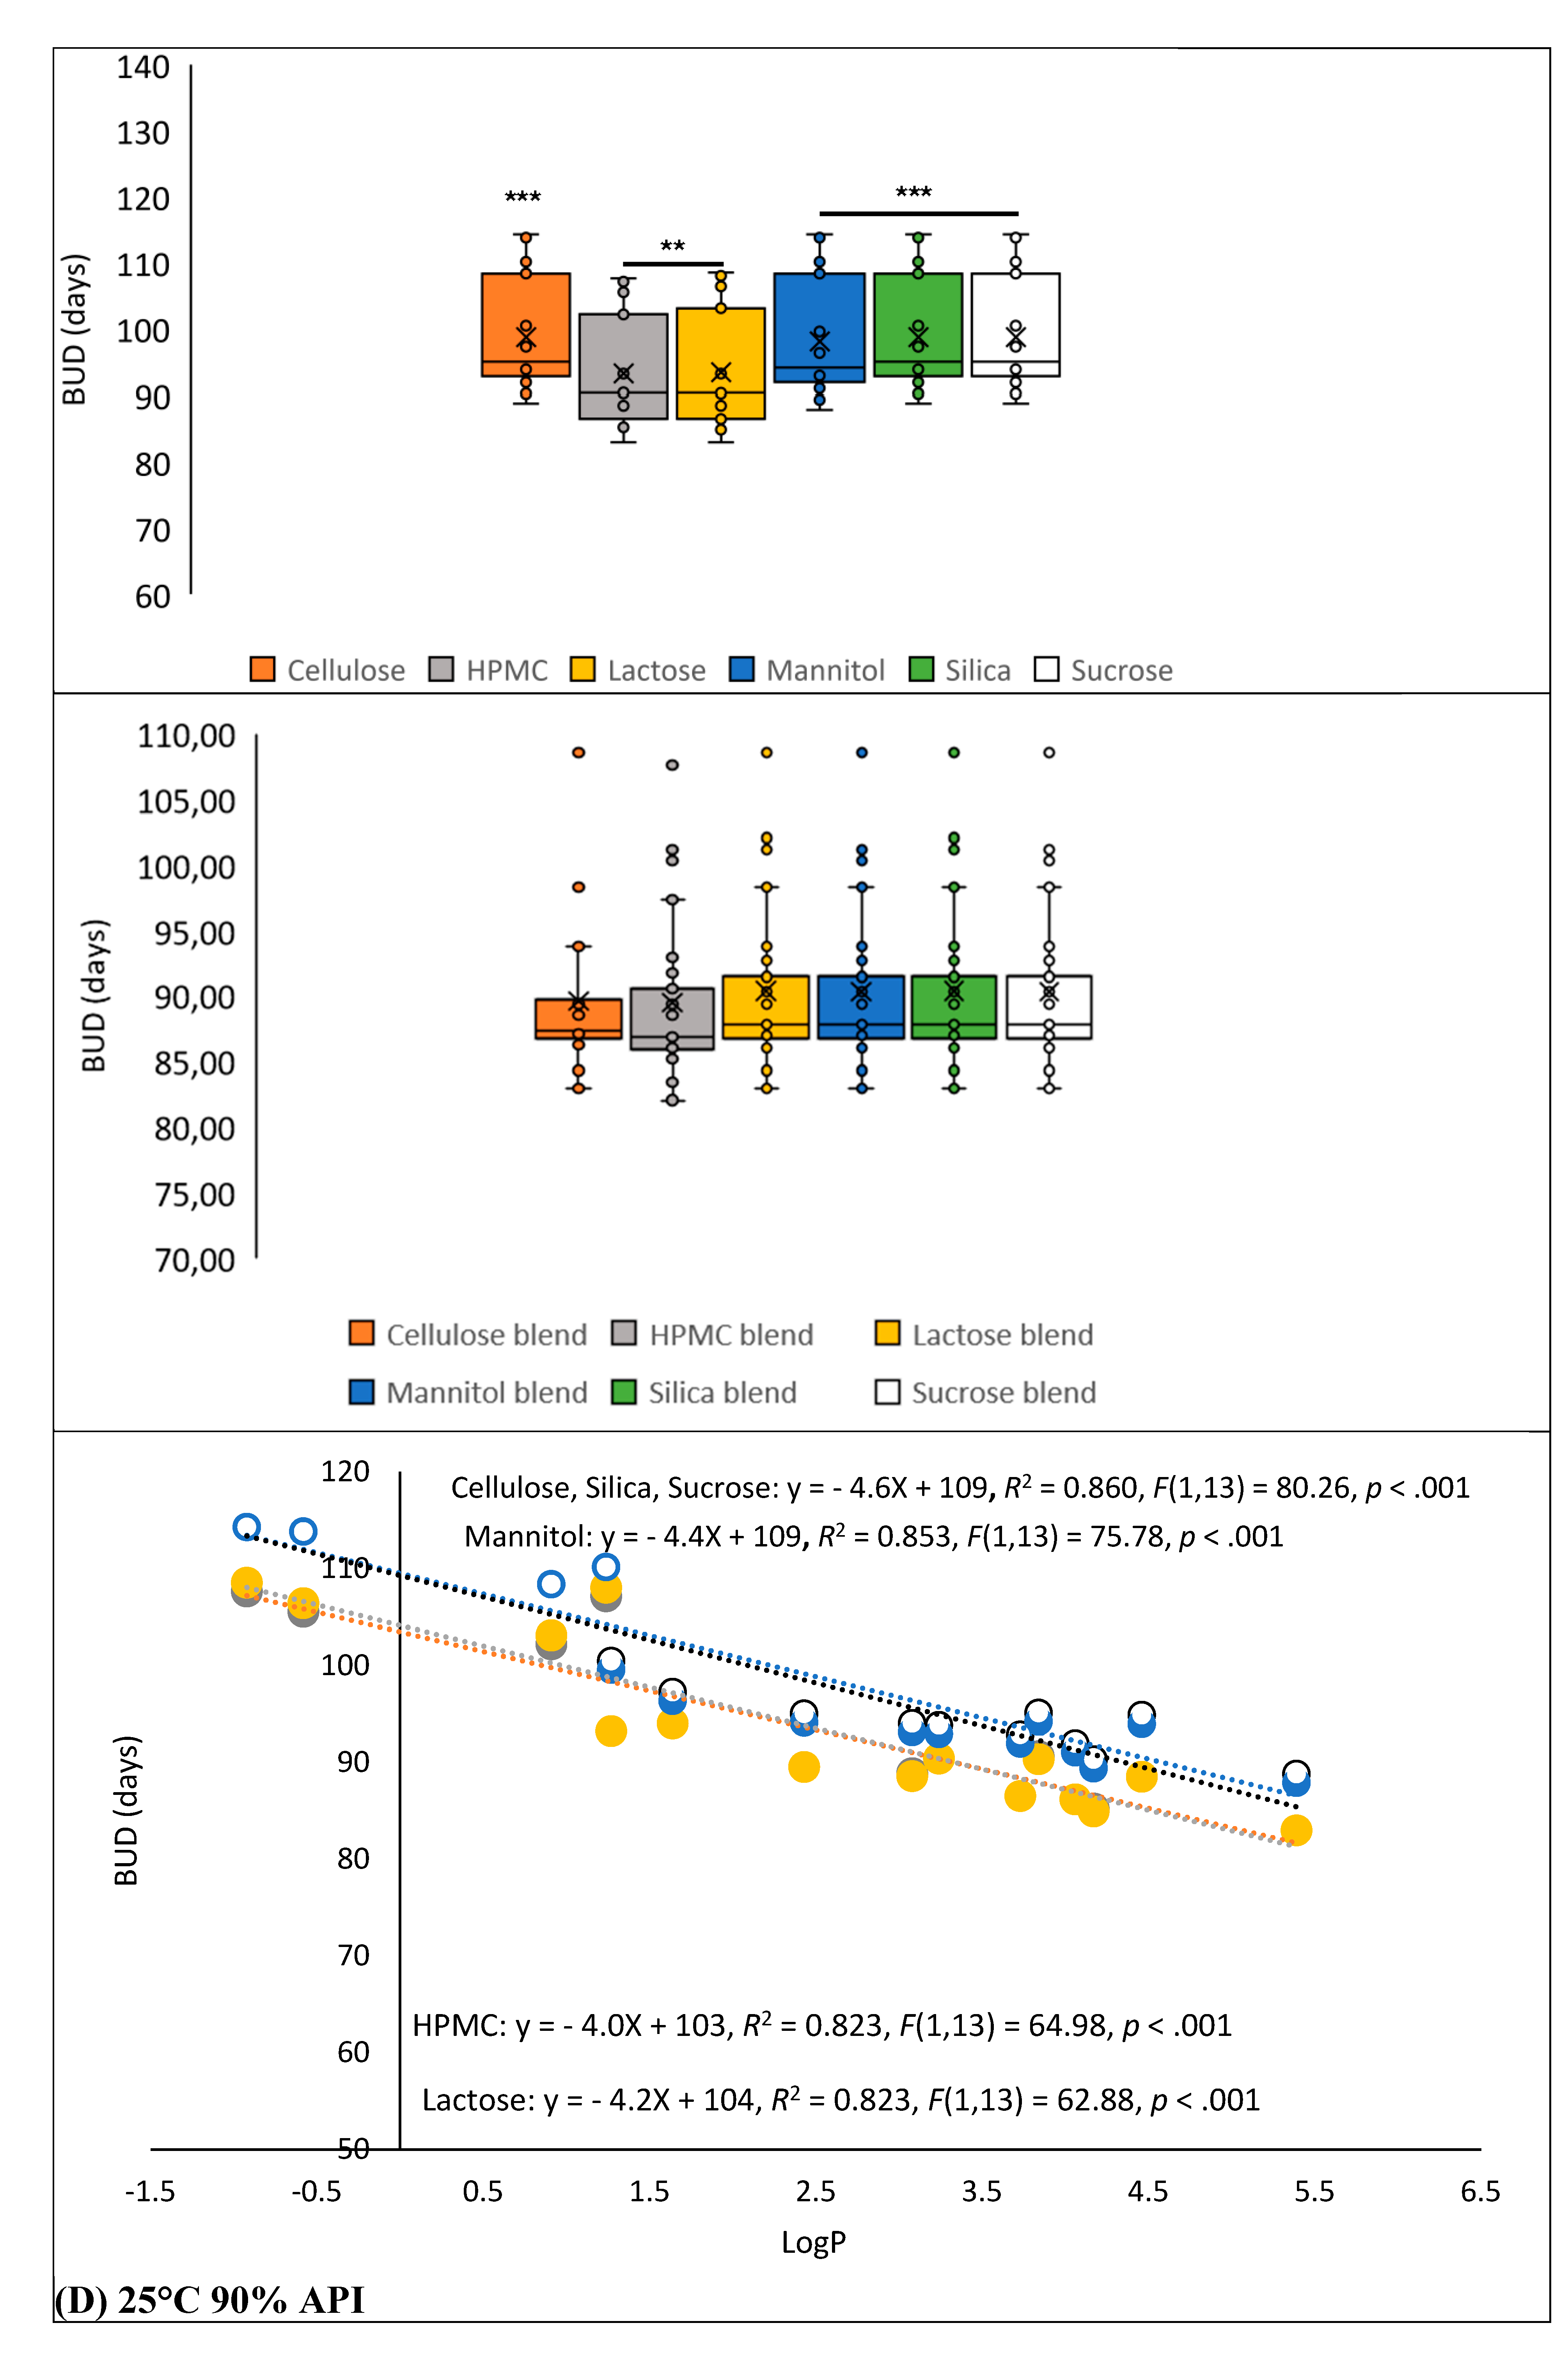
Figure 5.
Comparison of BUD for 3,166 APIs (MW: 12.01–1461.43 g.mol-1; log P: -12.01–17.16) formulated in ■ cellulose, ■ HPMC, ■ lactose, ■ mannitol, ■ silica and ■ sucrose (API content: 90% to 1%) then stored at 25°C in plastic containers. For API contents of 1%, 10%, 50% and 90%, significant differences were observed between excipients in the 80–170 day range (p < 0.0001). No significant difference was found between excipients in the 80–95 day category (Chi² test).
Figure 5.
Comparison of BUD for 3,166 APIs (MW: 12.01–1461.43 g.mol-1; log P: -12.01–17.16) formulated in ■ cellulose, ■ HPMC, ■ lactose, ■ mannitol, ■ silica and ■ sucrose (API content: 90% to 1%) then stored at 25°C in plastic containers. For API contents of 1%, 10%, 50% and 90%, significant differences were observed between excipients in the 80–170 day range (p < 0.0001). No significant difference was found between excipients in the 80–95 day category (Chi² test).
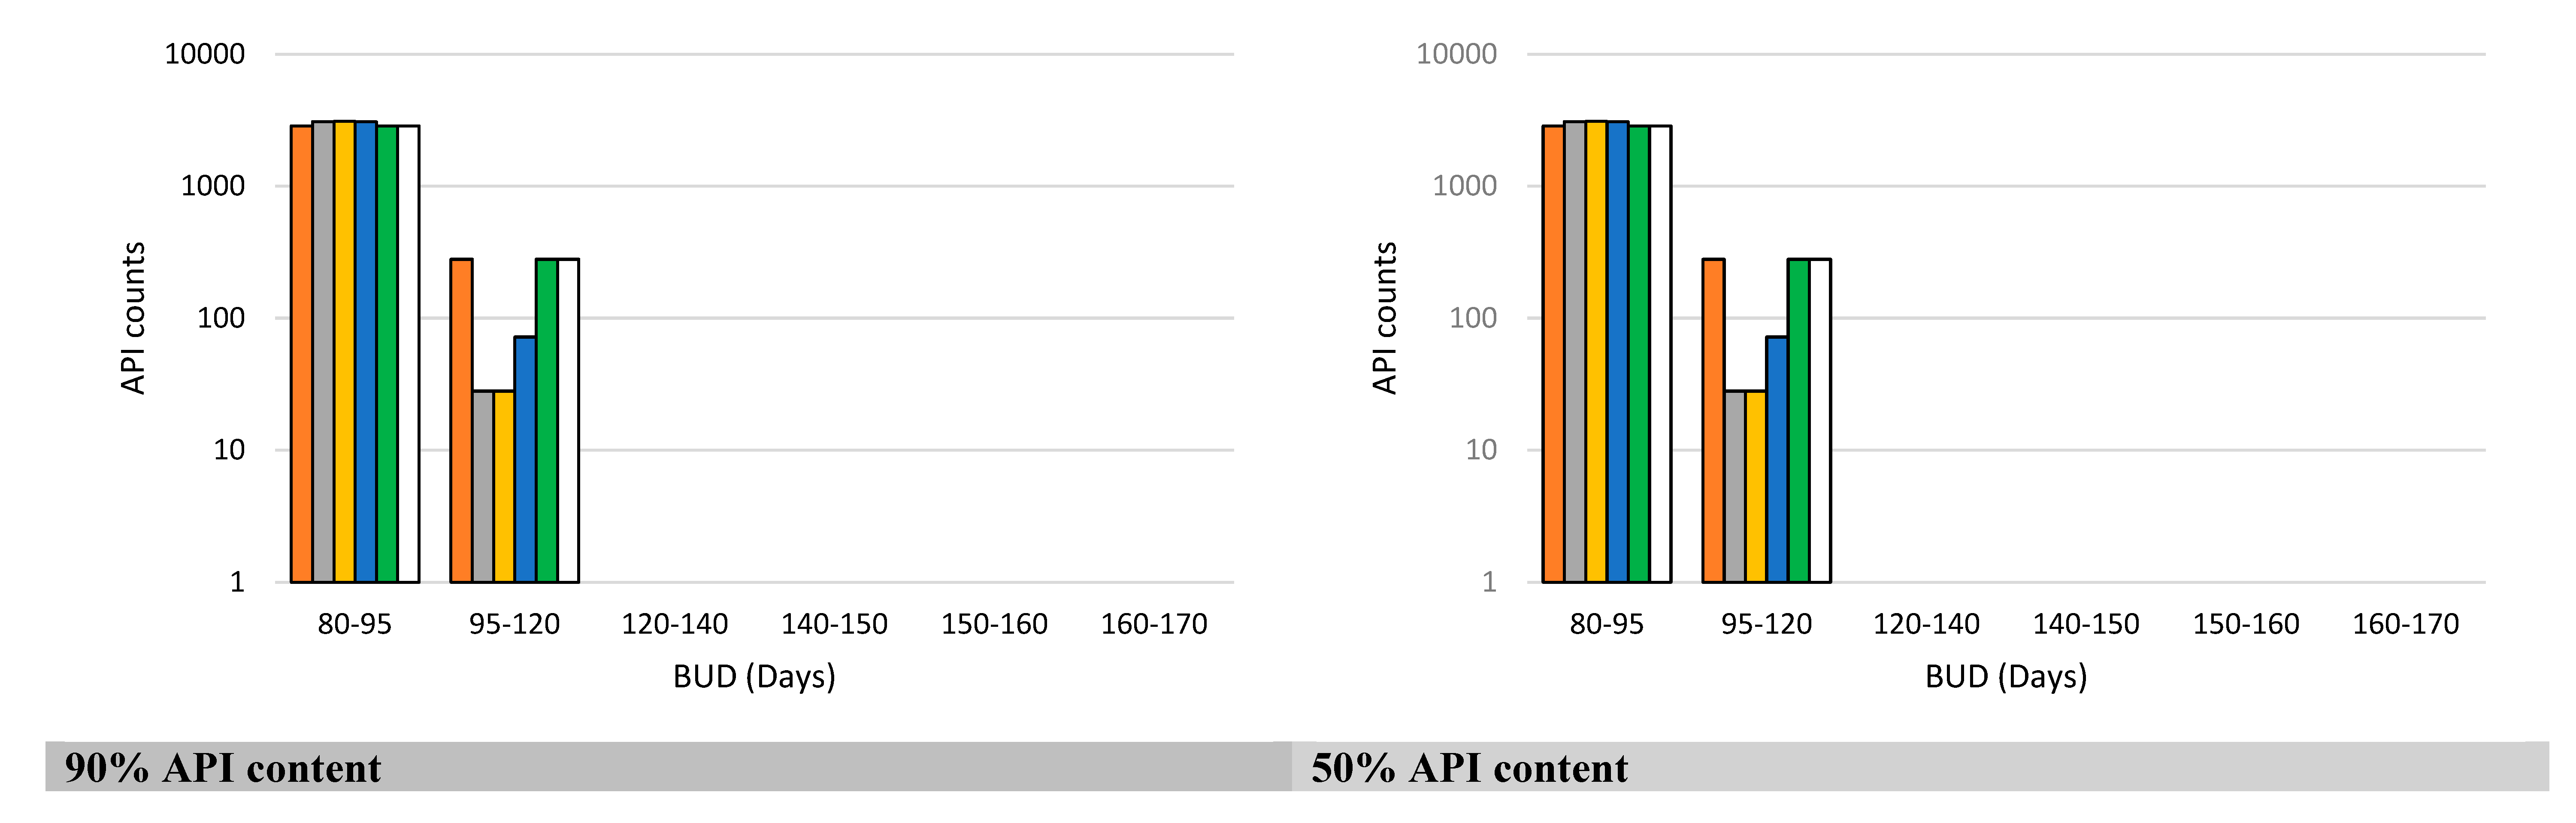
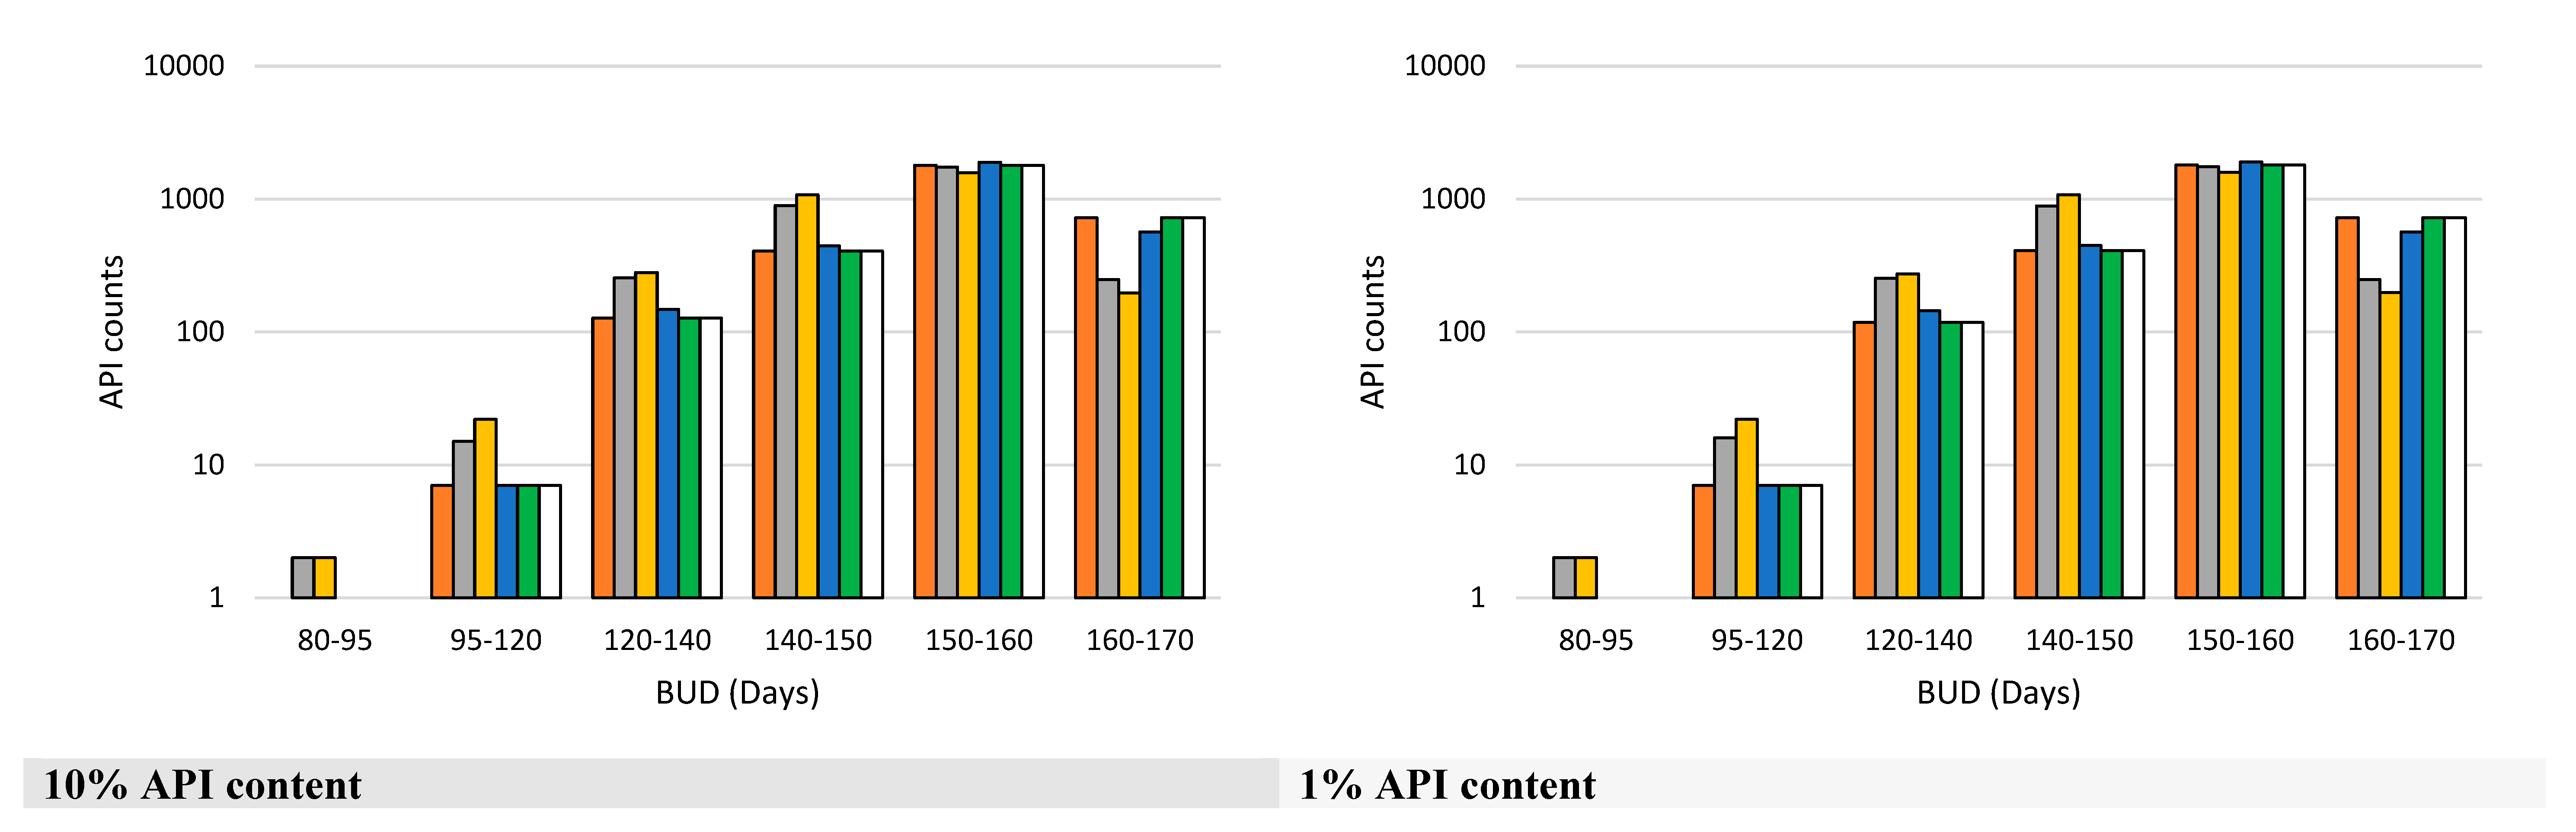
Figure 6.
Frequency of formulation categories with BUD of 80-170 Days. Radar charts represent the distribution of formulation categories (% on the y-axis) based on their BUD across different excipients (cellulose, HPMC, lactose, mannitol, silica, sucrose). The formulations are classified according to their API content, ranging from 90% to 1%, and stored at various temperatures (40°C, 25°C, and 4°C). The color-coded categories indicate the frequency of formulations falling within specific BUD ranges. For example, unlicensed preparations formulated with HPMC containing 10% API and stored at 40°C show the following distribution: 50.5% of formulations have a BUD between 150 and 160 days, 29.5% between 140 and 150 days, 10% between 120 and 140 days, 9% between 160 and 170 days, 1% between 80 and 120 days. All formulations were packaged in plastic containers.
Figure 6.
Frequency of formulation categories with BUD of 80-170 Days. Radar charts represent the distribution of formulation categories (% on the y-axis) based on their BUD across different excipients (cellulose, HPMC, lactose, mannitol, silica, sucrose). The formulations are classified according to their API content, ranging from 90% to 1%, and stored at various temperatures (40°C, 25°C, and 4°C). The color-coded categories indicate the frequency of formulations falling within specific BUD ranges. For example, unlicensed preparations formulated with HPMC containing 10% API and stored at 40°C show the following distribution: 50.5% of formulations have a BUD between 150 and 160 days, 29.5% between 140 and 150 days, 10% between 120 and 140 days, 9% between 160 and 170 days, 1% between 80 and 120 days. All formulations were packaged in plastic containers.
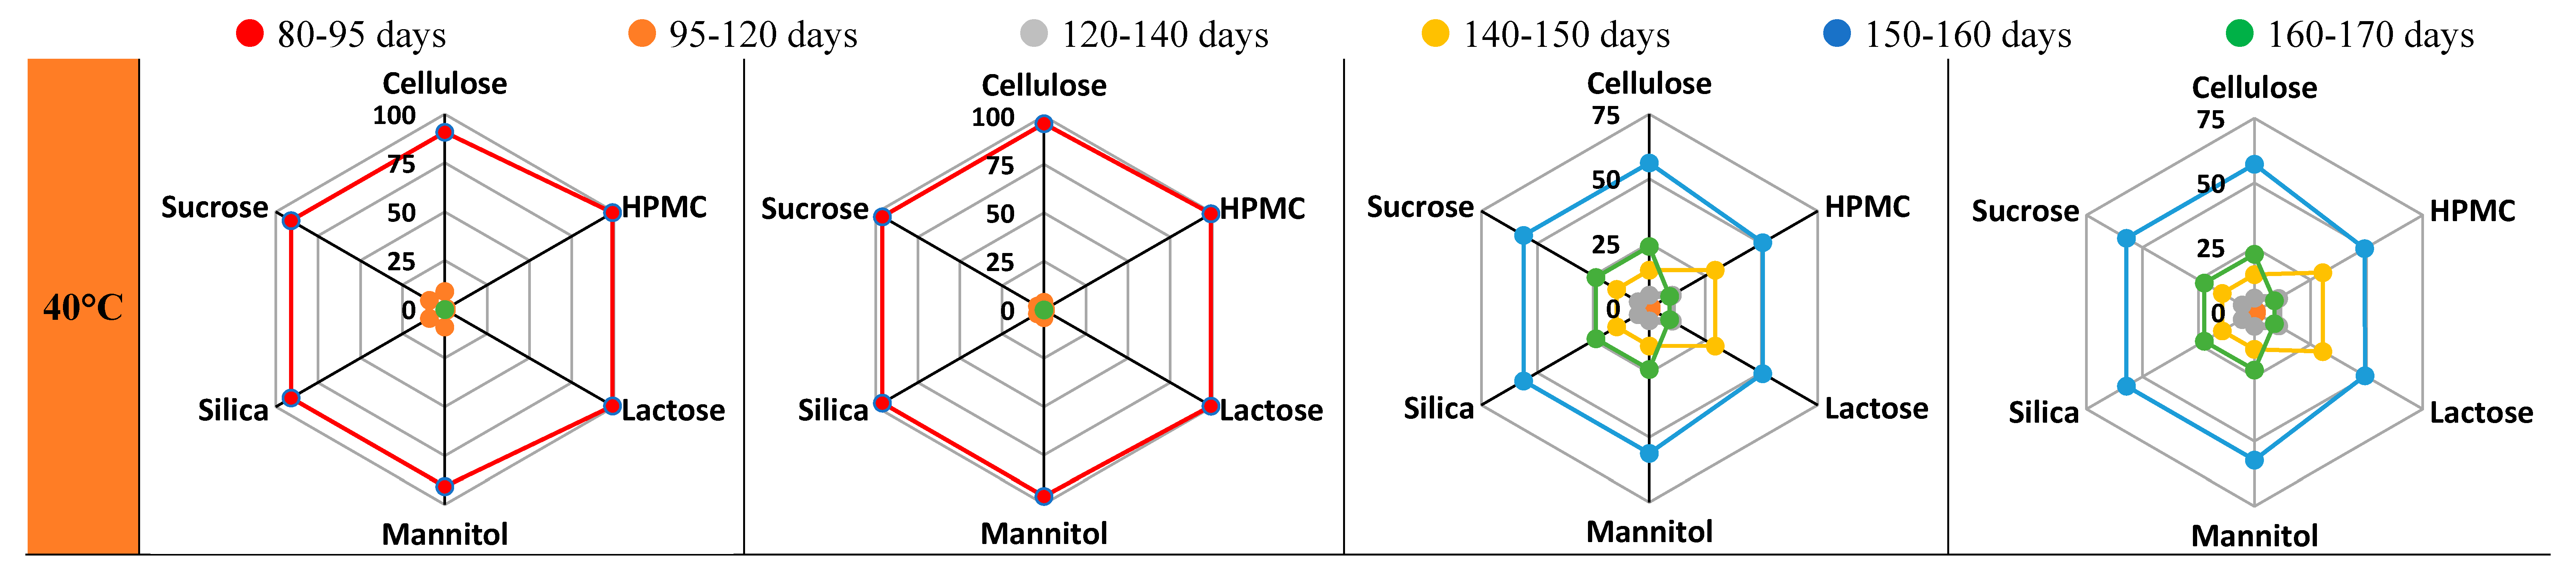
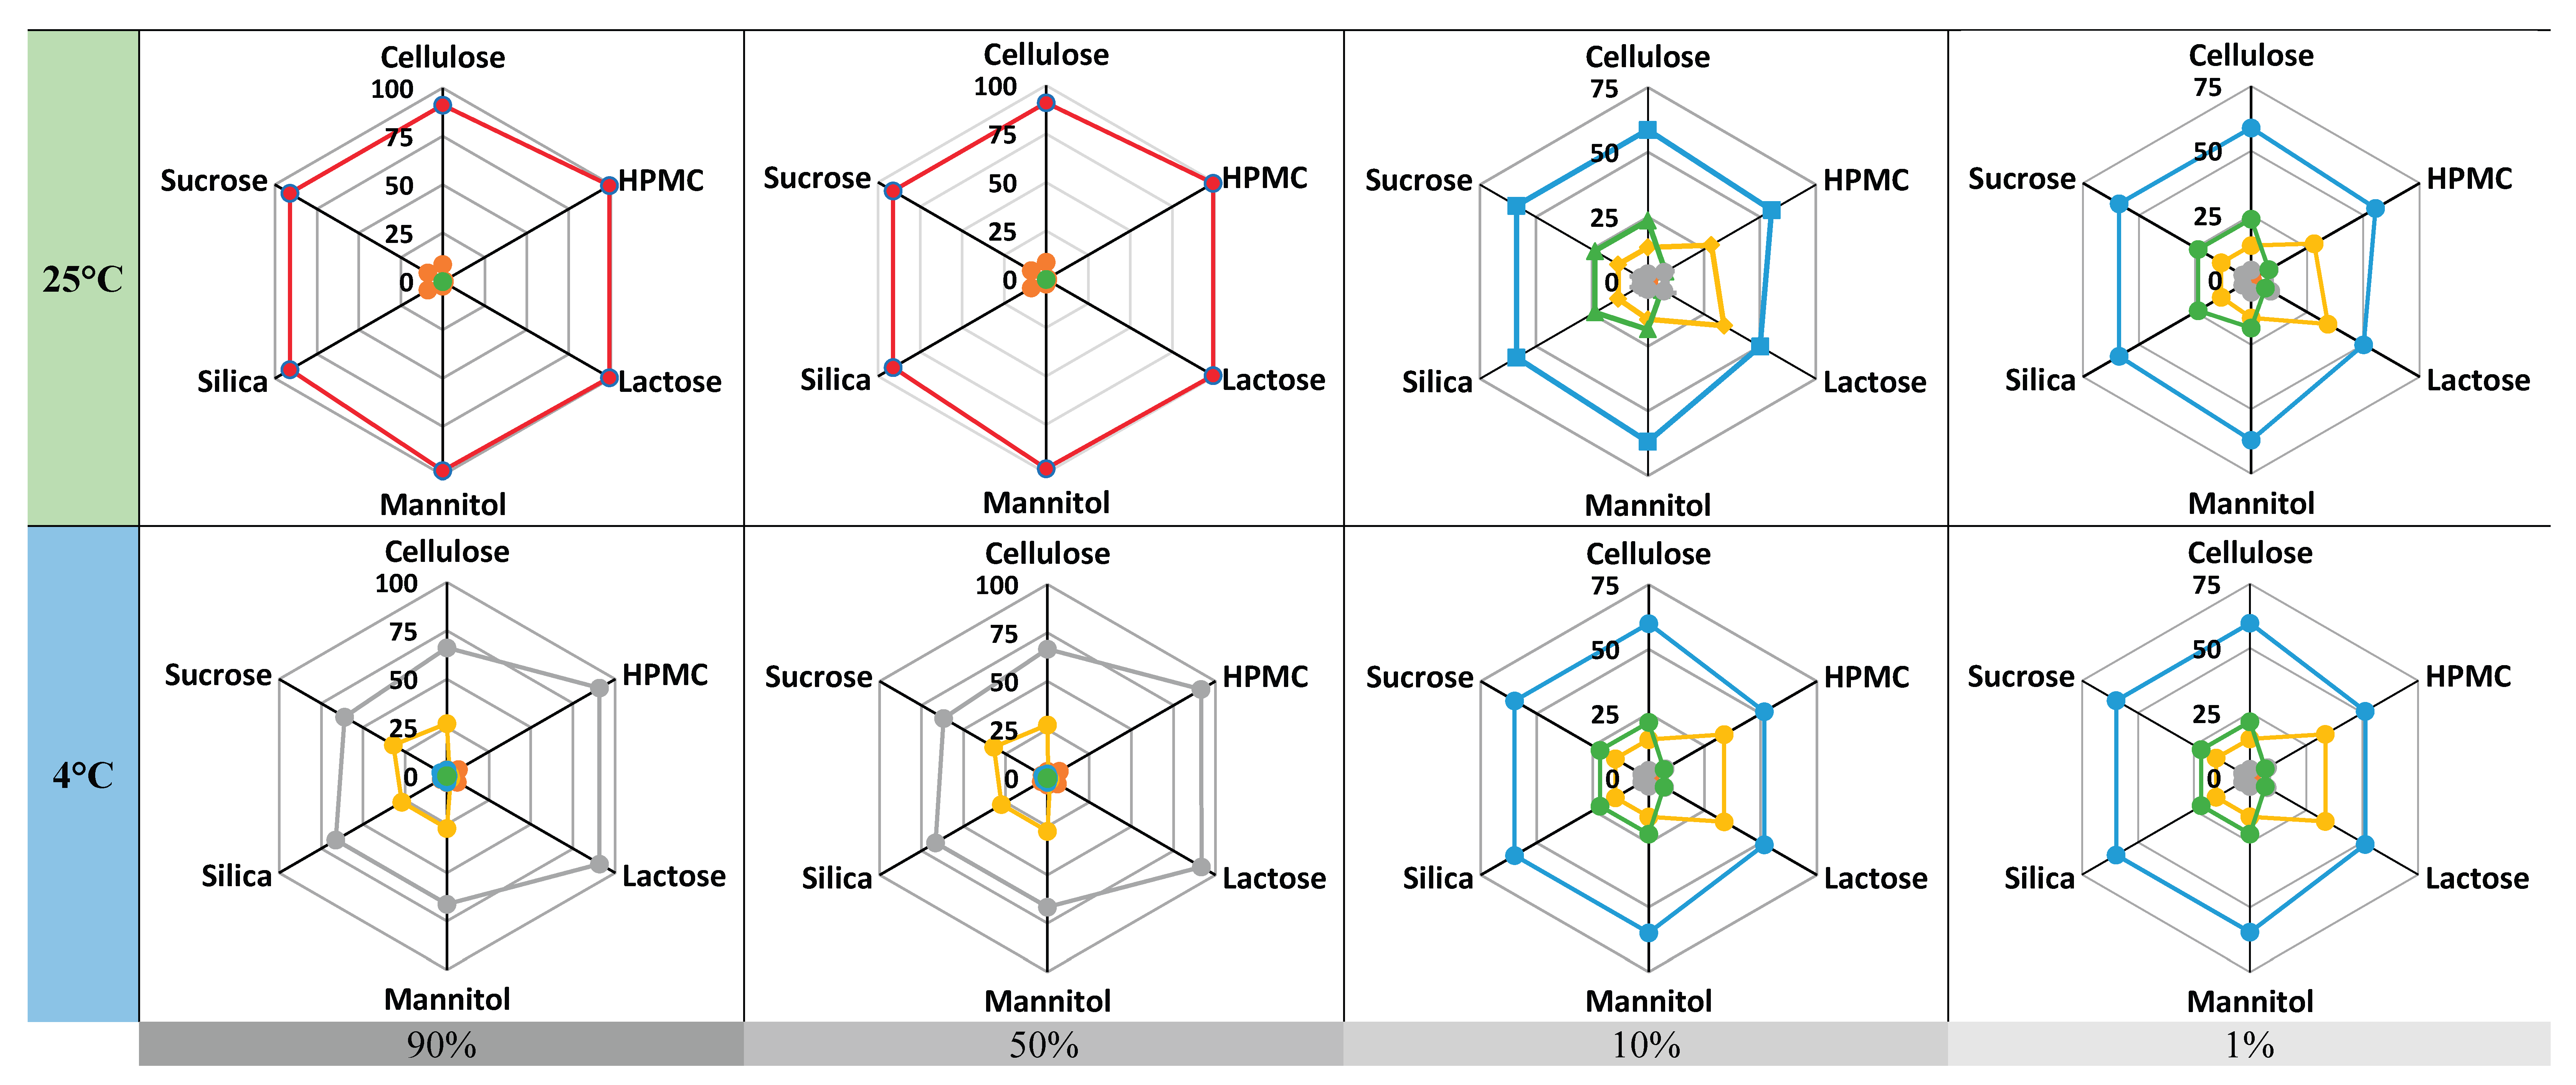

Table 1.
Dataset of (i) molecular descriptors (ChEMBL, PubChem, Drugbank) of 22 API, and (ii) 53 stability data of compounded oral preparation extracted from Stabilis and FRIPHARM data. BUD: Beyond-use date. Cond.: conditioning; G: Glass; Pl.: plastic; P: paper. ND: not documented. T: temperature; MW: molecular weight (g/mol), RB: rotatable bonds, PS: polar surface (Ų), HBD: hydrogen bond donor count, HBA: hydrogen bond acceptor count, AR: aromatic rings, MC: molecule class, MSC: molecular structure class.
Table 1.
Dataset of (i) molecular descriptors (ChEMBL, PubChem, Drugbank) of 22 API, and (ii) 53 stability data of compounded oral preparation extracted from Stabilis and FRIPHARM data. BUD: Beyond-use date. Cond.: conditioning; G: Glass; Pl.: plastic; P: paper. ND: not documented. T: temperature; MW: molecular weight (g/mol), RB: rotatable bonds, PS: polar surface (Ų), HBD: hydrogen bond donor count, HBA: hydrogen bond acceptor count, AR: aromatic rings, MC: molecule class, MSC: molecular structure class.
| API | MW | LogP | RB | PS | HBD | HBA | AR | MC | MSC | Excipients | Cond. | Content | T | BUD | |||||||
|---|---|---|---|---|---|---|---|---|---|---|---|---|---|---|---|---|---|---|---|---|---|
| Main | Other | (mg) | (%) | °C | (days) | ||||||||||||||||
| Acetylsalicylic acid | 180.16 | 1.24 | 2 | 63.60 | 1 | 3 | 1 | 30 | 5 | Lactose | - | ND | 4 | 4 | 25 | 365 | |||||
| 19 | 4 | 25 | 365 | ||||||||||||||||||
| 56 | 4 | 25 | 365 | ||||||||||||||||||
| 76 | 4 | 25 | 365 | ||||||||||||||||||
| Alpha-tocopherol acetate | 472.74 | 10.42 | 13 | 35.53 | 0 | 3 | 1 | 53 | 9 | Lactose | - | G | 100 | 56 | 8 | 60 | |||||
| 100 | 56 | 25 | 60 | ||||||||||||||||||
| 4-Aminopyridine | 94.12 | -0.07 | 1 | 38.91 | 1 | 2 | 1 | 24 | 4 | Lactose | Silica | Pl | 5 | 2 | 25 | 180 | |||||
| 5 | 2 | 40 | 30 | ||||||||||||||||||
| 3,4-Diaminopyridine | 109.13 | -0.9 | 0 | 64.93 | 1 | 2 | 1 | 25 | 5 | Lactose | Silica | Pl | 5 | 2 | 4 | 180 | |||||
| 5 | 2 | 25 | 180 | ||||||||||||||||||
| Amiodarone Hydrochloride | 681.78 | 7.64 | 11 | 42.68 | 1 | 4 | 3 | 52 | 9 | Cellulose | - | ND | 5 | 2 | 25 | 30 | |||||
| 20 | 10 | 25 | 30 | ||||||||||||||||||
| 50 | 25 | 25 | 30 | ||||||||||||||||||
| Mannitol | - | G | 10 | 4 | 25 | 365 | |||||||||||||||
| 60 | 25 | 25 | 365 | ||||||||||||||||||
| 100 | 50 | 25 | 365 | ||||||||||||||||||
| Amoxicillin trihydrate | 365,41 | -2.31 | 4 | 132.96 | 4 | 6 | 1 | 28 | 8 | - | - | Pl | 125 | 100 | 25 | 90 | |||||
| 250 | 100 | 25 | 56 | ||||||||||||||||||
| 250 | 100 | 40 | 56 | ||||||||||||||||||
| 500 | 100 | 25 | 90 | ||||||||||||||||||
| Atenolol | 266.34 | 0.43 | 6 | 84.58 | 2 | 5 | 1 | 30 | 7 | Cellulose | - | PI | 25 | 50 | 30 | 120 | |||||
| Captopril | 217.29 | 0.28 | 3 | 95.00 | 2 | 4 | 0 | 29 | 6 | Lactose | - | P | 2 | 2 | 25 | 84 | |||||
| Carbidopa | 244.24 | -1.21 | 4 | 115.81 | 5 | 5 | 1 | 27 | 7 | Cellulose | - | ND | 200 | 30 | 25 | 336 | |||||
| Cholecalciferol | 384.64 | 7.13 | 6 | 20.53 | 1 | 1 | 0 | 45 | 6 | Lactose | - | G | 0.025 | 0.008 | 8 | 60 | |||||
| 0.025 | 0.008 | 25 | 60 | ||||||||||||||||||
| Cholic acid | 408.57 | 2.48 | 4 | 97.99 | 3 | 5 | 0 | 37 | 7 | Silica | Lactose | Pl | 25 | 95 | 25 | 365 | |||||
| Silica | - | Pl | 250 | 97 | 25 | 365 | |||||||||||||||
| Silica | Lactose | Pl | 25 | 100 | 40 | 180 | |||||||||||||||
| Silica | - | PI | 250 | 100 | 40 | 180 | |||||||||||||||
| Clonidine hydrochloride | 266.56 | 2.49 | 1 | 36.42 | 2 | 3 | 1 | 33 | 5 | Cellulose | - | ND | 0.02 | 1 | 25 | 365 | |||||
| API | MW | LogP | RB | PS | HBD | HBA | AR | MS | MSC | Excipients | Cond. | Content | T | BUD | |||||||
| Main | Other | (mg) | (%) | °C | (days) | ||||||||||||||||
| Cyclo-phosphamide | 261.09 | 0.10 | 5 | 41.57 | 1 | 2 | 0 | 29 | 5 | Lactose | - | ND | 10 | - | 4 | 70 | |||||
| 25 | - | 4 | 70 | ||||||||||||||||||
| Erythromycin | 733.94 | 2.60 | 7 | 193.91 | 5 | 14 | 0 | 46 | 11 | Cellulose | - | ND | 20 | 46 | 25 | 365 | |||||
| Fludrocortisoneacetate | 422.49 | 1.76 | 3 | 110.90 | 2 | 6 | 0 | 37 | 7 | Lactose | - | ND | 0.01 | - | 25 | 180 | |||||
| Cellulose | - | ND | 0.01 | - | 25 | 180 | |||||||||||||||
| Sucrose | - | ND | 0.01 | - | 25 | 180 | |||||||||||||||
| Hydrocortisone | 362.47 | 1.61 | 0 | 94.00 | 3 | 5 | 1 | 35 | 6 | Lactose | - | P | 20 | 0.4 | 25 | 12 | |||||
| Melatonin | 232.28 | 1.15 | 4 | 54.12 | 2 | 4 | 2 | 31 | 6 | Lactose | HPMC | G | 3 | 0.7 | 25 | 90 | |||||
| Lactose | HPMC | G | 3 | 0.7 | 40 | 90 | |||||||||||||||
| Cellulose | - | ND | 0.5 | 0.65 | 25 | 547 | |||||||||||||||
| Cellulose | - | ND | 2 | 2.6 | 25 | 547 | |||||||||||||||
| Cellulose | - | ND | 6 | 8.4 | 25 | 547 | |||||||||||||||
| Lactose | - | P | 18 | 0.7 | 25 | 90 | |||||||||||||||
| Lactose | - | P | 18 | 0.7 | 40 | 90 | |||||||||||||||
| Lactose | - | P | 18 | 2 | -20 | 168 | |||||||||||||||
| Menadione | 172.18 | 1.89 | 0 | 34.14 | 0 | 2 | 1 | 30 | 4 | Lactose | - | G | 1 | 0.5 | 8 | 60 | |||||
| Lactose | - | G | 1 | 0.5 | 25 | 60 | |||||||||||||||
| Midazolam Hydrochloride | 362.20 | 3.97 | 1 | 30.18 | 0 | 3 | 3 | 38 | 6 | Cellulose | - | ND | 1 | 1 | 25 | 365 | |||||
| Naltrexone | 341.42 | 1.36 | 2 | 70.00 | 2 | 5 | 1 | 33 | 5 | Cellulose | - | G | 1.5 | 10 | 25 | 360 | |||||
| Nifedipine | 346.34 | 2.56 | 4 | 107.00 | 1 | 6 | 1 | 37 | 7 | Lactose | - | P | 1 | 0.2 | 6 | 365 | |||||
| Lactose | - | P | 1 | 0.2 | 22 | 365 | |||||||||||||||
| Retinyl acetate | 328.50 | 5.14 | 6 | 26.30 | 0 | 2 | 0 | 40 | 6 | Lactose | - | G | 5.5 | 1 | 8 | 60 | |||||
| Lactose | - | G | 5.5 | 1 | 25 | 60 | |||||||||||||||
Table 2.
Molecular descriptors (ChEMBL, PubChem), functional categories and properties (adapted from [36]) of excipients. MW: molecular weight (g/mol), RB: rotatable bonds, PS: polar surface (Ų), HBD: hydrogen bond donor count, HBA: hydrogen bond acceptor count, AR: aromatic rings, MC: molecule class, MSC: molecular structure class, (C): crystalline as major form; (A): amorphous as major form.
Table 2.
Molecular descriptors (ChEMBL, PubChem), functional categories and properties (adapted from [36]) of excipients. MW: molecular weight (g/mol), RB: rotatable bonds, PS: polar surface (Ų), HBD: hydrogen bond donor count, HBA: hydrogen bond acceptor count, AR: aromatic rings, MC: molecule class, MSC: molecular structure class, (C): crystalline as major form; (A): amorphous as major form.
| Excipients | Physico-chemical properties | Functional category | Shelf-life†(15°C-25°C) | ||||||||||||
|---|---|---|---|---|---|---|---|---|---|---|---|---|---|---|---|
| MW | LogP | RB | PS | HBD | HBA | AR | MC | MSC | Key functional roles | Notable properties | |||||
| Cellulose (C)a | 342.30 | -5.40 | 4 | 190.00 | 8 | 11 | 0 | 22 | 10 | Adsorbent, disintegrant, binder, diluent | Hygroscopic, used in wet/dry granulation | 4 years | |||
| HPMCb (A) | 1261.40 | -2.32 | 30 | 365.00 | 8 | 30 | 0 | 50 | 20 | Dispersing, solubilizing, stabilizing, thickening, film-coating, binder | Nonionic, used in extended-release tablets and film coatings | 3 years | |||
| Lactose (C/A) | 360.31 | -5.73 | 4 | 191.00 | 9 | 12 | 0 | 22 | 12 | Binder, filler, diluent | Exists in different crystalline forms | 3 years | |||
| Mannitol (C) | 182.17 | -3.73 | 2 | 131.38 | 6 | 6 | 0 | 21 | 9 | Diluent, plasticizer | Non-hygroscopic; suitable for moisture-sensitive APIs. | 5 years | |||
| Silicac (A) | 60.84 | -0.62 | 0 | 34.10 | 2 | 0 | 0 | 23 | 4 | Adsorbent, disintegrant, thermal stabilizer | Hygroscopic; widely used in oral formulations | 5 years | |||
| Sucrose (C) | 342.3 | -4,53 | 5 | 189.55 | 8 | 11 | 0 | 40 | 10 | Binder, filler | stable at room temperature; absorbs ~1% moisture. | 5 years | |||
†: Inresa sources; a: Cellulose microcrystalline Ph 102; b: Hypromellose 4000; c: Anhydrous colloidal silica.
Table 3.
Physicochemical properties and therapeutic classification of 3,166 APIs. Adapted from ChEMBL database.
Table 3.
Physicochemical properties and therapeutic classification of 3,166 APIs. Adapted from ChEMBL database.
| API | % |
| MW (g.mol-1) | |
| • < 250 | 20 |
| • 250 – 500 | 62 |
| • > 500 | 18 |
| Total | 100 |
| LogP | 22 |
| • < 0 | 26 |
| • 0 – 2 | 32 |
| • 2 – 4 | 20 |
| • > 4 | |
| Total | 100 |
| ATC | |
| • Nervous system | 17 |
| • Alimentary tract and metabolism | 12 |
| • Cardiovascular system | 12 |
| • Anti-infectives for systemic use | 11 |
| • Dermatologicals | 8 |
| • Antineoplastic, immunomodulating agents | 8 |
| • Respiratory system | 8 |
| • Various | 6 |
| • Sensory organs | 6 |
| • Genito urinary system | 5 |
| • Other | 7 |
| Total | 100 |
Table 4.
Comparative performance of seven KNIME models for drug stability prediction: analysis of drug content, storage conditions, packaging, and experimental data using single decision, ensemble, and boosting methods.
Table 4.
Comparative performance of seven KNIME models for drug stability prediction: analysis of drug content, storage conditions, packaging, and experimental data using single decision, ensemble, and boosting methods.
| Metrics | Single Decision Method | Ensemble Methods | Boosting Methods | ||||||
|---|---|---|---|---|---|---|---|---|---|
| Decision Trees | Random Forests | Random ForestRegression | Tree Ensembles | Tree Ensembles Regression | Gradient BoostedTrees | Gradient BoostedTrees Regression | |||
| R² | 0.93 | 0.758 | 0.536 | 0.491 | 0.975 | -0.447 | 0.849 | ||
| Mean Absolute Error (MAE) | 9 | 17.94 | 48.86 | 24.54 | 10.16 | 98.17 | 19.45 | ||
| Mean Squared Error (MSE) | 912.90 | 3160.86 | 6073.61 | 6661.17 | 358.16 | 18931.90 | 1972.69 | ||
| Root Mean Squared Error (RMSE) | 30.21 | 56.22 | 77.93 | 81.62 | 18.93 | 137.60 | 44.42 | ||
| Mean Signed Difference (MSD) | -1.17 | 8.34 | 20.20 | 24.54 | -0.13 | -76.46 | -7.15 | ||
| Mean Absolute Percentage Error (MAPE) | 0.05 | 0.23 | 0.59 | 0.44 | 0.064 | 0.50 | 0.16 | ||
Table 5.
Correlation between molecular descriptors, formulation, conditioning, storage parameters and predicted BUD of compounded APIs as obtained with Tree Ensembles Regression model. Significant correlations (p < 0.05) are highlighted in grey.
Table 5.
Correlation between molecular descriptors, formulation, conditioning, storage parameters and predicted BUD of compounded APIs as obtained with Tree Ensembles Regression model. Significant correlations (p < 0.05) are highlighted in grey.
| Parameters | Correlation value | p- value |
|---|---|---|
| Molecular descriptors | ||
| Molecule | -0,269 | 0,204 |
| Code SMILE | -0,163 | 0,447 |
| MW | 0,305 | 0,148 |
| MW class | 0,089 | 0,678 |
| LogP | 0,503 | 0,012 |
| LogP class | 0,502 | 0,012 |
| Rotatable bonds | 0,087 | 0,686 |
| Rotatable bonds class | 0,157 | 0,464 |
| Polar surface | 0,319 | 0,129 |
| Polar surface class | -0,153 | 0,476 |
| H-donor bonds | -0,183 | 0,392 |
| H donor bonds class | -0,271 | 0,201 |
| H-acceptor bonds | -0,162 | 0,449 |
| H acceptor bonds class | -0,128 | 0,550 |
| Aromatic rings | 0,357 | 0,087 |
| Aromatic rings class | 0,283 | 0,180 |
| Molecule class | 0,439 | 0,032 |
| Molecular structure class | -0,139 | 0,517 |
| Formulation descriptors | ||
| Main excipient | 0,041 | 0,849 |
| Encoded excipients | 0,300 | 0,154 |
| Content | -0,212 | 0,321 |
| Content class | -0,269 | 0,203 |
| Conditioning and storage descriptors | ||
| Packaging | -0,200 | 0,349 |
| Packaging class | 0,145 | 0,500 |
| Temperature | -0,336 | 0,109 |
| Temperature class | -0,110 | 0,608 |
| Storage class | -0,266 | 0,209 |
Table 6.
Comparative stability assessment of fifteen active pharmaceutical ingredients across three conditions: as raw materials (based on supplier data), in compounded oral preparations (predicted by Smart Formulation under standard conditions: 10% content, 25°C), and in marketed pharmaceutical products (manufacturer-reported data). For each active ingredient, the predicted BUD is presented alongside relevant formulation variables. Sources of raw material data includea: Inresa; b: Cerata Pharmaceuticals LL; c: Newstar Chem Enterprise LTD; d: Neutralpharma; e: Nicolas Green Pharmaceuticals; f: Xi’An Tian Guangyuan Biotech Co., Ltd; ‡: Vidal Hoptimal, ¥: HPMC. Smart Formulation predictions are compared to outputs from FormulationAI, which estimates physical stability in mannitol and HPMC matrices under identical storage conditions. The physical state of the active ingredient is indicated as crystalline (C) or amorphous (A) based on the predominant solid form. EXP: excipient.
Table 6.
Comparative stability assessment of fifteen active pharmaceutical ingredients across three conditions: as raw materials (based on supplier data), in compounded oral preparations (predicted by Smart Formulation under standard conditions: 10% content, 25°C), and in marketed pharmaceutical products (manufacturer-reported data). For each active ingredient, the predicted BUD is presented alongside relevant formulation variables. Sources of raw material data includea: Inresa; b: Cerata Pharmaceuticals LL; c: Newstar Chem Enterprise LTD; d: Neutralpharma; e: Nicolas Green Pharmaceuticals; f: Xi’An Tian Guangyuan Biotech Co., Ltd; ‡: Vidal Hoptimal, ¥: HPMC. Smart Formulation predictions are compared to outputs from FormulationAI, which estimates physical stability in mannitol and HPMC matrices under identical storage conditions. The physical state of the active ingredient is indicated as crystalline (C) or amorphous (A) based on the predominant solid form. EXP: excipient.
| API | Log P | Shelf-life (Raw material) |
BUD (Preparation) | Expiration date (Specialty)‡ | Film coated tablet | ||
|---|---|---|---|---|---|---|---|
| 1 EXP | 2 EXP | FormulationAI | |||||
| Acetaminophen (C) | 0.91 | 4 years; 15-25°Ca |
156 – 170 days | 156 – 171 days | 180 days | 5 EXP/5 years Claradol 500 mg | No |
| Amlodipine (besylate) (C) |
1.64 | 5 years; 15-25°Ca |
157 – 165 days | 148 – 153 days | 180 days | 3 EXP/3 years Amlodipine 10 mg | No |
| Aspirin(C) | 1.24 | 3 years; 15-25°Ca |
166 – 174 days | 163 – 173 days | 180 days | 2 EXP/3 years Aspirine du Rhône 500 mg | No |
| Atorvastatin (calcium) (A) |
5.39 | 5 years; 15-25°Cb |
136 – 149 days | 134 – 141 days | 180 days | 6 EXP/2 years Atorvastatin 80 mg | Yes |
| Clarithromycin (C) | 3.24 | 3 years; 15-25° Cc |
164 – 170 days | 155 – 158 days | 180 days | 7 EXP/3 years Clarithromycine 250 mg | Yes |
| Diazepam(C) | 3.08 | 5 years; 15-25°Ca |
155 – 168 days | 149 – 154 days | 180 days | 4 EXP/3 years Diazepam 10 mg | No |
| Fluoxetine (Chlorhydrate) (C) |
1.7 | 5 years; 15-25°Cd |
144 – 158 days | 141 – 147 days | 180 days | 3 EXP/3 years Fluoxetine 20 mg | Dispersible |
| Hydrochlorothiazide (C) | - 0.58 | 5 years; 15-25°Ca |
161 – 174 days | 161 – 174 days | 180 days | 5 EXP/3 years Esidrex 25 mg | No |
| Ibuprofen(C) | 3.84 | 5 years; 15-25°Ca |
156 – 170 days | 150 days | 180 days | 11 EXP/3 years Advil 200 mg | Yes |
| Levothyroxine (sodium) (A) |
-2.3 | 2 years; 15-25°Cf |
155 – 171 days | 150 – 160 days | 180 days | 5 EXP/3 years Thyrofix 100 µg | No |
| Losartan (potassium) (C) |
4.06 | 5 years; 15-25°Cb |
154 – 165 days | 151 – 156 days | 180 days | 7 EXP/3 years Losartan 50 mg | Yes |
| Metformin (hydrochloride) (C) |
-0.92 | 5 years; 15-25°Ce |
164 – 177 days | 164 – 177 days | 180 days | 4 EXP/5 years Glucophage 500 mg | No |
| Omeprazole (C) | 2.43 | 2 years; 15-25°Ca |
157 – 171 days | 150 – 160 days | 180 days | 8 EXP/3 years Omeprazole 10 mg | Enteric film |
| Prednisolone (C) | 1.27 | 3 years; 15-25°Ca |
156 – 171 days | 148 – 157 days | 180 days | 4 EXP/3 years Prednisolone 20 mg | No |
| Simvastatin (A) | 3 years; 15-25°Ca | 151 – 163 days | 149 – 155 days | 180 days /Instable¥ |
11 EXP/2 years Simvastatine 40 mg | Yes | |
Table 7.
Stability comparison of 27 APIs across three conditions: as raw materials (based on supplier data), in compounded preparations (predicted using the Smart Formulation model under standard conditions: 10% at 25°C, or as reported in the Magistral Therapeutic Formulary), and in commercial pharmaceutical specialties (according to manufacturer data). For each active ingredient, the predicted or reported BUD is presented alongside relevant formulation parameters. Sources of raw material data includea: Inresa; b: Metrix Food And Pharma c: Pharmacompass (www.pharmacompass.com); d: Samex Overseas; e: Yihuipharm; f: Saliuspharma ‡: Vidal Hoptimal, ¥: HPMC. Magistral Therapeutic Formulary (MTF). Diluent A: Lactose/silica; diluent B: Mannitol/silica. Hard capsule volume: # 000: 1,36 ml; #00: 0,95 ml; #0: 0,67 ml; #1: 0,48 ml; #2: 0,37 ml; #3: 0,27 ml. NA: non-available. EXP: excipient.
Table 7.
Stability comparison of 27 APIs across three conditions: as raw materials (based on supplier data), in compounded preparations (predicted using the Smart Formulation model under standard conditions: 10% at 25°C, or as reported in the Magistral Therapeutic Formulary), and in commercial pharmaceutical specialties (according to manufacturer data). For each active ingredient, the predicted or reported BUD is presented alongside relevant formulation parameters. Sources of raw material data includea: Inresa; b: Metrix Food And Pharma c: Pharmacompass (www.pharmacompass.com); d: Samex Overseas; e: Yihuipharm; f: Saliuspharma ‡: Vidal Hoptimal, ¥: HPMC. Magistral Therapeutic Formulary (MTF). Diluent A: Lactose/silica; diluent B: Mannitol/silica. Hard capsule volume: # 000: 1,36 ml; #00: 0,95 ml; #0: 0,67 ml; #1: 0,48 ml; #2: 0,37 ml; #3: 0,27 ml. NA: non-available. EXP: excipient.
| API (API content %) |
Shelf-life (Raw material) | BUD (Preparation) | Expiration date (Specialty)‡ | |||||
|---|---|---|---|---|---|---|---|---|
| 1 EXP | 2 EXP | MTF | ||||||
| Acetazolamide 250 mg (> 50%) |
3-4 years; 15-25°Cb |
Lactose G:165 Pl:167 P:162 days |
Lactose/silica G:173 Pl:175 P:170 days |
60 days Lactose/silica Hard capsules n° 2 | 4 EXP/3 years Diamox 250 mg |
|||
| Cetirizine dichlorhydrate 10 mg (< 50%) |
5 years; 15-25°Ca | Lactose G:148 Pl:148 P:145 days |
Lactose/silica G:162 Pl:163 P:159 days |
60 days Lactose/silica Hard capsules n° 3 | 5 EXP/4 years Cetirizine 10 mg |
|||
| Chenodesoxycholic acid 250 mg (< 50%) (> 50%) |
NA | Mannitol G:170 Pl:171 P:166 days Mannitol G:160 Pl:161 P:157 days |
Mannitol/silica G:154 Pl:155 P:150 days Mannitol/silica G:146 Pl:147 P:143 days |
180 days Mannitol/silica | NA | |||
| Cholecalciferol 100.000 U.I/g 4,0 mg (< 50%) |
NA | Lactose G:109 Pl:110 P:110 days |
- | 60 days Lactose | NA | |||
| Clindamycine 150, 300 mg Clindamycine phosphate 163.5, 327 mg (< 50%) |
2 years; 15-25°Cc |
Lactose G:164 Pl:166 P:162 days Mannitol G:171 Pl:174 P:169 days |
Lactose/silica G:170 Pl:172 P:168 days Mannitol/silica G:163 Pl:166 P:161 days |
60 days Lactose/silica Hard capsules n° 0 60 days Mannitol/silica Hard capsules n° 0 |
4 EXP/3 years Clindamycine 150, 300 mg |
|||
| Diosmine 500 mg (< 50%) |
NA | Lactose G:142 Pl:145 P:144 days |
Lactose/silica G:154 Pl:157 P:155 days |
60 days Lactose/silica Hard capsules n° 000 | 7 EXP/3 years Diosmine 600 mg |
|||
| Domperidone 10 mg (< 50%) |
NA | Lactose G:162 Pl:164 P:159 days |
Lactose/silica G:172 Pl:174 P:169 days |
60 days Lactose/silica Hard capsules n° 3 | 10 EXP/3 years Domperidone Arrow 10 mg |
|||
| Doxycycline 50, 100 mg Doxycycline hyclate 58, 116 mg (< 50%) |
3 years; 15-25°Cc |
Lactose G:167 Pl:170 P:165 days Mannitol G:175 Pl:178 P:173 days |
Lactose/silica G:175 Pl:178 P:173 days Mannitol/silica G:167 Pl:170 P:165 days |
60 days Lactose/silica Hard capsules n° 1 60 days Mannitol/silica Hard capsules n° 1 |
10 EXP / 3 years Doxy 50 mg, 100 mg |
|||
| Folic acid 0.4, 4 mg (< 50%) | NA | Mannitol G:173 Pl:176 P:171 days |
Mannitol/silica G:165 Pl:168 P:163 days |
60 days Mannitol/silica | 5 EXP/30 months 0.4 mg 5 EXP/2 years 5 mg |
|||
| Fludrocortisone acetate 0.025, 0.050, 0.1 mg (< 50%) |
NA | Mannitol G:175 Pl:177 P:173 days |
Mannitol/silica G:170 Pl:173 P:168 days |
60 days Mannitol/silica Hard capsules n° 2 |
3 EXP/ 3 years Flucortac 50 µg 6 EXP/ 2 years Flucortac 0.1 mg |
|||
| Furosemide 1 mg à 10 mg (< 50%) |
NA | Lactose G:152 Pl:154 P:149 days |
Lactose/silica G:165 Pl:167 P:161 days |
60 days Lactose/silica | 4 EXP/3 years Furosemide 20 mg |
|||
| Hydrocortisone 10, 20 mg (< 50%) |
2-5 years; 15-25°Cd |
Mannitol G:140 Pl:141 P:136 days |
Mannitol/silica G:126 Pl:127 P:122 days |
60 days Mannitol/silica Hard capsules n° 2 |
4 EXP/3 years Hydrocortisone 10 mg |
|||
| Loperamide chlorhydrate 2 mg (< 50%) |
2 years; 2-8°Ce | Lactose G:147 Pl:148 P:144 days |
Lactose/silica G:160 Pl:160 P:156 days |
60 days Lactose/silica Hard capsules n° 3 | 3 EXP/ 3 years Diaretyl 2 mg | |||
| Mebeverine chlorhydrate 135 mg (< 50%) |
NA | Lactose G:159 Pl:160 P:157 days |
Lactose/silica G:167 Pl:169 P:167 days |
60 days Lactose/silica Hard capsules n° 0 |
4 EXP/ 3 years Mebeverine 100 mg |
|||
| Menadione sodium bisulfite 1 mg (< 50%) |
NA | Mannitol G:105 Pl:106 P:104 days |
Mannitol/silica G:89 Pl:90 P:87 days |
60 days Mannitol/silica | NA | |||
| Minocycline chlorhydrate dihydrate 58, 116 mg (< 50%) | NA | Mannitol G:173 Pl:174 P:169 days |
Mannitol/silica G:165 Pl:166 P:161 days |
60 days Mannitol/silica Hard capsules n° 1 |
1 excipient/ 2 years Minocyne 100 mg |
|||
| Primaquine phosphate 30 mg (< 50%) |
NA | Mannitol G:160 Pl:162 P:159 days |
Mannitol/silica G:147 Pl:148 P:145 days |
180 days Mannitol/silica | 10 EXP/ 3 years Primaquine 15 mg |
|||
| Pyridoxal phosphate 10 mg (< 50%) |
5 years; 15-25°Ca | Mannitol G:161 Pl:164 P:161 days |
Mannitol/silica G:149 Pl:152 P:149 days |
180 days Mannitol/silica | NA | |||
| Ranitidine 150mg Ranitidine chlorhydrate 167.5 mg (< 50%) |
36 months ;15-25°Cf | Lactose G:155 Pl:158 P:153 days |
Lactose/silica G:167 Pl:169 P:164 days |
60 days Lactose/silica Hard capsules n° 00 | 8 EXP/ 3 years Ranitine EG 150 mg |
|||
| Retinol acetate 325.000 U.I/g 12,3 mg (< 50%) |
2 years; 15-25°C [43] | Lactose G:154 Pl:156 P:150 days |
- | 60 days Lactose | NA | |||
| Riboflavine 400 mg (< 50%) (> 50%) |
4 years; 15-25°Ca | Lactose G:165 Pl:166 P:161 days Lactose G:153 Pl:155 P:150 days |
Lactose/silica G:174 Pl:175 P:170 days Lactose/silica G:164 Pl:165 P:160 days |
60 days Lactose/silica | NA | |||
| Scopolamine butylbromure 10 mg (< 50%) |
NA | Lactose G:149 Pl:152 P:149 days |
Lactose/silica G:164 Pl:166 P:163 days |
60 days Lactose/silica | NA | |||
| Simvastatin 5, 20, 40 mg (< 50%) |
3 years; 15-25°Ca | Lactose G:157 Pl:157 P:153 days |
Lactose/silica G:167 Pl:167 P:164 days |
60 days Lactose/silica Hard capsules n° 2 | 11 EXP / 2 years Simvastatine Accord 10, 20,40 mg |
|||
| Spironolactone 25 mg (< 50%) |
5 years; 15-25°Ca | Lactose G:162 Pl:164 P:159 days |
Lactose/silica G:172 Pl:174 P:169 days |
60 days Lactose/silica | 5 EXP/ 18 months Aldactone 25 mg |
|||
| Sulpiride 50 mg (< 50%) |
NA | Lactose G:138 Pl:138 P:138 days |
Lactose/silica G:149 Pl:150 P:150 days |
60 days Lactose/silica | 4 EXP/ 2 years Dogmatil 50 mg |
|||
| Triamcinolone 4 mg (< 50%) |
NA | Mannitol G:158 Pl:158 P:156 days |
Mannitol/silica G:149 Pl:149 P:147 days |
60 days Mannitol/silica Hard capsules n° 2 |
NA | |||
| Trimethoprime 50 mg (< 50%) |
NA | Lactose G:163 Pl:165 P:160 days Mannitol G:172 Pl:174 P:169 days |
Lactose/silica G:172 Pl:174 P:169 days Mannitol/silica G:163 Pl:165 P:160 days |
60 days Lactose/silica Hard capsules n° 3 60 days Mannitol/silica Hard capsules n° 3 |
5 EXP/ 3 years Delprim 300 mg |
|||
| Trimethoprime 300 mg (> 50%) |
Lactose G:153 Pl:155 P:151 days Mannitol G:163 Pl:166 P:161 days |
Lactose/silica G:163 Pl:166 P:161 days Mannitol/silica G:153 Pl:155 P:151 days |
60 days Lactose/silica Hard capsules n° 1 60 days Mannitol/silica Hard capsules n° 1 |
|||||
Disclaimer/Publisher’s Note: The statements, opinions and data contained in all publications are solely those of the individual author(s) and contributor(s) and not of MDPI and/or the editor(s). MDPI and/or the editor(s) disclaim responsibility for any injury to people or property resulting from any ideas, methods, instructions or products referred to in the content. |
© 2025 by the authors. Licensee MDPI, Basel, Switzerland. This article is an open access article distributed under the terms and conditions of the Creative Commons Attribution (CC BY) license (http://creativecommons.org/licenses/by/4.0/).
Copyright: This open access article is published under a Creative Commons CC BY 4.0 license, which permit the free download, distribution, and reuse, provided that the author and preprint are cited in any reuse.