

Submitted:
24 June 2025
Posted:
24 June 2025
You are already at the latest version
Abstract
Background/Objectives: Pelvic floor disorders affect up to 30% of adult females in the United States. Misdiagnosis occurs in nearly 45% to 90% of cases. Standardized pelvic anatomical measurements could improve diagnostic accuracy and treatment planning. We aimed to evaluate pelvic anatomical variations using magnetic resonance imaging (MRI).Methods: We analyzed MRI pelvic measurements from 250 women aged 20-90 years. Exclusion criteria included prior pelvic surgery (except hysterectomy), pelvic cancer, and use of alternative imaging modalities. Key measurements included anterior vaginal wall thickness (AVWT), bladder wall thickness (BWT), vaginal epithelium to bladder urothelium (VWBU), urethral length (UL), and inter-ureteral distances.
Results: AVWT correlated positively with VWBU (rs = 0.542, p < 0.001) and UL (rs = 0.168, p = 0.036). Decreasing VWBU was associated with reduced BWT (rs = 0.233, p = 0.001). Women with incontinence exhibited significantly thinner BWT (2.3 ± 0.6 mm) compared to those without (3.2 ± 0.9 mm, p = 0.041). AVWT declined with age (p < 0.001), and UL to the distal urethral sphincter was shortest among Caucasian women (p = 0.016). The tissue thickness between vaginal epithelium and bladder urothelium was 9.7 mm. AVWT was greater in those < 45 years of age (4.3 mm ± 1.5) compared to those >65 years (3.5 mm ± 1.4). Conclusions: MRI-derived BWT measurements may serve as a noninvasive marker for incontinence, while AVWT and VWBU may offer insights into pelvic support. Further multicenter studies are needed to standardize imaging parameters and validate predictive anatomical markers.
Keywords:
pelvic floor dysfunction
; MRI anatomy
1. Introduction
Pelvic floor disorders (PFDs) affect a significant number of women throughout the world, causing varying degrees of impairment and interfering with their overall quality of life. Some of the most common PFDs include urinary incontinence (UI), stress urinary incontinence (SUI), overactive bladder syndrome (OAB), pelvic organ prolapse (POP), and anal incontinence (AI), representing a significant health issue that affects 25 to 30 % of adult females[1]. The lifetime prevalence risk for women over the age of 50 is estimated to increase by 46% by 2050 [1,2,3]. It also contributes significantly to healthcare expenditures in the United States, costing an estimated $300 million between 2005 and 2006. National Institute of Child Health and Human Development (NICHD) has projected a significant increase in the number of women undergoing surgery to correct PFDs, to rise by 47% from about 210,000 in 2010 to 310,000 by 2050 [4].
The need for more detailed anatomy grows with interest in designing and using new modalities for treatments targeting bladder innervation. Clinical examinations, signs, and symptoms alone are insufficient to diagnose pelvic floor disorders, contrary to conventional practice. This method is believed to result in under- or inaccurate diagnosis in 45 to 90% of cases leading to surgical approaches in 30% [5]. However, doctors and researchers still disagree on the best methods for imaging tests, radiologic guidelines, and differences in the pelvic organs of those with PFD [6].
Transvaginal ultrasonography is typically used to evaluate the lower genito-urinary tract. Artifacts prevent the differentiation of critical pelvic structures, such as the morphological layers of the urethra, using conventional ultrasound techniques. In addition, ultrasonography is of limited diagnostic use in assessing OAB, including BWT in cases of detrusor overactivity.However, it remains the gold standard for examining pelvic organs [7].
MRI can identify the abnormalities of different vaginal levels of support, as described by DeLancy et al [8]. A 15-minute Pelvic MRI in a female patient with POP during rest and straining can identify multi-compartment anatomical disorders and be a valuable tool for complex pre-operative planning. However, it cannot identify lower urinary tract dysfunction, requiring more invasive testing like urodynamics.
Recently, there has been more interest in targeted therapy for OAB. There is a need to define the precisely targeted area better. Most bladder nerve supply is located at the sub-trigonal area and the proximal urethra [9].
Clinical evaluations and MR usage were compared with surgical outcomes in one research. Comparable diagnosis rates were seen for disorders of the anterior and posterior compartments, 82.5% and 80%, respectively. The most significant discordance was reported in the middle compartment, where only 65 percent of MRI data matched [10]. El Sayed et al. did a thorough critical literature review of pelvic floor MRI techniques recommended by the European Society of Urogenital Radiology (ESUR) and the European Society of Gastrointestinal and Abdominal Radiology (ESGAR) [11]. Using standardized reference lines to evaluate pelvic dysfunction remains one of the most significant obstacles in imaging and accurate diagnoses, the researcher stated. Nevertheless, according to a second extensive survey, only about half of all doctors know the most recent radiology recommendations, resulting in a wide variety of clinical practices [12].
In addition to adhering to standardized imaging modalities and reference lines, it is crucial to recognize anomalies in the female pelvis that contribute to OAB and other dysfunctions. Kupec et al. discovered a substantial difference in urethral length (UL) between those with SUI and OAB and those with neither condition. Individuals with OAB had considerably longer urethral measures [13,14].In contrast, the urethral length (UL) measures of patients with pelvic dysfunction are much shorter in several other investigations. In contrast, other studies showed no changes in UL [15].
Further research has confirmed the relationship between UL and incontinence. Anatomical UL is associated with urodynamic parameters associated with SUI and is correlated with functional UL, the length of the continence zone, the length of the continence zone/functional UL ratio, the Valsalva and cough leak point pressures, and maximal urethral closure pressure [16]. This suggests that patients with short UL are more likely to develop stress incontinence, which is related to overall UL.
Vaginal wall thickness (VWT) and prolapse could diagnose an OAB or assess the risk of developing this disorder. It is essential to recognize that our knowledge of the link between VWT and POP/OAB is incomplete, and other factors like muscle tone and neurological function could play a role.
Certain anatomical variations, such as UL and VWT, have been associated with conditions frequently seen in the OAB population, such as urinary incontinence and prolapse of pelvic organs. MRI may offer more accurate and standardized approaches to pelvic floor disorders.
2. Materials and Methods
Following institutional review board (IRB) approval, we retrospectively reviewed 250 de-identified medical records and imaging reports of women who visited a single medical center and subsequently underwent a magnetic resonance imaging (MRI) evaluation of their pelvis. Records were excluded if the patient was male, under the age of 18, had a history of pelvic surgery other than hysterectomy, had a history of cancer in their pelvic region, or had pelvic measurements achieved using any other imaging modality other than MRI.
The pelvic organ measurements were recorded by radiology technicians and read by board-certified radiologists. Data recorded included anterior vaginal wall thickness, vaginal epithelium to bladder urothelium, BWT, urethral length to distal end of external urinary sphincter, urethral length, inter-ureteral mounds, inter-ureteral mounds to neck, and urethral width, expressed in millimeters (mm). Patient demographic information was collected, including age, race, and body mass index (BMI). Diagnoses pertaining to the reproductive organs and urinary tract were noted, including hysterectomy, prolapse of any pelvic organs, general incontinence, stress incontinence, urge incontinence, and mixed incontinence.
T-tests and ANOVA were used to compare the means of continuous variables against nominal variables. Correlation analyses were used to analyze the relationships between continuous variables. Data normality was assessed, and assumptions were satisfied. List-wise deletion was used for missing variables in the analysis. Cases that had measurements outside of the acceptable range of values were excluded from the analysis as potential outliers (Supplementary Table S1). All analyses were calculated with a 95 percent confidence interval and considered statistically significant with a p-value < .05.
3. Results
There was a total of 250 women included ranging from 20 to 90 years of age (49.1 ± 15.5). Most of the participants were White (47.6%), followed by Asian (19.2%), Hispanic (17.2%), “other” race (6.8%), Black (4.8%), “unknown” race (4.0%), and Native Hawaiian or Pacific Islander (0.4%). The largest proportion had a BMI of 18.5 to 24.9 (39.5%), followed by a BMI of 25.0 to 29.9 (32.3%), a BMI of 30 or more (23.4%), and a BMI of under 18.5 (4.8%). Exactly 20.4% of the patients had a history of hysterectomy, 32% had fibroids, and 4.4% had prolapse of a pelvic organ. Incontinence of any type was seen in 4.8%, urge incontinence in 2.4%, stress incontinence in 1.2%, and mixed incontinence in 0.4%.
3.1. Pelvic Morphology
There was a significant, strong positive correlation between AVWT and vaginal wall to bladder urothelium measurements, rs(211) = .542, p < .001. Vaginal wall to bladder urothelium measurements had a weak, positive correlation with BWT, rs(194) = .233, p = .001. There was also a weak to moderate, positive correlation between inter-ureteral mounds and inter-ureteral mounds to neck measurements, rs(106) = .352, p < .001. There was a positive correlation between AVWT and urethral length, but the strength was negligible, rs(155) = .168, p = .036 (Table 1).
3.2. Incontinence
Bladder walls were thicker for those without incontinence of any type (3.2 ± 0.9) than those with incontinence (2.3 ± 0.6), t(126) = 2.040, p = .041 (Figure 1). There were no other statistically significant differences in the pelvic morphological measurements and diagnoses. Means, standard deviations, interquartile range, and p-values of all MRI measurements by diagnosis can be found in Table 2.
3.3. Age and Race
A significant, weak negative correlation was found between AVWT and patient age, rs(219) = -.213, p < .001 (Figure 2). AVWT was greater in those < 45 years of age (4.3 ± 1.5) compared to those >65 years (3.5 ± 1.4), t(129) = 3.209, p = .005. Urethral length to sphincter was the least for White individuals (24.7 ± 1.9) followed by Asian individuals (25.2 ± 3.5), then those of ‘other’ race or ethnicity (32.1 ± 1.5), in that order, a statistically significant difference between the three different races, F(2, 9) = 6.854, p = .016. There were no significant differences in UL, urethral width, inter-ureteral mounds, or inter-ureteral mounds to neck measurements by patient age, BMI, race, hysterectomy, prolapse, incontinence, stress incontinence, urge incontinence, mixed incontinence, or fibroid diagnoses (Table 3).
4. Discussion
This study quantified a large sample of pelvic measurements within a normal range including AVWT, vaginal wall to bladder urothelium, BWT, urethral length to sphincter, UL, inter-ureteral mounds, inter-ureteral mounds to neck, and urethral width, compared measurements and sought to find relationships between those measurements and common pelvic disorders. Decreasing AVWT was associated with decreasing vaginal wall to bladder urothelium and UL measurements. Decreasing vaginal wall to bladder urothelium measurements were also associated with decreasing BWT. The strong positive correlation between AVWT and VWBU aligns with findings by Hsu et al., [A1] who demonstrated that vaginal thickness significantly contributes to pelvic support and overall continence mechanisms [17].
BWT was the only pelvic morphological measurement associated with incontinence. BWT was thinner among participants with incontinence compared to those without, aligning with studies that emphasized the diagnostic role of bladder wall abnormalities in detecting detrusor overactivity [18].
Measurements were not associated with any other pelvic disorders. AVWT, however, declined with age while UL to sphincter measurements significantly varied by race with Caucasian women having the smallest UL to sphincter measurements than other races. There were no significant differences in UL, urethral width, inter-ureteral mounds, or inter-ureteral mounds to neck measurements by patient age, BMI, race, hysterectomy, prolapse, incontinence, stress incontinence, urge incontinence, mixed incontinence, or fibroid diagnoses.
No differences in UL, VWT, or AVWT found among women with pelvic dysfunction, with and without PFDs challenges previous findings by Mothes et al., who reported shorter UL as a predictor of stress urinary incontinence [16]. However, AVWT was found to be related to vaginal wall to bladder urothelium measurements, which were associated with BWT measurements in the study population. While shorter UL and increasing VWT has been associated with SUI, this study could only confirm its association with BWT.
Additionally, even though differences in AVWT, vaginal wall to bladder, and UL to sphincter measurements varied per age and race, there were no strong differences in most measurements per demographic characteristics of the participants. This conflicts with the findings of Da Silva Lara et al., who noted age-related changes in vaginal anatomy that might predispose older women to pelvic dysfunction [19]. Racial differences observed in UL to sphincter measurements highlight an area for further investigation, particularly in understanding the genetic factors that might contribute to these disparities.
Our findings further support the integration of MRI into routine clinical practice for its non-invasive nature and ability to provide detailed anatomical information that correlates with clinical outcomes. Yet, limitations in standardizing MRI interpretation, as highlighted by El Sayed et al., remain a barrier to widespread adoption [11].
Our results further underline the need for standardized imaging protocols and reference lines in pelvic diagnostics. The discordance between the findings of this study and prior research, particularly regarding UL and AVWT, suggests that inter-observer variability and differences in imaging techniques may significantly impact outcomes. Future studies should focus on multi-center collaborations to validate these findings and explore longitudinal changes in pelvic measurements.
Moreover, this study raises important questions about the clinical thresholds for anatomical measurements that predict the progression of PFDs. Establishing such thresholds could guide early interventions and improve patient outcomes. The utility of BWT as a diagnostic marker for incontinence warrants further exploration in larger cohorts with diverse demographics.
4.1. Limitations
The retrospective nature and single-center design of this study limit its generalizability. Furthermore, this study could not confirm the differences in AVWT in menopause patients with prolapse [19]. Radiological techniques were not quantified, which could have drastically interfered with this study’s findings. Various technicians were used, which could have led to inconsistencies in measurements as well. Addressing these limitations in future research is crucial to refining diagnostic and therapeutic approaches for PFDs.
5. Conclusions
The primary aim of this research was to evaluate the precise anatomical relationships in the pelvic region and detect variations of measurements in different conditions to aid in the development of ways to improve targeted therapies. Using standardized reference lines to evaluate pelvic dysfunction in relation to pelvic morphological measurements remains a substantial obstacle to robust imaging and diagnostic practices. Despite conflicting results, this research demonstrates that BWT measurements obtained by MRI could be useful in evaluating women for incontinence issues especially due to the noninvasiveness this testing modality presents as compared to others. Due to the extensive range of imaging techniques and interpretation practices employed today, a large, multicenter study may be useful to confirm findings. Furthermore, a retrospective study where various measurements of the same women taken during different periods of time may prove to be helpful to determine if changes over time are likely to progress into pelvic dysfunction, and if so, determine the range of cutoff values in pelvic measurements leading up to confirmed diagnoses.
Supplementary Materials
The following supporting information can be downloaded at the website of this paper posted on Preprints.org.
Author Contributions
All authors have contributed, read, and agreed to the published version of the manuscript.
Funding
This research received no external funding.
Institutional Review Board Statement
The study was conducted in accordance with the Declaration of Helsinki and approved by the Institutional Review Board (or Ethics Committee) of University of California, Irvine for studies involving humans.
Informed Consent Statement
Informed consent was obtained from all subjects involved in the study.
Data Availability Statement
Data available upon request from corresponding author.
Acknowledgments
None.
Conflicts of Interest
The authors declare no conflicts of interest.
Abbreviations
The following abbreviations are used in this manuscript:
| AVWT | Anterior Vaginal Wall Thickness |
| BWT | Bladder Wall Thickness |
| VWBU | Vaginal Epithelium to Bladder Urothelium |
| UL | Urethral Length |
| MRI | Magnetic Resonance Imaging |
| PFD | Pelvic Floor Disorder |
| UI | Urinary Incontinence |
| SUI | Stress Urinary Incontinence |
| OAB | Overactive Bladder |
| POP | Pelvic Organ Prolapse |
| AI | Anal Incontinence |
| ESUR | European Society of Urogenital Radiology |
| ESGAR | European Society of Gastrointestinal and Abdominal Radiology |
| NICHD | National Institute of Child Health and Human Development |
| IRB | Institutional Review Board |
| BMI | Body Mass Index |
| SD | Standard Deviation |
| CI | Confidence Interval |
| mm | Millimeter |
References
- Hsu Y, Chen L, Delancey JOL, Ashton-Miller JA. Vaginal thickness, cross-sectional area, and perimeter in women with and those without prolapse. Obstet Gynecol. 2005;105(5 Pt 1):1012-1017. [CrossRef]
- Panayi DC, Khullar V, Fernando R, Digesu GA, Tekkis P. OC30.01: Vaginal wall thickness is related to the degree of vaginal prolapse. Ultrasound Obstet Gynecol. 2009;34(S1):58-59. [CrossRef]
- Bray R, Derpapas A, Fernando R, Khullar V, Panayi DC. Does the vaginal wall become thinner as prolapse grade increases? Int Urogynecology J. 2017;28(3):397-402. [CrossRef]
- Wu JM, Kawasaki A, Hundley AF, Dieter AA, Myers ER, Sung VW. Predicting the number of women who will undergo incontinence and prolapse surgery, 2010 to 2050. Am J Obstet Gynecol. 2011;205(3):230.e1-230.e5. [CrossRef]
- Olsen AL, Smith VJ, Bergstrom JO, Colling JC, Clark AL. Epidemiology of surgically managed pelvic organ prolapse and urinary incontinence. Obstet Gynecol. 1997;89(4):501-506. [CrossRef]
- Ghoniem GM, Shoukry MS, Yang A, Mostwin J. Imaging for urogynecology, including new modalities. Int Urogynecology J. 1992;3(3):212-221. [CrossRef]
- Rachaneni S, McCooty S, Middleton LJ, et al. Bladder ultrasonography for diagnosing detrusor overactivity: test accuracy study and economic evaluation. Health Technol Assess Winch Engl. 2016;20(7):1-150. [CrossRef]
- DeLancey JOL. What’s new in the functional anatomy of pelvic organ prolapse? Curr Opin Obstet Gynecol. 2016;28(5):420-429. [CrossRef]
- Spradling K, Khoyilar C, Abedi G, et al. Redefining the Autonomic Nerve Distribution of the Bladder Using 3-Dimensional Image Reconstruction. J Urol. 2015;194(6):1661-1667. [CrossRef]
- Zenebe CB, Chanie WF, Aregawi AB, Andargie TM, Mihret MS. The effect of women’s body mass index on pelvic organ prolapse: a systematic review and meta analysis. Reprod Health. 2021;18(1):45. [CrossRef]
- El Sayed RF, Alt CD, Maccioni F, et al. Magnetic resonance imaging of pelvic floor dysfunction - joint recommendations of the ESUR and ESGAR Pelvic Floor Working Group. Eur Radiol. 2017;27(5):2067-2085. [CrossRef]
- Talbott JMV, Yi J, Butterfield RJ, Wasson M. Five Year Prevalence of Pelvic Organ Prolapse After Vaginal Hysterectomy with Prophylactic Apical Support. J Gynecol Surg. 2021;37(2):127-131. [CrossRef]
- Kupec T, Pecks U, Gräf CM, Stickeler E, Meinhold-Heerlein I, Najjari L. Size Does Not Make the Difference: 3D/4D Transperineal Sonographic Measurements of the Female Urethra in the Assessment of Urinary Incontinence Subtypes. BioMed Res Int. 2016;2016(1):1810352. [CrossRef]
- Skorupska K, Wawrysiuk S, Bogusiewicz M, et al. Impact of Hysterectomy on Quality of Life, Urinary Incontinence, Sexual Functions and Urethral Length. J Clin Med. 2021;10(16):3608. [CrossRef]
- Fugett J, Phillips L, Tobin E, et al. Selective bladder denervation for overactive bladder (OAB) syndrome: From concept to healing outcomes using the ovine model. Neurourol Urodyn. 2018;37(7):2097-2105. [CrossRef]
- Mothes AR, Mothes HK, Kather A, et al. Inverse correlation between urethral length and continence before and after native tissue pelvic floor reconstruction. Sci Rep. 2021;11(1):22011. [CrossRef]
- Hsu Y, Summers A, Hussain HK, Guire KE, Delancey JOL. Levator plate angle in women with pelvic organ prolapse compared to women with normal support using dynamic MR imaging. Am J Obstet Gynecol. 2006;194(5):1427-1433. [CrossRef]
- Chess-Williams R, Sellers DJ. Pathophysiological Mechanisms Involved in Overactive Bladder/Detrusor Overactivity. Curr Bladder Dysfunct Rep. 2023;18(2):79-88. [CrossRef]
- da Silva Lara LA, da Silva AR, Rosa-E-Silva JC, et al. Menopause leading to increased vaginal wall thickness in women with genital prolapse: impact on sexual response. J Sex Med. 2009;6(11):3097-3110. [CrossRef]
Figure 1.
Bladder wall measurements were statistically significantly thinner for those with any form of incontinence.
Figure 1.
Bladder wall measurements were statistically significantly thinner for those with any form of incontinence.
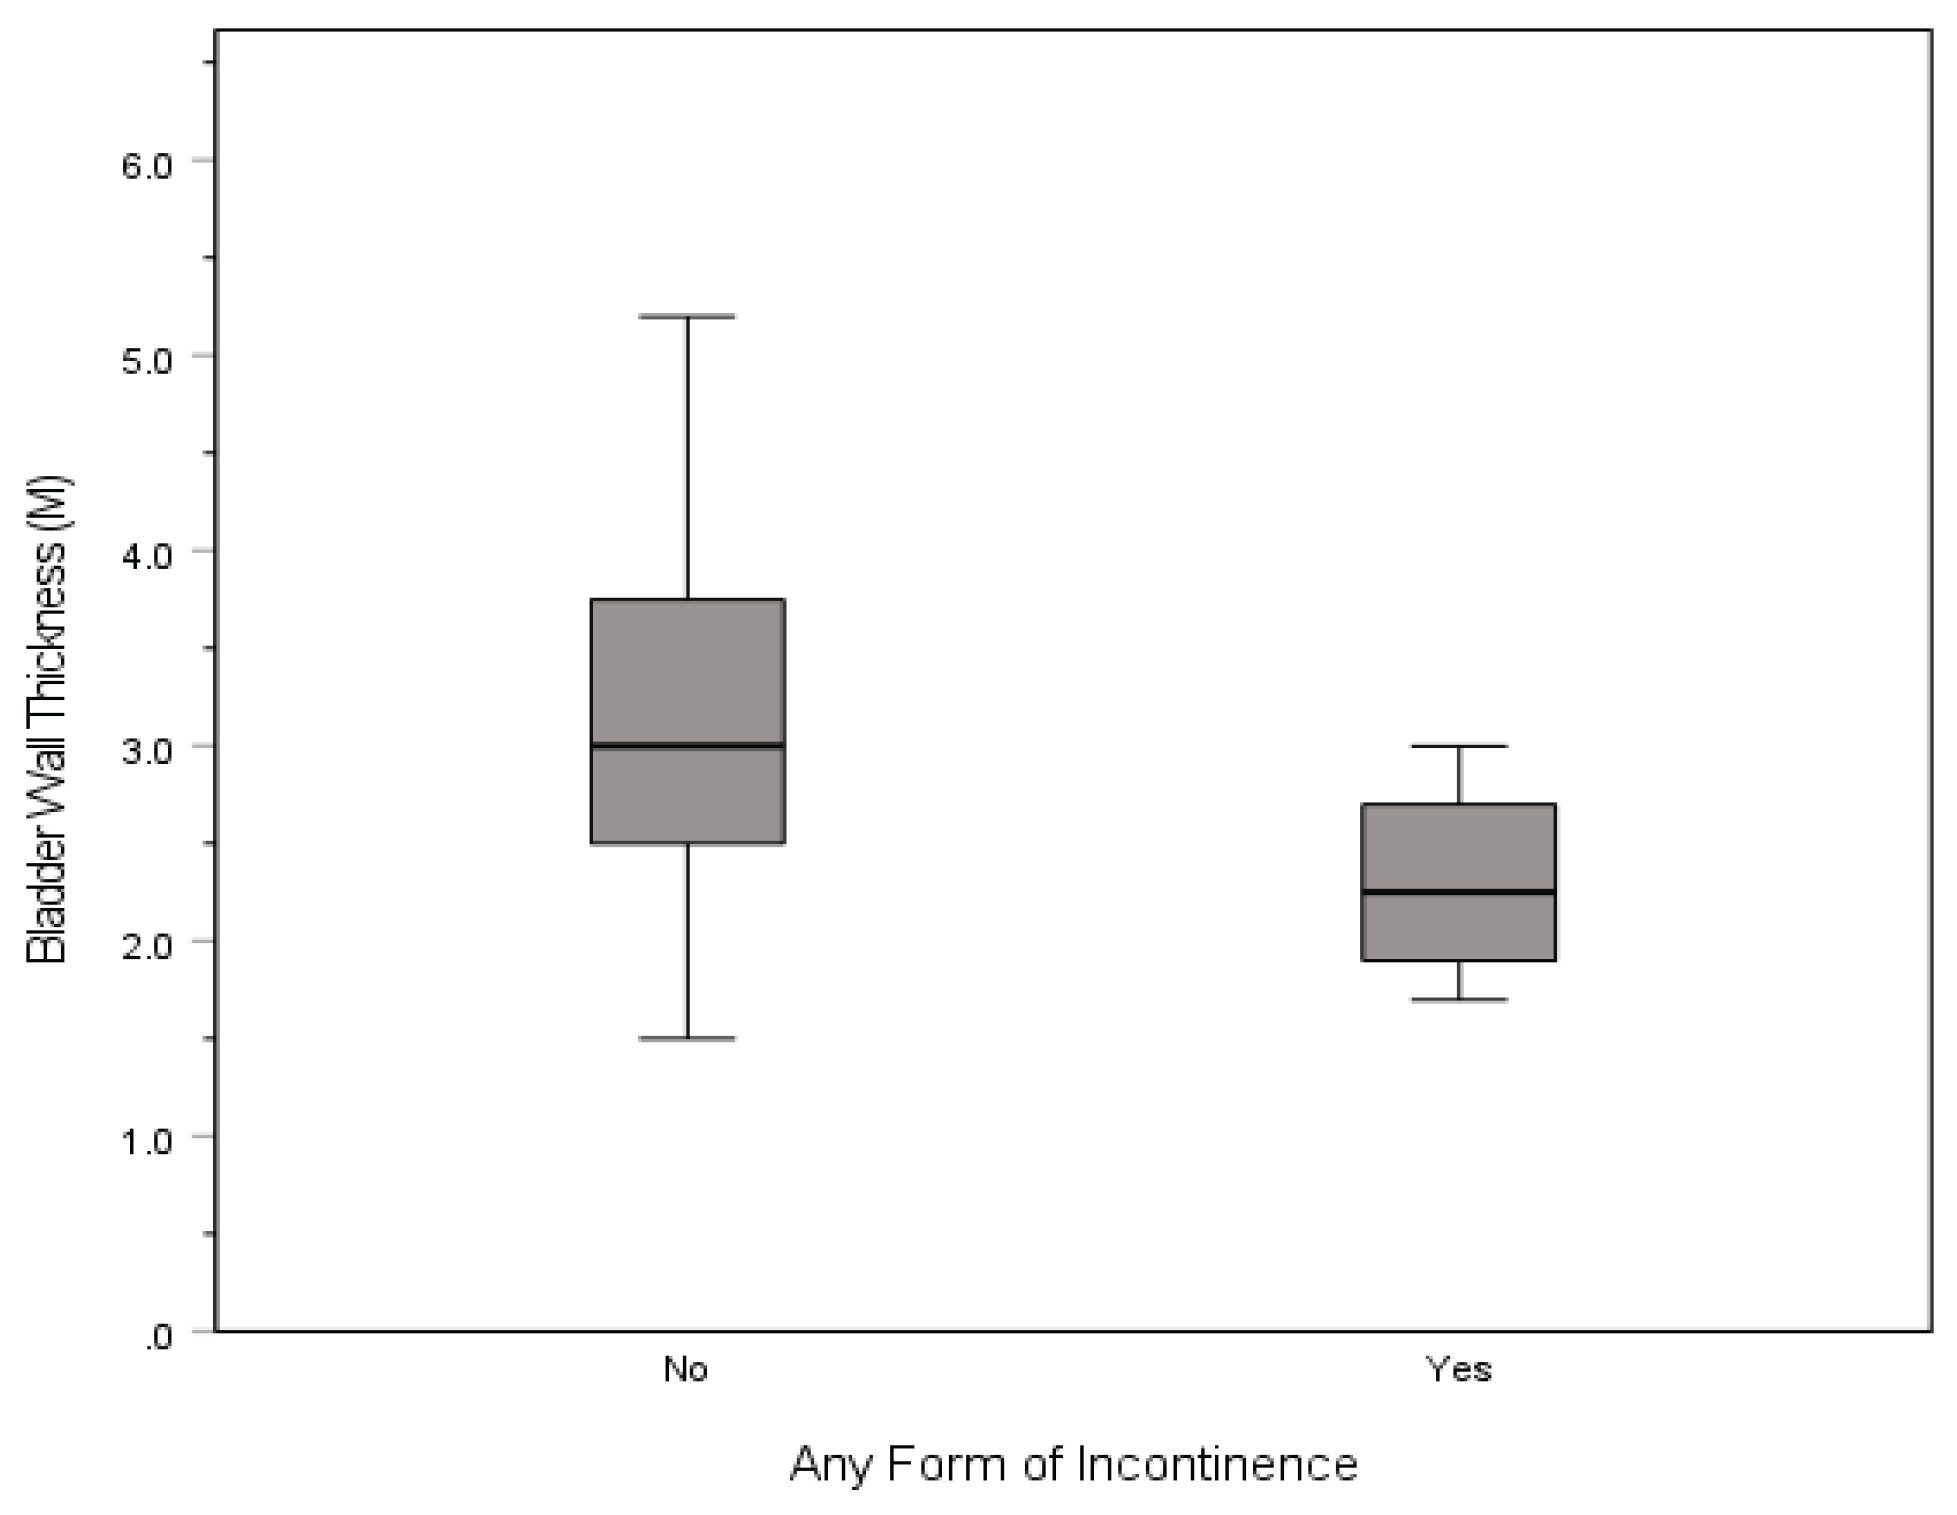
Figure 2.
AVWT measurements declined in the study population with increasing age.
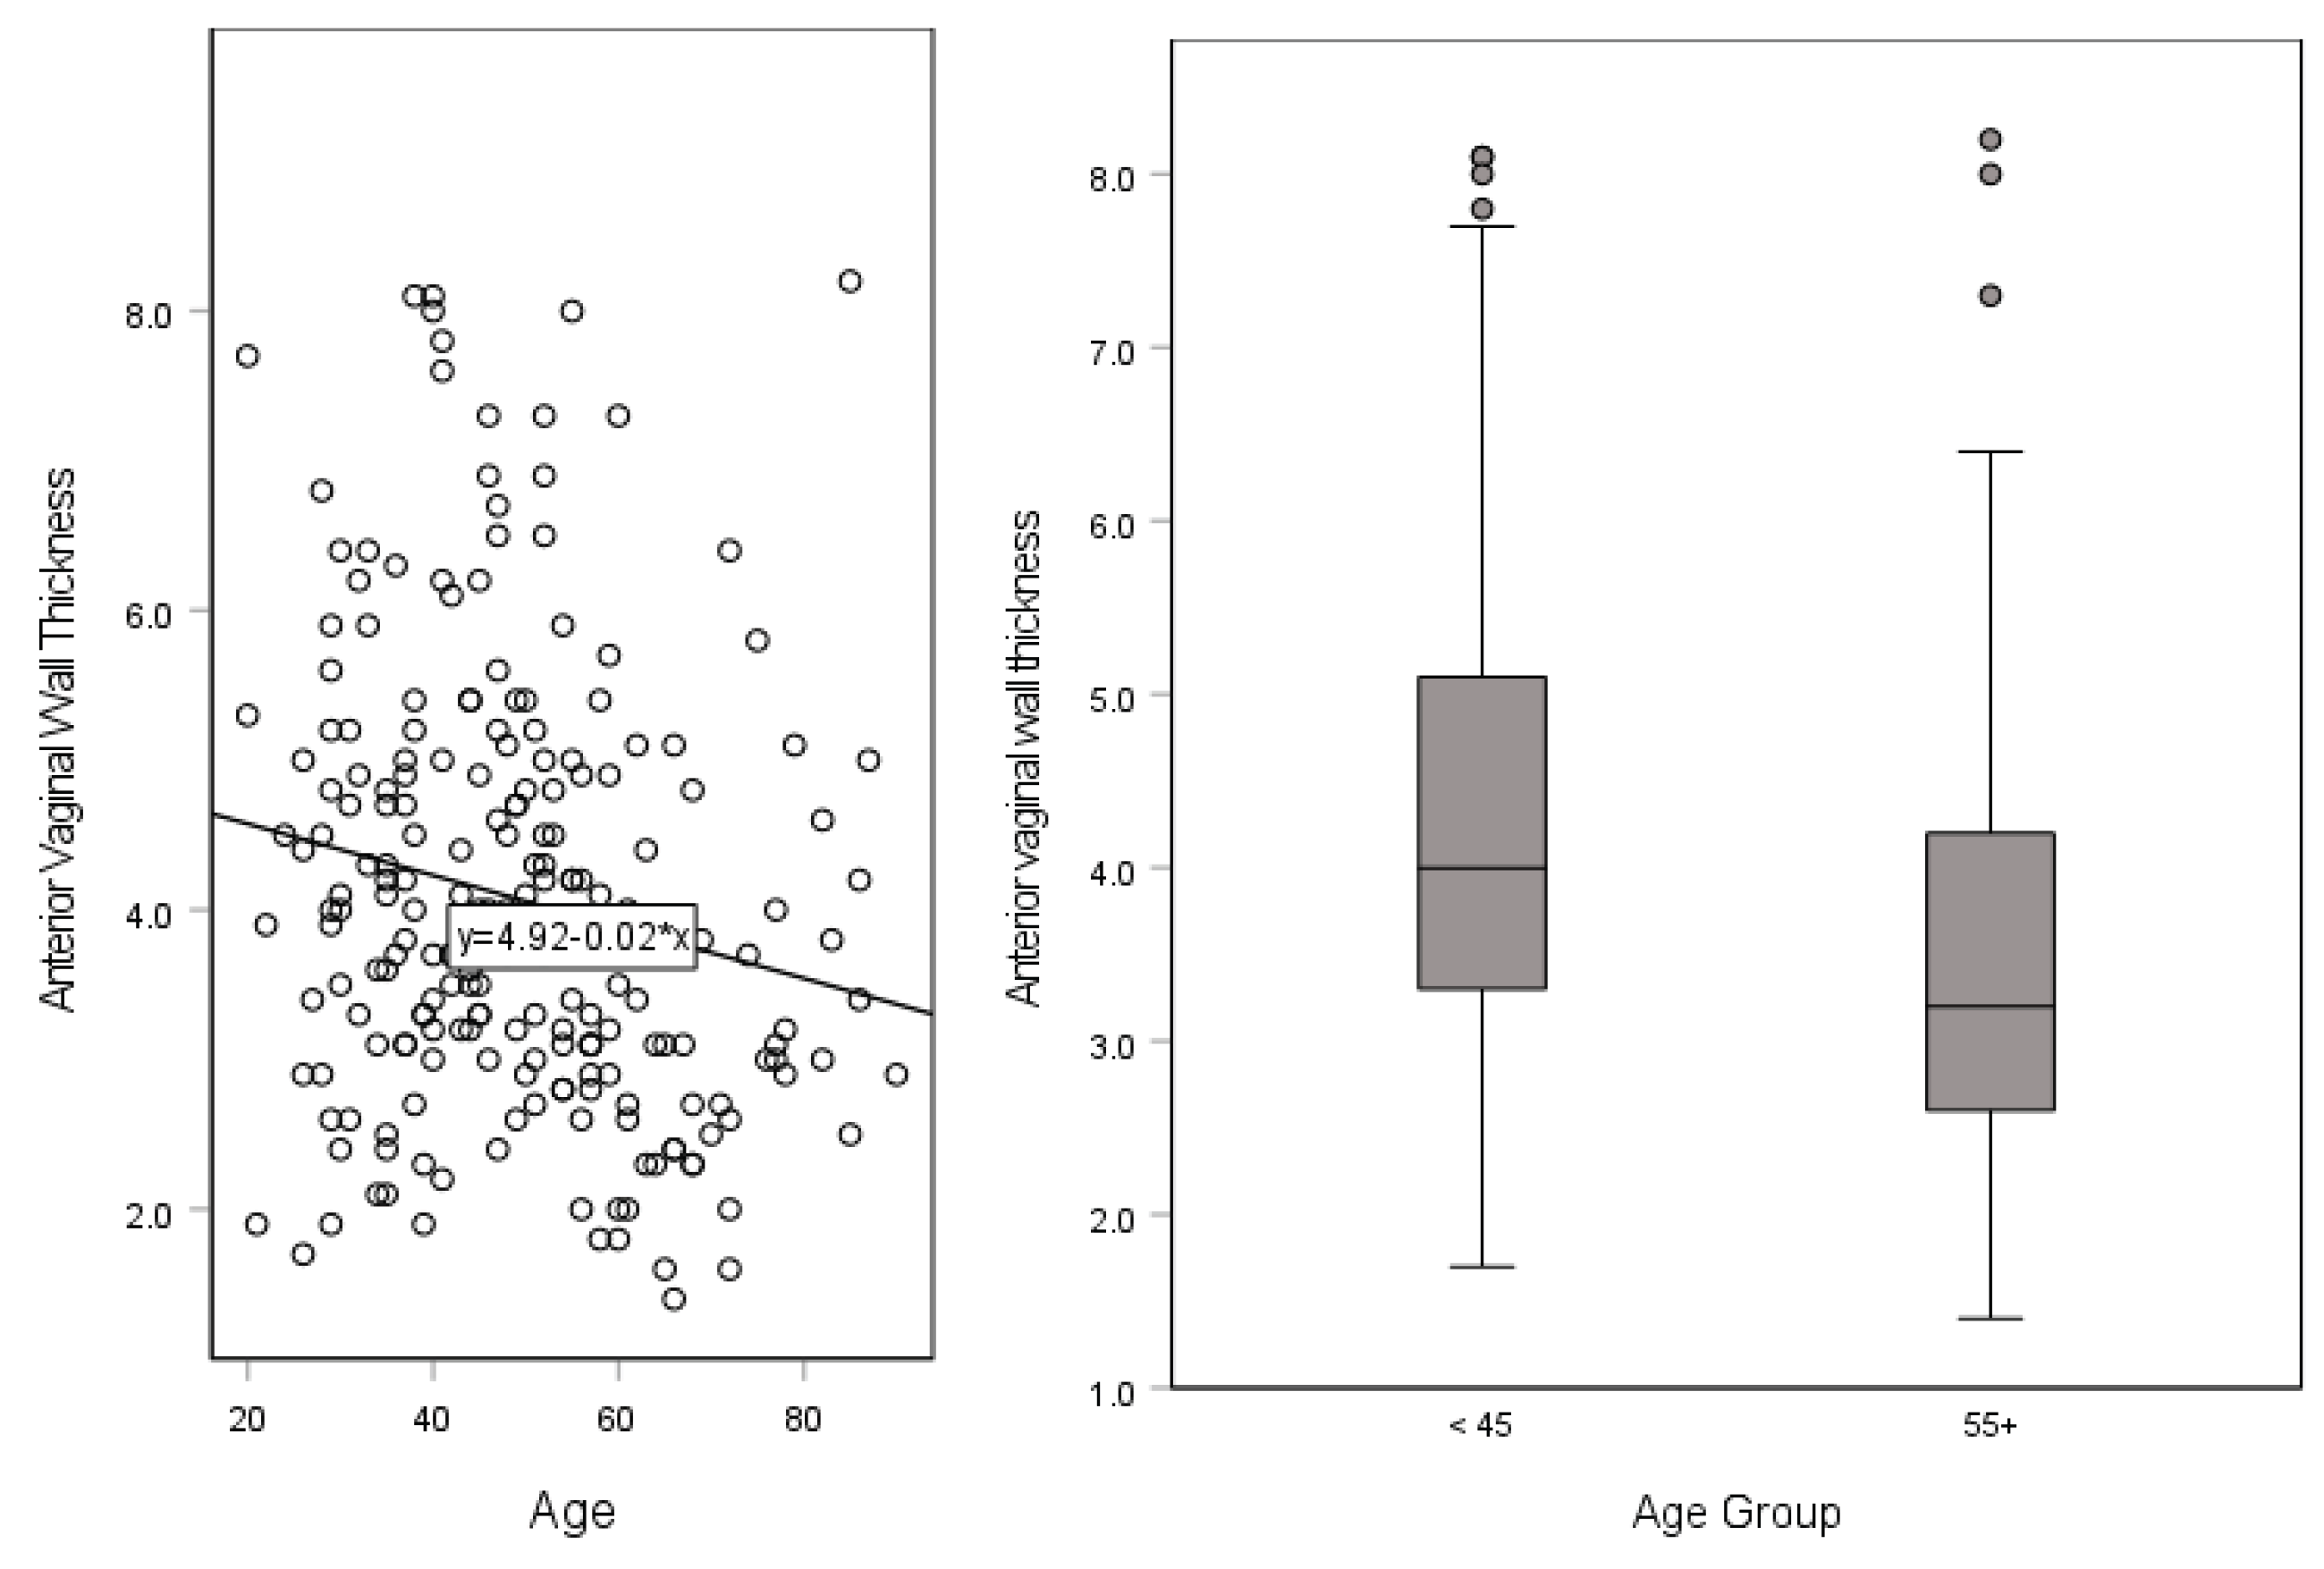

Table 1.
Spearman’s correlation table. Statistically significant, positive correlations were found between AVWT and vaginal wall to bladder urothelium; bladder wall thickness and vaginal wall to bladder urothelium; inter-ureteral mounds to neck and inter-ureteral mounds; and a negligible association between UL and AVWT.
Table 1.
Spearman’s correlation table. Statistically significant, positive correlations were found between AVWT and vaginal wall to bladder urothelium; bladder wall thickness and vaginal wall to bladder urothelium; inter-ureteral mounds to neck and inter-ureteral mounds; and a negligible association between UL and AVWT.
| 1 | 2 | 3 | 4 | 5 | 6 | |
|---|---|---|---|---|---|---|
| 1. Anterior vaginal wall thickness | ||||||
| 2. Vaginal wall to bladder urothelium | .542** | |||||
| 3. Bladder wall thickness | 0.085 | .233** | ||||
| 4. Urethral length | .168* | 0.095 | 0.088 | |||
| 5. Inter-ureteral mounds | 0.063 | -0.003 | -0.122 | -0.113 | ||
| 6. Inter-ureteral mounds to neck | 0.138 | 0.017 | -0.046 | -0.061 | .352** | |
| 7. Urethral width | 0.077 | 0.072 | 0.058 | 0.134 | -0.017 | 0.204 |
**. Correlation is significant at the 0.01 level (2-tailed). *. Correlation is significant at the 0.05 level (2-tailed).
Table 2.
Pelvic morphological measurements by diagnosis.
| Anterior vaginal wall thickness | Vaginal wall to bladder urothelium | Urethral length | Urethral width | Bladder wall thickness | Urethral length to sphincter | Inter-ureteral mounds | Inter-ureteral mounds to neck | ||
|---|---|---|---|---|---|---|---|---|---|
| Overall Cohort | M (SD) | 4.1 (1.5) | 9.7 (3.5) | 33.6 (5.0) | 9.8 (3.2) | 3.1 (0.8) | 26.1 (3.6) | 32.2 (7.1) | 14.8 (5.9) |
| N | 221 | 231 | 172 | 117 | 204 | 250 | 112 | 112 | |
| Hysterectomy | p-value | 0.527 | 0.431 | 0.356 | 0.421 | 0.499 | - | 0.206 | 0.981 |
| M (SD) | 4.0 (1.2) | 9.4 (3.2) | 34.3 (5.6) | 9.5 (2.8) | 3.0 (0.9) | 26.4 (-) | 30.8 (7.2) | 14.9 (5.9) | |
| N | 44 | 47 | 35 | 24 | 41 | 51 | 30 | 30 | |
| IQR | 1.7 | 3.3 | 8.2 | 5.0 | 1.4 | - | 11.2 | 8.6 | |
| Prolapse | p-value | 0.162 | 0.966 | 0.293 | 0.385 | 0.892 | 0.100 | 0.720 | 0.997 |
| M (SD) | 4.6 (1.1) | 9.7 (3.1) | 35.4 (5.2) | 8.1 (4.3) | 3.1 (0.8) | 23.8 (1.1) | 31.1 (6.4) | 14.9 (3.6) | |
| N | 9 | 10 | 9 | 5 | 8 | 11 | 4 | 4 | |
| IQR | 1.6 | - | 5.9 | - | - | - | - | - | |
| Incontinence, | p-value | 0.156 | 0.150 | 0.971 | 0.953 | 0.041 | - | 0.606 | 0.865 |
| any | M (SD) | 5.1 (1.6) | 11.3 (3.7) | 33.4 (6.2) | 9.6 (3.3) | 2.3 (0.5) | - | 31.0 (4.9) | 14.8 (4.3) |
| N | 9 | 11 | 11 | 7 | 4 | 12 | 5 | 5 | |
| IQR | 2.3 | 6.8 | 4.4 | 7.6 | - | - | 12.7 | - | |
| Stress | p-value | 0.333 | 0.518 | 0.711 | 0.955 | 0.847 | - | 0.271 | 0.508 |
| Incontinence | M (SD) | 5.8 (2.1) | 10.8 (2.7) | 35.1 (7.7) | 9.8 (-) | 3.0 (-) | - | 33.1 (0.4) | 12.3 (3.3) |
| N | 3 | 3 | 3 | 1 | 1 | 3 | 2 | 2 | |
| IQR | - | - | - | - | - | - | - | - | |
| Urge | p-value | 0.195 | 0.688 | 0.864 | 0.690 | 0.133 | - | 0.345 | 0.819 |
| Incontinence | M (SD) | 5.2 (1.1) | 10.4 (3.9) | 34.0 (8.7) | 10.0 (2.1) | 2.3 (0.7) | - | 28.7 (5.1) | 15.3 (6.0) |
| N | 4 | 5 | 5 | 5 | 3 | 6 | 3 | 3 | |
| IQR | 2.0 | - | - | - | - | - | - | - | |
| Fibroid | p-value | 0.329 | 0.342 | 0.788 | 0.217 | 0.450 | 0.240 | 0.297 | 0.308 |
| M (SD) | 4.2 (1.5) | 10.0 (3.4) | 33.7 (5.3) | 9.2 (3.7) | 3.0 (0.8) | 27.1 (4.3) | 33.3 (7.4) | 13.9 (5.9) | |
| N | 73 | 78 | 59 | 32 | 67 | 80 | 34 | 31 | |
| IQR | 2.1 | 4.8 | 7.7 | 4.0 | 1.0 | 8.0 | 13.5 | 10.9 |
Table 3.
Pelvic morphological measurements by patient demographic characteristics.
| Anterior vaginal wall thickness | Vaginal wall to bladder urothelium | Urethral length | Urethral width | Bladder wall thickness | Urethral length to sphincter | Inter-ureteral mounds | Inter-ureteral mounds to neck | ||
|---|---|---|---|---|---|---|---|---|---|
| Overall Cohort | M (SD) | 4.1 (1.5) | 9.7 (3.5) | 33.6 (5.0) | 9.8 (3.2) | 3.1 (0.8) | 26.1 (3.6) | 32.2 (7.1) | 14.8 (5.9) |
| N | 221 | 231 | 172 | 117 | 204 | 250 | 112 | 112 | |
| Age Group | p-value | 0.005 | 0.226 | 0.370 | 0.722 | 0.951 | 0.397 | 0.508 | 0.181 |
| < 45 | M (SD) | 4.3 (1.5) | 10.1 (3.5) | 33.6 (5.0) | 10.0 (2.8) | 3.0 (0.8) | 23.7 (1.5) | 32.6 (7.5) | 13.8 (5.6) |
| N | 95 | 103 | 78 | 50 | 90 | 111 | 42 | 42 | |
| IQR | 1.9 | 5.3 | 5.9 | 4.1 | 1.2 | 3.0 | 12.5 | 7.0 | |
| > 65 | M (SD) | 3.5 (1.4) | 9.2 (3.9) | 32.6 (5.0) | 9.7 (3.0) | 3.1 (0.9) | 25.2 (1.7) | 31.3 (7.4) | 16.0 (6.6) |
| N | 36 | 37 | 25 | 18 | 34 | 2 | 22 | 22 | |
| IQR | 2.5 | 4.5 | 7.8 | 3.9 | 1.3 | - | 13.7 | 10.6 | |
| BMI Group | p-value | 0.464 | 0.289 | 0.219 | 0.616 | 0.779 | 0.905 | 0.209 | 0.320 |
| < 18.5 | M (SD) | 3.8 (1.0) | 8.5 (3.0) | 32.0 (3.7) | 9.4 (3.0) | 3.0 (0.8) | 27.0 (5.7) | 33.9 (9.3) | 13.0 (4.6) |
| N | 11 | 10 | 8 | 6 | 10 | 12 | 8 | 8 | |
| IQR | 0.6 | 5.3 | 6.5 | 6.3 | 1.6 | - | 18.7 | 5.9 | |
| 18.5 - 24.9 | M (SD) | 3.9 (1.4) | 9.4 (3.6) | 33.0 (5.3) | 9.5 (2.9) | 3.0 (0.8) | 26.6 (4.4) | 33.6 (7.2) | 14.1 (5.7) |
| N | 90 | 93 | 71 | 50 | 84 | 98 | 49 | 46 | |
| IQR | 1.8 | 3.4 | 6.8 | 3.6 | 1.2 | 8.0 | 13.1 | 9.0 | |
| 25.0 - 29.9 | M (SD) | 4.2 (1.5) | 9.8 (3.1) | 34.7 (5.4) | 10.4 (4.1) | 3.1 (0.9) | 24.7 (1.7) | 30.8 (7.0) | 15.1 (6.2) |
| N | 71 | 72 | 53 | 34 | 63 | 80 | 31 | 32 | |
| IQR | 2.0 | 4.5 | 8.1 | 4.0 | 1.5 | - | 11.1 | 10.2 | |
| 30+ | M (SD) | 4.3 (1.6) | 10.4 (3.8) | 33.9 (3.9) | 9.7 (2.4) | 3.2 (0.9) | 25.7 (-) | 30.8 (5.9) | 16.5 (6.3) |
| N | 47 | 54 | 38 | 26 | 45 | 58 | 24 | 26 | |
| IQR | 1.8 | 6.9 | 5.2 | 4.1 | 1.5 | - | 11.6 | 11.3 | |
| Race | p-value | 0.216 | 0.072 | 0.114 | 0.262 | 0.081 | 0.016 | 0.872 | 0.642 |
| Asian | M (SD) | 4.1 (1.2) | 10.2 (3.6) | 34.8 (4.7) | 10.9 (3.5) | 3.3 (0.8) | 25.2 (3.5) | 32.0 (6.5) | 13.1 (6.2) |
| N | 45 | 46 | 37 | 23 | 40 | 48 | 23 | 22 | |
| IQR | 2.0 | 4.5 | 3.9 | 2.3 | 1.4 | 6.0 | 8.2 | 12.7 | |
| Black | M (SD) | 5.0 (1.6) | 11.3 (2.9) | 37.1 (2.4) | 7.0 (0.7) | 2.9 (0.6) | - | 32.2 (10.2) | 16.2 (4.7) |
| N | 10 | 10 | 8 | 4 | 8 | 12 | 2 | 3 | |
| IQR | 2.3 | 5.3 | 2.1 | - | 1.4 | - | - | - | |
| Hispanic | M (SD) | 4.4 (1.8) | 10.9 (3.8) | 33.2 (4.8) | 8.9 (3.3) | 2.8 (0.7) | - | 31.4 (6.1) | 14.5 (5.8) |
| N | 32 | 39 | 27 | 14 | 30 | 43 | 15 | 17 | |
| IQR | 2.9 | 6.7 | 5.7 | 5.1 | 1.0 | - | 10.1 | 9.3 | |
| White | M (SD) | 3.9 (1.4) | 9.1 (3.2) | 33.1 (5.4) | 9.8 (3.2) | 3.1 (0.9) | 24.7 (1.9) | 32.7 (7.9) | 15.7 (6.1) |
| N | 109 | 112 | 84 | 62 | 105 | 119 | 59 | 58 | |
| IQR | 1.9 | 4.2 | 6.1 | 3.5 | 1.3 | 4.0 | 14.4 | 9.2 | |
| Other | M (SD) | 3.8 (1.3) | 8.8 (3.6) | 33.2 (5.3) | 9.9 (2.3) | 3.5 (0.8) | 32.1 (1.5) | 30.1 (4.2) | 14.1 (6.0) |
| N | 15 | 15 | 9 | 7 | 13 | 17 | 6 | 6 | |
| IQR | 1.2 | 4.0 | 10.2 | - | 0.3 | - | - | - |
Disclaimer/Publisher’s Note: The statements, opinions and data contained in all publications are solely those of the individual author(s) and contributor(s) and not of MDPI and/or the editor(s). MDPI and/or the editor(s) disclaim responsibility for any injury to people or property resulting from any ideas, methods, instructions or products referred to in the content. |
© 2025 by the authors. Licensee MDPI, Basel, Switzerland. This article is an open access article distributed under the terms and conditions of the Creative Commons Attribution (CC BY) license (http://creativecommons.org/licenses/by/4.0/).
Copyright: This open access article is published under a Creative Commons CC BY 4.0 license, which permit the free download, distribution, and reuse, provided that the author and preprint are cited in any reuse.


