Submitted:
23 June 2025
Posted:
24 June 2025
You are already at the latest version
Abstract
This paper presents an empirical investigation into the role of Fintech risk in shaping the dynamic behavior of bank performance, employing a panel vector autoregressive (PVAR) methodology on a dataset comprising 41 banks across 11 African economies over the period June 2004 to December 2020. The findings reveal that bank performance, measured by return on equity (ROE), exhibits a negative and short-lived response to fintech risk shock, while the effects on bank stability, cost efficiency, and return on as-sets (ROA) are statistically insignificant. In addition, an increase in fintech risk signifi-cantly enhances both ROA and ROE, with negligible impacts on cost efficiency and stability. In contrast, a decline in fintech risk has a significant negative effect on ROE and stability, but remains insignificant for ROA and cost efficiency. These results indicate that fintech risk shocks have asymmetric effects on ROA, cost efficiency, and bank sta-bility, but a symmetric effect on ROE. The findings suggest that engagement in financial innovation initiatives may yield performance benefits for banks, provided such strate-gies are pursued within a sound regulatory framework to mitigate potential excessive risk-taking.
Keywords:
Fintech
; bank performance
; risk management
; panel vector autoregressive (PVAR) approach
1. Introduction
Recent technological innovation in the financial sector is increasingly affecting the provision of financial services through various streams, including but not limited to Financial technology (Fintech) start-ups, an extension of the financial services and products domain, and digital innovation (Basel Committee on Banking Supervision, 2024). While financial innovation is good for banks and customers to enhance process efficiency, financial inclusion, and competition - the financial stability risk that comes with rapid financial innovation cannot be ignored. For instance, financial stability risks come in various forms such as increased interconnectivity, regulatory arbitrage, contagion, and concentration of risks (Basel Committee on Banking Supervision, 2024). Moreover, it is identified that Fintech startups have increased competition in the banking sector (KPMG, 2022).
The term ‘Fintech’ refers to the rapid innovation in financial technology that leads to new models, applications, and products that can tremendously transform the financial markets and services (Bu et al., 2023). Thus, the development of Fintech comes with the risk that manifests in traditional banking risks. While Africa is renowned for its mineral wealth, the emergence of Fintech startups is also significantly reshaping financial services, fostering financial inclusion, and driving economic growth. For example, Kenya has positioned itself as the global Fintech hub, a home to fourteen Fintech start-ups including the iconic M-Pesa that offers loans, mobile money services, and other microfinance services, followed by Tala, which offers loans to customers by using SMS records and transaction history to assess credit worthiness. Other Fintech companies are; Branch, Pesa-pal, Juma, Zoa, Cellulant, Kopo-Kopo, Pezesha, Bit Pesa, Lipa Later, Chipper Cash, Tanda, and Aspira Kenya (Walyaula, 2007). In South Africa, prominent FinTech companies include 22Seven, Bank Zero, and Yoco. In Egypt, Fawry stands out, while in Nigeria, notable companies such as Kuda and Opay are making significant strides. Many of these companies operate within the digital payment space, while others function as Neobanks (Okafour, 2023).
The African banking sector is becoming increasingly aware of these players, and a handful of African commercial banks are now partnering with Fintech startups. For instance, in South Africa, the "big four" banks are partnering with Fintech firms to extend their reach into previously underserved markets. Notably, one South African bank collaborated with a payment system targeting the informal market to better understand the sector's unique needs (Timm, 2019). Similarly, a leading commercial bank in Nigeria has invested over $17 million in ten promising Nigerian Fintech startups, emphasizing that such partnerships foster innovation, promote financial inclusion, and strengthen the financial system (Obiowo, 2024). This strategic alignment demonstrates a shift in traditional banks’ approach, from competing with Fintech companies to actively collaborating with them. By acquiring stakes in Fintech ventures, traditional banks position themselves to benefit from the success of these innovative enterprises.
Given the influence of Fintech in the provision of financial services and the financial sector, some studies suggest that investment in Fintech may increase bank performance by enhancing banks’ business processes (Nekesa and Olweny, 2012; Ahmed and Wamugo, 2018). However, other research suggests that the emergence of Fintech can be perceived as competition, thus deteriorating bank performance (Berger and Mester, 2003; Bejar et al., 2022; Jia, He and Mohsin, 2023; and Liu, Feng and Li, 2024). It is further noted that even if banks can partner with Fintech start-ups to reinforce their Fintech capabilities, this may come with reputational and data breach risk (Basel Committee on Banking Supervision, 2024). Reversely, profitable banks may bolster investment, particularly in Fintech such that they are not left behind in Fintech race (Emery,Finnerty, and Stowe, J. D, 2017). Such banks make investment strategies that consider changes in financial technologies, which in turn help them to keep up with competitive pressures. Despite extensive discussions on the relationship between Fintech, and bank performance (Nekesa and Olweny, 2012;Wang, Feng and Dang, 2021;Bejar et al., 2022; Jia, He and Mohsin, 2023; Anarigide, Issahaku and Dary, 2023; Liu, Feng and Li, 2024; and Benchimol and Bozou, 2024), the results of analyses remain inconsistent due to divergence in the research context and time period. One possible cause of this inconsistency may be discrepancies in bank performance and Fintech metrics, including failure to account for other variables that may impact the effect of financial innovation on bank performance. Particularly, numerous studies in Africa - Nekesa and Olweny (2012); Ahmed and Wamugo (2018); Ashiru, Balogun, and Paseda (2023); and Mhlongo, Kunjal, and Muzindutsi (2025) - emphasize the adoption of financial technologies while overlooking the associated risks that accompany Fintech adoption. The externalities associated with Fintech adoption have been identified to include systemic risk, operational risk, outsourcing risk, and cyber risk (Khalaf, Awad, Ahmed, O, and Gharios, 2023). These risks have been shown to exert adverse effects on bank performance, particularly within developing economies (Khalaf et al., 2023). Consequently, this study aims to make two marginal contributions.
Firstly, unlike previous studies that emphasize the potential benefits of Fintech measured by the number of MoMo transactions, the number of Automated Teller Machines (ATMs), or new Fintech entrants, this study follows a different approach and develops a multi-dimensional Fintech Financial Stress Indicator (FFSI) following Bu, Du, Li, Yu, and Wang. (2023) using actual features of African economies. The resultant Fintech risk measure captures multi-dimensional aspects of financial innovation led vulnerability. Secondly, to understand the impact of Fintech risk (measured by FFSI) on bank performance, this paper follows a multiple equation framework, unlike previous studies that mostly rely on a single-country and single equation model which does not account for mutual influences. The multivariate approach helps account for the potential influence of competition in shaping the relationship between bank performance and Fintech while addressing possible endogeneity due to feedback effects. This is particularly important in the current financial landscape, where banks face competitive pressure from the emergence of Fintech start-ups. Accordingly, the panel vector autoregression (PVAR) model is used, which can also handle challenges associated with cross-country heterogeneity and two-way causality (Canova and Ciccarelli, 2013; and Zribi et al., 2024). The study further investigates whether bank performance exhibits symmetric responses to positive and negative Fintech risk shocks. The rest of the study is organized as follows; the literature review is presented in the next section, followed by methodology, data, and the results, and finally, the conclusion.
2. Literature Review
2.1. Conceptual Framework
Financial innovation theories can be classified under process innovation theory, adaptive innovation theory, and constrained induced financial innovation theory (Niehans, 1983). Process innovation involves technological breakthroughs or new business processes in delivering a service or product that leads to reduced costs of production and market expansion. Furthermore, transaction cost innovation theory falls under process innovation theory as it identifies technological advancement of providing services in a cost-effective manner (Ahmed and Wamugo, 2018). Adaptive innovation theory is an advancement in bundling basic services of banking. Central to adaptive innovation is entrepreneurial response to changes in market conditions, which may involve a revolutionary development in banking (Niehans, 1983). As part of adaptive innovation, Fintech also has the power to tremendously transform the banking industry and make it more inclusive through electronic banking channels (Niehans, 1983; Murinde et al. 2022; and Ashiru, Balogun and Paseda, 2023).
Fintech is an advanced development in financial technology, or the interplay between finance and technology (Murinde, Rizopoulos and Zachariadis, 2022). However, as part of innovative financial technologies, Fintech often moves in parallel with market disruption and is inherently accompanied by risk, primarily due to limited regulatory oversight. The absence of adequate supervision may, in turn, exaggerate vulnerabilities within the financial system, potentially leading to broader financial instability (Bu et al., 2023). Moreover, Fintech is more encompassing than the broader financial innovation as it involves innovation outside the banking sector. For instance, Fintech involves non-banking businesses that play into the banking space. The businesses are; shadow banks, neo banks, digital banks, crowdfunding, crypto-currencies, online payment systems, and CFIs (Co-operative Financial Institutions).
In Africa, financial inclusion is reinforced through CFIs, credit unions, or deposit taking financial institutions. CFIs form part of adaptive financial innovation as they are entrepreneurial in nature, country specific, and respond to market failure (Niehans, 1983; and Mushonga, Arun and Marwa, 2018). Banks often shun upon providing financial services to small medium enterprises and marginalized communities, often citing information asymmetry (Mushonga, Arun and Marwa, 2018; and Zhu and Guo, 2024). In response to this market failure, communities often form CFIs to service the unbanked or market that the banks cannot reach. However, it is argued that CFIs are highly regulated which stifles their growth. Consequently, constrained induced theory hypothesizes that the high cost of adhering to regulation is central to innovation of new financial products thus making banks more profitable (Silber, 1983). Constraints are not the only source of innovation, competition also stimulates banks to innovate.
Competition is at its best defined as the level of concentration of suppliers in the market. A lack of competition is characterized by a very concentrated market, featuring only a few suppliers. In highly competitive markets, suppliers and consumers are price takers facing infinitely elastic supply and demand functions at given market prices (Mas-Colell, Whinston, and Green, 1995). Lack of competition signals market power. The trivial case of market power is a monopoly, where a supplier notices that demand is less responsive to price changes. In this case, the supplier can increase the price above the competitive price and still make a profit. This case also arises in industries with few suppliers, like oligopolies (Mas-Colell, Whinston, and Green, 1995). It is further argued that in an oligopoly market, oligopolists can maximize profits when they collude as monopolists (Stigler, 1964). Collusion is defined as an agreement between suppliers to gain market power and influence trade (Chassang and Ortner, 2023). However, collusion has costs associated with it, such as compromised quality standards and a lack of product innovation (Stigler, 1964).
It is reasonable to posit that the African banking sector exhibits oligopolistic characteristics, given its high level of concentration and documented instances of collusion. Evidence suggests that competition authorities have encountered challenges in addressing anti-competitive and dominant market power abuse practices within the sector. For example, regulatory bodies have investigated allegations of price-fixing among 28 banks involved in manipulating the rand-dollar exchange rate (Petersen, 2019). Such foreign exchange cartels can have significant adverse effects, as their influence extends beyond financial markets, impacting the broader real economy. In addition, the initial capital outlay required to set up a bank is very high in some African countries, promoting bank oligopolies (Browne, 2019). Moreover, African banks are highly profitable with relatively high net interest margins, which signals an oligopolistic market (Mabe and Simo-kengne, 2023). As a result, the Stigler (1964) model of price cut detection by the oligopolist to maximize profit offers an analytical framework to understand the impact of Fintech risk on bank performance while accounting for competition. Moreover, the adoption of Fintech is accompanied by a range of risks, including inadequate consumer protection due to data breaches and fraud, regulatory arbitrage, contagion effects, and potential biases embedded in machine learning and artificial intelligence models, all of which may culminate in reputational risk (Oriji et al., 2023). Consequently, the breach of a collusion agreement through product differentiation or Fintech adaptation constitutes a significant risk tolerance by a bank. Similarly, the breach of a collusion agreement enables the violating bank to gain a competitive advantage and subsequently capture a larger market share.
Following the framework of Stigler (1964), it is assumed that each customer is pre-assigned to a specific bank. Furthermore, it is posited that a commercial bank engaging in product differentiation in violation of the collusion agreement does not actively advertise its differentiated product, either to potential customers or to competing banks. This strategic concealment makes the detection of product differentiation particularly challenging, as the violating bank seeks to avoid exclusion from the collusive arrangement. However, customers who have benefited from the innovative product or service may eventually disclose its existence to other potential customers. Over time, such dissemination of information can prompt competing banks to adopt and offer similar products, thereby diffusing the innovation throughout the market.
Over time, the bank that breaches the collusion agreement is likely to be detected, as it will attract customers that it would not have otherwise obtained in the absence of its product innovation. The definition of perfect collusion is that no bank customer changes bank voluntarily. Hence, the problem is to detect secret product innovation.
Secret product innovation detection is investigated in a simple model in which all bank customers and banks are equal, and each bank client is assigned a bank. Secret product innovation may be detected by the behavior of old customers. If there are old customers, then new customers are represented by
. Furthermore, suppose that there are commercial banks. As a result, on average a bank has customers and expects to sell in a given round of transactions, where is the price, and revenues.
Consequently, the objective is to construct a model of the bank’s customer base. At this stage, we diverge slightly from Stigler (1964) by employing the competitive Lotka-Volterra equations to characterize the dynamics of the evolving bank oligopoly market (Berryman, 1992). It is important to also emphasize that the assumption of a collusion violation still holds, that is, secret product innovation. We assume that there are customers, and the customers are divided into two categories, such that, the first category represents customers that are loyal to the banks that adhere to the cartel agreement, and represents customers that shift to banks that violate the collusion agreement as a result of product innovation. Subsequently, . Hence, the number of customers in the oligopolistic bank market with collusion and violators changes through time according to a pair of equations:
The rest of the models’ parameters are detailed in Table 1.
To solve for the equilibrium number of customers that are loyal to banks that violate the collu sion agreement through product innovation is:
Likewise, to solve for the equilibrium number of customers that are loyal to the collusion agreement yields:
Further, note that such that as . Consequently, an average number of customers that are loyal to the banks that adhere to the collusion agreement is:
The average number of customers that are loyal to banks that violate the collusion agreement is:
By imposing the probability to the model, it is further assumed that selecting a bank in every round of transactions follows a Bernoulli distribution such that . Moreover, success is selecting a bank that conforms to a collusion agreement, denoted as . Failure is selecting a bank that violates the collusion agreement. Subsequently, the probability of choosing a bank that honors the collusion agreement in any round of transaction is . Hence, the expected number of clients of the banks that collude is:
Likewise, the expected number of clients that are loyal to the banks that violate the collusion agreement is:
It is clear that in the limit, or equilibrium the probability of choosing a bank that violates the collusion agreement will increase as more banks will violate the collusion agreement. This is because the banks will realize that they gain greater market share as they take the risk to innovate. Moreover, the expected revenue of two categories of banks are; , and respectively.
Additionally, if it is assumed that the cost of granting banking services by the violating bank, is less than the cost of granting banking services by the bank that conforms with the collusion agreement, we have:
where , and are the profits of the colluding and violating banks respectively. Finally, , and it can be predicted that in an oligopolistic market with banks that adhere to the collusion agreement and violators (risk-takers), banks that violate the collusion agreement through product innovation gain greater market share and profit. Several propositions can be made from this statement.
Hypothesis 1a: Bank product innovation or Fintech has a negative effect on competition, that is, banks that take the risk of financial innovation gain market power.
Hypothesis 1b: Fintech risk has a positive effect on performance, giving a pairwise relationship between Fintech risk and performance.
Hypothesis 1c: Market power or lack of competition has a positive effect on performance, yielding a pairwise relationship between competition and bank performance
By combining Hypothesis 1a, 1b and 1c, the following transmission mechanism can be proposed:
Hypothesis 2: Fintech or financial product innovation reduces competition, which in turn improves bank performance
To operationalize the theoretical model, bank performance is captured by return on assets (ROA), return on equity (ROE), cost-to-income ratio (CTI), and stability (Z-Score). Fintech is an emerging form of finance, and FFSI is the indicator that signals Fintech risk (Bu et al., 2023).
Competition is denoted by the Boone Indicator, which measures the impact of efficiency on performance in terms of profits. It is estimated as the marginal elasticity of profits to costs. The main idea behind the Boone Indicator is that when there is less competition, banks will be more efficient and the Boone Indicator will be less negative. The more negative the Boone Indicator is, the more competitive the market is1.
2.2. Empirical Review
Empirical studies have investigated the relationship between financial innovation and bank competition (Bejar et al., 2022; Jia, He and Mohsin, 2023) and the results are mixed. On one hand, financial innovation has a positive effect on the competitiveness of large banks. On the other hand, financial innovation is detrimental to the competitiveness of small banks. Likewise, the link between competition and bank performance has been widely documented, with the overall conclusion that competition makes banks more efficient (Allen and Gale, 2004; Andries and Capraru, 2014; Fang et al., 2019; Wang, Feng and Dang, 2021). Moreover, the connection between financial innovation, and bank performance has been extensively explored (Nekesa and Olweny, 2012; Ahmed and Wamugo, 2018; Zhao et al., 2022; Kulu et al., 2022; Ashiru, Balogun and Paseda, 2023; and Liu, Feng and Li, 2024), with the general findings that financial innovation enhances bank performance. The shortcoming of the previous studies is that they fail to account for competition in the impact analysis of financial innovation on bank performance. In contrast, this study attempts to account for competition in assessing the impact on Fintech risk on bank performance.
Furthermore, Fintech entities, CFIs and mobile money (MoMo) platforms directly compete with traditional banks, presenting a significant challenge to the banking sector. In addition, these platforms may come with regulatory arbitrage and add to systemic risk (Chipeta and Mapela, 2024). For instance, large technology firms whose primary operations do not center on banking can pose significant regulatory challenges due to the complexity of their business models, often leading to conflicts of interest. These firms, commonly referred to as "Big Tech," are known for exhibiting anti-competitive behaviors, frequently operating under a "winner-takes-all" framework. Such market dominance can lead to substantial systemic risks within the financial sector (Zamil and Lawson, 2022).
In addition, the body of research examining the impact of FinTech on the performance of African banks remains limited. Existing studies primarily focus on the process-related effects of Fintech, such as mobile banking, internet banking, and Automated Teller Machines (ATMs); ignoring the competitive and negative externalities of Fintech on the performance of commercial banks in Africa, despite the sector's growing influence in the region's banking landscape.
2.2.1. Studies Related to Financial Innovation and Competition
Competition can drive banks that fail to innovate out of business. For instance, the negative relationship between technological advancement and operational efficiency is investigated. It is predicted that the negative effect of technological advancement on the operational efficiency of small-medium banks operating in Western China is intensified by a high degree of competition, where competition is measured by the Lerner Index (Liu, Feng and Li, 2024). Competition can also be measured by bank profitability, where tight competition in the banking sector is reflected through low margins, whereas a lack of competition is reflected through high net interest rate margins. By using a sample of 692 banks in Latin America and the Caribbean between the periods 1988-2018 the effect of Fintech on competition is analysed using difference-in-difference approach. It is revealed that banks situated in countries with high Fintech firm entry have low net interest rate margins relative to banks in countries where Fintech firm entry is less prevalent (Bejar et al., 2022). In parallel the impact of financial innovation is investigated on bank competition for a sample of banks that operate in South Africa where financial innovation is measured by the volume of mobile money transactions. It is revealed that mobile money transactions significantly reduces market power (Mhlongo, Kunjal and Muzindutsi, 2025).
Quadratic Assignment Procedure is used to study the impact of digital finance on competition for a sample of 16 listed banks in China. It is acknowledged that the consensus on the relationship between financial innovation and competition has not been reached as a result of different measures of competition and financial innovation. Banking competition is measured by a market commonality network, and it is revealed that digital finance changes the landscape of bank competition. For large banks, digital finance has a positive effect on their level of competitiveness, whereas it increases the competitive pressure for small and medium banks. Overall, digital finance increases the level of competition, which is favorable to consumers in the form of promoting financial inclusiveness and decreasing the price of financial products (Jia, He and Mohsin, 2023). By using a sample of 46 countries across Sub-Saharan Africa for the period between 1978-2017, the drivers of financial innovation are investigated. It is revealed that competition amongst others, has a meaningful impact in stimulating financial innovation. Competition is captured by the Boone indicator, whereas a measure of financial innovation constitutes ATMs and branchless banking (Anarigide, Issahaku and Dary, 2023).
2.2.2. Studies Related to Competition and Bank Performance /Stability
The degree of competition, to some extent, can affect the stability of the banking system (Claessens, 2009). It is noted that competition in the banking sector should lead to lower costs and improved efficiency in financial intermediation and product innovation (Berger and Mester, 2003). This notion is established by using a sample of Chinese banks between the period 2003-2017 where it is revealed that the positive effect of cost efficiency on bank performance is high under high levels of competition (Fang et al., 2019). The competition efficiency hypothesis is also confirmed in a study using a sample of EU 27 members for the period between 2004-2010, where competition is measured by the H-Statistic. Overall, it is established that an increase in the level of competition improves both cost and profit efficiencies (Andries and Capraru, 2014). However, in some cases, competition has been revealed to have detrimental effects on banking efficiency, and thus stability.
For instance, in a model setup, it is predicted that a more competitive market reduces banks’ markups which hampers financial stability (Benchimol and Bozou, 2024). Based on a sample of 48 rural banks operating in China between the period 2012-2018, the effect of competition on bank operating profit is investigated where competition is indicated by the Lerner index. It is revealed that increased market competition is associated with reduced bank operating profit (Wang, Feng and Dang, 2021).
2.2.3. Studies Related to Financial Innovation and Bank Performance
By employing a sample of 16 commercial banks in Kenya it is established that financial innovation factors such as; agency banking, mobile banking, Automated Teller Machines (ATM) banking, and internet banking have meaningful impact on bank performance. The channels through which financial innovation effects banking are; increased profitability, reduced costs of banking, increased productivity and efficiency, increased customer outreach, customer relationship management, increased accessibility and quality of services (Ahmed and Wamugo, 2018). A similar study is carried out where the effect of financial innovation on performance is investigated on a sample of Savings and Credit Co-operative Societies (SACCOS) in Kajiado County, Kenya. Performance is measured by return on assets and return on equity whereas financial innovation is constrained to product, process, and organization innovation. Product innovation is proxied by electronic banking, mobile banking, and the introduction of new products. Process innovation is proxied by; office automation, use of real time gross settlements, and loan tracking systems. Organisation innovation is proxied by the expansion of institutions, and organizational restructuring. The regression analysis revealed a significant positive relationship between all forms of innovation and performance (Nekesa and Olweny, 2012). A similar outcome is established for a sample of Nigerian deposit money banks, where performance is measured by return on assets and equity, and financial innovation is proxied by ATMs, point of sales, internet banking, mobile money banking, National Electronic Fund Transfer (NEFT) System, and instant payment (Ashiru, Balogun and Paseda, 2023). Using monthly country level data between the period of 2015-2020 the effect of mobile money banking on performance of banks that operate in Ghana is studied. Performance index is constructed by principal component analysis and it is made up of three components which are; private sector credit, return on assets, and capital adequacy ratio. The findings reveal that in the long-run mobile money banking has negative significant effect on banking sector efficiency, whereas it has insignificant effect on credit extended to the private sector and capital adequacy (Kulu et al., 2022). In a sample of South African banks, performance is measured by capital adequacy ratio (CAR) and it is established that financial innovation developments such as mobile money platforms and ATMs have no significant impact on performance (Mhlongo, Kunjal and Muzindutsi, 2025).
Outside Africa, a dynamic threshold regression analysis is used in studying the relationship between bank performance and financial innovation for a sample of 120 banks operating in China between the years 2003 and 2018. Financial innovation is captured by the development of a Fin-Tech index which involves enterprise-level data of China FinTech companies. The FinTech companies are; digital bank, online brokerages, online insurance, online fund sales, online asset management, online microfinance, online consumer finance, P2P, financial information services, crowdfunding, digital currency, financial infrastructure, payments, credit assessment and credit scoring. To reduce the complexity of the analysis a FinTech index is constructed out of factors such as; total established companies, registered capital, number of financing events, and amount of financing. Performance is captured by CAMEL (Capital adequacy, Asset quality, Earnings power, and Liquidity ratios) indicators. It is revealed that FinTech development significantly leads to better management efficiency, capital protection, and liquidity but lowers asset quality and profitability (Zhao et al., 2022). By using a sample of 130 banks operating in Western China between the period 2008 and 2021, it is revealed that digital financial development is detrimental to the operational efficiency of the banks (Liu, Feng and Li, 2024).
Therefore, this study reconciles three strands of prior research by examining the role of competition in driving the impact of Fintech risk on bank performance within a unified theoretical and empirical framework. Accordingly, it seeks to investigate whether and how rapid Fintech development comes with competition and risk that may hamper bank stability. Unlike previous studies that mainly focus on Fintech potential benefits, this study considers the negative externalities of Fintech (Fintech risk) resulting from a combination of factors from various sources, including Fintech companies, financial institutions, non-bank institutions offering financial services, economic environment, financial environment, science and technology, and network environment (Bu et al., 2023). Thus, the study employs the Panel Vector Autoregression approach to quantify the dynamic response of bank performance to changes in Fintech risk through the impulse response functions. This approach allows to test the transmission mechanism through which fintech risk affects bank performance while addressing endogeneity due to feedback effects. In addition, the shock-response among the three variables is investigated. The PVAR methodology is particularly well-suited for this analysis as it treats all three variables as endogenous, and allows us to study the response of bank performance to shocks in Fintech risk (Canova and Ciccarelli, 2013). Moreover, the impulse response functions provide a quantitative measure of the temporal dynamics.
3. Materials and Methods
3.1. Fintech Financial Stress Indicator Development
Fintech risk is a latent variable; therefore, it requires the use of a proxy indicator to gauge its dynamics. The Fintech Financial Stress Indicator (FFSI) serves this role by capturing the multifaceted nature of fintech-related risk. This study follows the FFSI as proposed by Bu et al. (2023), while tailoring it to the specific characteristics of African economies.
In the African context, community-based financial intermediaries or co-operative financial institutions (CFIs) play a significant role in promoting financial inclusion. The CFIs are formalized versions of traditional “stokvels”, demonstrating a unique model of financial intermediation where members access financing based on their savings behavior as opposed to credit history. As such, the growth rates of loans and deposits within CFIs are utilized as indicators within the FFSI to reflect Fintech-driven financial activities.
Additionally, the proliferation of internet usage is employed as a proxy for public awareness and potential adoption of digital financial services, including peer-to-peer (P2P) lending platforms and online banking. Mobile money platforms have emerged as a dominant financial service channel in remote regions, allowing unbanked individuals to engage in financial transactions without the need for a conventional bank account.
Furthermore, the growth rate of automated teller machines (ATMs) is used to measure the extent to which banks are automating services through technological innovations. Similarly, the growth in the number of bank branches also reflects technological adaptation. As digital banking gains traction, banks invest less in physical branches. In sum, the FFSI, as applied to the African setting, integrates various indicators that capture both the traditional and innovative aspects of fintech development, thereby providing a comprehensive measure of fintech-related financial stress in the region. The rest of the indicators are detailed in Table 2.
The overall FFSI index is computed by principal component analysis (PCA) using all the 19 secondary indicators. The notion behind PCA is to construct a variance covariance matrix, out of the indicators. And then solve for the eigen-values such that . 2Every estimated has an associated eigen-vector, Then it remains to solve for such that . 3The principal component is the eigen-vector that is associated with the highest eigen value. The highest eigen-value is the one that explains much of the variation in the data. The eigen-vectors are the factor loadings. The factor loadings are then used as the linear combination of the 19 secondary indicators to estimate the FFSI index.
3.2. Pretest Requirements
To obtain consistent parameter estimates, the model's variables, which are initially non-stationary, are differenced to achieve stationarity. Moreover, failing to account for potential correlations in regression disturbances over time and across units may result in biased statistical inferences (De Hoyos & Sarafidis, 2006). Consequently, the Pesaran (2004) cross-sectional dependence test is conducted to address this issue.
- Cross Sectional Dependence Test
The cross-sectional dependence test that will be applied is the one proposed by Peasaran (2004). The Peasaran (2004) has no substantial measurement error when is asymptotically large and is finite. The test is more appropriate in the current study where there are 41 banks and 34 time units, that is, . The cross-sectional dependence (CD) test is given as:
where is the estimate of the pairwise correlation of the residuals. Under the null hypothesis of no cross-sectional dependence for and sufficiently large. The statistic has mean at exactly zero for given values of and under a variety of panel data models (De Hoyos and Sarafidis, 2006). The step that follows is to test the model’s variables for unit roots.
- Panel Unit Root Test
To ensure that there exists a VAR representation of any vector, the assumption of stationarity must be met. Moreover, if the stationarity condition is satisfied it ensures that the variance of a VAR representation is bounded and greater than zero (Greene, 2002).
The panel unit root test that is followed is the Im-Pesaran-Shin (IPS) unit-root test. The Im-Pesaran-Shin (IPS) unit root test is well-suited for heterogeneous panels, making it an appropriate choice for this study, given that the banks operate across different countries(Im, Pesaran and Shin, 2003). Given a sample of cross sections of banks observed over some time period, it is assumed that the stochastic process, , is generated by the first order autoregressive process:
The objective is to test for the null hypothesis of unit roots, that is for all the banks. Alternatively, Equation 16 can be written as:
where the null hypothesis of unit root becomes:
for all Against the alternatives:
, ……,
The formulation of the alternative hypothesis allows for the to differ across groups. It further allows for some, but not all of the individual series to have unit roots. The test statistic is derived for Equation 16 under the assumption that errors are serially uncorrelated and is fixed. More assumptions are made and the t-statistics are computed based on the pooled log-likelihood function. Hence,
where, , and .
The simplified version of the t-statistic is;
Therefore, the average t-statistic is:
The test derived is well-suited for our data, as the study is based on a panel of banks that operate across different nations, hence there is heterogeneity across panels. Once stationarity is achieved, the PVAR model is estimated.
3.3. PVAR Model
The structural panel VAR model that is estimated is:
where is a stacked three-dimensional vector of endogenous variables, and , and denote bank performance, competition, and financial innovation for bank at time , respectively. Financial innovation is captured by the number of mobile money transactions (MoMo) and the number of Automated Teller Machines (ATMs) . Moreover, is the matrix of coefficients of the lag variables. The model is estimated with one lag. Restrictions are placed on the polynomial coefficients, to ensure that the polynomial is invertible and the variance of the VAR representation is finite. This ensures the moving average representation of the structural VAR model, which allows one to assess the response of one variable to the shock in the residual of the other variable. The error term in Equation (21) can be decomposed in to a linear combination of the residuals of the three variables such that:
The structural PVAR process allows shocks in the residuals of each variable. Where ( or zero means white noise process). Moreover, the error terms are unobservable. To model the impacts of , , and on to and the matrix is formed out of Equations 16-18 such that:
Alternatively, . Central to the identification of structural panel VAR is the identity, = Which is the variance-covariance matrix of a reduced form residuals given in Equations 22-24.
Since the variance-covariance matrix is symmetric, there are six unique equations and nine unknowns. Thus, the model is under-identified, which is the identification problem presented by structural VAR equations. To solve the identification problem, the structural VAR needs to be restricted. The restriction considered in the study is the Cholesky zero short-run restrictions, which decompose the variance-covariance matrix into a product of the lower triangular matrix and its conjugate transpose.
The assumption behind zero short-run restrictions is that the innovations of FFSI index have no short-run effects on performance and competition. This assumption aligns with the prevailing technological paradigm, which posits that innovation occurs cumulatively and incrementally rather than instantaneously. Technological advancements typically build upon prior developments, progressing gradually over time. However, in cases of radical innovation, this pattern may not hold, as such innovations introduce unpredictable outcomes that may not be anticipated by industry experts (Werker, 2003). The Generalised Method of Moments (GMM) technique is used to estimate the PVAR model.
The primary advantage of the Generalized Method of Moments (GMM) lies in its flexibility, as it does not require the assumption that the data-generating process belongs to a specific family of distributions. Instead, parameter estimation is achieved by aligning sample moments with their corresponding population moments. However, a key challenge associated with GMM is the precise specification of moment conditions, which is crucial for obtaining reliable estimates. To address this issue, Andrews and Lu (2001) propose a moment selection criterion based on the J-statistic. The J-statistic tests for over-identifying restrictions in GMM estimation under the null hypothesis that all moment conditions are correct. Consequently, the J-test statistic based on the model selected by and the moment selected by is defined as:
Here, denote an ordered pair of model and moment selection vectors. By definition , and are vectors made up of zeros and ones. If the element of is one then the element of the parameter vector , is the one to be estimated. If the element is zero, then such a parameter is not to be estimated. Likewise, if the element of c is one, then the moment condition is included in the GMM function specification, otherwise it is not included if it is zero. Where, is the matrix employed with the moments and the model selected by . It is noted that is defined such that it is an optimal weight matrix as when the moments selected by are correct ( see Andrews and Lu, 2001). Upon estimating the PVAR model, the diagnostic tests are carried out to ensure that the model is stable.
The eigenvalues of the matrix should lie inside the unit circle for a structural PVAR to be stable or for a dynamic system to have a PVAR representation. Once a model has a stable dynamic process, Impulse Response Functions (IRFs) can be obtained (Stata Corp, 2023). The IRF measures the response of one variable to the shock in the residuals of another variable in a dynamic system at a given point in time. If there is a response in one variable to a shock in another variable we may conclude that the latter variable causes the former (Lütkepohl, 2005). Technically, is the coefficient matrix of the moving average (MA) representation of a VAR(1) process. Consequently, the MA coefficient matrices contain impulse response system. The results can be generalized to a VAR(p) process. Given that , the impulse response are the upper left-hand block of . The matrix can be shown to be coefficient of the matrix , the MA representation of . Hence, with , a process. In other words, is the element of , representing the reaction of the variable of the system to a unit shock in variable , periods ago. The response variable to a unit shock in variable is generally illustrated graphically to get an image representation of a dynamic inter-relationships within the system (Lütkepohl, 2005). Moreover, a formal causality test is implemented to identify the causal direction between the variables.
The Granger causality test followed is the one proposed by Dumitrescu and Hurlin (the DH test). This test is suited to this study as the data are macro panels. Macro panels involve large units and time periods where issues of non-stationarity and causality creep in (Lopez and Weber, 2017). The DH test is an extension of the test developed by Granger (1969). Dumitrescu and Hurlin (2012) provide an extension designed to detect causality in panel data, where the regression is given as:
where and are the observations of two stationary variables for individual units and periods. Causality exists if the past values of have a significant effect on the current values of The null hypothesis is:
which is equivalent to the absence of no causality.
The alternative hypothesis is:
for all
which means there is causality for some individuals, and is strictly less than .
To compute the test statistic regressions are ran as detailed in Equation 27, then test is performed on linear hypothesis to compute individual Wald statistic , and subsequently, the average Wald statistic is computed such that :
4. Results
4.1. Data
Semiannual data spanning from June 2004 to December 2020 are utilized in the study. This period was selected in part due to the completeness of the data, as many economic datasets prior to 2004 have missing data points. Furthermore, this timeframe includes several notable events that have had a profound impact on the banking sector, such as the global financial crisis and the COVID-19 pandemic. The analysis focuses on a sample of 41 banks from 11 African economies. These 11 economies include Botswana, Egypt, Ghana, Namibia, Nigeria, Kenya, Uganda, Rwanda, South Africa, Zambia, and Zimbabwe. This sample encompasses both economies that have made substantial investments in financial innovation and those that are transitioning towards making Fintech investments. The data resources and measurement of the variables are detailed in Table 3. According to Table 4 the data of the variables are clustered around the mean, as it is indicated in the small standard deviation. However, the data of CTI, and FFSI are widely spread around the mean. Of particular interest is the Fintech Financial Stress Indicator (FFSI) which is derived by PCA (Bu et al., 2023) .The eigenvalue that is associated with the principal component is estimated at 4.724 and explains 22.50% of the variation in the data. The eigenvector of the first component is detailed in Table 2. The factor loadings of the first component are then used to compute the FFSI index. The FFSI index is the linear combination of the factor loadings and the factors. The market and fintech volatility is computed in two steps. Firstly, by estimating the GARCH (1, 1) model from S&P Fintech stock returns and Financial market returns. Secondly, by predicting the variance from the GARCH (1,1) model, followed by estimating the standard deviation, which is the volatility. The volatility is estimated using daily returns, upon estimating daily volatility, the data are then averaged semiannually using E-Views. The dynamics of the FFSI risk index are illustrated in Figure 1. The correlation matrix is detailed on Table 3 to assess the degree of association. Moreover, in Figure 2 a regression line is fitted on the scatter plots to assess the degree of linear relationship between performance and fintech risk. Similarly, a regression line is fitted to assess the degree of linear relationship between competition and fintech risk as illustrated in Figure 3. It remains to use panel data techniques for meaningful analysis.
The panel data used in this paper may come with a problem of cross-sectional dependence (De Hoyos and Sarafidis, 2006; and Dong, Du and Min, 2024) Therefore, cross-sectional dependence test is performed according to Pesaran (Pesaran, 2007). The results of the cross-section dependence test are shown in Table 4. According to the results for all variables, the null hypothesis is significantly rejected, indicating the existence of cross-sectional dependence in the data. Consequently, the unit root test is performed using the panel Im-Pesaran-Shin (IPS) unit root test (Bu et al., 2023). Furthermore, due to the presence of dependence across different units, the variables are demeaned when conducting the unit root tests. The results are shown in Table 5 and all the variables are stationary at level.
4.2. Results and Discussion
As previously mentioned, the IRFs measure the response of one variable to the shock in the residuals of another variable in a dynamic system at a given point in time. Thus, they can be used to assess the spillover effects of fintech risk on bank performance (Simo-Kengne, Gupta and Bittencourt, 2013). Moreover, panel VAR models have been widely used to study relationships of various economic variables and transmission mechanisms (Zribi et al., 2024). The estimated panel VAR models (Table A1, Table A2 and Table A3) are used to construct IRFs. Overall, Fintech risk (FFSI) has a negative effect on performance albeit insignificant, and the results are consistent across all performance measures. However, a positive shock in fintech risk has a positive and significant effect on ROA and ROE at the conventional level of significance. This pattern is in line with our main research hypothesis, which poses that as banks take on more fintech risk, they are able to bolster performance through driving competition out of the market. The results further solidify the notion that the benefits associated with Fintech substantially outweigh its potential risks (Oriji et al., 2023). Moreover, an increase in fintech risk has a negative effect on BI, indicating that fintech risk makes the banking market more competitive, although the impact is insignificant. Conversely, a decline in fintech risk has a significant positive effect on BI, indicating that when there are fewer fintech players competition is neutralized. In addition, a negative shock in fintech risk has a negative effect on performance, supporting the notion that banks will be left behind if they do not take on fintech investment initiatives (Zhao et al., 2022; and Liu, Feng and Li, 2024).
Nonetheless, the results confirms that the emergence of Fintech start-ups poses a challenge for the banking sector. As mentioned earlier, competition is measured by the Boone Indicator (BI) which measures the level of market concentration. The higher the BI, the higher the market concentration. Market concentration is inversely related to competition, as when the market is concentrated with only few banks it is less competitive. Consequently and consistently with our hypothesis put forth, a positive response of BI to negative Fintech risk implies that, as banks take on more Fintech related risk , they are able to capture the market of their competitors.
The responses of performance metrics and competition to aggregate Fintech risk shock are displayed in Figure 4. In panel (a) of Figure 4 we observe that an aggregate Fintech risk shock of one standard deviation results in an initial ROE (Z-score) decline by 0.03 (0.3) per cent, staying significant for about 2.5 years, and gradually reverting back to the baseline over 10 years. Likewise, in panel (d), a joint Fintech risk shock leads to 0.3 per cent decline in financial stability (Z-score), remaining significant for a short while and reduces to zero after 3 years. This pattern is in line with the emergence of competitive Fintech technologies such as MoMo, P-2-P lending platforms that may erode traditional banking market which in turn hamper banking profits and stability. The findings are consistent with the conclusion made by Allen and Gale (2004), that is, competition is good for banking efficiency, but bad for financial stability. In panel (e) a delayed positive response to competition takes place following the Fintech risk shock and peaks after 3 years and subsides to zero over the 10- year period. Surprisingly in panel (a) ROA does not respond to a Fintech risk shock consistent with the findings made by (Mhlongo, Kunjal and Muzindutsi, 2025). Market power (BI) responds positively to a shock in Fintech risk. This result is consistent with Hypothesis 1a.
- Asymmetric effects of fintech risk on bank performance.
In panel (a) an increase in Fintech risk has a positive and significant effect on ROA, whereas a fintech risk deceleration is not significant; confirming that fintech risk changes exhibit an asymmetric effect on ROA. Likewise, fintech risk effect on the Z-score or bank stability is asymmetric, with positive fintech risk shock exerting an insignificant positive effect on stability, whereas the negative shock exerts a significant negative effect. The negative response to the decrease in fintech risk dies out after 2.5 years; suggesting that slowing down the technological development affects bank stability in the short term. This corroborates Obiowo (2024) who suggests that investments in financial innovation foster bank stability.
In Figure 5 (b) , ROE response to positive shocks in Fintech risk is positive and significant. Likewise, in Figure 6 (b) ROE responds negatively to a negative shock in Fintech risk , establishing Fintech risk symmetric effect on ROE. The evidence lands support to Hypothesis 2 , where it is conjectured that when banks take on risk in the form of Fintech investments, they gain market power, which in turn increases performance.
CTI does not respond to positive Fintech risk shock, but the response to a negative shock is negative and short-lived. This indicates that the benefits that come with Fintech projects far outweigh their costs . This is a clear indication that Fintech projects have a positive net present value, subsequently enhancing banks’ equity (Emery, Finnerty and Stowe, 2017). Moreover, the results are in part owed to process innovation theory, which posits that technological breakthroughs in banking service provision minimize business costs (Niehans, 1983). In Figure 6(e) a negative shock in Fintech risk increases market power whereas in Figure 5(e) an increase in Fintech risk reduces market power. This indicates that when non banking firms play into the banking space, it reduces banks’ market power.
Overall, disaggregating Fintech risk shock into its positive and negative components leads to further insights that aggregate shock cannot uncover. Finally, it is important to note that the constructed Fintech risk measure is multi-dimensional in nature, capturing both the negative and positive aspects of Fintech. The evidence suggests that banks' investments in financial innovation technologies serve as a strategic response to mitigate the adverse effects associated with Fintech developments, including heightened competitive pressures.
4.2.1. Diagnostic Tests: Stability of the Panel VAR Model
It is crucial to assess the stability of the panel VAR model. The panel VAR must have an infinite order moving average representation and be invertible in order to meet the stability condition. The stability of the panel VAR is established by using the modulus of each estimated model eigenvalue. The model is said to be stable if each modulus in the companion matrices is strictly less than one (Lütkepohl, 2005) . The graphs in Figure 7 illustrate that the estimated panel VAR models are stable as every eigenvalue modulus is strictly less than one4.
4.2.2. Robustness Check: Granger Non-Causality Test
The Dumitrescu and Hurlin (DH) Granger non-causality test is particularly suitable for addressing econometric challenges commonly associated with macro panels, including issues of stationarity and cross-sectional dependence (Lopez and Weber, 2017). As reported in Table 6, the results indicate that, aggregate Fintech risk significantly predict variations in only ROE and market competition. These findings support Hypothesis 1b, which posits that Fintech risk exerts a positive influence on bank performance. Similarly, the observed relationship between Fintech and competition is consistent with Hypothesis 1a, which suggests that financial innovation contributes to the diffusion of competitive pressures within the banking sector. Furthermore, in the CTI model, competition is found to be a significant predictor of cost-to-income ratios. Positive shocks to Fintech risk are also found to be predictive of ROA and ROE, while negative shocks explain variations in both performance and competition indicators. Notably, reverse causality is not supported in any of the models estimated—whether for aggregate, positive, or negative Fintech shocks—implying that neither competition nor performance metrics Granger-cause Fintech risk. Additionally, aggregate Fintech risk does not explain much of the variation in ROA, CTI, and Z-score. The results are in parallel with what is evidenced in Mhlongo, Kunjal and Muzindutsi (2025). This may be due to the fact that some of the Fintech developments have not yet filtered through some bank performance measures.
5. Conclusions
This study employs a Panel Vector Autoregression (Panel VAR) approach using bank-level data from 11 African economies over a semi-annual period spanning 2004 to 2020. The analysis reveals that fintech-related risk exerts a marginal influence on various bank performance indicators across the region. However, when decomposing the aggregate fintech risk shock into its positive and negative components, the results indicate that positive fintech shocks are associated with improvements in Return on Assets (ROA), Return on Equity (ROE), and bank stability (Z-Score), with asymmetric effects observed particularly on ROA and Z-score. This suggests that disaggregating fintech risk shocks provides deeper insight, as the aggregated measure may obscure the complex effects on the response variables.
Furthermore, the findings imply that for the sampled countries, the benefits of financial innovation outweigh the associated investment costs. Specifically, fintech-related financial risk shocks appear to have minimal discernible effects on the Cost-to-Income Ratio (CTI), suggesting that fintech investments do not substantially compromise operational efficiency. Consequently, the study supports the broader inference that banks operating within African markets should actively pursue technological advancements.
The fintech risk indicator utilized in this study is comprehensive, capturing bank-specific, social, economic, financial, and global dimensions pertinent to the African context. The evidence also underscores the importance of financial innovation for fostering competition, enabling market expansion, and contributing to financial stability. These results align with the study’s central hypothesis regarding the positive role of fintech in enhancing bank performance and resilience through competition, despite the negative fintech externalities.
In light of these findings, it is recommended that banks adopt a proactive stance toward fintech adoption, capitalizing on the benefits such technologies offer. At the same time, to ensure regulatory compliance and mitigate potential risks, banks should implement robust oversight mechanisms for their fintech partnerships. This includes establishing dedicated teams of process engineers tasked with ensuring adherence to regulatory frameworks, both within the banks themselves and among their fintech collaborators
Author Contributions
This study was carried out by Ms. Q. M Mabe under the supervision of Prof. B. D Simo-Kengne “Conceptualization, Ms. Q M Mabe and Prof. B. D Simo-Kengne.; methodology, Prof. B. D Simo-Kengne.; software, Ms. Q M Mabe.; validation, Ms. Q M Mabe and Prof. B. D Simo-Kengne ; formal analysis, Ms. Q M Mabe.; investigation, Ms. Q M Mabe.; resources, Ms. Q M Mabe..; data curation, Ms. Q M Mabe.; writing— Ms. Q M Mabe.; review— B. D Simo-Kengne; visualization, Ms. Q M Mabe.; supervision, B. D Simo-Kengne.; project administration, B. D Simo-Kengne . All authors have read and agreed to the published version of the manuscriptAuthorship must be limited to those who have contributed substantially to the work reported.
Funding
This research received no external funding
Institutional Review Board Statement
Not applicable.
Informed Consent Statement
Not applicable
Data Availability Statement
The data of the study was obtained from Thompson and Reuters, and International Financial Statistics.
Acknowledgments
This paper has been presented at a Wits Global Fintech Conference (14-15 November 2024) and we are thankful to all the speakers who have made recommendations to improve on the paper. We are also thankful to Prof. Renee van Eyden for her assistance at the data analysis stage.
Conflicts of Interest
The authors declare no conflicts of interest.
Abbreviations
The following abbreviations are used in this manuscript:
| ATMs | Automated Teller Machines |
| CFI | Co-operative Financial Institution |
| CTI | Cost to Income Ratio |
| FFSI | Fintech Financial Stress Indicator |
| Fintech | Financial Technology |
| MoMo | Mobile Money |
| ROA | Return on Assets |
| ROE | Return on Equity |
| PVAR | Panel Vector-Autoregressive process |
Appendix A

Table A1.
Dynamic Panel VAR Results of joint fintech risk shock.
| Bank Performance Metrics | ||||
| GMM Estimates | ||||
| ROA | ROE | CTI | Z-Score | |
| ROA(t-1) | -0.0601 | |||
| (0.106) | ||||
| Fintech(t-1) | -0.00000784 | -0.000709* | -0.446 | -0.00715 |
| (0.0000346) | (0.000377) | (0.306) | (0.00544) | |
| BI(t-1) | 0.000510 | -0.0150 | -2.803* | 0.0799 |
| (0.00188) | (0.0117) | (1.527) | (0.146) | |
| ROE(t-1) | 0.125 | |||
| (0.106) | ||||
| CTI(t-1) | -0.365** | |||
| (0.183) | ||||
| Z-Score(t-1) | 0.473*** | |||
| (0.0425) | ||||
| GMM Estimates Competition |
||||
| ROA(t-1) | -0.0388 | |||
| (0.0601) | ||||
| Fintech(t-1) | 0.00111* | 0.00110* | 0.00111* | 0.00113* |
| (0.000599) | (0.000598) | (0.000599) | (0.000609) | |
| BI(t-1) | 0.809*** | 0.809*** | 0.809*** | 0.809*** |
| (0.124) | (0.124) | (0.124) | (0.123) | |
| ROE(t-1) | -0.0147 | |||
| (0.0172) | ||||
| CTI(t-1) | -0.00000172 | |||
| (0.00000921) | ||||
| Z-Score(t-1) | 0.00242 | |||
| (0.00664) | ||||
| N | 1312 | 1312 | 1312 | 1312 |
Notes: The panel VAR is estimated by GMM. The robust standard errors are in parentheses. * p < 0.10, ** p < 0.0.
Table A2.
Dynamic Panel VAR Results of a positive fintech risk shock.
| Bank Performance Metrics GMM Estimates |
||||
| ROA | ROE | CTI | Z-score | |
| ROA(t-1) | -0.0755 | |||
| (0.0826) | ||||
| FintechP(t-1) | 0.0000515* | 0.000657** | -0.00104 | 0.00520 |
| (0.0000204) | (0.000213) | (0.0135) | (0.00464) | |
| BI(t-1) | 0.000161 | -0.0202 | -2.826 | -0.00145 |
| (0.00171) | (0.0128) | (2.031) | (0.122) | |
| ROE(t-1) | 0.0899 | |||
| (0.0551) | ||||
| CTI(t-1) | -0.359* | |||
| (0.179) | ||||
| Z-score(t-1) | 0.443*** | |||
| (0.0404) | ||||
| Competition GMM Estimates |
||||
| ROA(t-1) | -0.00698 | |||
| (0.0268) | ||||
| FintechP(t-1) | -0.000373 | -0.000367 | -0.000373 | -0.000447 |
| (0.000360) | (0.000360) | (0.000360) | (0.000362) | |
| BI(t-1) | 0.802*** | 0.802*** | 0.802*** | 0.801*** |
| (0.103) | (0.103) | (0.103) | (0.103) | |
| ROE(t-1) | -0.00898 | |||
| (0.00877) | ||||
| CTI(t-1) | 0.00000735 | |||
| (0.0000126) | ||||
| Z-score(t-1) | 0.00921 | |||
| (0.00748) | ||||
| N | 1312 | 1312 | 1310 | 1312 |
Standard errors in parentheses. * p < 0.05, ** p < 0.01, *** p < 0.001.
Table A3.
Dynamic Panel VAR Results of a negative fintech risk shock.
| Performance Metrics GMM Estimates |
||||
| ROA | ROE | CTI | Z-Score | |
| ROA(t-1) | -0.0736 | |||
| (0.0819) | ||||
| FintechN(t-1) | -0.00187 | -0.0432** | -14.04 | -0.445*** |
| (0.000994) | (0.0132) | (9.836) | (0.132) | |
| BI(t-1) | -0.000573 | -0.0371 | -8.443 | -0.168 |
| (0.00200) | (0.0202) | (6.721) | (0.211) | |
| ROE(t-1) | 0.105 | |||
| (0.0661) | ||||
| CTI(t-1) | -0.333 | |||
| (0.178) | ||||
| Z-Score(t-1) | 0.372*** | |||
| Competition GMM Estimates |
||||
| ROA(t-1) | -0.0504 | |||
| (0.0820) | ||||
| FintechN(t-1) | 0.0478* | 0.0468* | 0.0469* | 0.0565* |
| (0.0191) | (0.0187) | (0.0187) | (0.0220) | |
| BI(t-1) | 0.822*** | 0.821*** | 0.821*** | 0.822*** |
| (0.106) | (0.106) | (0.106) | (0.107) | |
| ROE(t-1) | -0.0247 | |||
| (0.0226) | ||||
| CTI(t-1) | -0.0000812 | |||
| (0.0000689) | ||||
| Z-Score(t-1) | 0.0182 | |||
| (0.00991) | ||||
| N | 1312 | 1312 | 1310 | 1312 |
Standard errors in parentheses. * p < 0.05, ** p < 0.01, *** p < 0.001.
| 1 | Banking Competition |
| 2 |
is the characteristic polynomial, and its roots are the eigenvalues. |
| 3 | The eigen vectors are linearly dependent, as for every computed eigenvalue, , we need to solve for non-zero such that |
| 4 | Where and .Hence the null hypothesis of unit root becomes . Moreover, , subsequently substituting back into Equation 17 one gets: as in Equation 16. |
| 5 | The models are also stable for positive and negative fintech risk shocks. |
References
- Ahmed, O. N. and Wamugo, L. (2018) ‘Financial Innovation and the Performance of Commercial Banks in Kenya’, International Journal of Current Aspects in Finance., IV(Ii), pp. 133–147.
- Allen, F. and Gale, D. (2004) ‘Competition and Financial Stability’, Journal of Money, Credit and Banking., 36(3), pp. 453–480.
- Anarigide, D. A., Issahaku, H. and Dary, S. K. (2023) ‘Drivers of financial innovation in sub-Saharan Africa’, SN Business & Economics. Springer International Publishing, 3(9), pp. 1–21. [CrossRef]
- Andrews, D. W. K. and Lu, B. (2001) ‘Consistent model and moment selection procedures for GMM estimation with application to dynamic panel data models’, Journal of Econometrics, 101, pp. 123–164.
- Andries, A. M. and Capraru, B. (2014) ‘The nexus between competition and efficiency : The European banking industries experience’, International Business Review, 23, pp. 566–579. [CrossRef]
- Ashiru, O., Balogun, G. and Paseda, O. (2023) ‘Financial innovation and bank financial performance : Evidence from Nigerian deposit money banks’, Research in Globalization. Elsevier Ltd, 6(December 2022), p. 100120. [CrossRef]
- Basel Committee on Banking Supervision (2024) Digitalisation of finance.
- Bejar, P., Ishi, K, Komatsuzaki, T, Shibata, I, and Sin, J. (2022) ‘Can Fintech Foster Competition in the Banking System in Latin America and the Caribbean ? ’, Latin American Journal of Central Banking. Elsevier B.V., 3(2), p. 100061. [CrossRef]
- Benchimol, J. and Bozou, C. (2024) ‘Desirable banking competition and stability’, Journal of Financial Stability. Elsevier B.V., 73(April), p. 101266. [CrossRef]
- Berryman, A. A. (1992) ‘The Origins and Evolution of Predator-Prey Theory’, Ecology, 73(5), pp. 1530–1535.
- Browne, J. (2019) Nigeria’s banking oligopolies : Case for review, Nigerian Tribune.
- Bu, Y, Du, X, Li, H, Yu, X, and Wang, Y. (2023) ‘Research on the FinTech risk early warning based on the MS-VAR model : An empirical analysis in China’, Global Finance Journal, 58(April), pp. 1–18. [CrossRef]
- Canova, F. and Ciccarelli, M. (2013) 'Panel Vector Autoregressive Models: A Survey.' Working Paper No 1507.
- Chassang, S. and Ortner, J. (2023) ‘Regulating Collusion’, Annual Review of Economics, 15, pp. 177–204.
- Chipeta, C. and Mapela, L. (2024) The effects of Basel III capital and liquidity. South African Reserve Bank Working Paper Series-WP/24/17.
- Dong, Q., Du, Q. and Min, A. (2024) ‘Interplay between oil prices , country risks , and stock returns in the context of global conflict : A PVAR approach’, Research in International Business and Finance. Elsevier B.V., 72(PB), p. 102545. [CrossRef]
- Emery, D. R., Finnerty, J. D. and Stowe, J. D. (2017) Corporate Financial Management. 5th Edition. Morristown, NJ: Wohl Publishing.
- Fang, J., Lau, C.M., Lu, Z., Tan, Y., and Zhang, H. (2019) ‘Bank performance in China : A Perspective from Bank efficiency , risk-taking and market competition’, Pacific-Basin Finance Journal. Elsevier, 56(June), pp. 290–309. [CrossRef]
- Githinji, M. W. (2024) ‘Bank-Specific Charecteristics, Bank Concentration and Financial Distress of Commercial Banks in Kenya.’, International Academic Journal of Economics and Finance, 4(3), pp. 313–342.
- Greene, W. H. (2002) Econometric Analysis. 5th Edition. Prentice Hall.
- De Hoyos, R. E. and Sarafidis, V. (2006) ‘Testing for cross-sectional dependence in panel data models’, The Stata Journal, 6(Number 4), pp. 482–496.
- Im, K. S., Pesaran, M. H. and Shin, Y. (2003) ‘Testing for unit roots in heterogeneous panels’, Journal of Econometrics, 115(9526), pp. 53–74. [CrossRef]
- Jia, K., He, Y. and Mohsin, M. (2023) ‘Digital financial and banking competition network : Evidence from China’, Frontiers in Psychology, (January), pp. 1–11. [CrossRef]
- Khalaf, B. A., Awad, A. B., Ahmed, O., and Gharios, R. (2023) ‘The Role of FinTech in Determining the Performance of Banks : The Case of Middle East & North Africa ( MENA ) Region’, International Journal of Membrane Science and Technology, 10(3), pp. 1525–1.
- KPMG (2022) Pulse of Fintech H2’21. Available at: https://assets.kpmg.com/content/dam/kpmg/xx/pdf/2022/02/pulse-of-fintech-h2-21.pdf.
- Kulu, E., Opoku, A., Gbolonyo, E., Anthony, M., and Kodwo, T. (2022) ‘ Mobile money transactions and banking sector performance in Ghana’, Heliyon. The Author(s), 8(May), p. e10761. [CrossRef]
- Liu, Z., Feng, Q. and Li, H. (2024) ‘Digital finance , bank competition shocks and operational efficiency of local commercial banks in Western China.’, Pacific-Basin Finance Journal. Elsevier B.V., 85(April 2024), p. 102377. [CrossRef]
- Lopez, L. and Weber, S. (2017) ‘Testing for Granger causality in panel data’, The Stata Journal, 17(4), pp. 972–984. [CrossRef]
- Lütkepohl, H. (2005) New Introduction to Multiple Time Series Analysis. Springer.
- Mabe, Q. M. and Simo-kengne, B. D. (2023) ‘Relative Importance of Time , Country and Bank-specific Effects on Bank Performance : A Three-Level Hierarchical Approach’, African Review of Economics and Finance, 15, pp. 1–25.
- Mas-Colell, A., Whinston, M. D. and Green, J. R. (1995) Microeconomic Theory. Oxford University Press.
- Mhlongo, N., Kunjal, D. and Muzindutsi, P.-F. (2025) ‘The influence of Fintech innovations on bank competition and performance in South Africa’, Modern Finance, 3(2020), pp. 1–12.
- Murinde, V., Rizopoulos, E. and Zachariadis, M. (2022) ‘International Review of Financial Analysis The impact of the FinTech revolution on the future of banking : Opportunities and risks’, International Review of Financial Analysis. Elsevier Inc., 81(June 2021), p. 102103. [CrossRef]
- Mushonga, M., Arun, T. G. and Marwa, N. W. (2018) ‘Technological Forecasting & Social Change Drivers , inhibitors and the future of co-operative financial institutions : A Delphi study on South African perspective’, Technological Forecasting & Social Change. Elsevier, 133(April), pp. 254–268. [CrossRef]
- Nekesa, S. M. and Olweny, T. (2012) ‘Effect of Financial Innovation on Financial Performance: A Case Study of Deposit-Taking Savings and Credit Cooperative Societies in Kajiado County’, International Journal of Social and Information Technology, ISSN 2412=.
- Niehans, J. (1983) ‘Financial Innovation, Multinational Banking and Monetary Policy.’, Journal of Banking and Finance, 7, pp. 537–551.
- Okapor, C. (2023) 'Top Fintech Companies in Africa'., Business Insider Africa.
- Oriji, O., Shonibare, M. A, Daraojimba, R.E, Abitoye., O., and Daraojimbe, A. (2023) ‘Financial Technology Evolution in Africa: A Comprehensive Review of Legal Frameworks and Implications for AI-Driven Financial Services.’, International Journal of Management and Entrepreneurship Research, 5(12), pp. 929–951. [CrossRef]
- Petersen, F. (2019) SA’s banking oligopoly and the forex cartel, IOL. Available at: https://www.iol.co.za/sundayindependent/analysis/sas-banking-oligopoly-and-the-forex-cartel-2654b258-1ebc-464e-9174-41352bc7ce68 (Accessed: 19 February 2025).
- Silber, W. L. (1983) ‘The Process of Financial’, American Economic Association, 73(2), pp. 89–95.
- Simo-kengne, B. D., Gupta, R. and Bittencourt, M. (2013) ‘The Impact of House Prices on Consumption in South Africa : Evidence from Provincial-Level Panel VARs ’, Housing Studies, (September), pp. 37–41. [CrossRef]
- Stata Corp (2023) Stata Statistical Software: Release 18., STATA Reference Manual. College Station, TX: StataCorp LLC.
- Stigler, G. J. (1964) ‘A Theory of Oligopoly’, Journal of Political Economy, 72(1), pp. 44–61.
- Walyaula, A. (2007) List Of Fintech Startups In Kenya, Kahawa Tungu. Available at: https://kahawatungu.com/list-of-fintech-startups-in-kenya/.
- Wang, W., Feng, C. and Dang, X. (2021) ‘Research on the Impact of Market Competition on the Operating Performance of Rural Commercial Banks — Path Inspection Based’, in Xu, J. et al. (eds) Proceedings of the Fifteenth International Conference on Management Science and Engineering Management. Springer International Publishing, pp. 788–811. [CrossRef]
- Werker, C. (2003) ‘Innovation , market performance , and competition : lessons from a product life cycle model’, Technovation, 23, pp. 281–290. [CrossRef]
- Zamil, R. and Lawson, A. (2022) Gatekeeping the gatekeepers : when big techs and fintechs own banks – benefits , risks and policy options.
- Zhao, J., Li, X., Yu, C., Chen, S, and Lee., C (2022) ‘Riding the FinTech innovation wave : FinTech , patents and bank performance’, Journal of International Money and Finance. Elsevier Ltd, 122, p. 102552. [CrossRef]
- Zhu, K. and Guo, L. (2024) ‘Financial technology , inclusive finance and bank performance’, Finance Research Letters. Elsevier Inc., 60(August 2023), p. 104872. [CrossRef]
- Zribi, W., Boufateh. T, Ben, B., and Urom, C. (2024) ‘Uncertainty shocks, investor sentiment and environmental performance : Novel evidence from a PVAR approach’, International Review of Financial Analysis. Elsevier Inc., 93(July 2023), p. 103196. [CrossRef]
Figure 1.
Average Fintech risk. Note: PCA is used to compute the FFSI. Namibia has the highest Fintech risk. Overall, countries with many banks tend to have the smallest Fintech risk, as positive and negative Fintech risk cancel each other out. Namibia is characterized by banks that contribute positively to Fintech risk.
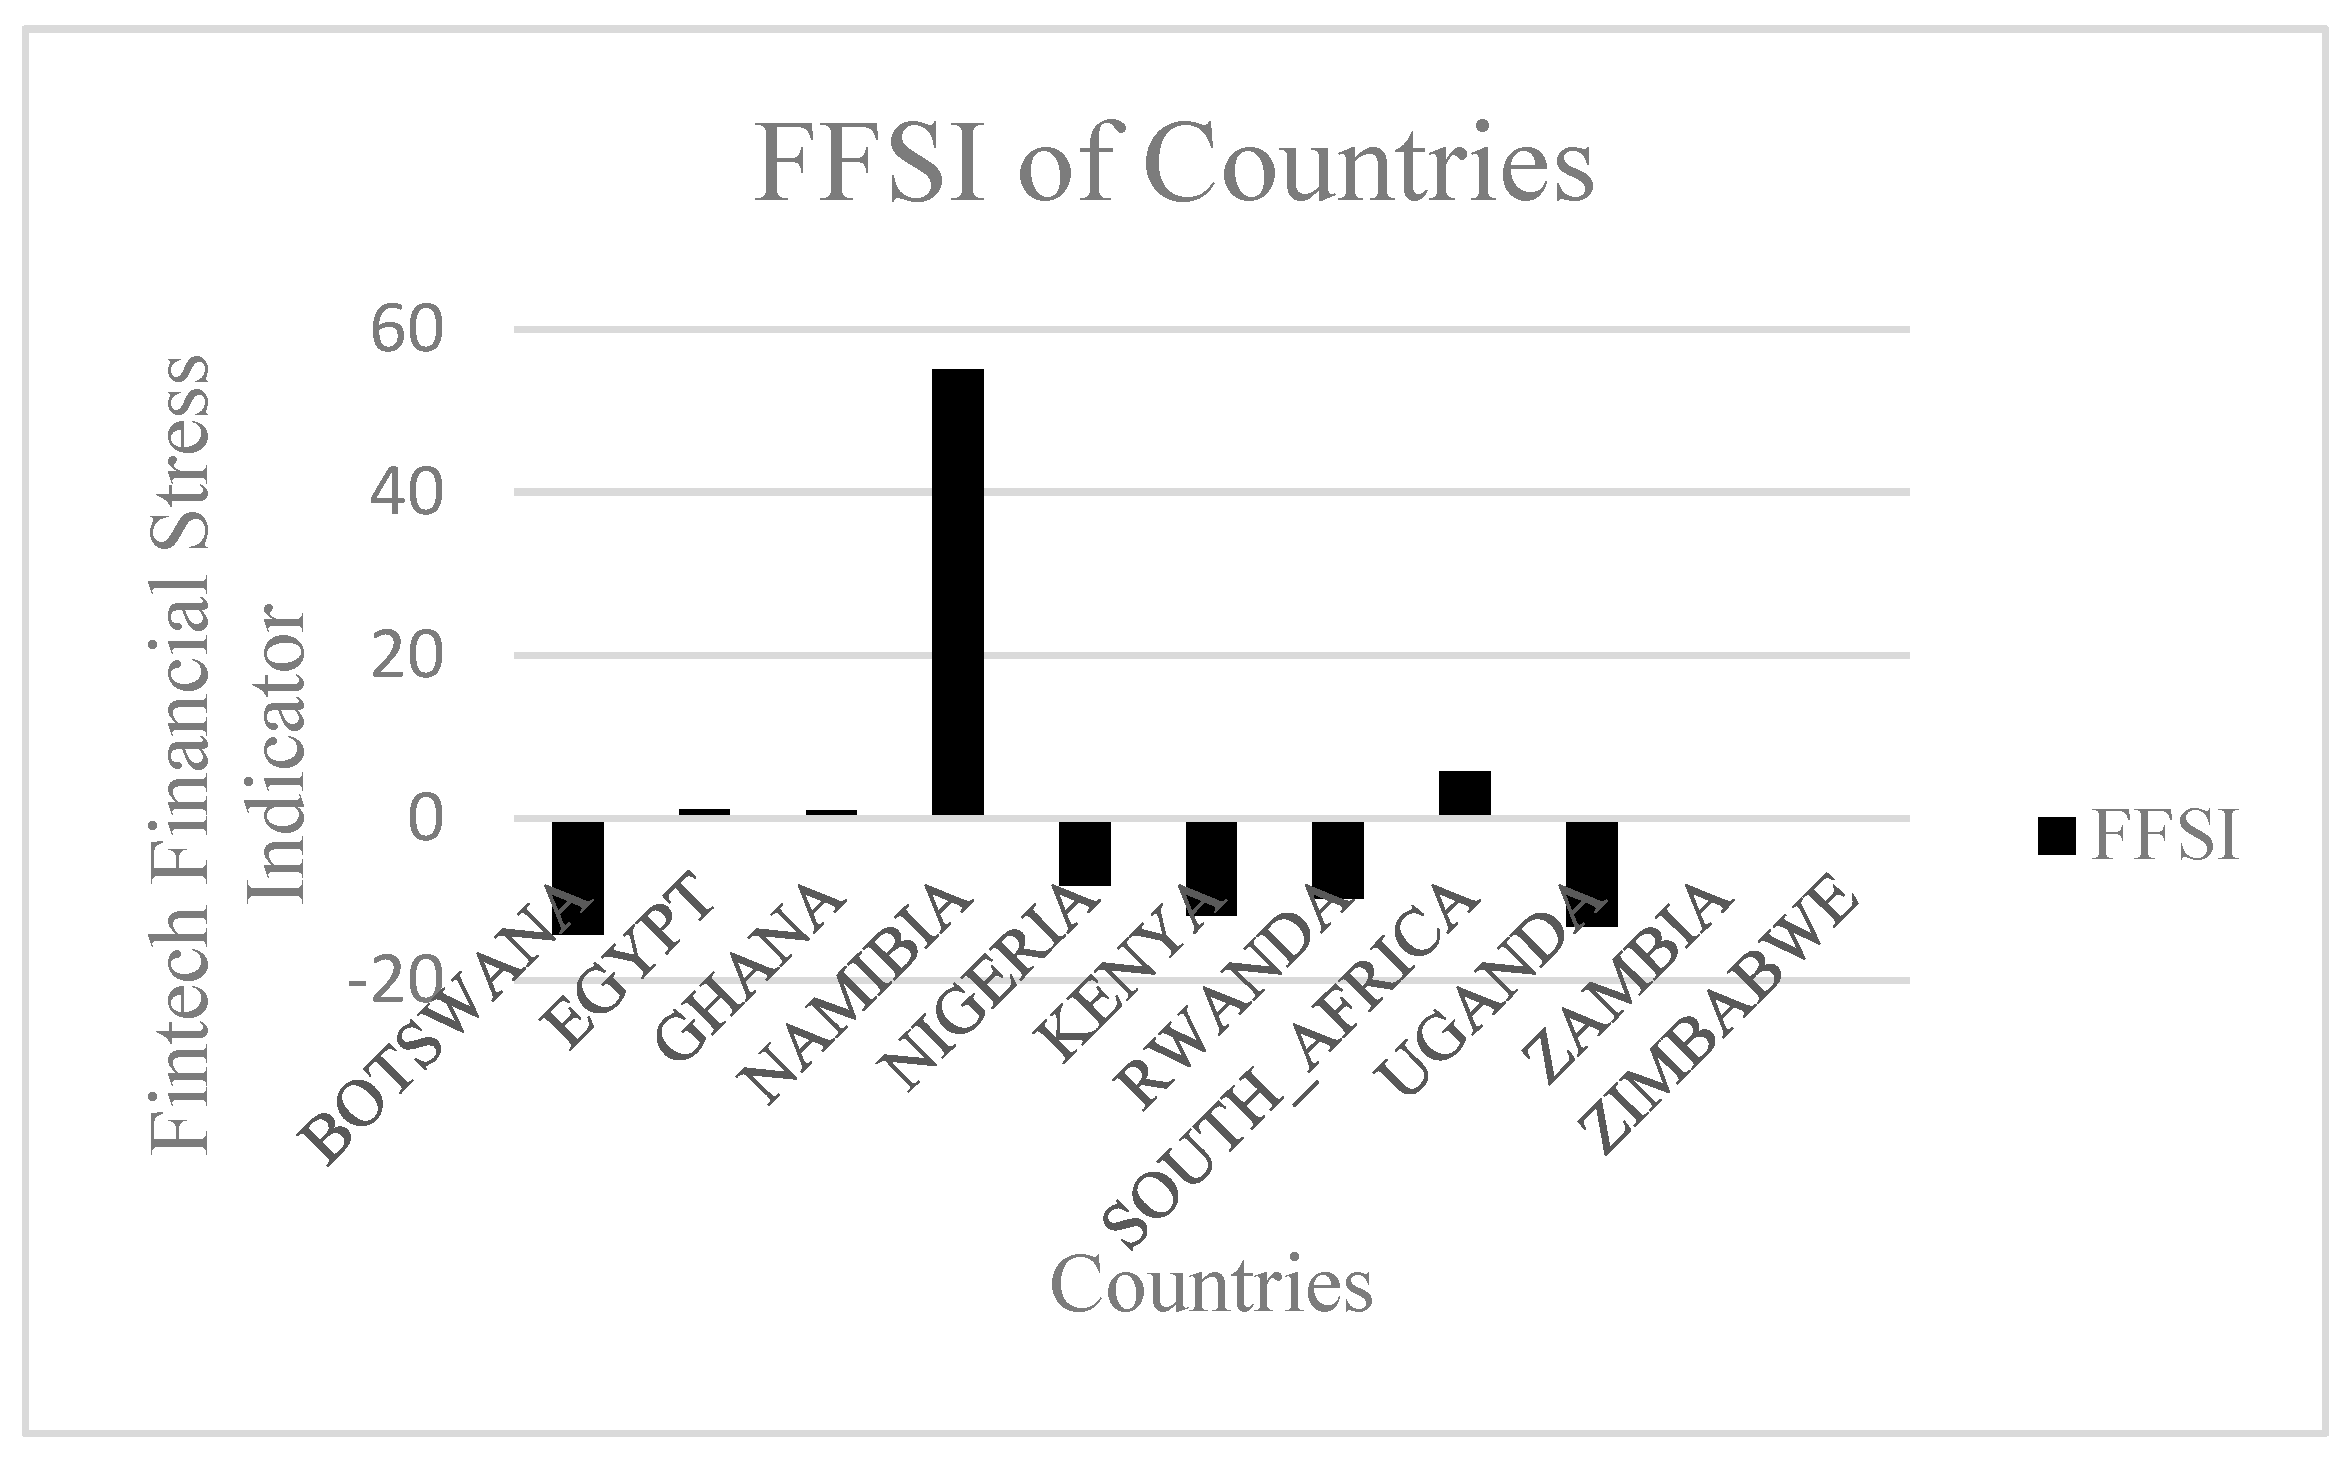
Figure 2.
The linear relationship between performance metrics and FFSI across countries. (a) ROA vs FFSI (b) ROE vs FFSI (c) CTI vs FFSI (d) Z-Score vs FFSI. Note: The linear relationship between all the performance metrics and FFSI is less obvious as scatter plots are clustered around zero with a flat fitted line. However, it remains to undertake robust panel statistical analysis
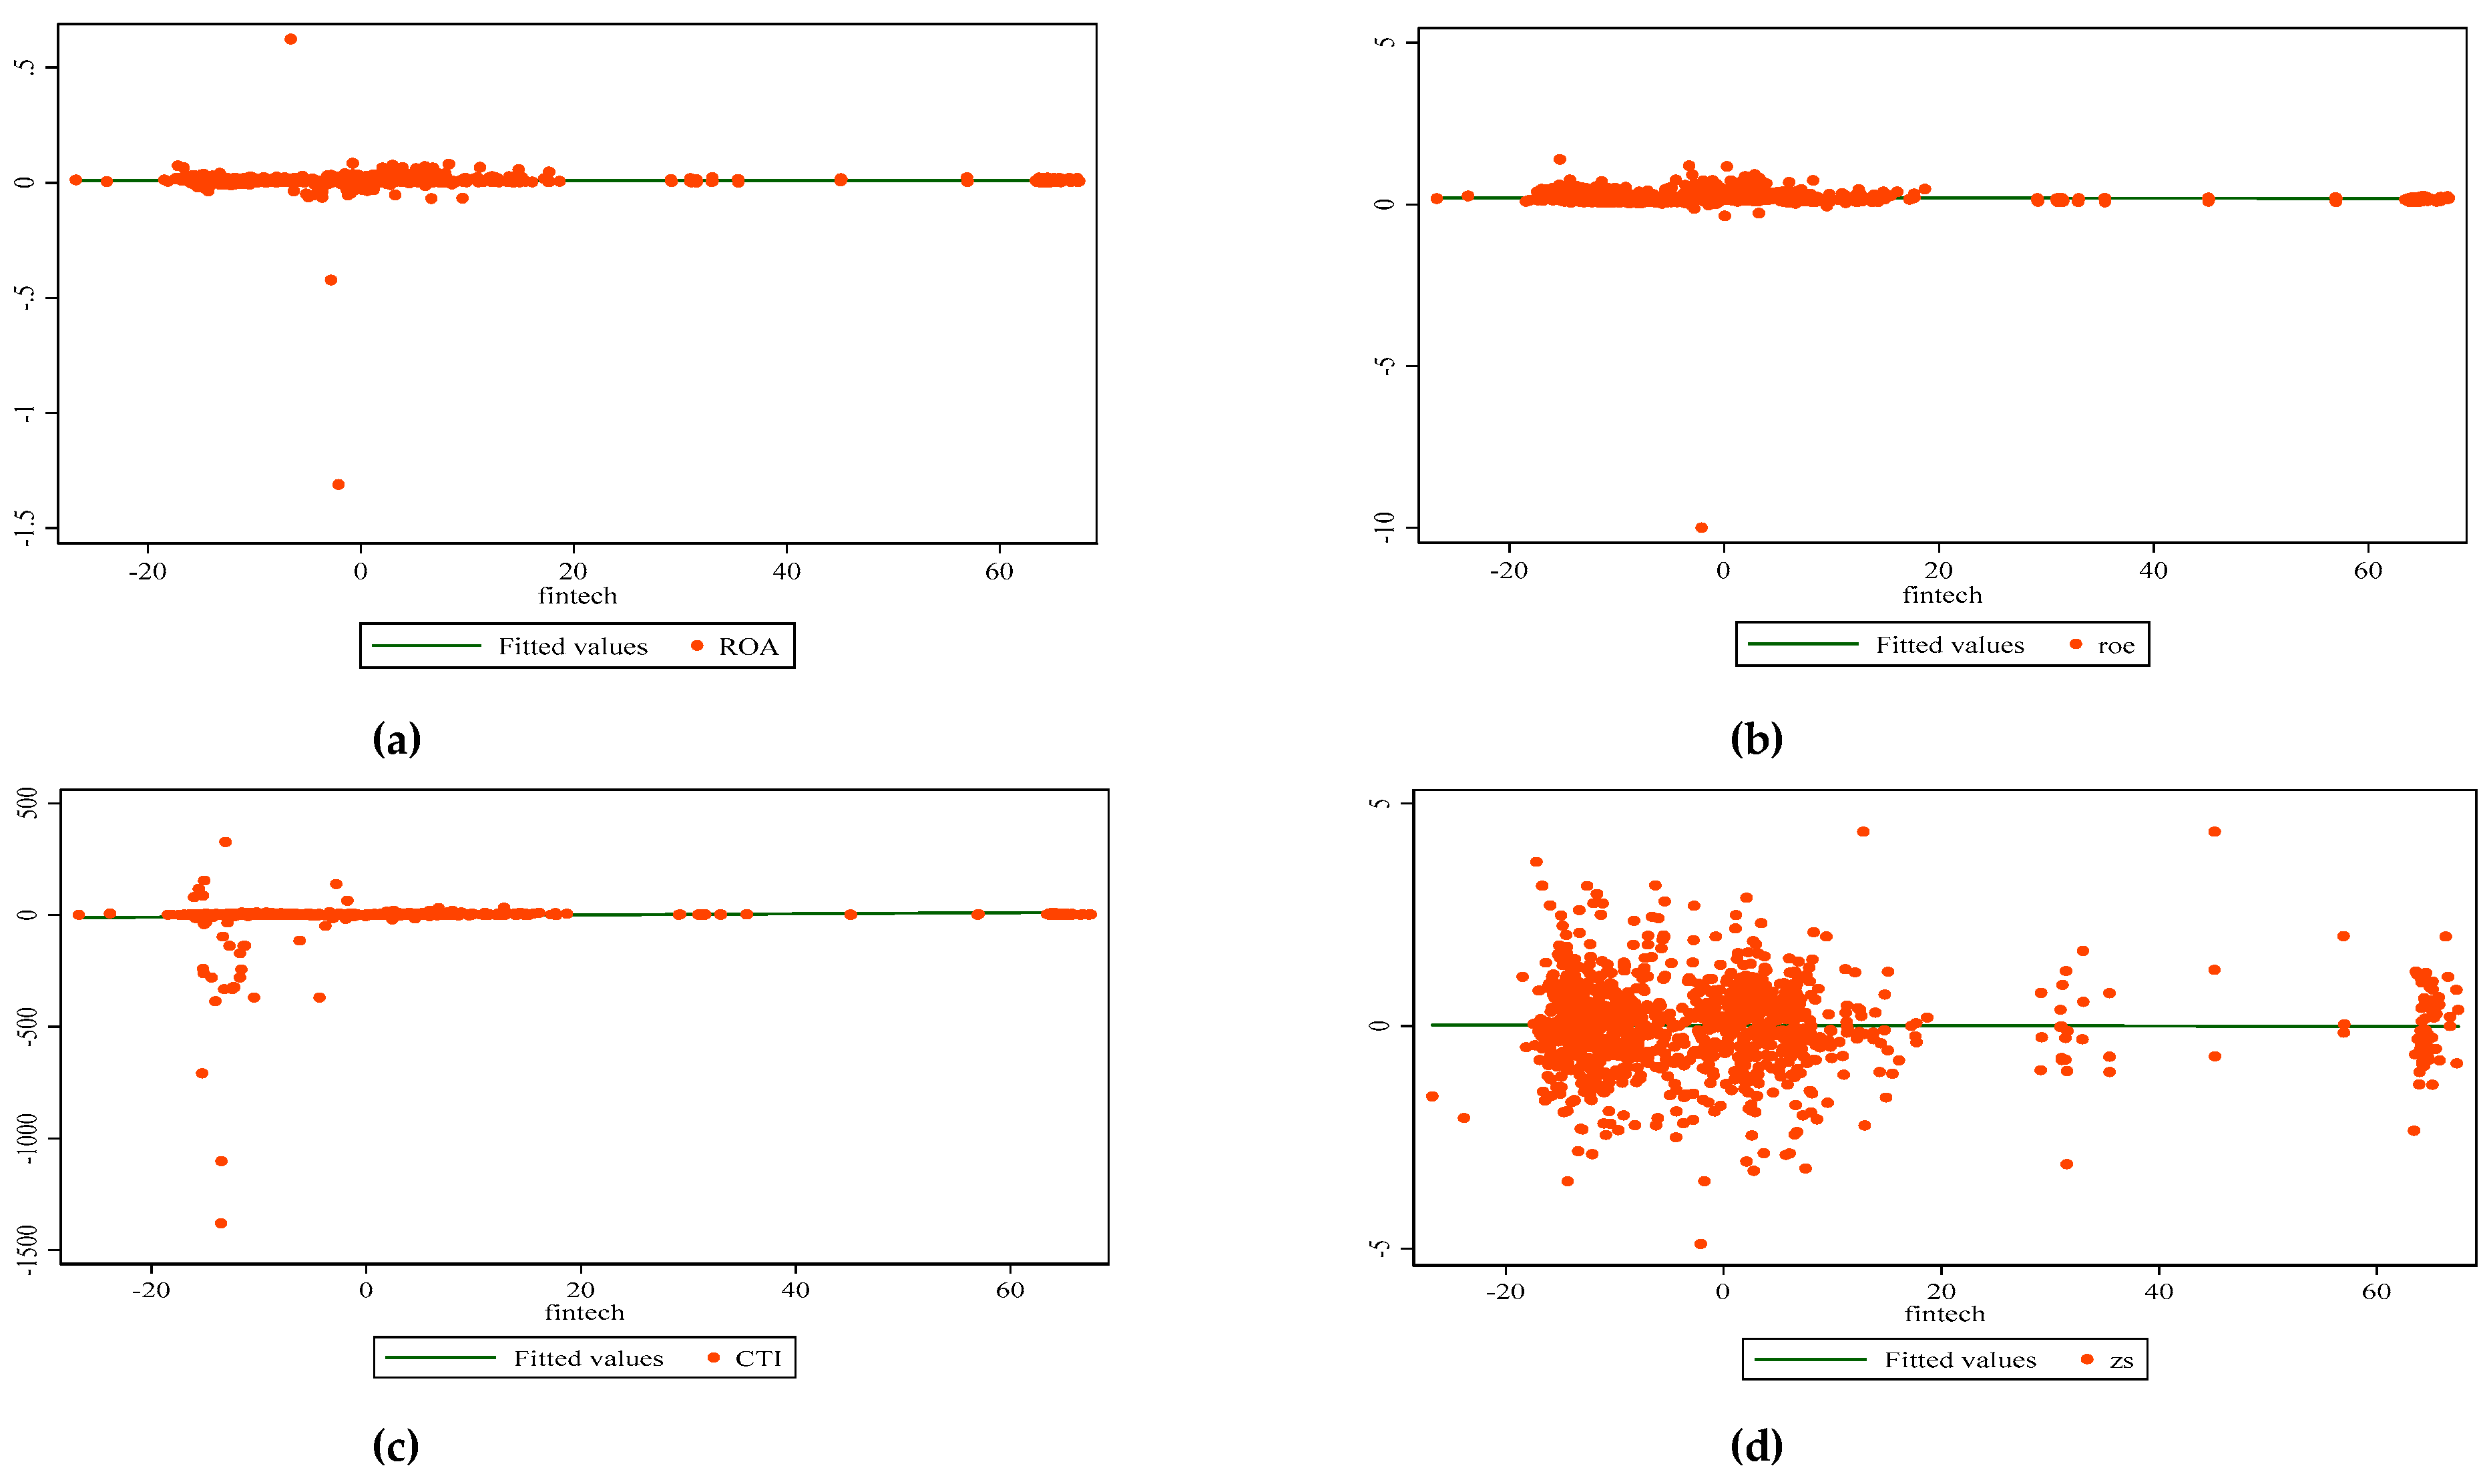
Figure 3.
The linear relationship between competition (BI) and FFSI. Note: There is a slight positive relationship between FFSI and BI, indicating that when banks take on more Fintech risk, they can neutralize competition.
Figure 3.
The linear relationship between competition (BI) and FFSI. Note: There is a slight positive relationship between FFSI and BI, indicating that when banks take on more Fintech risk, they can neutralize competition.
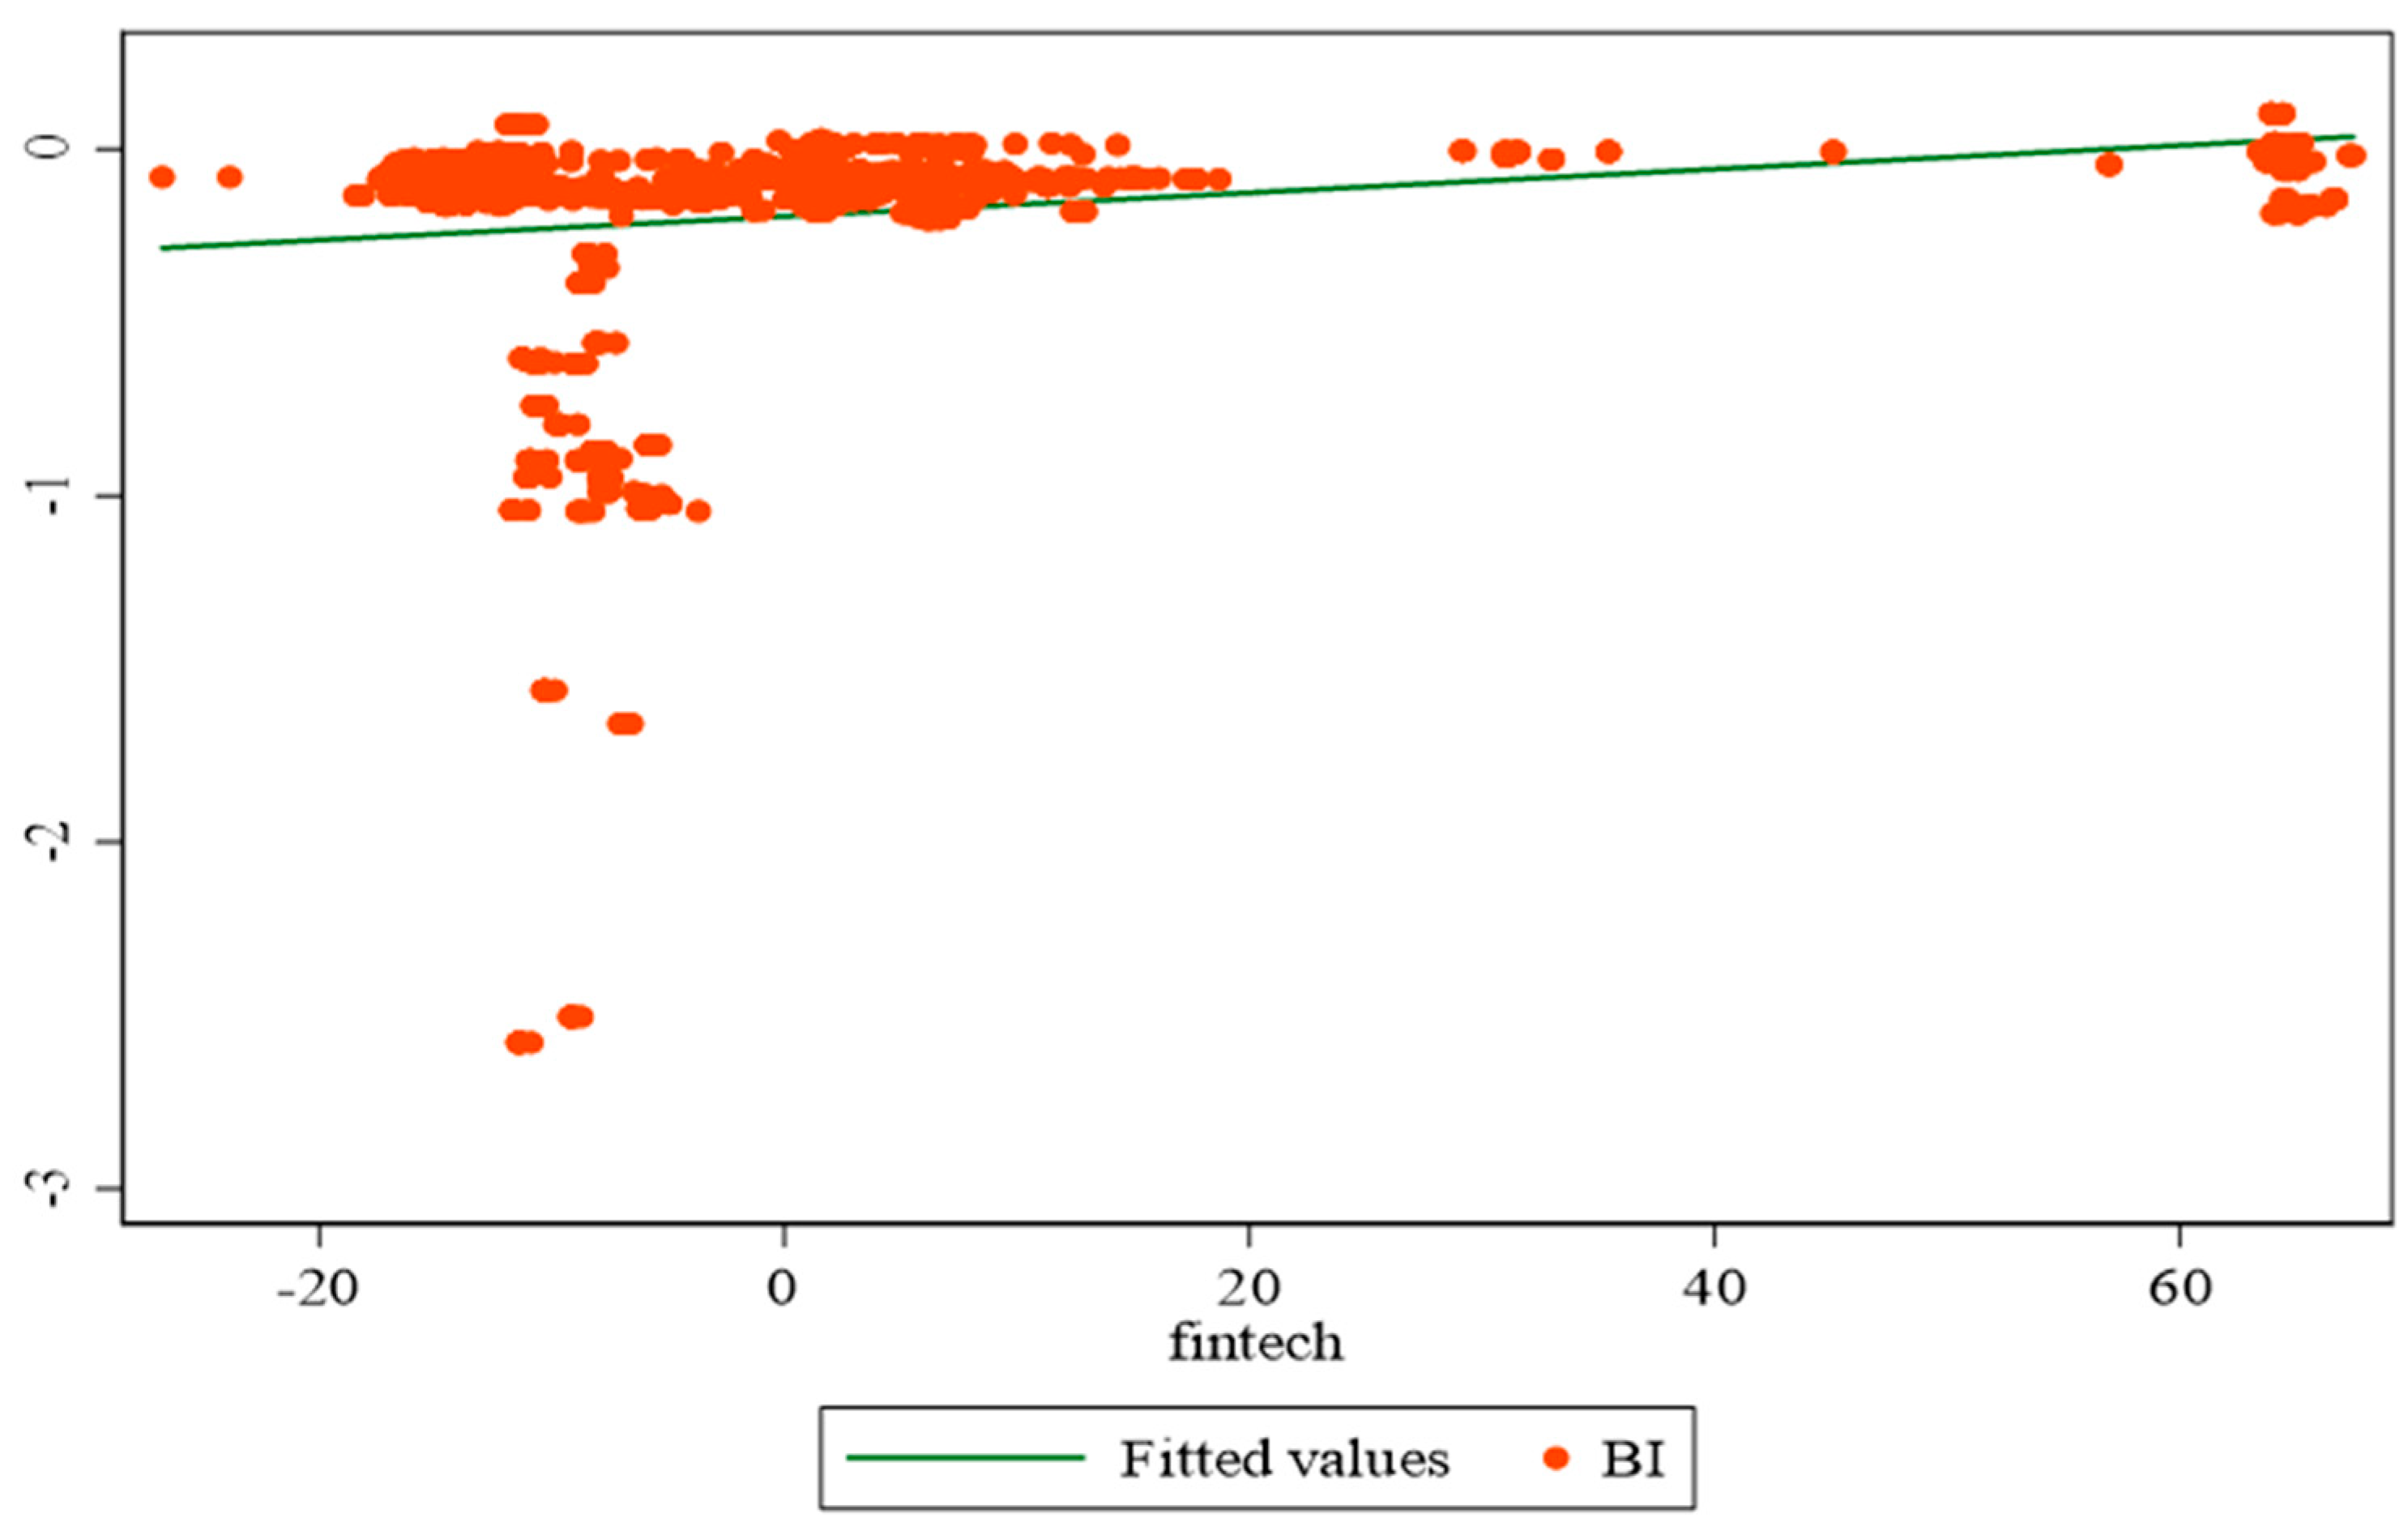
Figure 4.
Impulse responses to orthogonalized one-unit Fintech risk shock. (a) ROA response to Fintech risk shock (b) ROE response to Fintech risk shock (c) CTI response to Fintech risk shock (d) Z-Score response to Fintech risk shock (e) Market power response to Fintech risk shock. Note: Dotted lines show the impulse response of a specific variable following a Fintech risk shock. The shaded area represents 95% confidence band generated by 200 Monte-Carlo replications.
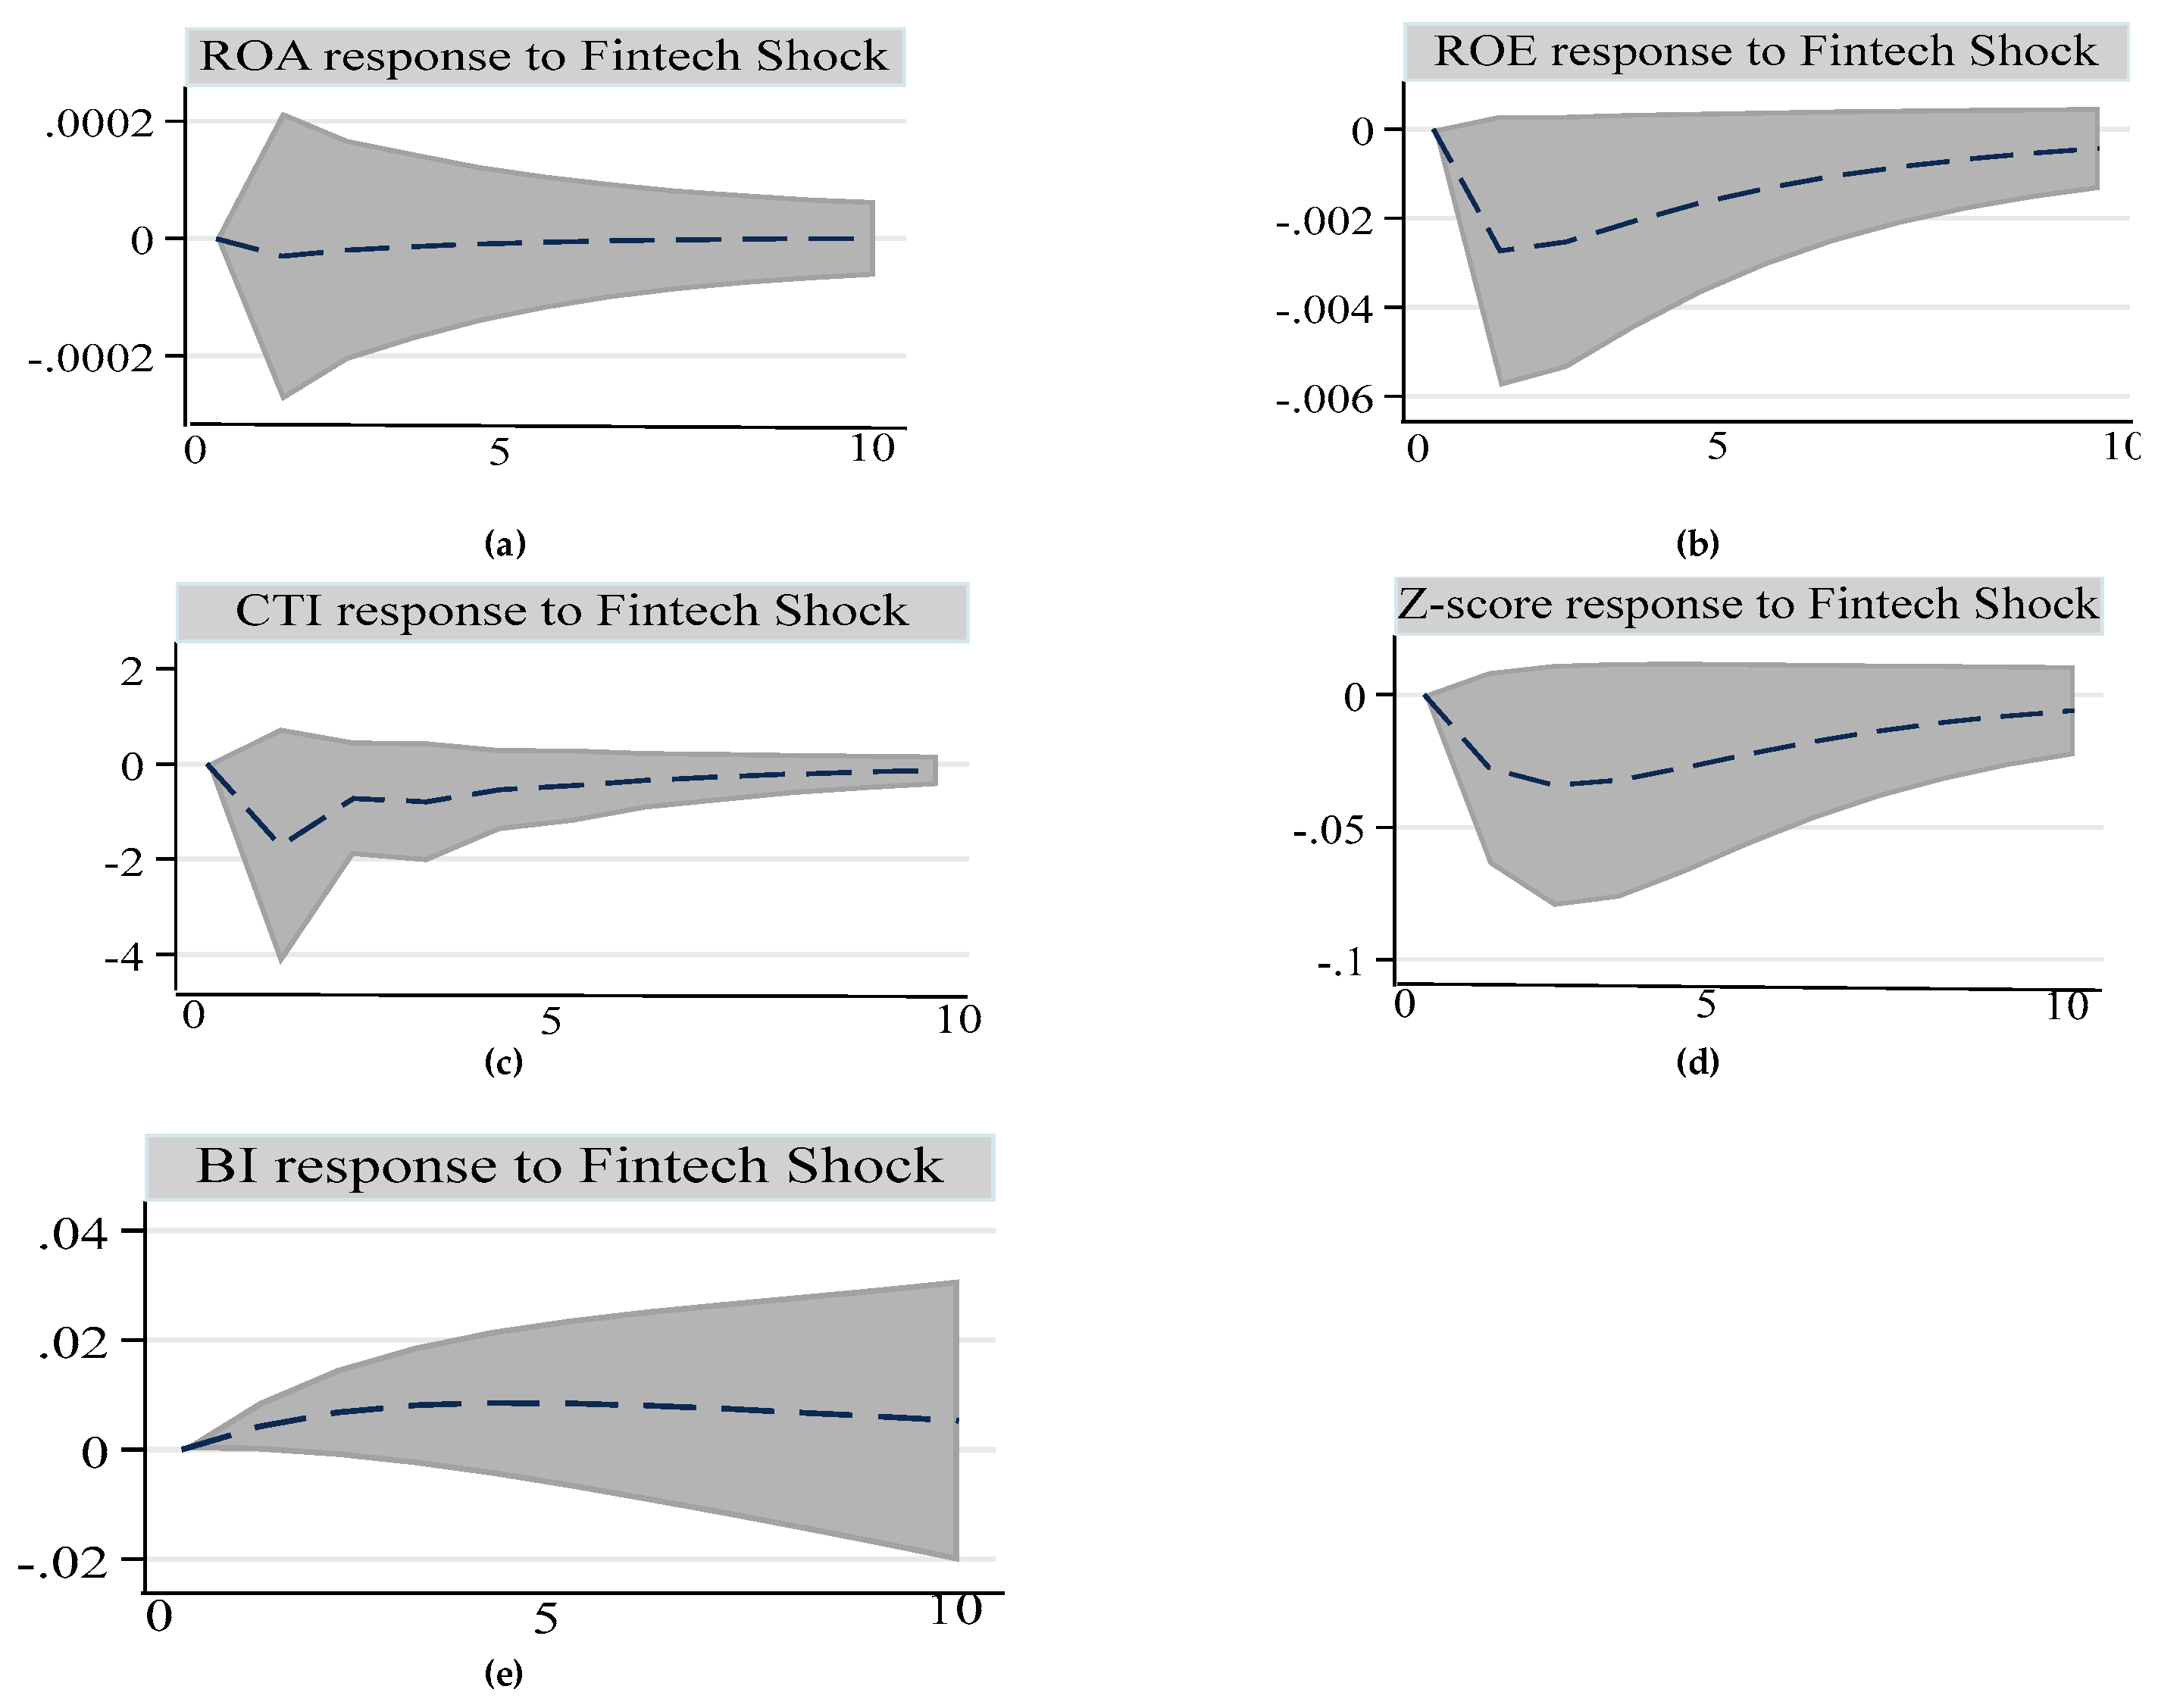
Figure 5.
Impulse responses to orthogonalised one-unit positive fintech risk shock. . (a) ROA response to positive Fintech risk shock (b) ROE response to positive Fintech risk shock (c) CTI response to positive Fintech risk shock (d) Z-Score response to positive Fintech risk shock (e) Market power response to positive Fintech risk shock. Note: Dotted lines show the impulse response of a specific variable following a Fintech risk shock. The shaded area represents 95% confidence band generated by 200 Monte-Carlo replications.
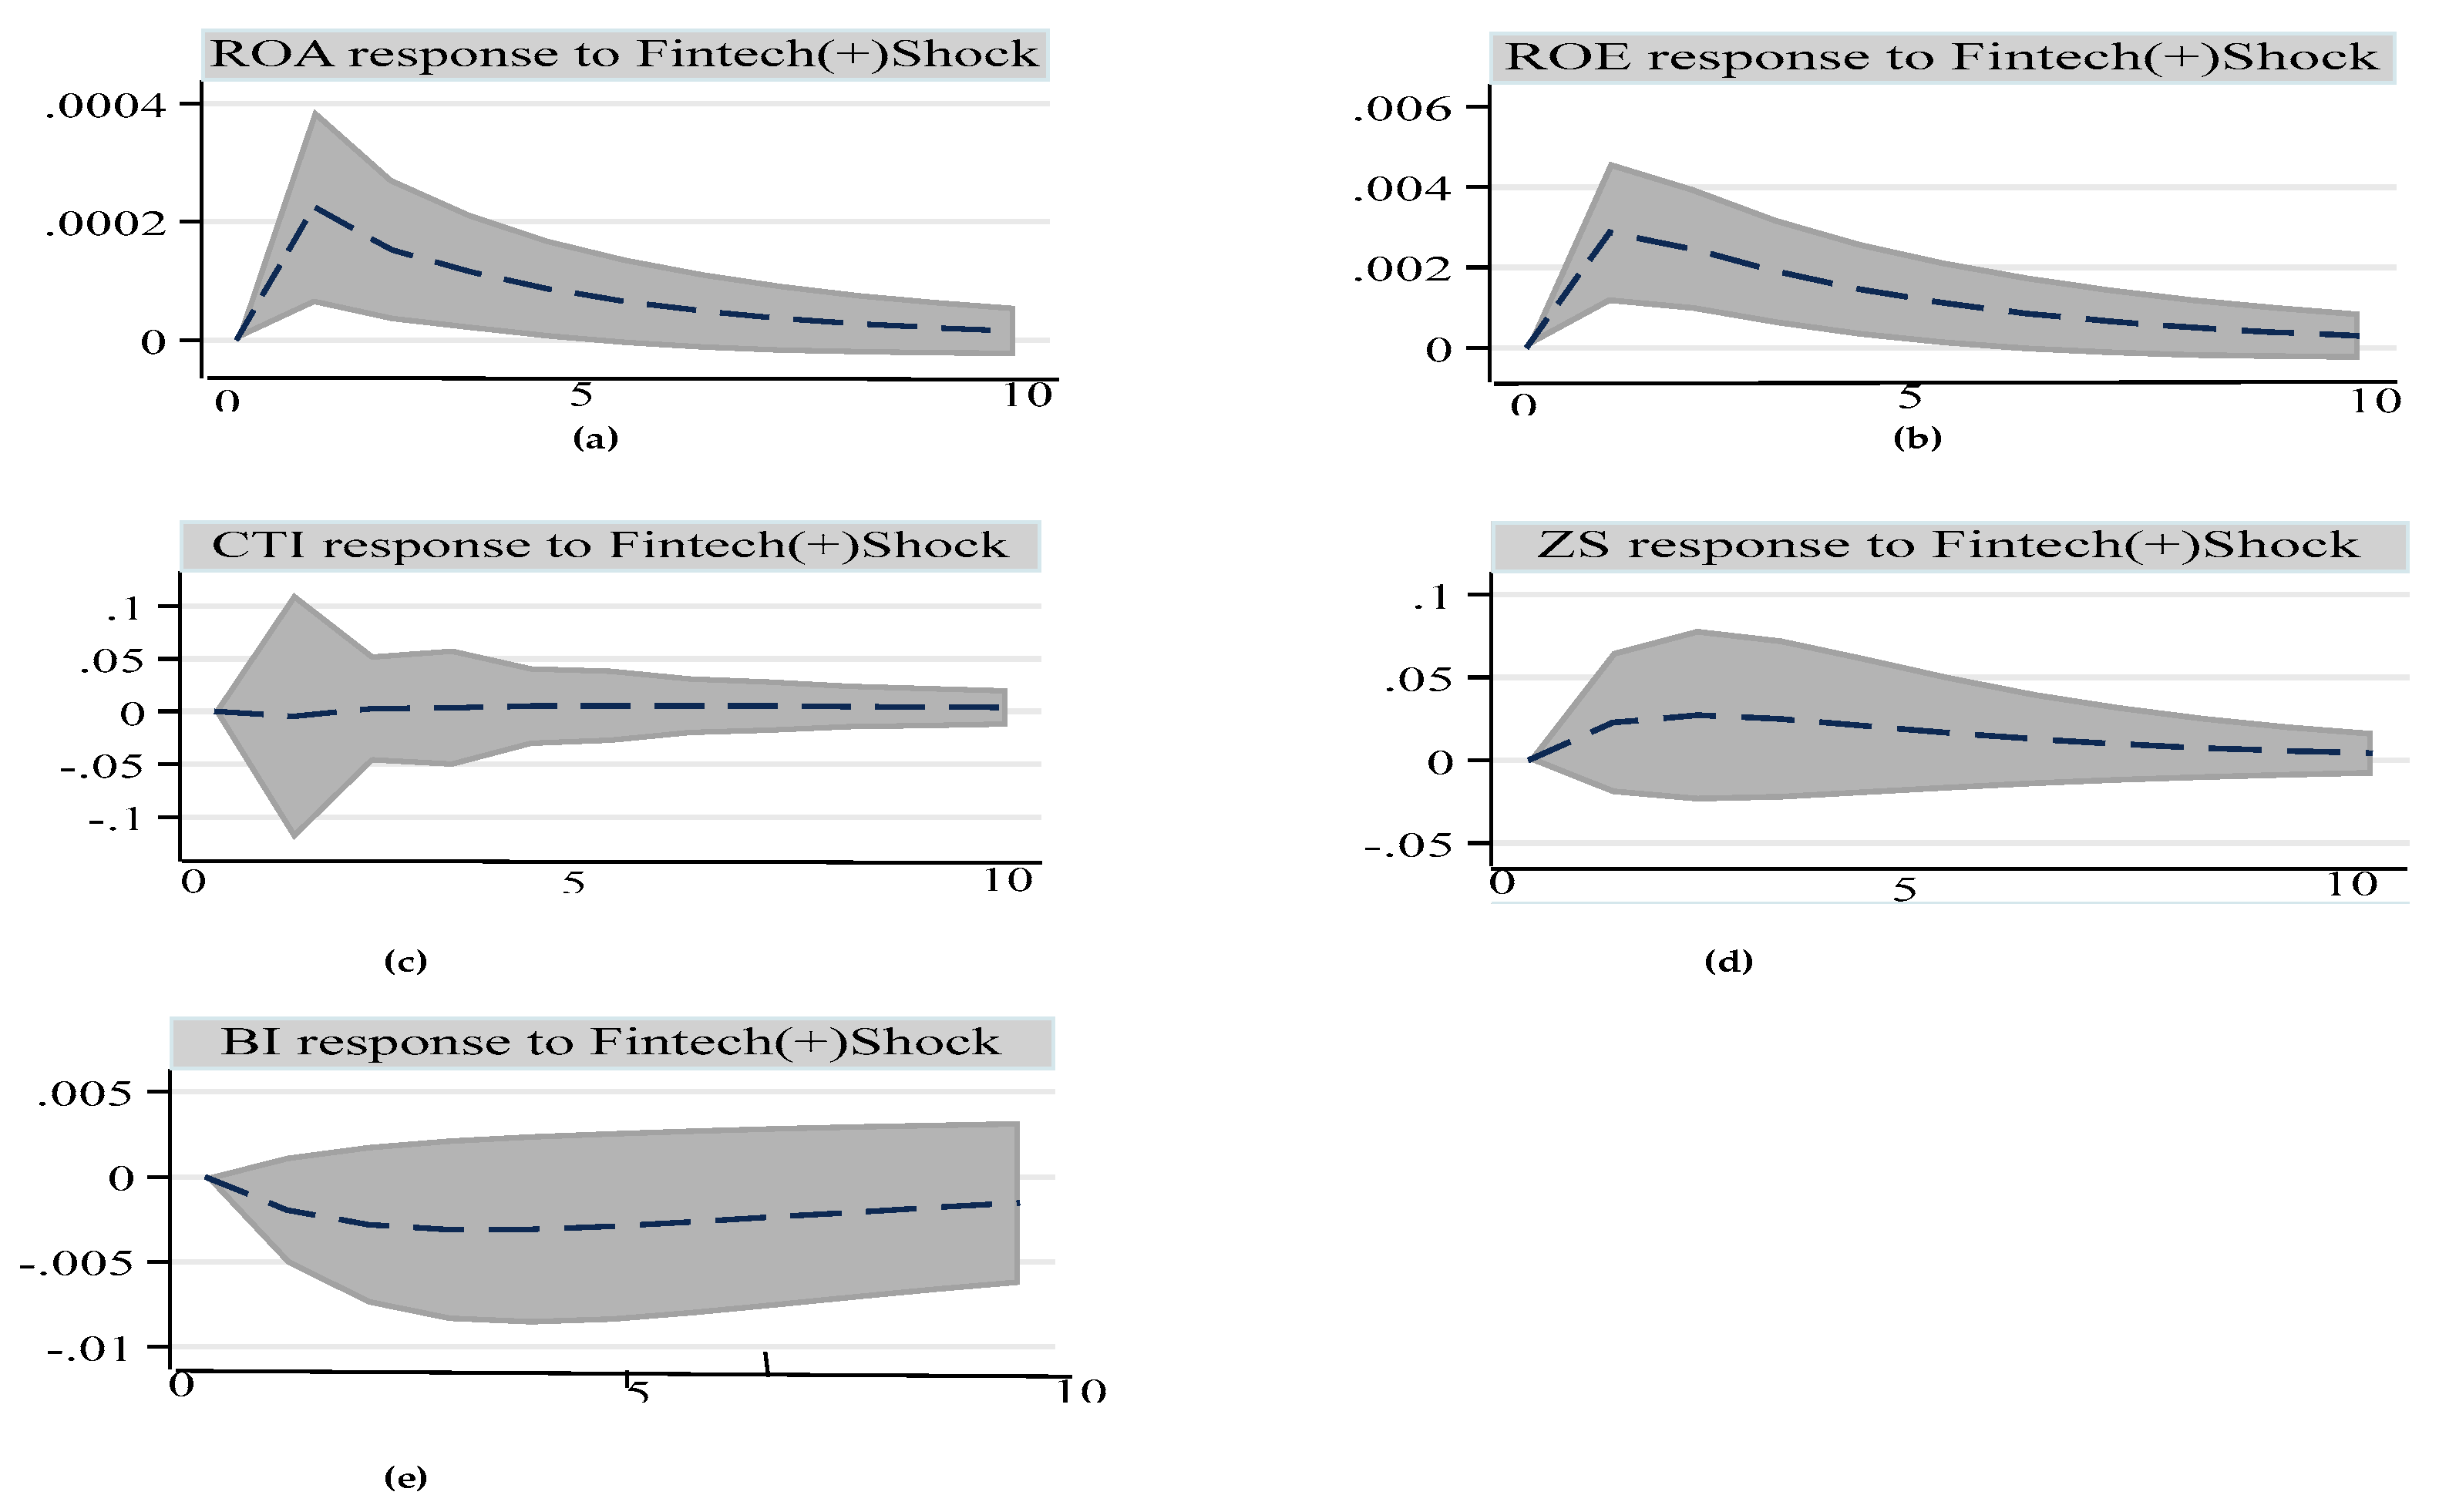
Figure 6.
Impulse responses to orthogonalised one-unit positive fintech risk shock. . (a) ROA response to a negative Fintech risk shock (b) ROE response to a negative Fintech risk shock (c) CTI response to a negative Fintech risk shock (d) Z-Score response to a negative Fintech risk shock (e) Market power response to a negative Fintech risk shock. Note: Dotted lines show the impulse response of a specific variable following a Fintech risk shock. The shaded area represents 95% confidence band generated by 200 Monte-Carlo replications.
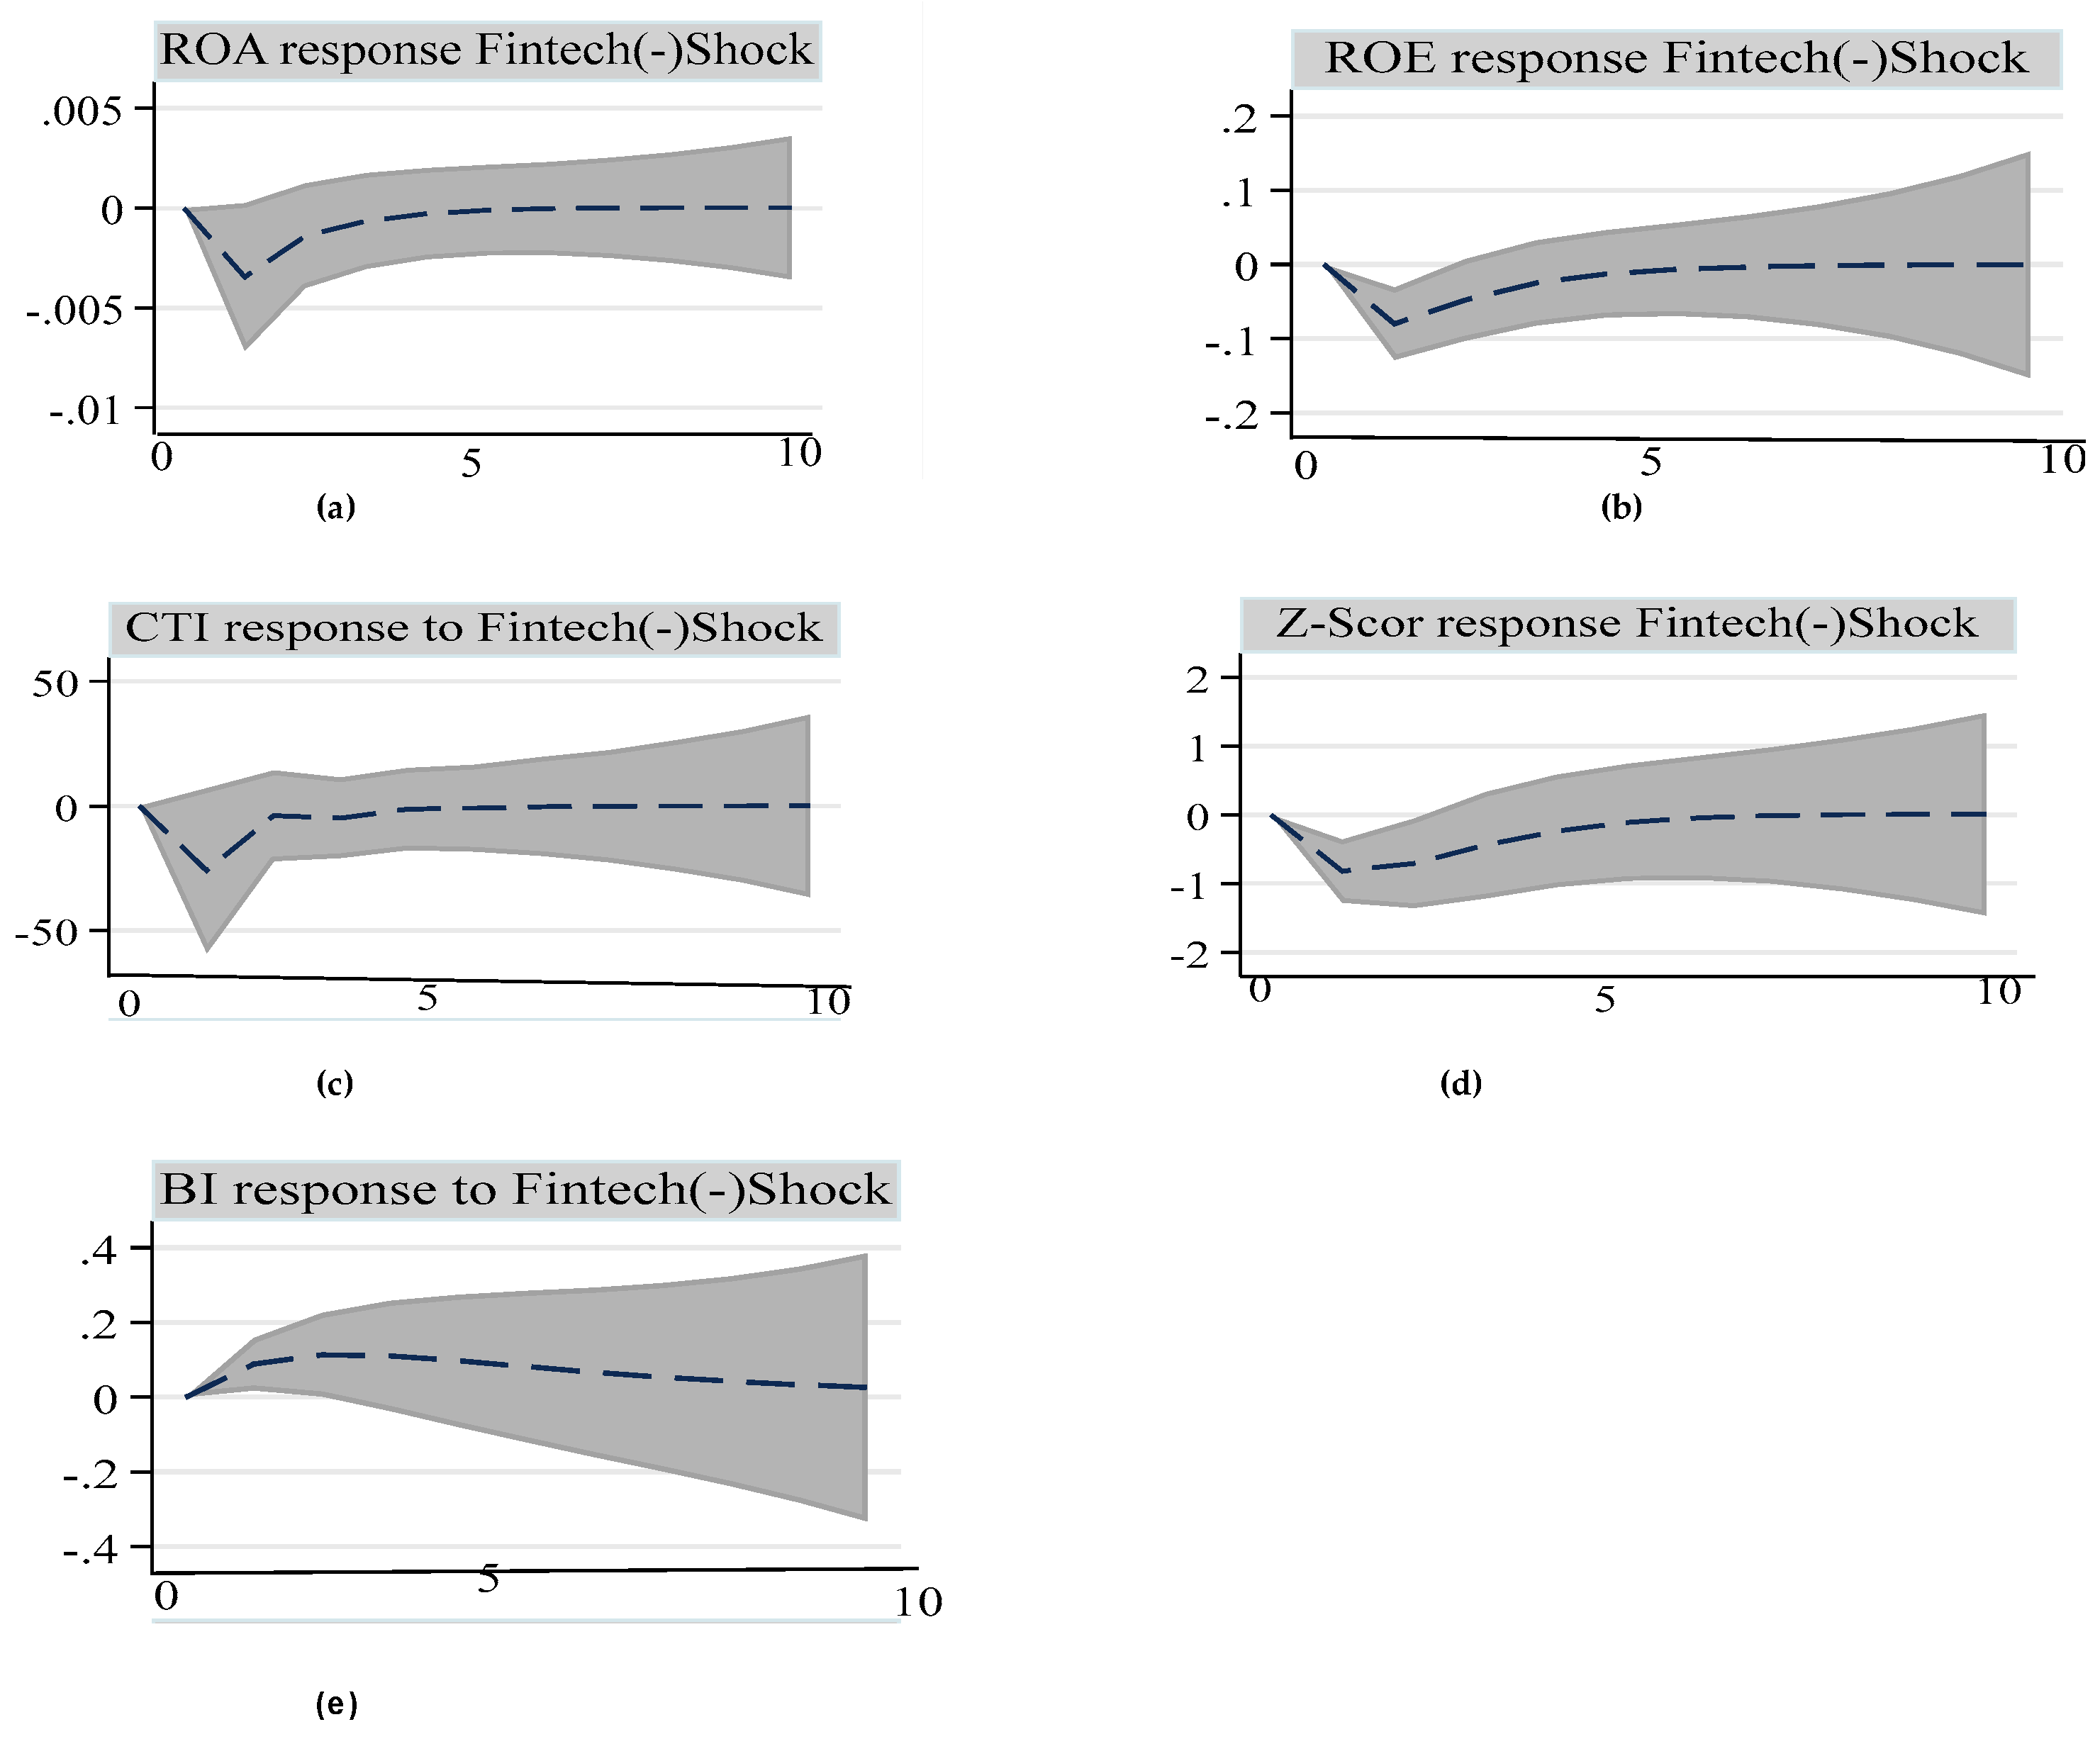
Figure 7.
Stability of the performance metrics models for the fintech risk shock.
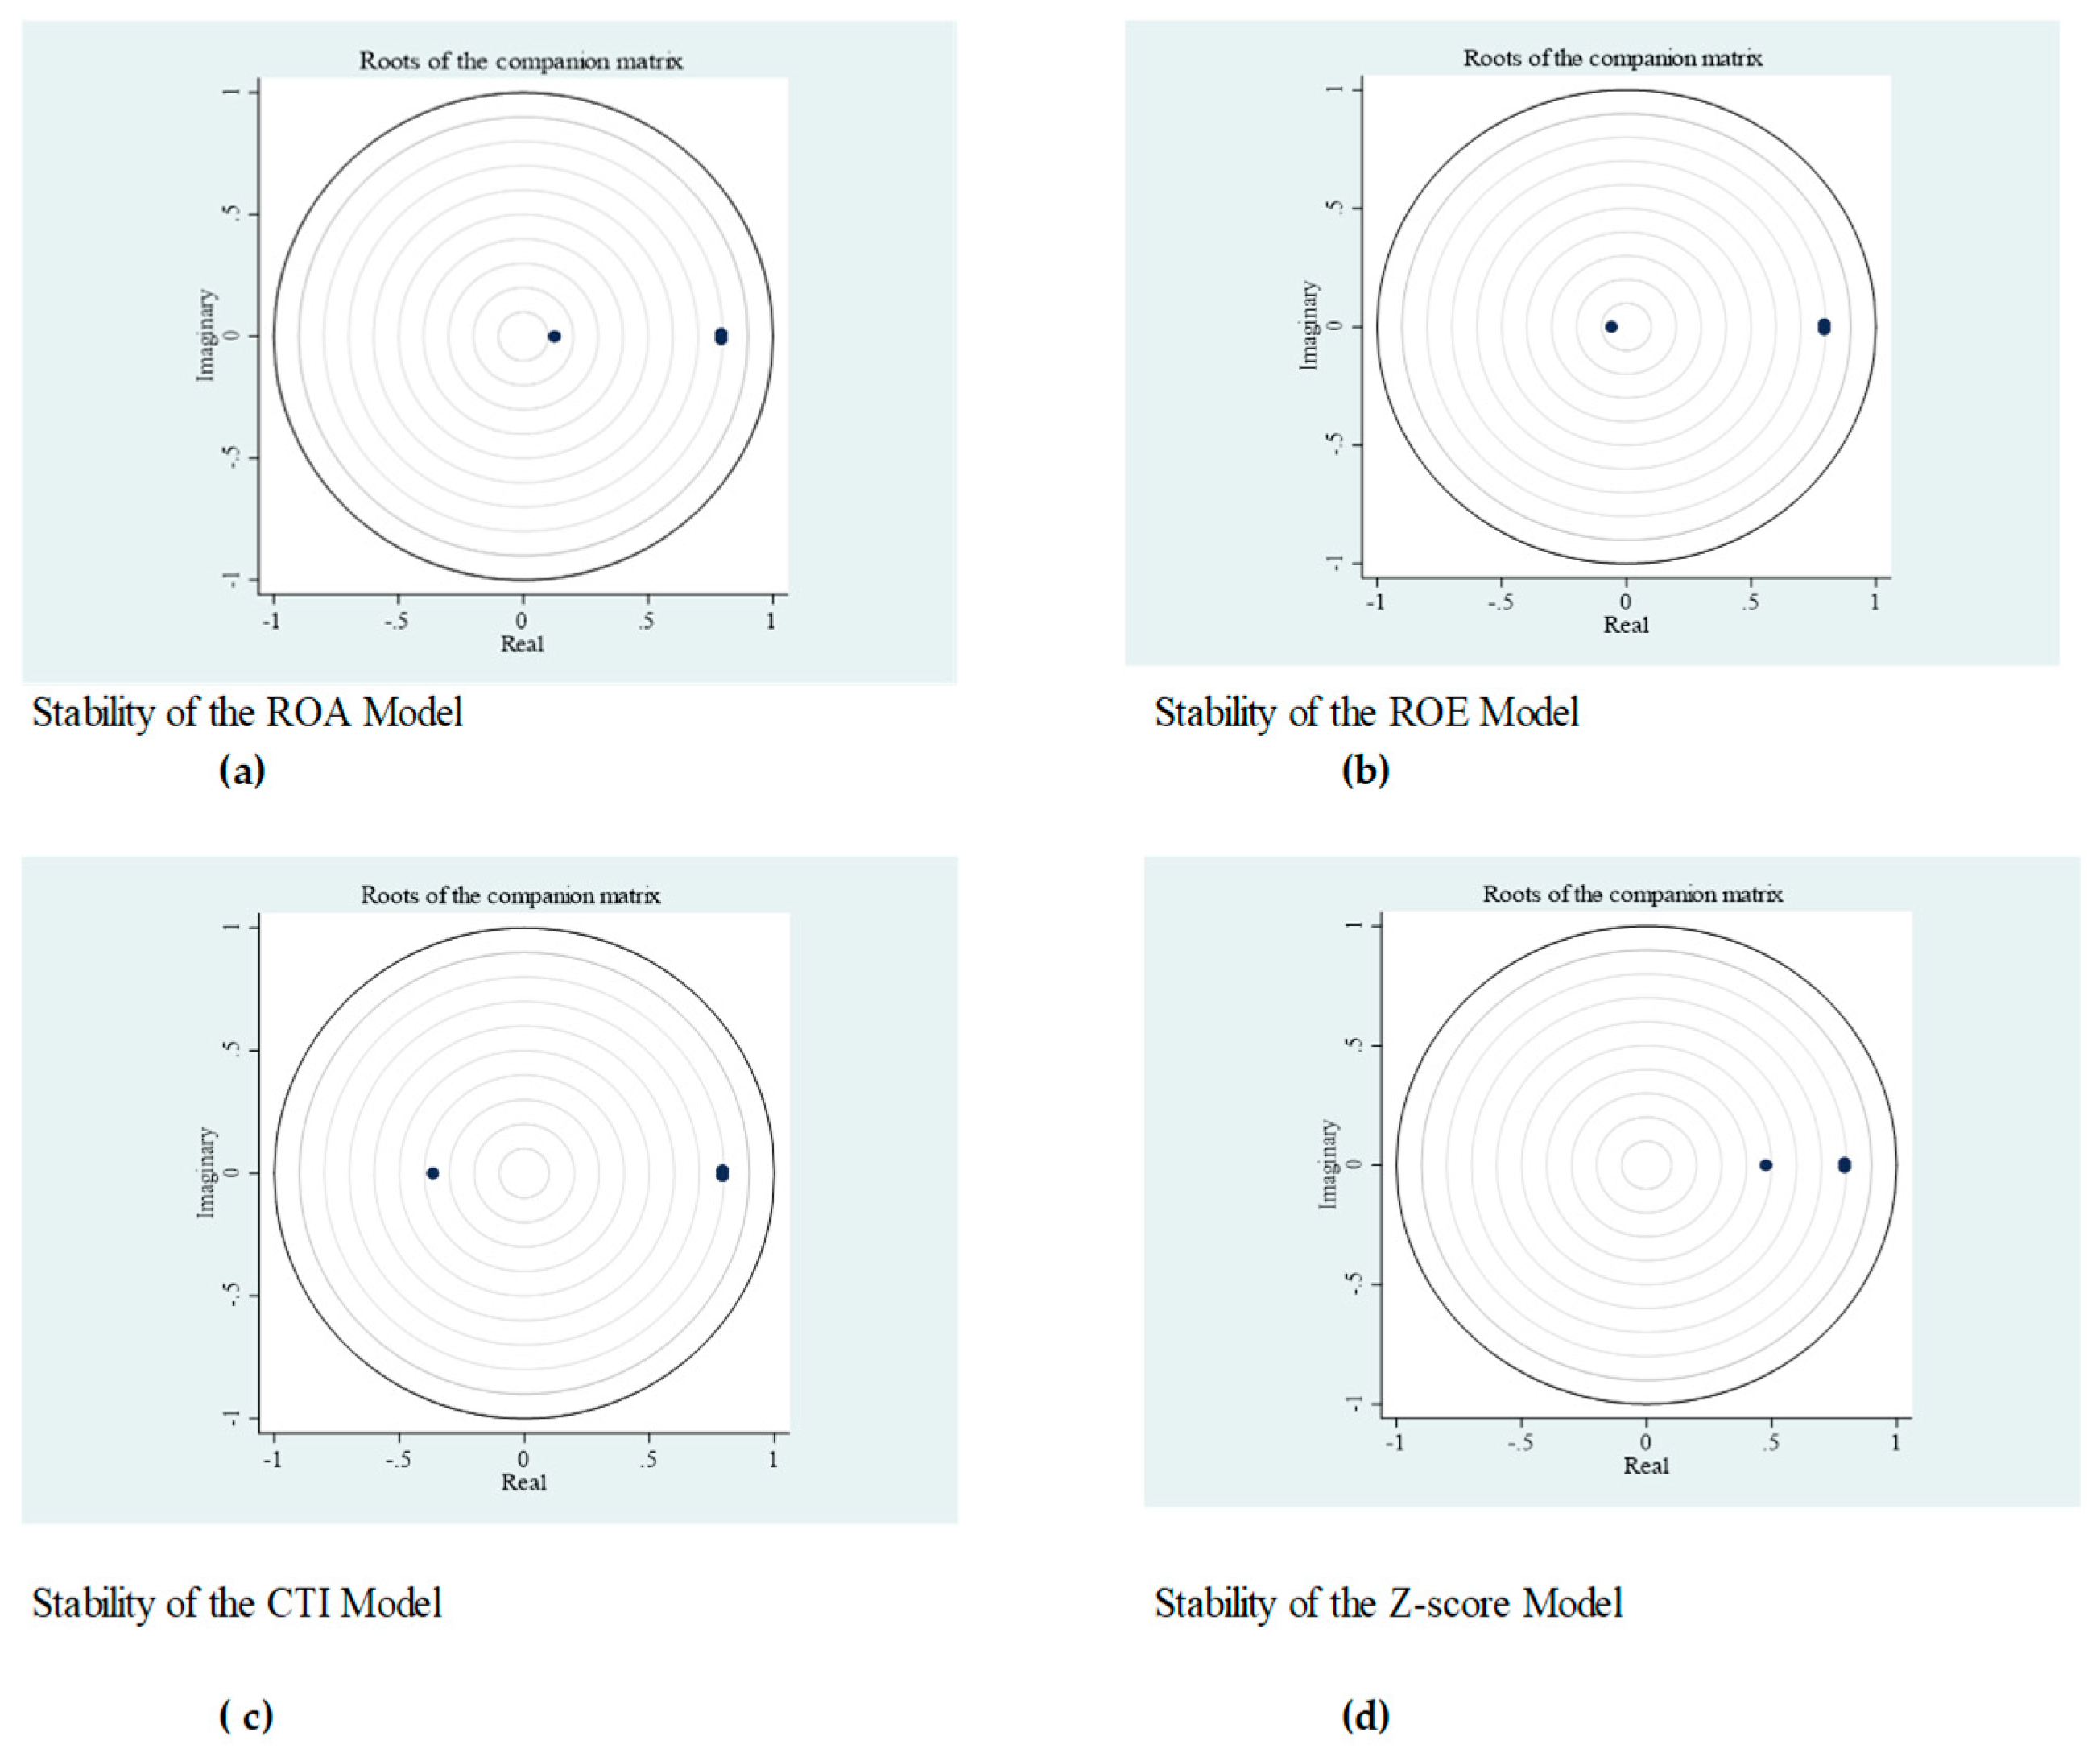
Table 1.
Model Parameters.
| Model Parameters | Interpretations and Assumptions |
| The growth rate of cartel customers | |
| The diminishing rate of cartel customers when they interact with the violator customers | |
| The percentage rate of cartel customers that leave the cartel bank without any interaction with the violating banks’ customers. The assumption is that the customers who leave banks that conform with the cartel agreement, become the violators’ customers. | |
| The death rate of the violators’ customers or clients who switch to mattress banking. | |
| The growth rate of the violators’ customers when they interact with cartels’ customers |
Table 2.
Detailed Index System of Fintech Risk.
| Metric type | Level 1 Indicators | Secondary Indicators |
|---|---|---|
| Fintech Companies | Market Risk | MoMo growth rate |
| Stoxx Global Fintech volatility | ||
| Internet use | ||
| Deposits and loans with credit unions | ||
| Banking-Financial institutions | Digital operational risk | Automated Teller Machine (ATM) growth rate |
| Branches growth rate | ||
| Operational risk | Nonperforming loan ratio | |
| Capital adequacy ratio | ||
| Provision for loan loss reserves | ||
| Market risk | Liquidity ratio | |
| Net Interest Margin | ||
| Financial Market Volatility | ||
| Non-banking-Financial institutions | Securities market cycle risk | Treasury Bill rates |
| Peripheral services | Economic environment | Year-on-year CPI |
| GDP growth rate | ||
| Finance | Financial environment | Net loans-to-total deposit of financial institutions |
| External Environment | Technological environment | Secured Internet servers R&D growth rate |
| Network-environment/Cyber crime | Crime rate |
Table 3.
Summary statistics.
| Description | Variable | Source |
|---|---|---|
| The ratio of net income to equity | ROE | Thomson Reuters |
| The ratio of net income to total assets | ROA | Thomson Reuters |
| Cost to income ratio | CTI | Thomson Reuters |
| The difference between ROA and its mean over the standard deviation of ROA | Z-score | Derived by the author |
| Fintech Financial Stress Index | FFSI | Derived by the author |
Table 4.
Factor loadings of the principal component.
| Factors | Component 1 |
|---|---|
| Loan to deposit ratio | 0.3589 |
| Leverage ratio | 0.2129 |
| Liquidity (current liability:current assets) | 0.2652 |
| Non-performing loans | -0.2713 |
| Net interest margin | 0.0741 |
| Tier 1 capital ratio | -0.299 |
| Loan loss reserves | -0.0029 |
| Market volatility | -0.0022 |
| Fin tech volatility | 0.0164 |
| Rate of change of MoMo transactions | -0.0833 |
| Rate of change in the number of bank branches | 0.2643 |
| Rate of change in the number of ATMs | 0.3254 |
| Internet use per 100 individuals | -0.3095 |
| Treasury bill rates | -0.2165 |
| Consumer Price Index (CPI) | 0.2552 |
| GDP | 0.2223 |
| Rate of change in the number of Secured internet servers | -0.0939 |
| Crime rate | -0.2709 |
| Research and Development | 0.0219 |
| Deposits in credit unions | 0.2308 |
| Loans issued by credit unions | -0.1046 |
Table 5.
Correlation Matrix.
| ROA | ROE | CTI | Z-score | FFSI | BI | |
| ROA | 1.000 | |||||
| ROE | 0.8165* | 1.000 | ||||
| CTI | 0.019 | -0.012 | 1.000 | |||
| Z-score | 0.3214* | 0.2259* | -0.039 | 1.000 | ||
| FFSI | 0.003 | -0.011 | 0.0704* | -0.008 | 1.000 | |
| BI | 0.018 | 0.0713* | -0.036 | -0.006 | 0.1910* | 1.000 |
Note. *<less than 10% level of significance.
Table 6.
DH Granger Non-Causality Test.
| ROA | ROE | CTI | Z-Score | ||||
|---|---|---|---|---|---|---|---|
| Hypothesis | Hypothesis | Hypothesis | Hypothesis | ||||
| BI ROA | 0.074 | BI ROE | 1.65 | BI CTI | 3.37* | BI Z-score | 0.302 |
| Fintech ROA | 0.051 | Fintech ROE | 3.537* | FintechCTI | 2.118 | Fintech Z-score | 1.729 |
| ROA BI | 0.416 | ROE BI | 0.733 | CTI BI | 0.035 | Z-score BI | 0.133 |
| Fintech BI | 3.44* | Fintech BI | 3.389* | Fintech BI | 3.427 | FintechBI | 3.427* |
| ROA Fintech | 0.089 | ROE Fintech | 0.201 | CTI Fintech | 0.165 | Z-score Fintech | 0.512 |
| BI Fintech | 0.93 | BI Fintech | 0.916 | BIFintech | 0.932 | BI Fintech | 1.23 |
| Positive Fintech | Positive Fintech | Positive Fintech | Positive Fintech | ||||
| BI ROA | 0.009 | BI ROE | 2.497 | BI CTI | 1.936 | BI Z-score | 0.002 |
| Fintech ROA | 6.394*** | Fintech ROE | 9.542** | Fintech CTI | 0.006 | Fintech Z-score | 1.255 |
| ROA BI | 0.068 | ROE BI | 1.049 | CTI BI | 0.338 | Z-score BI | 1.515 |
| Fintech BI | 1.074 | Fintech BI | 1.041 | Fintech BI | 1.075 | Fintech BI | 1.522 |
| ROA Fintech | 1.507 | ROE Fintech | 1.661 | CTI Fintech | 2.165 | Z-score Fintech | 0.042 |
| BI Fintech | 0.215 | BI Fintech | 0.292 | BI Fintech | 0.243 | BI Fintech | 0.042 |
| Negative Fintech | Negative Fintech | Negative Fintech | Negative Fintech | ||||
| BI ROA | 0.082 | BI ROE | 3.367* | BI CTI | 1.578 | BI Z-score | 0.639 |
| Fintech ROA | 3.527* | Fintech ROE | 10.664** | Fintech CTI | 2.038 | Fintech Z-score | 11.297*** |
| ROA BI | 0.378 | ROE BI | 1.195 | CTI BI | 1.386 | Z-score BI | 3.367* |
| Fintech BI | 6.262*** | Fintech BI | 6.271** | Fintech BI | 6.28** | Fintech BI | 6.591*** |
| ROA Fintech | 0.24 | ROE Fintech | 0.105 | CTI Fintech | 0.041 | Z-score Fintech | 0.113 |
| BI Fintech | 1.193 | BI Fintech | 1.25 | BI Fintech | 1.235 | BIFintech | 1.174 |
*< 10% *<10%level of significance, **<5% level of significance, and ***<1% level of significance.
Disclaimer/Publisher’s Note: The statements, opinions and data contained in all publications are solely those of the individual author(s) and contributor(s) and not of MDPI and/or the editor(s). MDPI and/or the editor(s) disclaim responsibility for any injury to people or property resulting from any ideas, methods, instructions or products referred to in the content. |
© 2025 by the authors. Licensee MDPI, Basel, Switzerland. This article is an open access article distributed under the terms and conditions of the Creative Commons Attribution (CC BY) license (http://creativecommons.org/licenses/by/4.0/).
Copyright: This open access article is published under a Creative Commons CC BY 4.0 license, which permit the free download, distribution, and reuse, provided that the author and preprint are cited in any reuse.


