
Submitted:
23 June 2025
Posted:
24 June 2025
You are already at the latest version
Abstract
Cardiovascular disease (CVD), particularly atherosclerotic cardiovascular disease (ASCVD), is the leading cause of death worldwide, driven by factors like oxidative stress, inflammation, and lipid metabolism disorders. Although phenolic compounds such as Tyrosol (Tyr) and Hydroxytyrosol (HTyr) found in extra virgin olive oil have shown promising antioxidant and anti-inflammatory effects, their specific roles in modulating oxidative stress biomarkers and HDL functionality in elderly populations, especially in those with prior myocardial infarction, are not fully understood. This study aimed to investigate the effects of EVOO phenolic compounds on oxidative stress biomarkers and HDL functionality, and related metabolic outcomes in both healthy and post-MI elderly individuals. This pilot randomized clinical trial study included healthy and post-myocardial infarction (pos-MI) participants aged 65-85 years. Participants in each group were randomly assigned to consume 25 ml per day of one of three types of olive oils: high HTyr/Tyr extra virgin olive oil (HP-EVOO), extra virgin olive oil (EVOO), or refined olive oil (ROO) for a period of 26 weeks. Blood samples were collected at baseline and post-intervention to assess key biomarkers. Plasma levels of (poly)phenols, malondialdehyde (MDA), total antioxidant capacity (FRAP), lecithin-cholesterol acyltransferase activity (LCAT) and serum paraoxonase-1 (PON-1) activity were measured. A total of 34 individuals completed the study (mean age: 74 years). Baseline characteristics, including sex, age, body mass index (BMI), weight, blood pressure, and inflammatory markers like C-reactive protein (CRP) levels, did not differ significantly between the two groups. A significant increase in both FRAP levels and PON-1 activity was observed in post-MI participants following HP-EVOO consumption compared to baseline (p = 0.014). No significant changes were observed in MDA levels, LCAT activity, or plasma (poly)phenols. These results indicate that HP-EVOO may enhance antioxidant capacity, particularly FRAP and PON-1 activity, in elderly post-MI individuals. The observed differences between groups suggest that underlying cardiometabolic status may influence the response to olive oil phenolic compounds. Further studies are needed to explore the long-term cardiovascular effects.
Keywords:
cardiovascular disease
; hydroxytyrosol
; extra virgin olive oil
; oxidative stress
1. Introduction
Cardiovascular disease (CVD) is the major cause of mortality and morbidity, affecting 523 million people worldwide. Atherosclerotic vascular diseases (ASVDs), particularly ischaemic heart disease (IHD) and stroke, are the most prominent contributors to the global burden of CVD and determine variations and trends in age-standardised prevalence [1]. Atherosclerosis is a progressive condition characterized by the buildup of lipid plaques within vessel walls [2]. This process involves lipid deposition, endothelial dysfunction, oxidative stress, and immune activation, ultimately leading to plaque formation and, in advanced stages, thrombosis [3].
Several risk factors, including a sub-optimal diet, physical inactivity, smoking, and alcohol consumption, contribute to ASCVD. Evidence from multiple studies indicates that addressing these lifestyle factors can significantly reduce the risk of cardiovascular events [4]; including dietary changes, increased physical activity, cessation of smoking and alcohol consumption. Moreover, antioxidant, anti-inflammatory, and lipid-lowering therapies are among the key strategies for both the prevention and management of ASCVDs [5].
A longitudinal study of 1,180 individuals with a history of ASCVD found that adherence to the Mediterranean diet (MD) significantly reduced the risk of all-cause, cardiovascular, and coronary artery disease/cerebrovascular mortality, regardless of statin use [6]. Furthermore, the combination of statin therapy and average-to-high adherence to MD showed a synergistic effect in reducing cardiovascular mortality, likely mediated by reduction of low-grade inflammation rather than changes in blood cholesterol levels [6]. It is notable that the main source of fat in MD is primarily extra-virgin olive oil (EVOO). The antiatherogenic effects of EVOO were originally attributed to its high content of monounsaturated fats (MUFA), particularly oleic acid [7]. However, recent studies indicate that the bioactive phenolic compounds present in EVOO also contribute substantially to its cardioprotective properties [8]. A controlled, crossover, randomized trial by Covas et al., including 200 healthy male volunteers from 5 European countries, demonstrated that olive oil with higher phenolic content significantly improved plasma lipid levels and reduced oxidative stress markers, such as oxidized low-density lipoprotein (ox-LDL), in a dose-dependent manner [9]. These findings indicate that, apart from its monounsaturated fat content, the phenolic compounds in EVOO provides cardiovascular benefits, including increasing high-density lipoprotein (HDL) cholesterol and reducing oxidative damage [9]. Similarly, Perrone et al., showed that an acute postprandial intake of 25 g phenols-rich EVOO significantly reduced oxidative stress biomarkers, such as ox-LDL and malondialdehyde (MDA), and also increased the expression of antioxidant genes, including catalase and superoxide dismutase-1 (SOD-1) in healthy participants [10].
Tyrosol (Tyr) and its hydroxylated derivative, Hydroxytyrosol (HTyr), are two phenolic compounds found EVOO that exhibit a range of bioactive properties, including anti-inflammatory, anti-proliferative effects and potent antioxidant activities [11]. Furthermore, Tyr and HTyr are the only phenolic compounds approved by the European Food Safety Authority (EFSA) with a health claim, supporting its ability in protecting LDL from oxidative damage while also modulating HDL levels and blood pressure [12]. For optimal health benefits, the EFSA recommends a daily intake of 20 g of EVOO containing at least 5 mg of Tyr/HTyr and their derivatives [13]. The diverse biological activities of Tyr/HTyr were initially attributed to their potent antioxidant properties, primarily through free radical-scavenging and metal-chelating mechanisms [14]. These antioxidant effects stem from their hydroxyl group, which donates electrons, form stable hydrogen bonds with phenoxyl radicals, and scavenge reactive oxygen species (ROS) [15,16]. HTyr upregulates heme oxygenase-1 (HO-1) in VECs via PI3K/Akt and ERK1/2 signaling pathways. This leads to the stabilization of nuclear factor erythroid 2–related factor 2 (Nrf2), a key transcription factor that regulates antioxidant responses. Through these effects, HTyr contributes to wound healing and may protect against atherosclerosis by mitigating oxidative stress and improving endothelial function [17].
Similarly, studies have shown that Tyr can activate the Nrf2/HO-1 pathway, enhancing the expression of antioxidant enzymes and providing cytoprotective effects. For instance, Wang et al., demonstrated that Tyr significantly upregulated HO-1 expression and activated Nrf2 in RAW 264.7 murine macrophages. Moreover, in a mouse model of lipopolysaccharide (LPS)-induced acute lung injury, Tyr treatment improved survival, reduced lung permeability, and ameliorated histopathological damage, indicating its potential protective effects against oxidative stress and inflammation [18]. Additionally, some studies have shown that HTyr lowers ROS and MDA levels while enhancing nitric oxide (NO) production in vitro and in vivo [19]. Although HTyr has been shown to exert a wide range of biological effects, including cardioprotective, endocrine, metabolic, and other health-promoting properties [20], the evidence regarding the impact of EVOO or its phenolic compounds, like Tyr/HTyr, on oxidative stress, inflammatory markers, and cardiometabolic risk factors remains inconsistent across systematic reviews and meta-analyses [21,22,23]. Conversely, inflammation has been shown to induce multiple structural modifications in HDL, leading to functional impairments [24]. In addition, inflammatory biomarkers such as C-reactive protein (CRP) are known to increase significantly following acute MI [25]. CRP levels typically rise within 4 to 6 hours after symptoms onset, peak between 2 to 4 days, and gradually return to baseline within 7 to 10 days [25]. However, the significance of elevated inflammatory markers during the convalescence period remains underexplored. Additionally, it has been reported that HDL maturation and functionality are compromised in post-MI patients, as evidenced by reduced cholesterol efflux from macrophages, decreased paraoxonase-1 (PON-1) activity [26] and reduced anti-inflammatory properties, independent of plasma HDL cholesterol levels [27]. Moreover, Guerin et al., highlighted that serum cholesterol efflux capacity serves as a valuable biomarker for identifying patients at higher risk of mortality following an acute coronary event. These findings suggest that enhancing serum cholesterol efflux capacity in post-MI patients may contribute to a reduction in mortality risk. Given that elderly individuals with a history of MI face elevated rates of recurrent cardiovascular events, including multiple recurrences [28], there is a clear need for intensive secondary prevention strategies and comprehensive management of comorbidities in high-risk patients. Therefore, the present study aimed to evaluate the long-term effect of EVOO enriched in phenolic compounds, particularly Tyr/HTy, on oxidative stress biomarkers in post-MI patients, in comparison to age-matched elderly individuals without a history of cardiovascular disease or other major chronic illnesses.
2. Materials and Methods
2.1. Study Design and Subjects
This study is part of the LIPIMAGE Cohort, an ongoing prospective study in which positron emission tomography imaging is used to analyze the effect of EVOO on the atherosclerotic plaque progression and stability in individuals at high cardiovascular risk. The study protocol was approved in accordance with the Declaration of Helsinki and approved by the Sherbrooke University Hospital Center Ethics Committee (#2019-3145). All participants provided written informed consent prior to enrollment.
Forty-eight participants were recruited for the study, including healthy individuals (n=24) and post-MI patients (n=24) who were enrolled at least three months after their infarction event to allow stabilization of infarct-related inflammation. Within in each group, participants were randomized into one of three subgroups to receive one of three types of olive oils: high Tyr/HTyr-EVOO (HP-EVOO), regular EVOO, or refined olive oil (ROO). All participants consumed 25 ml per day for a duration of 26 weeks (Figure 1). The dose of 25 mL/day was selected based on previous clinical trials demonstrating its efficacy in improving cardiovascular and oxidative stress markers [29]. Healthy individuals were selected based on the absence of recent or family history of disease and to meet criteria for presenting normal arterial pressure (less than 140/85 mmHg), normal lipid profile, and normal ECG.
All participants had a BMI between 23 and 28 kg/m². Exclusion criteria included high alcohol consumption, smoking, chronic metabolic disorders such as diabetes (HbA1c > 6%), chronic inflammatory conditions, liver or kidney failure, cancer, use of anti-inflammatory medications, or intake of dietary supplements such as omega-3 fatty acids, probiotics, or hormonal therapy. Post-MI patients have maintained their prescribed medications. Also subjects consuming EVOO regularly (more than 3 times per week) were excluded.
Fasting blood samples were collected at baseline and after 6 months of olive oil consumption. During the intervention period, participants attended monthly visits to receive a new bottle of olive oil, monitor compliance, address any questions, and collect study-related data.
Participants were instructed to maintain their usual dietary habits and physical activity level throughout the six months intervention. Dietary assessment was done using a three-day food journal completed by each participant.
2.2. Olive Oils
HP-EVOO and regular EVOO were obtained from Atlas Olive Oil Inc. (Casablanca, Morocco). The HP-EVOO contained exceptionally high levels of phenolic compounds (1249 mg/kg), with particularly elevated concentrations Tyr and HTyr, measured at 123.1 mg/kg and 233.6 mg/kg, respectively. In comparison, regular EVOO contains 255 mg/kg of total phenolic compounds, with Tyr and HTyr levels of 6.3 mg/kg and 7.8 mg/kg, respectively. The phenolic content of all oils was certified by an independent Biotechnology Laboratory at the Faculty of Sciences Dhar El Mehraz (Fez, Morocco) and cross-verified in our laboratory. ROO was purchased from local grocery stores in Sherbrooke, Canada, and was confirmed to be devoid of phenolic compounds.
All participants were instructed to consume 25 ml of their assigned oil daily, in its raw form and preferably with meals. Compliance with the intervention was monitored during monthly visits through the administration of a standardized questionnaire. Adherence was further evaluated by collecting and analyzing the returned EVOO containers.
2.3. Blood Collection
Participant’s blood samples were collected following an overnight fast (at least 8 hours). Blood samples were collected in EDTA tubes and promptly centrifuged at 400 x g for 15 minutes to separate the plasma. Plasma and serum samples were aliquoted and stored at -80 °C until further analysis.
2.4. Biochemical Analyses
2.4.1. Plasma Total (poly)phenols Measurement
Plasma total (poly)phenols were measured as previously described [30], with some modifications. Briefly, 100 µl plasma was added to 200 µl of 1 mol/L HCl, vortexed for 1 min, and incubated at 37 °C for 30 min. Then 200 µl of 2 mol/L NaOH in 75% methanol was added, followed by vortexing for 2 min and incubation at 37 °C for an additional 30 minutes. Next, 200 µl of 0.75 mol/L meta-phosphoric acid was added, and the mixture was vortexed for 2 minutes before being centrifuged at 1700 × g for 10 min at 4 °C. The supernatant was collected and stored on ice in the dark. Risidual (poly)phenols in the pellet were re-extracted by adding 200 µl of 1:1 (v/v) acetone:water. This mixture was vortexed for 1 min and centrifuged at 1700 × g for 10 min at 4 °C to obtain the supernatant. The two supernatants were pooled together and centrifuged at 1700 × g for 5 min at 4 °C. The ultimate supernatant was obtained after centrifugation were used for analysis. For quantification of (poly)phenols, 250 µl of 0.2 N Folin-Ciocalteu phenol reagent and 200 µl of 2 mol/L Na2CO3 solution were added to 50 µl of the final supernatant. After 90 min of incubation at room temperature in dark, absorbance at 750 nm was measured using the Multimode Plate Reader (VICTORTM X5). A calibration curve was generated using Gallic acid (GA) standards ranging from 0 to 800 µg/ml, prepared in distilled water. Results were expressed as µg of Gallic acid equivalents (GAE) per ml of plasma.
2.4.2. Ferric Reducing Antioxidant Power (FRAP)
The Ferric Reducing Antioxidant Power (FRAP) of serum samples was measured using the FRAP Assay Kit (MAK509, Sigma-Aldrich) according to the manufacturer’s instructions. This colorimetric assay quantifies total antioxidant capacity by evaluating the ability of sample to reduce ferric (Fe³⁺) to ferrous (Fe²⁺) iron in the presence of a chromogenic substrate, forming a blue-colored Fe²⁺-complex measurable at 590 nm. Briefly, serum samples were first diluted 1:10 with purified water, and all standards and samples were run in duplicate. A standard curve was generated using serial dilutions of a 180 μM Fe²⁺ solution. Fresh working reagent was prepared prior each assay. For analysis, 50 μL of each sample or standard was added to a clear, flat-bottom 96-well plate, followed by the addition of 200 μL of the working reagent. After gentle mixing and a 40-minute incubation at room temperature, absorbance was measured at 590 nm using a VICTOR™ X5 Multimode Plate Reader.
FRAP values were calculated from the slope of the standard curve and expressed as μM Fe²⁺ equivalents, using the following formula:
Rsample and RBlank are the optical density values of the sample and blank, respectively. Results are expressed in μM Fe²⁺ equivalent.
2.4.3. PON-1 Activity Measurement
Serum paraoxonase activity was measured using paraoxon as substrate as previously described [31]. Briefly, 25 µl of serum was added to Tris/HCl buffer (100 mmol/L, pH 8.0) containing 2 mmol/L CaCl2 and 5.5 mmol/L paraoxon (O, O-diethyl-O-p-nitrophenylphosphate; Sigma Chemical Co). The rate of hydrolysis of paraoxon and generation of p-nitrophenol was determined by monitoring the increase in absorbance at 412 nm and at 25 °C (UH5300, UV/VIS spectrophotometer, 3J1-0012). The amount of p-nitrophenol generated was calculated using the molar extinction coefficients at pH 8 (=17100 M-1 cm-1). Paraoxonase activity was expressed as units per milliliter (U/ml).
2.4.4. MDA Measurement
Plasma MDA levels were measured by using the thiobarbituric acid reactive substances (TBARS) assay, as previously described [32,33], with minor modifications. Briefly, 75 µl of plasma was mixed with 1.5 ml TCA-TBA-HCl reagent [15 % (w/v) TCA, 0.385 % (w/v) TBA in 0.25 N HCl], then heated at 100 °C for 30 min in a dry bath incubator (Fisher Scientific). After cooling, samples were centrifuged at 3000 rpm for 10 min at 4 °C to remove precipitates. The absorbance of MDA in the supernatant was measured at 532 nm using a VICTORTM X5 Multimode Plate Reader. Results were expressed in μmol/L with 1,1,3,3-Tetraethoxypropane (TEP) was used as the MDA standard.
2.4.5. LCAT Activity Measurement
Plasma LCAT activity level was measured by using a commercially available kit (Roar Biomedical Inc. New York, USA). Plasma samples were incubated with a fluorescent substrate and the fluorescence intensity of the intact substrate was measured at 470 nm by a Bio-Tek Synergy HT Multi-Mode Microplate Reader. As the substrate is hydrolyzed by LCAT, a monomer is produced which becomes detectable at 390 nm. LCAT activity was calculated by measuring the 390/470 nm emission intensity.
2.5. Statistical Analysis
The obtained results were reported as mean ± standard error (SE). The normality of the distribution of quantitative variables was assessed using the Shapiro–Wilk test. For within-group comparisons (pre- and post-intervention), a paired t-test was used for normally distributed variables, while the Wilcoxon signed-rank test was applied for non-normally distributed data. For between-group comparisons, an unpaired t-test was used when the data followed a normal distribution, and the Mann–Whitney U test was used for non-normal distributions. Sex distribution across the six study groups was compared using Fisher’s exact test. To compare means among the three olive oil subgroups (before and after the intervention), one-way ANOVA was used for normally distributed data, and the Kruskal–Wallis test for non-normal data. A P-value less than or equal to 0.05 was considered statistically significant. All statistical analyses were performed using GraphPad Prism version 10.1.2 (GraphPad Software®, Inc., La Jolla, CA, USA).
3. Results
3.1. Participants Characteristics
Of the 73 participants assessed for eligibility, 48 were enrolled in the study, and 34 completed the intervention (See Figure 1 for details). Baseline characteristics of the participants are presented in Table 1. Overall, 64% of participants were male. Sex distribution across the six groups was compared using Fisher’s exact test. No significant differences were observed (p = 0.438). The study groups were generally well-matched, with no statistically significant differences in mean age (healthy individuals: 74.76 ± 1.43 years; post-MI: 73.62 ± 1.56 years, p = 0.592), body weight, BMI, systolic blood pressure, CRP, triglycerides (TG) and lipoprotein(a) [Lp(a)]. However, a significant difference in baseline diastolic blood pressure was observed in the HP-EVOO group between healthy and post-MI participants (p = 0.024). Additionally, baseline lipid profiles revealed significant differences between groups in total cholesterol (TC) (p < 0.001), HDL-C (p = 0.031), LDL-C (p = 0.010), and non-HDL cholesterol (p = 0.035). These differences remained significant following the intervention for TC (p = 0.003), HDL-C (p = 0.048), LDL-C (p < 0.007) and non-HDL cholesterol (p = 0.016).
In the EVOO group, both at baseline and after the 6-month intervention, significant differences were observed between healthy and post-MI patients in TC (p < 0.001 and p < 0.0001), LDL-C (p < 0.001 and p < 0.0001), and non-HDL cholesterol (p = 0.002 and p<0.0001).
For the ROO group, both within-group and between-group analyses revealed significant differences in LDL-C (p = 0.006 at baseline and p = 0.030 at the end of the study) and non-HDL cholesterol (p = 0.002 at baseline and p = 0.022 at the end of the study).
3.2. Biochemical Outcomes
Following the intervention, in the HP-EVOO group, plasma (poly)phenol levels increased in both healthy (mean difference = 32 ± 149 mg of GAE/mL) and post-MI participants (mean difference = 65 ± 134.87 mg of GAE/mL). In contrast, decreases were observed in the EVOO group (H: mean difference = –34 ± 179; PMI: mean difference = –37 ± 83.5 mg of GAE/mL) and ROO group (H: MD = –12 ± 144.9; PMI: MD = –92 ± 73.4 mg of GAE/mL). While these trends are illustrated in Figure 2, none of the changes were statistically significant, either within or between healthy participants and post-MI patients across the three intervention groups (HP-EVOO, EVOO, and ROO) (Figure 2).
A significant increase in serum FRAP was observed in post-MI patients following HP-EVOO consumption (mean difference = 67.7 ± 89.9 mM Fe2+, p= 0.014) compared to the baseline, while it was small and insignificant in healthy participants (mean difference = 3.3 ± 114.7 mM Fe2+). Additionally, an increase in the mean difference was observed in both healthy and post-MI participants after consuming EVOO; however, it was not statistically significant (H: mean difference = 27.8 ± 78.7 mM Fe2+; PMI: mean difference = 26.9 ± 80.2 mM Fe2+). Moreover, results showed a significant difference between healthy and post-MI patients at baseline (p=0.046), and after consuming EVOO (p=0.050). In the ROO group, there was no significant difference between baseline levels of FRAP between healthy and post-MI participants, however, after the intervention, the FRAP level decreased in post-MI patients (mean difference = -11.1 ± 65.2 , p= 0.427) and increased in healthy participants (mean difference = 50.9 ± 52, p= 0.062) and made the difference statistically significant (p=0.011). One-way ANOVA revealed a significant difference in baseline FRAP levels between the HP-EVOO and ROO groups among post-MI patients (p = 0.037), and the Kruskal–Wallis test showed a significant difference in post-consumption values between these groups (p = 0.009) (Figure 3).
For the HP-EVOO group, serum PON-1 activity was significantly higher in healthy participants compared to post-MI patients, both at baseline (p=0.020) and after the intervention (p=0.021) (results no shown). Interestingly, following 6 months of HP-EVOO consumption, serum PON-1 activity exhibited a significant increase in post-MI patients compared to baseline (PMI: mean difference = 3.68 ± 11.90 U/mL, p = 0.014) (Figure 4)
Results from the EVOO and ROO groups showed no significant changes in PON-1 activity wither among healthy participants, and a slight increase in post-MI patients (mean difference = 2.63 ± 36.78 U/mL); however, these changes were not statistically significant.
MDA levels decreased slightly in both healthy (mean difference = –4.56 ± 8.27 mmol/L) and post-MI participants (mean difference = –2.66 ± 5.05 mmol/L) in the HP-EVOO group. A similar downward trend was observed in the ROO group for both healthy individuals (mean difference = –6.05 ± 4.91 mmol/L, p=0.055) and post-MI individuals (mean difference = –5.50 ± 3.33, p=0.059). However, in the EVOO group, results showed a reduction in MDA levels among healthy participants (mean difference = –7.05 ± 4.99 mmol/L), and an increase among post-MI individuals (mean difference = 4.22 ± 7.02 mmol/L). Despite these trends, none of the changes were statistically significant (Figure 5). One-way ANOVA and Kruskal–Wallis tests showed no significant differences in plasma MDA among healthy participants across the three oil groups, nor among post-MI participants.
LCAT activity slightly decreased after 6 months of consumption HP-EVOO for in both healthy (mean difference = -0.006 ± 0.011) and post-MI participants (mean difference = -0.0062 ± 0.0137), as well as after ROO consumption in post-MI patients (mean difference = -0.0163 ± 0.0419). In contrast, an increase in LCAT activity was observed in both healthy (mean difference = 0.0054 ± 0.0063) and post-MI participants (mean difference = 0.002 ± 0.008, p= 0.332) following EVOO intake, and in healthy participants (mean difference = 0.004 ± 0.012) only after ROO intake. However, these changes were not statistically significant (Figure 6).
4. Discussion
In this 26-week pilot randomized clinical trial, we investigated the effects of consuming 25 mg/day of three types of olive oil on oxidative stress biomarkers and HDL functionality. Our results showed a significant increase in serum FRAP and PON-1 activity in post-MI patients (aged 65-85) after consuming 25 mg/day of HP-EVOO, compared to baseline. No adverse effects were observed. These findings suggest that incorporating 25 mg/day of HP-EVOO into the daily diet may enhance HDL functionality, particularly its antioxidant activity, and may also improve the plasma total antioxidant capacity in patients with previous MI.
Participants in both groups received supplementation with three types of olive oil over a period of six months. The daily intake of 25 mL of each oil, in our conditions, corresponded to a daily intake of 2.70 mg Tyr and 5.30 mg HTyr for the HP-EVOO, 0.14 mg and 0.18 mg, respectively, for the standard EVOO, and undetectable levels of these phenolic compounds for the ROO. The total intake of phenolic compounds (Tyr + HTyr) of 8 mg/day (with HP-EVOO) is even above the dose (5 mg/day) recommended by the EFSA to achieve beneficial health effects, including protection of LDL particles from oxidative damage and modulation of HDL levels [12,13]. Interestingly, our study did not reveal any significant differences in fasting plasma (poly)phenol levels, despite the substantial variation in (poly)phenol content among the three oils used. However, a trend toward increased levels was observed in participants supplemented with HP-EVOO, both in healthy individuals and post-MI patients. One possible explanation for this finding might be the rapid clearance of (poly)phenols from plasma. Previous studies have shown that the peak plasma concentration of HTyr metabolites occurs approximately 30 minutes after intake and declines sharply within 2 hours post-administration [34,35]. In the present study, blood samples were collected after a 12-hour fasting period, which likely reduced the likelihood of detecting peak levels. Additionally, the substantial inter-individual variability in phenolic compounds absorption, as previously reported [36,37], warrants consideration as well.
Olive oil was selected for this study, as it has been identified as the optimal matrix for Tyr/HTyr [36]. Similarly, Wood et al., reported no significant changes in fasting plasma total (poly)phenol levels after 12 weeks of wild blueberry supplementation (providing 302 mg of anthocyanins) in healthy older individuals [38]. However, they observed a significant increase in 24-hour urinary excretion of (poly)phenol metabolites in the intervention group compared to the control group [38]. Unfortunately, our study did not include the collection of urinary samples from participants. In contrast, a randomized clinical trial in obese adults aged 40-65 years showed that replacing regular olive oil with an EVOO rich in oleocanthal and oleacein for 4 weeks significantly increased fasting plasma concentrations of HTyr in individuals with prediabetes and obesity [39].
The assessment of oxidative stress status is important, since it has been shown that ox-LDL plays a crucial role in the initiation of atherosclerotic plaque formation [40,41] and serves as a prognostic predictor in patients with chronic congestive heart failure [42]. Numerous in vitro and in vivo studies have demonstrated that (poly)phenols, particularly HTyr, exert cardioprotective effects by reducing oxidative stress and enhancing antioxidant biomarkers [10,43,44,45]. While our result showed no significant changes in plasma MDA levels, a marker of lipid oxidative stress, Fitó et al., reported a significant reduction in plasma lipid peroxide levels following the consumption of 50 ml/day of virgin olive oil for 3 weeks in patients with stable coronary heart disease [46]. Ikonomidis et al., also reported a significant decrease in MDA levels following a 4-week intervention in which patients took four capsules per day, each containing 412.5 mg of olive oil and 2.5 mg of HTyr, in patients with chronic coronary artery syndrome [47]. Consistently, Colica et al., demonstrated that the intake of two gastroresistant capsules containing 15 mg/day of HTyr for 3 weeks significantly reduced MDA levels in healthy individuals. They also showed that HTyr supplementation significantly increased the plasma HTyr, thiol groups, and total antioxidant status (TAS) [48]. However, the daily HTyr dose in their study (15 mg) was two times higher than that used in our own. In line with this, our study found that the HP-EVOO intervention for 26 weeks increased serum FRAP levels in post-MI individuals. Similarly, in a randomized crossover trial, short-term consumption of phenol-rich EVOO (69 g/day for 3 weeks) resulted in a slight, non-significant increase in FRAP in healthy individuals [49].
Regarding HDL functionality, a placebo-controlled intervention study found that co-supplementation of 9.9 mg of HTyr and 195 mg of punicalagin, taken three times per day for 8 weeks in healthy adults aged 45-65, did not lead to changes in ox-LDL, total plasma lipid peroxides, antioxidant capacity or PON-1 levels [50]. In contrast, our study measured PON-1 activity rather than its concentration. Modulating PON-1 activity may serve as a promising therapeutic target to reduce the prevalence of atherosclerosis and its clinical complications [51]. PON-1 is an HDL-associated enzyme with antioxidant properties that help protect against oxidative stress [52]. Additionally, PON-1 has been shown to reduce inflammation by limiting LDL oxidation, thus playing a crucial role in preventing the initial stage of foam cell formation [53]. In our study, participants in the HP-EVOO group showed that serum PON-1 activity was significantly lower in post-MI patients compared to the healthy group at baseline. This finding is consistent with previous studies demonstrating that serum PON-1 activity is significantly reduced in patients with myocardial infarction, potentially contributing to the development of coronary artery disease [54]. Furthermore, the results of the present study indicate that the intake of 25 mg/day of HP-EVOO for 26 weeks significantly increased serum PON-1 activity in elderly post-MI patients. These findings suggest that regular consumption of EVOO, rich in (poly)phenols, particularly Tyr/HTyr, may enhance antioxidant status and help reduce the risk of recurrent CVD. This finding suggests that olive oil may exert cardiovascular protective effects not only through its polyphenol content— depending on their concentration—but also via its specific fatty acid composition. Oleic acid, the predominant monounsaturated fatty acid in olive oil, appears to positively influence PON-1 activity [55]. These observations are consistent with the study by Nguyen and Sok, which demonstrated that oleic acid protects PON-1 from oxidative inactivation and enhances its stability, in contrast to polyunsaturated fatty acids, which tend to inhibit its activity [56].
It is important to note that all post-MI participants were on stable statin therapy for 3 to 4 months prior to the beginning of the intervention and continued its use throughout the study period. Therefore, it is unlikely that statins alone accounted for the observed improvements in PON-1 activity and FRAP levels during the intervention.
Among the various enzymes involved in HDL remodeling, LCAT plays a crucial role. It facilitates HDL maturation by converting free cholesterol into cholesteryl esters, thereby promoting the transformation of nascent, discoidal HDL into a spherical, functionally active form [52]. Given this role, LCAT has been proposed as a potential therapeutic target for CVDs.
Farràs et al., reported that a 3-week intake of 25 mL/day of high-phenolic compound virgin olive oil (500 ppm) increased LCAT activity compared to low-phenolic compound virgin olive oil (80 ppm) in hypercholesterolemic individuals [57]. In contrast, our present study showed no significant change in LCAT activity following the intervention.
Although LCAT has long been considered a key enzyme in reverse cholesterol transport (RCT) and atheroprotection, studies in both animal models and humans have yielded conflicting results, likely due to unclear underlying mechanisms [58,59]. Elevated LCAT levels are typically associated with increased HDL-C concentrations; however, this does not consistently result in enhanced atheroprotective effects. Conversely, reduced LCAT levels and activity are often linked to lower HDL-C levels, yet this is not always accompanied by a greater extent of atherosclerosis [60]. These inconsistencies suggest that LCAT activity alone may not reliably reflect HDL functionality or its protective role in cardiovascular disease. Moreover, evidence indicates that cholesterol efflux from macrophages and RCT can still proceed even in the absence of functional LCAT, challenging earlier assumptions about its indispensable role [61].
Findings from the IMPROVE study, which included 540 European individuals at high cardiovascular risk, showed no association between plasma LCAT concentrations and carotid intima-media thickness (IMT), a marker of preclinical atherosclerosis, in the overall population, even after adjusting for age, sex, HDL-C, and triglycerides. These results further support the view that LCAT is not essential for effective RCT and that low LCAT levels are not necessarily linked to increased atherosclerosis risk [62].
Stadler et al., study showed that LCAT activity was not associated with the incidence of atherosclerotic cardiovascular events or kidney function decline during a 5-year follow-up in 453 non-dialysis CKD patients from the CARE FOR HOMe study. while low LCAT activity was independently associated with all-cause mortality and acute decompensated heart failure (ADHF) [63].
Altogether, these findings underscore that while LCAT plays a role in HDL metabolism, its impact on atherosclerosis is highly context-dependent and influenced by genetic, metabolic, and sex-specific factors. Thus, future preventative or therapeutic strategies should consider these complexities rather than relying solely on LCAT activity as a marker of cardiovascular protection.
An important factor to consider when interpreting the outcome results is that levels of total cholesterol, LDL-C, HDL-C, and non-HDL cholesterol were significantly higher in healthy participants compared to post-MI patients at both baseline and after the intervention within the HP-EVOO group. Similar results were observed in the EVOO group, except for HDL-C, which did not differ significantly between the two populations.
The first strength of this study lies in its comparison of three types of oils, with ROO serving as the control group. Secondly, instead of merely quantifying enzymes associated with HDL function, this study focused on measuring enzyme activity. A third strength is the examination of the long-term effects of consuming HP-EVOO compared to regular EVOO and ROO. Additionally, we selected oils from high-quality, technologically advanced products that possessed the specific characteristics necessary for this study. Moreover, the inclusion of both healthy elderly participants and post-MI patients allowed more comprehensive investigation of the effects. Finally, this study incorporated HTyr into the participants’ diet within the food matrix of EVOO, which has previously been shown to enhance HTyr bioavailability.
Nevertheless, the present study has certain limitation. One limitation was the relatively small sample size, which may have reduced the statistical power to detect differences in biomarkers with high interindividual variability in some groups. Another limitation was the lack of assessment of physical activity or other lifestyle factors, which could have influenced the results. Additionally, the study did not examine mechanistic outcomes such as changes in gut microbiota, cellular signaling pathways, gene expression, or enzyme activities related to cardiovascular health. These aspects should be explored in future research.
5. Conclusions
Overall, this pilot study demonstrated that consuming HP-EVOO may have beneficial effects on the antioxidant status of patients with a history of myocardial infarction, such as FRAP and PON-1 activity. Although the cardiovascular protective effects of HTyr have been documented, further long-term clinical studies involving diverse populations are needed. These studies should account for environmental, lifestyle, and genetic variations to define more clearly the specific effects of HTyr on oxidative stress and HDL functionality. Notably, HDL functionality and the distribution of its subclasses have been shown to be more important than HDL quantity in the prevention of CVD.
Author Contributions
Conceptualization, funding acquisition, methodology, review, and editing, A.K.; T.F. and M.N. Methodology, data creation, writing and analyzing M.M., M.A., N.Z., and H.B.; original draft preparation, M.M. All authors have read and agreed to the published version of the manuscript.
Funding
This research was funded by the Canadian Institutes of Health Research (CIHR) (grant number #PJT162366).
Institutional Review Board Statement
The study protocol was approved in accordance with the Declaration of Helsinki and approved by the Sherbrooke University Hospital Center Ethics Committee (#2019-3145). All participants provided written informed consent prior to enrollment.
Informed Consent Statement
Informed consent was obtained from all subjects involved in the study.
Data Availability Statement
Data are contained within the article.
Conflicts of Interest
The authors declare no conflicts of interest.
References
- Nedkoff L, Briffa T, Zemedikun D, Herrington S, Wright FL. Global Trends in Atherosclerotic Cardiovascular Disease. Clin Ther. 2023 Nov;45(11):1087–91. [CrossRef]
- Wolf D, Ley K. Immunity and Inflammation in Atherosclerosis. Circ Res. 2019 Jan 18;124(2):315–27.
- Libby P, Buring JE, Badimon L, Hansson GK, Deanfield J, Bittencourt MS, et al. Atherosclerosis. Nature Reviews Disease Primers. 2019 Aug 16;5(1):56.
- Kariuki JK, Imes CC, Engberg SJ, Scott PW, Klem ML, Cortes YI. Impact of lifestyle-based interventions on absolute cardiovascular disease risk: a systematic review and meta-analysis. JBI Evid Synth. 2024 Jan 1;22(1):4–65. [CrossRef]
- Zhang W, Zheng Y, Yan F, Dong M, Ren Y. Research progress of quercetin in cardiovascular disease. Front Cardiovasc Med. 2023;10:1203713. [CrossRef]
- Bonaccio M, Di Castelnuovo A, Costanzo S, Persichillo M, De Curtis A, Cerletti C, et al. Interaction between Mediterranean diet and statins on mortality risk in patients with cardiovascular disease: Findings from the Moli-sani Study. Int J Cardiol. 2019 Feb 1;276:248–54. [CrossRef]
- Guasch-Ferré M, Hu FB, Martínez-González MA, Fitó M, Bulló M, Estruch R, et al. Olive oil intake and risk of cardiovascular disease and mortality in the PREDIMED Study. BMC Med. 2014 May 13;12:78.
- Guo X, Tresserra-Rimbau A, Estruch R, Martínez-González MA, Medina-Remón A, Castañer O, et al. Effects of Polyphenol, Measured by a Biomarker of Total Polyphenols in Urine, on Cardiovascular Risk Factors After a Long-Term Follow-Up in the PREDIMED Study. Oxid Med Cell Longev. 2016;2016:2572606.
- Covas MI, Nyyssönen K, Poulsen HE, Kaikkonen J, Zunft HJF, Kiesewetter H, et al. The effect of polyphenols in olive oil on heart disease risk factors: a randomized trial. Ann Intern Med. 2006 Sep 5;145(5):333–41.
- Perrone MA, Gualtieri P, Gratteri S, Ali W, Sergi D, Muscoli S, et al. Effects of postprandial hydroxytyrosol and derivates on oxidation of LDL, cardiometabolic state and gene expression: a nutrigenomic approach for cardiovascular prevention. J Cardiovasc Med (Hagerstown). 2019 Jul;20(7):419–26.
- Boronat A, Mateus J, Soldevila-Domenech N, Guerra M, Rodríguez-Morató J, Varon C, et al. Cardiovascular benefits of tyrosol and its endogenous conversion into hydroxytyrosol in humans. A randomized, controlled trial. Free Radic Biol Med. 2019 Nov 1;143:471–81. [CrossRef]
- EFSA Panel on Dietetic Products N and A (NDA). Scientific opinion on the substantiation of health claims related to polyphenols in olive and protection of LDL particles from oxidative damage (ID 1333, 1638, 1639, 1696, 2865), maintenance of normal blood HDL cholesterol concentrations (ID 1639), maintenance of normal blood pressure (ID 3781),“anti-inflammatory properties”(ID 1882),“contributes to the upper respiratory tract health”(ID 3468),“can help to maintain a normal function of gastrointestinal tract”(3779), and “contributes to body defences against external agents”(ID 3467) pursuant to Article 13 (1) of Regulation (EC) No 1924/2006. EFSA journal. 2011;9(4):2033.
- Mancebo-Campos V, Salvador MD, Fregapane G. EFSA Health Claims-Based Virgin Olive Oil Shelf-Life. Antioxidants (Basel). 2023 Aug 4;12(8). [CrossRef]
- Visioli F, Poli A, Gall C. Antioxidant and other biological activities of phenols from olives and olive oil. Med Res Rev. 2002 Jan;22(1):65–75.
- De la Torre-Carbot K, Jauregui O, Gimeno E, Castellote AI, Lamuela-Raventós RM, López-Sabater MC. Characterization and quantification of phenolic compounds in olive oils by solid-phase extraction, HPLC-DAD, and HPLC-MS/MS. Journal of agricultural and food chemistry. 2005;53(11):4331–40. [CrossRef]
- Fitó M, Cladellas M, De La Torre R, Marti J, Alcántara M, Pujadas-Bastardes M, et al. Antioxidant effect of virgin olive oil in patients with stable coronary heart disease: a randomized, crossover, controlled, clinical trial. Atherosclerosis. 2005;181(1):149–58. [CrossRef]
- Zrelli H, Kusunoki M, Miyazaki H. Role of hydroxytyrosol-dependent regulation of HO-1 expression in promoting wound healing of vascular endothelial cells via Nrf2 de novo synthesis and stabilization. Phytotherapy Research. 2015;29(7):1011–8. [CrossRef]
- Wang W chen, Xia Y min, Yang B, Su X ni, Chen J kuan, Li W, et al. Protective Effects of Tyrosol against LPS-Induced Acute Lung Injury via Inhibiting NF-κB and AP-1 Activation and Activating the HO-1/Nrf2 Pathways. Biological and Pharmaceutical Bulletin. 2017;40(5):583–93.
- Vijakumaran U, Shanmugam J, Heng JW, Azman SS, Yazid MD, Haizum Abdullah NA, et al. Effects of Hydroxytyrosol in Endothelial Functioning: A Comprehensive Review. Molecules. 2023 Feb 16;28(4). [CrossRef]
- Karković Marković A, Torić J, Barbarić M, Jakobušić Brala C. Hydroxytyrosol, Tyrosol and Derivatives and Their Potential Effects on Human Health. Molecules. 2019 May 24;24(10).
- Hohmann CD, Cramer H, Michalsen A, Kessler C, Steckhan N, Choi K, et al. Effects of high phenolic olive oil on cardiovascular risk factors: A systematic review and meta-analysis. Phytomedicine. 2015 Jun 1;22(6):631–40.
- George ES, Marshall S, Mayr HL, Trakman GL, Tatucu-Babet OA, Lassemillante ACM, et al. The effect of high-polyphenol extra virgin olive oil on cardiovascular risk factors: A systematic review and meta-analysis. Critical Reviews in Food Science and Nutrition. 2019 Sep 25;59(17):2772–95. [CrossRef]
- Morvaridzadeh M, Cohen AA, Heshmati J, Alami M, Berrougui H, Zoubdane N, et al. Effect of Extra Virgin Olive Oil on Anthropometric Indices, Inflammatory and Cardiometabolic Markers: a Systematic Review and Meta-Analysis of Randomized Clinical Trials. The Journal of Nutrition. 2024 Jan 1;154(1):95–120. [CrossRef]
- Feingold KR, Grunfeld C. Effect of inflammation on HDL structure and function. Current Opinion in Lipidology [Internet]. 2016;27(5). Available from: https://journals.lww.com/co-lipidology/fulltext/2016/10000/effect_of_inflammation_on_hdl_structure_and.12.aspx.
- Oprescu N, Micheu MM, Scafa-Udriste A, Popa-Fotea NM, Dorobantu M. Inflammatory markers in acute myocardial infarction and the correlation with the severity of coronary heart disease. Ann Med. 2021 Dec;53(1):1041–7. [CrossRef]
- Djekic S, Vekic J, Zeljkovic A, Kotur-Stevuljevic J, Kafedzic S, Zdravkovic M, et al. HDL Subclasses and the Distribution of Paraoxonase-1 Activity in Patients with ST-Segment Elevation Acute Myocardial Infarction. International Journal of Molecular Sciences. 2023;24(11). [CrossRef]
- Annema W, Willemsen HM, de Boer JF, Dikkers A, van der Giet M, Nieuwland W, et al. HDL function is impaired in acute myocardial infarction independent of plasma HDL cholesterol levels. Journal of clinical lipidology. 2016;10(6):1318–28. [CrossRef]
- Li S, Peng Y, Wang X, Qian Y, Xiang P, Wade SW, et al. Cardiovascular events and death after myocardial infarction or ischemic stroke in an older Medicare population. Clin Cardiol. 2019 Mar;42(3):391–9. [CrossRef]
- Farràs M, Fernández-Castillejo S, Rubió L, Arranz S, Catalán Ú, Subirana I, et al. Phenol-enriched olive oils improve HDL antioxidant content in hypercholesterolemic subjects. A randomized, double-blind, cross-over, controlled trial. The Journal of Nutritional Biochemistry. 2018 Jan 1;51:99–104. [CrossRef]
- Serafini M, Maiani G, Ferro-Luzzi A. Alcohol-free red wine enhances plasma antioxidant capacity in humans. J Nutr. 1998 Jun;128(6):1003–7. [CrossRef]
- Seres I, Paragh G, Deschene E, Fulop TJ, Khalil A. Study of factors influencing the decreased HDL associated PON1 activity with aging. Exp Gerontol. 2004 Jan;39(1):59–66. [CrossRef]
- Nezami N, Ghorbanihaghjo A, Rashtchizadeh N, Argani H, Tafrishinejad A, Ghorashi S, et al. Atherogenic changes of low-density lipoprotein susceptibility to oxidation, and antioxidant enzymes in pulmonary tuberculosis. Atherosclerosis. 2011 Jul;217(1):268–73. [CrossRef]
- Yagi, K. Yagi K. A simple fluorometric assay for lipoperoxide in blood plasma. Biochem Med. 1976 Apr;15(2):212–6. [CrossRef]
- Bender C, Strassmann S, Golz C. Oral Bioavailability and Metabolism of Hydroxytyrosol from Food Supplements. Nutrients. 2023 Jan 9;15(2). [CrossRef]
- Pastor A, Rodríguez-Morató J, Olesti E, Pujadas M, Pérez-Mañá C, Khymenets O, et al. Analysis of free hydroxytyrosol in human plasma following the administration of olive oil. Journal of Chromatography A. 2016 Mar 11;1437:183–90. [CrossRef]
- Alemán-Jiménez C, Domínguez-Perles R, Medina S, Prgomet I, López-González I, Simonelli-Muñoz A, et al. Pharmacokinetics and bioavailability of hydroxytyrosol are dependent on the food matrix in humans. Eur J Nutr. 2021 Mar;60(2):905–15. [CrossRef]
- de Bock M, Thorstensen EB, Derraik JGB, Henderson HV, Hofman PL, Cutfield WS. Human absorption and metabolism of oleuropein and hydroxytyrosol ingested as olive (Olea europaea L.) leaf extract. Mol Nutr Food Res. 2013 Nov;57(11):2079–85. [CrossRef]
- Wood E, Hein S, Mesnage R, Fernandes F, Abhayaratne N, Xu Y, et al. Wild blueberry (poly)phenols can improve vascular function and cognitive performance in healthy older individuals: a double-blind randomized controlled trial. Am J Clin Nutr. 2023 Jun;117(6):1306–19. [CrossRef]
- Ruiz-García I, Ortíz-Flores R, Badía R, García-Borrego A, García-Fernández M, Lara E, et al. Rich oleocanthal and oleacein extra virgin olive oil and inflammatory and antioxidant status in people with obesity and prediabetes. The APRIL study: A randomised, controlled crossover study. Clin Nutr. 2023 Aug;42(8):1389–98. [CrossRef]
- Poznyak AV, Nikiforov NG, Markin AM, Kashirskikh DA, Myasoedova VA, Gerasimova EV, et al. Overview of OxLDL and its impact on cardiovascular health: focus on atherosclerosis. Frontiers in Pharmacology. 2021;11:613780. [CrossRef]
- Jiang H, Zhou Y, Nabavi SM, Sahebkar A, Little PJ, Xu S, et al. Mechanisms of oxidized LDL-mediated endothelial dysfunction and its consequences for the development of atherosclerosis. Frontiers in cardiovascular medicine. 2022;9:925923. [CrossRef]
- Tsutsui T, Tsutamoto T, Wada A, Maeda K, Mabuchi N, Hayashi M, et al. Plasma oxidized low-density lipoprotein as a prognostic predictor in patients with chronic congestive heart failure. J Am Coll Cardiol. 2002 Mar 20;39(6):957–62. [CrossRef]
- Lopez-Huertas E, Fonolla J. Hydroxytyrosol supplementation increases vitamin C levels in vivo. A human volunteer trial. Redox Biology. 2017;11:384–9. [CrossRef]
- Jemai H, Fki I, Bouaziz M, Bouallagui Z, El Feki A, Isoda H, et al. Lipid-Lowering and Antioxidant Effects of Hydroxytyrosol and Its Triacetylated Derivative Recovered from Olive Tree Leaves in Cholesterol-Fed Rats. J Agric Food Chem. 2008 Apr 1;56(8):2630–6. [CrossRef]
- Calabriso N, Gnoni A, Stanca E, Cavallo A, Damiano F, Siculella L, et al. Hydroxytyrosol ameliorates endothelial function under inflammatory conditions by preventing mitochondrial dysfunction. Oxidative medicine and cellular longevity. 2018;2018(1):9086947. [CrossRef]
- Fitó M, Cladellas M, de la Torre R, Martí J, Alcántara M, Pujadas-Bastardes M, et al. Antioxidant effect of virgin olive oil in patients with stable coronary heart disease: a randomized, crossover, controlled, clinical trial. Atherosclerosis. 2005 Jul 1;181(1):149–58. [CrossRef]
- Ikonomidis I, Katogiannis K, Chania C, Iakovis N, Tsoumani M, Christodoulou A, et al. Association of hydroxytyrosol enriched olive oil with vascular function in chronic coronary disease. European Journal of Clinical Investigation. 2023 Jul 1;53(7):e13983. [CrossRef]
- Colica C, Di Renzo L, Trombetta D, Smeriglio A, Bernardini S, Cioccoloni G, et al. Antioxidant Effects of a Hydroxytyrosol-Based Pharmaceutical Formulation on Body Composition, Metabolic State, and Gene Expression: A Randomized Double-Blinded, Placebo-Controlled Crossover Trial. Oxid Med Cell Longev. 2017;2017:2473495.
- Vissers M, Zock P, Wiseman S, Meyboom S, Katan M. Effect of phenol-rich extra virgin olive oil on markers of oxidation in healthy volunteers. European Journal of Clinical Nutrition. 2001 May 1;55(5):334–41.
- Quirós-Fernández R, López-Plaza B, Bermejo LM, Palma-Milla S, Gómez-Candela C. Supplementation with Hydroxytyrosol and Punicalagin Improves Early Atherosclerosis Markers Involved in the Asymptomatic Phase of Atherosclerosis in the Adult Population: A Randomized, Placebo-Controlled, Crossover Trial. Nutrients. 2019 Mar 16;11(3). [CrossRef]
- Sirca TB, Mureșan ME, Pallag A, Marian E, Jurca T, Vicaș LG, et al. The Role of Polyphenols in Modulating PON1 Activity Regarding Endothelial Dysfunction and Atherosclerosis. Int J Mol Sci. 2024 Mar 4;25(5). [CrossRef]
- Mahrooz, A. Mahrooz A. Chapter Three - Pleiotropic functions and clinical importance of circulating HDL-PON1 complex. In: Makowski GS, editor. Advances in Clinical Chemistry [Internet]. Elsevier; 2024. p. 132–71. Available from: https://www.sciencedirect.com/science/article/pii/S0065242324000647.
- Kumar M, Ali W, Yadav K, Kaumri S, Mishra S, Nardi P, et al. High-Density Lipoprotein-Associated Paraoxonase-1 (PON-1) and Scavenger Receptor Class B Type 1 (SRB-1) in Coronary Artery Disease: Correlation with Disease Severity. Journal of Clinical Medicine. 2024;13(18). [CrossRef]
- Durrington PN, Bashir B, Soran H. Paraoxonase 1 and atherosclerosis. Frontiers in Cardiovascular Medicine. 2023;10:1065967.
- Manning PJ, Jong SA de, Ryalls AR, Sutherland WHF. Paraoxonase 1 activity in chylomicrons and VLDL: the effect of type 2 diabetes and meals rich in saturated fat and oleic acid. Lipids. 2012;47(3):259–67. [CrossRef]
- Boshtam M, Razavi AE, Pourfarzam M, Ani M, Naderi GA, Basati G, et al. Serum paraoxonase 1 activity is associated with fatty acid composition of high density lipoprotein. Dis Markers. 2013;35(4):273–80. [CrossRef]
- Farràs M, Castañer O, Martín-Peláez S, Hernáez Á, Schröder H, Subirana I, et al. Complementary phenol-enriched olive oil improves HDL characteristics in hypercholesterolemic subjects. A randomized, double-blind, crossover, controlled trial. The VOHF study. Molecular Nutrition & Food Research. 2015 Sep 1;59(9):1758–70.
- Oldoni F, Baldassarre D, Castelnuovo S, Ossoli A, Amato M, van Capelleveen J, et al. Complete and partial lecithin: cholesterol acyltransferase deficiency is differentially associated with atherosclerosis. Circulation. 2018;138(10):1000–7. [CrossRef]
- Kunnen S, Van Eck M. Lecithin: cholesterol acyltransferase: old friend or foe in atherosclerosis? Journal of lipid research. 2012;53(9):1783–99.
- Ossoli A, Pavanello C, Calabresi L. High-Density Lipoprotein, Lecithin: Cholesterol Acyltransferase, and Atherosclerosis. Endocrinol Metab. 2016 Jun 10;31(2):223–9.
- Tanigawa H, Billheimer JT, Tohyama J ichiro, Fuki IV, Ng DS, Rothblat GH, et al. Lecithin: cholesterol acyltransferase expression has minimal effects on macrophage reverse cholesterol transport in vivo. Circulation. 2009 Jul 14;120(2):160–9.
- Calabresi L, Baldassarre D, Simonelli S, Gomaraschi M, Amato M, Castelnuovo S, et al. Plasma lecithin:cholesterol acyltransferase and carotid intima-media thickness in European individuals at high cardiovascular risk. J Lipid Res. 2011 Aug;52(8):1569–74. [CrossRef]
- Stadler JT, Bärnthaler T, Borenich A, Emrich IE, Habisch H, Rani A, et al. Low LCAT activity is linked to acute decompensated heart failure and mortality in patients with CKD. Journal of Lipid Research [Internet]. 2024 Sep 1 [cited 2025 May 26];65(9). [CrossRef]
Figure 1.
Flow diagram of study design and participant allocation.
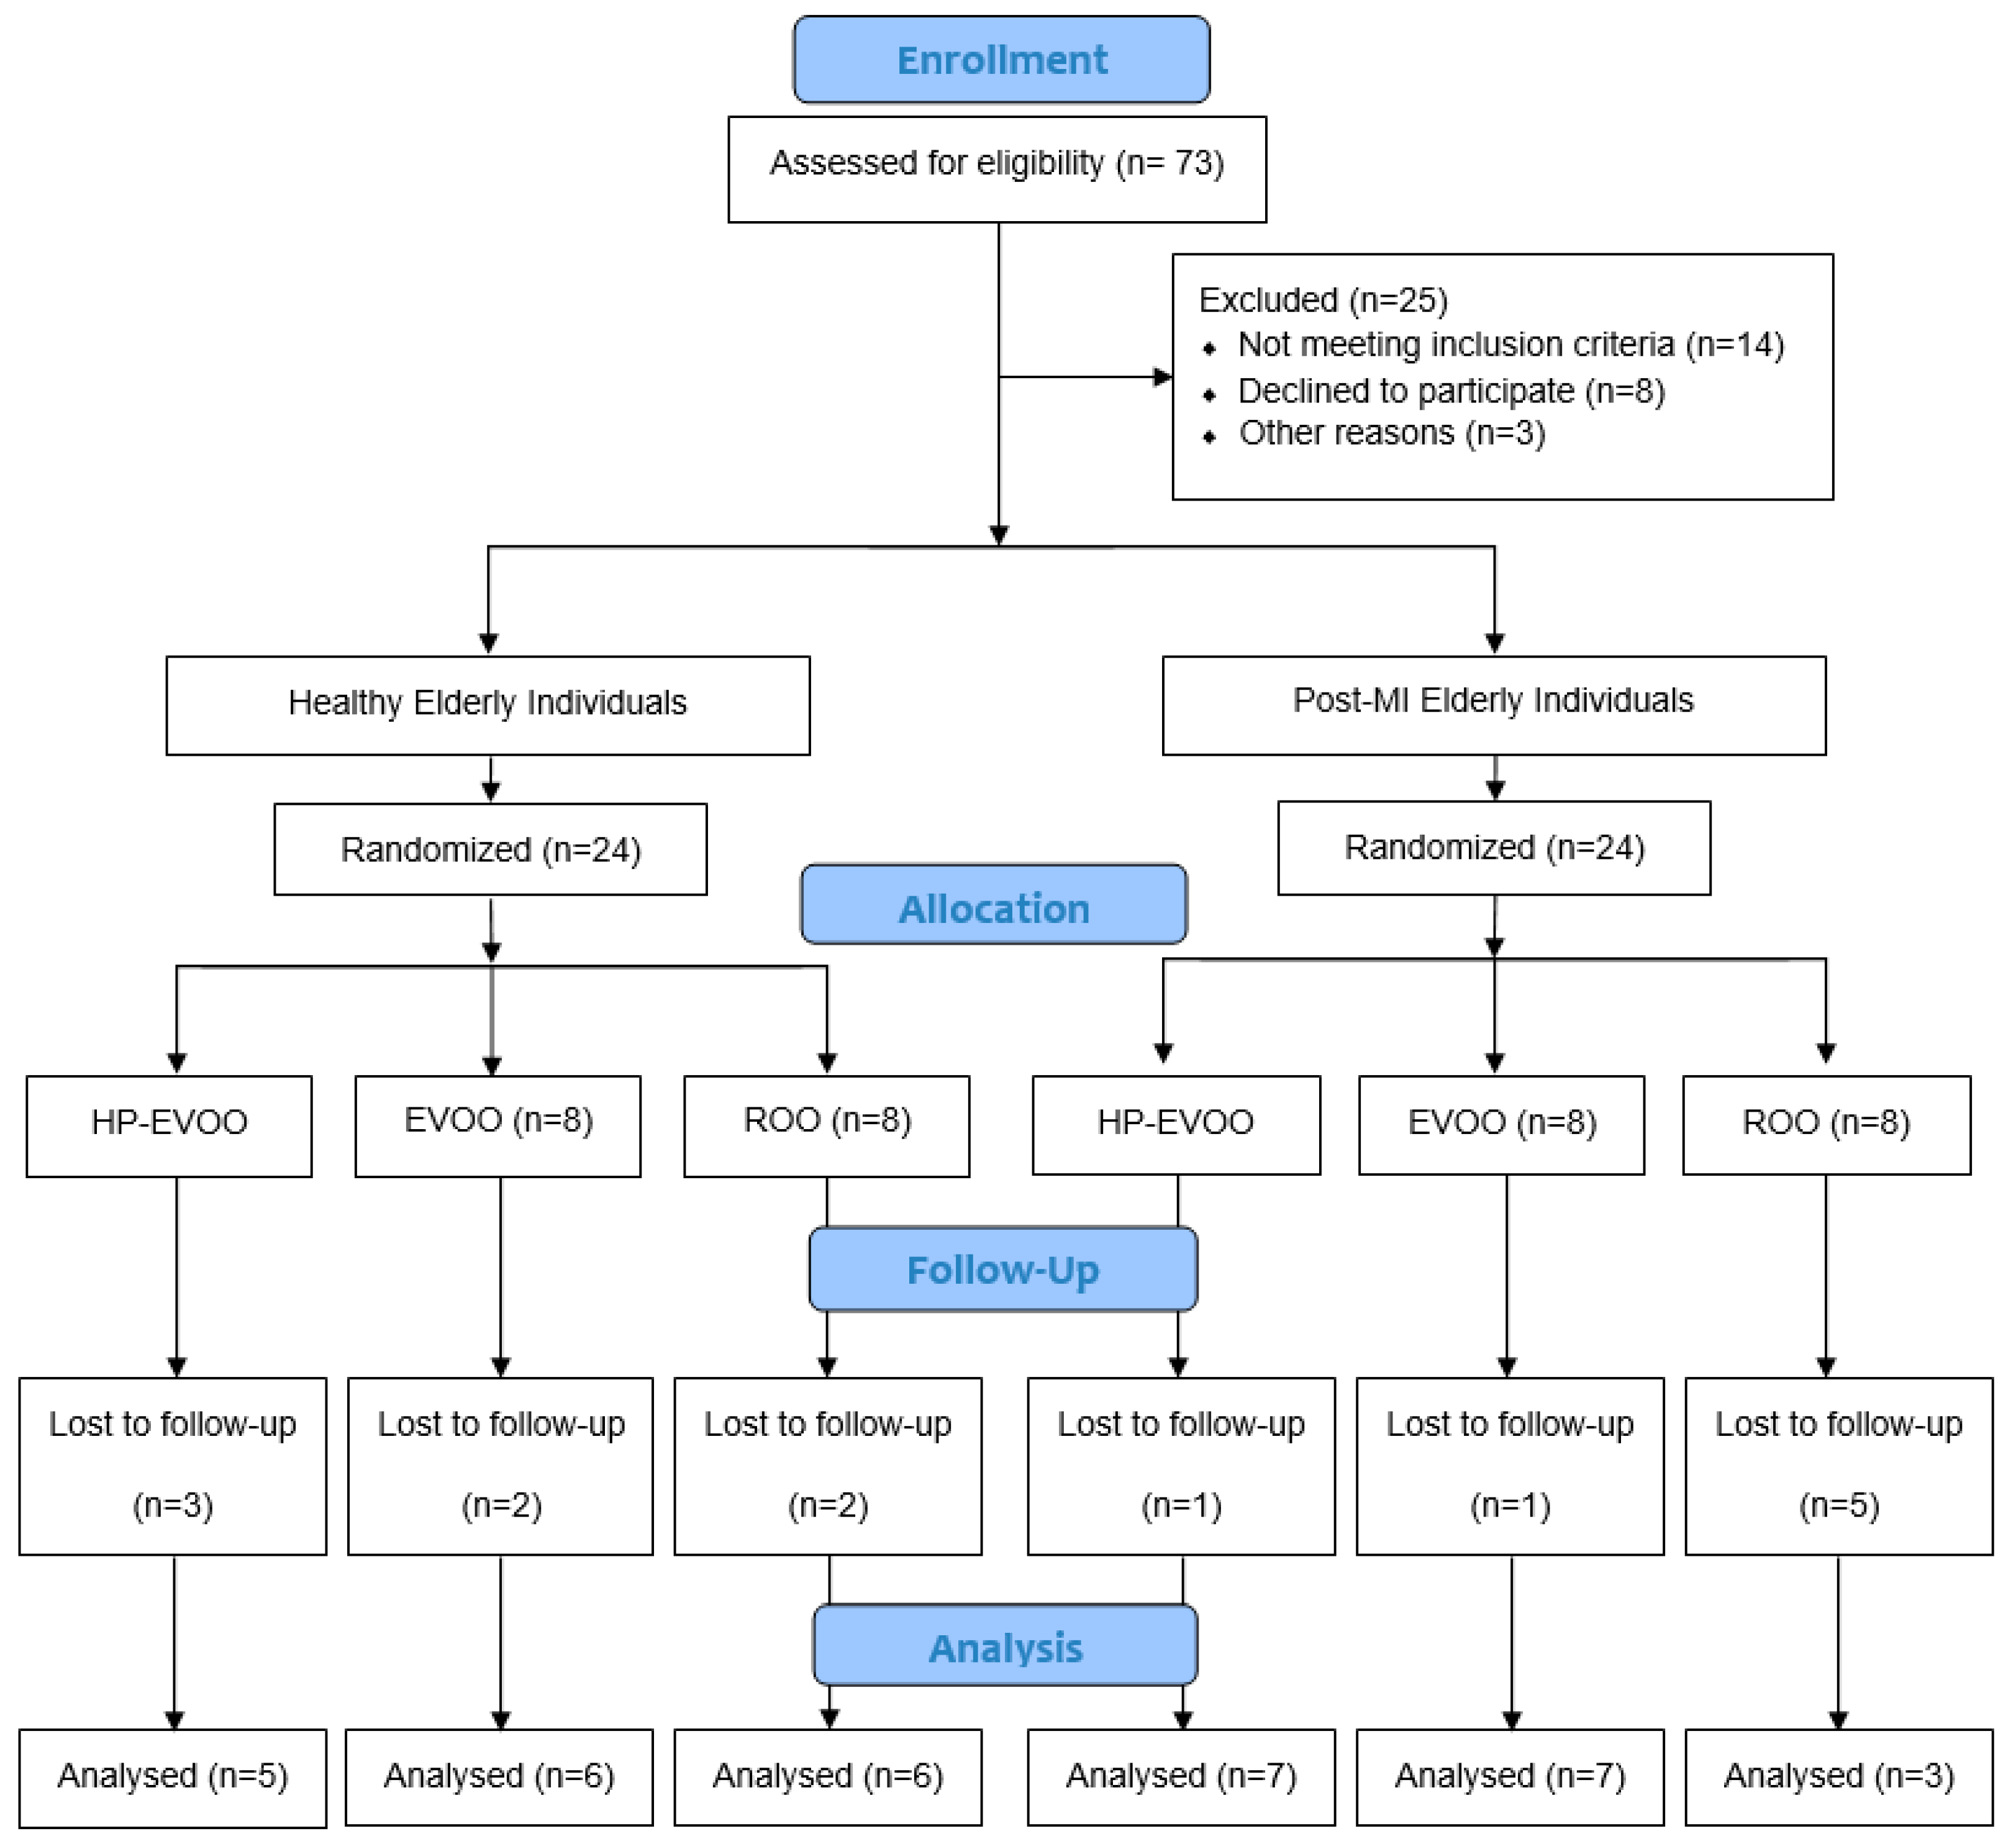
Figure 2.
Mean differences in plasma (poly)phenols (µg GAE/ml) after six months of intervention with three types of oils. A: High polyphenol extra virgin olive oil (HP-EVOO), B: Extra virgin olive oil (EVOO), and C: Refined olive oil (ROO), in healthy (H) and post-myocardial infarction (post-MI) participants.
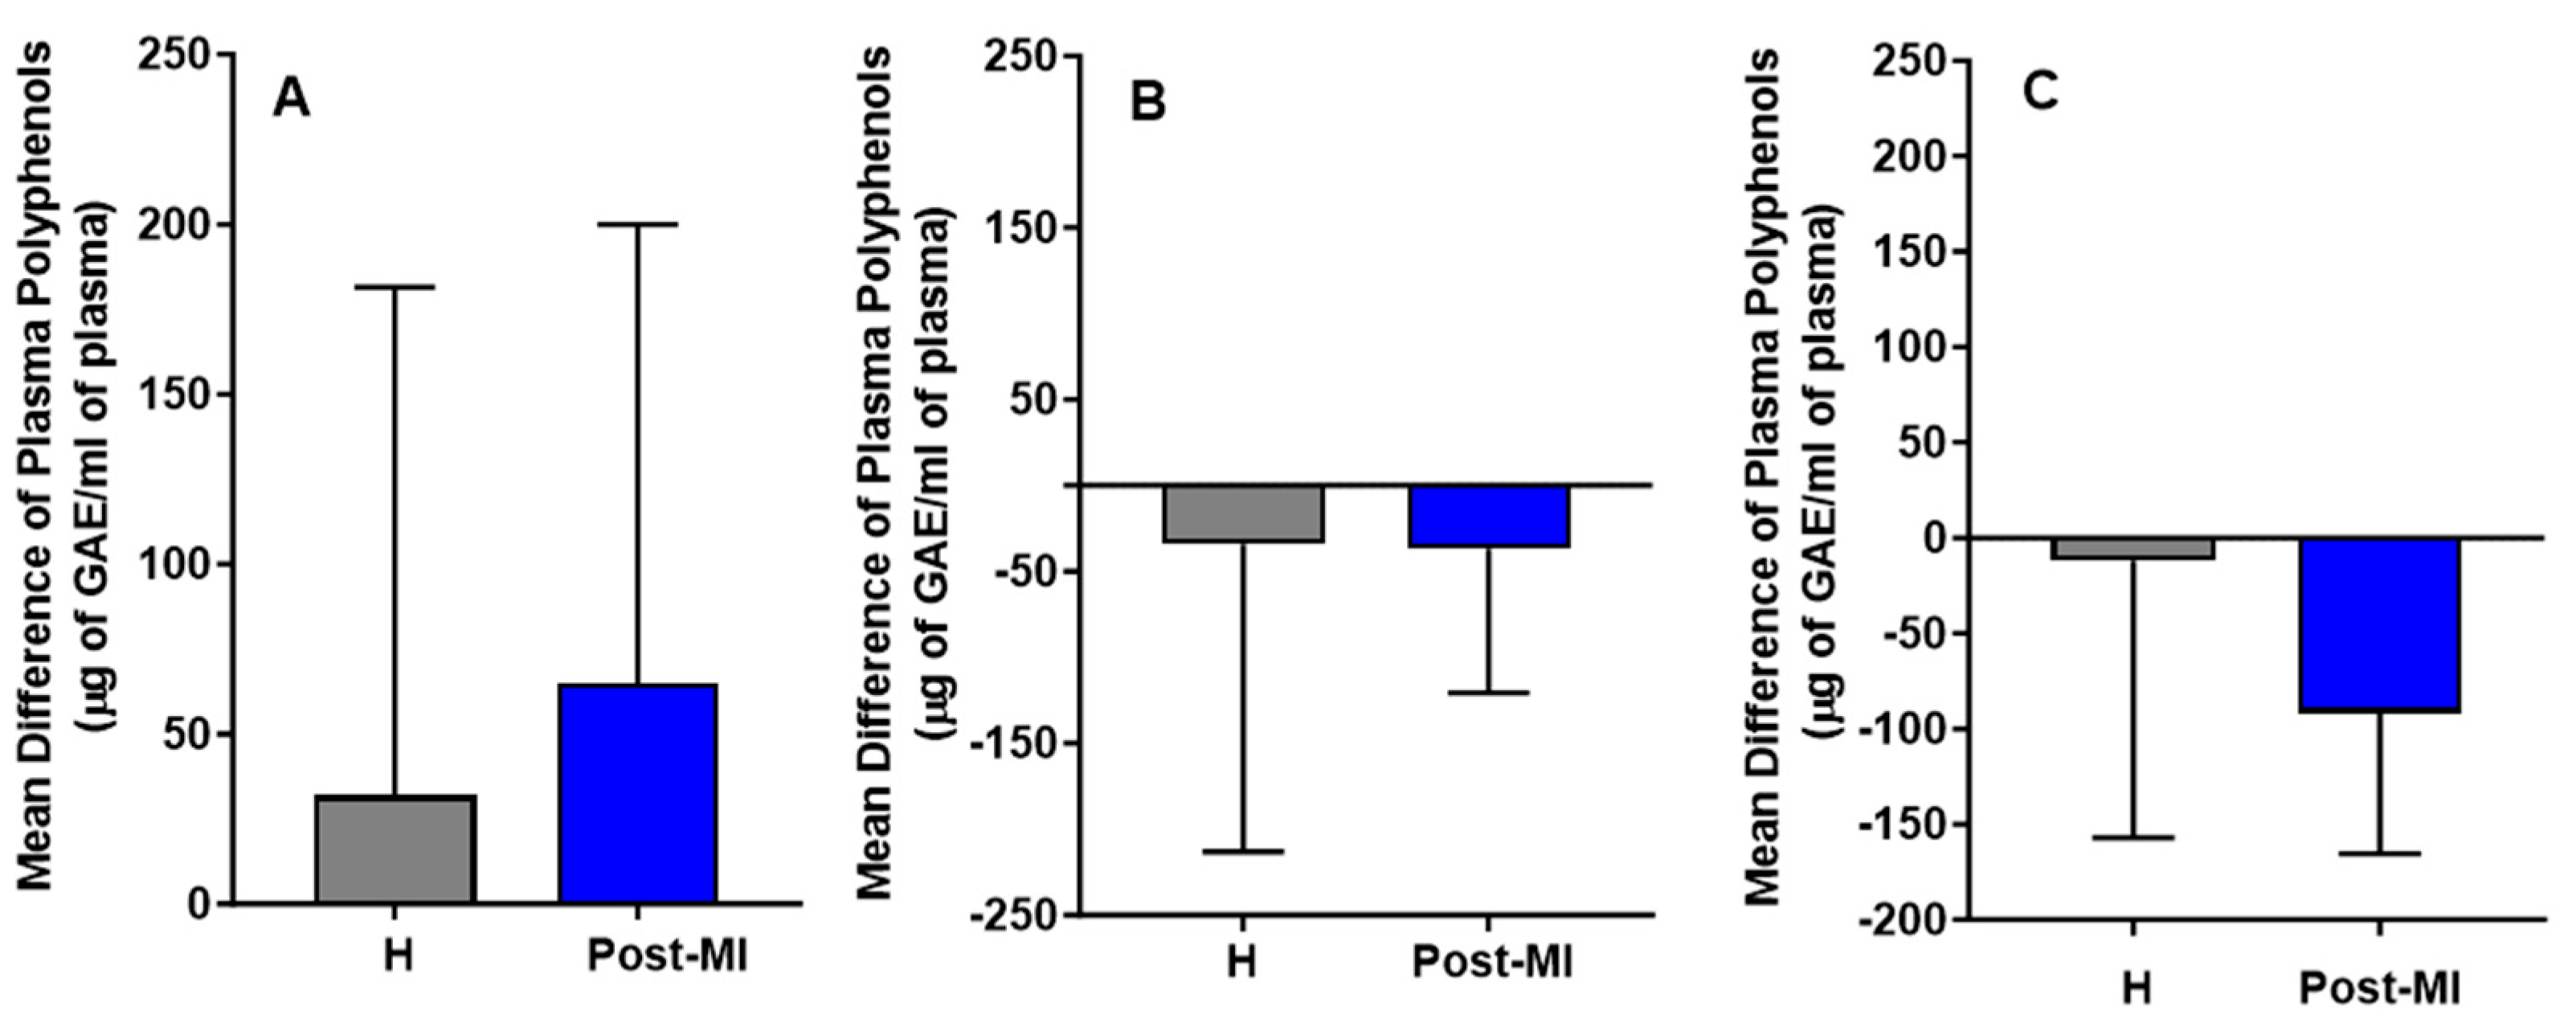
Figure 3.
Serum FRAP (µM Fe2+) levels before and after six months of intervention with three types of oils. A: High polyphenol extra virgin olive oil (HP-EVOO), B: Extra virgin olive oil (EVOO), and C: Refined olive oil (ROO), in healthy (H) and post-myocardial infarction (post-MI) participants. ***p<0.01, **p<0.02*, p ≤ 0.05.
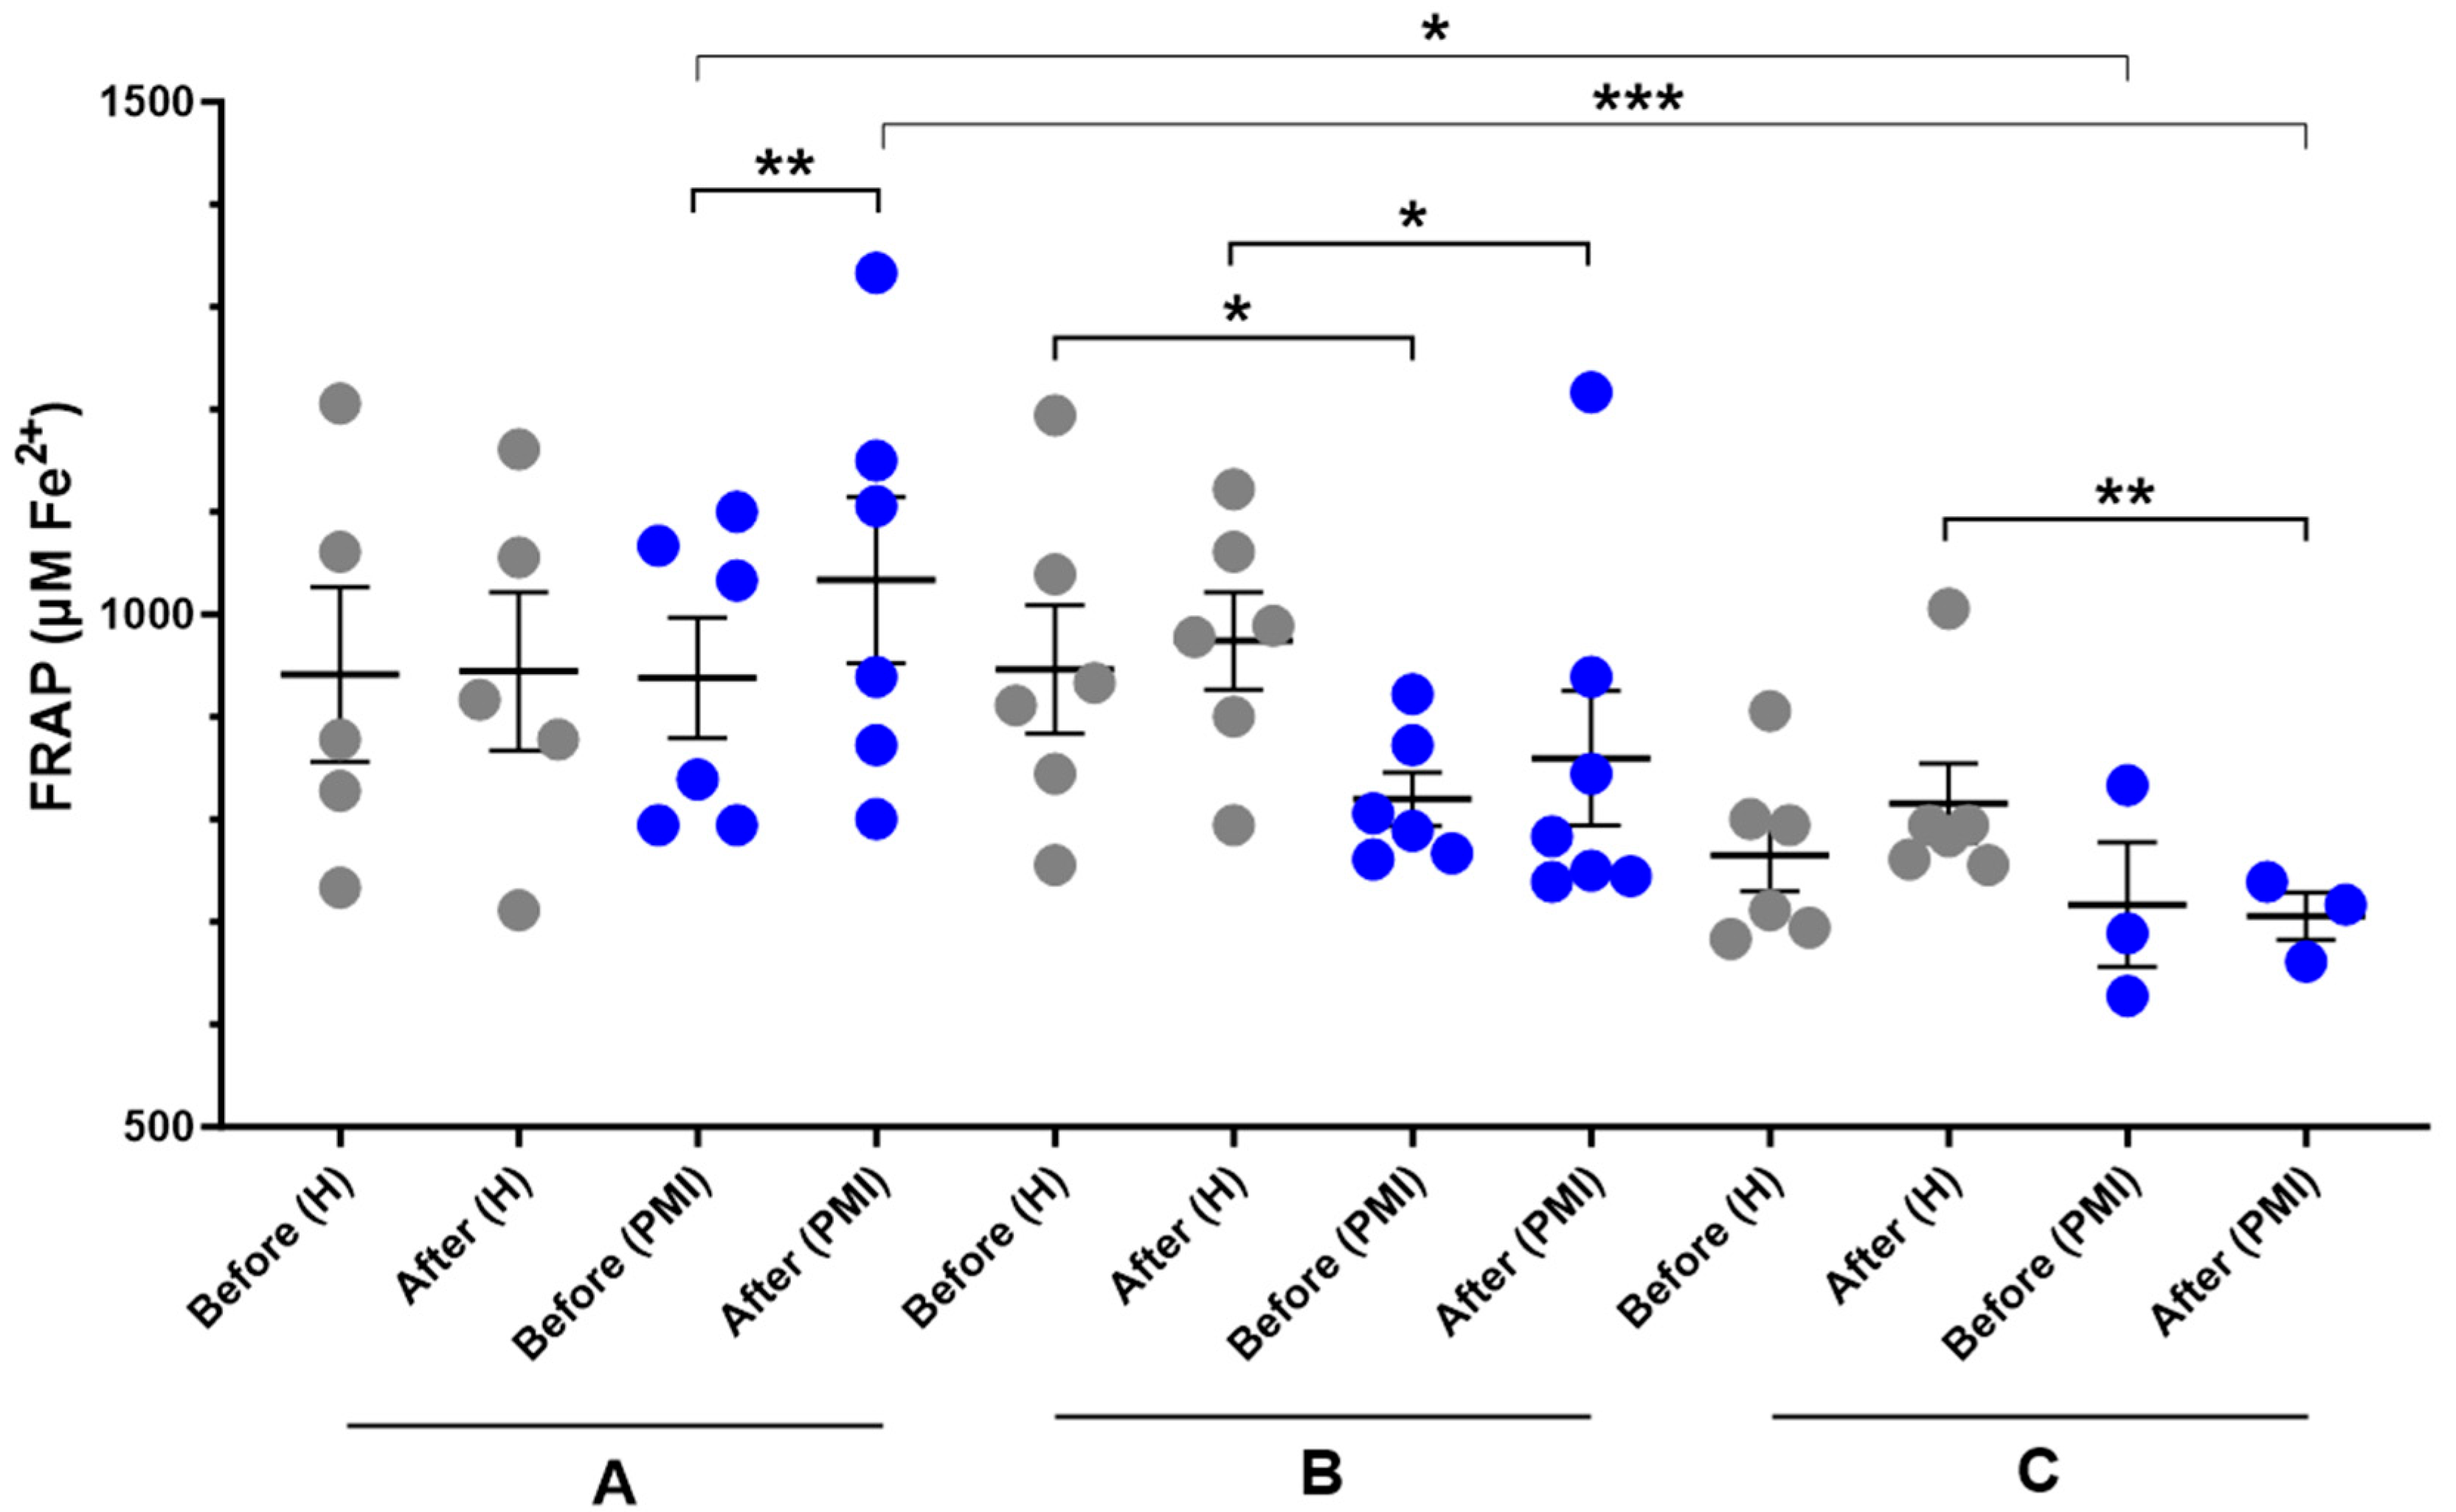
Figure 4.
Mean differences of serum PON-1 activity (U/ml) after six months of intervention with three types of olive oils. A: High polyphenol extra virgin olive oil (HP-EVOO), B: Extra virgin olive oil (EVOO), and C: Refined olive oil (ROO), in healthy (H) and post-myocardial infarction (post-MI) participants. **p<0.02.
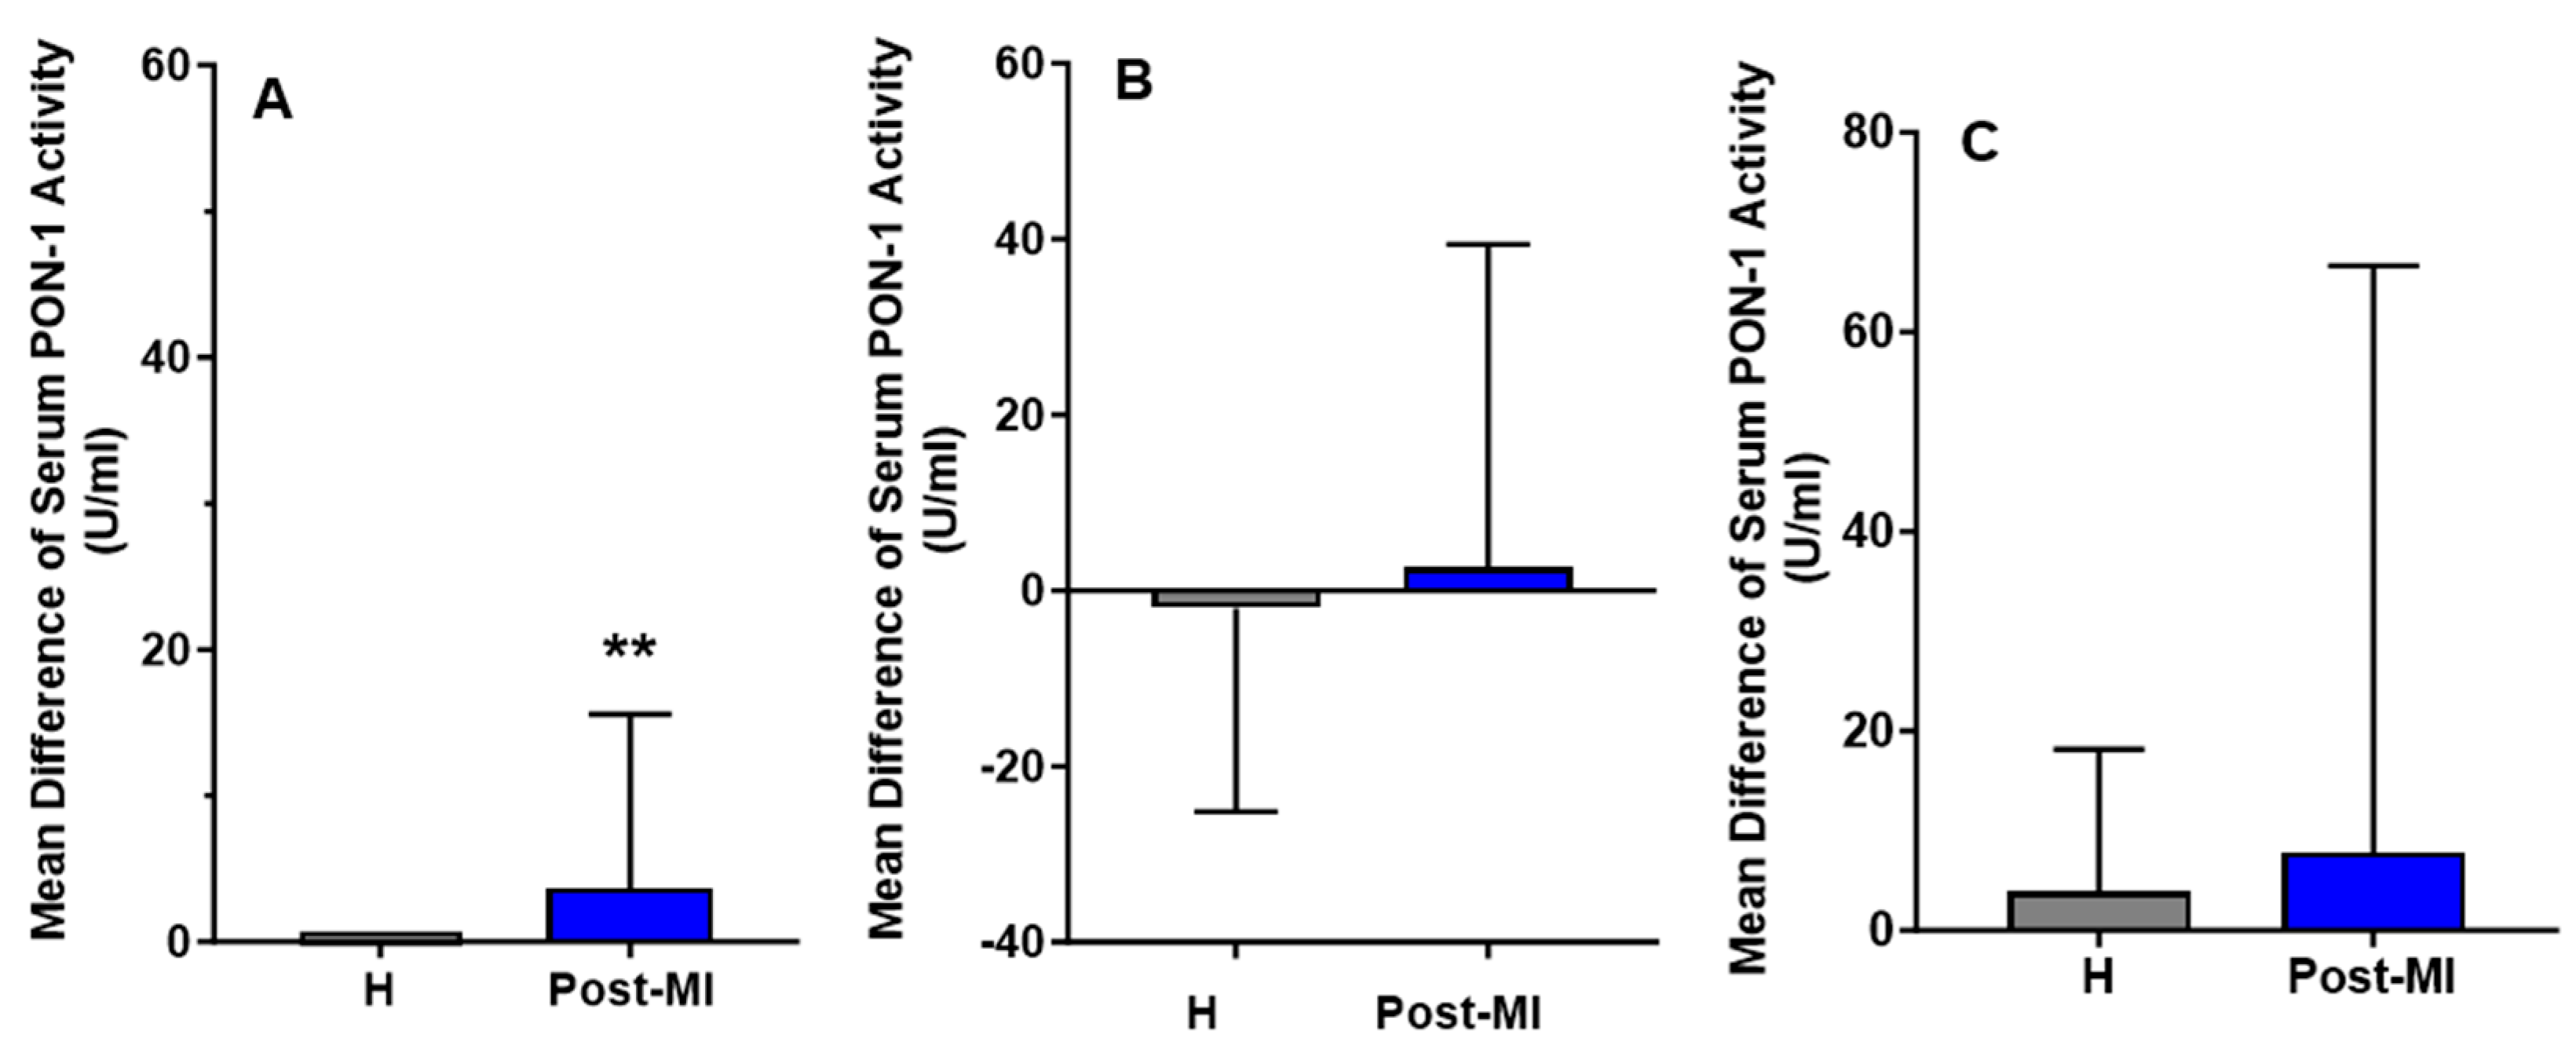
Figure 5.
Mean differences of plasma MDA levels (µmol/L) after six months of intervention with three types of oils. A: High polyphenol extra virgin olive oil (HP-EVOO), B: Extra virgin olive oil (EVOO), and C: Refined olive oil (ROO), in healthy (H) and post-myocardial infarction (post-MI) participants.
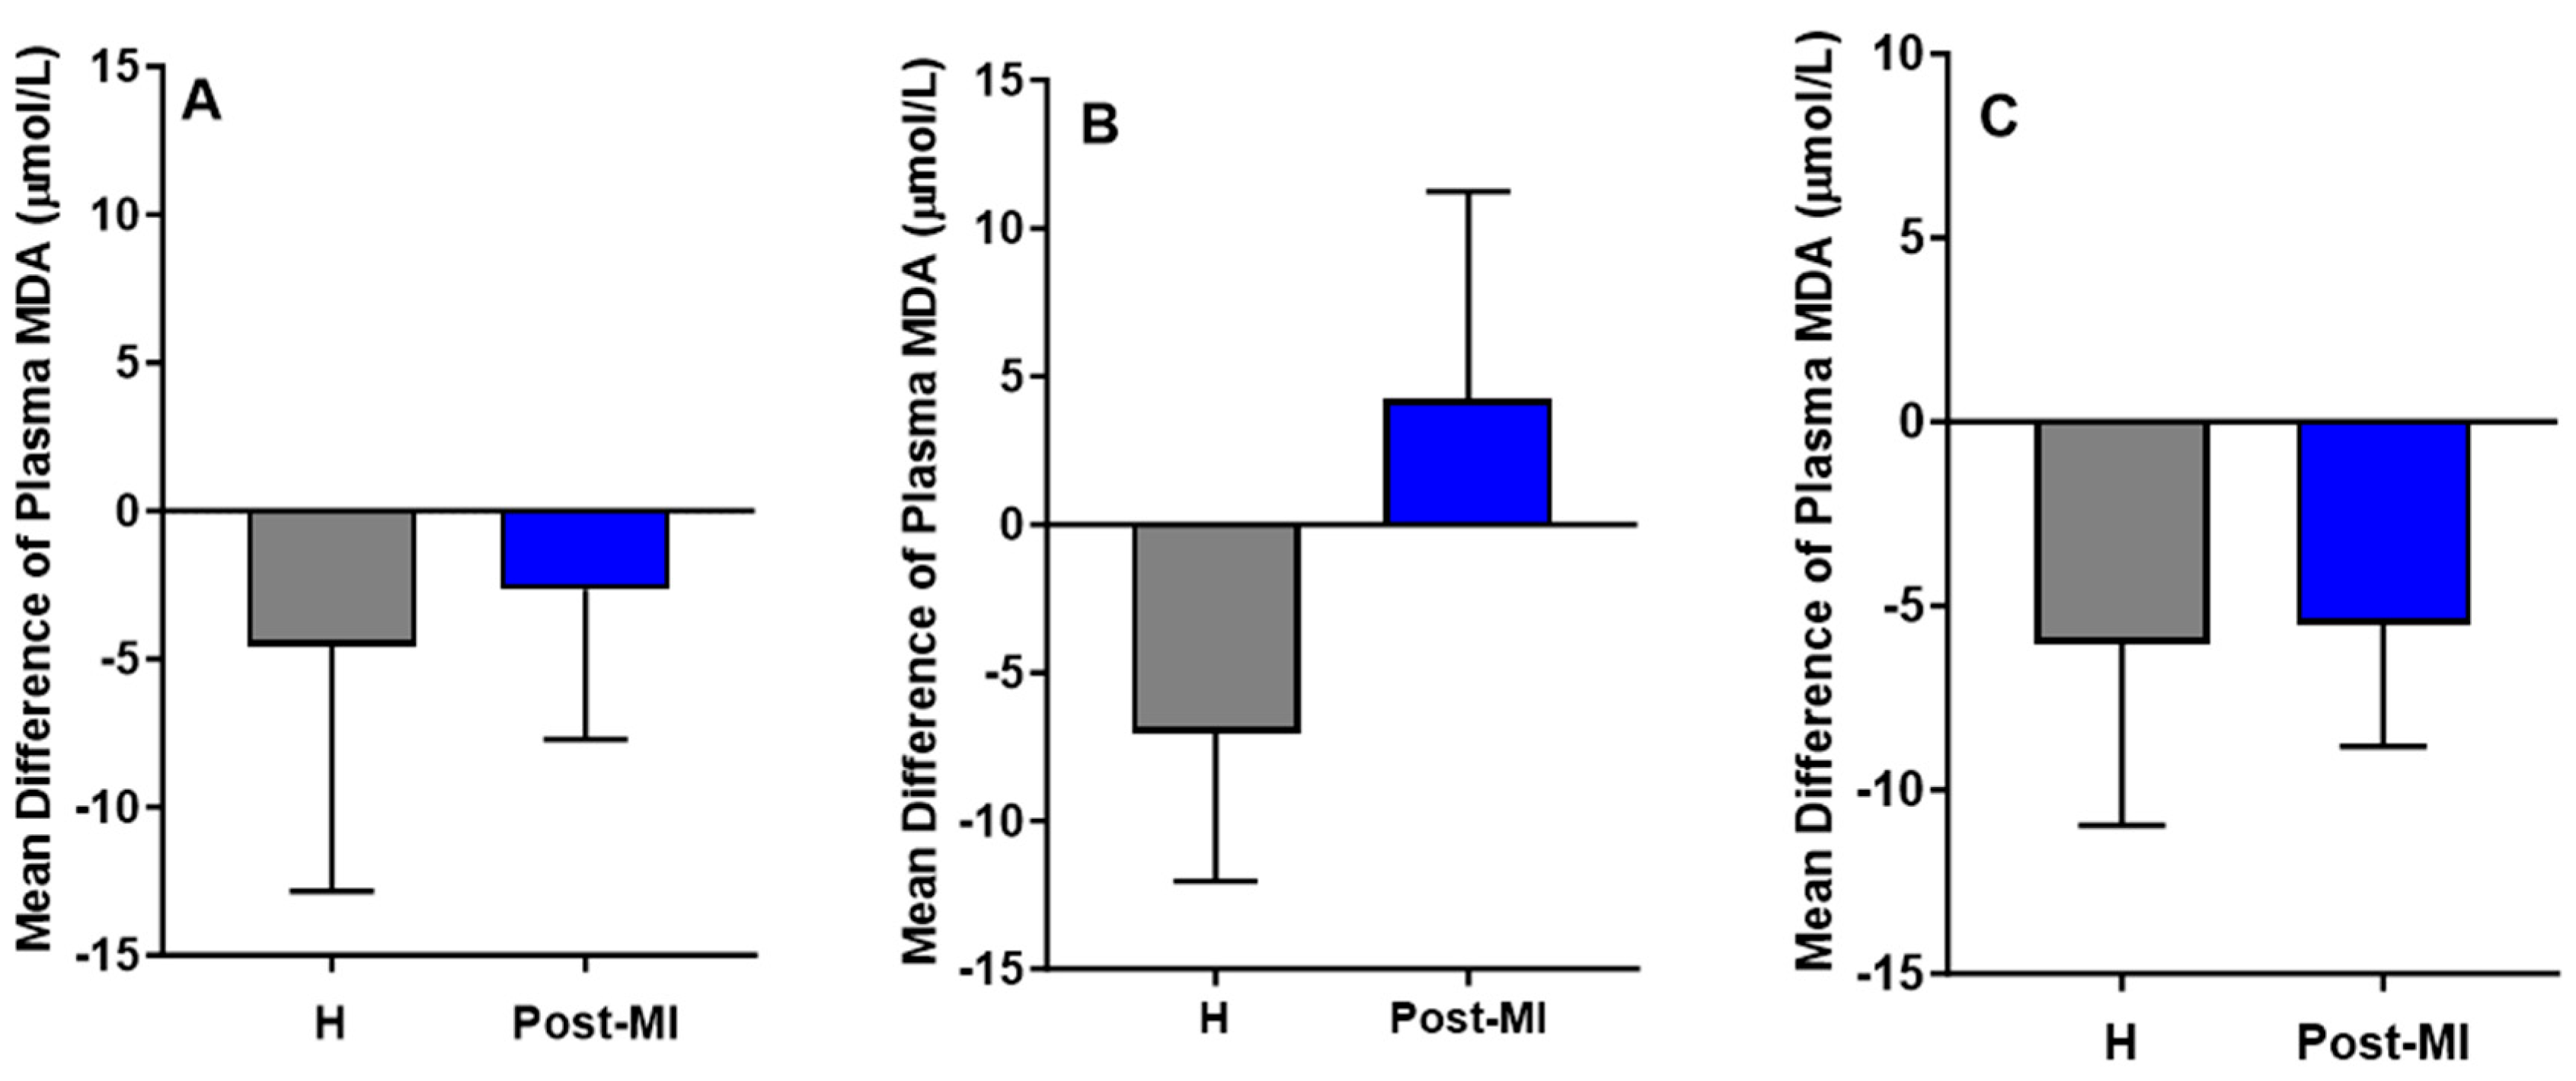
Figure 6.
Mean differences of plasma LCAT activity (expressed as the 390/470 ratio) after six months of intervention with three types of oils. A: High polyphenol extra virgin olive oil (HP-EVOO), B: Extra virgin olive oil (EVOO), and C: Refined olive oil (ROO), in healthy (H) and post-myocardial infarction (post-MI) participants.
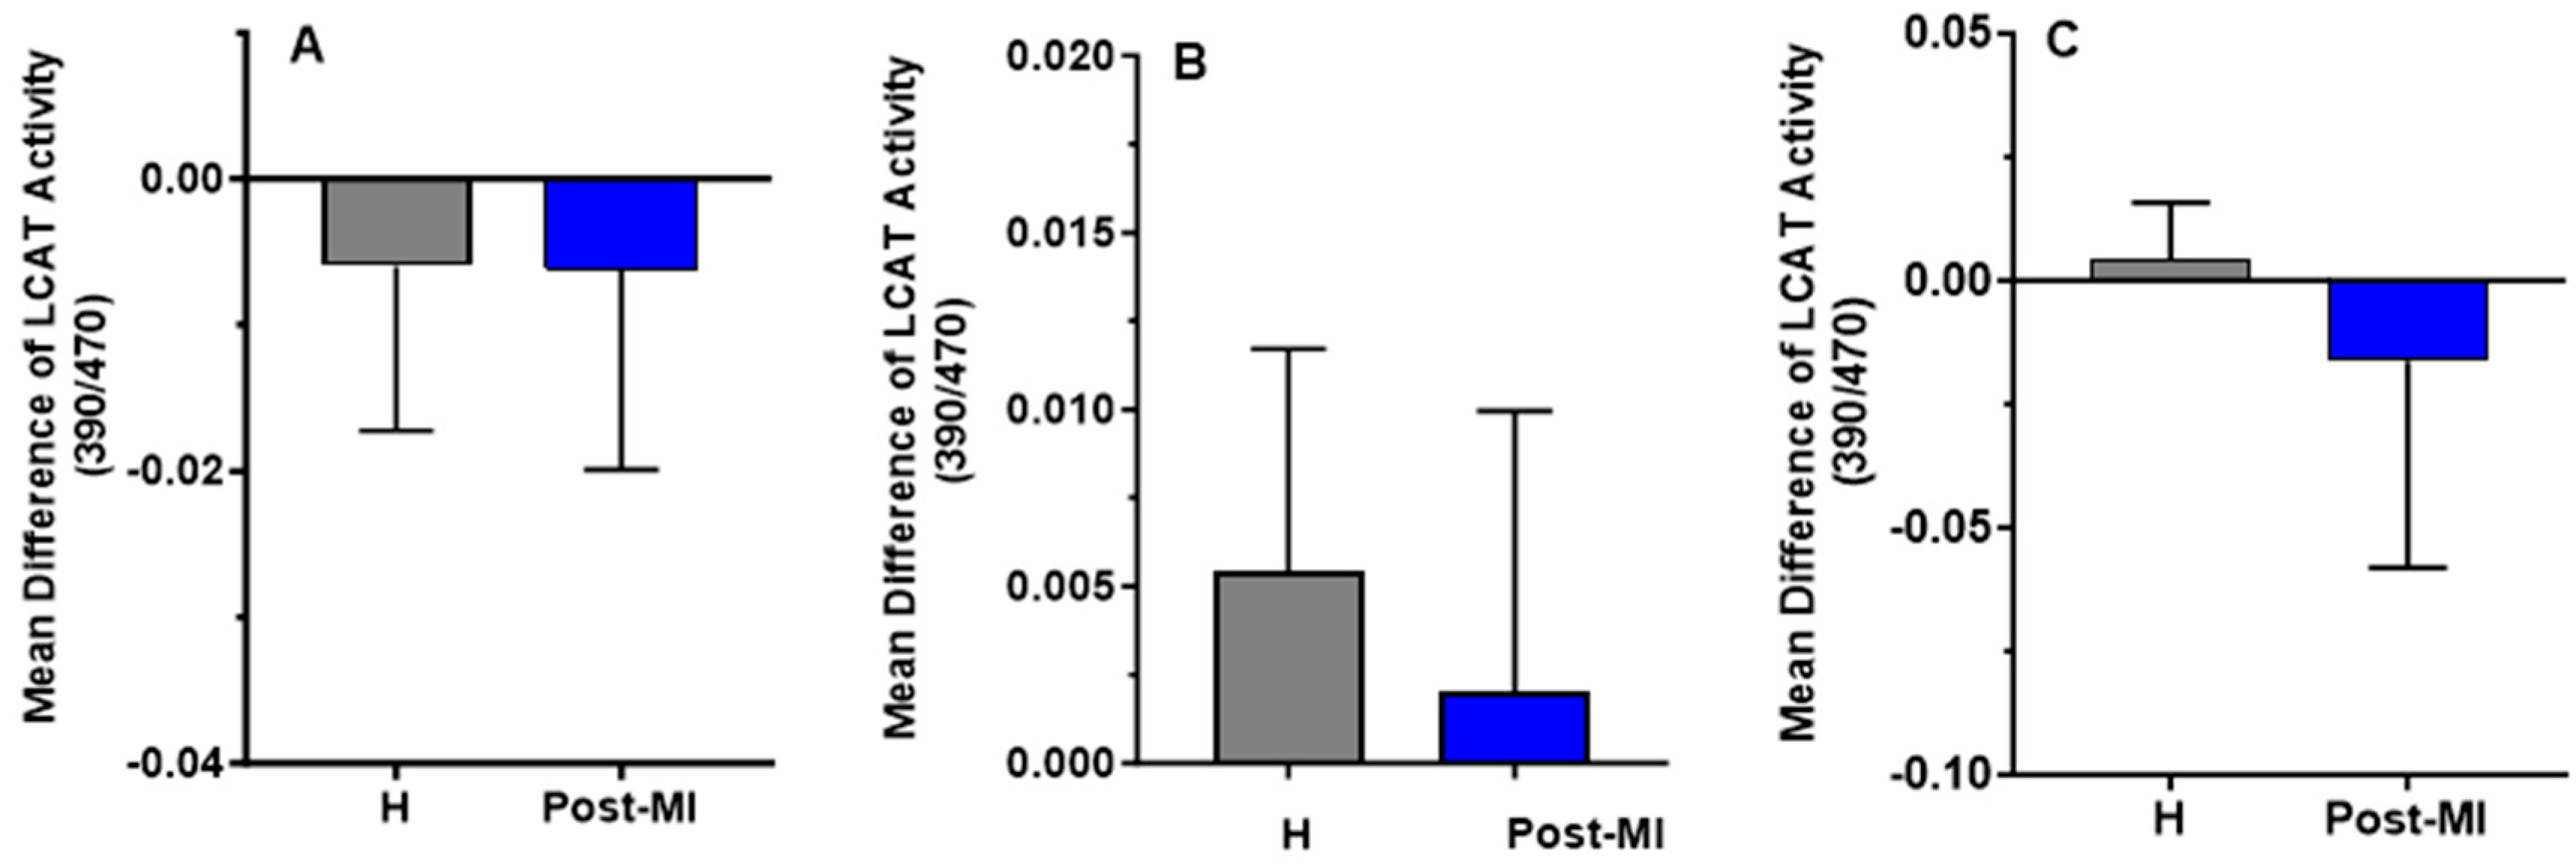

Table 1.
Baseline characteristics of the participants (data are presented as numbers or Mean ± SE).
| HP-EVOO | EVOO | ROO | ||||||||
|---|---|---|---|---|---|---|---|---|---|---|
| Healthy | Post-MI | p-value (Between groups) |
Healthy | Post-MI | p-value (Between groups) |
Healthy | Post-MI | p-value (Between groups) |
||
| Sex | Women | 1 | 1 | 3 | 2 | 4 | 1 | |||
| Men | 4 | 6 | 3 | 5 | 2 | 2 | ||||
| Age | 71 ± 2.34 | 75.71 ± 2.97 | 0.272 | 76.67 ± 1.82 | 71.5 ± 2.19 | 0.124 | 76 ± 2.87 | 73.67 ± 2.33 | 0.618 | |
|
Weight (kg) |
Before | 94 ± 15.70 | 79.79 ± 4.66 | 0.339 | 68.85 ± 7.37 | 73.13 ± 3.15 | 0.584 | 78.78 ± 5.34 | 81.73 ± 14.09 | 0.814 |
| After | 95.62 ± 16.82 | 80.58 ± 4.98 | 0.376 | 69.32 ± 6.90 | 75.96 ± 2.98 | 0.433 | 81.83 ± 4.10 | 82.83 ± 13.06 | 0.714 | |
|
p-value (Within groups) |
0.300 | 0.062 | 0.473 | 0.909 | 0.156 | 0.641 | ||||
|
BMI (kg/m2) |
Before | 31.51 ± 4.85 | 26.58 ± 1.06 | 0.431 | 25.70 ± 2.00 | 27.15 ± 1.08 | 0.521 | 28.47 ± 1.86 | 28.33 ± 2.75 | 0.969 |
| After | 32.05 ± 5.20 | 27.08 ± 1.19 | 0.536 | 25.93 ± 1.88 | 28.09 ± 1.274 | 0.536 | 29.61 ± 1.60 | 28.97 ± 2.48 | 0.828 | |
|
p-value (Within groups) |
0.307 | 0.062 | 0.385 | 0.812 | 0.184 | 0.318 | ||||
|
Systolic BP (mmHg) |
Before | 143.4 ± 6.76 | 147.0 ± 9.27 | 0.778 | 136.4 ± 6.50 | 131.1 ± 2.50 | 0.413 | 146.0 ± 9.55 | 132.0 ± 1.52 | 0.351 |
| After | 144.4 ± 5.51 | 126.0 ± 9.15 | 0.137 | 124.3 ± 11.83 | 137.0 ± 7.50 | 0.412 | 141.8 ± 12.38 | 136.3 ± 12.12 | 0.789 | |
|
p-value (Within groups) |
0.731 | 0.051 | 0.366 | 0.589 | 0.539 | 0.730 | ||||
|
Diastolic BP (mmHg) |
Before | 82.60 ± 1.36 | 76.14 ± 1.80 | 0.024 | 80.20 ± 11.18 | 79.57 ± 2.25 | 0.406 | 81.50 ± 2.66 | 78.33 ± 2.66 | 0.357 |
| After | 84.40 ± 1.36 | 79.50 ± 3.87 | 0.299 | 74.50 ± 3.83 | 81.00 ± 5.814 | 0.684 | 80.33 ± 4.74 | 78.33 ± 6.36 | 0.812 | |
|
p-value (Within groups) |
0.321 | 0.328 | >0.999 | 0.812 | 0.672 | >0.999 | ||||
| CRP (mg/L) | Before | 2.60 ± 1.10 | 2.957 ± 1.31 | 0.621 | 1.95 ± 0.52 | 1.14 ± 0.19 | 0.188 | 1.13 ± 0.24 | 1.63 ± 0.73 | 0.690 |
| After | 2.48 ± 1.65 | 1.817 ± 0.48 | 0.541 | 2.23 ± 0.58 | 1.15 ± 0.22 | 0.162 | 1.20 ± 0.18 | 0.70 ± 0.10 | 0.059 | |
|
p-value (Within groups) |
> 0.999 | >0.999 | 0.377 | 0.500 | 0.562 | 0.500 | ||||
| TC (mmol/L) | Before | 4.89 ± 0.29 | 3.12±0.22 | 0.0007 | 5.07 ± 0.25 | 3.15 ± 0.19 | 0.0003 | 4.71 ± 0.27 | 3.09 ± 0.09 | 0.0054 |
| After | 4.89 ± 0.29 | 3.30±0.27 | 0.003 | 5.375 ± 0.18 | 3.08 ± 0.16 | <0.0001 | 4.81 ± 0.49 | 3.05 ± 0.11 | 0.047 | |
|
p-value (Within groups) |
0.991 | 0.575 | 0.179 | 0.654 | 0.739 | 0.269 | ||||
| TG (mmol/L) | Before | 1.11 ± 0.35 | 1.21 ± 0.26 | >0.999 | 1.38 ± 0.22 | 1.15 ± 0.35 | 0.400 | 0.88 ± 0.13 | 0.87 ± 0.07 | 0.956 |
| After | 0.95 ± 0.17 | 1.62 ± 0.48 | 0.258 | 1.45 ± 0.31 | 0.84 ± 0.061 | 0.063 | 0.98 ± 0.10 | 0.85 ± 0.10 | 0.479 | |
|
p-value (Within groups) |
0.437 | 0.313 | 0.710 | 0.812 | 0.528 | 0.431 | ||||
| HDL-C (mmol/L) | Before | 1.72 ± 0.23 | 1.13 ± 0.11 | 0.031 | 1.59 ± 0.25 | 1.18 ± 0.11 | 0.202 | 1.69 ± 0.15 | 1.28 ± 0.08 | 0.125 |
| After | 1.79 ± 0.24 | 1.13 ± 0.16 | 0.048 | 1.68 ± 0.27 | 1.27 ± 0.09 | 0.167 | 1.69 ± 0.18 | 1.390 ± 0.09 | 0.316 | |
|
p-value (Within groups) |
0.380 | 0.486 | 0.082 | 0.425 | 0.957 | 0.085 | ||||
|
LDL-C (mmol/L) |
Before | 2.66 ± 0.31 | 1.43 ± 0.24 | 0.010 | 2.84 ± 2.84 | 1.44 ± 0.10 | 0.0001 | 2.61 ± 0.21 | 1.41 ± 0.03 | 0.006 |
| After | 2.66 ± 0.26 | 1.42 ± 0.24 | 0.007 | 3.02 ± 0.11 | 1.42 ± 0.10 | <0.0001 | 2.68 ± 0.35 | 1.27 ± 0.07 | 0.030 | |
|
p-value (Within groups) |
0.961 | 0.724 | 0.344 | 0.897 | 0.765 | 0.063 | ||||
|
non-HDL-C (mmol/L) |
Before | 3.07 ± 0.42 | 1.99 ± 0.23 | 0.035 | 3.47 ± 0.23 | 1.92 ± 0.13 | 0.002 | 3.01 ± 0.18 | 1.81 ± 0.01 | 0.002 |
| After | 3.10 ± 0.26 | 2.17 ± 0.18 | 0.016 | 3.68 ± 0.17 | 1.80 ± 0.14 | <0.0001 | 3.12 ± 0.34 | 1.66±0.037 | 0.022 | |
|
p-value (Within groups) |
0.668 | 0.665 | 0.312 | 0.602 | 0.671 | 0.021 | ||||
| Lp (a) (nmol/L) | Before | 32.56 ± 10.69 | 71.55 ± 34.68 | 0.349 | 52.82 ± 45.12 | 72.06 ± 29.37 | 0.190 | 114.1 ± 29.97 | 141.4 ± 51.41 | 0.635 |
| After | 31.56 ± 10.52 | 89.67 ± 40.08 | 0.231 | 60.82 ± 50.50 | 104.1 ± 43.38 | 0.142 | 107.0 ± 24.09 | 81.00 ± 13.23 | 0.497 | |
|
p-value (Within groups) |
0.228 | 0.353 | 0.250 | 0.437 | 0.601 | 0.263 | ||||
Bold p-values indicate statistical significance (p < 0.05). Abbreviations: BMI, Body mass index; BP, Blood pressure; HDL-C, High-density lipoprotein cholesterol; LDL-C, Low-density lipoprotein cholesterol; Lp (a), Lipoprotein(a); TC, Total cholesterol; TG, Triglycerides.
Disclaimer/Publisher’s Note: The statements, opinions and data contained in all publications are solely those of the individual author(s) and contributor(s) and not of MDPI and/or the editor(s). MDPI and/or the editor(s) disclaim responsibility for any injury to people or property resulting from any ideas, methods, instructions or products referred to in the content. |
© 2025 by the authors. Licensee MDPI, Basel, Switzerland. This article is an open access article distributed under the terms and conditions of the Creative Commons Attribution (CC BY) license (http://creativecommons.org/licenses/by/4.0/).
Copyright: This open access article is published under a Creative Commons CC BY 4.0 license, which permit the free download, distribution, and reuse, provided that the author and preprint are cited in any reuse.


