

Submitted:
24 June 2025
Posted:
24 June 2025
You are already at the latest version
Abstract
Museum cultural creative products (MCCPs) represent a contemporary and tangible extension of cultural heritage, transforming intangible values and historical narratives into accessible consumer experiences. As cultural heritage institutions increasingly adopt market-oriented strategies, MCCPs have not only become a crucial medium for engaging the public with heritage through creative innovation but also a key revenue source, ensuring the sustainability and growth of these institutions. However, research on how consumers evaluate MCCPs and how these evaluations impact satisfaction remains fragmented. This study examines the relationships among product perception, consumption experience, and consumer satisfaction, integrating key indicators such as Product Creativity, Design Aesthetics, Product Functionality, Service Experience, Product Quality, Product Price, Consumer Loyalty, Emotional Response, and Cultural Perception. Using 11,035 consumer-generated reviews from e-commerce platforms, this study employs LLM-assisted semantic sentiment analysis and Partial Least Squares Structural Equation Modeling (PLS-SEM) to enhance thematic analysis and refine consumer insights, providing a more precise understanding of consumer perceptions and their effects on satisfaction. Results reveal that product perception significantly influences both consumption experience and satisfaction, with experience acting as a mediator between the two. Most notably, creativity is identified as the core dimension driving consumer satisfaction, highlighting the role of innovation in MCCP's success. Furthermore, this study extends the Diffusion of Innovation Theory by demonstrating how product creativity affects adoption and satisfaction in cultural heritage marketing. By integrating LLM-assisted semantic analysis and structural modeling, this study advances both methodological rigor and theoretical applications, offering a novel perspective on consumer perceptions in the cultural and creative industries.
Keywords:
cultural heritage management
; museum cultural creative product (MCCP)
; consumer perception
; large language model (LLM)
; semantic analysis
Introduction
In the evolving discourse on cultural heritage preservation and dissemination, museum cultural creative products (MCCPs) have emerged as vital instruments that bridge traditional heritage with contemporary audiences. Rooted in historical artifacts, symbols, and narratives, MCCPs serve not merely as commodities but as recontextualized expressions of heritage values. Understanding how consumers perceive and engage with these products offers critical insight into the effectiveness of heritage communication, cultural identity reinforcement, and the societal resonance of historical narratives. However, in recent years, cultural heritage management institutions worldwide have faced increasing financial pressures (Borin & Donato, 2023; Stamatoudi & Roussos, 2024; Volanakis et al., 2024). With reduced government funding for cultural preservation projects, many museums and cultural institutions have had to turn to market-oriented approaches to ensure their long-term operational sustainability (Aroles & Morrell, 2024; Porter, 2024). Traditional management models of cultural heritage primarily rely on government grants, donations, and ticket revenues; however, the instability of these funding sources makes it challenging to support the long-term maintenance and innovative development of cultural heritage (Acampa & Parisi, 2021; Barile & Saviano, 2015). Therefore, establishing a sustainable business model for cultural heritage is essential not only for preserving history but also for ensuring that cultural institutions can continue to thrive and remain viable. In recent years, the cultural and creative industries have been regarded as a key pathway to addressing the sustainable development of cultural heritage (Gao et al., 2023; Imperiale et al., 2021). The cultural and creative industries not only transform cultural resources into marketable products but also enhance public interest and recognition of cultural heritage through innovative forms (Howkins, 2018). Among these, museum cultural and creative products (MCCPs), as an essential component of the cultural and creative industries, have become a vital means for major museums worldwide to enhance cultural dissemination and expand revenue streams (Haoyuan Cheng et al., 2023; Gao & Xinquan, 2024; Li et al., 2021). For example, world-renowned museums such as the Palace Museum, the British Museum, and the Louvre have successfully commercialized and socialized cultural content through the development of high-quality MCCPs (Chen et al., 2020; Li & Li, 2022; Tsang et al., 2022; Tu et al., 2019). By blending traditional culture with contemporary design, MCCPs bridge the gap between the past and present, foster cultural engagement, meet the evolving demands of today’s consumers (Hui Cheng, Xu Sun, et al., 2023; Cheng et al., 2024), enhance the economic value of cultural heritage, and facilitate its reinterpretation and global dissemination (Shangguan, 2024).
However, despite the rapid development of the MCCP industry, its market growth faces multiple challenges from the consumer perspective. First, the issue of product homogenization has become increasingly prominent (Cheng et al., 2024; Li et al., 2021; Tu et al., 2019). Some MCCPs overly rely on simple reproductions of traditional cultural symbols, lacking creative innovation, which diminishes consumer interest and weakens their market appeal (Carvajal Pérez et al., 2020; L. Liu, 2024). Consumers have also voiced numerous complaints about the homogenization of MCCPs, which not only reduces their purchase intentions and satisfaction but also limits the further development of the MCCP market (H. Li et al., 2024; Xu & Chen, 2024). Therefore, enhancing the uniqueness and attractiveness of products through innovative design while preserving cultural value has become a critical issue for the MCCP industry. Second, when evaluating MCCPs, consumers consider not only the cultural value of the products but also multiple factors such as aesthetics, functionality, and consumption experience (Cheng et al., 2024). However, research on consumer perception in a broader context has yielded fragmented and often contradictory findings (Blut et al., 2023), let alone studies specifically focusing on consumers of cultural creative products in museums.
Additionally, consumers’ purchasing decisions are influenced not only by the products themselves but also by the overall experience of the purchasing process, including brand interaction, service quality, and price perception (Kalyva et al., 2024; Levrini & Jeffman dos Santos, 2021; Pina & Dias, 2021; Wang et al., 2021). Optimizing the consumption experience of MCCPs to enhance consumer satisfaction remains a significant challenge for the cultural and creative industries. These issues suggest that the market success of MCCPs depends not only on the transmission of cultural content but also on multiple factors, including product design and the overall consumption experience. Therefore, in-depth research on how consumers evaluate MCCPs and the impact of these evaluations on satisfaction is crucial for promoting the sustainable development of the MCCP market.
Although the existing studies mentioned above have explored the development of the MCCP industry, several research gaps remain. First, there is a lack of systematic research on the consumer evaluation mechanism of MCCPs. Existing studies primarily focus on the cultural value and market promotion of MCCPs while paying less attention to the multiple factors that consumers consider when evaluating MCCPs. Second, traditional consumer behavior research emphasizes functionality, price, and brand influence; however, the impact of creativity, aesthetic experience, and cultural attributes on consumer satisfaction in the context of MCCPs as cultural consumer goods has not been fully explored. Furthermore, most current MCCP research relies on questionnaire surveys, failing to fully utilize consumer-generated online review data to uncover consumers’ actual needs and preferences.
To address these research gaps, this study aims to develop a data-driven MCCP evaluation framework that identifies key factors influencing consumer satisfaction. By systematically analyzing consumers' multidimensional evaluations of MCCPs, this study will develop a comprehensive evaluation framework to reveal the core factors that affect consumer satisfaction. At the same time, this study will explore the mechanism through which product perception influences consumption experience and satisfaction. Consumers’ perceptions of MCCPs encompass not only cultural value but also multiple dimensions such as aesthetics, functionality, and creativity. How these perceptions affect final satisfaction through the mediating role of consumption experience is a key focus of this study. This research will examine the mechanism of how product perception influences consumption experience and consumer satisfaction, providing a theoretical basis for optimizing MCCP design and marketing strategies. Additionally, this study will apply the Diffusion of Innovation Theory to explain how consumers adopt MCCPs and explore the applicability of this theory in the context of MCCPs. To achieve these objectives, this study utilizes consumer-generated comments from an e-commerce platform, employing text mining, sentiment analysis, and structural equation modeling (PLS-SEM) to extract MCCP evaluation dimensions in a data-driven manner and validate their impact on consumer satisfaction.
The structure of this study is as follows: Section 2 provides a literature review, revisiting MCCP consumer behavior research, the Diffusion of Innovation Theory, and related consumer satisfaction theories to provide theoretical support for the research hypotheses. Section 3 outlines the research methodology, introducing data sources, text mining methods, sentiment analysis, and the construction of the PLS-SEM model. Section 4 presents the research results, reporting the core dimensions of consumer evaluations and their impact on consumption experience and consumer satisfaction. Section 5 discusses the findings and contributions, exploring the MCCP evaluation mechanism, deepening the Diffusion of Innovation Theory, and proposing management and policy recommendations. Section 6 concludes the study, summarizing its contributions, pointing out limitations, and suggesting directions for future research.
Literature Review
Consumer behavior is a multi-faceted construct shaped by cognitive, emotional, and situational factors. Among these, three critical dimensions—product value perception, consumption experience, and consumer satisfaction—play a fundamental role in influencing purchasing decisions and post-consumption evaluations. Product value perception refers to how consumers assess a product’s worth, taking into account both its functional and emotional attributes. Consumption experience encompasses the sensory, cognitive, and affective aspects of engaging with a product or service. Consumer satisfaction determines whether expectations are met, exceeded, or disappointed, influencing future behavior. Understanding the interplay among these factors is essential for advancing MCCP consumer behavior research and cultural heritage marketing strategies. The following sections critically examine these dimensions, drawing on theoretical and empirical insights.
Consumer Satisfaction
Consumer satisfaction has long been recognized as a crucial factor in influencing consumer behavior, brand loyalty, and repeat purchases. Traditionally, scholars argue that consumer satisfaction is primarily driven by the perception of product attributes and the quality of the consumption experience (Oliver, 1980). In the context of heritage tourism and MCCPs, these factors, together with psychological and emotional engagement, play a crucial role in determining whether visitors feel a sense of fulfillment and connection to their purchases because scholars discover that museum visitors often evaluate MCCPs based on their authenticity, quality, uniqueness, and relevance to the heritage experience (McKercher & du Cros, 2002; Pine & Gilmore, 2011). Perceived authenticity is particularly crucial, as it significantly impacts visitor satisfaction in heritage tourism (Chhabra et al., 2003). However, authenticity is often a subjective perception rather than an objective reality, meaning that visitors’ expectations can shape their satisfaction regardless of the product’s actual historical accuracy (Cohen, 1988). Put differently, if a product successfully reflects the cultural and historical significance of a site, consumers are more likely to find it valuable and, consequently, feel satisfied with their purchase.
Additionally, the shopping or consumption experience itself—such as engaging with knowledgeable museum staff, encountering interactive displays, or purchasing well-packaged products—can enhance overall satisfaction (Holbrook & Hirschman, 1982; Parasuraman et al., 1988). According to the expectation-disconfirmation model (Anderson & Sullivan, 1993; Oliver, 2014), consumers derive satisfaction when their experience meets or exceeds their pre-existing expectations. Empirical studies in heritage tourism confirm this relationship, demonstrating that visitor satisfaction is more dependent on the alignment of expectations than on the objective quality of the product (Wen et al., 2024). In the museum context, a well-crafted and meaningful MCCP, combined with a positive purchasing experience, is likely to result in high consumer satisfaction. In summary, research strongly supports the notion that product perception and the consumption experience are key determinants of consumer satisfaction.
However, an opposing viewpoint argues that satisfaction does not always stem directly from product perception or experience alone. Consumer personality traits also play a crucial role, as individuals with higher emotional sensitivity may report satisfaction differently than those with more analytical tendencies (Ladhari, 2007). Additionally, emotional memory can distort post-experience evaluations, meaning that a consumer’s mood or sentimental connection to a purchase may override their actual experience (Hosany & Gilbert, 2009). According to Cognitive Dissonance Theory (Festinger, 1957), consumers often experience psychological discomfort if they feel uncertain about their purchase decision. In such cases, they may rationalize their choice by convincing themselves that a product is more valuable than it is, leading to an inflated sense of satisfaction. For example, a museum visitor who buys an expensive yet low-quality replica artifact may justify the purchase by emphasizing its cultural significance despite the product itself failing to meet expectations.
Additionally, external factors can override perceived product quality and consumption experience, leading to satisfaction or dissatisfaction regardless of a product’s actual attributes. Price sensitivity plays a significant role in consumer evaluations, as visitors may feel dissatisfied even with a high-quality product if they perceive it as overpriced (Thaler, 1985; Zeithaml, 1988). Similarly, social influence can shape consumer satisfaction; tourists may purchase a heritage product due to peer pressure or because it is endorsed by experts rather than because they genuinely appreciate it (Solomon, 2020). In such cases, satisfaction is not necessarily linked to product perception but rather to external validation and expectations.
Another challenge to the traditional product perception-experience model comes from the debate between experience and outcome. Some scholars suggest that consumers remember the outcome of their consumption experience rather than the process itself (Kahneman, 2011; Mittal & Kamakura, 2001). In the context of MCCPs, a visitor might have a frustrating shopping experience but later develop substantial sentimental value toward their purchased item, leading to long-term satisfaction. This perspective suggests that satisfaction can be delayed and re-evaluated over time rather than being an immediate response to product attributes or the shopping experience.
Furthermore, behavioral economics and consumer psychology offer alternative explanations for satisfaction that challenge purely rational models of consumer behavior. Kahneman and Tversky (1979) and Schwarz and Clore (1983) argue that consumer satisfaction is often driven by emotional biases rather than logical assessments of product quality. The dual-system theory of Kahneman (2011) further supports this, suggesting that consumer evaluations rely on a mix of fast, emotional intuition (System 1) and slower, analytical reasoning (System 2), with the former often dominating satisfaction judgments. For instance, in a museum scenario, a positive emotional interaction with museum staff may overshadow the actual quality of a product, making a consumer feel satisfied even if the product itself is unremarkable. Conversely, a visitor might leave dissatisfied despite a great product and experience if they feel the product was too expensive or if they were in a bad mood during the purchase.
Consumption Experience
Consumption experience is a fundamental aspect of consumer behavior that encompasses the emotional, sensory, cognitive, and social dimensions of engaging with a product or service. Unlike the traditional utilitarian perspective, which views consumption primarily as a means of fulfilling functional needs, contemporary theories emphasize the experiential nature of consumption, where individuals seek pleasure, meaning, and engagement beyond mere utility. The shift from a rationalist framework to an experiential perspective has been primarily influenced by the work of Holbrook (1999), who introduced the experiential view of consumption, arguing that consumers derive value not only from product attributes but also from the subjective enjoyment associated with the consumption process. This perspective aligns with later research on experiential consumption, which suggests that consumers derive hedonic value from sensory and emotional stimuli associated with consumption (Arnould & Price, 1993; Gentile et al., 2007). Contributions from scholars across various disciplines have marked the evolution of consumption experience as an academic field. Pine and Gilmore (2011) developed the Experience Economy framework, which posited that businesses should focus on designing memorable experiences rather than simply offering goods or services. Carù and Cova (2003) examined immersion in consumption experiences, arguing that deep engagement with a product or service fosters a stronger emotional and psychological connection. It aligns with research on emotional attachment in consumption experiences, which posits that consumers form strong affective bonds with brands, products, and services when these align with personal identity and self-concept (Debenedetti & Chaney, 2024; Thomson et al., 2005; J. Zhang et al., 2024).
In the context of heritage tourism, the consumption experience takes on a distinct form, as tourists engage with cultural and historical sites that evoke a sense of authenticity, nostalgia, and emotional connection. Unlike conventional tourism, which often prioritizes leisure and entertainment, heritage tourism involves an interpretive and educational dimension, where visitors seek to establish a deeper connection with historical narratives and cultural identity. McKercher and du Cros (2002), Lin et al. (2024), and Jv et al. (2024) emphasized the role of cultural authenticity in shaping visitor experiences, arguing that tourists’ perceptions of a site's historical integrity influence their overall satisfaction. In addition, Rasoolimanesh and Lu (2024) and Steriopoulos et al. (2024) argued that heritage tourists are often motivated by a personal or emotional connection to a site, which enhances their overall consumption experience. Recent research on nostalgia in tourism experiences further supports this perspective, demonstrating that visitors who experience nostalgia during heritage tourism activities exhibit higher satisfaction and stronger emotional attachment to the site (Cho et al., 2019). It suggests that heritage tourism experiences are not merely about observing historical artifacts but involve active participation in meaning-making and emotional engagement.
Within the broader framework of heritage tourism, MCCPs allow visitors to engage with cultural narratives beyond the confines of the museum space. A recent study highlights that MCCPs play a significant role in enhancing consumers' cultural interest and engagement, particularly when they effectively represent historical and artistic elements (Ye & Yu, 2024). Thus, the consumption experience of MCCPs is shaped by several interrelated factors, including perceived authenticity, aesthetic appeal, emotional connection, and multi-sensory engagement (Huang et al., 2023). However, as observed by Rickly et al. (2023), Huang et al. (2023), and Jin and Hwang (2024), authenticity is often socially constructed rather than objectively determined, meaning that visitors’ expectations and pre-existing cultural knowledge influence their interpretation of MCCPs. For example, an MCCP that closely resembles an ancient artifact may be perceived as authentic and meaningful by some consumers. In contrast, others may view it as a mere commercial reproduction with little intrinsic value. Beyond authenticity, aesthetic and design attributes significantly impact the consumption experience of MCCPs. Contemporary research highlights that the success of MCCP design depends on the creative integration of traditional cultural elements, modern technologies, fashion trends, and aesthetic preferences (Capece et al., 2024; Chen et al., 2024; Furferi et al., 2024; H. Li et al., 2024; Tussyadiah et al., 2018; Zheng et al., 2024).
However, recent studies have questioned the universal applicability of experiential advantage. For instance, Weingarten and Goodman (2021) conducted a meta-analysis revealing that the happiness derived from experiential purchases compared to material ones is moderated by various factors, suggesting that the experiential advantage may not be as robust as previously thought. Furthermore, they challenged the clear-cut distinction between experiential and material purchases, arguing that the interplay between these types of consumption is more complex and context-dependent than earlier theories have proposed (Weingarten et al., 2023). These critiques underscore the need for a more nuanced understanding of consumption experiences, taking into account the situational and individual differences that influence consumer preferences.
Based on the aforementioned review, we put forward the hypothesis that Consumption Experience significantly impacts Consumer Satisfaction.
Product Value Perception
Understanding how consumers perceive a product’s value is crucial in determining their engagement and overall satisfaction. Consumer Value Perception Theory (CVPT) offers a framework for examining the various dimensions through which consumers assess products and services (Sánchez-Fernández & Iniesta-Bonillo, 2007). Early studies, particularly those of Holbrook (1999), highlight multiple dimensions of value, including efficiency, excellence, aesthetics, and play, which contribute to how consumers perceive and interact with products. Zeithaml (1988) further emphasized that perceived value is not just a function of price but also a balance between quality, emotional engagement, and functional utility.
Recent literature has expanded the concept of product perception to reflect its impact on both consumption experience and consumer satisfaction (Morar, 2013; Tasci, 2016). Within the context of heritage tourism and MCCPs, consumer perceptions are shaped by factors such as design, authenticity, packaging, and functionality, all of which influence both the experience of products and their contribution to satisfaction (Cheng et al., 2024; Guo et al., 2023). To explore this further, this section examines two major pathways: (1) How product perception influences consumption experience and (2) How product perception directly impacts consumer satisfaction.
The Impact of Product Perception on Consumption Experience
Consumer perception of product attributes—such as aesthetics, creativity, functionality, design, cultural authenticity, symbolic meaning, and emotional appeal—not only shapes their evaluation of a product but also significantly influences the shopping experience. In the context of MCCPs, these attributes impact consumer engagement, interpretation, and experience during the purchasing process, as well as their interactions with museum retail environments, product displays, and brand storytelling (Guo et al., 2023; Huang et al., 2021; Li & Li, 2022; Li et al., 2021). Existing research suggests that shopping is not merely a transactional activity but an experiential journey influenced by sensory stimulation, emotions, and contextual factors (Pine & Gilmore, 2011). A well-perceived product can enhance this journey, making the shopping experience more engaging, immersive, and emotionally rewarding (Schmitt, 1999). Consumers who are drawn to the artistic and historical significance of an MCCP may perceive their shopping experience as more meaningful as it aligns with their cultural identity and personal values (Tu et al., 2019). It aligns with self-congruence theory, which posits that consumers derive greater satisfaction from shopping experiences that reinforce their self-concept (Sirgy, 1982). Beyond psychological engagement, product perception also influences behavioral aspects of the shopping experience. Consumers who perceive an MCCP as authentic and aesthetically refined are more likely to engage with product demonstrations, interactive store displays, and knowledgeable staff, all of which enhance shopping enjoyment and memorability (Guo et al., 2023).
Additionally, packaging and storytelling elements within a retail environment shape consumer mood, engagement levels, and willingness to explore products (Duarte et al., 2024; Yuxin et al., 2024). However, some scholars argue that product perception alone may not always determine the quality of the shopping experience. Weingarten et al. (2023) highlight that external variables, such as store atmosphere, customer service, and price positioning, can override product attributes in shaping consumers' emotional states. Additionally, some studies suggest that consumers may rationalize their shopping experiences post-purchase, meaning that their satisfaction with the shopping trip may not directly correlate with their initial product perception (Lin et al., 2022; Park et al., 2015). Despite these counterarguments, existing literature predominantly supports the idea that product perception—through aesthetics, authenticity, symbolic meaning, and cultural resonance—significantly influences the shopping experience by shaping emotional engagement, cognitive processing, and interaction levels. Given the strong theoretical and empirical support for the role of product perception in shaping how consumers engage with and experience products, this study proposes the following hypothesis: Product Perception significantly impacts Consumption Experience.
Product Perception in Shaping Consumer Satisfaction
Consumer satisfaction with MCCPs is influenced by multiple dimensions of product value perception, including creativity, aesthetics, functionality, and cultural authenticity (Baghirov & Zhang, 2024; Huang et al., 2023; Kumar et al., 2025; Lee et al., 2024; Tu et al., 2019). Consumers often favor MCCPs that incorporate innovation, as creativity enhances uniqueness and fosters emotional attachment (Hui Cheng, Xu Sun, et al., 2023; Cheng et al., 2024). Similarly, aesthetic appeal plays a crucial role in satisfaction, with consumers gravitating toward products that exhibit refined craftsmanship and artistic excellence (Rejón-Guardia, 2024; Sonderegger et al., 2014). In addition to design attributes, functionality is increasingly valued as consumers appreciate MCCPs that offer practical applications in conjunction with cultural significance (H. Li et al., 2024). Cultural authenticity further strengthens consumer satisfaction by reinforcing a sense of historical connection and meaning as individuals seek products that align with their perceptions of genuine heritage (Jin & Hwang, 2024; Kreuzbauer & Keller, 2017). While these factors are widely acknowledged as key drivers of consumer satisfaction, some scholars argue that satisfaction does not always stem directly from product attributes alone. Research suggests that external influences, such as social expectations, branding, and psychological biases, may shape consumer perceptions more than inherent product qualities (Ordabayeva et al., 2022; Włodarska et al., 2019). For instance, consumers may rationalize dissatisfaction post-purchase, convincing themselves that a product is of higher value due to brand prestige or social desirability (Akdeniz et al., 2013; Sansome et al., 2024). Additionally, studies indicate that price sensitivity can override product value perception, leading to dissatisfaction when consumers perceive MCCPs as overpriced, even if they are high in creativity and authenticity (Cao & Wang, 2024; Kalyva et al., 2024). The cognitive dissonance effect further complicates this relationship, as individuals who regret their purchases may later attempt to justify them by focusing on select product attributes rather than forming an objective assessment of overall value (Jog et al., 2024; Xu & Jin, 2022). In summary, despite these counterarguments, research overwhelmingly supports the view that consumers who have a positive perception of MCCPs are more likely to experience higher levels of satisfaction. Given this relationship, it is reasonable to hypothesize that Product Perception significantly impacts Consumer Satisfaction.
Summary
Methodology
This study employs an LLM-assisted hybrid approach, integrating text mining, sentiment analysis, and Partial Least Squares Structural Equation Modeling (PLS-SEM) to analyze consumer perceptions of creativity in MCCPs. The methodology consists of three main phases: (1) data collection and preprocessing, (2) topic modeling and clustering using LDA + SVM and BERT + K-Means with LLM-enhanced semantic analysis, and (3) validation of extracted MCCP dimensions via PLS-SEM.
Data Collection
The Palace Museum is widely recognized as the benchmark for MCCP innovation in China, setting standards that many other museums follow. As one of China’s most significant cultural heritage sites, it holds a central position in the country’s historical and artistic legacy, making it an ideal case for studying consumer perceptions of MCCPs. Notably, in 2024, the successful World Heritage inscription of Beijing’s Central Axis, where the Palace Museum serves as the core landmark, has further reinforced its cultural and symbolic importance. Given its unparalleled influence in heritage preservation and cultural commercialization, the Palace Museum provides a unique and representative context for analyzing how consumers engage with MCCPs in a market-driven heritage landscape. Furthermore, with China emerging as a global leader in digital commerce, an increasing number of museums have established official e-commerce platforms, such as Tmall flagship stores, to enhance accessibility to their MCCPs. These platforms, which synchronize product availability with physical museum stores and offer nationwide free shipping, have become a primary purchasing channel for MCCPs in China. Industry reports indicate that online transactions now constitute a substantial share of total MCCP sales, as virtual museum visits have surpassed physical attendance for the first time, with Tmall and Taobao museum flagship stores alone recording 1.6 billion visits in a single year—1.5 times the total nationwide museum foot traffic1—underscoring the growing influence of e-commerce on consumer engagement with MCCPs.
This study does not rely on in-person museum visits to collect consumer feedback for two key reasons. First, direct interviews with consumers could introduce social desirability bias, where respondents may feel pressured to provide more favorable responses when interacting face-to-face. Second, on-site surveys present logistical challenges, requiring significant resources while yielding a relatively limited volume of textual data. In contrast, e-commerce platforms offer a vast and readily available repository of consumer-generated reviews, enabling large-scale text mining and quantitative analysis. Another advantage of leveraging e-commerce reviews over social media discussions is the authenticity of the feedback. Each review is tied to an actual purchase, ensuring that the dataset reflects real consumer experiences rather than speculative or promotional content.
Data Cleaning
To ensure that the dataset contains only meaningful consumer insights, a systematic data-cleaning process will be applied. This process will involve removing non-informative, redundant, or irrelevant reviews while retaining those that provide explicit evaluations of MCCP attributes. By implementing these cleaning criteria, the study will ensure that the final dataset is optimized for subsequent text mining and structural modeling. The detailed cleaning criteria and their impact on the dataset size will be reported in the Results section.
Themes Identification
This study will employ a two-stage hybrid approach, integrating LDA+SVM and BERT+K-Means, to systematically extract consumer-perceived dimensions of MCCPs. When integrating results from LDA+SVM and BERT+K-Means, themes identified by both methods will be merged, while those detected in only one method will be retained for empirical validation in PLS-SEM. Finally, to ensure the accuracy of dimensions and indicators, a text analysis of the comments will be conducted in SPSSAU by identifying high-frequency keywords.
LDA and SVM
In the first stage, Latent Dirichlet Allocation (LDA), a probabilistic generative model commonly used for topic modeling, will be employed to identify latent topics within the consumer review corpus in DIKW (7.83). LDA is particularly suitable for this study as it identifies underlying themes in large text datasets by analyzing word co-occurrence patterns, making it an effective tool for extracting consumer-perceived dimensions of MCCPs. To validate LDA-extracted topics, the topic coherence score will determine the optimal number of topics, selecting the model with the highest coherence score. Additionally, LDAvis will assess topic dispersion and overlap, further validating the separation and interpretability of themes. To determine the indicators for each theme, only keywords with topic weights greater than zero, rounded to three decimal places, will be retained. Lower-weighted words will be considered statistically insignificant in defining the thematic structure. This filtering process will ensure that only highly relevant keywords contribute to the final thematic framework. Using this approach, the study will identify dimensions (themes) along with their indicators (high-weight keywords), which will form the foundation for further classification.
To validate the robustness of the topics extracted by LDA, a Support Vector Machine (SVM) classifier will be employed to refine the topic assignments. Since the themes derived from LDA are probabilistic rather than deterministic, the use of SVM will ensure that each review is assigned a dominant, definitive theme. This approach will help verify the accuracy of the LDA results, confirming that the identified themes reliably represent the underlying patterns in the data. Moreover, the SVM model will be trained using the LDA-derived themes as target labels. The model’s performance will be evaluated using standard classification metrics, such as accuracy, precision, recall, and F1-score, which will provide evidence that the LDA-derived themes are reliable and consistent. For the process of SVM, the dataset will be split into training (80%), and test (20%) sets, and a grid search with five-fold cross-validation will be conducted to identify the optimal SVM hyperparameters, including kernel type (linear, RBF, or polynomial), regularization parameter (C), and gamma value. This optimization process ensures that the classifier is well-calibrated, preventing both overfitting and underfitting.
BERT and K-Means
In the second stage, Bidirectional Encoder Representations from Transformers (BERT), a deep learning-based natural language processing model, will be employed to refine and validate the creativity-related themes extracted from LDA+SVM. Unlike LDA, which identifies topics based on probabilistic word co-occurrence, BERT generates context-aware word embeddings that capture deeper semantic relationships between words and phrases. This ability makes BERT particularly suitable for analyzing consumer reviews, as it can identify subtle meanings in text that may not be evident in traditional topic modeling approaches. By integrating BERT embeddings with K-Means clustering, this study will enhance the robustness of theme identification by uncovering underlying patterns and improving the interpretability of creativity-related themes in MCCPs.
To generate BERT embeddings, each consumer review will first be tokenized using a pre-trained BERT tokenizer (bert-base-chinese), a model trained on a large corpus of Chinese texts, which will output high-dimensional vector representations encoding the semantic meaning of each review. This tokenizer segments Chinese text into meaningful subwords, ensuring that words are correctly mapped to their corresponding embeddings in the pre-trained BERT model. Instead of reducing dimensionality through PCA or other techniques, this study will retain the full-dimensional BERT feature vectors and apply K-Means clustering directly to group semantically similar reviews into distinct themes. The decision to preserve the full-dimensional embeddings is based on the need to retain as much contextual information as possible, ensuring that fine-grained semantic relationships within consumer reviews are not lost.
Following the extraction of BERT embeddings, the study will employ K-Means clustering to group semantically similar reviews into distinct themes. K-Means is a widely used unsupervised machine learning algorithm that partitions data into clusters based on similarity, making it particularly effective for grouping consumer reviews with shared perceptions. To determine the optimal number of clusters (K), two widely used validation techniques will be applied. First, the Silhouette Score will be calculated for different values of K, measuring how well each data point fits within its assigned cluster while maintaining a clear separation from other clusters. A higher silhouette score will indicate that the clustering structure is well-defined. Second, the Elbow Method will be used to analyze the sum of squared errors (SSE) for different values of K, identifying the point at which adding more clusters no longer significantly reduces variance. This combination of methods will ensure that the most meaningful and well-separated clusters are selected for analysis. Once the optimal number of clusters (K) is identified, the best clustering model will be applied to categorize the reviews, generating the theme clusters that represent consumer-perceived dimensions of MCCPs.
To summarize and extract key themes from the results of BERT + K-Means clustering, DeepSeek R1, and ChatGPT o3-mini-high will be used. DeepSeek R1 excels in deep contextual understanding, enabling it to capture complex themes within clustered reviews accurately. At the same time, ChatGPT o3-mini-high is highly effective in generating concise, contextually relevant summaries from large, unstructured text. The keyword summaries produced by both models will be compared, and their outputs are expected to be broadly consistent. These keywords will then be used to supplement and validate the results of the LDA + SVM analysis, offering further insights into the thematic structure of the consumer feedback.
Text Analysis
To ensure both the adequacy and accuracy of the identified dimensions and their corresponding indicators, a final step of text analysis will be conducted by extracting high-frequency keywords from consumer reviews. This process aims to refine and supplement the dimensions and indicators derived from the LDA+SVM and BERT+K-Means approaches. By systematically identifying frequently occurring terms associated with consumer perceptions, additional relevant indicators will be incorporated to enhance the comprehensiveness of the analytical framework. This step not only ensures that all key aspects of MCCP evaluations were adequately captured but also reinforces the robustness of the categorization process, minimizing the risk of omitting critical consumer insights.
By integrating insights from probabilistic topic modeling (LDA), supervised classification (SVM), and deep learning-based clustering (BERT+K-Means), as well as two advanced LLMs, this study will establish a rigorous and data-driven thematic framework that accurately reflects consumer perceptions of MCCPs. The final themes derived from this hybrid methodology will provide the foundation for PLS-SEM validation, enabling further investigation into how MCCP dimensions influence consumer satisfaction.
Data Structurization
Before proceeding with PLS-SEM, it is necessary to transform the unstructured textual data into a structured form suitable for quantitative analysis. Since consumer reviews are qualitative in nature, sentiment analysis will be applied to derive numerical scores that represent consumer attitudes toward different MCCP dimensions. This transformation process consists of two key steps: sentiment classification and matrix transformation, ensuring that the final dataset is appropriately structured for PLS-SEM modeling.
Sentiment Classification
To classify sentiment within consumer reviews, this study will employ two independent sentiment analysis tools: the sentiment analysis module of SPSSAU (an automated statistical analysis platform widely used for academic research in China) and the sentiment analysis API of Alibaba Cloud (i.e., Aliyun, a leading cloud computing service provider in China, specializing in AI-driven data processing and e-commerce analytics). SPSSAU’s tool categorizes text into four sentiment levels—positive, slightly positive, slightly negative, and negative—providing a nuanced understanding of sentiment variation. In contrast, Alibaba Cloud’s sentiment analysis API, a machine learning-based tool trained on extensive consumer data from Taobao’s e-commerce platform, classifies sentiment into three broader categories: positive, neutral, and hostile. The integration of these two tools will enable cross-validation, thereby improving the reliability of sentiment classification.
Since sentiment classification directly affects the validity of the final quantitative dataset, special attention must be given to the reliability of the sentiment results analyzed by the tools. Given their maturity and reliability, a direct reliability metric, such as Cohen’s Kappa or Krippendorff’s Alpha, was deemed unnecessary. However, for situations where one tool labels a review as positive while the other categorizes it as negative, manual verification will still be needed to determine the correct sentiment classification. Thus, we introduce a procedure of manual judgment, where an expert with more than 8 years of experience in the research field of MCCPs will distinguish discrepancies among the results, ensuring that positive and negative elements are assigned to the appropriate MCCP dimensions.
Given that SPSSAU provides four sentiment levels while Alibaba Cloud offers only three, this study will adopt SPSSAU’s sentiment classification as the primary scoring system, with Alibaba Cloud’s classification serving as a validation tool. To standardize sentiment ratings, the following scoring system will be applied: (1) Positive = 7; (2) Slightly Positive = 5; (3) Neutral =4; (4) Slightly Negative = 3; (5) Negative = 1. This scoring system is designed to enhance differentiation among sentiment levels, ensuring that subtle variations in consumer sentiment are effectively captured in the final dataset.
Matrix Transformation
After determining sentiment labels, these values must be mapped to the indicators identified through LDA+SVM and BERT+K-Means analysis. This process, referred to as matrix transformation, involves linking each consumer review to the specific indicator it describes and assigning the corresponding sentiment scores. However, a key challenge in this process is that consumers may use synonyms, alternative phrases, or different terminology to express the same concept. Therefore, a direct keyword-matching approach would be insufficient for accurately mapping sentiment scores to MCCP dimensions.
To address this, two different approaches to matrix transformation will be considered. The first approach utilizes a large language model (LLM)-based method through Alibaba Cloud’s Qwen model (Tongyi Qianwen), which applies deep learning to analyze sentence structure, recognize synonyms, and map textual content to predefined MCCP dimensions. The selection of Qwen over ChatGPT is based on two key advantages: First, Qwen provides a free API, making it a cost-effective solution for large-scale data processing. Second, Alibaba Cloud specializes in e-commerce services, and its models are trained on a vast dataset of Chinese e-commerce reviews, making it particularly well-suited for analyzing consumer feedback in the context of MCCPs. The second approach is a traditional word frequency-based method using SPSSAU’s text analysis tool, which systematically extracts keywords from each sentence, calculates their frequency, and assigns text labels based on predefined categories. To determine which approach yields the most accurate and reliable mappings, a random sample of extracted sentences will be manually reviewed, and the final matrix transformation method will be selected based on its ability to assign sentiment scores to the relevant indicators accurately.
Following the selection of the matrix transformation method, the process will consist of several key steps. First, keyword extraction will be performed using a text analysis tool to identify high-frequency terms associated with the themes. Next, the extracted keywords will be mapped to predefined indicators, ensuring that consumer perceptions are accurately categorized. Once the relevant dimensions are identified for each review, the sentiment scores from the sentiment analysis tools will be mapped onto these dimensions. In cases where a review contains multiple indicators spanning different dimensions, the corresponding sentiment score will be assigned to each relevant category. Finally, the transformed dataset will be structured into an indicator-sentiment score matrix, where each row represents a consumer review, and each column corresponds to an indicator with assigned sentiment scores.
Missingness Handling
After structuring the dataset into an indicator-sentiment score matrix, missing values may still exist due to incomplete sentiment analysis, partial keyword matching, or cases where consumer reviews do not contain sufficient information to map specific indicators. Since PLS-SEM performs best with complete datasets for optimal estimation, to ensure model validity and robustness, missing values must be handled appropriately before proceeding with modeling.
To address this issue, this study will apply K-Nearest Neighbors (KNN) imputation, a widely used technique for handling missing data. KNN imputation identifies the k most similar observations (neighbors) in the dataset and estimates the missing value based on the weighted average or mode of these neighbors. This approach ensures that missing values are replaced based on patterns observed in the existing data rather than relying on arbitrary assumptions, thereby preserving the integrity of consumer sentiment information. The decision to use KNN imputation instead of Mean, Regression, and Multiple Imputation (MI) is based on methodological considerations related to the nature of the sentiment score dataset: Mean imputation oversimplifies missing data by replacing values with the average, reducing variance and distorting sentiment distributions. Regression imputation assumes fixed linear relationships, which do not capture the diverse linguistic expressions in consumer sentiment. MI generates probabilistic values that may fall outside the predefined sentiment scale, complicating interpretation. In contrast, KNN imputation preserves data structure, maintains scale consistency, and imputes missing values based on real observed patterns, ensuring methodological robustness.
The KNN imputation process will proceed as follows. First, the dataset will be examined for missing values in indicators’ scores. Suppose an indicator is missing from a given review. In that case, it suggests that either the sentiment classification failed to detect relevant content or the review did not contain an explicit sentiment toward that dimension. Next, the number of nearest neighbors (k) will be selected using cross-validation techniques to optimize imputation accuracy, with different k values (e.g., 3, 5, and 7) tested to determine the most effective configuration. Once the optimal k-value is identified, the algorithm will find similar consumer reviews based on the available sentiment scores in other MCCP dimensions. The weighted average of the k neighbors will then replace the missing value. Finally, statistical validation will be performed to compare the distribution of the original and imputed data, ensuring that the imputation process does not introduce bias or distort the dataset’s structure.
The missingness in sentiment scores primarily arises from cases where consumer reviews lacked explicit expressions related to specific dimensions rather than from random or systematic data loss (Kim & Im, 2018; Li et al., 2023; Mellinas & Leoni, 2024; Mitra et al., 2023; Zhou et al., 2024), addressing them through statistical reporting would provide limited additional insights beyond what is already captured by the text-mining framework. Given that missing values were distributed across various MCCP dimensions rather than concentrated in specific categories, KNN imputation was selected to leverage existing sentiment scores and maintain contextual consistency in consumer evaluations.
Reliability Testing
To ensure the reliability of the structured dataset before conducting PLS-SEM analysis, this study will evaluate internal consistency using McDonald’s Omega (ω). While Cronbach’s Alpha (α) has traditionally been the most widely used measure for reliability testing, recent research suggests that McDonald’s Omega provides a more robust and theoretically sound estimate of internal consistency, particularly in cases where the scale exhibits heterogeneity among its indicators (Njeri et al., 2024; Orçan, 2023; Trizano-Hermosilla & Alvarado, 2016). Given that our dataset is derived from consumer sentiment analysis of textual reviews rather than traditional survey-based Likert-scale responses, heterogeneity in item loadings is expected, making McDonald’s Omega a more appropriate reliability metric. Unlike Cronbach’s Alpha, which assumes tau-equivalence (i.e., all items contribute equally to the latent construct), McDonald’s Omega does not require this assumption. Instead, it accounts for the actual variance explained by each indicator, providing a more precise measurement of internal consistency. It is imperative in sentiment-based data, where different MCCP dimensions may have varying levels of contribution to consumer perception. For interpretation, a McDonald’s Omega value above 0.80 indicates high reliability, while values between 0.70 and 0.80 suggest good reliability; values between 0.60 and 0.70 are considered acceptable, and those below 0.60 indicate low reliability and potential measurement concerns. In this study, SPSSAU will be used to calculate the McDonald’s Omega of each dimension and the overall result.
PLS-SEM Model Specification
Given the nature of the extracted dimensions from consumer sentiment analysis, this study will adopt a formative measurement model rather than a reflective measurement model. The choice of a formative specification is based on the theoretical and methodological considerations regarding the nature of MCCP dimensions in consumer perception. A reflective measurement model assumes that latent constructs cause their indicators, meaning that all indicators should be highly correlated and interchangeable with one another. If one indicator is removed, the meaning of the construct remains unchanged. This approach is suitable for traditional psychological scales, where responses to different items reflect an underlying trait (e.g., satisfaction or brand trust). However, in our case, MCCP perception is not a single latent trait that generates consumer sentiment scores but rather an emergent construct composed of distinct dimensions. These dimensions are not necessarily correlated, but together, they define the overall perception of MCCPs. By contrast, a formative measurement model assumes that indicators collectively form the latent construct, meaning that each dimension uniquely contributes to the construct’s meaning. In the context of consumer MCCP perception, dimensions such as aesthetic appeal, craftsmanship, functionality, and emotional engagement independently shape the overall assessment of a product. The absence or variation in one dimension does not invalidate the construct; instead, it alters its overall composition and meaning. Given that our sentiment-based dataset captures diverse consumer expressions toward different aspects of MCCPs, a formative approach allows us to model these dimensions as independent yet complementary contributors to MCCPs perception. Thus, using a formative measurement model in PLS-SEM ensures that our analysis reflects the causal relationship between dimensions and overall perception rather than assuming that consumer sentiment toward one dimension is necessarily correlated with another. This approach provides a more accurate representation of how consumers evaluate MCCPs, allowing us to quantify the relative importance of each dimension in shaping consumer satisfaction.
In PLS-SEM with a formative measurement model, it is crucial to report appropriate indicators while avoiding internal consistency metrics, such as Composite Reliability (CR) and Average Variance Extracted (AVE), which are only applicable to reflective models. Key essential indicators include Variance Inflation Factor (VIF), ensuring multicollinearity is within acceptable limits (VIF < 5, ideally <3.3), and outer weights, which indicate each indicator’s contribution to the construct, with significance tested via bootstrapping (p < 0.05). Path coefficients also should be reported to assess the strength and direction of relationships (range: -1 to 1, p < 0.05). Additionally, R² will measure the variance explained by independent variables (≥0.25 weak, ≥0.50 moderate, ≥0.75 vigorous), while f² will quantify effect size (≥0.02 small, ≥0.15 medium, ≥0.35 large). Optional indicators include Q² (predictive relevance), which is used to assess out-of-sample prediction (Q² > 0 indicates relevance). To determine the primary indicator influencing the dimension of consumer satisfaction, Importance-Performance Map Analysis (IPMA) will provide managerial insights. Because PLS-SEM prioritizes prediction over overall model fit and formative constructs are defined by their indicators rather than inferred from them (Henseler et al., 2016), the model evaluation does not rely on traditional model fit indices (e.g., RMSEA, SRMR, CFI). Thus, the metrics of model fit are optional. At last, PLS-SEM researchers suggest that to detect a medium effect size (f² = 0.15) with 80% power, at least 150-200 cases are required (Cohen, 1992; Hair et al., 2021); thus, the threshold for data size in PLS-SEM is set at 200.
The PLS-SEM analysis will be conducted in SmartPLS 4.0.0.
Results
Data Overview
The dataset (containing 11,035 consumer reviews) was collected in November 2023, covering reviews from November 2021 to November 2023. This two-year span provides a comprehensive representation of consumer perceptions, minimizing the influence of short-term sentiment fluctuations and ensuring relevance to contemporary MCCP trends. The reviews are primarily in Simplified Chinese, with a small proportion in Traditional Chinese and English, which aligns with Tmall’s primary user base in Mainland China. The limited presence of English reviews does not diminish the study’s global relevance, as consumer behavior in cultural product consumption shares cross-market similarities. Insights from this research can help museums worldwide optimize their cultural product strategies and enhance their engagement with Chinese consumers.
Data Preprocess
The data preprocessing followed a systematic approach to ensure quality and consistency. The first step involved removing empty or non-informative reviews, such as those with default system messages like “此用户没有填写评价” (translated: “This user did not provide a review”). Reviews with extremely short content, such as a single word or a generic phrase like “好” (good), “棒” (great), “还行” (okay), or “不错” (not bad), were excluded. These reviews, while indicative of sentiment, did not provide substantive information about the product and were unsuitable for evaluating MCCP dimensions. Similarly, reviews containing only emojis or special characters were removed, as they lacked explicit textual content for analysis and interpretation. Duplicate reviews, often resulting from bulk purchases or copy-pasting behavior, were also identified and removed to prevent redundancy and bias in the dataset.
The data cleaning process was conducted in two stages: the first stage, in July 2024, resulted in a labeled training set of 2,125 reviews, and the second stage, in January 2025, expanded the dataset to 3,414 reviews. While the exact steps of the two cleaning processes slightly differed—particularly with the addition of a tokenization step in the 2024 phase—both followed a consistent overall methodology, as detailed in the methodology section. This temporal separation between the two stages helped avoid potential biases from revisiting the data too closely, allowing for a more objective approach to processing the dataset. This added layer of data handling can be seen as a strength, ensuring the integrity and reliability of the results.
Dimensions and Indicators
To extract consumer-perceived MCCP dimensions, a two-stage hybrid approach integrating LDA and SVM, as well as BERT and K-Means, was employed with the assistance of an LLM. This section presents the results of each step, including topic optimization, classification performance, and clustering validation.
LDA Topic Modeling
The first stage applied LDA to identify underlying themes within consumer reviews (using the July 2024 dataset, comprising 2,125 reviews). To determine the optimal number of topics, coherence scores were calculated for different topic numbers. The coherence score plot (See Figure 2) indicated that six topics yielded the highest coherence, confirming their suitability for further analysis.
After establishing K = 6 as the optimal number of topics, the top-weighted keywords for each theme were identified. These keywords served as the basis for interpreting topics and naming themes. The identified topics and their corresponding keywords suggest that consumer perceptions of MCCPs are structured around six main themes: Functionality & Quality, Craftsmanship & Price, Design Appeal, Cultural Perception, Emotional Responses, and Aesthetic Impression. Table 2 summarizes the extracted themes, along with the most relevant keywords. The initial probabilistic topic distribution is presented in Figure 3.
SVM Classification for Theme Labeling
Following LDA, an SVM classifier was trained to refine the topic assignments. Since LDA-derived themes are probabilistic rather than deterministic, the SVM classification process helped improve accuracy by ensuring that each consumer review was assigned to a dominant theme. The dataset from July 2024 already had clear dominant themes derived from LDA, and the SVM model was used to validate whether LDA had correctly extracted these themes. During the validation process, the entire dataset of 2,125 reviews was split into 80% for training (1,700 reviews) and 20% for testing (425 reviews). The SVM model achieved impressive results, with an accuracy of 94.12%, a precision of 94.26%, a recall of 94.12%, and an F1-score of 94.11%. These results demonstrate that the SVM model reliably predicted the LDA-derived themes, confirming the robustness and validity of the LDA analysis.
BERT and K-Means Clustering Validation
BERT and K-Means clustering were used as supplementary methods to LDA. The clustering analysis revealed that the highest silhouette score was achieved with 7 clusters (See Figure 4).
After applying BERT to generate 768-dimensional vector representations for the consumer reviews, K-Means clustering was used to group these reviews into distinct clusters. For each cluster, a label was assigned based on its predominant theme, and the reviews were grouped accordingly. The comment examples of each cluster are shown in Table 3.
We then passed 100 randomly selected reviews from each cluster (due to input length limitations) into two advanced LLMs, namely DeepSeek R1 and ChatGPT o3-mini-high. These models were tasked with summarizing the key content of the reviews in each cluster using one to two words (See Table 4). Upon comparing the results in Table 4, we found that those from both models were nearly consistent. The consistency between the keywords generated by the language models and the themes identified by LDA provided additional support for the reliability of the LDA clustering.
Based on the results of LDA+SVM and BERT+K-Means, we propose a framework of dimensions and indicators for further analysis (See Table 5).
Since PLS-SEM latent variables typically require 3-4 observed indicators per construct, the current framework does not yet meet this criterion. To ensure both the adequacy and accuracy of dimensions and indicators, we further refined the initial framework derived from LDA+SVM and BERT+K-Means. Specifically, we applied SPSSAU’s text analysis tool to segment the review texts and identify high-frequency keywords. These high-frequency terms were then used to supplement the previously established indicators, enhancing the robustness of the measurement framework. Since SPSSAU’s text analysis tool initially extracted 1,000 keywords (with frequencies ranging from 2 to 1,769), processing all keywords would be impractical and unnecessary. To refine the dataset, a frequency threshold was established, and keywords with fewer than 10 occurrences were excluded. As a result, 152 keywords were retained for analysis. We rearranged the 152 keywords according to the framework of dimensions and indicators (See Table 6).
In summary, at this stage, LDA provided an initial framework, grouping reviews based on keyword co-occurrence. SVM improved classification accuracy, ensuring robust theme assignment. BERT+K-Means validated the semantic grouping, refining the theme framework, and text analysis supplemented it with specific keywords. After this process, we determined the dimensions of consumers’ perception of an MCCP and the indicators they used to describe it.
Sentiment Analysis
To quantify consumer sentiment toward different MCCP dimensions, this study applied a dual-method sentiment analysis approach, integrating SPSSAU’s sentiment classification module and Alibaba Cloud’s sentiment analysis API. Each consumer review was assigned a sentiment score based on SPSSAU’s four-level classification system: Positive (7 points), Slightly Positive (5 points), Slightly Negative (3 points), and Negative (1 point). To enhance classification reliability, Alibaba Cloud’s sentiment classifier, which categorizes sentiment into three levels (Positive, Neutral, and Negative), was used for cross-validation. For Neutral cases, we will assign 4 points to them.
To further ensure sentiment classification accuracy, manual verification was conducted for cases where the two classifiers produced conflicting results (i.e., one classifier labeled a review as positive and the other as negative) by an associate professor in the MCCP research field with over 13 years of experience in the field. Additionally, reviews flagged as potential errors by the Alibaba Cloud tool were examined. Each sentence and its clauses within these reviews were carefully analyzed and marked based on its expressed meaning, and sentiment scores were reassigned accordingly to reflect the most accurate interpretation. In this process, we did not adjust sentiment classifications labeled as slightly positive or slightly negative by SPSSAU based on Alibaba Cloud’s sentiment analysis tool. The primary reason for this decision is that Alibaba Cloud’s tool provides only three broad sentiment categories (i.e., positive, neutral, and negative).
In contrast, SPSSAU offers a more granular four-level classification. Given that Alibaba Cloud’s labels are coarser, they lack the necessary detail to refine SPSSAU’s sentiment scores effectively. Therefore, as long as there were no direct contradictions between the two tools (e.g., one labeling a review as positive and the other as negative), we retained SPSSAU’s original four-level classification.
The distribution of sentiment scores is summarized in Table 7 below.
Score Matrixization
To facilitate quantitative analysis using PLS-SEM, the unstructured textual data was transformed into a structured sentiment score matrix. This matrix transformation process ensured that each consumer review was systematically linked to the MCCP dimensions identified through LDA+SVM, BERT+K-Means, and high-frequency keyword analysis. By mapping sentiment scores to relevant dimensions, the study enabled a structured evaluation of consumer perceptions across multiple aspects of MCCPs. Once sentiment classification was finalized, the sentiment scores were mapped to their respective MCCP dimensions. For reviews that contained multiple sentiment expressions within a single entry, the sentiment scores were distributed accordingly. For instance, a review expressing satisfaction with the design but dissatisfaction with the price resulted in a positive sentiment score for design aesthetics and a negative sentiment score for the price. If a review mentioned only one dimension, its sentiment score was assigned exclusively to that category, while the remaining dimensions were left unassigned. The structured dataset was then organized into a sentiment score matrix, where each row represented a consumer review, each column corresponded to an MCCP dimension, and the values indicated sentiment scores assigned to each dimension. To ensure more accurate and reliable mappings, the matrix was reviewed by the expert we invited. A sample of this structured matrix is shown in Table 8.
Missing Data Processing
In the initial sentiment score matrix, a significant proportion of missing values was observed, with some indicators exhibiting missing rates as high as 99% (See Figure 5). Since PLS-SEM requires complete datasets for accurate model estimation, handling missing sentiment scores was a critical step before proceeding with structural modeling. Missing values in the sentiment score matrix primarily arose due to three reasons. First, some consumer reviews did not explicitly mention specific MCCP dimensions. For instance, a review may discuss design aesthetics and cultural attributes but not address price or functionality. In such cases, no sentiment score could be assigned to the unmentioned dimensions. Second, sentiment analysis tools occasionally fail to classify a sentiment score due to ambiguous phrasing or indirect expressions in consumer reviews. Thirdly, the selection of keywords, particularly those that barely met the minimum occurrence threshold (i.e., 10) in the dataset, also contributed to the issue of a high missing rate.
To effectively address this issue, a keyword aggregation approach was implemented. Instead of treating each keyword as an independent metric, the 152 identified keywords (Column 3 in Table 6) were grouped under their respective indicators (Column 2 in Table 6), with their sentiment occurrences summed to generate aggregated indicator scores. This aggregation allowed missing values at the keyword level to be absorbed within the broader indicator-level structure, thereby reducing data missingness (black line in Figure 5) and streamlining the complexity of the PLS-SEM model.
To systematically address missing values, KNN imputation was applied. While the 20% missing data threshold is commonly used in structured survey data, it is less applicable to consumer reviews, where missing sentiment scores arise from content-driven omissions rather than data errors. Strictly following the 20% rule would lead to excessive data loss, excluding valuable insights. Although studies suggest KNN can handle up to 90% missingness (Marchang & Tripathi, 2021), such high thresholds increase uncertainty. To strike a balance, this study adopts a 50% threshold, ensuring enough observed sentiment scores for reliable imputation while avoiding excessive reliance on estimated values. Thus, before applying KNN, cases with excessive missing values (a missing rate of more than 51%) were removed from the dataset. After this process, 523 entries remain, and the average missing rate falls from 76.04% to 46.49%.
By removing reviews with excessive missing values and applying KNN imputation, the study ensured that all retained cases had complete sentiment scores across all MCCP dimensions. This imputation step significantly enhanced the dataset’s reliability and validity, providing a solid foundation for subsequent PLS-SEM analysis.
Measurement Model Construction
The MCCP perception model was developed through a data-driven, multi-step approach that integrates text mining, sentiment analysis, expert validation, and structural modeling. This process ensures that the final model is empirically grounded while remaining theoretically relevant to existing frameworks of consumer perception. Building on the previous stages, we have systematically extracted indicators from consumer reviews through text mining techniques, including LDA+SVM and BERT+K-Means. These indicators were then grouped into broader dimensions based on expert validation, ensuring a structured and conceptually meaningful framework. Now, before proceeding to the reliability assessment, we first establish the theoretical measurement model, which organizes these dimensions into a structured representation of MCCP perception, consumer experience, and satisfaction. This model will serve as the foundation for subsequent PLS-SEM analysis.
In the literature review, we identified three key factors — Product Perception, Consumption Experience, and Satisfaction —as the foundation for understanding consumer evaluation of MCCPs. Based on this framework, we structured the dimensions and indicators extracted from text analysis into these categories, ensuring consistency between empirical findings and theoretical insights. Each of these constructs consists of multiple dimensions, which were derived from text mining, expert validation, and theoretical alignment. The final measurement model is presented in Table 9, which details the latent constructs, their corresponding dimensions, and the indicators associated with each.
The hierarchical model structure is illustrated in Figure 6, which visualizes the relationships between latent constructs and their indicators.
Descriptive Statistics and Reliability
Before conducting the reliability analysis, we first present the descriptive statistics of the extracted sentiment scores for each indicator (See Table 10).
In Table 10, the mean values (5.41–6.15) suggest a generally positive consumer sentiment, with standard deviations (1.0–1.4) indicating moderate variability. The full range (1–7) observed in all indicators confirms diverse sentiment distribution across respondents.
To evaluate the internal consistency of the measurement model, McDonald’s Omega was computed. Unlike Cronbach’s Alpha, McDonald’s Omega does not assume equal contributions from all indicators, making it a more robust measure of internal consistency. The overall McDonald’s Omega for the nine dimensions was 0.794, indicating good reliability. The detailed reliability results, including item-deleted McDonald’s Omega values, are presented in Table 11.
In Table 12, the reliability analysis of the latent construct using McDonald’s Omega indicates that Product Perception (0.786) demonstrates good reliability, suggesting that its indicators are well-aligned in capturing consumer evaluations of MCCPs. Consumer Satisfaction (0.675) and Consumption Experience (0.629) fall within the acceptable range, indicating moderate internal consistency. While these values are slightly lower than the conventional 0.70 threshold for strong reliability, they are still within an acceptable range for exploratory research, particularly in formative measurement models where indicator variance is expected.
PLS-SEM Report
Outer Weight
The outer weights analysis provides insights into the relative contributions of each indicator to its respective construct, helping to understand which factors play a more significant role in shaping consumer perceptions and experiences. The results in Table 13 indicate that for Product Perception, Product Creativity (0.853) is the most influential factor, suggesting that consumers primarily evaluate MCCPs based on their creative attributes. At the same time, Product Functionality (0.061, p-value=0.325) has a negligible impact (). In the aspect of Consumption Experience, Product Price (0.711) and Product Quality (0.514) are the strongest contributors, emphasizing the importance of pricing fairness and product reliability, whereas Service Experience (0.302) plays a supporting role. Finally, in terms of Consumer Satisfaction, Emotional Response (0.690) has the highest weight, indicating that emotional engagement has a significant influence on overall consumer satisfaction.
Path Coefficients and Predictive Effects
The structural model was evaluated using path coefficients (β), t-values, and p-values to examine the hypothesized relationships. Table 14 summarizes the results. All paths showed statistically significant relationships (p < 0.05), with Product Perception demonstrating a substantial direct effect on Consumption Experience (β = 0.545, t = 14.153, p < 0.001) and Consumer Satisfaction (β = 0.442, t = 7.324, p < 0.001). Meanwhile, Consumption Experience had a moderate effect on Consumer Satisfaction (β = 0.237, t = 3.797, p < 0.001).
R² and f² Values
The predictive power of the model was assessed using R² values, which indicate the proportion of variance in the dependent variable that the predictors explain. The R² values for Consumption Experience and Consumer Satisfaction were 0.297 and 0.366, respectively, reflecting moderate explanatory power. The f² values demonstrated the relative effect size of predictors. Product Perception had a significant effect on Consumption Experience (f² = 0.422) and a medium effect on Consumer Satisfaction (f² = 0.217). In contrast, the effect of Consumption Experience on Consumer Satisfaction was small (f² = 0.062).

Table 15.
R² and f² Values.
| Dependent Variable | R² | f² (Effect Sizes) |
|---|---|---|
| Consumption Experience | 0.297 | Product Perception→Consumption Experience: 0.422 (Large) |
| Consumer Satisfaction | 0.366 |
Product Perception → Consumer Satisfaction: 0.217 (Medium) Consumption Experience → Consumer Satisfaction: 0.062 (Small) |
Multicollinearity
To ensure the validity of the formative constructs in the model, multicollinearity was assessed using VIF values. As shown in Table 16, all VIF values ranged from 1.001 to 1.433, which is well below the critical threshold of 5.0, indicating that there is no significant multicollinearity among the predictors.
Importance-Performance Map Analysis (IPMA)
The IPMA results revealed Product Creativity as the most critical driver of Consumer Satisfaction, with the highest Importance Score and Performance Score (See Figure 7). It highlights the significant role of Product Creativity in shaping consumer perceptions and satisfaction of MCCPs.
Q² Value
The indicator-level predictive relevance was assessed using the cross-validated communality Q² values (Table 17). Among all indicators, only Product Creativity (Q² = 0.046) demonstrated weak predictive relevance, suggesting that it contributes partially to its latent construct. However, all other indicators, including Product Quality (Q² = -0.212), Product Price (Q² = -0.100), and satisfaction-related dimensions (Q² < 0), exhibited no predictive relevance.
Model Fit
To evaluate the overall fit of the model, several fit indices were examined. The standardized root mean square residual (SRMR) was 0.046, which is well below the recommended threshold of 0.08, indicating a good model fit. Additionally, the unweighted least squares discrepancy (d_ULS = 0.097) and geodesic discrepancy (d_G = 0.030) were found to be low, suggesting a minimal discrepancy between the observed and estimated models. Finally, the normed fit index (NFI) was 0.899, which is close to the recommended threshold of 0.90, indicating an acceptable model fit. These results collectively confirm that the proposed model demonstrates a satisfactory level of model fit and provides reliable structural estimates.
Summary
This study identified Product Perception, Consumption Experience, and Satisfaction as the core dimensions shaping consumer evaluations of MCCPs. Text mining and sentiment analysis were used to extract key consumer themes, which were structured into measurable indicators and aggregated into higher-order constructs. To address missing data, KNN imputation was applied with a 50% threshold, ensuring sufficient observed values while preserving data integrity. Reliability analysis confirmed that the extracted dimensions exhibited acceptable internal consistency, supporting their suitability for further analysis.
PLS-SEM results validated the proposed theoretical framework, demonstrating that Product Perception significantly influenced both Consumption Experience and Satisfaction, while Consumption Experience played a secondary role in shaping Consumer Satisfaction. No multicollinearity issues were found, ensuring the stability of the model estimates. Among the indicators, Product Creativity, Product Price, and Emotional Response emerged as the strongest contributors to their respective dimensions. In contrast, Product Functionality showed minimal impact on consumers' product perception, suggesting that functionality may not be a primary evaluation criterion for MCCPs. Moreover, IPMA analysis highlighted areas for strategic improvement, indicating that while some dimensions performed well, others—such as Product Functionality and Product Quality—had moderate importance but lower performance, presenting opportunities for enhancement. Finally, predictive relevance analysis showed that most indicators had limited predictive power, except for Product Creativity, which exhibited weak predictive relevance. The validated PLS-SEM model is illustrated in Figure 8, and the decisions to the Hypotheses are summarized in Table 18.
Discussion
Methodological Contribution
This study introduces LLM-assisted semantic analysis as a methodological advancement in extracting consumer perceptions from large-scale textual data, significantly enhancing context-aware sentiment classification, thematic identification, and discourse structuring. Traditional text analysis methods, such as manual coding and keyword-based sentiment analysis, often fail to capture implicit meanings, contextual nuances, and linguistic complexities in consumer-generated discourse. By leveraging LLMs, this study enables more precise sentiment classification, identifying consumer emotions and attitudes beyond surface-level expressions. Additionally, LLM-assisted thematic analysis facilitates the discovery of underlying themes in consumer feedback, improving the accuracy of clustering product-related discussions. Furthermore, advanced discourse structuring techniques powered by LLMs enable a more comprehensive and contextualized understanding of how consumers evaluate creativity, aesthetics, functionality, emotional engagement, and cultural values in MCCPs. This methodological innovation addresses key limitations of conventional text mining approaches by reducing human bias, improving processing efficiency, and enabling large-scale automated analysis of consumer discourse. Unlike traditional methods that rely on predefined dictionaries or rule-based systems, LLM-assisted models adapt dynamically to diverse linguistic expressions, capturing subtle variations in consumer sentiment and product evaluations. This adaptability is particularly valuable in cultural and creative industries, where product perception is often highly subjective and emotionally driven.
Beyond enhancing analytical precision, this study establishes a scalable and AI-driven framework for future research in cultural heritage marketing and consumer behavior. The integration of LLM-assisted semantic analysis provides a replicable and extensible approach for analyzing consumer-generated content, offering insights that are both theoretically robust and practically actionable. As an early exploration of LLM-assisted analysis in MCCP evaluation, this research provides insights into the potential of AI-driven consumer sentiment analysis in understanding cultural product engagement. Rather than establishing a definitive benchmark or foundation, this study provides an empirical example that may inspire future research to refine and expand the application of LLMs in analyzing consumer perceptions within the cultural and creative industries.
Theoretical Contribution
Theoretically, this study contributes to the literature by constructing a data-driven framework for evaluating MCCPs, confirming the central role of Creativity, along with Aesthetics, Emotion, Design, and Culture, in shaping consumer perceptions. The research highlights Creativity as the primary driver of consumer satisfaction, reinforcing that innovation is a crucial determinant in MCCP evaluation, aligning with the findings of previous studies (He & Timothy, 2024; Xu & Zhang, 2024). While previous studies have often treated creativity as a subset of design (Han et al., 2021; Wodehouse & Casakin, 2022), our findings demonstrate that it functions as an independent dimension with distinct consumer expectations. This distinction underscores the necessity for MCCPs to transcend traditional design principles and proactively incorporate creative and innovative elements to capture consumer interest and engagement.
Moreover, our study contributes to the Diffusion of Innovation Theory of Rogers (2003) by providing new insights into how MCCPs gain consumer acceptance, expanding its application in the context of cultural and creative products. Rogers (2003) identifies five key attributes influencing the adoption of innovations in his theory: relative advantage, compatibility, complexity, observability, and trialability. The findings of this study provide new insights into how these attributes operate in the MCCP domain, particularly in the context of cultural product evaluation.
The concept of relative advantage is evident in how creativity significantly enhances the perceived value of MCCPs (Im & Workman, 2004; Kumar et al., 2024; Li et al., 2021; Modig & Rosengren, 2014). Unlike conventional mass-market products, MCCPs differentiate themselves through unique and innovative designs that elevate their cultural significance and artistic appeal. It reinforces the idea that product differentiation in the MCCP industry should be driven by creative reinvention rather than merely replicating cultural elements.
Compatibility, which measures the alignment between innovation and consumer values, plays a crucial role in MCCP adoption, particularly through cultural compatibility rather than functional utility. Unlike mainstream consumer products that emphasize efficiency and practicality, we discovered that MCCP consumers prioritize cultural authenticity, emotional resonance, and aesthetic alignment over pure functionality, supported by the previous research on MCCPs (Beverland & Farrelly, 2010; Hui Cheng, Shi-jian Luo, et al., 2023; Cheng & Qiu, 2023; Kreuzbauer & Keller, 2017; Yu et al., 2022). Our findings suggest that successful MCCPs must integrate historical narratives, artistic traditions, and personal identity to establish deeper consumer connections. By embedding authenticity and emotional depth into product design, MCCPs can strengthen their cultural appeal, fostering stronger engagement and long-term adoption.
The role of complexity in MCCPs differs from its conventional interpretation in the Theory of Diffusion of Innovation. Unlike standard products, where higher complexity may deter adoption, our findings suggest that MCCP consumers are willing to embrace intricate and creative designs as long as they maintain cultural coherence, aligning with the previous studies (Buschgens et al., 2024; Liu & Zhao, 2024). It indicates that complexity in MCCPs is not necessarily a barrier but rather an opportunity—provided that the creative elements remain interpretable and meaningful within their cultural context.
Observability and trialability—the extent to which an innovation’s benefits can be seen and experienced before adoption—are increasingly shaped by digital engagement strategies in the MCCP industry. Digital tools such as online previews, consumer-generated content, and augmented reality experiences enhance observability by allowing consumers to explore product attributes virtually before making a purchase (Lavoye et al., 2023; Sekri et al., 2024; Zulkarnain et al., 2024). This technological integration helps bridge the gap between digital and physical consumer experiences, making MCCPs more accessible and engaging.
Practical Implications
These findings have important implications for MCCP development, commercialization, and consumer engagement strategies. One of the primary challenges in the MCCP industry is product homogeneity (Hui Cheng, Xu Sun, et al., 2023; H. Li et al., 2024), where many products fail to stand out due to repetitive motifs and lack of originality. Given that creativity is the strongest driver of consumer satisfaction discovered by this research, museums, and cultural enterprises must shift their design strategies away from standardized cultural symbols and instead focus on original, narrative-driven innovations. MCCPs should blend historical authenticity with contemporary design elements to ensure they remain culturally relevant yet commercially viable.
Our findings underscore the strategic importance of consumer loyalty in driving MCCP growth. Consumers with strong emotional connections to MCCPs are more likely to repurchase, recommend, and co-create. Museums and brands should enhance engagement through interactive storytelling, limited-edition collaborations, and personalized designs. One practical approach, supported by previous studies (Y. Li et al., 2024; R. Zhang et al., 2024; Zou et al., 2024), is a cultural points system that rewards purchases, museum visits, and content creation, allowing consumers to redeem points for exclusive experiences and co-creation opportunities. Furthermore, consumer co-creation should be actively encouraged, aligning with research such as Y. Liu (2024), Shaw et al. (2021), and Monteiro et al. (2023). Museums can implement user-generated content (UGC) initiatives, enabling consumers to design, customize, and collaborate on MCCPs, thereby enhancing authenticity, cultural value, and consumer ownership.
Furthermore, the insights from our study provide a pathway for cultural institutions to transition towards financial sustainability. The traditional reliance on government funding for cultural heritage preservation is becoming increasingly challenging (Christensen, 2025; Thuc et al., 2024). By strengthening MCCP market viability through creativity-driven differentiation and consumer loyalty initiatives, museums can develop self-sustaining business models. Encouraging habitual engagement through loyalty programs (Frullo & Mattone, 2024; Thakker et al., 2024) and fostering brand attachment through cultural storytelling (Choi et al., 2024; Zimand-Sheiner, 2024) can reduce financial dependency on public funding while ensuring cultural heritage remains an integral part of contemporary consumer culture.
Lastly, the LLM-assisted semantic analysis provides a scalable and adaptable framework for integrating AI into heritage management and heritage marketing, enabling institutions to make data-driven strategic decisions based on large-scale consumer feedback. By enhancing the interpretation of consumer sentiment, thematic trends, and cultural preferences, this approach enables heritage organizations to optimize MCCP design, refine their marketing strategies, and enhance visitor engagement. The ability to process vast amounts of unstructured text data in real time enables a more nuanced understanding of consumer perceptions, ensuring that heritage products align with audience expectations while maintaining historical authenticity. Furthermore, by leveraging advanced natural language processing techniques, this method empowers heritage institutions and creative industries to anticipate market shifts, enhance consumer experience, and drive innovation, ultimately fostering sustainable cultural commercialization and broader public appreciation of heritage assets.
Conclusions
This study employs LLM-assisted semantic analysis to enhance the accuracy and efficiency of context-aware sentiment classification, theme extraction, and discourse structuring in consumer-generated reviews. By leveraging advanced natural language processing, this approach addresses the limitations of traditional text analysis by capturing implicit meanings, nuanced sentiments, and complex linguistic patterns in consumer discourse. This methodological innovation strengthens data-driven insights into heritage marketing, providing a scalable and adaptable framework for future AI-enhanced consumer research.
Building on this methodological foundation, the study explores how consumers evaluate MCCPs and develop a data-driven evaluation framework. Through LLM-assisted semantic analysis and PLS-SEM, findings reveal that Creativity is the strongest driver of consumer satisfaction. Additionally, this research applies the Diffusion of Innovation Theory to interpret the data analysis results, further expanding the theory’s application in the MCCP domain. The study further refines traditional consumer behavior research by integrating creativity, aesthetics, emotion, and cultural values into an MCCP evaluation framework. Moreover, it reinterprets consumer loyalty in cultural products, emphasizing engagement and co-creation alongside repurchase intent. These findings suggest that MCCP developers should prioritize creativity and foster consumer participation through co-creation strategies and loyalty mechanisms such as cultural points and UGC. Additionally, cultural heritage institutions can leverage these strategies to increase consumer engagement, reduce reliance on government funding, and ensure the sustainable development of cultural heritage.
Despite its contributions, this study has two key limitations. First, LLM-assisted semantic analysis is not fully automated and requires human intervention. While LLMs enhance sentiment classification and thematic extraction, manual refinement, and phased processing remain necessary due to constraints imposed by batch processing. Future advancements in automation and scalability will improve efficiency. Second, reliance on consumer-generated reviews may introduce bias, as online feedback may not fully represent all MCCP consumers. Future research could incorporate surveys or experiments for a more comprehensive understanding of consumer perceptions.
Declaration of generative AI and AI-assisted technologies in the writing process
We acknowledge the use of ChatGPT 4o, an AI language model, in translating and conducting grammar checks. All content and code were thoroughly reviewed and validated by the authors to ensure their accuracy and relevance to the research.
| 1 | China Economic Net. (2019, August 16). Annual online museum visits reach 1.6 billion, surpassing physical attendance. Retrieved from http://www.ce.cn/culture/gd/201908/16/t20190816_32929128.shtml. Accessed February 8, 2025. |
| 2 | The indicator of Appearance was originally placed under the Cluster of Functionality & Quality, but since it didn't fit well there, it was moved to the dimension of Aesthetic Impression. |
References
- Acampa, G.; Parisi, C. M. Cultural heritage management: optimising procedures and maintenance costs. Journal Valori e Valutazioni 2021, 29, 79–102. [Google Scholar] [CrossRef]
- Akdeniz, B.; Calantone, R. J.; Voorhees, C. M. Effectiveness of Marketing Cues on Consumer Perceptions of Quality: The Moderating Roles of Brand Reputation and Third-Party Information. Psychology & Marketing 2013, 30(1), 76–89. [Google Scholar] [CrossRef]
- Anderson, E. W.; Sullivan, M. W. The Antecedents and Consequences of Customer Satisfaction for Firms. Marketing Science 1993, 12(2), 125–143. [Google Scholar] [CrossRef]
- Arnould, E. J.; Price, L. L. River Magic: Extraordinary Experience and the Extended Service Encounter. Journal of Consumer Research 1993, 20(1), 24–45. [Google Scholar] [CrossRef]
- Aroles, J.; Morrell, K. Marketisation and the Public Good: A Typology of Responses among Museum Professionals. Work, Employment and Society 2024, 39(1), 226–247. [Google Scholar] [CrossRef]
- Baghirov, F.; Zhang, Y. Assessment of the association between aesthetic products and perceived product quality: an analysis of customer attitudes. Journal of Consumer Marketing 2024, 41(7), 789–803. [Google Scholar] [CrossRef]
- Barile, S.; Saviano, M. G., M. Golinelli, Ed.; From the Management of Cultural Heritage to the Governance of the Cultural Heritage System. In Cultural Heritage and Value Creation: Towards New Pathways; Springer International Publishing, 2015; pp. 71–103. [Google Scholar] [CrossRef]
- Beverland, M. B.; Farrelly, F. J. The Quest for Authenticity in Consumption: Consumers’ Purposive Choice of Authentic Cues to Shape Experienced Outcomes. Journal of Consumer Research 2010, 36(5), 838–856. [Google Scholar] [CrossRef]
- Blut, M.; Chaney, D.; Lunardo, R.; Mencarelli, R.; Grewal, D. Customer Perceived Value: A Comprehensive Meta-analysis. Journal of Service Research 2023, 27(4), 501–524. [Google Scholar] [CrossRef]
- Borin, E.; Donato, F. Financial Sustainability of Digitizing Cultural Heritage: The International Platform Europeana. Journal of Risk and Financial Management 2023, 16(10). [Google Scholar] [CrossRef]
- Buschgens, M.; Figueiredo, B.; Blijlevens, J. Heritage yet contemporary: an aesthetic cultural precept explaining diasporic consumer aesthetic appreciation for package design. Journal of Product & Brand Management 2024, (ahead-of-print). [Google Scholar] [CrossRef]
- Cao, Y.; Wang, J. How do purchase preferences moderate the impact of time and price sensitivity on the purchase intention of customers on online-to-offline (O2O) delivery platforms? British Food Journal 2024, 126(4), 1510–1538. [Google Scholar] [CrossRef]
- Capece, S.; Chivăran, C.; Giugliano, G.; Laudante, E.; Nappi, M. L.; Buono, M. Advanced systems and technologies for the enhancement of user experience in cultural spaces: an overview. Heritage Science 2024, 12(1), 71. [Google Scholar] [CrossRef]
- Carù, A.; Cova, B. Revisiting Consumption Experience: A More Humble but Complete View of the Concept. Marketing Theory 2003, 3(2), 267–286. [Google Scholar] [CrossRef]
- Carvajal Pérez, D.; Le Masson, P.; Weil, B.; Araud, A.; Chaperon, V. Creative heritage: Overcoming tensions between innovation and tradition in the luxury industry. Creativity and Innovation Management 2020, 29(S1), 140–151. [Google Scholar] [CrossRef]
- Chen, Y.; Wang, X.; Le, B.; Wang, L. Why people use augmented reality in heritage museums: a socio-technical perspective. Heritage Science 2024, 12(1), 108. [Google Scholar] [CrossRef]
- Chen, Z.; Xu, J.; Xiao, B.; Rauterberg, M. Research on Consumers’ Decision-Making Factors of Cultural and Creative Products of the Palace Museum Under the Background of New Media. In Culture and Computing; Cham., 2020. [Google Scholar]
- Cheng, H.; Luo, S.-j.; Liu, B.-j.; Xia, L.; Xie, J.; Qiu, X. Insights on Metrics’ Correlation of Creativity Assessment for Museum Cultural and Creative Product Design. International Conference on Human-Computer Interaction 2023 (HCII2023), Copenhagen, Denmark; 2023. [Google Scholar]
- Cheng, H.; Mi, Q.; Sun, Y.; Zhao, X. Factors Influencing Chinese Consumers’ Intentions to Purchase Museum’s Cultural and Creative Products. The 2nd International Conference on Creative Industries and Knowledge Economy (CIKE 2023); 2023. [Google Scholar]
- Cheng, H.; Qiu, X. Exploring Correlations of PCMI Metrics in Museum Creativity through Line Chart. AHFE International Conference on Human Factors in Design, Engineering, and Computing 2023 (AHFE2023 Hawaii Edition), Hawaii, USA; 2023. [Google Scholar]
- Cheng, H.; Sun, X.; Qiu, X.; Liu, B.-j.; Xia, L.; Luo, S.-j.; Xie, J.; Li, W.; Li, Y.; Tian, X. An In-depth Analysis of PCMI Dimensions for Museum Creativity. Thinking Skills and Creativity 2023, 50, 101407. [Google Scholar] [CrossRef]
- Cheng, H.; Sun, X.; Xie, J.; Liu, B.-j.; Xia, L.; Luo, S.-j.; Tian, X.; Qiu, X.; Li, W.; Li, Y. Constructing and Validating the Museum Product Creativity Measurement (MPCM): Dimensions for Creativity Assessment of Souvenir Products in Chinese Urban Historical Museums. Humanities & Social Sciences Communications 2024, 11(1), Article 280. [Google Scholar] [CrossRef]
- Chhabra, D.; Healy, R.; Sills, E. Staged authenticity and heritage tourism. Annals of Tourism Research 2003, 30(3), 702–719. [Google Scholar] [CrossRef]
- Cho, H.; Joo, D.; Chi, C. G. Examining nostalgia in sport tourism: The case of US college football fans. Tourism Management Perspectives 2019, 29, 97–104. [Google Scholar] [CrossRef]
- Choi, C.-J.; Xu, J.; Min, D.-G. Investigating of the influence process on consumer’s active engagement through emotional brand attachment and brand love. Asia Pacific Journal of Marketing and Logistics 2024, 36(11), 3061–3080. [Google Scholar] [CrossRef]
- Christensen, M. E. B. ‘They all know which way the wind is blowing, which way the money is flowing’: museum actors’ perspectives on involvement in protection of cultural heritage in armed conflict. International Journal of Cultural Policy 2025, 31(1), 36–50. [Google Scholar] [CrossRef]
- Cohen, E. Authenticity and commoditization in tourism. Annals of Tourism Research 1988, 15(3), 371–386. [Google Scholar] [CrossRef]
- Cohen, J. A power primer. Psychol Bull 1992, 112(1), 155–159. [Google Scholar] [CrossRef] [PubMed]
- Debenedetti, A.; Chaney, D. From feeling like home to being at home: The negative outcomes of attachment to commercial places. Journal of Retailing and Consumer Services 2024, 77, 103653. [Google Scholar] [CrossRef]
- Duarte, P.; Silva, S. C.; Roza, A. S.; Dias, J. C. Enhancing consumer purchase intentions for sustainable packaging products: An in-depth analysis of key determinants and strategic insights. Sustainable Futures 2024, 7, 100193. [Google Scholar] [CrossRef]
- Festinger, L. A theory of cognitive dissonance; Stanford University Press, 1957. [Google Scholar]
- Frullo, N.; Mattone, M. Preservation and Redevelopment of Cultural Heritage Through Public Engagement and University Involvement. Heritage 2024, 7(10), 5723–5747. [Google Scholar] [CrossRef]
- Furferi, R.; Di Angelo, L.; Bertini, M.; Mazzanti, P.; De Vecchis, K.; Biffi, M. Enhancing traditional museum fruition: current state and emerging tendencies. Heritage Science 2024, 12(1), 20. [Google Scholar] [CrossRef]
- Gao, L.; Xinquan. The impact of museum creative products involvement on purchase intention: The mediating role of perceived value. Social Behavior and Personality: an international journal 2024. [Google Scholar] [CrossRef]
- Gao, Y.; Turkina, E.; Van Assche, A. The nexus between the cultural and creative industries and the Sustainable Development Goals: a network perspective. Regional Studies 2023, 58, 841–859. [Google Scholar] [CrossRef]
- Gentile, C.; Spiller, N.; Noci, G. How to Sustain the Customer Experience:: An Overview of Experience Components that Co-create Value With the Customer. European Management Journal 2007, 25(5), 395–410. [Google Scholar] [CrossRef]
- Guo, L.; Hang, Y.; Wu, J. A Study on the Differences of Consumers’ Emotional Experience of Cultural Creative Products in the Palace Museum of Beijing. International Conference on Human-Computer Interaction 2023 (HCII2023), Copenhagen, Denmark; 2023. [Google Scholar]
- Hair, J. F.; Hult, G. T. M.; Ringle, C. M.; Sarstedt, M. A Primer on Partial Least Squares Structural Equation Modeling (PLS-SEM), 3rd Edition ed.; SAGE Publication, 2021. [Google Scholar]
- Han, J.; Forbes, H.; Schaefer, D. An exploration of how creativity, functionality, and aesthetics are related in design. Research in Engineering Design 2021, 32(3), 289–307. [Google Scholar] [CrossRef]
- He, L.; Timothy, D. J. Tourists’ perceptions of ‘cultural and creative souvenir’ products and their relationship with place. Journal of Tourism and Cultural Change 2024, 22(2), 143–163. [Google Scholar] [CrossRef]
- Henseler, J.; Hubona, G.; Ray, P. A. Using PLS path modeling in new technology research: updated guidelines. Industrial Management & Data Systems 2016, 116(1), 2–20. [Google Scholar] [CrossRef]
- Holbrook, M. Introduction to consumer value, 1st Edition ed.; Routledge, 1999. [Google Scholar] [CrossRef]
- Holbrook, M. B.; Hirschman, E. C. The Experiential Aspects of Consumption: Consumer Fantasies, Feelings, and Fun. Journal of Consumer Research 1982, 9(2), 132–140. [Google Scholar] [CrossRef]
- Hosany, S.; Gilbert, D. Measuring Tourists’ Emotional Experiences toward Hedonic Holiday Destinations. Journal of Travel Research 2009, 49(4), 513–526. [Google Scholar] [CrossRef]
- Howkins, J. Creative ecologies: where thinking is a proper job; Routledge, 2018. [Google Scholar]
- Huang, H.; Chen, H.; Zhan, Y. A Study on Consumers’ Perceptions of Museum Cultural and Creative Products through Online Textual Reviews: An Example from Palace Museum’s Cultural and Creative Flagship Store. Behavioral Sciences 2023, 13(4), 318. [Google Scholar] [CrossRef]
- Huang, K.-L.; Xu, N.; Lin, H.; Jiang, J. Research on the Attractive Factors and Design of Cultural Derivative Commodities Under Cultural Sustainability. In C. Stephanidis, HCI International 2021 - Late Breaking Papers: Design and User Experience Cham. 2021.
- Im, S.; Workman, J. P. Market Orientation, Creativity, and New Product Performance in High-Technology Firms. Journal of Marketing 2004, 68(2), 114–132. [Google Scholar] [CrossRef]
- Imperiale, F.; Fasiello, R.; Adamo, S. Sustainability Determinants of Cultural and Creative Industries in Peripheral Areas. Journal of Risk and Financial Management 2021. [Google Scholar] [CrossRef]
- Jin, H.; Hwang, J. The dual lens of authenticity and likability: The effect of cultural familiarity on consumer responses to ethnic foods. International Journal of Hospitality Management 2024, 117, 103655. [Google Scholar] [CrossRef]
- Jog, D.; Gumparthi, V. P.; Jena, S. K. The antecedents and consequences of post-purchase dissonance among tourists purchasing souvenirs: The moderating role of gender, age, and time elapsed. Journal of Hospitality and Tourism Management 2024, 58, 51–68. [Google Scholar] [CrossRef]
- Jv, X.; Liu, X.; Wang, F. Authentic perception experience of tourists in traditional agricultural cultural heritage village: Scale development and validation. Tourism and Hospitality Research 2024, 14673584241285174. [Google Scholar] [CrossRef]
- Kahneman, D. Thinking, Fast and Slow Farrar, Straus and Giroux. 2011. [CrossRef]
- Kahneman, D.; Tversky, A. Prospect Theory: An Analysis of Decision under Risk. Econometrica 1979, 47(2), 263–291. [Google Scholar] [CrossRef]
- Kalyva, Z. C.; Kosma, I. S.; Skalkos, D. Young Consumers’ Price Perceptions in Purchasing Foods: Evidence from Greece. Sustainability 2024, 16(13). [Google Scholar] [CrossRef]
- Kim, J.; Im, J. Proposing a missing data method for hospitality research on online customer reviews. International Journal of Contemporary Hospitality Management 2018, 30(11), 3250–3267. [Google Scholar] [CrossRef]
- Kreuzbauer, R.; Keller, J. The Authenticity of Cultural Products: A Psychological Perspective. Current Directions in Psychological Science 2017, 26(5), 417–421. [Google Scholar] [CrossRef]
- Kumar, D. S.; Gunasekar, S.; Purani, K.; de Gregorio, F. Creativity–help or hindrance? The impact of product review creativity on perceived helpfulness. Computers in Human Behavior 2024, 156, 108182. [Google Scholar] [CrossRef]
- Kumar, R.; Jain, V.; Eastman, J. K.; Ambika, A. The components of perceived quality and their influence on online re-purchase intention. Journal of Consumer Marketing 2025, 42(1), 38–55. [Google Scholar] [CrossRef]
- Ladhari, R. The effect of consumption emotions on satisfaction and word-of-mouth communications. Psychology & Marketing 2007, 24(12), 1085–1108. [Google Scholar] [CrossRef]
- Lavoye, V.; Tarkiainen, A.; Sipilä, J.; Mero, J. More than skin-deep: The influence of presence dimensions on purchase intentions in augmented reality shopping. Journal of Business Research 2023, 169, 114247. [Google Scholar] [CrossRef]
- Lee, Y.-J.; Kim, J.-N.; Lee, H.-S. Rapid product characterization and discrimination considering consumer satisfaction: A product test using three integrated perceptual dimensions as an alternative to a list of individual attributes. Food Quality and Preference 2024, 114, 105099. [Google Scholar] [CrossRef]
- Levrini, G. R. D.; Jeffman dos Santos, M. The Influence of Price on Purchase Intentions: Comparative Study between Cognitive, Sensory, and Neurophysiological Experiments. Behavioral Sciences 2021, 11(2). [Google Scholar] [CrossRef] [PubMed]
- Li, H.; Zhu, Y.; Guo, Q.; Wang, J.; Shi, M.; Liu, W. Unveiling Consumer Satisfaction with AI-Generated Museum Cultural and Creative Products Design: Using Importance–Performance Analysis. Sustainability 2024, 16(18). [Google Scholar] [CrossRef]
- Li, M.; Yang, D.; Zhang, L. Towards Robust Multimodal Sentiment Analysis Under Uncertain Signal Missing. IEEE Signal Processing Letters 2023, 30, 1497–1501. [Google Scholar] [CrossRef]
- Li, Y.; Li, J. The Influence of Design Aesthetics on Consumers’ Purchase Intention Toward Cultural and Creative Products: Evidence From the Palace Museum in China. Frontiers in Psychology 2022, 13, 939403. [Google Scholar] [CrossRef] [PubMed]
- Li, Y.; Sun, J.; Chen, J.; Li, J.; Sun, L.; Cao, K. How to Promote the Development of Cultural and Creative Industries from an Evolutionary Game Perspective: Policy Mechanisms for Certification+Incentives. Sustainability 2024, 16(11). [Google Scholar] [CrossRef]
- Li, Z.; Shu, S.; Shao, J.; Booth, E.; Morrison, A. M. Innovative or Not? The Effects of Consumer Perceived Value on Purchase Intentions for the Palace Museum’s Cultural and Creative Products. Sustainability 2021, 13(4), 2412. [Google Scholar] [CrossRef]
- Lin, C.; Wang, G.; Zeng, B.-Y.; Li, S.-J.; Xiong, L.; Yang, H. Revealing the pattern of causality between tourist experience and the perception of sacredness at shamanic heritage destinations in Northeast China. Scientific Reports 2024, 14(1), 27142. [Google Scholar] [CrossRef]
- Lin, S.-C.; Tseng, H.-T.; Shirazi, F. Consumer decision journey for online group buying: psychological and intentional procedure perspectives. British Food Journal 2022, 124(12), 4387–4405. [Google Scholar] [CrossRef]
- Liu, L. The Use of Visual Communication Technology in the Cultural Connotation and Design Expression of Traditional Cultural and Creative Products. Applied Mathematics and Nonlinear Sciences 2024, 9(1). [Google Scholar] [CrossRef]
- Liu, L.; Zhao, H. Research on consumers’ purchase intention of cultural and creative products—Metaphor design based on traditional cultural symbols. PLOS ONE 2024, 19(5), e0301678. [Google Scholar] [CrossRef] [PubMed]
- Liu, Y. Research on the mechanism of consumer participation in value co-creation by innovative enterprises: An evolutionary game analysis framework. PLOS ONE 2024, 19(5), e0297475. [Google Scholar] [CrossRef] [PubMed]
- Marchang, N.; Tripathi, R. KNN-ST: Exploiting Spatio-Temporal Correlation for Missing Data Inference in Environmental Crowd Sensing. IEEE Sensors Journal 2021, 21(3), 3429–3436. [Google Scholar] [CrossRef]
- McKercher, B.; du Cros, H. Cultural Tourism: The Partnership Between Tourism and Cultural Heritage Management, 1st ed.; Routledge, 2002. [Google Scholar] [CrossRef]
- Mellinas, J. P.; Leoni, V. Beyond words: unveiling the implications of blank reviews in online rating systems. Information Technology & Tourism 2024. [Google Scholar] [CrossRef]
- Mitra, R.; McGough, S. F.; Chakraborti, T.; Holmes, C.; Copping, R.; Hagenbuch, N.; Biedermann, S.; Noonan, J.; Lehmann, B.; Shenvi, A.; Doan, X. V.; Leslie, D.; Bianconi, G.; Sanchez-Garcia, R.; Davies, A.; Mackintosh, M.; Andrinopoulou, E.-R.; Basiri, A.; Harbron, C.; MacArthur, B. D. Learning from data with structured missingness. Nature Machine Intelligence 2023, 5(1), 13–23. [Google Scholar] [CrossRef]
- Mittal, V.; Kamakura, W. A. Satisfaction, Repurchase Intent, and Repurchase Behavior: Investigating the Moderating Effect of Customer Characteristics. Journal of Marketing Research 2001, 38(1), 131–142. Available online: http://www.jstor.org/stable/1558577. [CrossRef]
- Modig, E.; Rosengren, S. Can advertising creativity affect product perceptions and retailer evaluations? Journal of Product & Brand Management 2014, 23(6), 452–461. [Google Scholar] [CrossRef]
- Monteiro, C.; Franco, M.; Meneses, R.; Castanho, R. A. Customer Co-Creation on Revisiting Intentions: A Focus on the Tourism Sector. Sustainability 2023, 15(21). [Google Scholar] [CrossRef]
- Morar, D. D. An overview of the consumer value literature–perceived value, desired value. International Conference "Marketing–from information to decision "6th Edition, Romania; 2013. [Google Scholar]
- Njeri, M.; Khader, M.; Ali, F.; Line, N. D. Revisiting internal consistency in hospitality research: toward a more comprehensive assessment of scale quality. International Journal of Contemporary Hospitality Management 2024, 36(9), 3072–3092. [Google Scholar] [CrossRef]
- Oliver, R. L. A Cognitive Model of the Antecedents and Consequences of Satisfaction Decisions. Journal of Marketing Research 1980, 17(4), 460–469. [Google Scholar] [CrossRef]
- Oliver, R. L. Satisfaction: A behavioral perspective on the consumer: A behavioral perspective on the consumer; Routledge, 2014. [Google Scholar]
- Orçan, F. Comparison of cronbach’s alpha and McDonald’s omega for ordinal data: Are they different? [Comparison of cronbach’s alpha and McDonald’s omega for ordinal data: Are they different?]. International Journal of Assessment Tools in Education 2023, 10(4), 709–722. [Google Scholar] [CrossRef]
- Ordabayeva, N.; Lisjak, M.; Jones, A. C. How social perceptions influence consumption for self, for others, and within the broader system. Current Opinion in Psychology 2022, 43, 30–35. [Google Scholar] [CrossRef] [PubMed]
- Parasuraman, A.; Zeithaml, V. A.; Berry, L. L. SERVQUAL: A multiple-item scale for measuring consumer perceptions of service quality. Journal of Retailing 1988, 64(1), 12–40. [Google Scholar]
- Park, I.; Cho, J.; Rao, H. R. The Dynamics of Pre-and Post-purchase Service and Consumer Evaluation of Online Retailers: A Comparative Analysis of Dissonance and Disconfirmation Models. Decision Sciences 2015, 46(6), 1109–1140. [Google Scholar] [CrossRef]
- Pina, R.; Dias, Á. The influence of brand experiences on consumer-based brand equity. Journal of Brand Management 2021, 28(2), 99–115. [Google Scholar] [CrossRef]
- Pine, B. J.; Gilmore, J. H. The Experience Economy; Harvard Business Review Press, 2011; Available online: https://books.google.com.sg/books?id=edtOyzyKgXUC.
- Porter, S. M. Making Big Bets and Leaning into Operational Excellence: Building the Future of Cultural Heritage Institutions. Journal of Library Administration 2024, 64(2), 168–193. [Google Scholar] [CrossRef]
- Rasoolimanesh, S. M.; Lu, S. Enhancing emotional responses of tourists in cultural heritage tourism: the case of Pingyao, China. Journal of Heritage Tourism 2024, 19(1), 91–110. [Google Scholar] [CrossRef]
- Rejón-Guardia, F. The influence of aesthetics and emotions on reuse intention and compulsive behaviour in food delivery usage. British Food Journal 2024, 126(13), 353–377. [Google Scholar] [CrossRef]
- Rogers, E. M. Diffusion of Innovations, 5th Edition ed.; Free Press, 2003; Available online: https://books.google.co.jp/books?id=9U1K5LjUOwEC.
- Sánchez-Fernández, R.; Iniesta-Bonillo, M. Á. The concept of perceived value: a systematic review of the research. Marketing Theory 2007, 7(4), 427–451. [Google Scholar] [CrossRef]
- Sansome, K.; Conduit, J.; Wilkie, D. C. H. Consumerbased conceptualisation of brand transparency: scope, characteristics and contextual determinants. European Journal of Marketing 2024, 58(12), 2637–2669. [Google Scholar] [CrossRef]
- Schmitt, B. Experiential Marketing. Journal of Marketing Management 1999, 15(1-3), 53–67. [Google Scholar] [CrossRef]
- Schwarz, N.; Clore, G. L. Mood, misattribution, and judgments of well-being: Informative and directive functions of affective states [doi:10.1037/0022-3514.45.3.513]. Journal of Personality and Social Psychology 1983, 45(3), 513–523. [Google Scholar] [CrossRef]
- Sekri, K.; Bouzaabia, O.; Rzem, H.; Juárez-Varón, D. Effects of virtual try-on technology as an innovative e-commerce tool on consumers' online purchase intentions. European Journal of Innovation Management 2024, ahead-of-print. [Google Scholar] [CrossRef]
- Shangguan, X. The Influence of Graphic Design Elements in Museum Cultural and Creative Products on Consumer Satisfaction. Journal of Humanities, Arts and Social Science 2024. [Google Scholar] [CrossRef]
- Shaw, S. J.; Bennett, R.; Kottasz, R. Making space for co-creation: heritage attractions that host contemporary art. International Journal of Heritage Studies 2021, 27(9), 869–883. [Google Scholar] [CrossRef]
- Sirgy, M. J. Self-Concept in Consumer Behavior: A Critical Review. Journal of Consumer Research 1982, 9(3), 287–300. Available online: http://www.jstor.org/stable/2488624. [CrossRef]
- Solomon, M. R. Consumer behavior: Buying, having, and being; Pearson, 2020. [Google Scholar]
- Sonderegger, A.; Uebelbacher, A.; Pugliese, M.; Sauer, J. The influence of aesthetics in usability testing: the case of dual-domain. In Proceedings of the SIGCHI Conference on Human Factors in Computing Systems, Toronto, Ontario, Canada; 2014. [Google Scholar] [CrossRef]
- Stamatoudi, I.; Roussos, K. A Sustainable Model of Cultural Heritage Management for Museums and Cultural Heritage Institutions. Journal on Computing and Cultural Heritage 2024. [Google Scholar] [CrossRef]
- Tasci, A. D. A. A critical review of consumer value and its complex relationships in the consumer-based brand equity network. Journal of Destination Marketing & Management 2016, 5(3), 171–191. [Google Scholar] [CrossRef]
- Thakker, H.; Kumar, R.; Ganesan, E.; Gupta, S.; Garg, A.; Singla, A.; Pathak, A. K. Assessing the Influence of Community Involvement on Perceptions of Cultural Heritage Tourism Development. Evolutionary Studies in Imaginative Culture 2024, 8.1(S2), 723–732. [Google Scholar] [CrossRef]
- Thaler, R. Mental Accounting and Consumer Choice. Marketing Science 1985, 4(3), 199–214. Available online: http://www.jstor.org/stable/183904. [CrossRef]
- Thomson, M.; MacInnis, D. J.; Whan Park, C. The Ties That Bind: Measuring the Strength of Consumers’ Emotional Attachments to Brands. Journal of Consumer Psychology 2005, 15(1), 77–91. [Google Scholar] [CrossRef]
- Thuc, L. D.; Van Nguyen, M.; Ha Duy, K.; Nguyen Van, D. Prioritizing barriers to the conservation of cultural heritage buildings in adaptation to urbanization and climate change. Journal of Cleaner Production 2024, 473, 143529. [Google Scholar] [CrossRef]
- Trizano-Hermosilla, I.; Alvarado, J. M. Best Alternatives to Cronbach's Alpha Reliability in Realistic Conditions: Congeneric and Asymmetrical Measurements [Perspective]. Frontiers in Psychology 2016, 7. Available online: https://www.frontiersin.org/journals/psychology/articles/10.3389/fpsyg.2016.00769. [CrossRef] [PubMed]
- Tsang, N. K. F.; Zhu, M.; Au, W. C. W. Investigating the Attributes of Cultural Creative Product Satisfaction-the Case of the Palace Museum. Journal of China Tourism Research 2022, 18(6), 1239–1258. [Google Scholar] [CrossRef]
- Tu, J.-C.; Liu, L.-X.; Cui, Y. A Study on Consumers’ Preferences for the Palace Museum’s Cultural and Creative Products from the Perspective of Cultural Sustainability. Sustainability 2019, 11(13), 3502. [Google Scholar] [CrossRef]
- Tussyadiah, I. P.; Wang, D.; Jung, T. H.; tom Dieck, M. C. Virtual reality, presence, and attitude change: Empirical evidence from tourism. Tourism Management 2018, 66, 140–154. [Google Scholar] [CrossRef]
- Volanakis, A.; Seymour, C.; Fouseki, K. Assessing the Long-COVID Impact on Heritage Organisations. Heritage 2024, 7(6), 3211–3247. [Google Scholar] [CrossRef]
- Wang, C.; Wang, Y.; Wang, J.; Xiao, J.; Liu, J. Factors influencing consumers' purchase decision-making in O2O business model: Evidence from consumers' overall evaluation. Journal of Retailing and Consumer Services 2021, 61, 102565. [Google Scholar] [CrossRef]
- Weingarten, E.; Duke, K.; Liu, W.; Hamilton, R. W.; Amir, O.; Appel, G.; Cerf, M.; Goodman, J. K.; Morales, A. C.; O’Brien, E.; Quoidbach, J.; Sun, M. What makes people happy? Decoupling the experiential-material continuum. Journal of Consumer Psychology 2023, 33(1), 97–106. [Google Scholar] [CrossRef]
- Weingarten, E.; Goodman, J. K. Re-examining the Experiential Advantage in Consumption: A Meta-Analysis and Review. Journal of Consumer Research 2021, 47(6), 855–877. [Google Scholar] [CrossRef]
- Wen, Y.; Luo, F.; Li, H. The Impact of Aesthetic Expectations and Aesthetic Experiential Qualities on Tourist Satisfaction: A Case Study of the Zhangjiajie National Forest Park. Forests 2024, 15(2). [Google Scholar] [CrossRef]
- Włodarska, K.; Pawlak-Lemańska, K.; Górecki, T.; Sikorska, E. Factors Influencing Consumers’ Perceptions of Food: A Study of Apple Juice Using Sensory and Visual Attention Methods. Foods 2019, 8(11). [Google Scholar] [CrossRef]
- Wodehouse, A.; Casakin, H. Design Creativity in Architecture and Engineering. Buildings 2022, 12(10). [Google Scholar] [CrossRef]
- Xu, J.; Zhang, L. Exploration of Intelligent Transformation Path of Traditional Cultural and Creative Products Based on Internet of Things Technology. Applied Mathematics and Nonlinear Sciences 2024, 9(1). [Google Scholar] [CrossRef]
- Xu, X.; Chen, J. Traditional Cultural and Creative Product Design Methods Combining Digital Art Elements. Applied Mathematics and Nonlinear Sciences 2024, 9(1). [Google Scholar] [CrossRef]
- Xu, X.; Jin, Y. Examining the effects of conflicting reviews on customers' purchase intentions from a product attributes perspective. Journal of Consumer Behaviour 2022, 21(6), 1351–1364. [Google Scholar] [CrossRef]
- Ye, Y.; Yu, X. Investigating the Impact of Museum Cultural and Creative Products on Consumers’ Cultural Interest: A Case Study of Dunhuang. IEEE Access 2024, 12, 192317–192327. [Google Scholar] [CrossRef]
- Yu, L.; Feng, X.; Wang, J.; Kong, W.; Chen, W. Research on the mechanism of emotional design in Chinese cultural and creative products. Heritage Science 2022, 10(1), 119. [Google Scholar] [CrossRef]
- Yuxin, F.; Jianpeng, Q.; Xiaoyu, L.; Yunxia, T.; Weilong, M. Exploring the influence of historical storytelling on cultural heritage tourists’ revisit intention: A case study of the Mogao Grottoes in Dunhuang. PLOS ONE 2024, 19(9), e0307869. [Google Scholar] [CrossRef]
- Zeithaml, V. A. Consumer Perceptions of Price, Quality, and Value: A Means-End Model and Synthesis of Evidence. Journal of Marketing 1988, 52(3), 2–22. [Google Scholar] [CrossRef]
- Zhang, J.; Yang, Y.; Jin, S.; Jing, F. Self-improvement or hedonic enjoyment? Effect of romantic experiences on consumer product preferences. Journal of Consumer Behaviour 2024, 23(6), 2883–2896. [Google Scholar] [CrossRef]
- Zhang, R.; Huang, Q.; Luo, J.; Xu, J.; Pan, Y. Enhancing User Participation in Cultural Heritage through Serious Games: Combining Perspectives from the Experience Economy and SOR Theory. Sustainability 2024, 16(17). [Google Scholar] [CrossRef]
- Zheng, F.; Wu, S.; Liu, R.; Bai, Y. What influences user continuous intention of digital museum: integrating task-technology fit (TTF) and unified theory of acceptance and usage of technology (UTAUT) models. Heritage Science 2024, 12(1), 253. [Google Scholar] [CrossRef]
- Zhou, Z.; Ji, F.; Chang, X.; Liu, Y.; Fujita, H.; Wu, J. A novel self-supervised contrastive learning based sentence-level attribute induction method for online satisfaction evaluation. Computers & Industrial Engineering 2024, 189, 109981. [Google Scholar] [CrossRef]
- Zimand-Sheiner, D. Four Dimensions of Brand Storytelling: Framework for Managing and Analyzing Online Brand Stories. International Journal of Business Communication 2024, 23294884241261362. [Google Scholar] [CrossRef]
- Zou, F.; Yang, M.; Zhou, Y.; Deng, Y.; Xie, B. Goal-gradient point rewards can increase consumers' willingness to purchase poverty-alleviating products. Socio-Economic Planning Sciences 2024, 92, 101788. [Google Scholar] [CrossRef]
- Zulkarnain, A. H. B.; Moskowitz, H. R.; Kókai, Z.; Gere, A. Enhancing consumer sensory science approach through augmented virtuality. Current Research in Food Science 2024, 9, 100834. [Google Scholar] [CrossRef]
Figure 1.
Conceptual Model Framework.
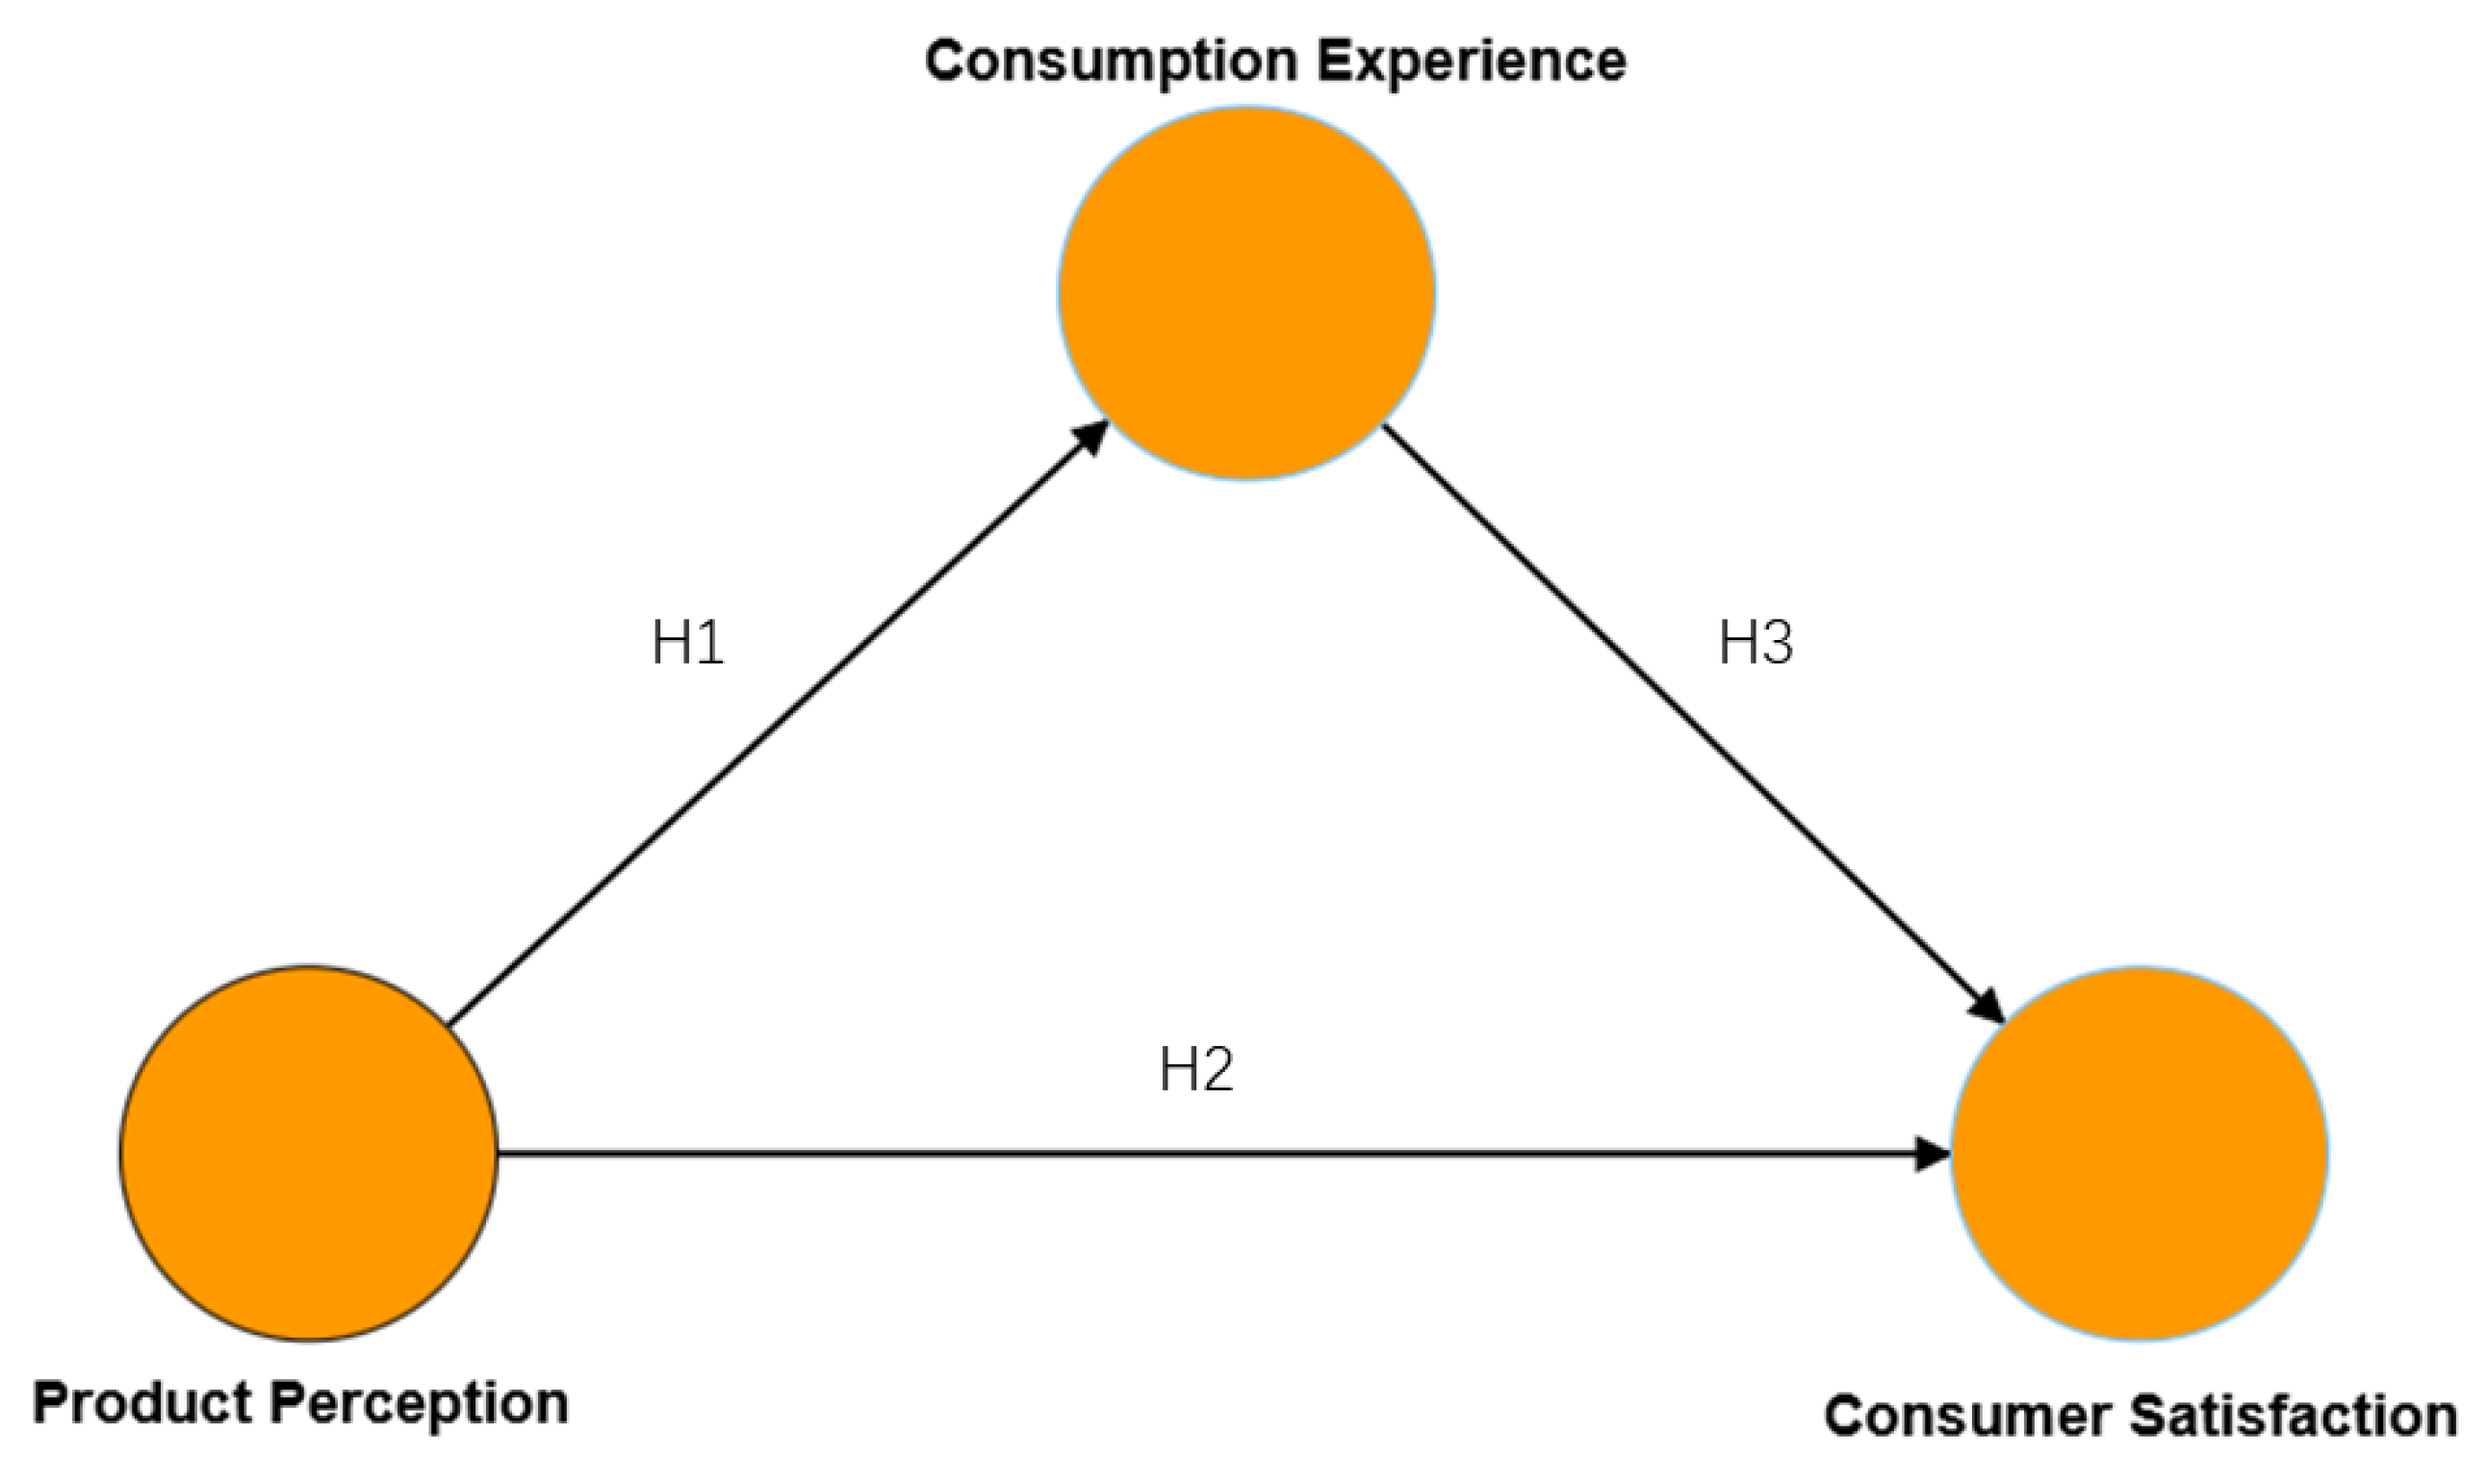
Figure 2.
Coherence Score Plot.
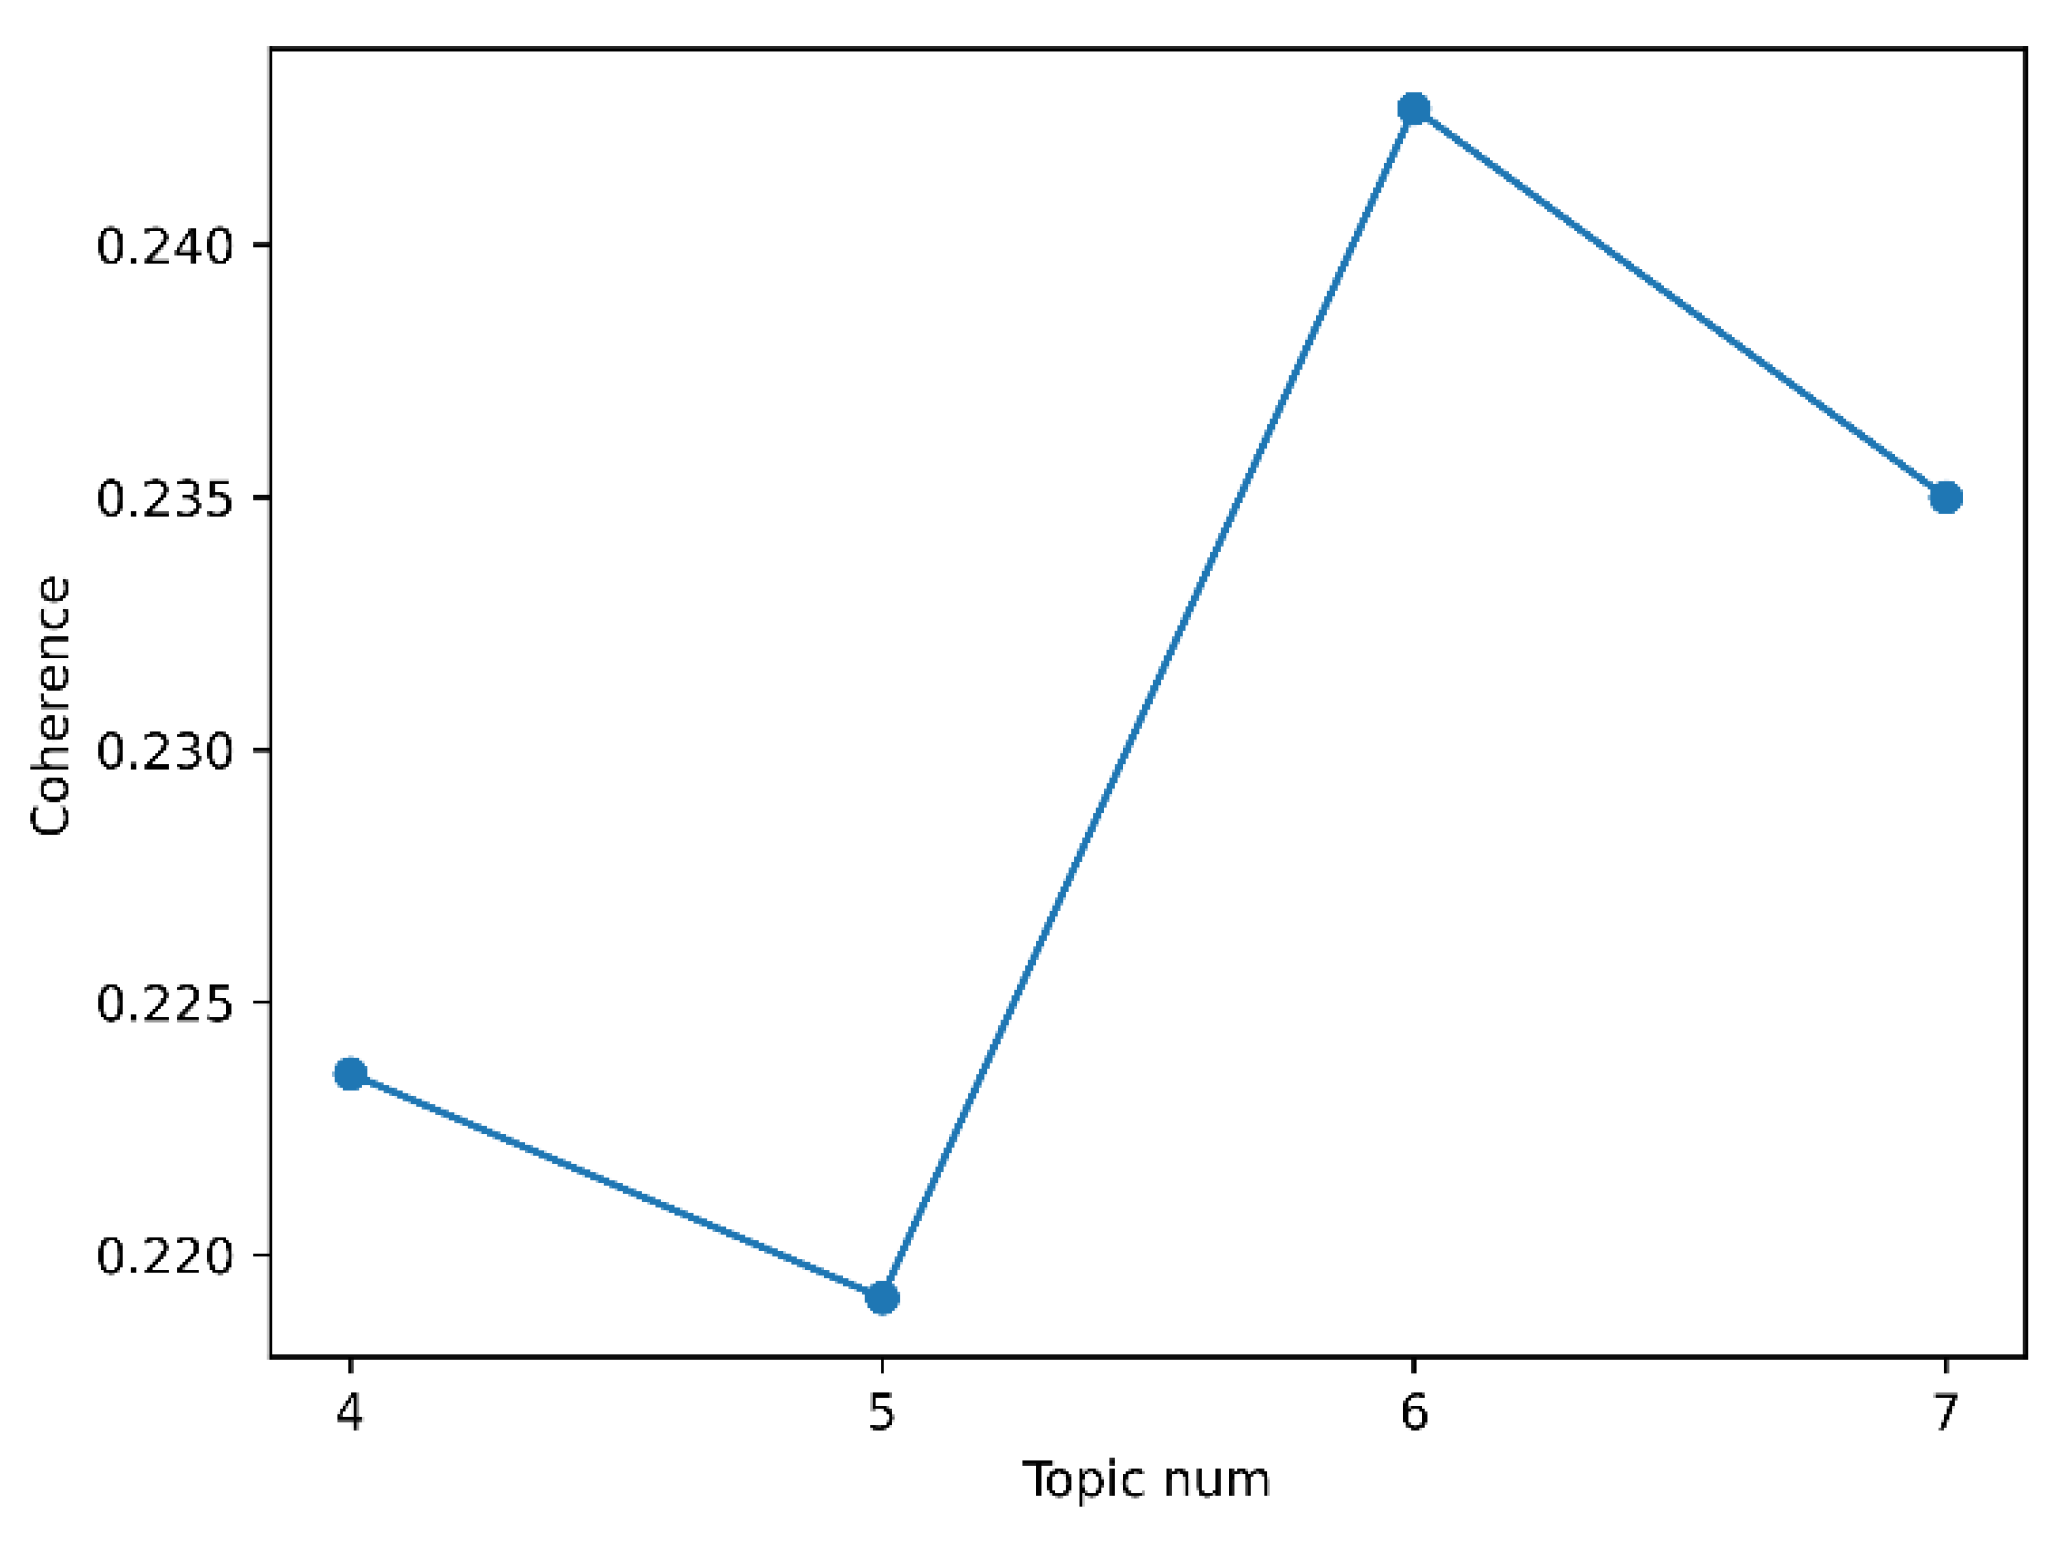
Figure 3.
Intertopic Distance Map.
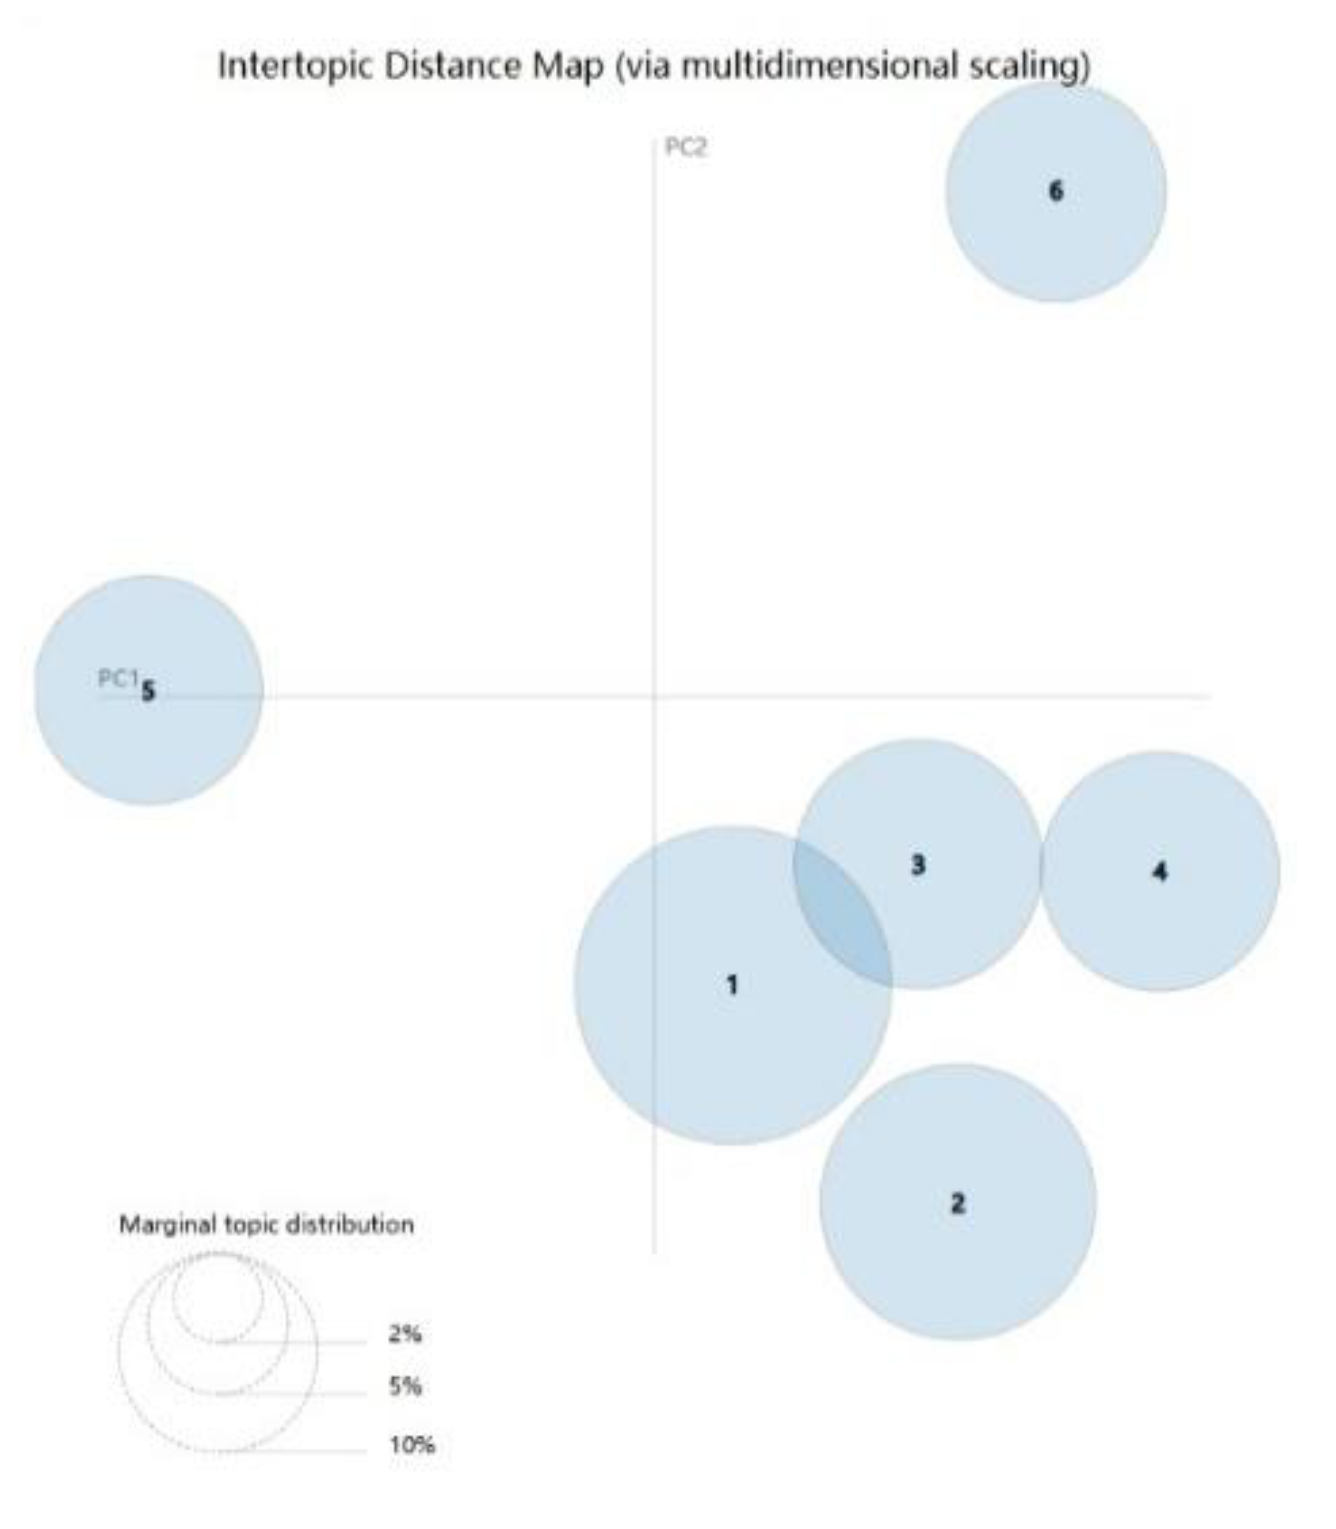
Figure 4.
Silhouette Score Plot.
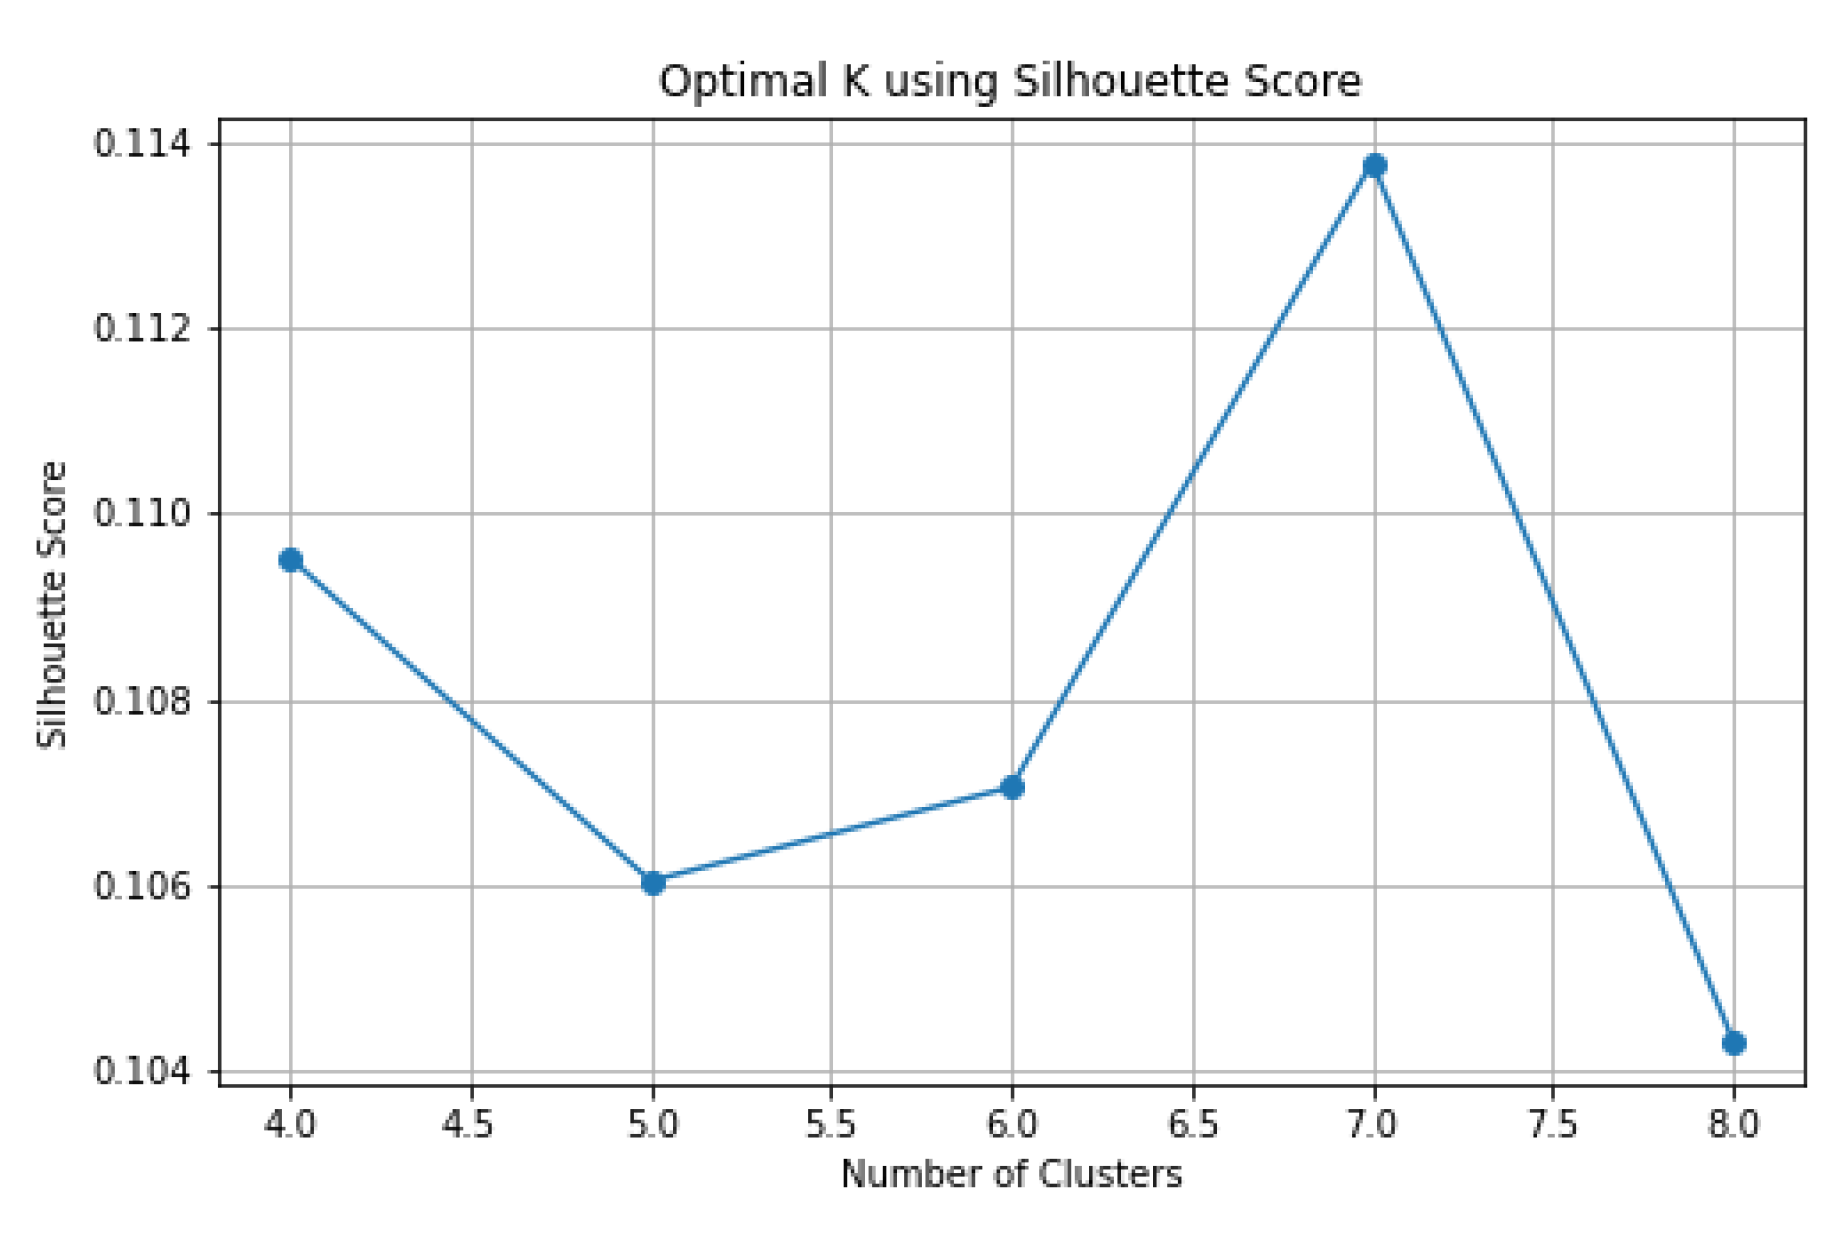
Figure 5.
Initial Missing Data Proportion.
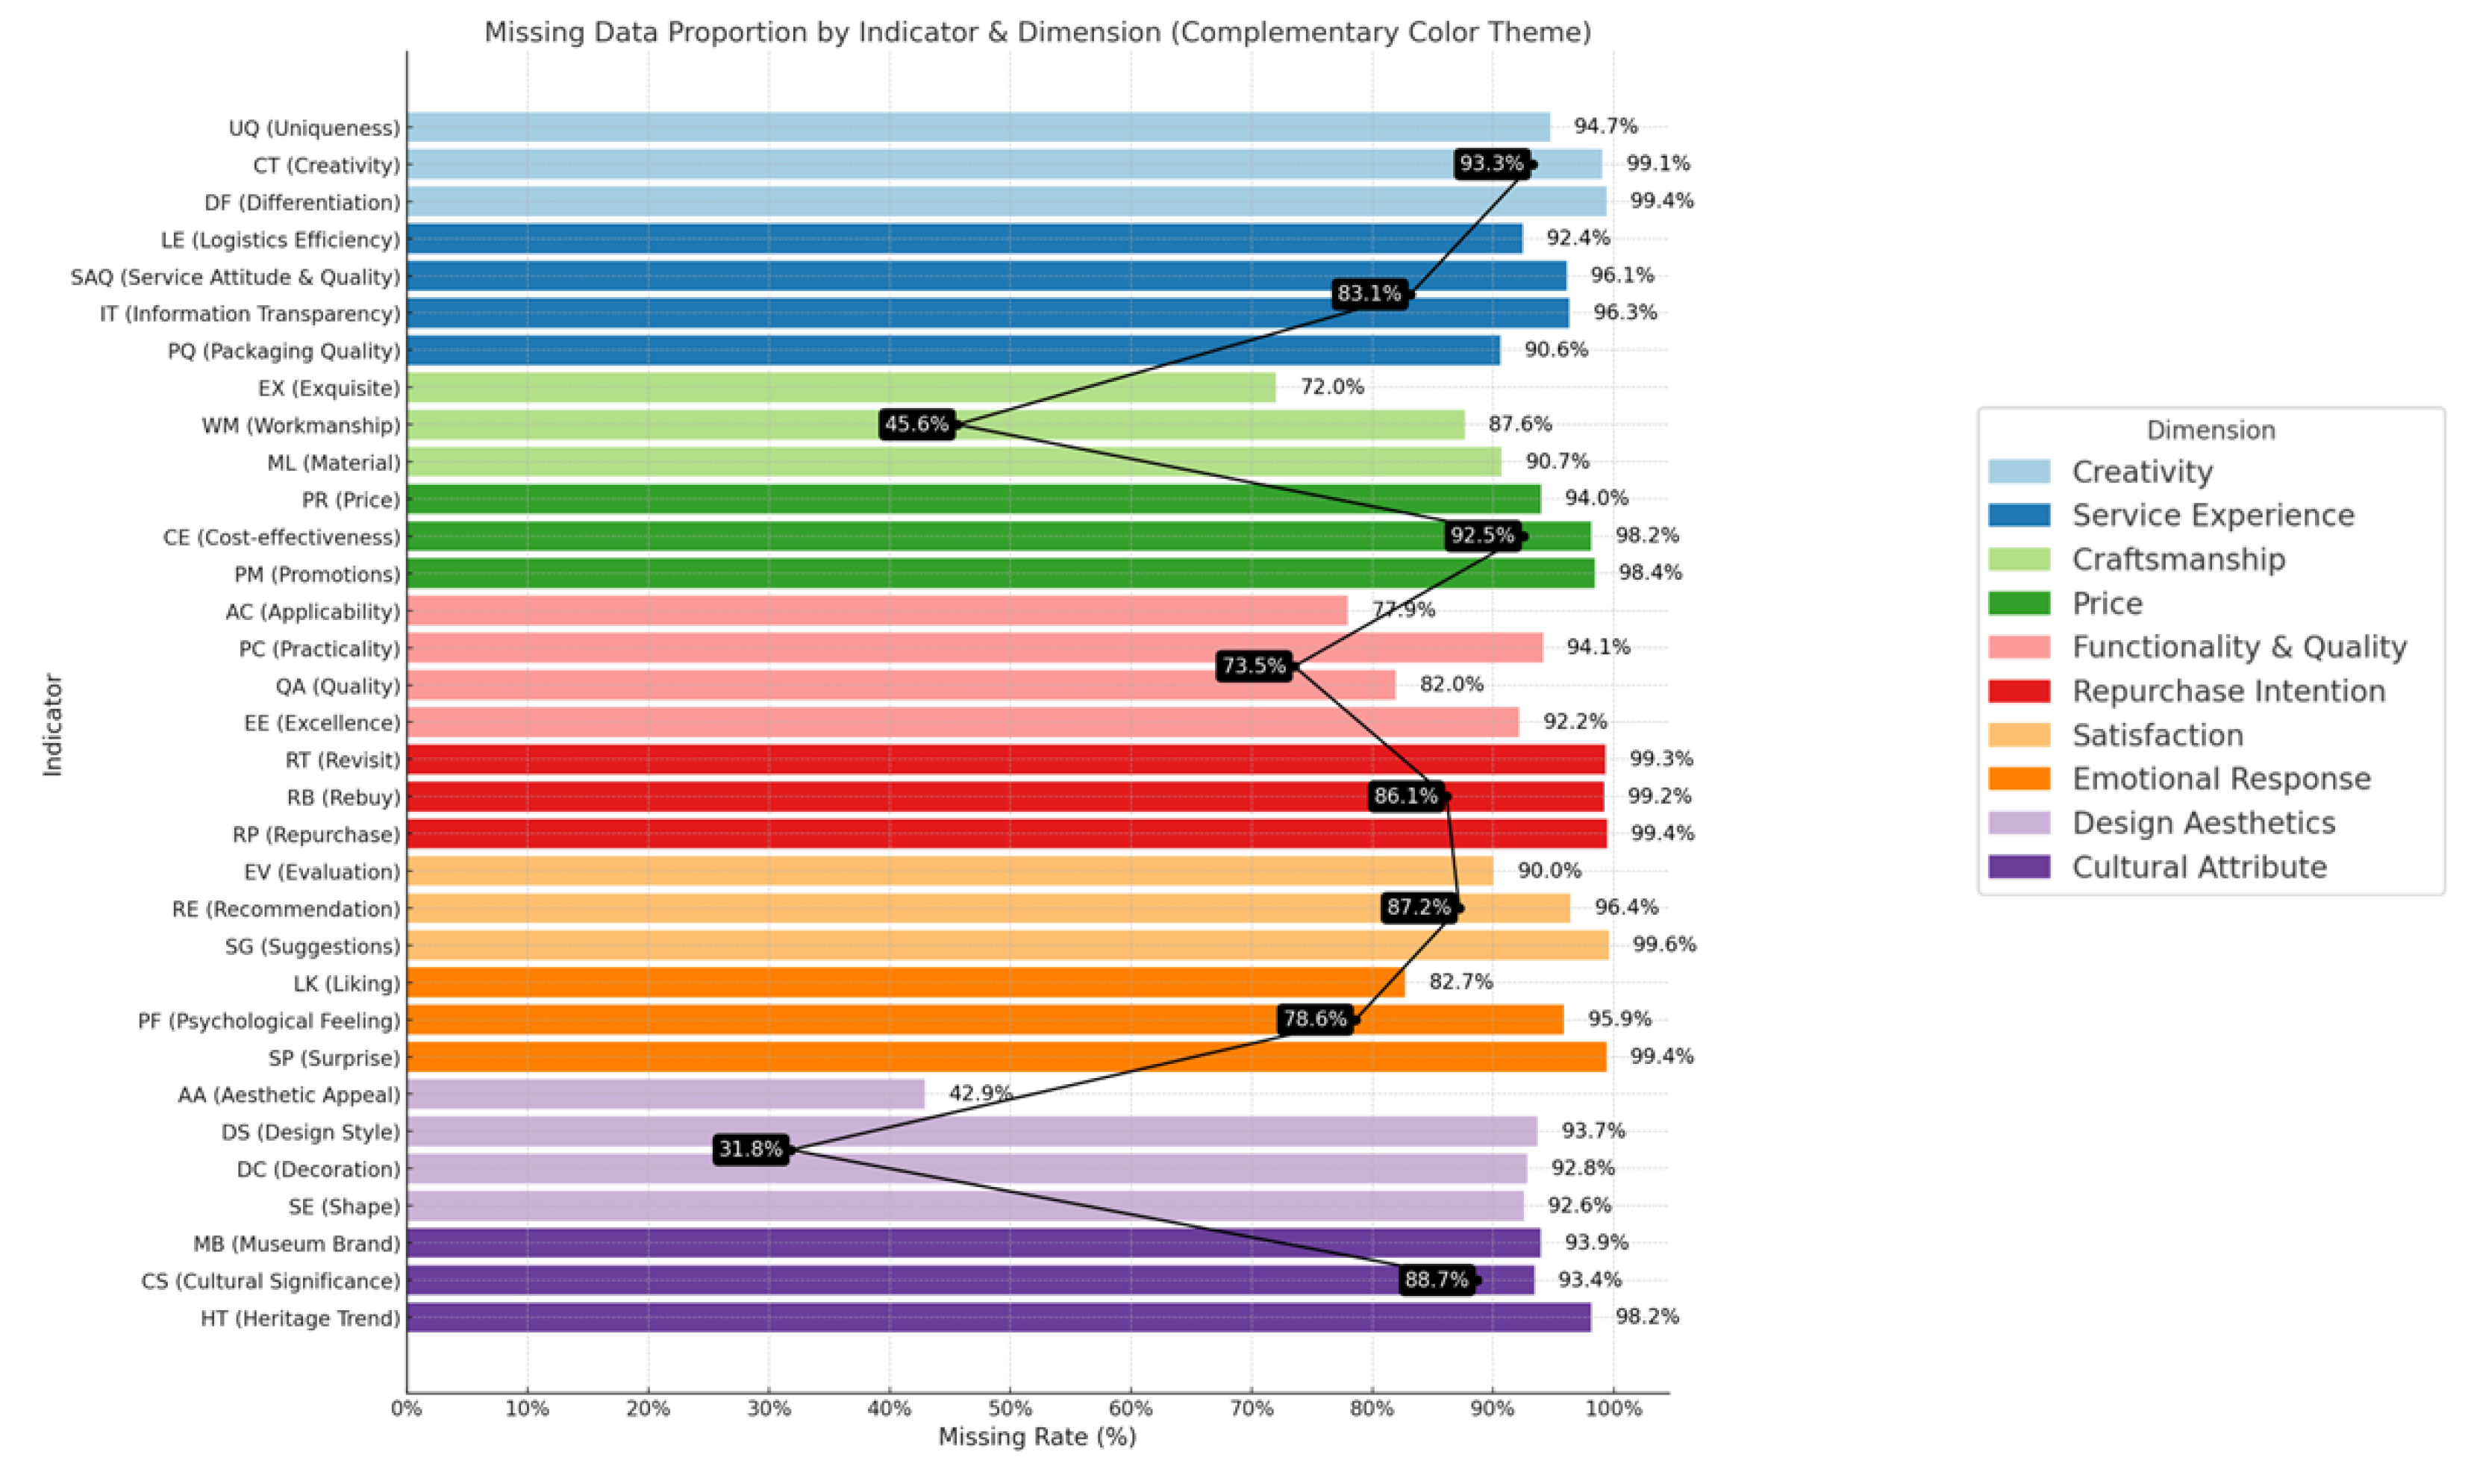
Figure 6.
Conceptual Model with Indicators.
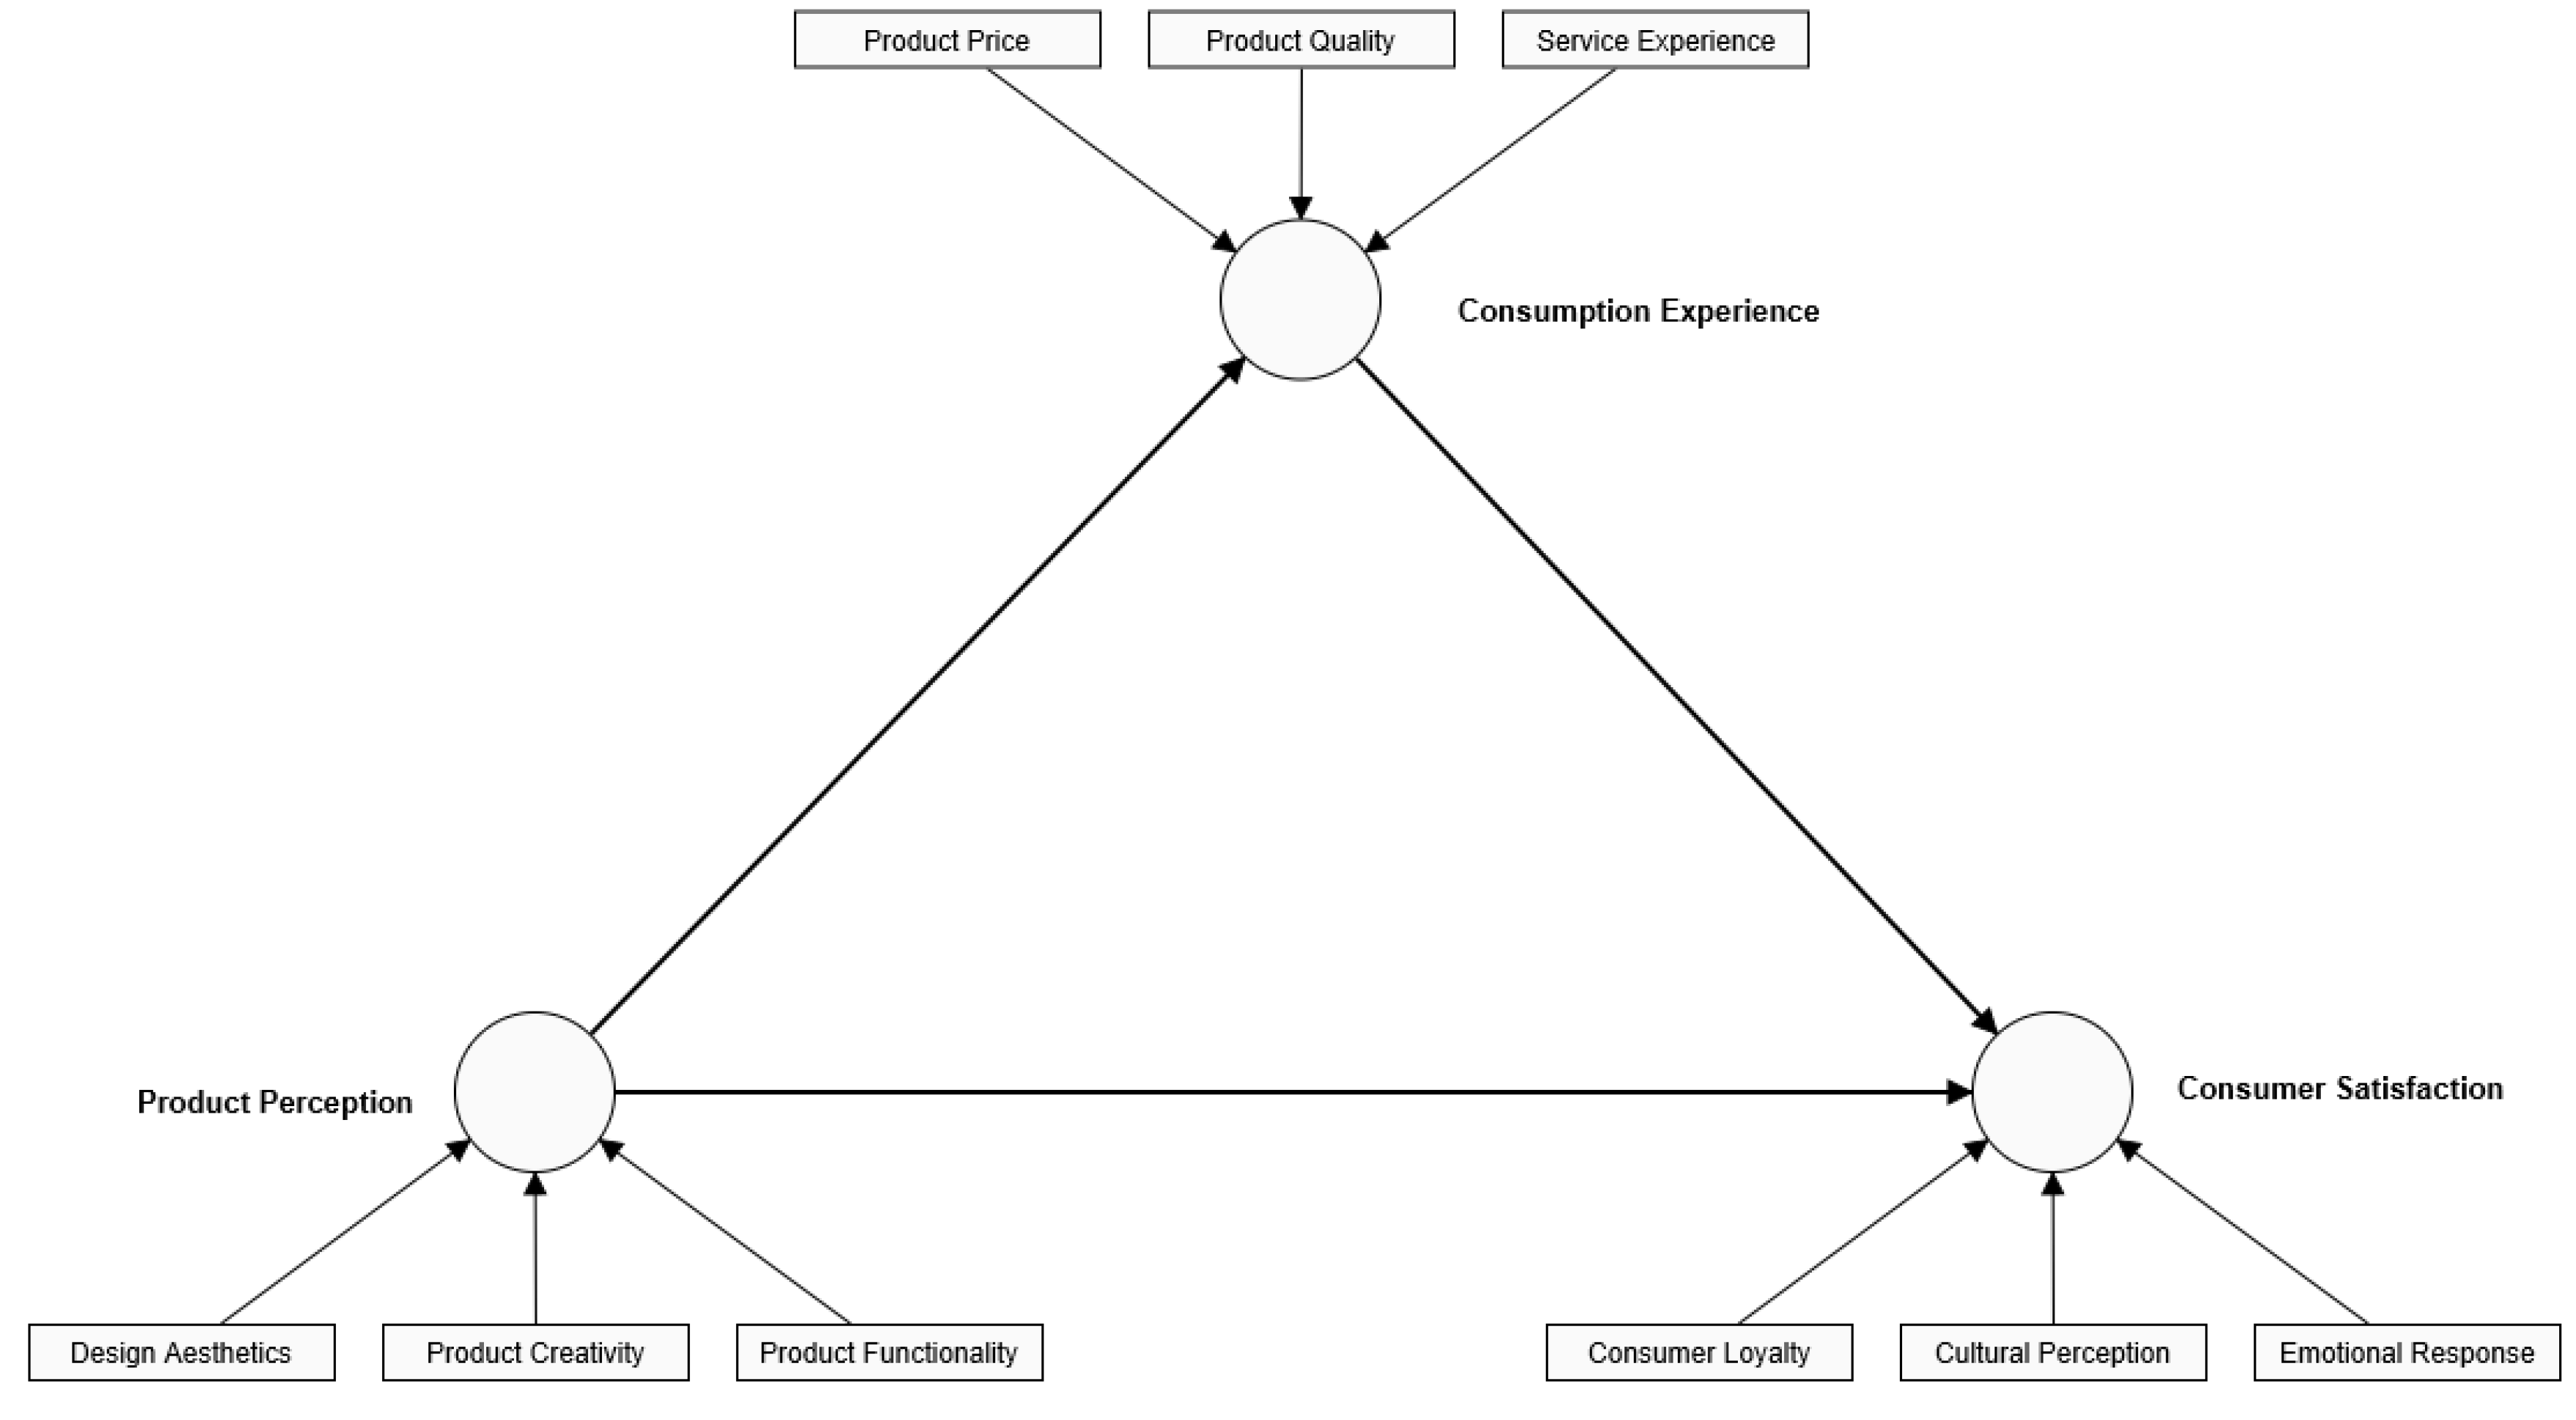
Figure 7.
Importance-Performance Map Analysis (IPMA).
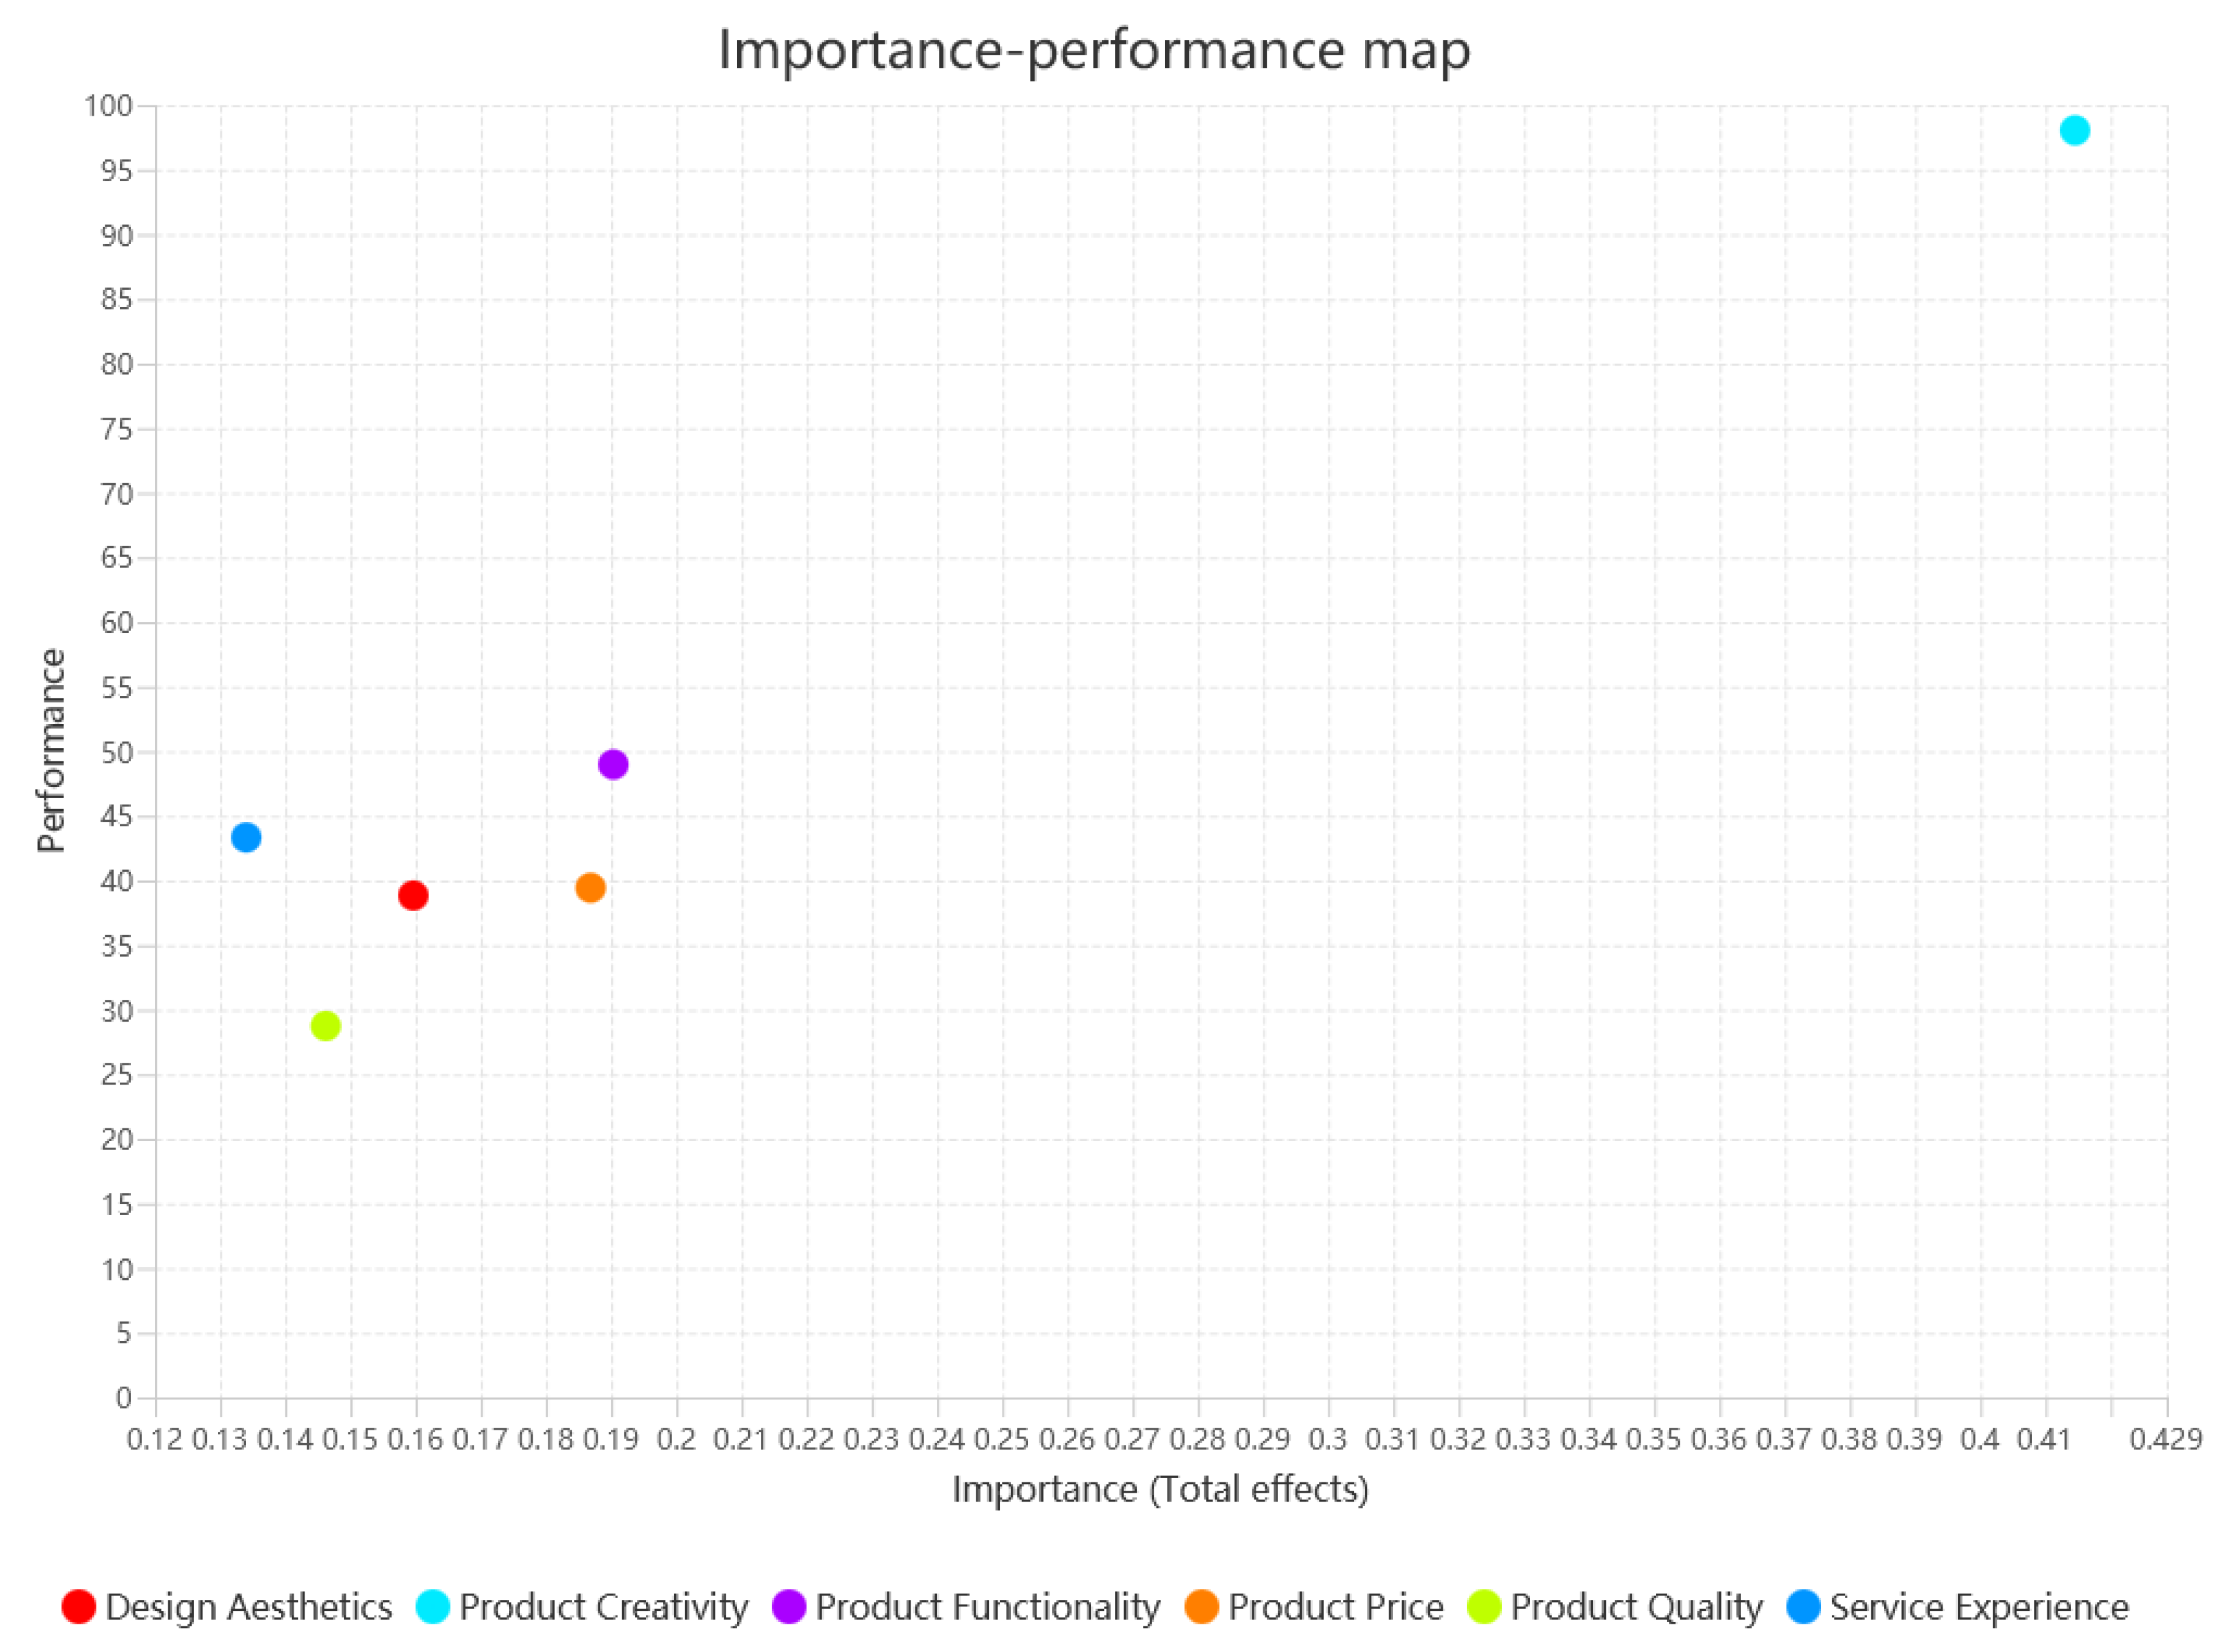
Figure 8.
PLS-SEM Structural Model Results.
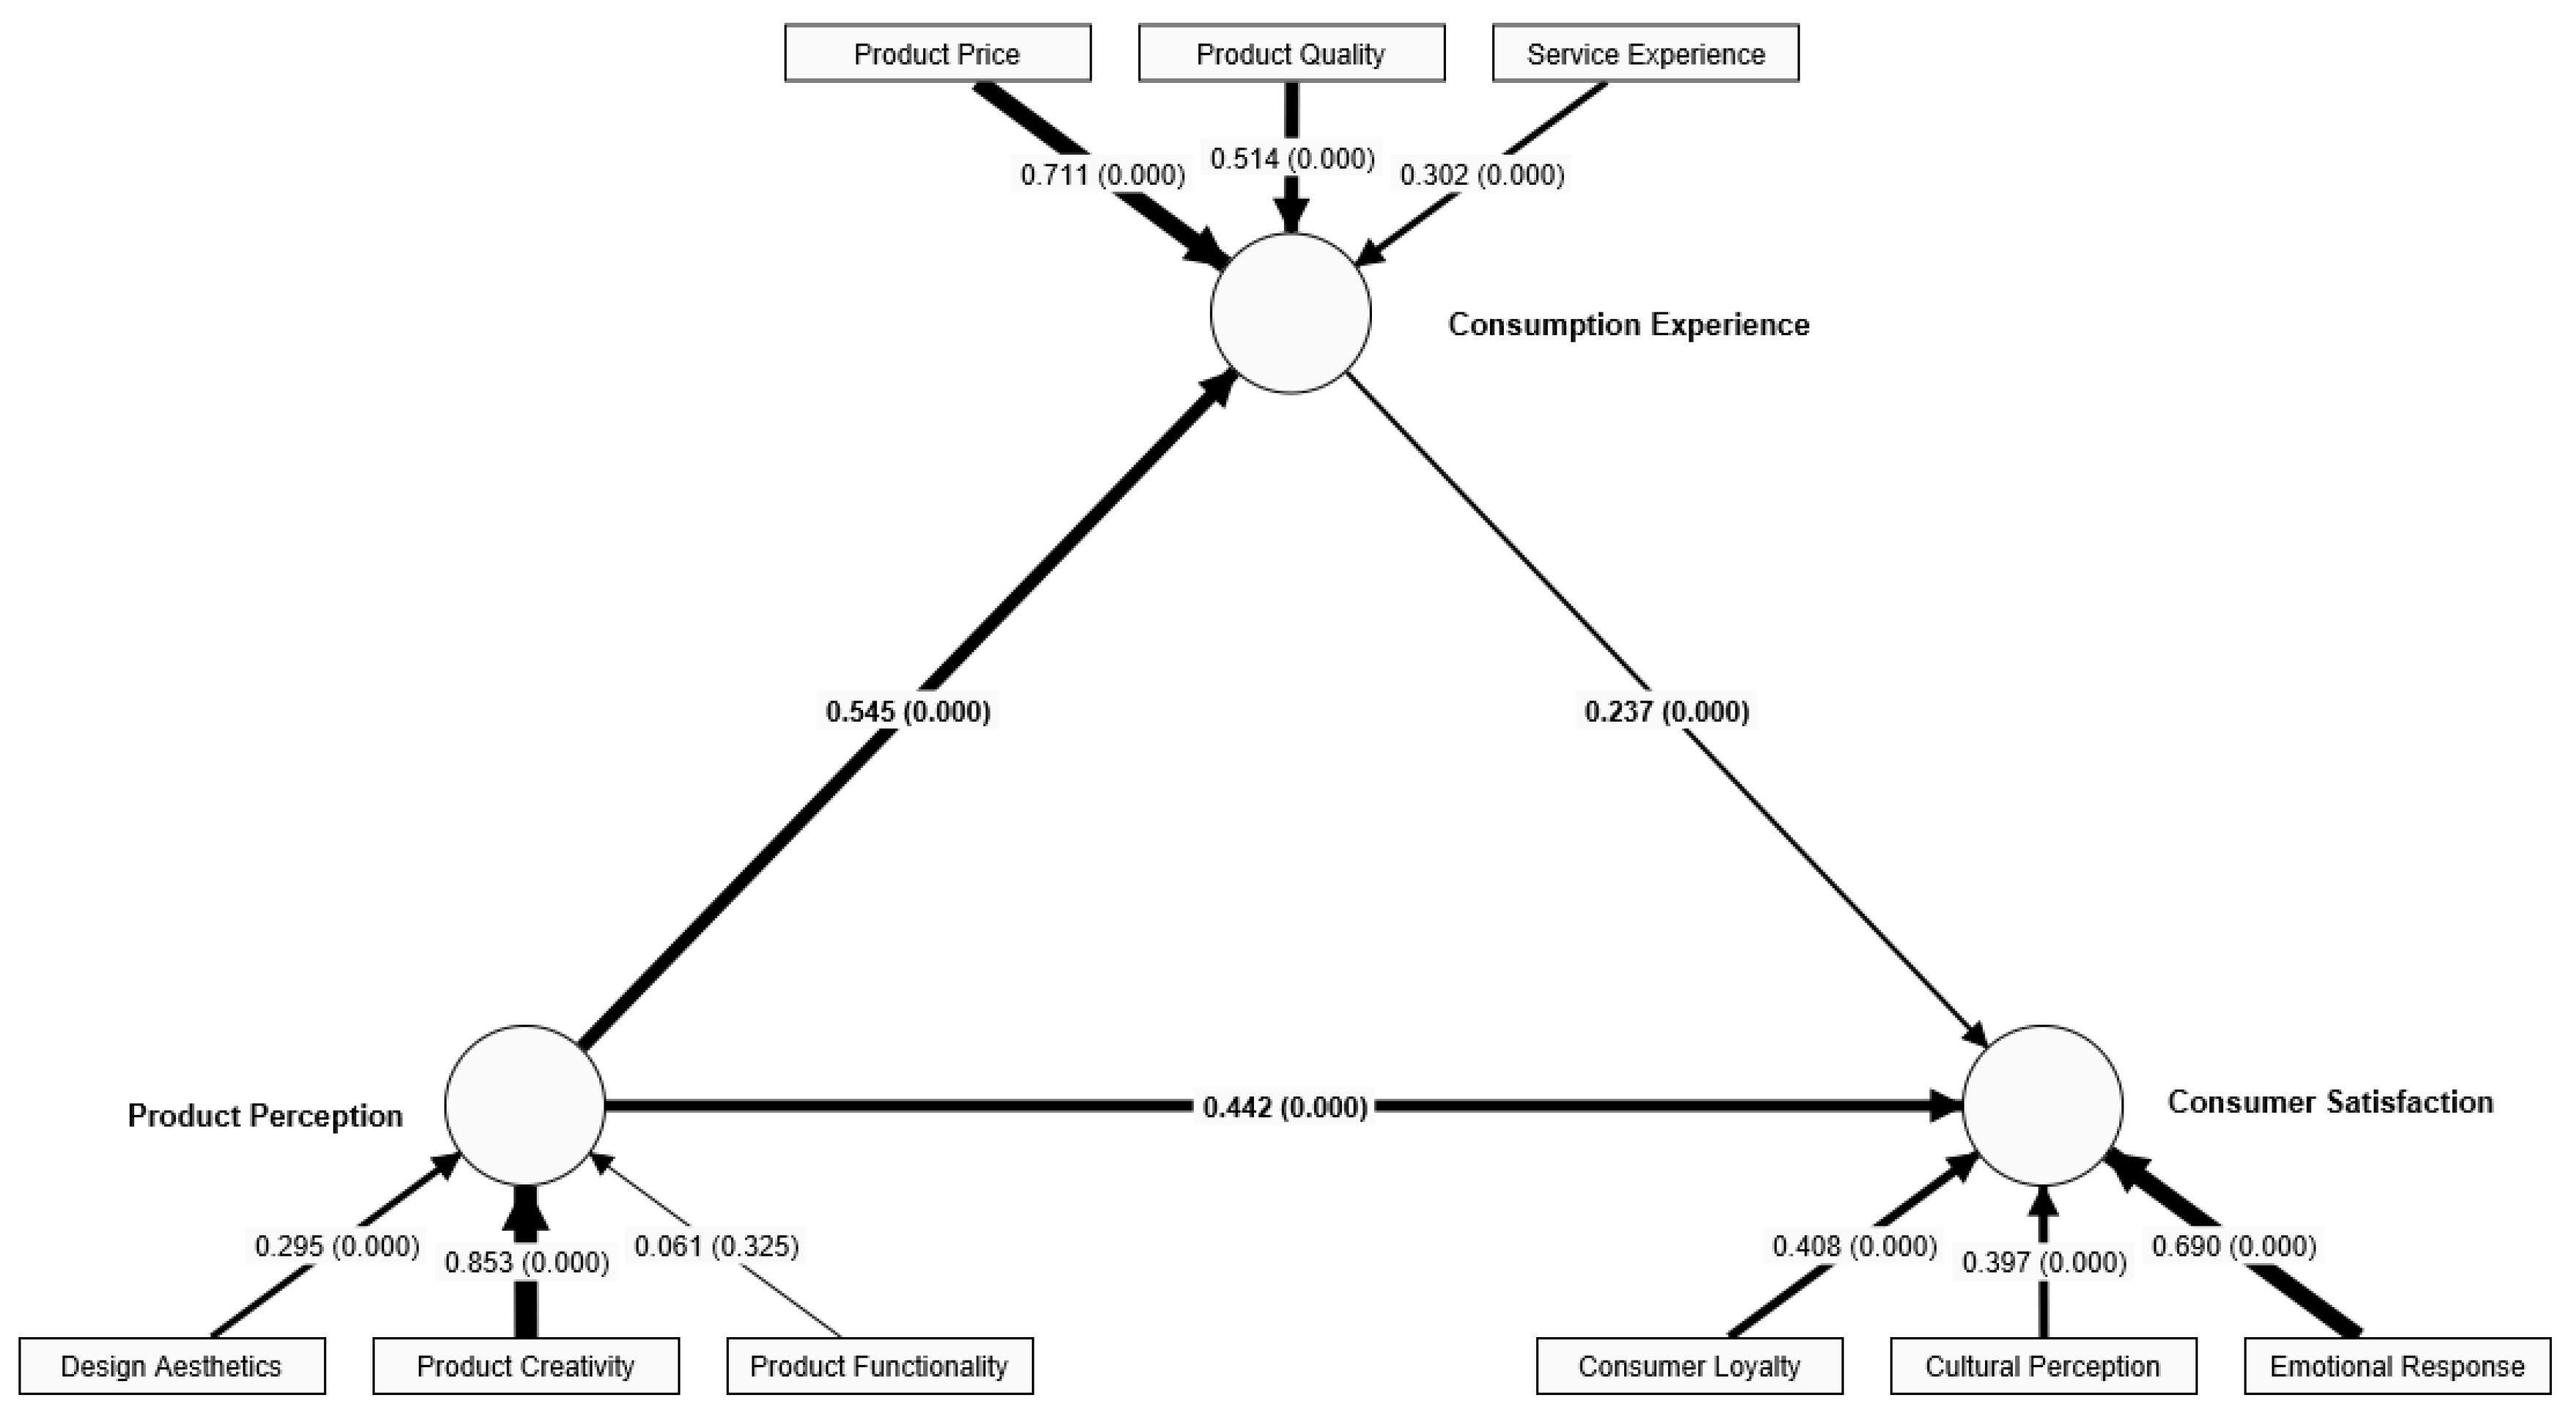
Table 1.
Hypotheses Proposal.
| Hypothesis | Statement |
|---|---|
| H1 | Product Perception significantly impacts the Consumption Experience. |
| H2 | Product Perception significantly impacts Consumer Satisfaction. |
| H3 | Consumption Experience significantly impacts Consumer Satisfaction. |
Table 2.
LDA-Extracted Topics and Top Keywords.
| Theme | Theme Name | Top Keywords (Weight) |
|---|---|---|
| T1 | Functionality & Quality | Fitting (0.321), Material (0.258), Appearance (0.237), Quality (0.181) |
| T2 | Craftsmanship & Price | Craftsmanship (0.767), Price (0.231) |
| T3 | Design Appeal | Design (0.577), Cute (0.415) |
| T4 | Cultural Perception | Palace Museum (0.995) |
| T5 | Emotional Responses | Favorable (0.997) |
| T6 | Aesthetic Impression | Beautiful (0.997) |
Table 3.
Comment Examples (Translated in English).
| Cluster | Comment Examples (Comment ID) |
|---|---|
| C0 | The quality is excellent, and it looks exquisite. (1156392000886) |
| C1 | The coaster is super beautiful. (1204232520633) |
| C2 | I gave it as a birthday gift to my friend, and she loves it. She said the koi fish enamel is very exquisite. (1167171355711) |
| C3 |
The product is just average. The lid tends to overflow when pouring water, as the seal is not good enough. Additionally, the quality of the tea towel is quite rough, which does not match its price. Poor practicality! Overall evaluation: It appears satisfactory, but it is not practical or cost-effective. I don’t recommend buying it! (1167171355711) Fast delivery, gorgeous packaging, no damage, and affordable price. The red envelope is finely crafted and designed scientifically, easily accommodating thousand-yuan bills. The hand-painted design is full of artistic charm, lively, cute, and attractive, with a beautiful meaning. It’s perfect for picky children. I will visit the Palace Museum Cultural Creativity store again if I need anything in the future. Royal products are indeed extraordinary (1198130901994). |
| C4 | It’s great, so beautiful, and the quality is excellent too! (1178527758948) |
| C5 | It’s so exquisite that I can’t bear to use it. (1171543545021) |
| C6 | It looks beautiful. (1154456901775, 1155440338386, ...) |
Table 4.
Cluster Keywords.
| Cluster | Keywords (DeepSeek R1) | Keywords (ChatGPT o3) | Keywords Integrated |
|---|---|---|---|
| C0 | Appearance, Quality | Appearance, Exquisite | Appearance, Quality, Exquisite |
| C1 | Appearance | Beautiful | Appearance, Beautiful |
| C2 | Gift Selection, Quality Feedback | Gift Giving, Exquisite | Gift, Quality Feedback |
| C3 | Design, Cost-Effectiveness | Product Packaging | Design, Cost-Effectiveness, Product Packaging |
| C4 | Quality, Exquisite | Quality, Appearance | Quality, Exquisite, Appearance |
| C5 | Exquisite, Craftsmanship | Exquisite, Craftsmanship | Exquisite, Craftsmanship |
| C6 | Beautiful | Beautiful | Beautiful |
Table 5.
Framework of Dimension and Indicator.
| Dimension | Description | Indicator | Remarks |
|---|---|---|---|
| Functionality & Quality | Practicality, durability, and overall product performance. | Fitting, Material, Quality, Gift | LDA+SVM and BERT+K-Means |
| Craftsmanship & Price | Quality of craftsmanship and its relationship to price. | Craftsmanship, Exquisite, Price, Cost-Effectiveness | LDA+SVM and BERT+K-Means |
| Design Appeal | Sense of Design and its styles. | Design, Cute | LDA+SVM and BERT+K-Means |
| Cultural Perception | Integration of cultural elements and historical relevance. | Palace Museum | LDA+SVM |
| Emotional Responses | Consumer emotional attachment and subjective appeal. | Favorable | LDA+SVM |
| Aesthetic Impression | Perceived visual appeal, artistic style, and uniqueness. | Beautiful, Appearance2 | LDA+SVM and BERT+K-Means |
| Packaging | Presentation, protective design, and product delivery. | Product Packaging | BERT+K-Means |
Table 6.
Mapping of High-Frequency Keywords to Dimensions.
| Dimension | Indicator | Metric |
|---|---|---|
| Creativity | Uniqueness (UQ) | (1) Special |
| Creativity (CT) | (2) Creativity | |
| Differentiation (DF) | (3) Distinctive Features | |
| Service Experience | Logistics Efficiency (LE) | (4) Logistics, (5) Delivery, (6) Speed, (7) Dispatch, (8) Arrival, (9) Courier, (10) Fast |
| Service Attitude & Quality (SAQ) | (11) Service Attitude, (12) Enthusiasm, (13) Attitude, (14) Service, (15) Reshipment, (16) Customer Service | |
| Information Transparency (IT) | (17) Seller, (18) Store, (19) Merchant, (20) Trust, (21) Experience, (22) Consistency, (23) Minimal Differences | |
| Packaging Quality (PQ) | (24) Packaging, (25) Outer Packaging, (26) Gift Bag, (27) Packaging Box | |
| Craftsmanship | Exquisite (EX) | (28) Delicate, (29) Exquisite, (30) Fine, (31) Elegant, (32) Premium, (33) Refined, (34) Detail |
| Workmanship (WM) | (35) Workmanship, (36) Craft | |
| Material (ML) | (37) Texture, (38) Material, (39) Feel, (40) Composition | |
| Price | Price (PR) | (41) Price, (42) Cost, (43) Cheap, (44) Affordable, (45) Budget-friendly, (46) Worthwhile, (47) Slightly Expensive |
| Cost-effectiveness (CE) | (48) Cost-effectiveness, (49) Not Worth It | |
| Promotions (PM) | (50) Promotions, (51) Double Eleven, (52) Discounts | |
| Functionality & Quality | Applicability (AC) | (53) Friends, (54) Clients, (55) Gifting, (56) Present, (57) Given to, (58) Birthday Gift, (59) Gift, (60) Girlfriend, (61) Close Friend, (62) Child, (63) Colleague, (64) Thoughtful Gift, (65) Teacher, (66) Suitable, (67) Wedding, (68) Collection, (69) Personal Use, (70) Appropriate, (71) Size, (72) Scales |
| Practicality (PC) | (73) Practical, (74) Usability, (75) Necklace, (76) Tea Set, (77) Ornament, (78) Function | |
| Quality (QA) | (79) Quality, (80) Product Quality, (81) Defects, (82) Damage, (83) Fading, (84) Breakage | |
| Excellence (EE) | (85) Durability, (86) Defects, (87) Roughness, (88) Color Difference, (89) Sturdiness, (90) Elegant, (91) Luxurious, (92) High-end, (93) Premium, (94) Superior, (95) Weight, (96) Premium, (97) Effect | |
| Consumer Loyalty | Revisit (RT) | (98) Next Time |
| Rebuy (RB) | (99) Will Buy Again | |
| Repurchase (RP) | (100) Repurchase | |
| Evaluation (EV) | (101) Five-star, (102) Perfect, (103) Excellent, (104) Like, (105) Fantastic, (106) Expected, (107) Superb, (108) Satisfied, (109) Positive Review, (110) Not Bad, (111) Acceptable | |
| Recommendation (RE) | (112) Worth Buying, (113) Recommended | |
| Suggestions (SG) | (114) Improvement | |
| Emotional Response | Liking (LK) | (115) Love It, (116) Truly Like, (117) Like |
| Psychological Feeling (PF) | (118) Feeling, (119) Happy, (120) Disappointed | |
| Surprise (SP) | (121) Surprise | |
| Design Aesthetics | Aesthetic Appeal (AA) | (122) Beautiful, (123) Pretty, (124) Very Pretty, (125) Good-looking, (126) Aesthetic, (127) Looks Nice |
| Design Style (DS) | (128) Cute, (129) Design | |
| Decoration (DC) | (130) Pattern, (131) Color, (132) Gold, (133) Blue, (134) Red, (135) Motif | |
| Shape (SE) | (136) Appearance, (137) Shape, (138) Form, (139) Style, (140) Look | |
| Cultural Perception | Museum Brand (MB) | (141) Palace Museum, (142) The Forbidden City |
| Cultural Significance (CS) | (143) Meaning, (144) Cultural Heritage, (145) Implication, (146) China, (147) Culture, (148) Festive, (149) Beautiful, (150) New Year, (151) Auspicious | |
| Heritage Trend (HT) | (152) Cultural Creative Product |
Table 7.
Distribution of Sentiment Scores.
| Sentiment Category | SPSSAU Classification (%) | Alibaba Cloud Classification (%) |
|---|---|---|
| Positive (7) | 2321 (67.98%) | 3106 (90.98%) |
| Slightly Positive (5) | 1028 (30.11%) | / |
| Slightly Negative (3) | 52 (15.23%) | / |
| Negative (1) | 13 (0.38%) | 217 (6.36%) |
| Neutral | / | 64 (1.87%) |
| Error | / | 27 (0.79%) |
Table 8.
Sample Sentiment Score Matrix.
| Comment | UQ | … | LE | … | EX | … | AC | … | LK | … | CS | HT |
|---|---|---|---|---|---|---|---|---|---|---|---|---|
| This product was bought as a gift for my classmate, but the delivery service was bad. He says it’s not that exquisite. Additionally, he thinks creativity is only average. However, he truly loves this type of creative cultural product that promotes Chinese culture. | 4 | … | 1 | … | 5 | … | 7 | … | / | … | 7 | 7 |
| The product is very exquisite. | / | … | / | … | 7 | … | / | … | / | … | / | / |
| This cup is not suitable as a gift. It just looks good. I don’t like it at all. The only reason I’m not returning it is its high cultural significance. | / | … | / | … | / | … | 1 | … | 1 | … | 7 | / |
Note:(1) These sentences are fiction and composed by the author. They are intended to demonstrate the rating logic and present the sentiment score matrix structure. (2) A slash (/) indicates that a particular review did not mention a given MCCP dimension, meaning no sentiment score was assigned to that category. (3) UQ= Uniqueness, LE=Logistics Efficiency, EX= Exquisite, AC=Applicability, LK=Liking, CS= Cultural Significance, HT= Heritage Trend (The list of full names and their abbreviations can be found in Table 6.).
Table 9.
MCCP Perception Measurement Model.
| Latent Construct | Dimension | Indicators |
|---|---|---|
| Product Perception | Design Aesthetics | Aesthetic Appeal (AA), Design Style (DS), Decoration (DC), Shape (SE) |
| Product Creativity | Uniqueness (UQ), Creativity (CT), Differentiation (DF) | |
| Product Functionality | Applicability (AC), Practicality (PC) | |
| Consumption Experience | Product Price | Price (PR), Cost-effectiveness (CE), Promotions (PM) |
| Service Experience | Logistics Efficiency (LE), Service Attitude & Quality (SAQ), Information Transparency (IT), Packaging Quality (PQ) | |
| Product Quality | Exquisite (EX), Workmanship (WM), Material (ML), Quality (QA), Excellence (EE) | |
| Consumer Satisfaction | Consumer Loyalty | Revisit (RT), Rebuy (RB), Repurchase (RP), Evaluation (EV), Recommendation (RE), Suggestions (SG) |
| Emotional Response | Liking (LK), Psychological Feeling (PF), Surprise (SP) | |
| Cultural Perception | Museum Brand (MB), Cultural Significance (CS), Heritage Trend (HT) |
Note: Craftsmanship was moved to Quality as per expert advice, as consumer reviews frequently linked craftsmanship with quality rather than functionality.
Table 10.
Descriptive Statistics.
| Variable | Sample Size | Min | Max | Mean | Std. Dev | Median |
|---|---|---|---|---|---|---|
| Product Creativity | 523 | 1.000 | 2.333 | 2.293 | 0.190 | 2.333 |
| Design Aesthetics | 523 | 1.000 | 5.250 | 2.120 | 0.768 | 1.750 |
| Product Functionality | 523 | 1.000 | 7.000 | 3.632 | 0.882 | 3.500 |
| Service Experience | 523 | 1.000 | 7.000 | 2.998 | 1.504 | 2.800 |
| Product Quality | 523 | 1.000 | 7.000 | 2.115 | 1.048 | 1.400 |
| Product Price | 523 | 1.000 | 7.000 | 2.961 | 0.870 | 2.800 |
| Consumer Loyalty | 523 | 1.000 | 4.667 | 1.402 | 0.457 | 1.167 |
| Emotional Response | 523 | 1.000 | 4.667 | 2.403 | 0.516 | 2.333 |
| Cultural Perception | 523 | 1.000 | 7.000 | 3.072 | 0.957 | 2.800 |
Table 11.
Data Reliability of Variables.
| Variable | Item-deleted McDonald’s Omega | McDonald’s Omega |
|---|---|---|
| Product Creativity | 0.755 | 0.794 |
| Design Aesthetics | 0.788 | |
| Product Functionality | 0.776 | |
| Service Experience | 0.793 | |
| Product Quality | 0.795 | |
| Product Price | 0.778 | |
| Consumer Loyalty | 0.794 | |
| Emotional Response | 0.776 | |
| Cultural Perception | 0.791 |
Table 12.
Data Reliability of Latent Construct.
| Latent Construct | McDonald’s Omega |
|---|---|
| Consumption Experience | 0.629 |
| Product Perception | 0.786 |
| Satisfaction | 0.675 |
Table 13.
Outer Weights of Indicator.
| Latent Construct | Indicator | Outer weight | p-value |
|---|---|---|---|
| Consumer Satisfaction | Consumer Loyalty | 0.408 | 0.000 |
| Cultural Perception | 0.397 | 0.000 | |
| Emotional Response | 0.690 | 0.000 | |
| Product Perception | Design Aesthetics | 0.295 | 0.000 |
| Product Functionality | 0.061 | 0.325 | |
| Product Creativity | 0.853 | 0.000 | |
| Consumption Experience | Product Price | 0.711 | 0.000 |
| Product Quality | 0.514 | 0.000 | |
| Service Experience | 0.302 | 0.000 |
Table 14.
Path Coefficients and Statistical Significance.
| Path | Coefficient (β) | t-value | p-value |
|---|---|---|---|
| Consumption Experience→Consumer Satisfaction | 0.237 | 3.797 | 0.000 |
| Product Perception→Consumption Experience | 0.545 | 14.153 | 0.000 |
| Product Perception→Consumer Satisfaction | 0.442 | 7.324 | 0.000 |
Table 16.
Variance Inflation Factor (VIF) Values.
| Indicator | VIF |
|---|---|
| Consumer Loyalty | 1.013 |
| Cultural Perception | 1.055 |
| Emotional Response | 1.068 |
| Product Design | 1.069 |
| Product Functionality | 1.409 |
| Product Creativity | 1.433 |
| Product Price | 1.076 |
| Product Quality | 1.001 |
| Service Experience | 1.075 |
Table 17.
Cross-Validated Communality Q² Values.
| Indicator | Q² (Cross-Validated Communality) | Interpretation |
|---|---|---|
| Consumer Loyalty | -0.120 | No predictive relevance |
| Cultural Perception | -0.047 | No predictive relevance |
| Emotional Response | -0.022 | No predictive relevance |
| Product Design | -0.005 | No predictive relevance |
| Product Creativity | 0.046 | Weak predictive relevance |
| Product Price | -0.100 | No predictive relevance |
| Product Quality | -0.212 | No predictive relevance |
| Service Experience | -0.015 | No predictive relevance |
Table 18.
Hypotheses Decision.
| Hypothesis | Statement | Decision |
|---|---|---|
| H1 | Product Perception significantly impacts the Consumption Experience. | Accept |
| H2 | Product Perception significantly impacts Consumer Satisfaction. | Accept |
| H3 | Consumption Experience significantly impacts Consumer Satisfaction. | Accept |
Disclaimer/Publisher’s Note: The statements, opinions and data contained in all publications are solely those of the individual author(s) and contributor(s) and not of MDPI and/or the editor(s). MDPI and/or the editor(s) disclaim responsibility for any injury to people or property resulting from any ideas, methods, instructions or products referred to in the content. |
© 2025 by the authors. Licensee MDPI, Basel, Switzerland. This article is an open access article distributed under the terms and conditions of the Creative Commons Attribution (CC BY) license (http://creativecommons.org/licenses/by/4.0/).
Copyright: This open access article is published under a Creative Commons CC BY 4.0 license, which permit the free download, distribution, and reuse, provided that the author and preprint are cited in any reuse.