
Submitted:
23 June 2025
Posted:
25 June 2025
You are already at the latest version
Abstract
Hybrid ocean energy systems that combine wave and current energy sources offer im-proved reliability over standalone devices yet remain technically underexplored. This study presents the design, fabrication, and performance assessment of a small-scale (50–100 W) hybrid ocean energy system that captures energy from wave-induced heave mo-tion using a point-absorber buoy and from ocean currents via a vertical-axis water turbine (VAWT). A key innovation is a custom-built dual-input electromagnetic generator that ac-cepts independent mechanical input from both subsystems without requiring complex mechanical coupling. Numerical simulations using ANSYS AQWA and QBLADE guided the design optimization of the buoy and turbine, respectively. Wave resource assessment for the Khobar coastline, Saudi Arabia, was conducted using both historical data and field measurements. The prototype was fabricated using locally available off-the-shelf and 3D-printed components and tested in both laboratory and outdoor conditions. Results demonstrated stable energy output and system functionality under combined wave-current conditions. This work provides a validated pathway for low-cost, compact, and modular hybrid ocean energy systems suited for remote coastal applications or dis-tributed marine sensing platforms.
Keywords:
wave energy
; resource assessment
; heave buoy
; current turbine
; hybrid ocean energy
; numerical simulation
1. Introduction
Energy is crucial for driving industrial growth, societal development, and technological progress. With the rising use of finite reserve fossil fuels and the escalating pressure of global warming and climate change, the demand for clean renewable energy is increasing. Since the ocean covers 71% of the earth’s surface, water-based energy generation is considered a promising solution for sustainable energy production. However, ocean energy harvesting technology remains less mature than solar and wind energy due to a range of technical and economic challenges.
Among the various methods of water-based energy production, conventional hydropower is the most established, utilizing the gravitational force of flowing or falling water to generate electricity through dams and turbines. Wave energy captures energy from surface water movement caused by wind, converting it into electricity using devices such as oscillating water columns, overtopping structures, oscillating surge converters and point absorbers. Tidal energy is harnessed through tidal stream generators that extract kinetic energy from moving water or tidal barrages that exploit potential energy from differences in water levels. Similarly, ocean current energy utilizes the kinetic energy of marine currents through underwater turbines.
In this study, a novel hybrid ocean energy system is developed to capture energy from both ocean waves and currents simultaneously. The system employs a heaving buoy to collect wave energy and a vertical axis water turbine to capture current energy. To enhance efficiency, mechanical devices such as slotted-links and bevel gears are incorporated to convert and combine the heaving motion of the buoy and the turbine’s rotation via a dual-input hybrid generator for electricity generation.
Section 2 reviews existing technologies for extracting wave and current energy in standalone and hybrid forms. Section 3 presents the wave energy resource assessment conducted for selected locations along the Khobar coastline in Saudi Arabia. Section 4 details the design and methodology of the developed hybrid system. Prototype development and testing are discussed in Section 5 and Section 6, respectively. Finally, Section 7 summarizes key findings and outlines future research directions.
2. Literature Review
Hybrid marine energy systems have emerged as a response to the limitations of standalone wave and current energy devices. This section reviews the motivation for hybridization, the fundamental operating principles of wave and current systems, prior developments in standalone and hybrid devices, and key challenges that inform the present work.
2.1. Motivation for Hybrid Ocean Energy Systems
While ocean energy offers vast untapped potential, its exploitation is constrained by the variability of individual sources such as waves or tides. Wave energy converters (WECs) often experience reduced performance during calm sea states or seasonal lulls [1], while tidal and current energy systems, although more predictable, are limited to specific geographic regions.
To address these shortcomings, researchers have explored hybrid systems that combine multiple marine resources to increase energy availability and reliability. Prior work in this area includes multi-source platforms such as solar–wave [2], wind–solar [3], and wind–tidal [4] systems. However, comparatively few studies have focused on integrating wave and current energy into a single, compact system [5]. This gap underscores the need for practical hybrid solutions that are mechanically simple, efficient, and adaptable to varied marine conditions.
The present study addresses this challenge by proposing a hybrid system that combines a heaving buoy and a vertical-axis current turbine, linked through a dual-input power take-off mechanism capable of capturing energy from both modes without complex coupling systems.
2.2. Principles of Wave and Current Energy Conversion
Wave energy is derived from the vertical displacement of water surfaces caused by wind. WECs generally fall into three categories: oscillating water columns, overtopping devices, and oscillating body devices such as point absorbers and attenuators [6]. Oscillating water columns drive air turbines via pressure fluctuations, while overtopping devices store water and convert potential energy using turbines. Oscillating body devices extract energy from heaving or pitching motions using mechanical PTO systems [7].
Tidal energy arises from gravitational interactions between the Earth, moon, and sun, and can be harnessed through barrages or tidal stream turbines. Tidal barrages function similarly to hydroelectric dams but operate bidirectionally due to the nature of tidal flow [8]. Tidal stream or current turbines extract kinetic energy from moving water via rotors, gearboxes, and generators. In their simplest form, such systems comprise a rotor connected to a gearbox and a generator, with electricity transmitted to shore via subsea cables [9].
Ocean current energy systems operate similarly to tidal stream devices but target more stable and continuous flows. Vertical-axis turbine designs are particularly advantageous in such contexts due to their ability to handle omnidirectional currents without active yaw mechanisms.
2.3. Review of Standalone Wave and Current Energy Devices
Numerous standalone WEC prototypes have been developed to harness heave motion. Youssef et al. [10] designed a rack-and-pinion buoy system that successfully lit a 3-W lamp in shallow water. Binh et al. [11] developed a bidirectional gearbox system, while Chandrasekaran et al. [12] introduced a deep-sea variant with lever-arm transmission. Wang et al. [13] optimized a buoy for the Penghu Sea using a damping skirt, and later proposed a magnetic lead screw (MLS)-based system for improved efficiency and reduced friction losses [14].
Other notable works include Zhang et al. [15], who introduced a buoy with turbofan blades and damping plates; Shi et al. [16], who used a mass-adjustable buoy for wave resonance tuning; and Sakr et al. [17], who employed a stiffness controller with continuously variable transmission (CVT) for adaptive frequency response. Zheng et al. [18] used a nonlinear spring PTO to expand the WEC’s operating bandwidth, while Rava et al. [19] implemented a tethered cable drum system. Vijayasankar et al. [20] added a mass plate to enhance the natural frequency of a compact point absorber.
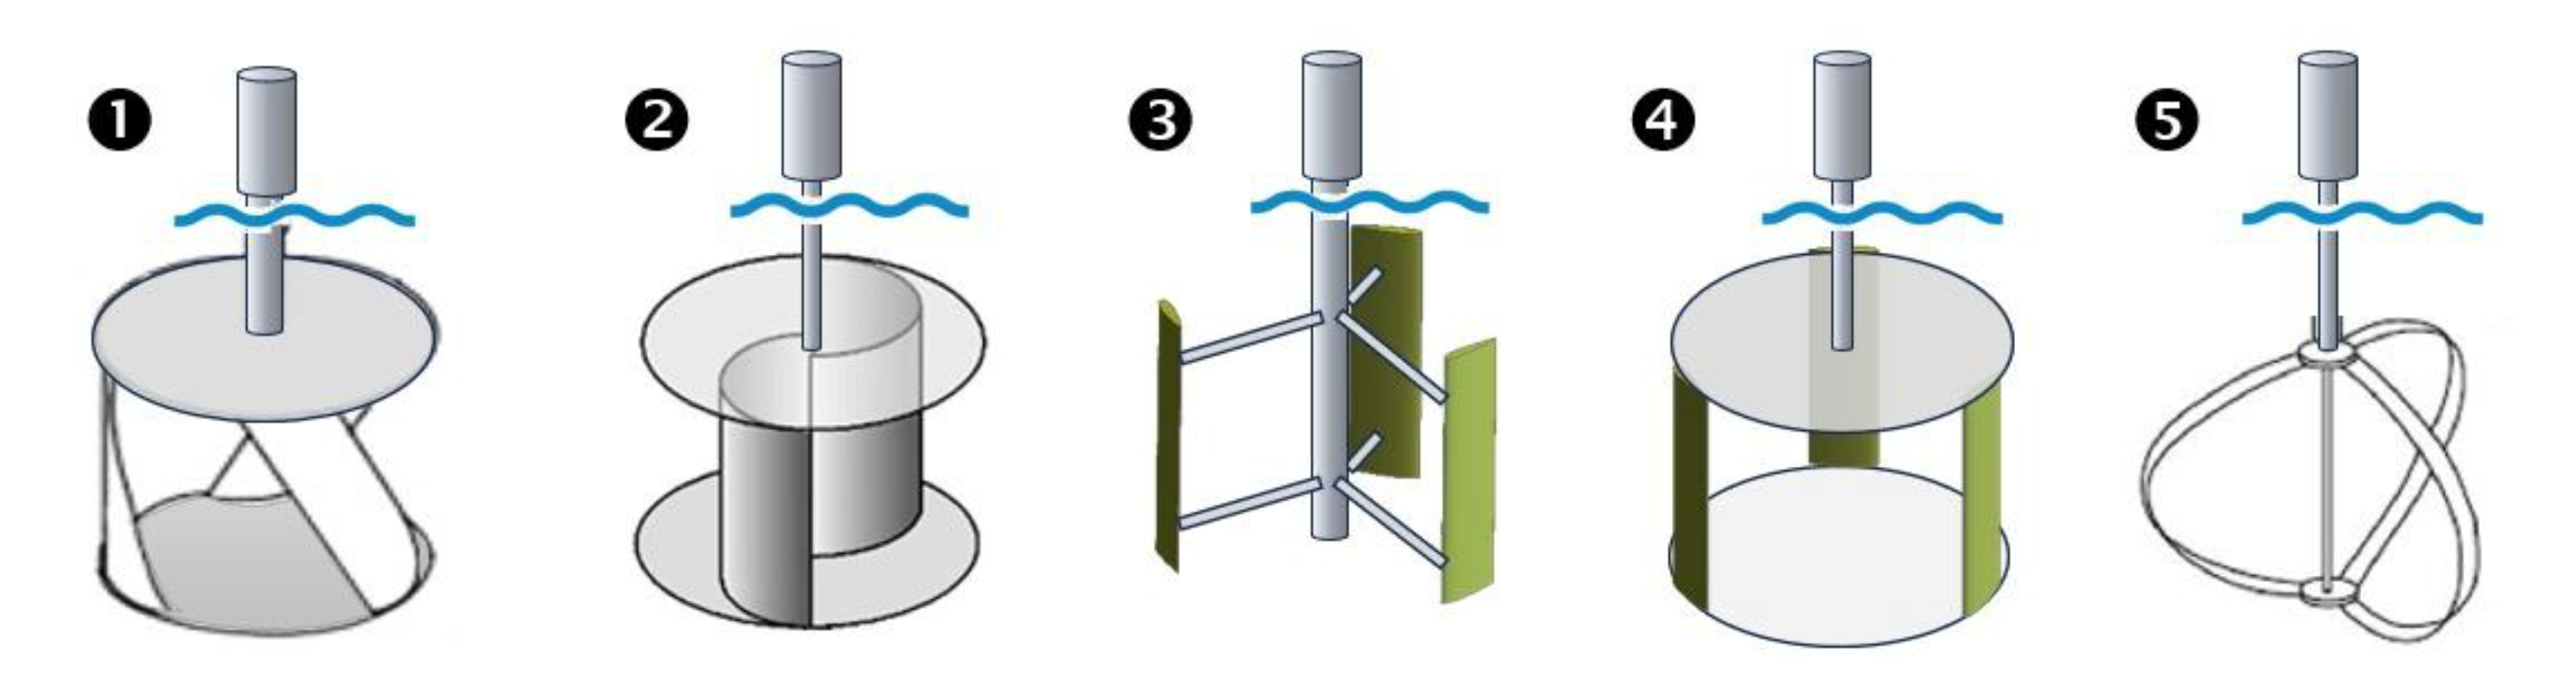
In parallel, vertical-axis water turbines (VAWTs) have been developed for capturing current energy. Mutsuda et al. [21] integrated a small-scale turbine with a fish aggregating device (FAD), achieving outputs up to 20 kW. Behrouzi et al. [22] proposed a hinged-blade design to reduce drag and achieved 188.8 W at 0.56 m/s. Fernandes et al. [23] explored autorotation from vortex-induced asymmetry, while Alam et al. [24] combined Darrieus and Savonius rotors to enhance performance in low-speed flows. A selection of such configurations is illustrated in Figure 1.
These standalone systems demonstrate the viability of wave and current energy harvesting individually. However, each suffers from inherent limitations in consistency or deployment scope, motivating further integration.
2.4. Existing Hybrid Wave–Current Systems
To overcome the limitations of individual systems, researchers have proposed hybrid wave–current energy converters (HWCECs). Silva et al. [25] developed a non-coupled platform combining oscillating buoys and a vertical-axis turbine, each with separate generators. Chen et al. [26] introduced a coupled two-body system using a buoy and a heave plate, linked via a planetary gearbox to merge wave and current inputs into a single output shaft.
This design was validated through 1:10 scale testing in wave tanks, achieving 1.226 W under moderate wave and current conditions [27]. Park et al. [28] developed a combined swing-plate and rotating-cylinder concept, converting both types of motion using mechanical PTOs.
While these systems show promise, they often involve complex mechanical arrangements, large footprints, or synchronization difficulties. These constraints motivate the development of simpler, more compact designs, particularly those that can operate with minimal mechanical interaction between the subsystems.
Figure 1.
Common types of vertical axis water turbines: (1) Gorlov, (2) Savonius, (3) H-Darrieus, (4) Squirrel-cage Darrieus, and (5) Darrieus.
Figure 1.
Common types of vertical axis water turbines: (1) Gorlov, (2) Savonius, (3) H-Darrieus, (4) Squirrel-cage Darrieus, and (5) Darrieus.
2.5. Technical Challenges and Design Considerations
Designing an effective HWCEC involves multiple engineering challenges. Key among them is the integration of two distinct energy sources—one delivering oscillatory, low-frequency linear motion and the other providing continuous rotational input—into a shared PTO. The mismatch in force profiles and frequency characteristics complicates gearbox and rectification design [27].
Other critical considerations include marine corrosion resistance [29], buoyancy-stability optimization, and low-friction mechanical transmission. Environmental concerns such as underwater noise [30], electromagnetic interference, and entanglement risk must also be addressed. While some studies report hybrid systems achieving up to 87% more output than standalone systems [26], achieving this performance in a cost-effective, scalable way remains a major research challenge.
The present study contributes to this area by proposing a prototype hybrid system that prioritizes mechanical simplicity, compact design, and off-the-shelf manufacturability. Its dual-input generator accepts independent mechanical inputs from a heaving buoy and a vertical-axis turbine, operating without complex coupling mechanisms.
3. Resource Assessment
This section presents an assessment of wave energy potential relevant to the design and deployment of a hybrid ocean energy harvesting system. It begins by briefly contextualizing the broader wave climate of the Red Sea and Persian Gulf, drawing from existing studies, before focusing on real-time measurements and historical data specific to the Al Khobar coastline. These insights inform the system’s suitability for operation in a nearshore low-to-moderate energy environment.
3.1. Regional Wave Climate Context
Several studies have investigated wave energy availability across Saudi Arabia’s coastal regions, highlighting important contrasts between offshore and nearshore environments. In the Red Sea, offshore locations such as Thual experience wave heights exceeding 4 meters and peak periods above 8 seconds, while nearshore sites exhibit significantly reduced wave energy [31]. Similarly, wave data from the Persian Gulf reveals that its central and western regions (e.g., Assalouyeh, Boushehr) occasionally reach wave heights over 2 meters, with wave power peaking above 3.9 kW/m during high-energy seasons [32]. In contrast, the eastern region of the Persian Gulf, including the Al Khobar coastline, shows consistently lower wave energy, but with calmer and more predictable conditions. Long-term wave reanalysis at Ras Al Khair further confirms that while extreme wind and swell events do occur offshore, nearshore waters remain significantly more stable in both height and directionality. These findings support the selection of Al Khobar as a practical deployment site for small-scale, point-absorber systems. Although not the most energetic location, its consistency and accessibility make it suitable for controlled testing and iterative prototype development.
3.2. Wave Conditions at Al Khobar
To enable design of the hybrid prototype and verify regional model data, wave conditions at the Al Khobar coastline (26.081684°N, 50.154086°E) were analyzed using both reanalysis data and physical site measurements
3.2.1. Historical Oceanographic Data
Wave characteristics at the Al Khobar site were retrieved from the Global Ocean Physics Reanalysis dataset [33], provided by Mercator Ocean International through the European Union’s Copernicus Marine Service. This dataset combines satellite observations and in-situ measurements to provide high-resolution oceanographic information from 1993 to 2022. The time series data from 2013 to 2023, presented in Figure 2(a) and 2(b), show significant wave height and mean wave period, respectively. Significant wave heights ranged from 0.01 meters to 1.91 meters, while mean periods ranged from 1.58 seconds to 5.94 seconds. The average/median values were 0.28/0.21 meters for wave height and 2.68/2.67 seconds for wave period. These values confirm that the site experiences relatively calm and consistent wave conditions.
3.2.2. On-Site Observations and Measurements
Field measurements were conducted at two locations at the Half-moon bay area of Khobar coastline south of the city to further characterize real-time wave conditions and support system tuning. A calibrated rod, marked at 5 cm intervals, along with a small buoy, shown in Figure 3, was used to observe and record the wave motion and wave height using a fixed-position camera.
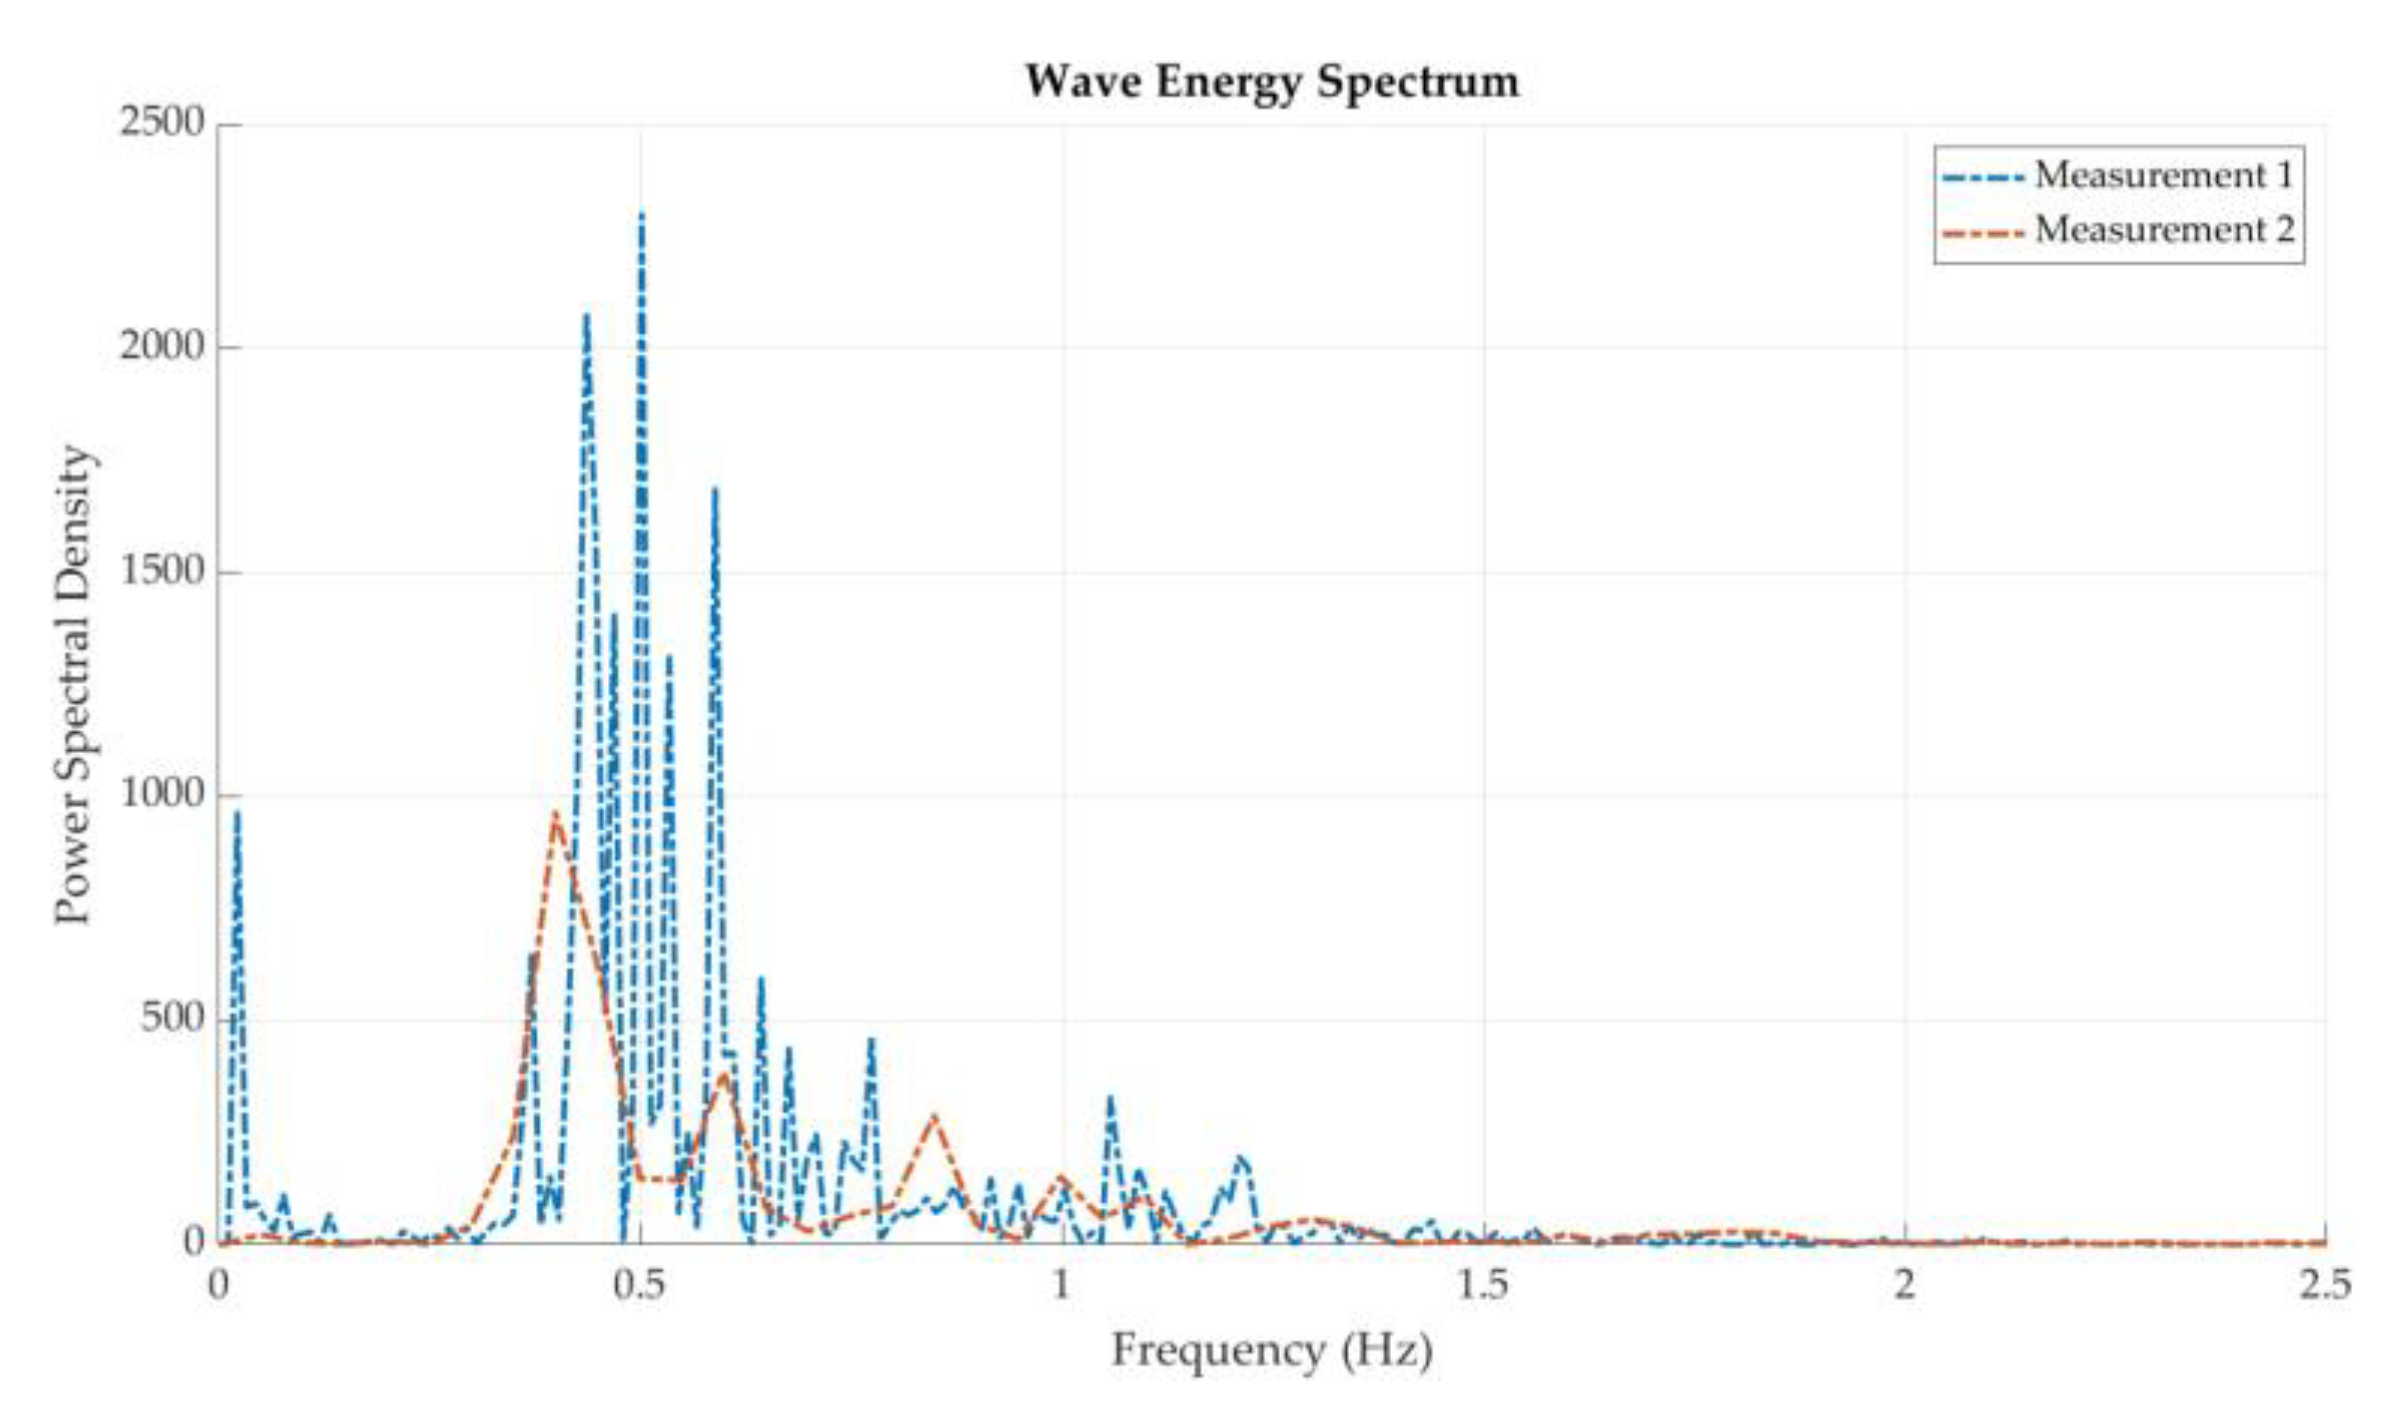
The recorded video was analyzed using Tracker software, [34] which generated a time series of wave elevation and its corresponding frequency spectrum. Observed wave heights ranged from –0.11 meters to 0.20 meters. The measured wave period was approximately 2.22 seconds, and the dominant frequency was found to be about 0.45 Hz. These values are consistent with the average and range obtained from the historical dataset, confirming the validity of the measurement approach. Figure 4 shows the wave height data measurement data from the two separate visits while Figure 5 displays the associated frequency spectrum.
Figure 3.
Calibrated rod and small buoy used for on-site wave motion and height measurements.
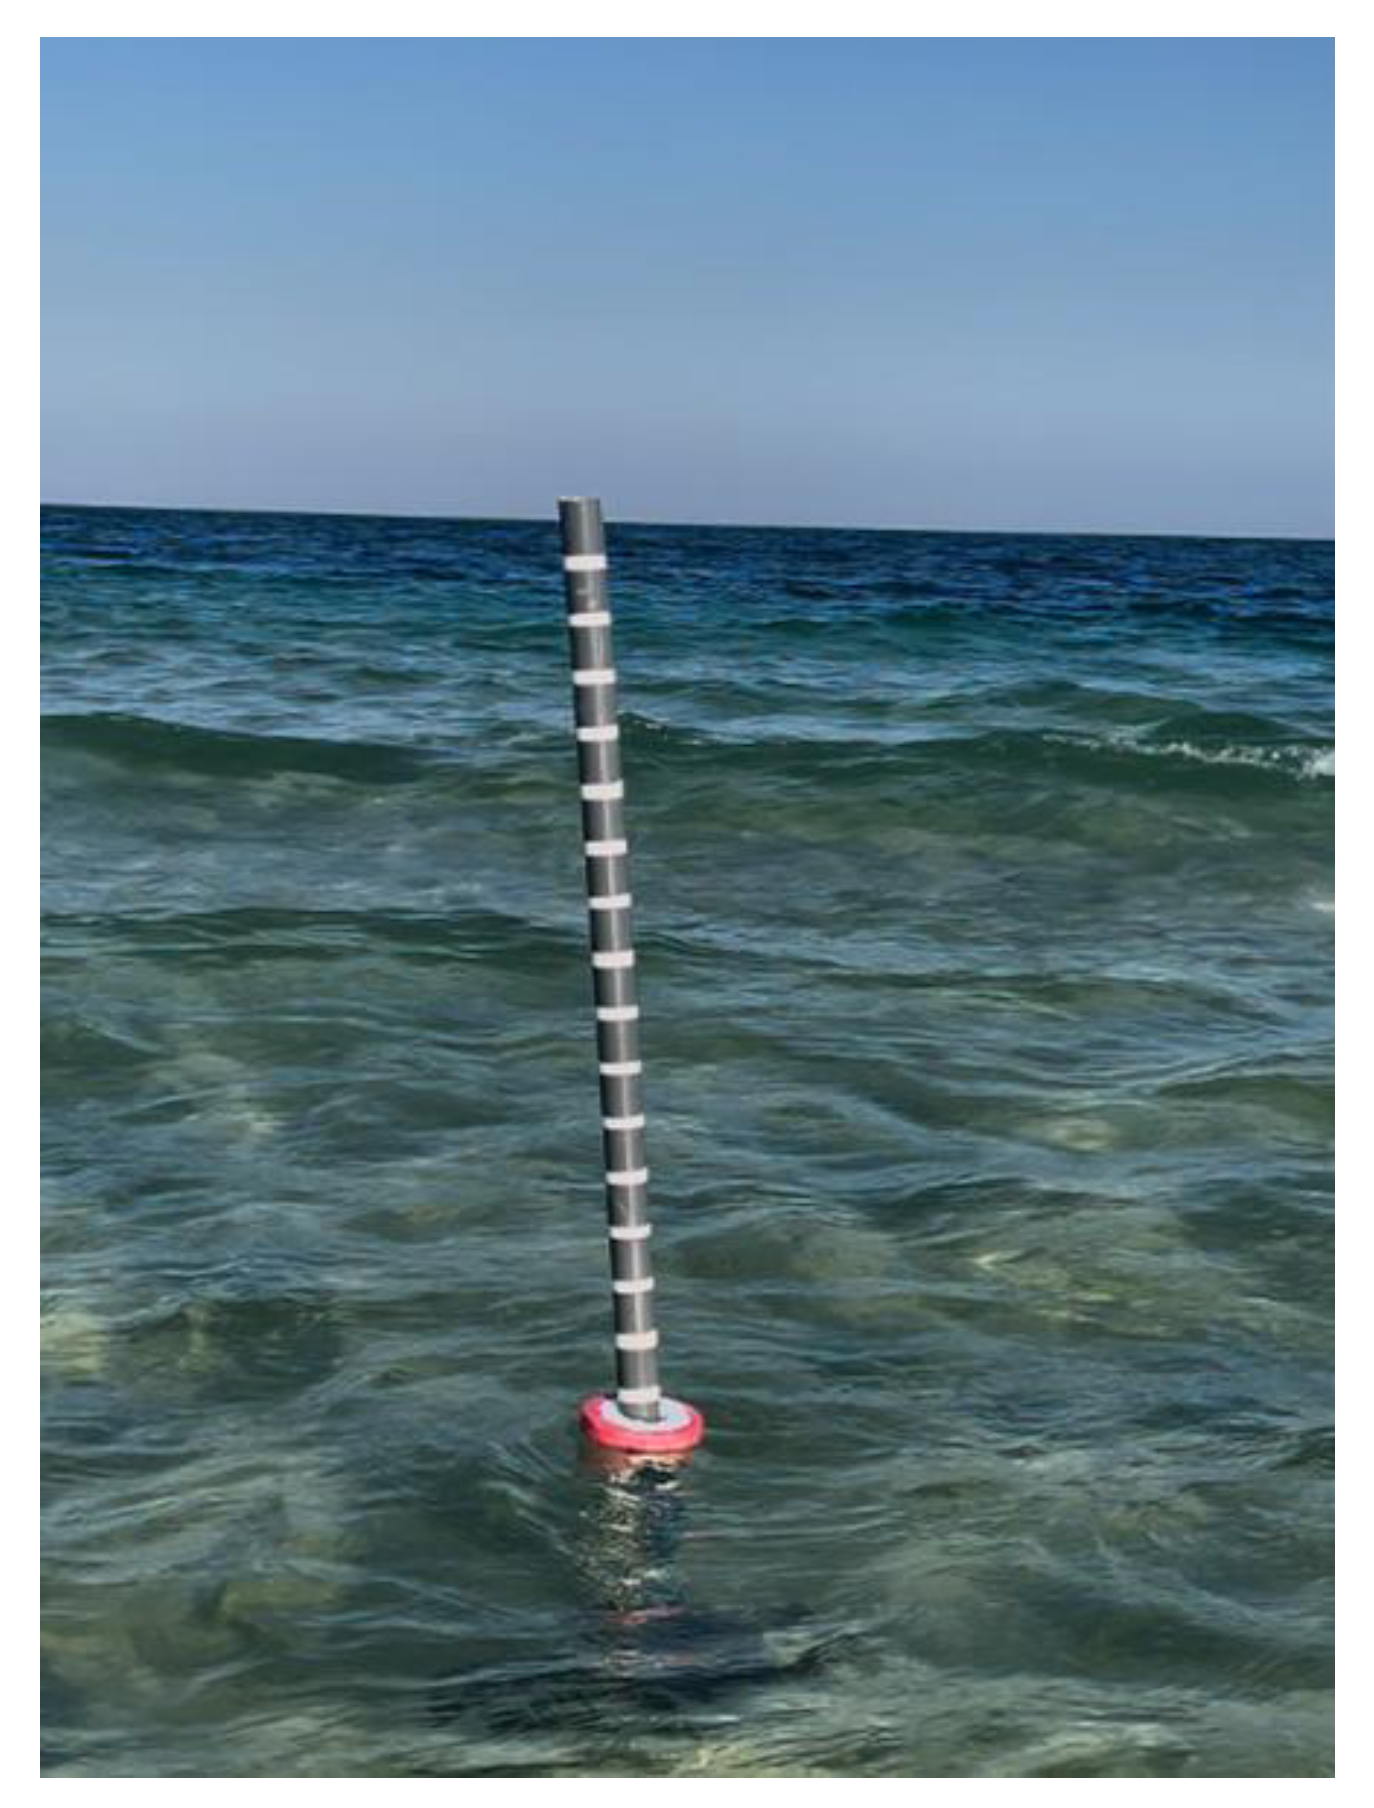
Figure 4.
On-site wave height data measurements.
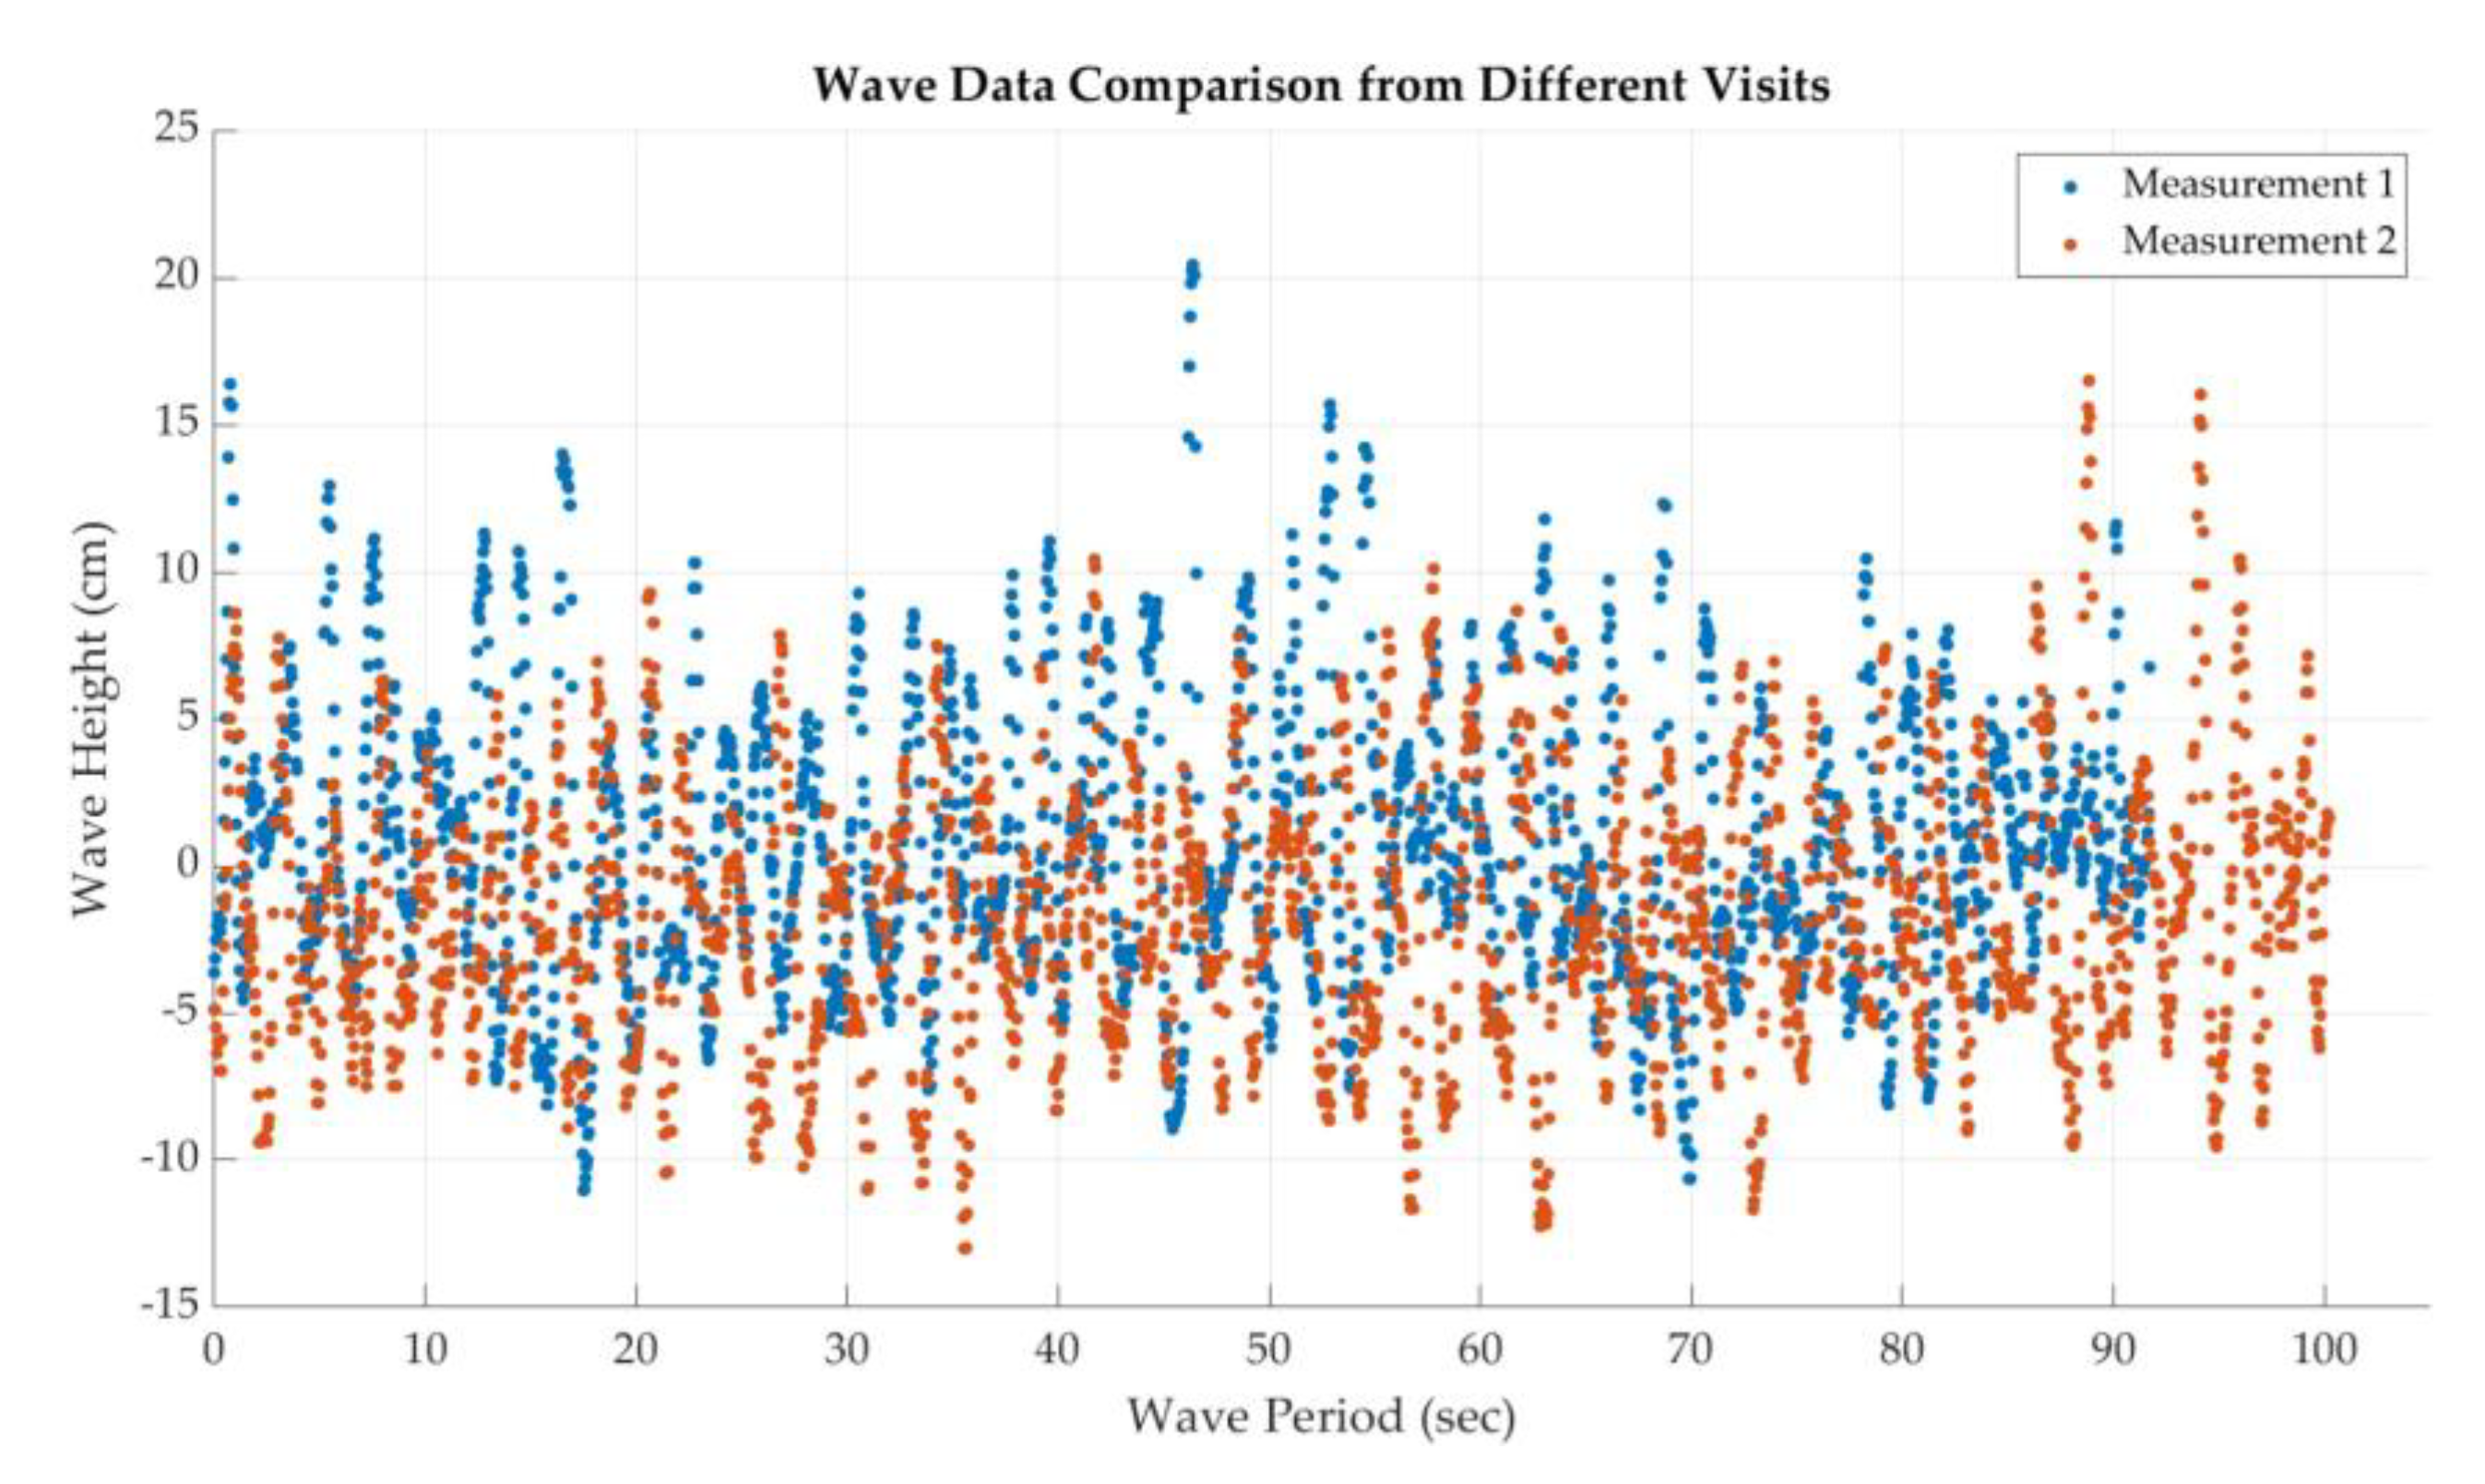
Figure 5.
Frequency spectrum of on-site wave height measurement results.
3.3. Summary
Historical analysis data indicate that the Khobar coastline experiences an average significant wave height of 0.28 m and an average wave period of 2.68 s. Onsite measurements further validated these values, with observed wave heights in a range from -0.11 m to 0.20 m and a dominant wave period of around 2.22 s. Frequency spectrum analysis in Figure 5 revealed two peaks at 0.39 Hz and 0.5 Hz, which suggested the target natural frequency range for the buoy design. The average wave power density potential of the site can be determined using the relation:
where, is the water density, g is the gravitational acceleration, is the significant wave height, and is the mean wave period. Based on the measured wave parameters at Khobar, the estimated average wave power density is approximately 103.08 W/m, suggesting potential for small scale ocean energy harvesting and necessitating prototype development and testing.
4. Hybrid System Design and Prototype Development
4.1. Concept Development
The primary design objective was to combine wave and current energy harvesting into a single system such that the oscillating input from a wave-driven buoy after being converted into unidirectional rotation via a specially designed mechanical motion rectifier (MMR) is fed to one rotor of the dual-rotor generator while the counter-rotating input from the vertical axis water turbine (VAWT) is fed to the other rotor of the dual-rotor generator. With the two counter-rotating rotors, the generator power could be increased many folds depending upon the relative rpm between the two rotors.
The first design concept, see Figure 6(a), had the generator placed on a platform above the water surface, while all the other components, i.e. the MMR, gearbox, turbine shaft and other linkages, were to be placed in an underwater water-tight compartment. However, the need for a large underwater water-tight compartment meant hydrodynamic blockage of the water currents which may have significant negative impact on the performance of the turbine and, therefore, this idea was later abandoned.
The second design concept, see Figure 6(b), was an effort to create a limited underwater footprint with a smaller water-tight compartment to reduce complexity as well as eliminate any flow blockage. Moreover, the original turbine was replaced by combined savonius-helical blade Darrieus vertical axis water turbine to exploit its omnidirectional character for maximum performance potential. However, it was realized that the potential for mechanical loss in the MMR could be significant, and the complexity and effort to design and manufacture it made the later design consideration to completely revise its design.
4.2. Final Prototype Design
After a series of design changes and trade-offs, Figure 7 shows the different views of the final design concept along with the key components in its final assembled form that was built and tested. The key features of the final design include: (1) a hollow point-absorber buoy made of polyurethane foam with a lid to hold weights, (2) a helical-blade vertical axis wind turbine (VAWT), (3) modified MMR with overdrive, (4) dual-rotor generator, along with the necessary linkages, bearings and gear drives. The key innovative features of the design are presented next.
4.2.1. The Modified MMR with Overdrive
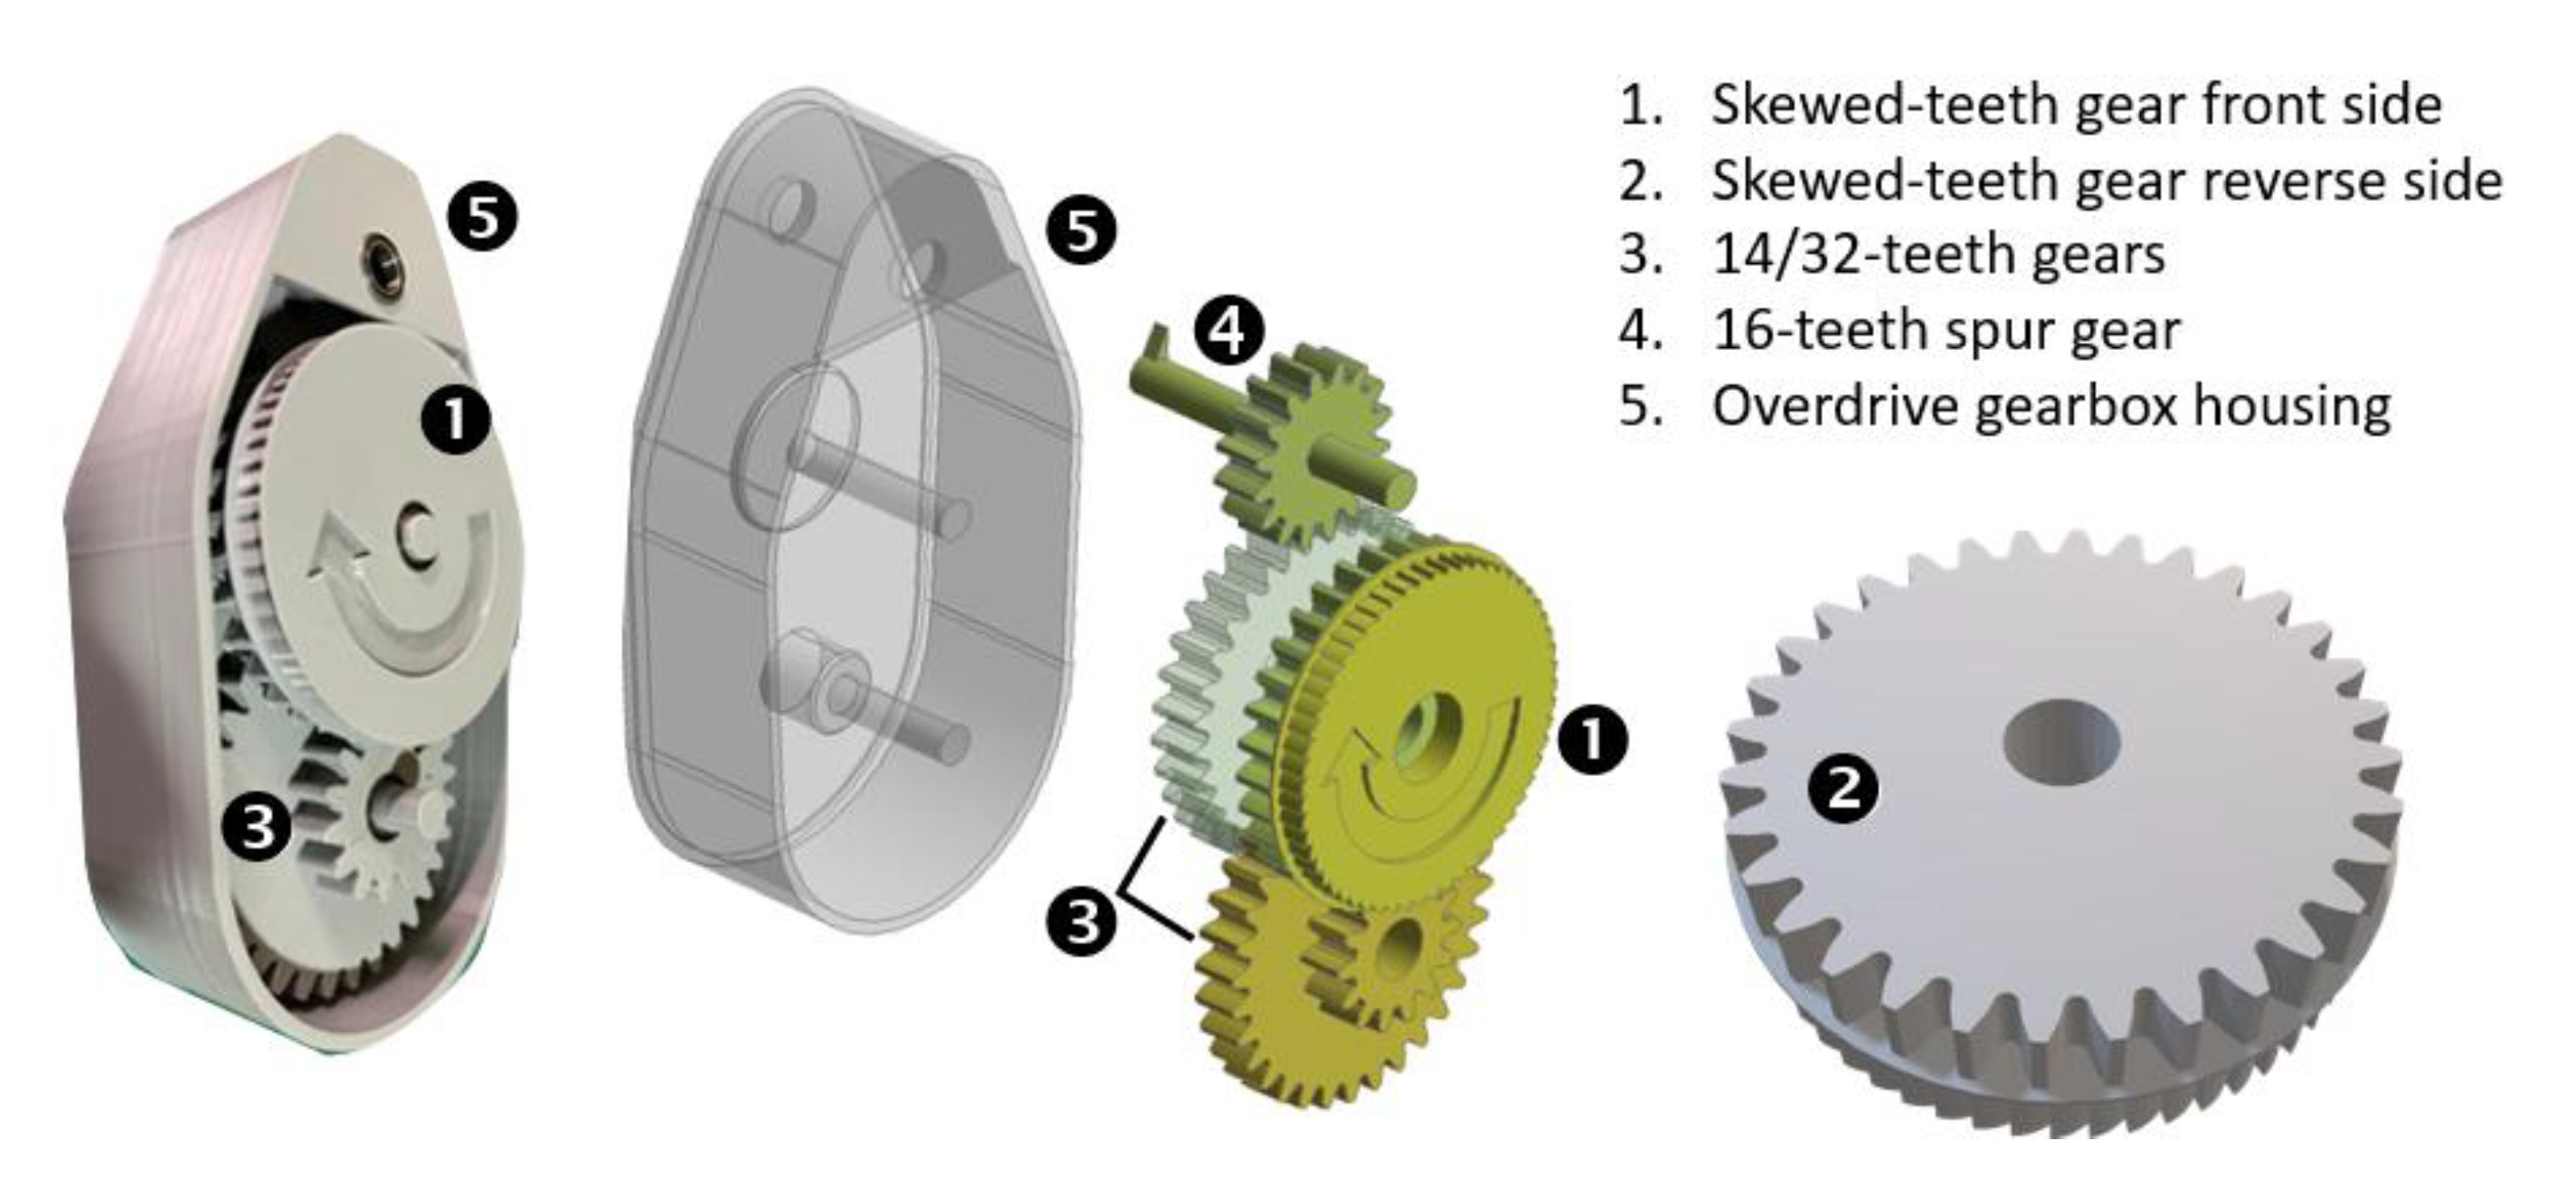
To transform the oscillatory motion of the buoy into unidirectional rotational motion, a specifically designed MMR, as shown in Figure 8, was built. At the heart of the MMR is the skewed-teeth dual gear, also shown in Figure 8, one side with skewed-teeth gear engages with the push-pullet array plate, see item (1) in Figure 8, that is attached by a rod to the point-absorber buoy, while the other side (back) with regular gears is connected to a 1:10 ratio overdrive gearbox, shown in Figure 9. This arrangement ensures that the one oscillation of the buoy is converted into 10 by the modified MMR and overdrive gearbox. This was necessary, as will be explained later, to allow higher rpm input to the dual-rotor generator for reasonable power generation.
The VAWT, modified MMR, overdrive gearbox, dual-rotor generator and some of the other components were 3D-printed using PLA+ filament. Other structural materials were selected for their resistance to sea water, off-the-shelf availability, lightweight and mechanical integrity and robustness of the overall assembly.
Figure 6.
Design evolution showing: (a) The first concept, and (b) the second concept.
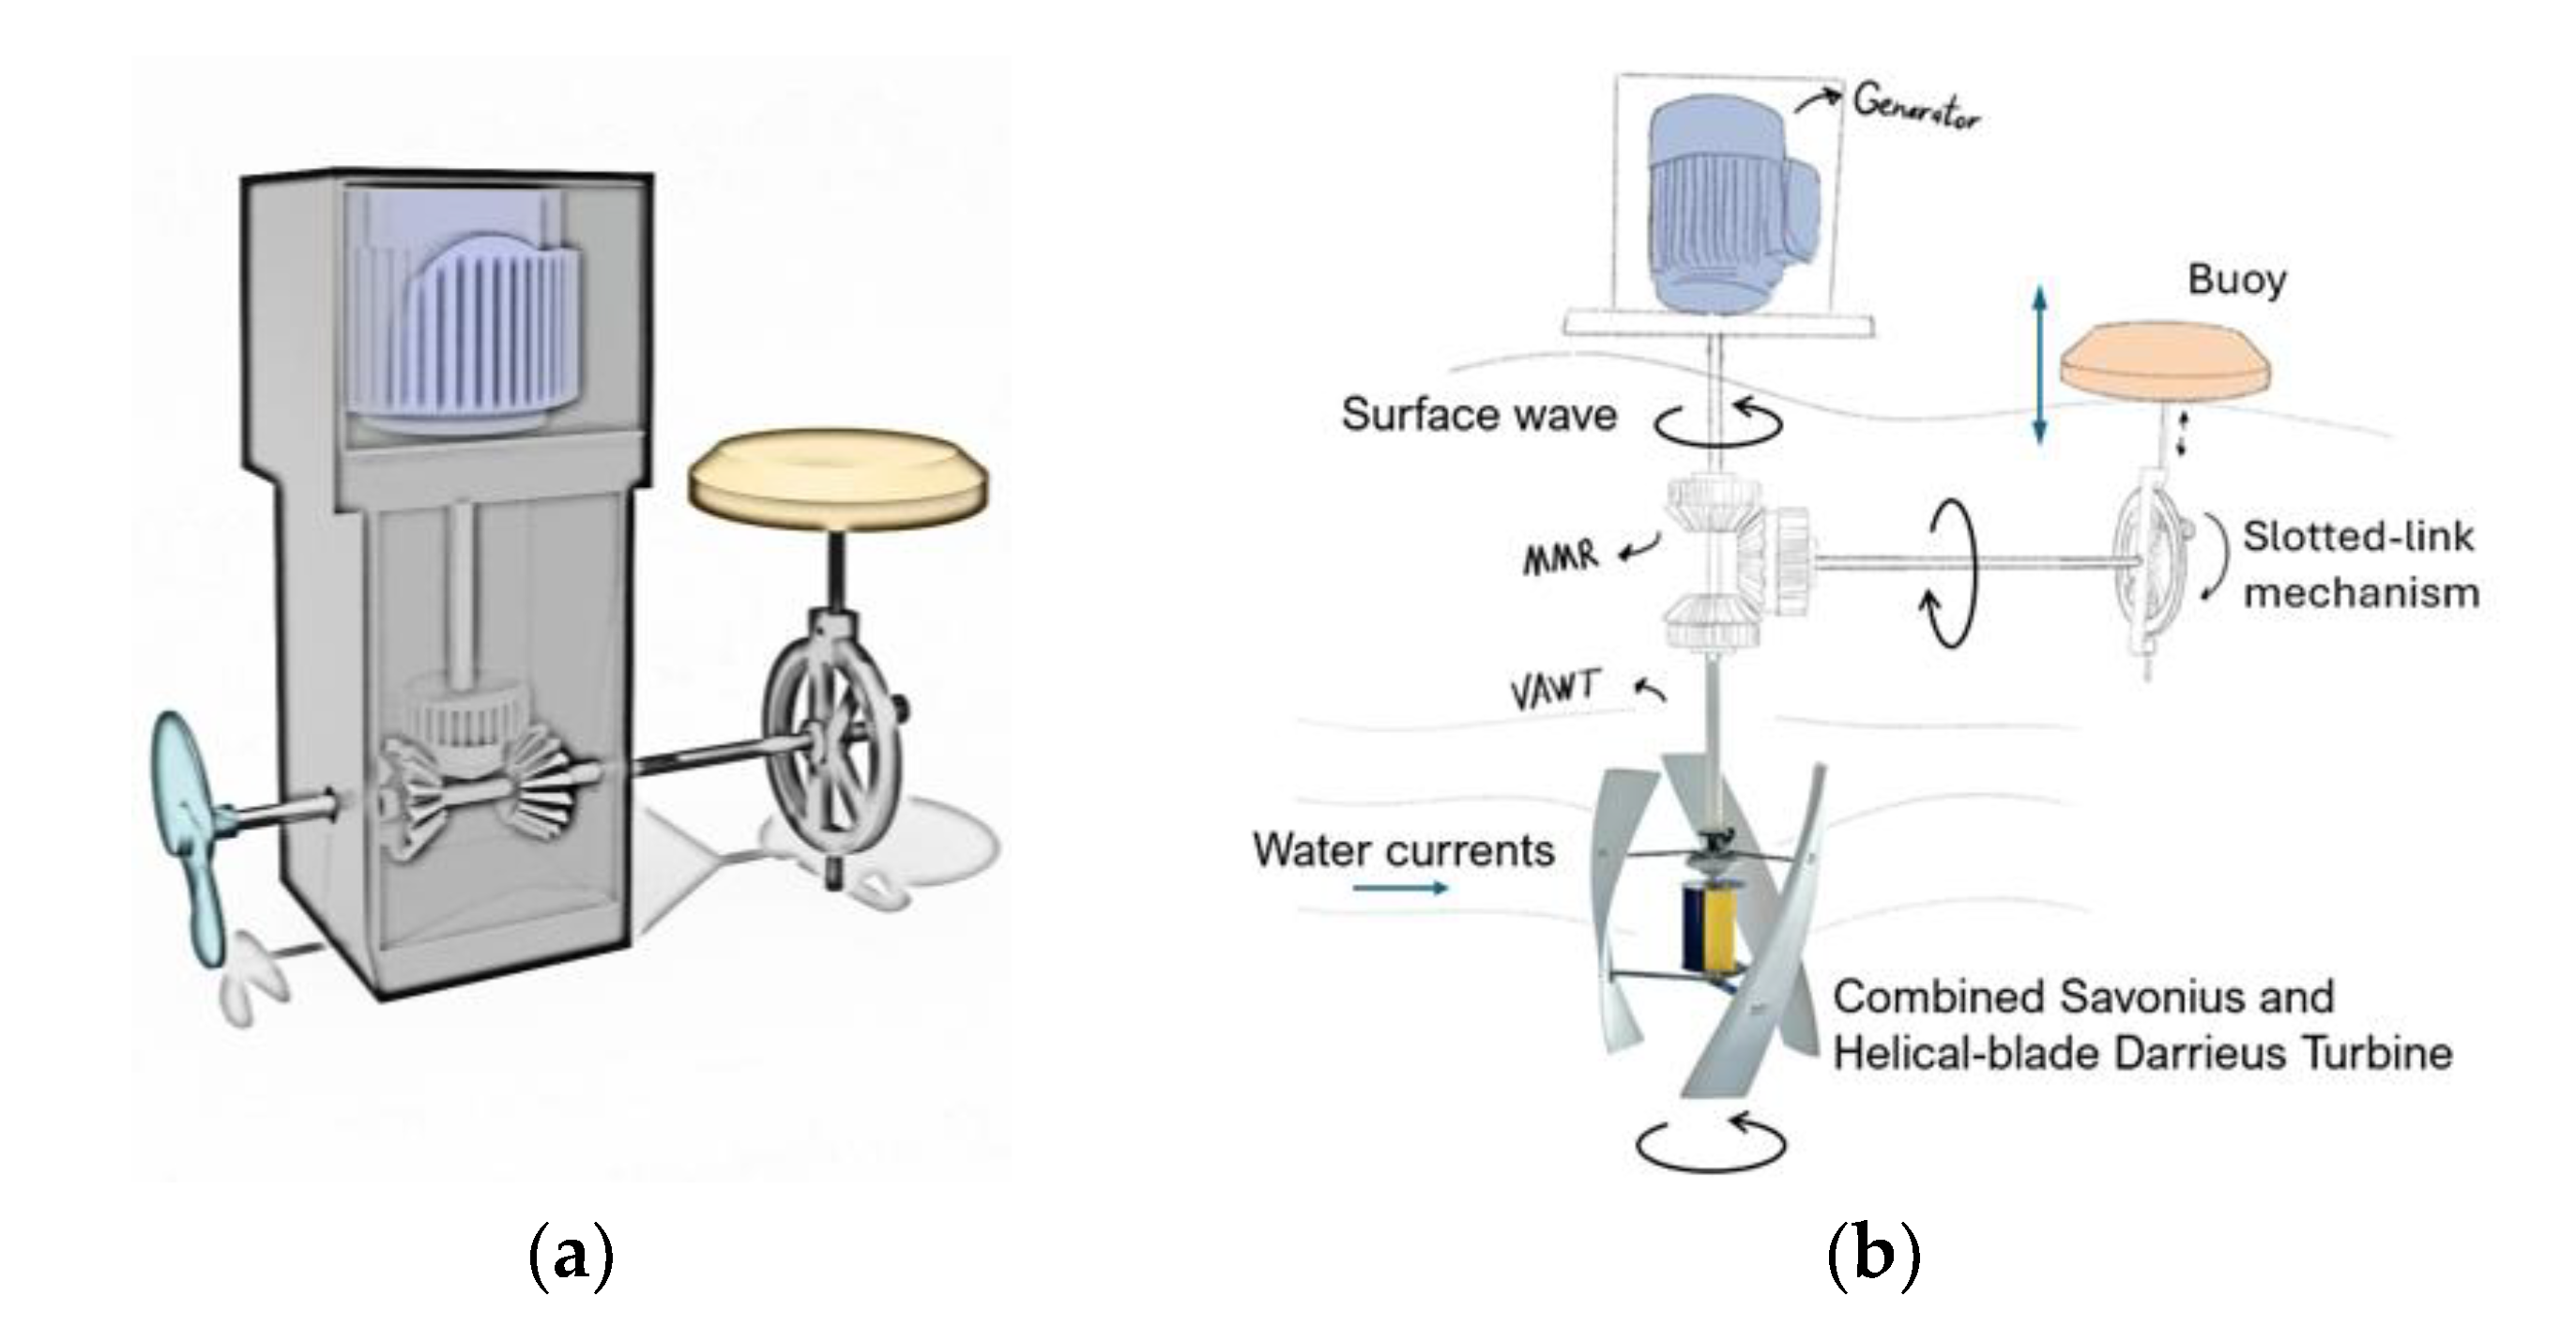
Figure 7.
The different views of the final complete system in its assembled form.
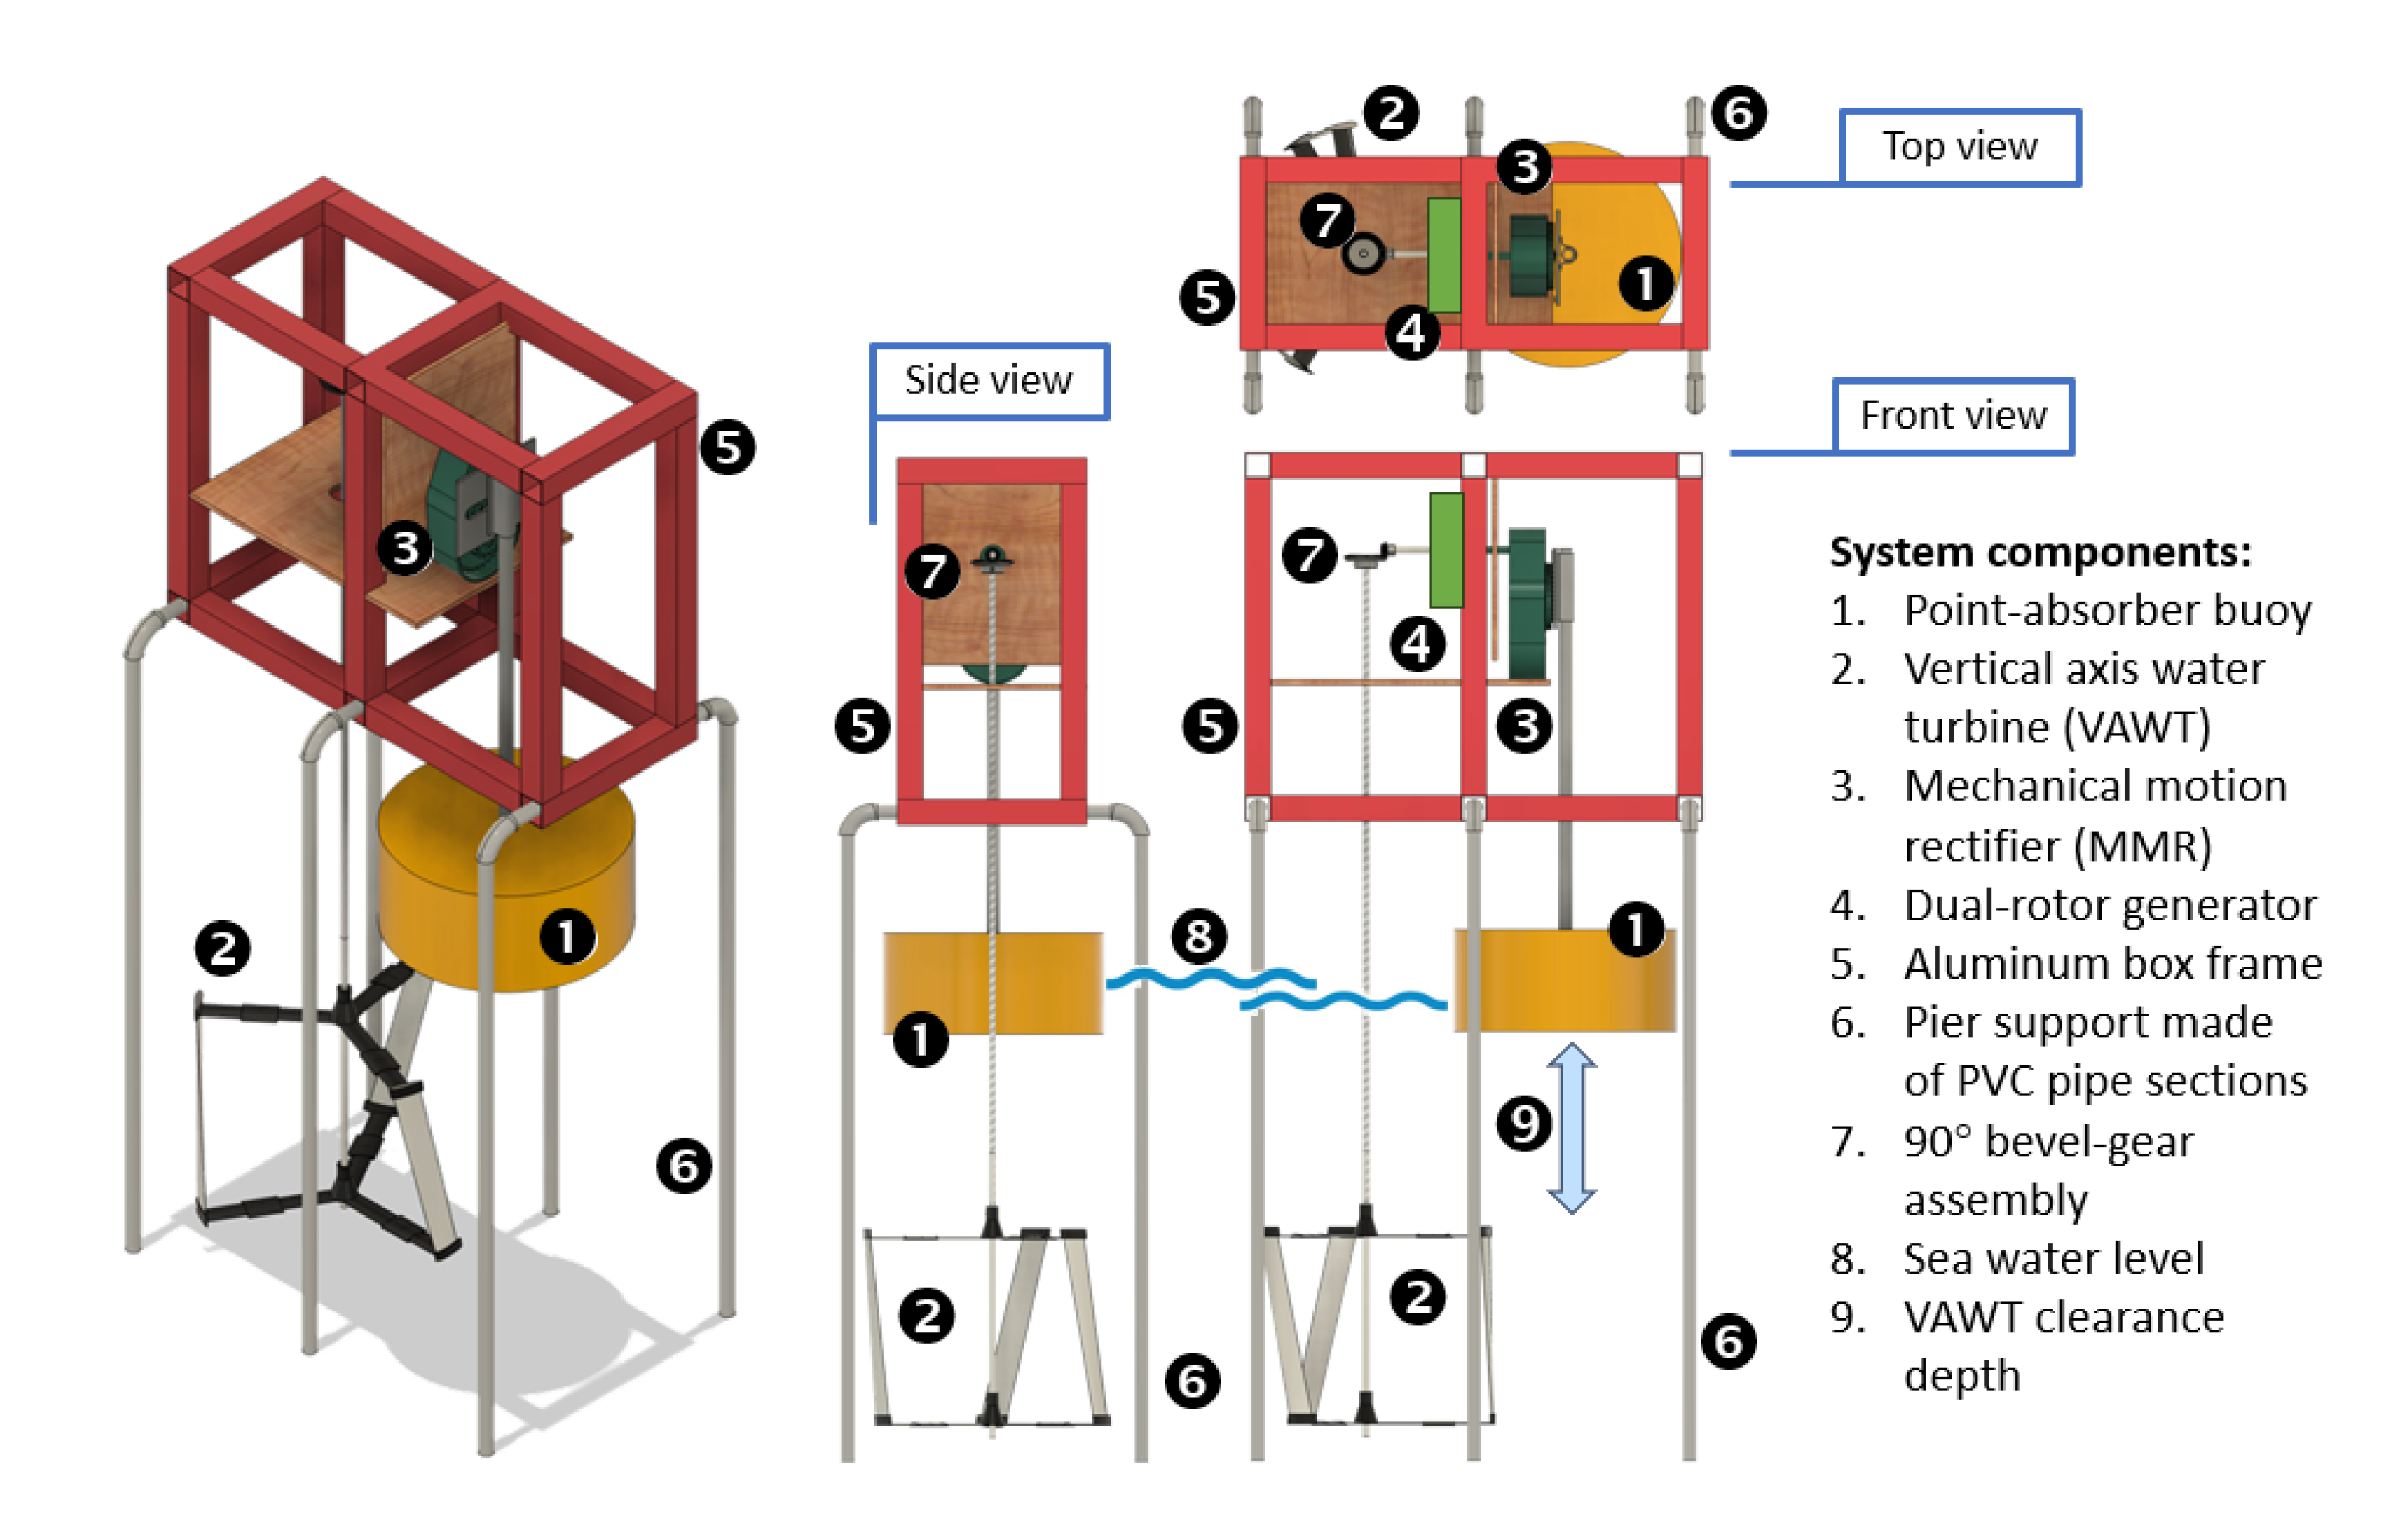
Figure 8.
The modified MMR system.
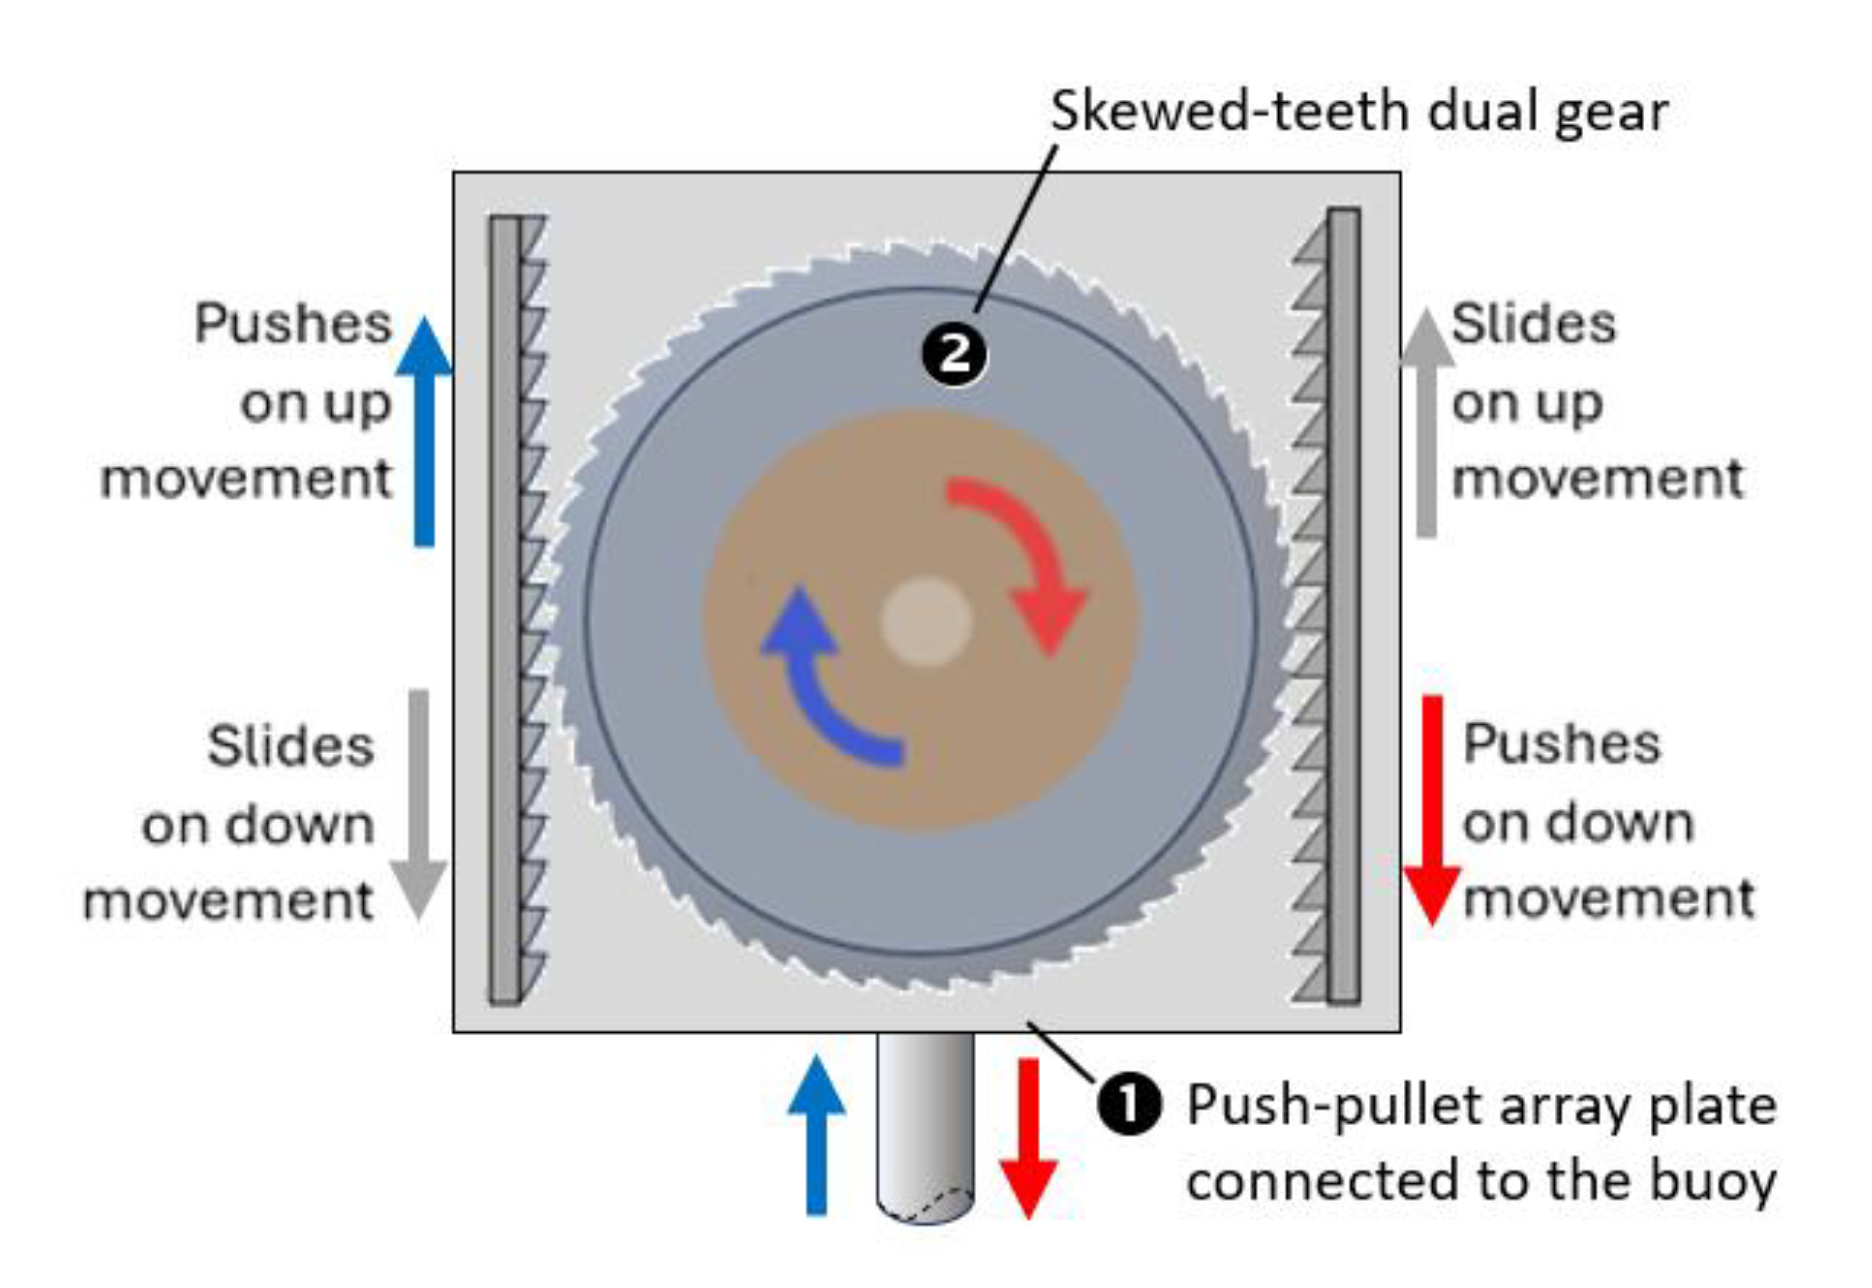
Figure 9.
The modified MMR and overdrive gearbox assembly.
4.2.2. The Dual-Rotor Generator
The idea of dual-rotor generator stemmed from two important design constraints. First, the generator should accept input from two diametrically-opposed counter-rotating drive shafts. Second, since it was anticipated that due to low ocean wave periods and current velocities the resulting drive shaft rpms would be low, therefore, some means to boost the rpm would be necessary to obtain reasonable generator power output. The former constraint is overcome by the use of a dual-rotor generator.
Figure 10 illustrates the dual-rotor generator subassembly along with its different components and rotations. Here the dual-rotor generator consists of two rotor discs, one housing the permanent magnets and connected to the output shaft from the modified MMR overdrive gearbox while the other containing the copper-coil windings and driven by the VAWT's shaft via a 90°-bevel gear with a 1:3 ratio. The arrangement is such that the two inputs to the dual-rotor generator are counter-rotating, i.e. the coil windings and the magnets independently counter-rotate. The latter constraint is overcome by providing the boost to rpm by the 1:10 ratio overdrive gear on the magnet side and 1:3 ratio 90°-bevel gear on the coil-windings side resulting in increased electricity generation through enhanced electromagnetic induction at lower relative rpms. A full-wave rectifier circuit is used to convert the alternating current into direct current. Finally, a slip ring is used to transfer electrical current from the rotating coil windings to a stationary outlet for power measurements.
4.2.3. The Vertical Axis Water Turbine
Figure 11 illustrates the vertical axis water turbine (VAWT) and 90°-bevel gear subassembly. The specific design of the VAWT with skewed blades and Darrieus configuration was chosen for its omni-directional characteristics as well as smooth variation of turbine torque during its complete 360° rotation as compared to a straight-bladed Darrieus configuration.
4.2.4. Data Acquisition and Recording
An Arduino-based data acquisition system was designed and built to collect real-time voltage and current data from the generator during indoor and in-situ tests of the prototype. All readings were stored on an SD card module for post-processing and analysis. The data acquisition and recording system consisted of the Arduino Uno R3 board, REES51 voltage sensor, ACS712 current sensor, Micro SD card reader module, 5V power source, resistors, capacitors, breadboard and wires.
4.3. The Final Prototype Fabrication
Figure 12 shows the final prototype of the dual-input hybrid wave-current ocean energy system. The upper frame is made up of aluminum sections while the lower frame is made from PVC pipes with adjustable heights. The push-pullet array plate was mounted on a rail mechanism to allow heave motion of the buoy. The VAWT, push-pullet-array plate with the rail mechanism, modified MMR, overdrive, dual-rotor generator and 90°-bevel gears were 3D printed using PLA+ filament. The college of engineering workshop and fab-house facilities were used for all other hardware and fabrication tasks.
In the following sections, details of design of the point-absorber buoy and the vertical axis water turbine (VAWT) are described in detail.
5. Point-Absorber Buoy Design
In this section, the objective is to determine the appropriate buoy geometry and characteristics for our system. One of the most critical steps in this process is the accurate estimation of the natural frequency of the buoy. The natural frequency significantly influences the dynamic behavior of the buoy under wave excitation and matching it with the dominant wave frequency helps ensure the optimal performance of the system.
Three different approaches were adopted to estimate the natural frequency of the buoy, thereby identifying the dimensions of the buoy. The first is the theoretical approach in which the following formula [35] can be used to obtain natural frequency.
where Awp = (1/4) πD² is the water plane area of the buoy, M₃₃ = ρ (1/4) πD²T is the buoy mass based on the submerged volume, and A₃₃ is the added mass coefficient which can be estimated at the preliminary stage using the following relation: A₃₃ = 0.167ρD³. Substitution of these expressions in Eq. (2) yields:
The above Eq. (3) can be used to determine possible buoy dimensions that have the desired natural frequency. It is to be noted that different diameter-draft combinations can give the same natural frequency. From resource assessment in Section 3, a natural frequency of 0.5 Hz represents the dominant wave frequency observed in the target location of Al Khobar, Saudi Arabia. Table 1 shows different diameter-draft combinations for which this natural frequency of 0.5 Hz can be achieved.
According to Table 1, one possible combination of reaching the desired natural frequency of 0.5 Hz is using a buoy of about 1 meter draft, with diameter between 0.3 and 0.35 meters. However, such buoy dimensions would require greater water depth for tests that are farther away from the coast and, in addition, incur higher projected cost due to larger system size necessitating a more robust structure and motion conversion system. To ensure safe, cost-effective testing and compatibility with readily available components, a smaller buoy was selected without compromising the design’s resonance alignment in scaled conditions. The selected dimensions of cylindrical shape buoy are: an outer diameter of 0.35 m, an inner diameter of 0.32 m, and a height of 0.16 m.
For the chosen buoy geometry, different drafts were checked and tested to verify natural frequencies at different submergence depths. Natural periods of the buoy for different drafts were estimated through numerical heave decay simulations using ANSYS AQWA. Detailed hydrodynamic simulation results are presented in Section 7. Figure 13 shows: (a) the response of the buoy tested at a draft of 8.5 cm for three different release depths, and (b) the corresponding heave power spectral density.
To explore the natural period of the buoy, free decay experiments were also conducted for different drafts which were achieved by adding weights inside the cylindrical buoy. Table 2 presents a comparison between the natural periods of the buoy obtained from three different methods: numerical simulation using ANSYS AQWA, experimental data from in-situ measurements, and theoretical calculations based on Eq. (1). The three approaches are found to yield consistent results thereby confirming the findings and validating the three approaches.
6. Vertical Axis Water Turbine Design
A current turbine design optimized for low water currents as expected near the seashore and shallow water conditions is desirable. A recent study showed that lift-type vertical-axis hydro-turbine outperform drag-type one [36]. Hence, for the current study, a Vertical-Axis Water Turbine (VAWT) was chosen to determine its potential. Since the turbine is confined within the frame structure, see Figs. 7 and 12, the geometrical constraints on the design included: (1) turbine radius R ≤ 0.2 m, and (2) turbine height H ≤ 0.3 m. Additional design parameters considered to obtain the optimized design included: (a) blade profile, (b) blade chord c, and (c) the circular angle qc defined as the relative azimuthal angle between the upper and lower blade tips. The design constraints considered included: (a) turbine radius R ≤ 0.2 m, (b) turbine height H ≤ 0.3 m, (c) number of blades N = 2, 3 and 4, (d) blade profile shapes based on symmetrical airfoils: NACA 0015, 0018 or 0021, (e) blade chord 0.04 m ≤ c ≤ 0.12 m (c = 0.04, 0.08, or 0.12 m), and (f) circular angles qc = –20°, 0°, or +20°.
The analysis was performed using QBLADE [37], a state-of-the-art multi-physics validated open source code for modeling and aero-servo-hydro-elastic performance assessment of horizontal or vertical axis wind/hydro turbines. Blade section aerodynamic characteristics are obtained using an in-build XFOIL module [38]. QBLADE has been reliably used for design of hydro-turbines [39]. The analysis were performed considering: water at 20°C with density 998 kg/m3 and dynamic viscosity 1.002×10⁻³ Pa·s, water current velocities ranging from 0.5 m/s to 3.0 m/s at 0.5 m/s increments, and turbine rotational speed ranging from 10 rpm to 900 rpm at 10 rpm increments which together correspond to turbine tip-speed ratios TSR (= wR/V) ranging from 0 to 6. Based on these parameters, a total of 27 design configurations were analyzed considering 3 blades and maximum allowable turbine radius and height of 0.2 m and 0.3 m, respectively.
Figure 14. shows comparison of: (a) the turbine power, and (b) the torque coefficient curves as a function of the tip-speed ratio TSR and RPM, respectively. The results show that the highest turbine power coefficient Cp = 0.41 is achieved at TSR = 2.6 corresponding to the highest turbine torque coefficient Cm = 0.15. These results suggest that the optimal configuration for the VAWT is the one with 3 blades, radius R = 0.2 m, height H = 0.3 m, blade profile based on NACA 0021 airfoil, blade chord c = 0.04 m, and a circular angle qc = +20° (forward skew). Figure 11 shows the geometric rendering of the best configuration selected as the final design. The VAWT blades were connected to the central shaft with the aid of top and bottom struts having a profile of 16% thick S8036 low Reynolds number laminar flow airfoil for minimum drag due to the struts. Table 3 lists the performance characteristics of the final VAWT design.
Figure 9.
Comparison of: (a) power coefficient and (b) torque coefficient curves of the different VAWT configurations.
Figure 9.
Comparison of: (a) power coefficient and (b) torque coefficient curves of the different VAWT configurations.
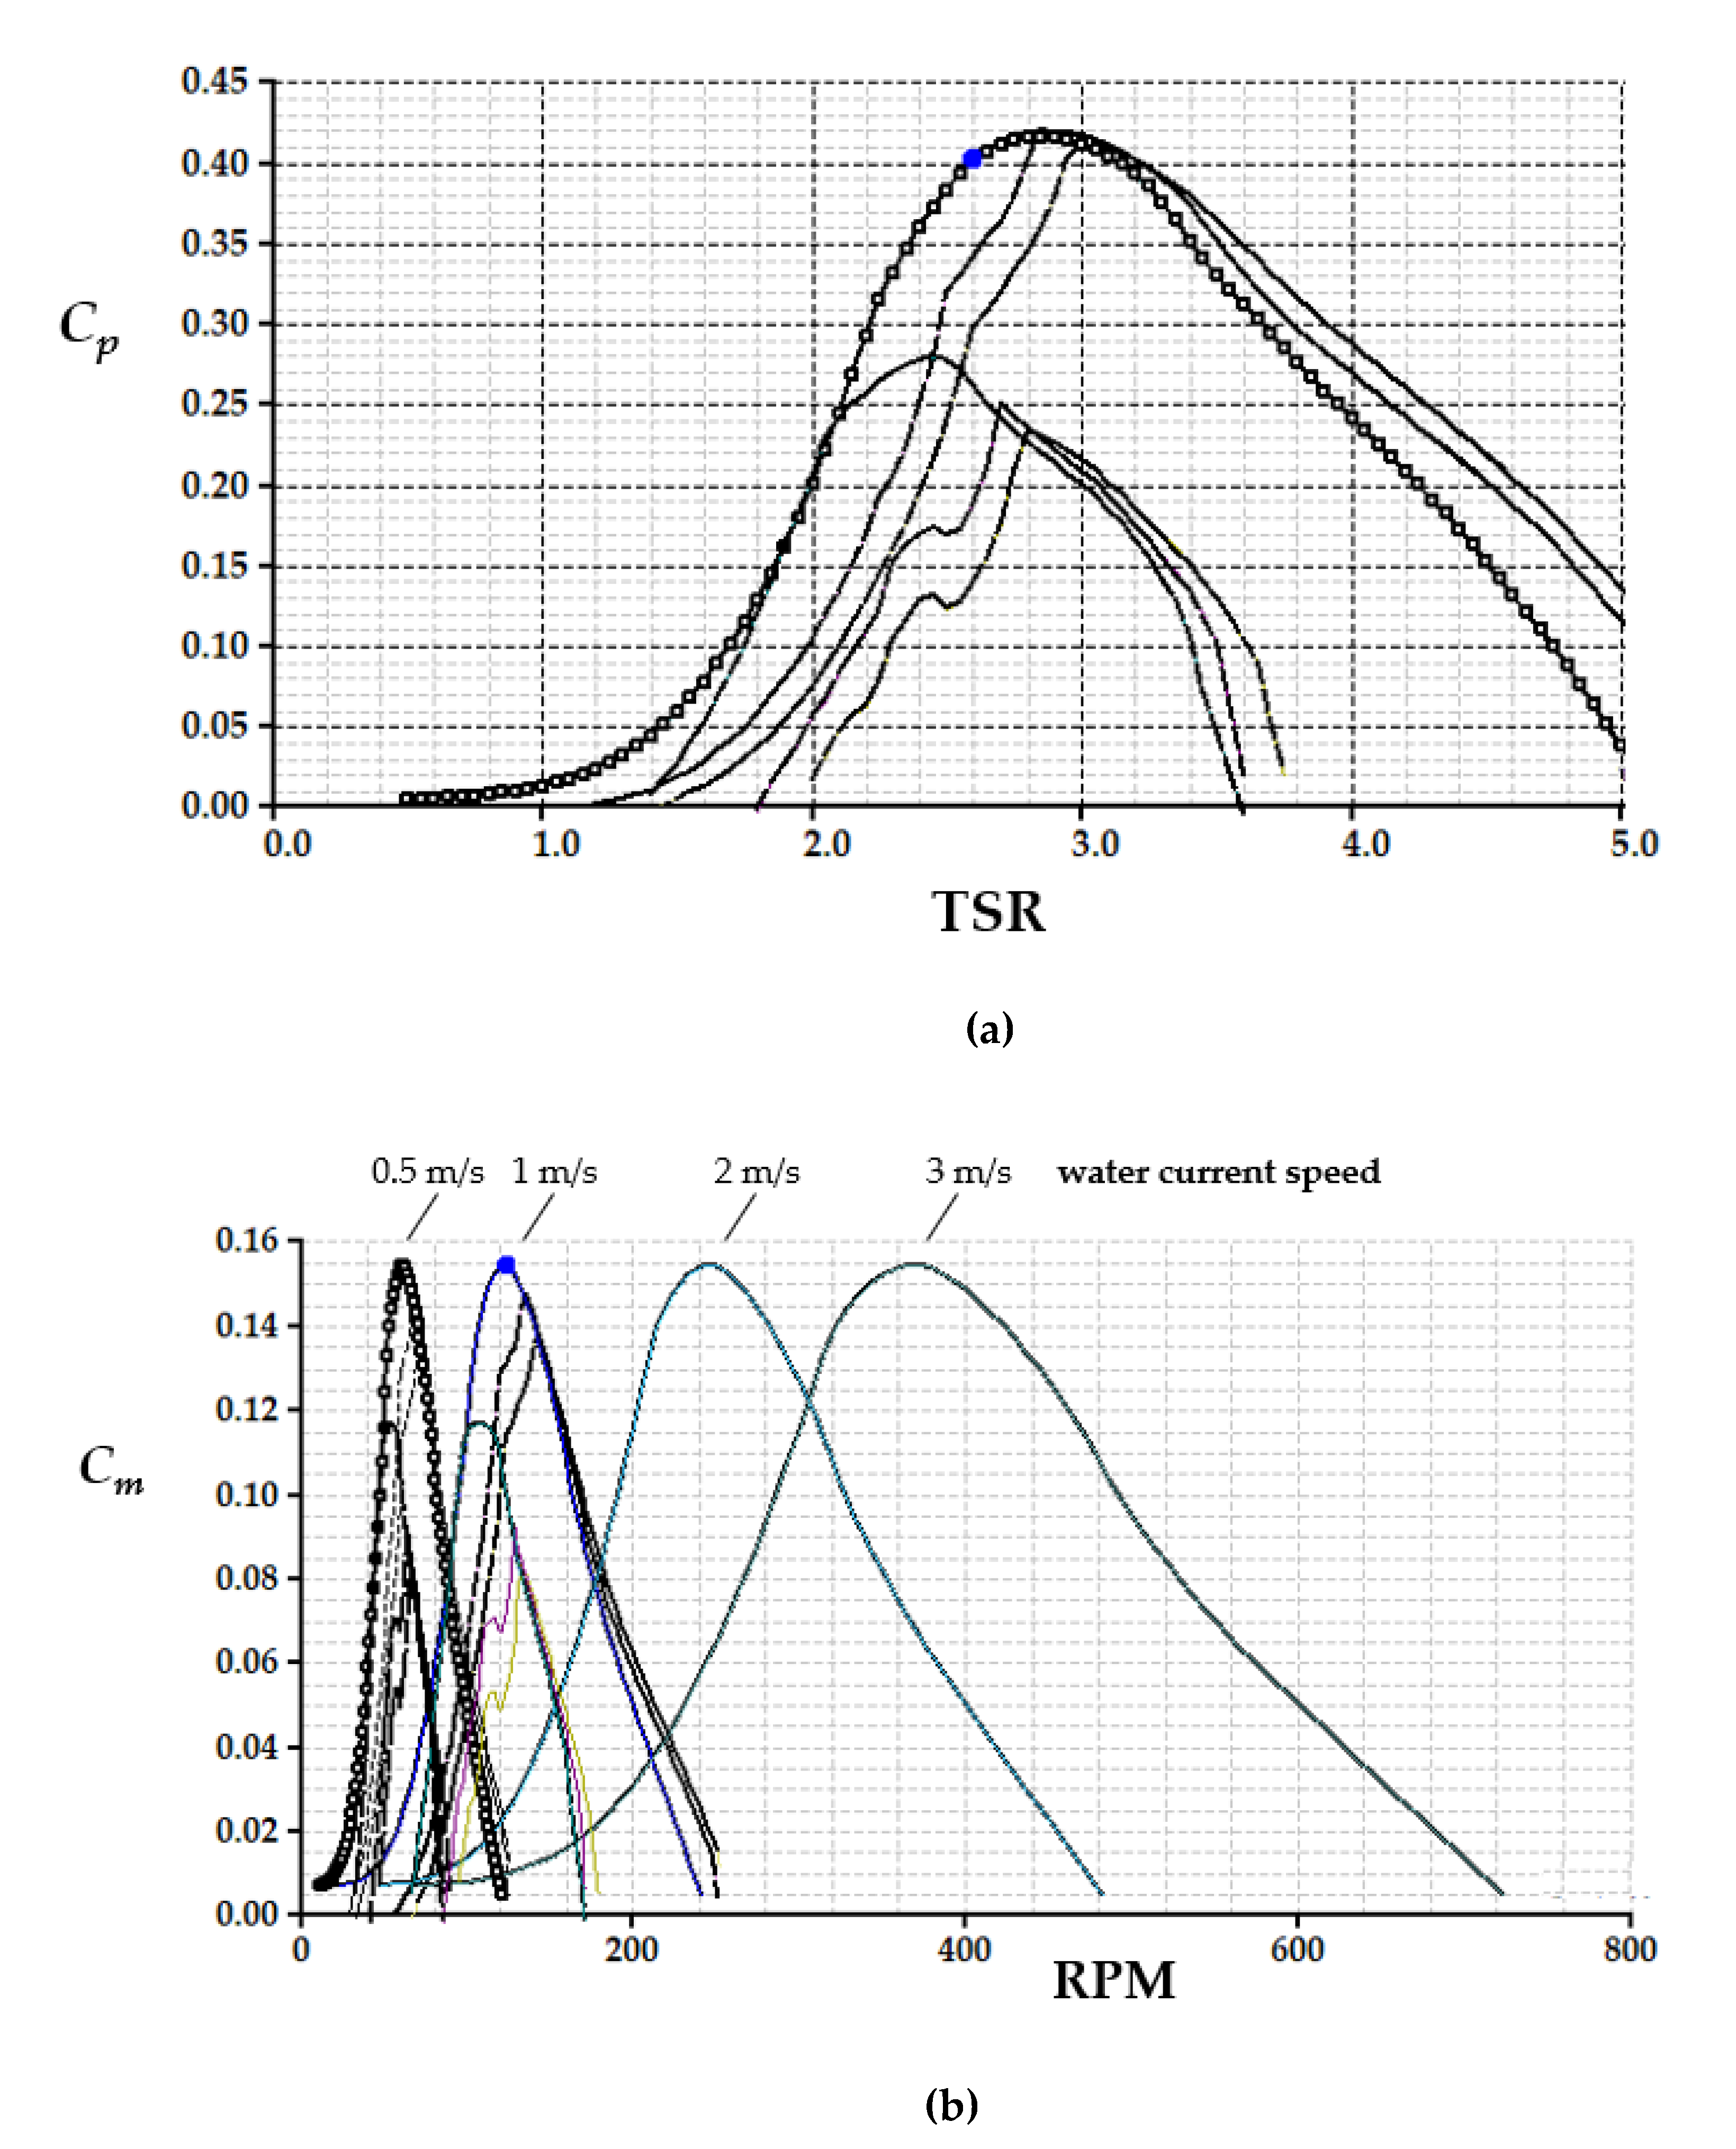

Table 3.
Performance characteristics of the final VAWT configuration.
| Current speed (m/s) |
Turbine RPM |
Turbine rotational speed (rad/s) |
Turbine Power (W) |
Turbine Torque (N·m) |
|---|---|---|---|---|
| 0.5 | 62 | 6.5 | 3 | 0.46 |
| 1.0 | 124 | 13.0 | 24 | 1.84 |
| 1.5 | 186 | 19.5 | 81 | 4.20 |
| 2.0 | 248 | 26.0 | 192 | 7.40 |
| 2.5 | 310 | 32.5 | 375 | 11.6 |
| 3.0 | 370 | 39.0 | 650 | 16.6 |
7. Performance Assessment
7.1. Hydrodynamic Performance of Buoy
The simulation of the buoy’s hydrodynamic behavior was performed using ANSYS AQWA, a specialized software widely adopted in the offshore engineering field for modeling the interaction between marine structures and environmental forces [40]. This platform is particularly effective in analyzing wave-induced motions and predicting the dynamic responses of floating bodies, making it highly suitable for wave energy converter studies [41]. In this analysis, the Hydrodynamic Diffraction module was used to compute the wave excitation forces—including both Froude–Krylov and diffraction components—based on linear wave theory. Additionally, the Response Analysis module was utilized to generate Response Amplitude Operators (RAOs), which provide insights into how the buoy responds at different wave frequencies and submergence depths [42]. These outputs were essential in identifying resonance zones, estimating natural periods, and optimizing the buoy's configuration for maximum efficiency under varying sea conditions.
7.1.1. Wave and Fluid Properties
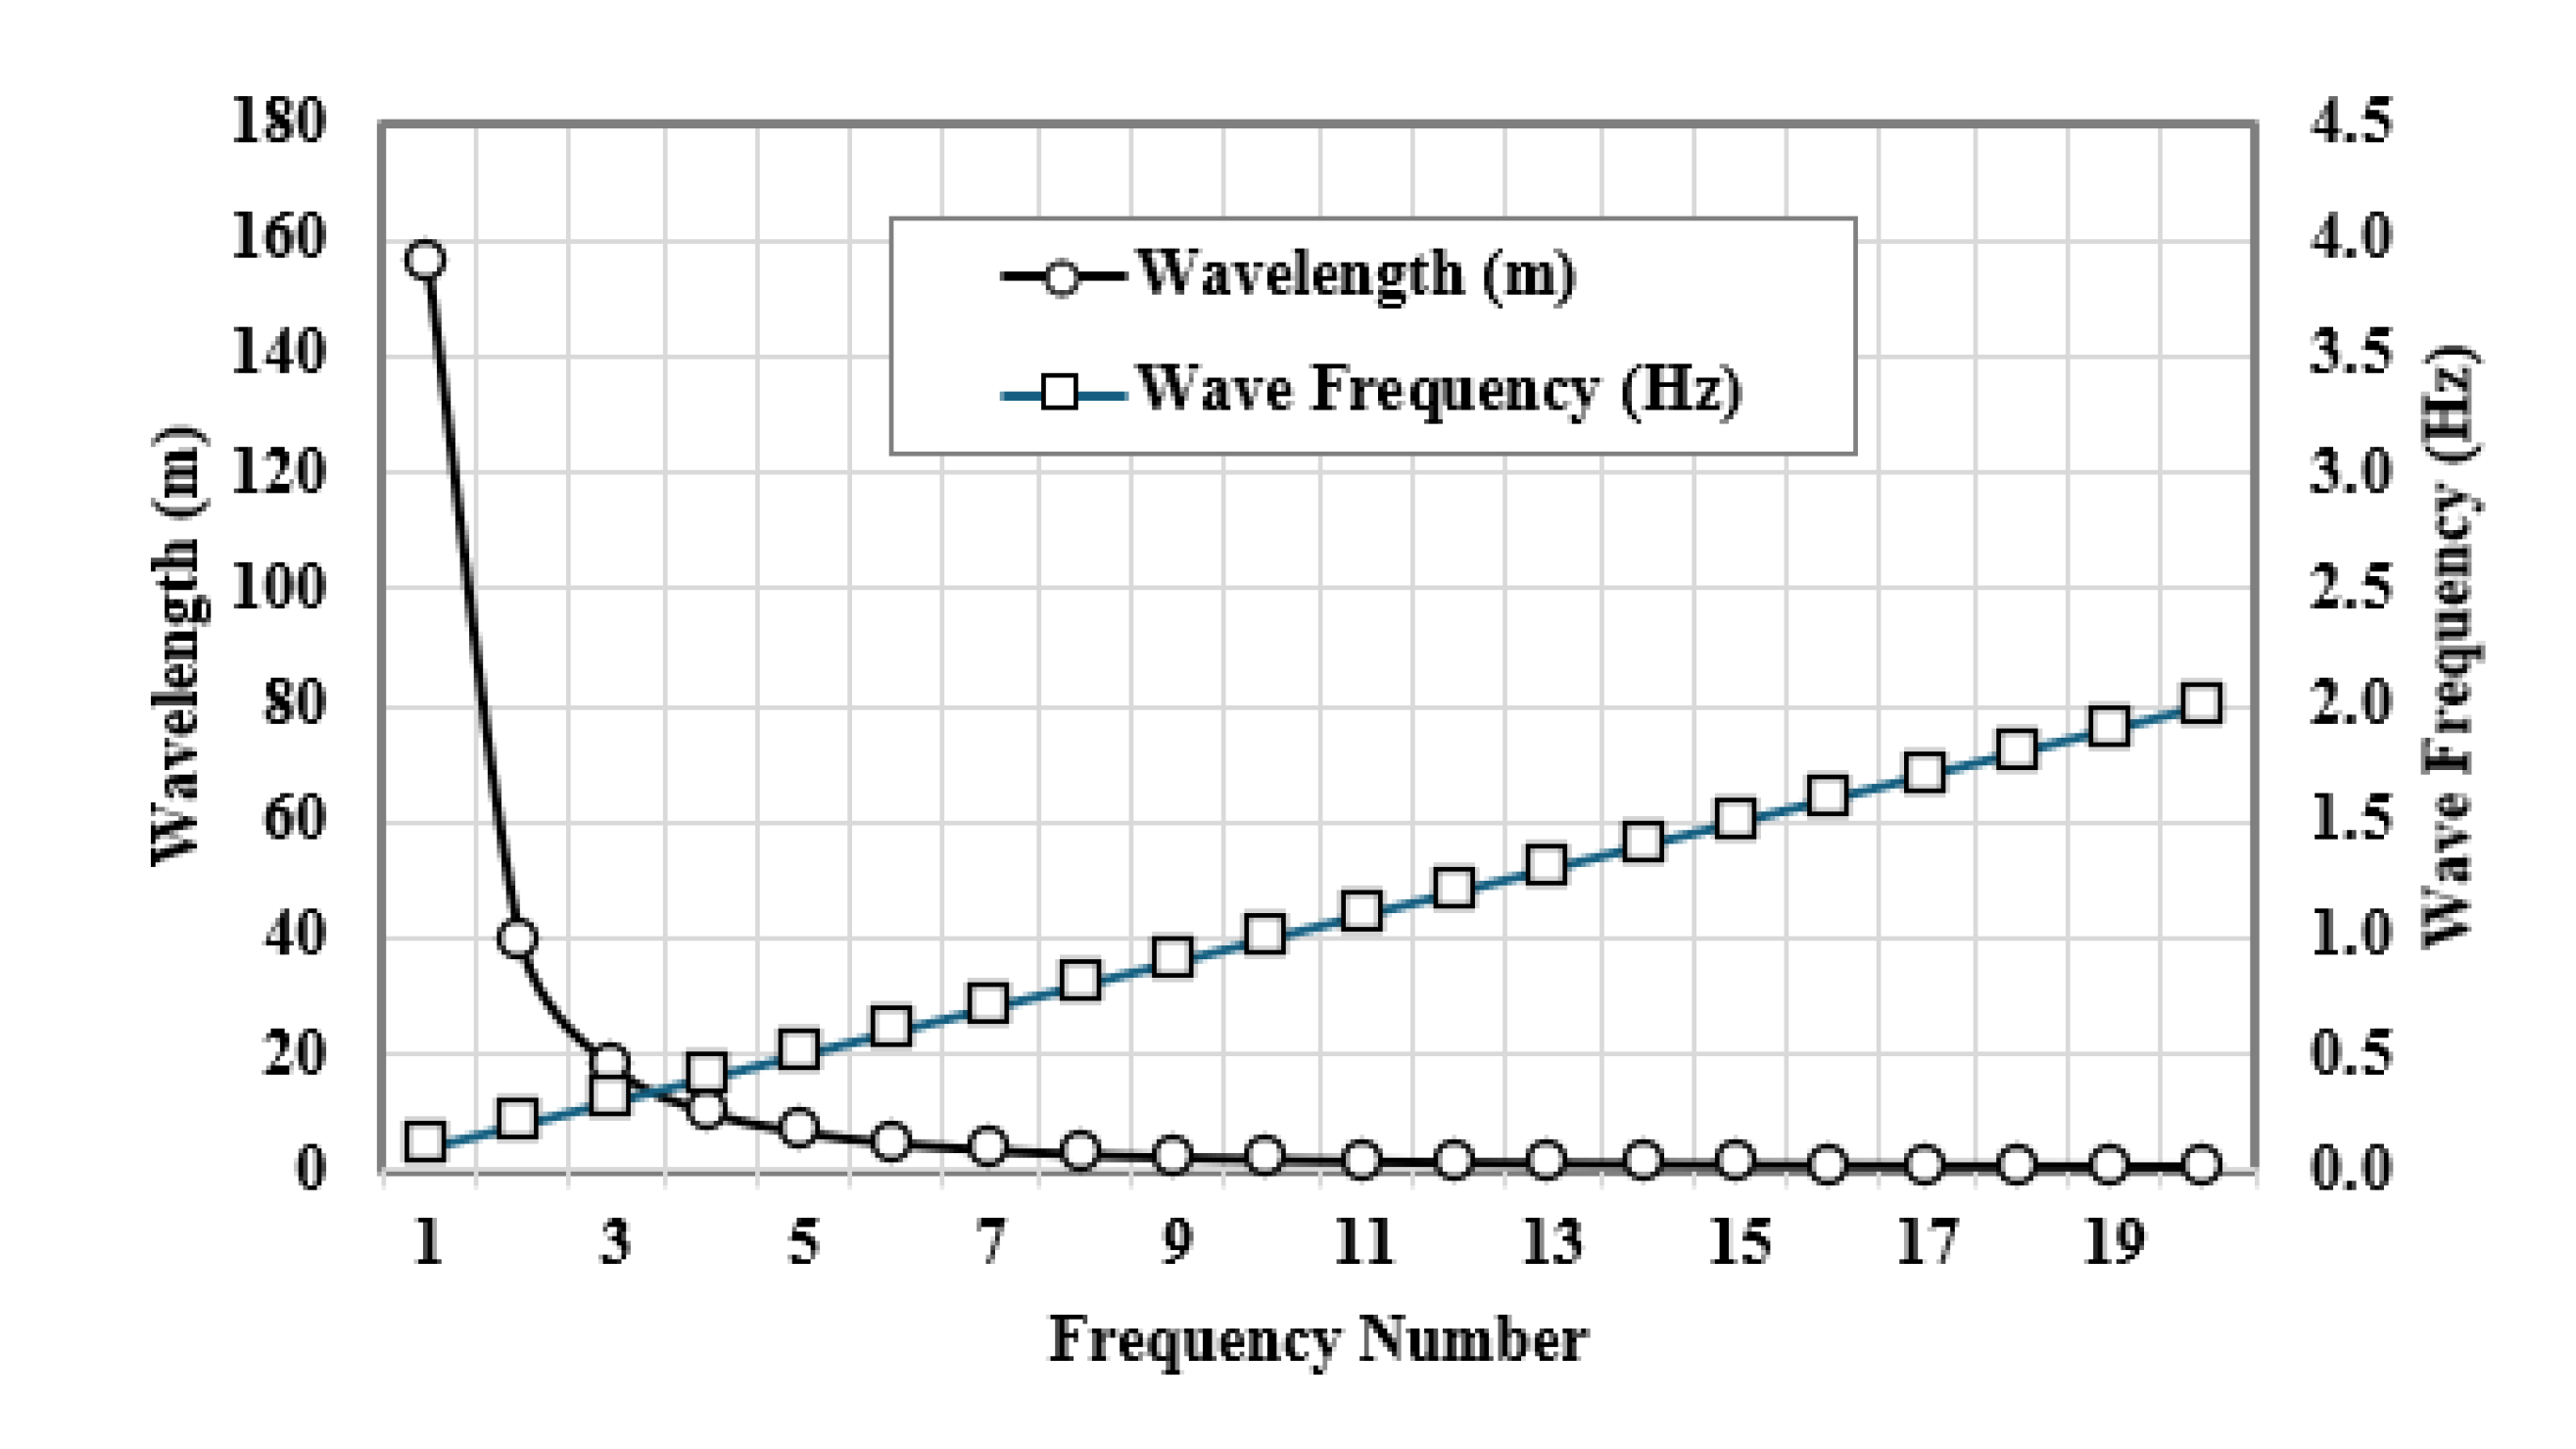
A representative wave profile was defined, using a sinusoidal wave with an amplitude of 0.1 m. The sea water density was set to 1025 kg/m³ along with a water depth of 100 m and water area of 1.02 m × 0.91 m. Wave frequency was varied to study the response under different conditions from 0.1 to 2 Hz corresponding to 10 s and 0.5 s periods, respectively. Figure 15 shows plots of wave frequencies and corresponding wavelengths as a function of frequency number based on the hydrodynamic diffraction analysis for a water depth of 100 m.
Figure 10.
Wave frequencies and corresponding wavelengths based on the hydrodynamic diffraction analysis for a water depth of 100 m.
Figure 10.
Wave frequencies and corresponding wavelengths based on the hydrodynamic diffraction analysis for a water depth of 100 m.
7.1.2. Mesh Analysis
To ensure accurate simulation results, a structured mesh was generated with an element size of 0.02 m based on grid sensitivity analysis considering suitability for capturing the intricate fluid-structure interactions between the sea waves and the buoy, computational efficiency and result accuracy. The final mesh is made up of 1240 hexahedral elements adapted to the buoy's geometry and the surrounding fluid domain. Figure 16 shows ANSYS AQWA simulation of the pressure distribution as head of water on the buoy surface and the mesh.
Figure 11.
Pressure distribution simulation using ANSYS AQWA.
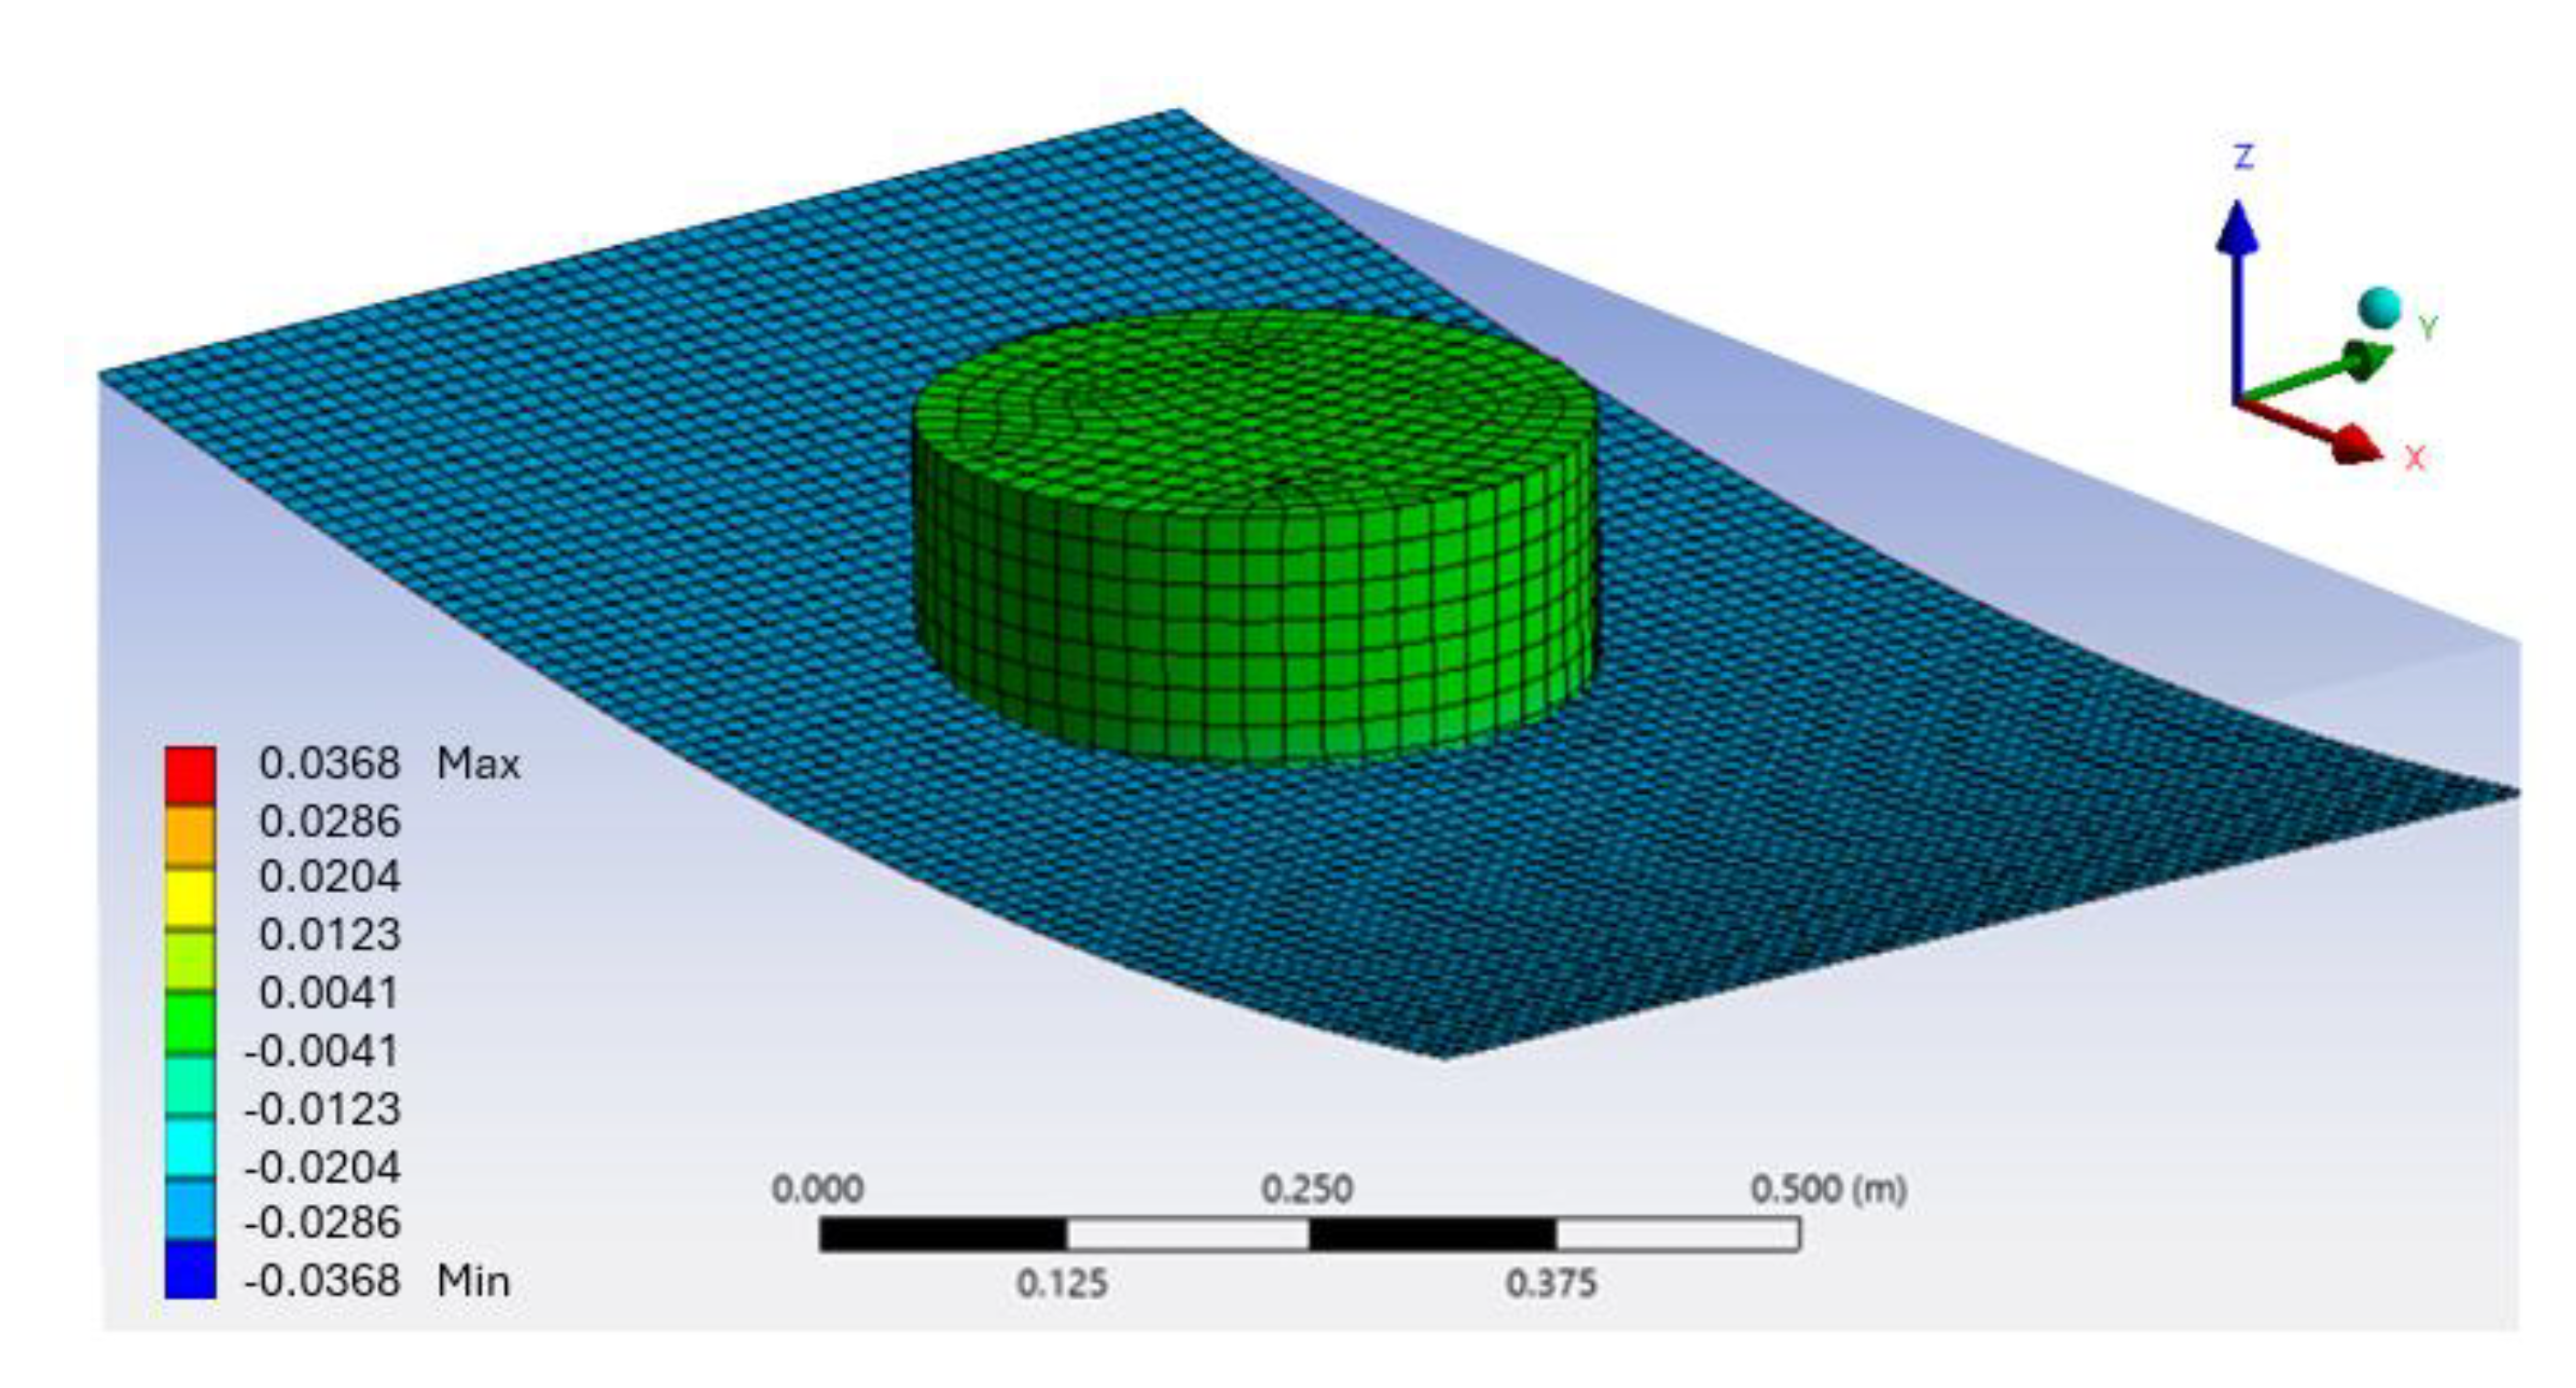
Figure 12.
Diffraction and Froude–Krylov forces acting on the buoy.
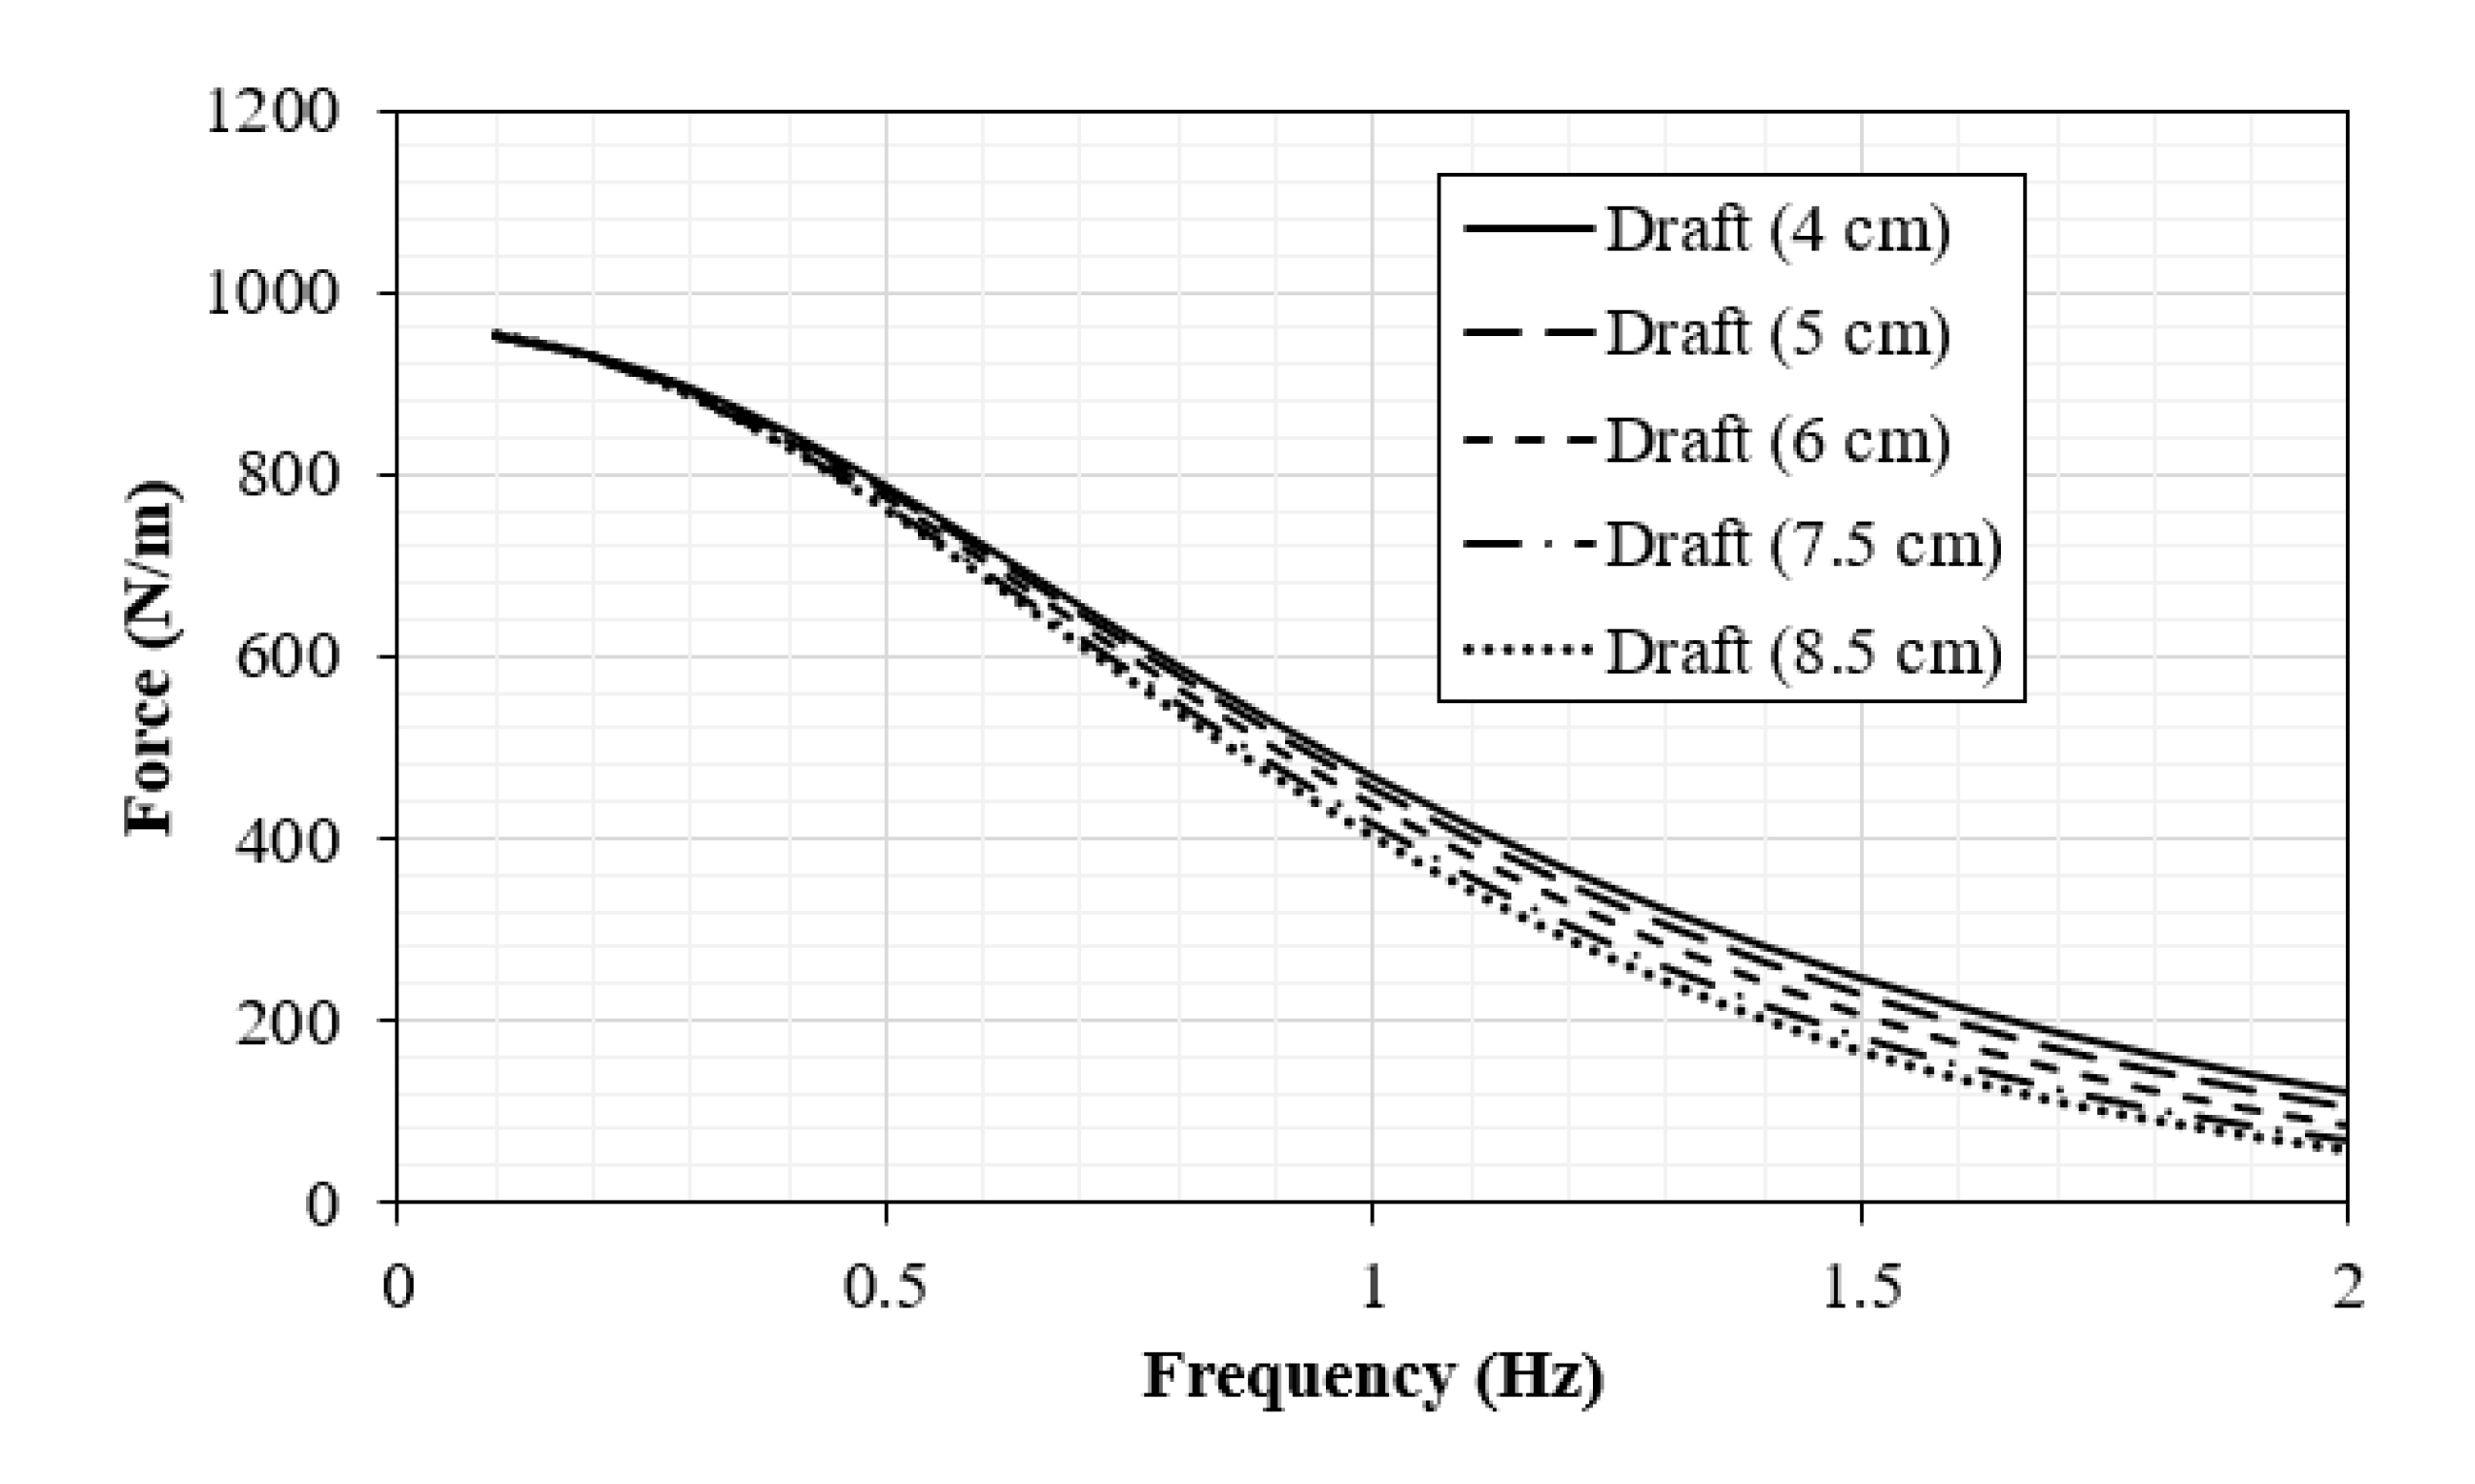
Figure 17 shows a comparison of the diffraction forces and Froude–Krylov forces experienced by the buoy for different drafts under identical wave conditions. The results indicate that these forces decrease as the wave frequency increases, which is typical since low-frequency (longer) waves apply more force. For the cases considered, the 4 cm draft experiences the highest force, indicating stronger interaction with longer waves.
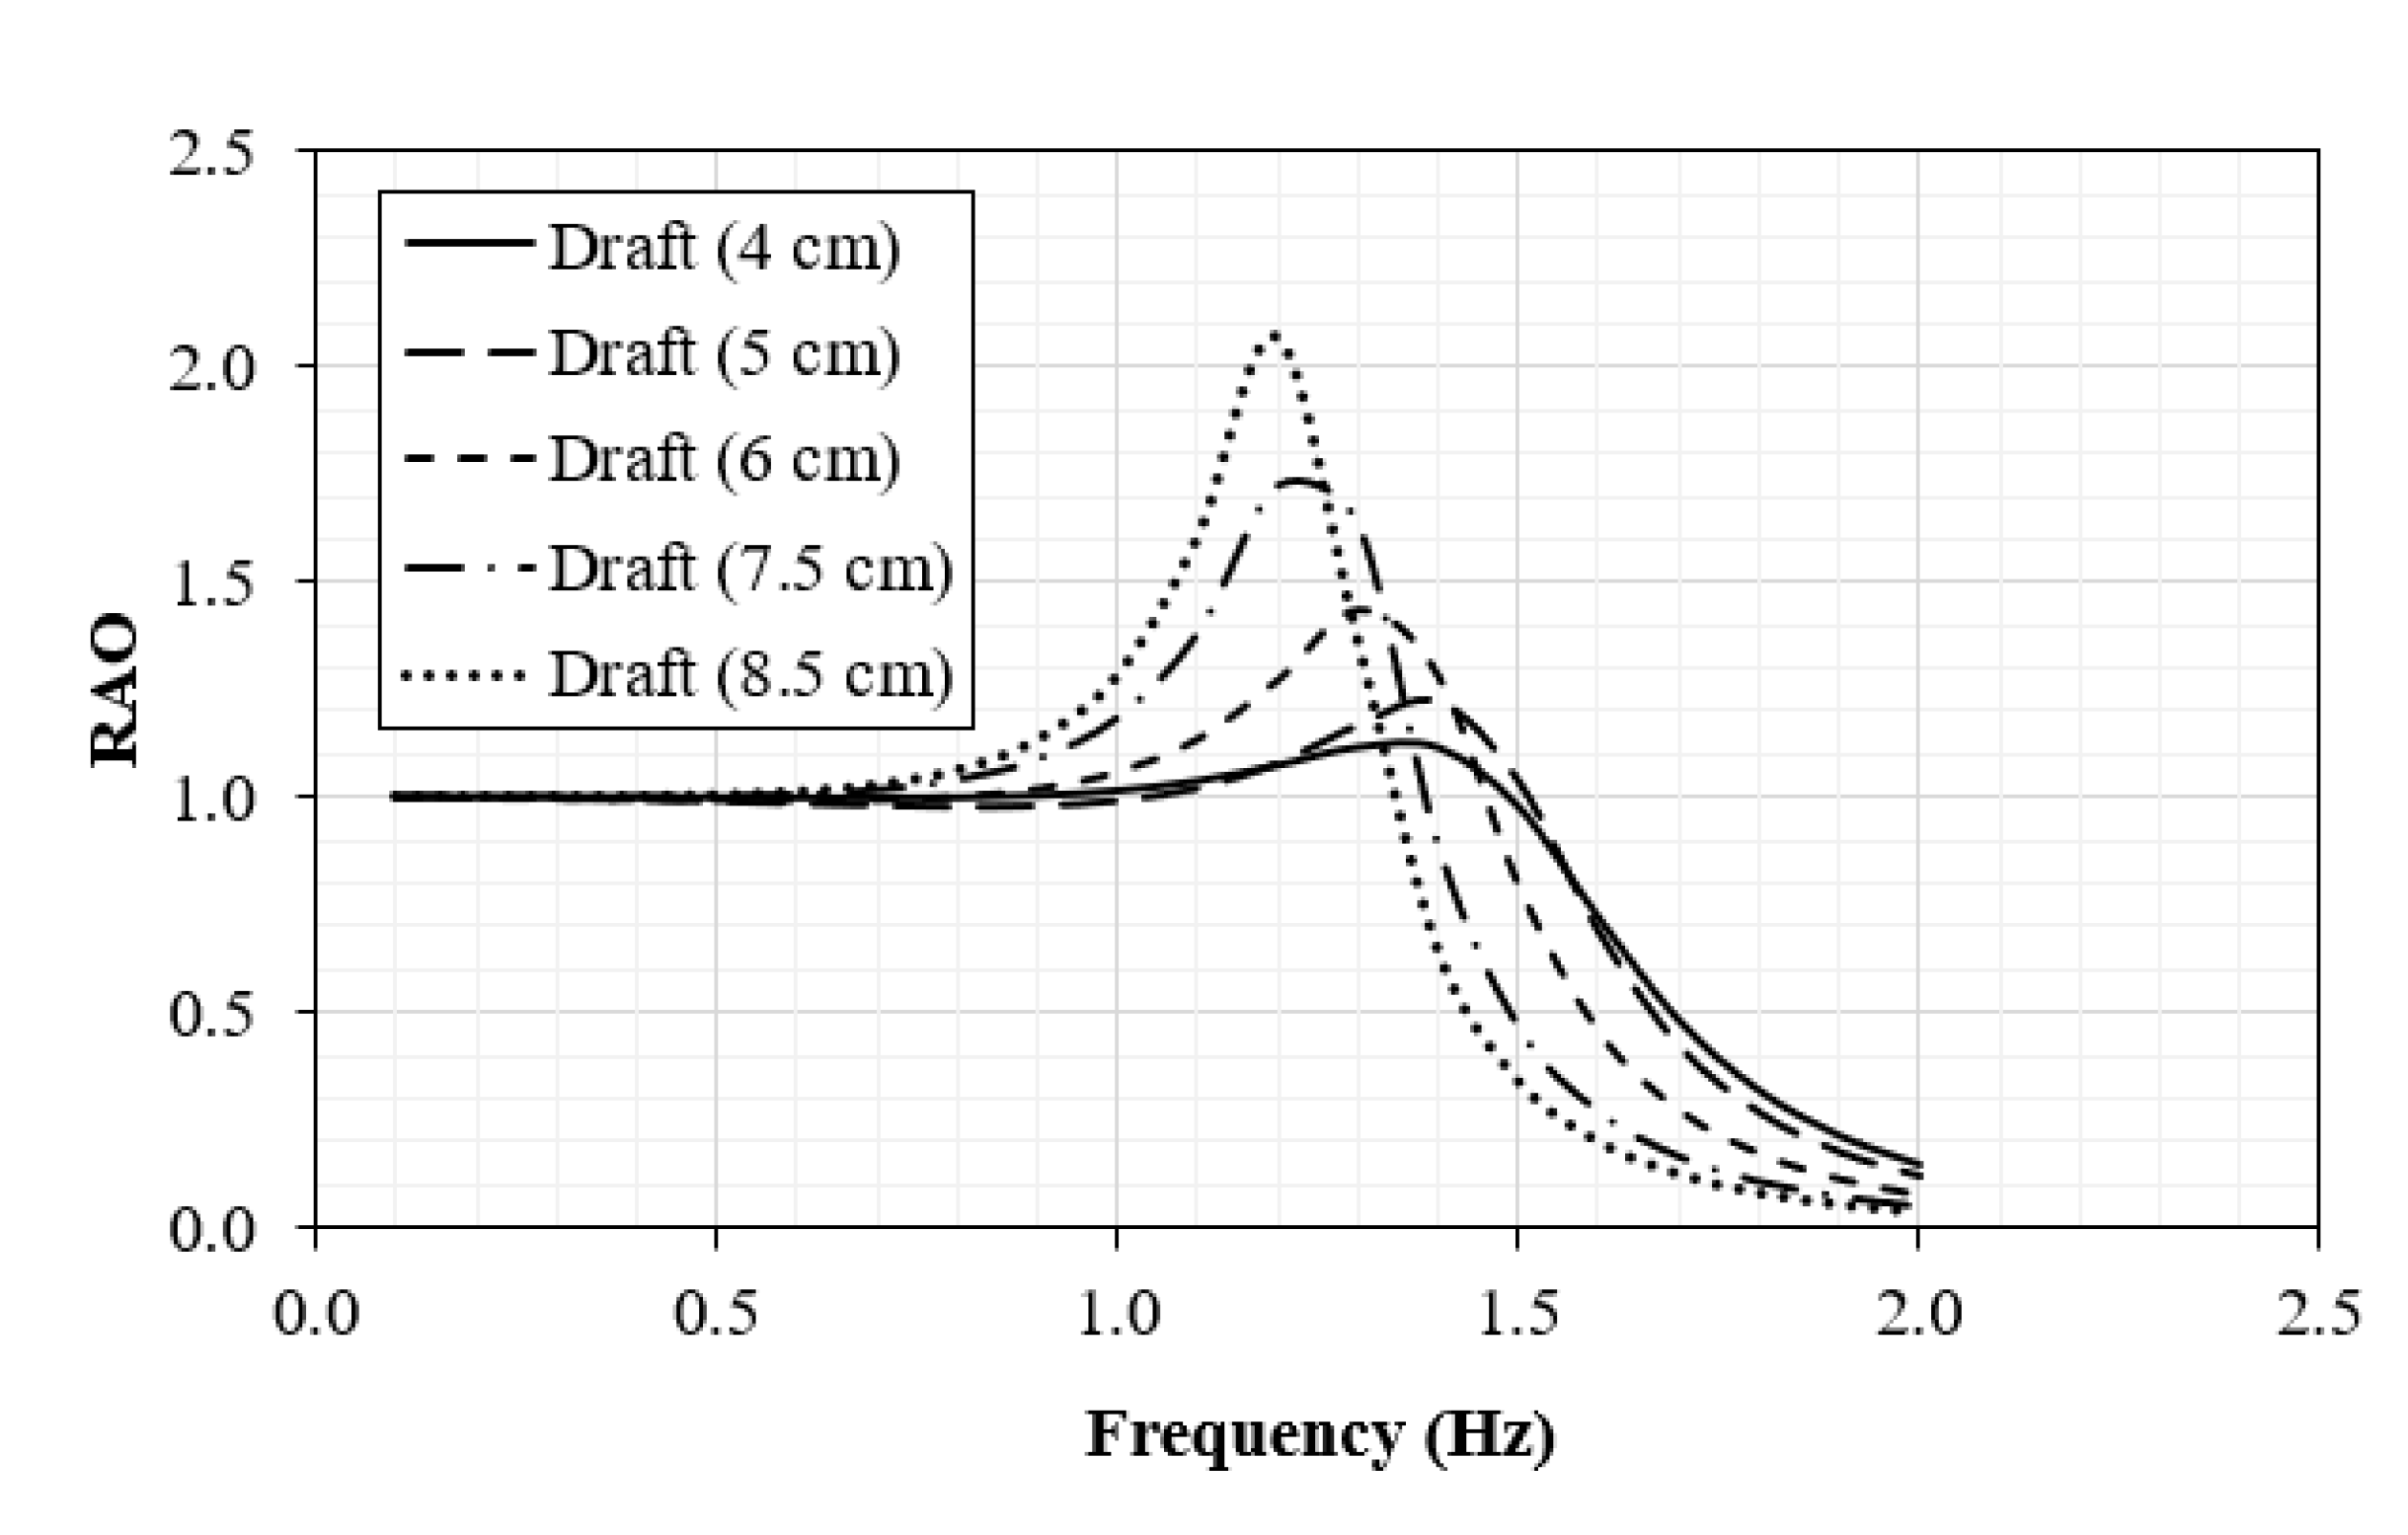
Figure 18 shows a comparison of the Response Amplitude Operators (RAOs) of the buoy for different drafts under identical wave conditions. By comparing their RAO curves, we can observe how buoy geometry and draft affect its motion behavior as a results of wave excitation at different frequencies. This helps identify which design is more responsive or stable across various sea states, supporting better performance in wave energy applications. The buoy, evaluated across drafts from 4 cm to 8.5 cm, exhibits clear resonance behavior near 1.2 Hz, with the 7.5 cm draft producing the highest RAO value, indicating its natural frequency aligns closely with the incoming wave energy at that point. As the draft increases, the peak shifts slightly and the RAO magnitude decreases, showing the damping effect of greater submergence. The curve flattens more quickly for shallower drafts beyond the peak, reflecting reduced sensitivity to higher frequencies.
Figure 13.
Heave RAO of the first buoy.
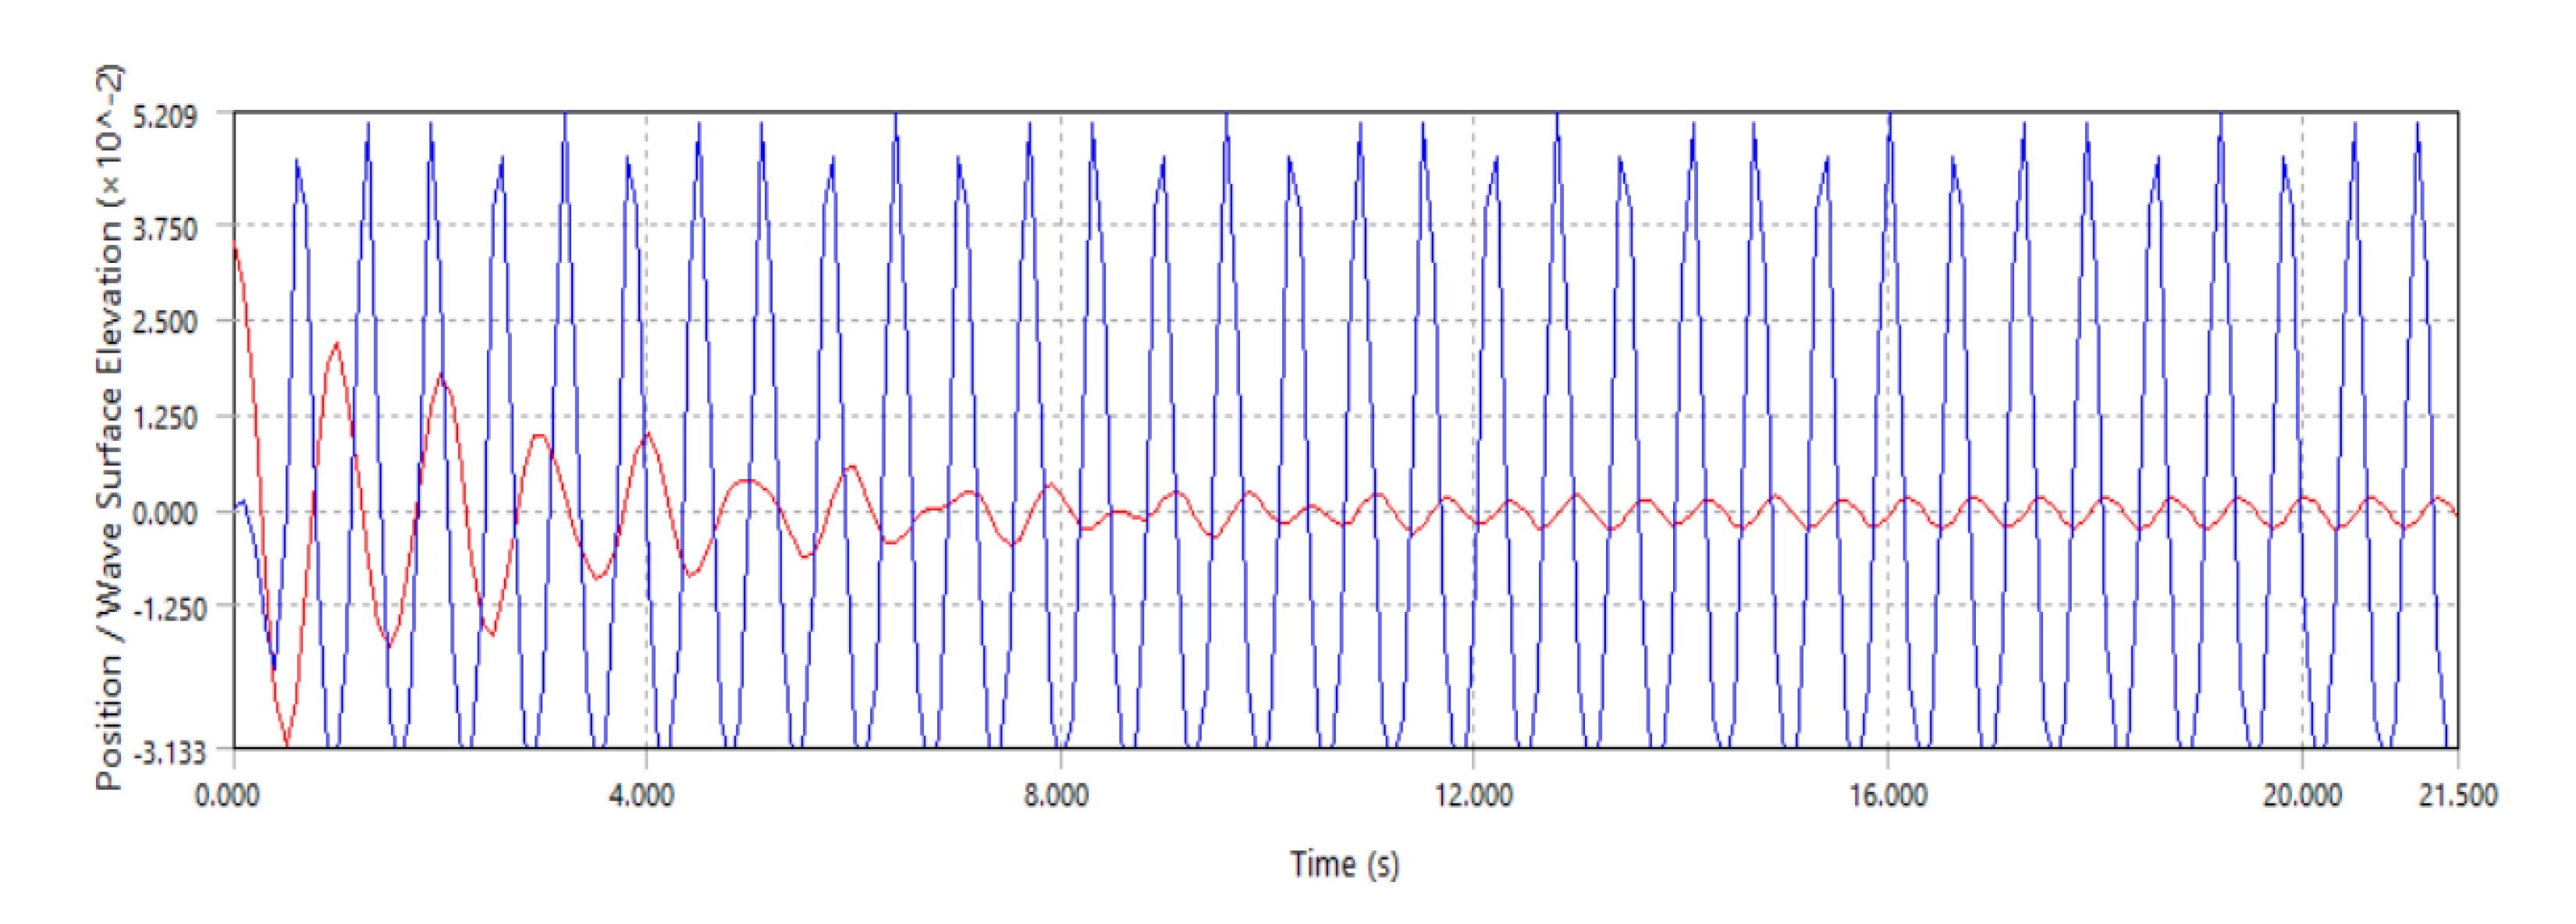
In order to assess the buoy's dynamic reaction under wave excitation, this part compares the buoy's heave motion with the wave elevation. The time-series plot of the buoy heave motion under incident waves with periods of (5 s, 0.9 s, and 0.64 s) is shown in Figure 19, Figure 20 and Figure 21. These wave periods were carefully selected to observe the buoy behavior in three different motion types: dominated by inertia, by stiffness, and at resonance. As expected, and as confirmed by the RAO analysis, the buoy shows a much larger response during the resonant period (0.9 s) compared to the wave height. At lower frequencies, the buoy follows the shape of the waves closely, while at higher frequencies, its movement becomes exceedingly small.
Figure 19.
Response in heave for an incoming regular wave with period T = 5 s. The red line represents the heave motion, and the blue line is the wave elevation.
Figure 19.
Response in heave for an incoming regular wave with period T = 5 s. The red line represents the heave motion, and the blue line is the wave elevation.
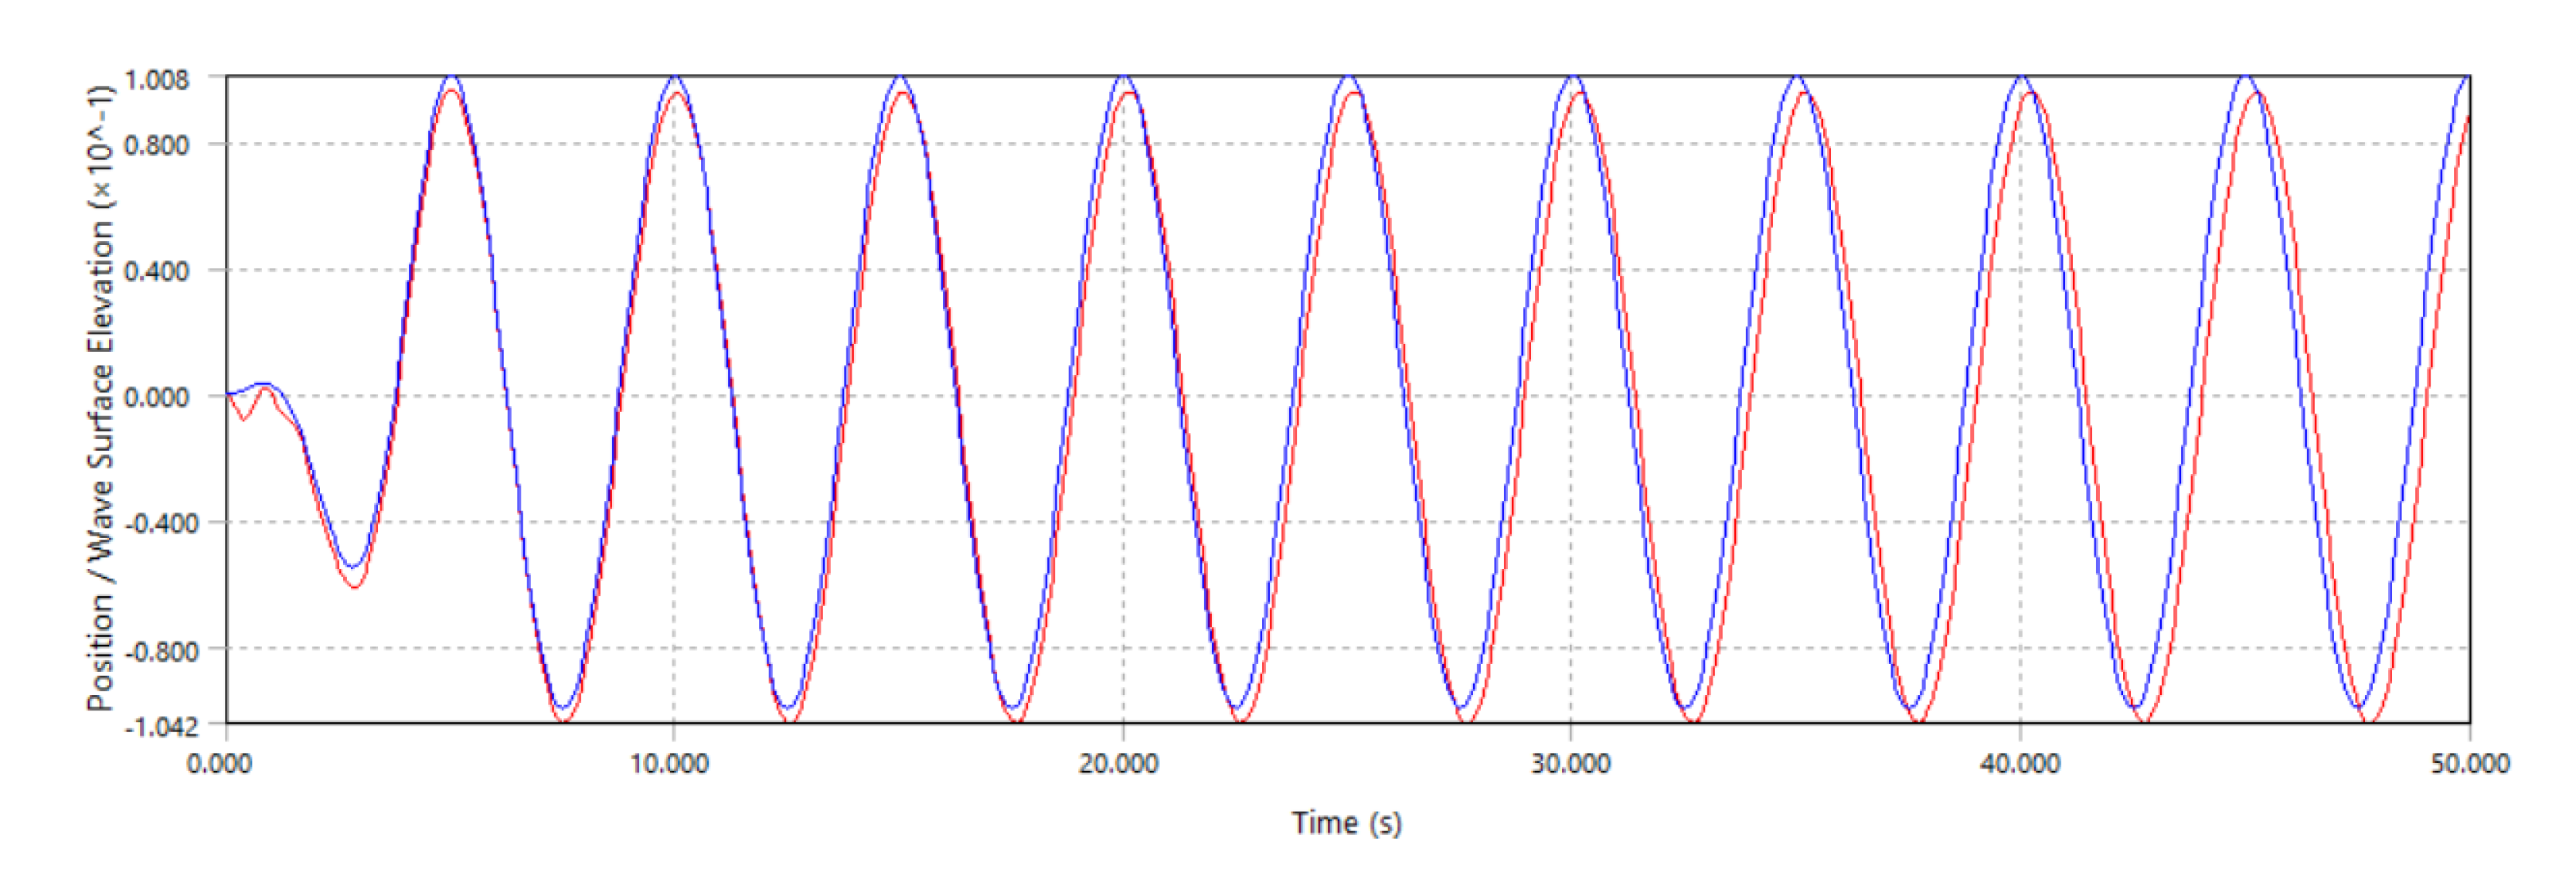
Figure 14.
Response in heave for an incoming regular wave with period T = 0.9 s. The red line represents the heave motion, and the blue line is the wave elevation.
Figure 14.
Response in heave for an incoming regular wave with period T = 0.9 s. The red line represents the heave motion, and the blue line is the wave elevation.
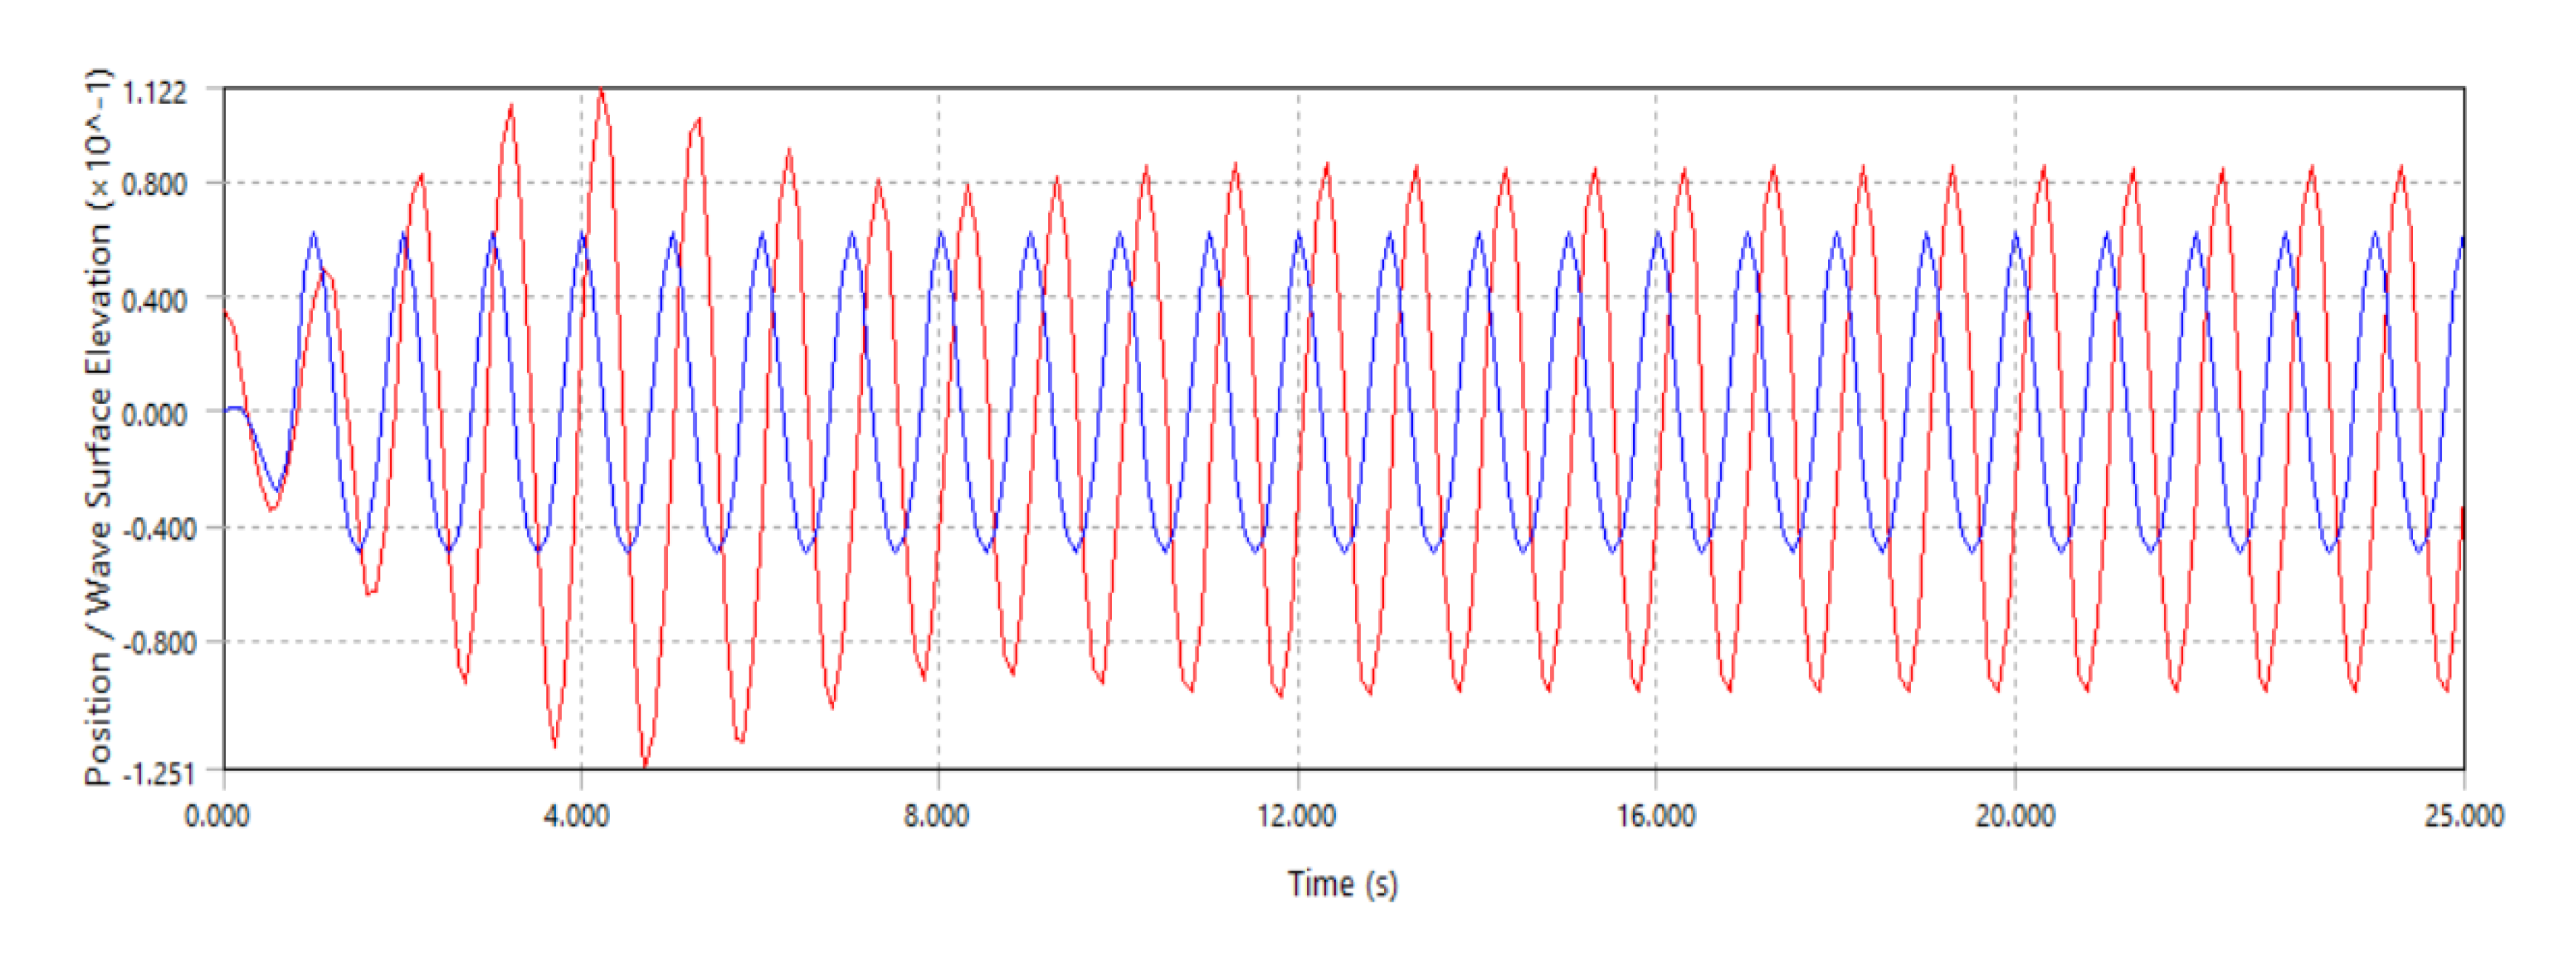
Figure 21.
Response in heave for an incoming regular wave with period T = 0.64 s. The red line represents the heave motion, and the blue line is the wave elevation.
Figure 21.
Response in heave for an incoming regular wave with period T = 0.64 s. The red line represents the heave motion, and the blue line is the wave elevation.
7.2. In-Situ Experimental Tests and Validation
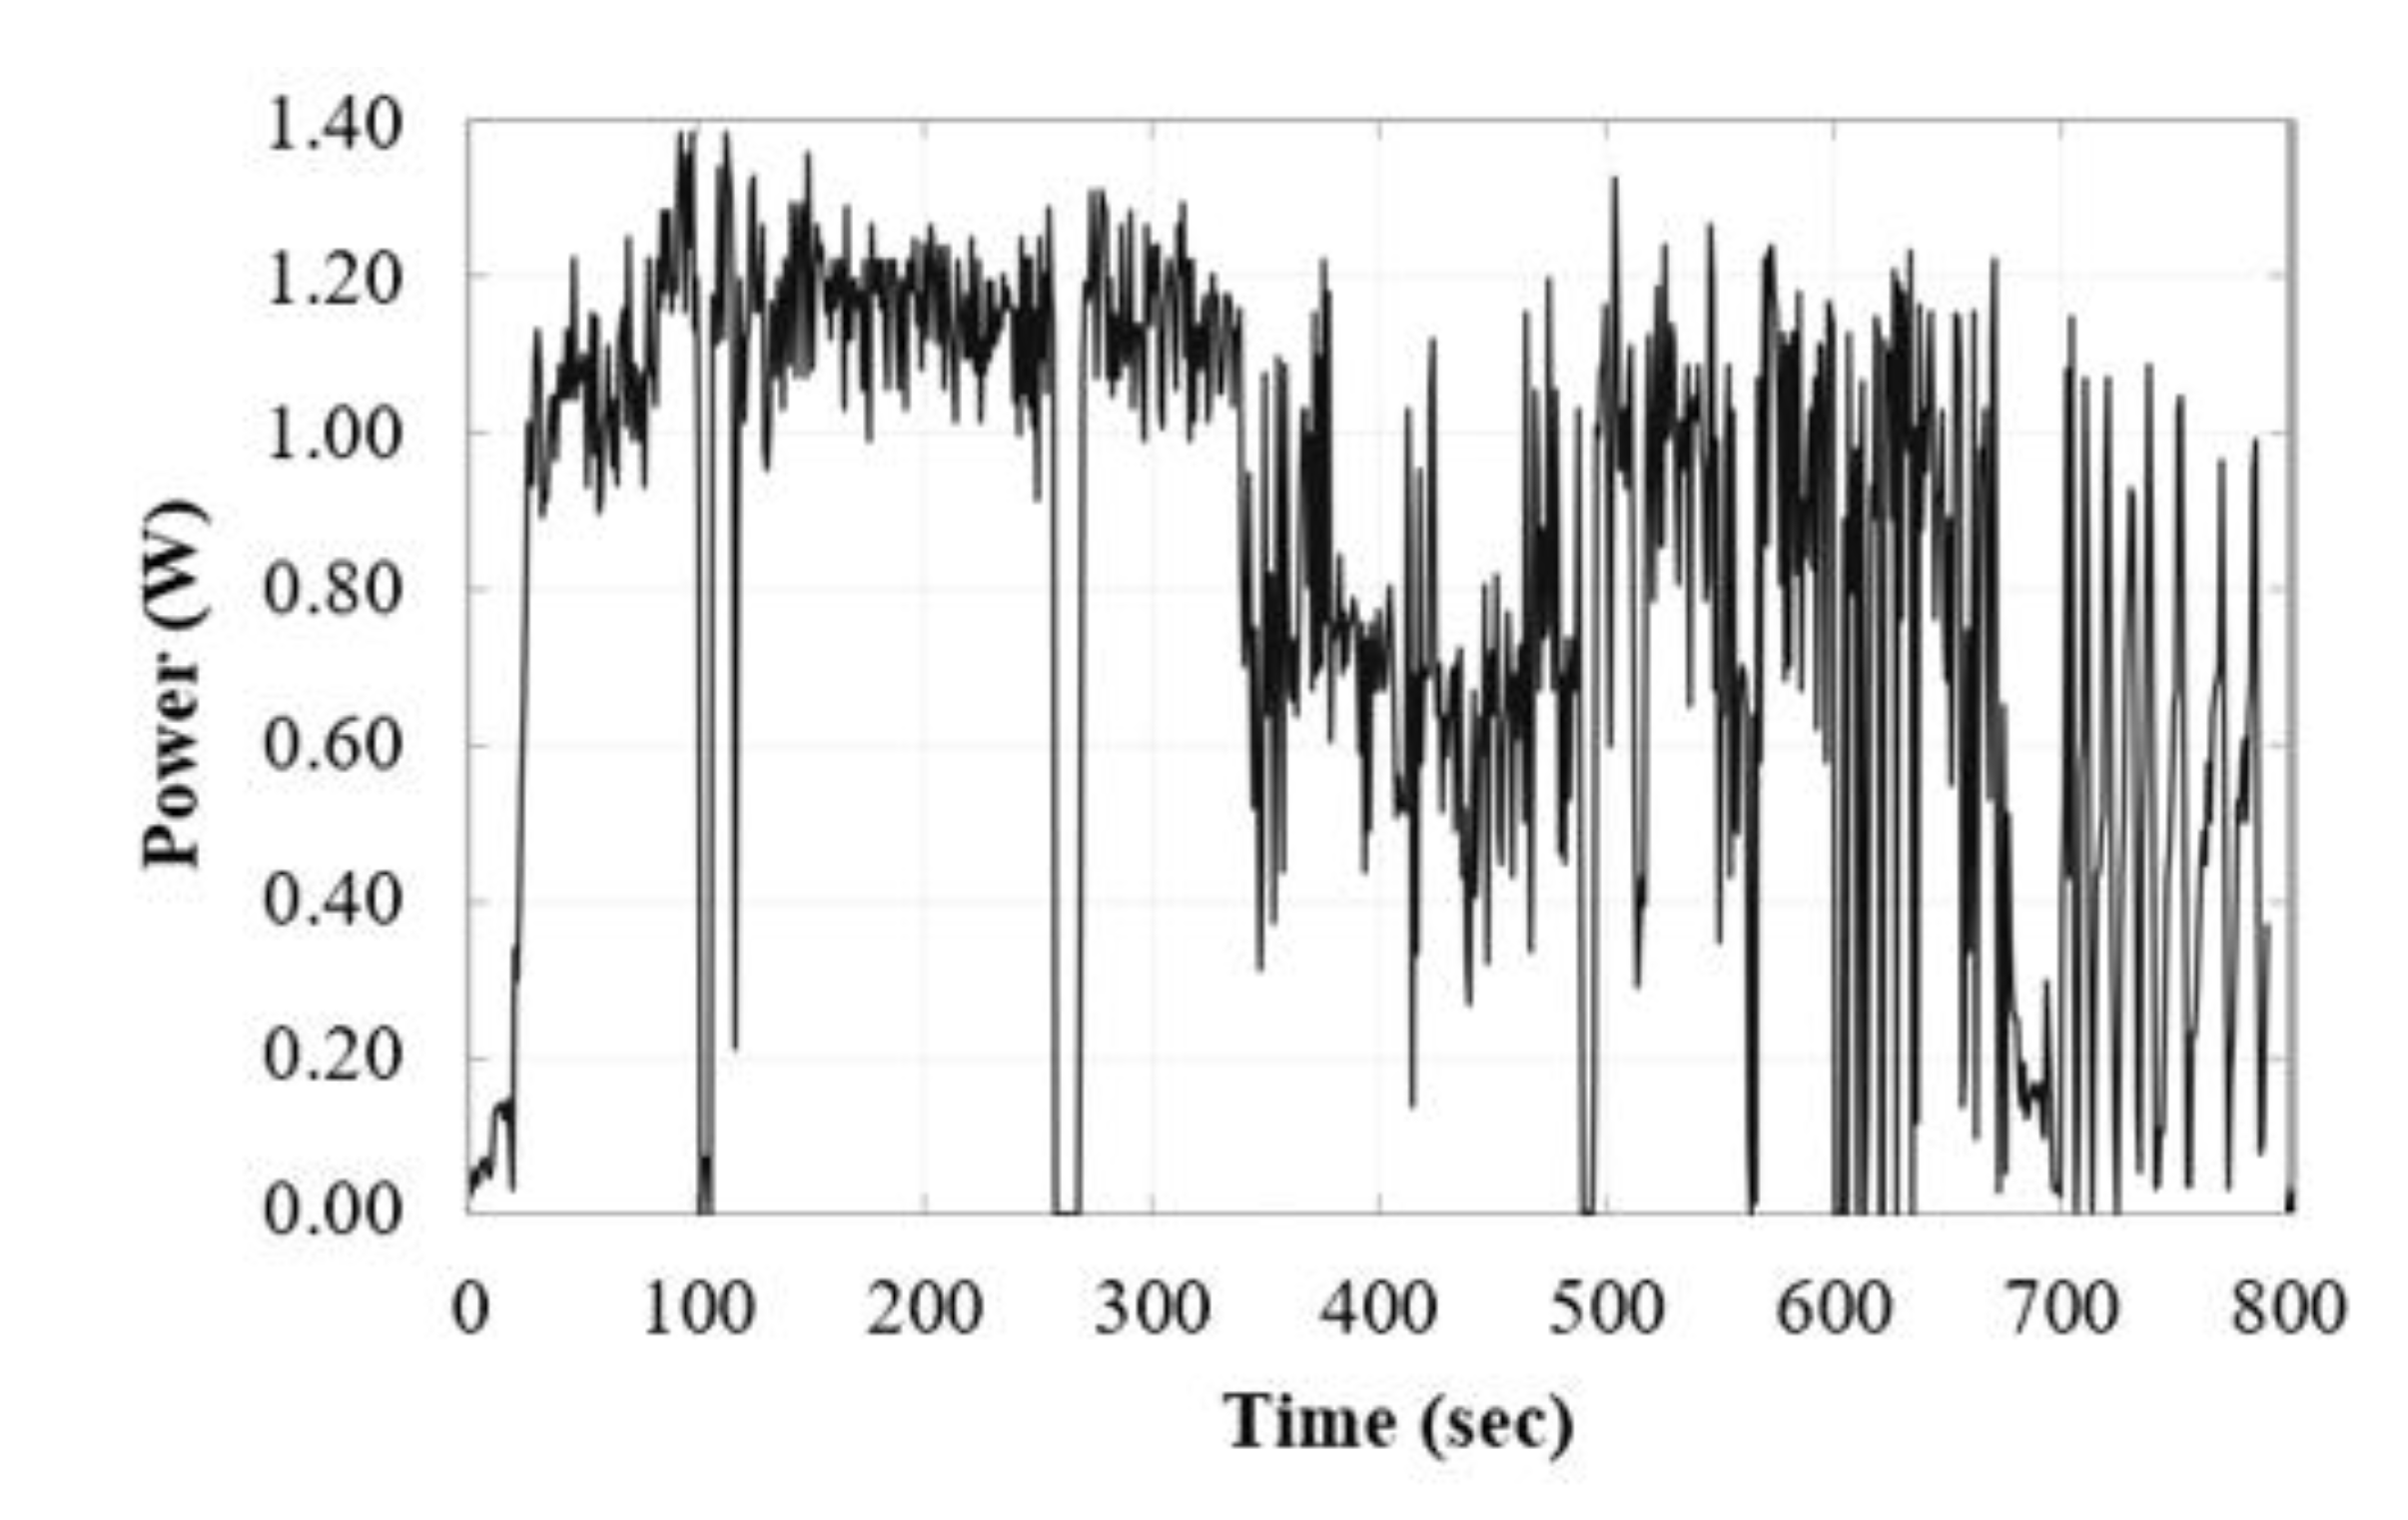
In this section, measurements from in-situ test are presented. Table 4 lists the buoy mass, the buoy submergence and the wave frequency recorded during the test. The RMS value of velocity was determined from the ANSYS AQWA simulation. Figure 22 shows the plot of the measured power from the in-situ test where on average the system is generating approximately 0.72 W of power at the buoy rpm of 30 corresponding to the 0.5 Hz wave frequency.
Table 3.
Buoy in-situ test and corresponding simulation data.
| Mass (kg) | Submergence (m) | Amplitude (m) | Frequency (Hz) | RMS Velocity (m/s) |
|---|---|---|---|---|
| 5 | 0.06 | 0.20 | 0.500 | 0.444 |
Figure 22.
Power measurement data from in-situ test.
To validate the system's power output, the voltage and current measurements were compared with the performance data of an off-the-shelf generator available in the market. The generator chosen in this case was the Dunkermotoren model GR 63x25 24V rated at 48.4 W at 3300 rpm. This generator’s performance was measured using the same Arduino-based data acquisition setup. In this case, a power drill was used to rotate the generator shaft. A marker was taped to the hand drill for taking rpm measurements using a video camera. The Tracker software was used to correlate the current and voltage measurements to the recorded rpm values. Figure 23 presents the measured and interpolated voltage, and current output of the Dunkermotoren generator model GR 63x25 at different rpms.
Figure 15.
Voltage and current measurement of Dunkermotoren generator model GR 63x25.
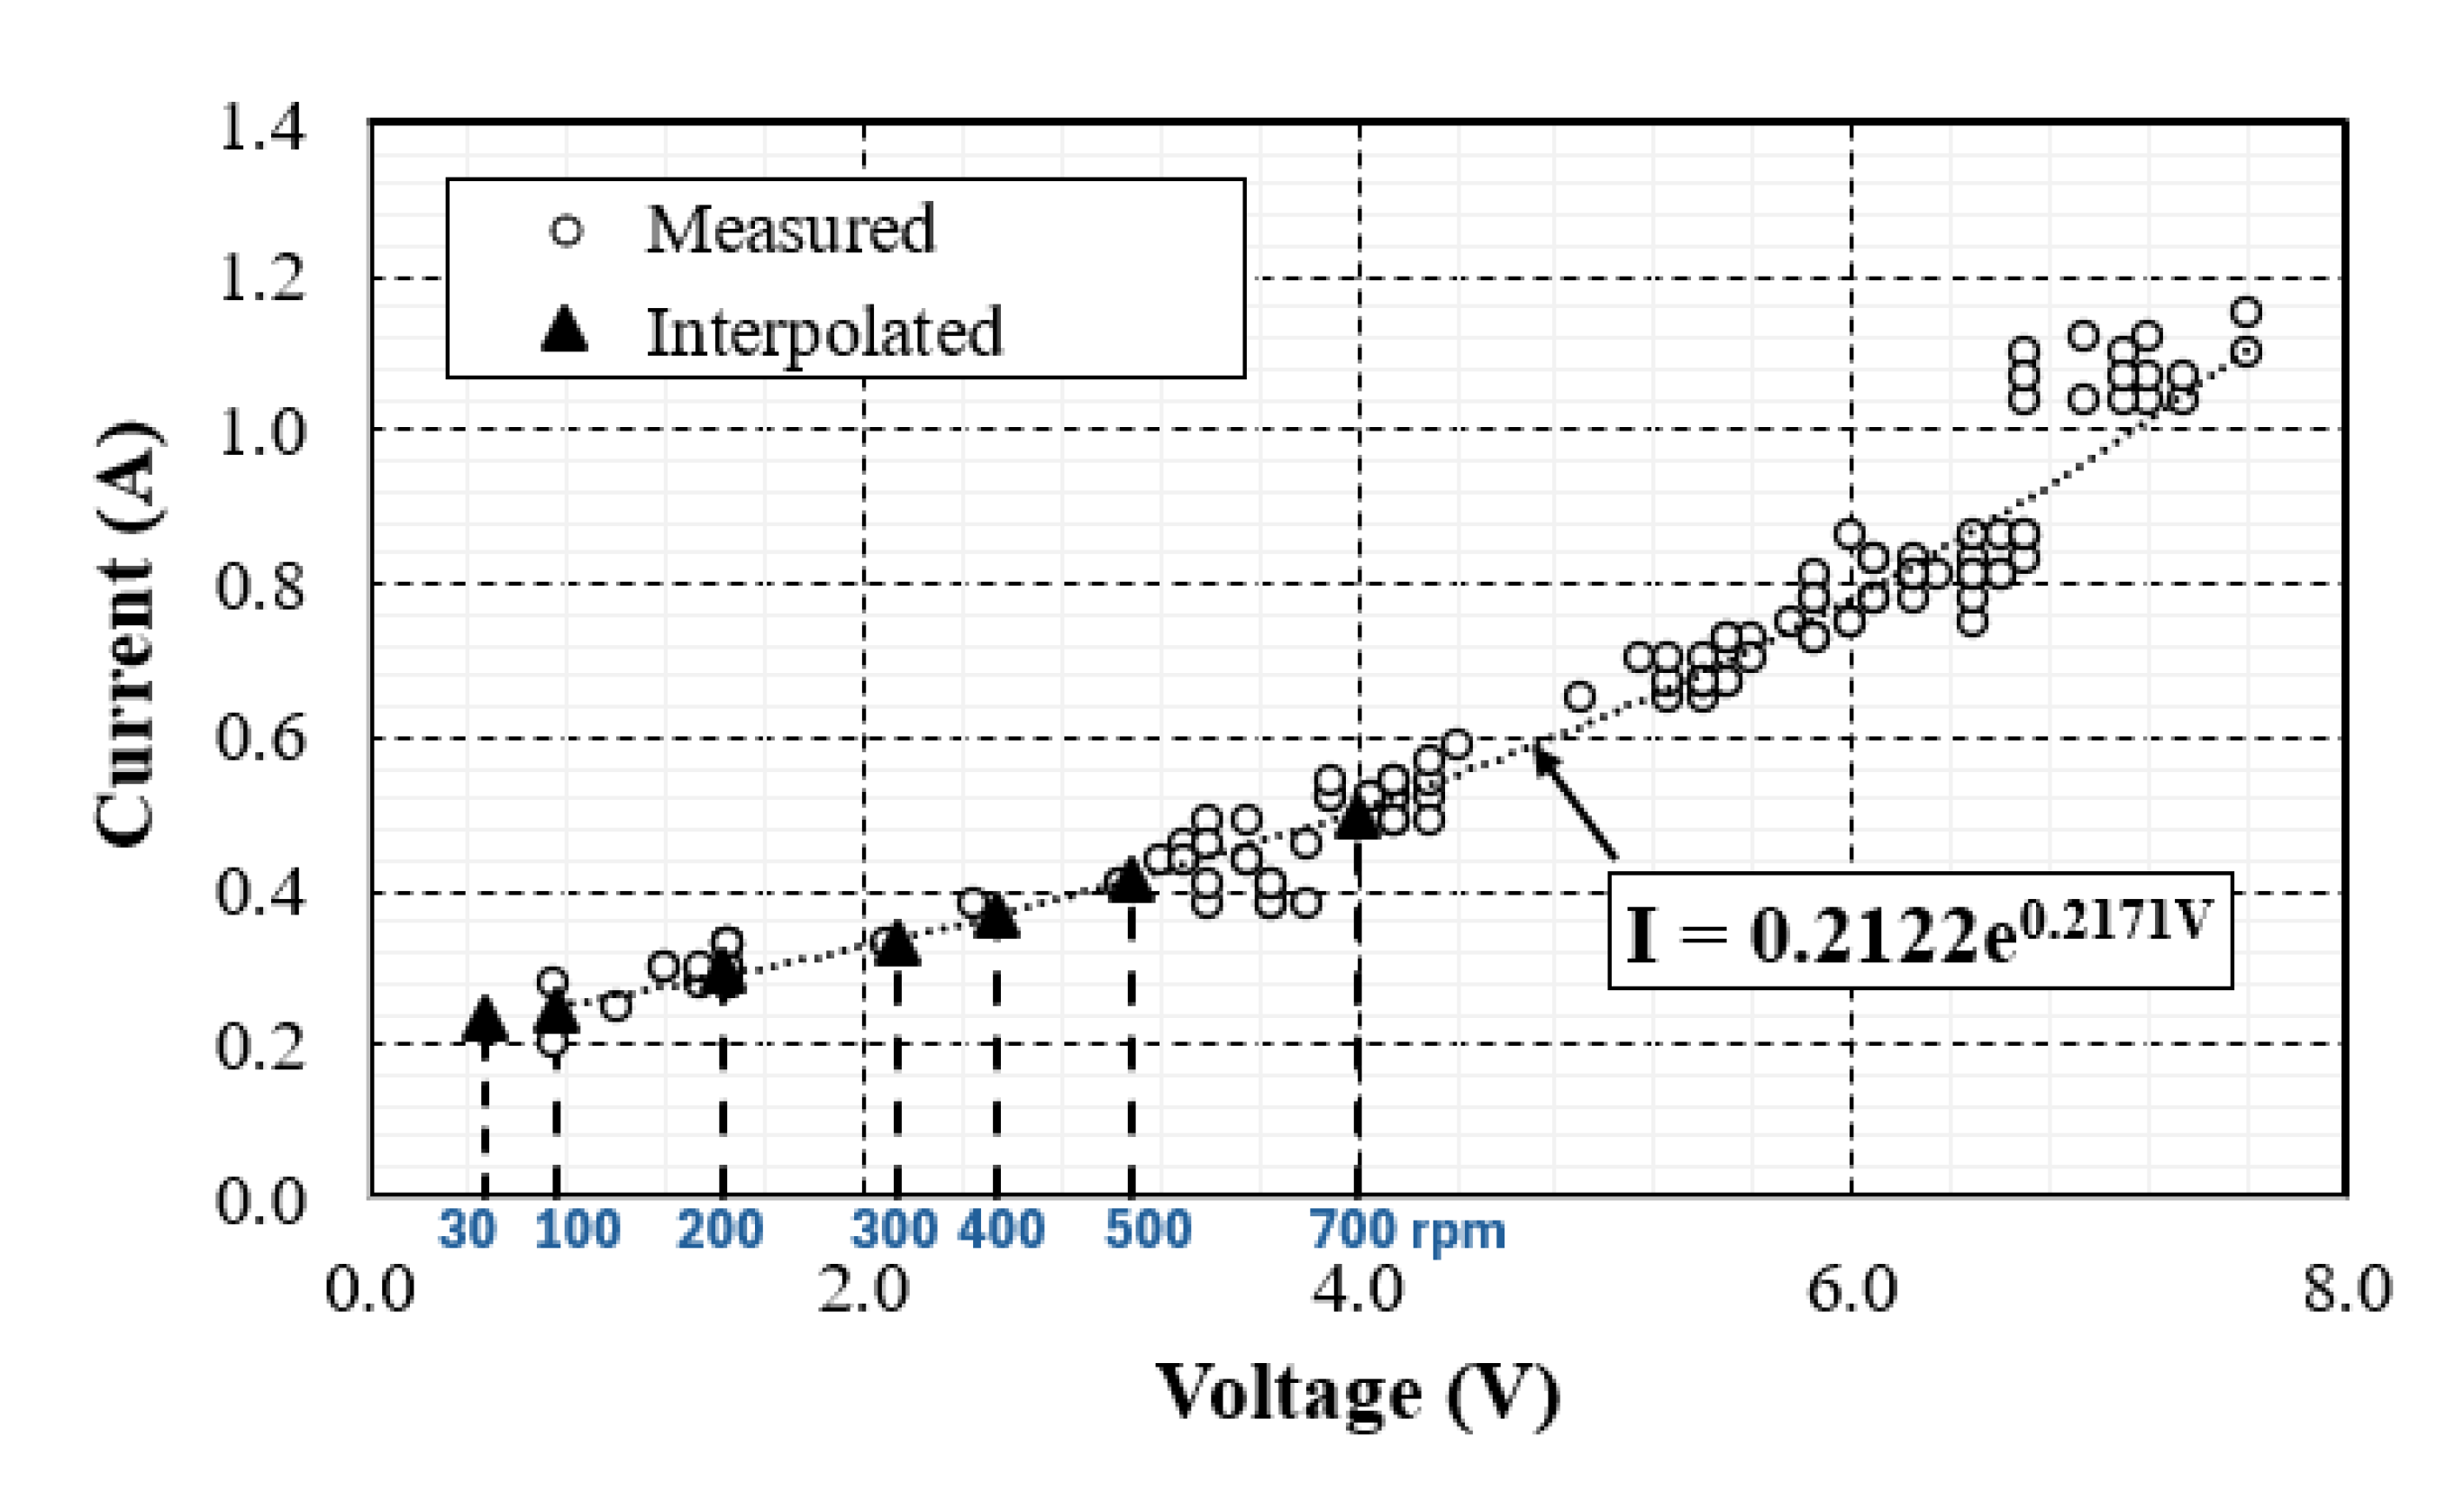
As mentioned earlier, the overdrive gearbox increases the rpm of the buoy by a factor of 10. Thus, the first rotor of the dual-rotor generator sees a rpm of 300 corresponding to the buoy rpm of 30. Based on Figure 23, the generic generator yields a power of 0.711 W (2.133V and 0.333 A) at 300 rpm compared to 0.72 W using the dual-rotor generator. Therefore, one can conclude that the dual-rotor generator measured output is reasonably accurate. Moreover, without the overdrive the dual-rotor generator will yield a power of approximately 0.11 W representing only 15.3% of the power generated using the overdrive.
It is also noted here that in the absence of water current during the test, the VAWT did not contribute to generating power. However, based on the VAWT numerical simulation results presented in Table 3, a water current speed of 1 m/s will result in 124 rpm of the VAWT which will increase 3 folds due to the 1:3 ratio 90°-bevel gear resulting in 372 rpm of the second rotor of the dual-rotor generator. In this case, the dual-rotor generator will see a combined rpm of 672, resulting in approximately 2 W of power. This represents an 18 fold increase in power generation compared to a system without the dual-rotor generator and the overdrive mechanisms.
In addition, from Figure 18, ANSYS AQWA results predict a force response of 800 N/m at 0.5 Hz for the wave amplitude of 0.2 m. This suggests an excitation force of approximately 160 N. With an RMS velocity of 0.444 m/s, the estimated mechanical power is around 71 W. However, from section 3.3, the theoretically estimated power output is 103.08 W/m x 0.35 m 36 W. The difference between the two results could be attributed to overestimation of the Froude-Krylov force without consideration for damping, system losses and phase differences in the analysis. These results suggest that a much higher power potential is available in the point-absorber buoy and therefore it remains to be seen how this potential can be fully realized.
8. Conclusion
This work presents the design, fabrication, and testing of a small-scale hybrid ocean energy harvesting system that utilizes a heaving buoy and vertical axis water turbine. The system development process started with wave resource assessment that verified suitable conditions at Khobar coastline. Followed by simulation-based design optimization of the buoy's design and natural period, and ANSYS AQWA validation of hydrodynamic performance. The QBlade software helped optimize the current turbine blade profiles for low-flow conditions, and the prototype used accessible materials with adjustable components for on-site deployment.
Two main technical innovations distinguish this project: (1) a custom-designed MMR with an overdrive gearbox that transforms the buoy's heaving motion into rotational motion and maintains a single direction of output rotation, and (2) a dual-rotor generator that accepts separate power inputs from both the buoy and turbine, without mechanical coupling resulting in a higher operating rpm of the generator. A slip ring is used to transfer the electrical power from the rotating dual-rotor to a stationary power outlet to provide uninterrupted power output.
Several important conclusions can be drawn from this study. First, the study shows that such hybrid ocean energy generation systems have significant potential for generating power at near-coast and shallow water depths under low significant wave height, wave amplitude, and water current speed conditions with the aid of overdrives and a dual-rotor generator. Second, historical analysis data indicate that the Khobar coastline experiences average and median significant wave heights of 0.28 and 0.21 m and average and median wave period of 2.68 and 2.67 s, respectively. Third, in-situ experimental measurements further validate these values, with observed wave heights in a range from -0.11 m to 0.20 m and a dominant wave period of around 2.22 s. Fourth, the frequency spectrum analysis revealed two peaks at 0.39 Hz and 0.5 Hz, which suggests the target natural frequency range for the buoy design for Khobar coastline. Fifth, the force-response analysis suggests that such systems have the potential to generate much higher power with the aid of low rpm and high torque generators due to relatively low wave frequencies. Sixth, the RAO analysis can help determine resonant period of the buoy as compared to the wave height such that the buoy follows the shape of the waves closely.
As for the next steps, several enhancements can be made to the current system such as implementing a flywheel system for power delivery stabilization and battery integration for energy storage and system stability enhancement. Moreover, since the heave force of the buoy is very significant, a mechanism to run multiple low rpm and high torque would allow the system to extract maximum available energy. These additions have the potential to enhance performance and move the system closer to full-scale practical application.
Author Contributions
Conceptualization, F.S., T.S., A.B., A.A. and O.A.; methodology, F.S., T.S.; software, F.S., T.S., O.A., M.A. and S.A.; validation, F.S., A.B., A.A. and O.A.; formal analysis, F.S., T.S., O.A., and M.A.; investigation, A.B., A.A., O.A., M.A. T.A., and S.A; resources, F.S.; data curation, F.S., T.S., A.B., A.A. and O.A.; writing—original draft preparation, F.S., T.S., M.H. and T.A.; writing—review and editing, F.S., T.S. and M.H.., visualization, A.B. and A.A., and O.A..; supervision, F.S., and T.S.; project administration, F.S., and T.S.; funding acquisition, F.S.. All authors have read and agreed to the published version of the manuscript.
Funding
Not applicable.
Institutional Review Board Statement
Not applicable.
Informed Consent Statement
Not applicable.
Data Availability Statement
Available upon request.
Acknowledgments
The authors would like to acknowledge the support provided by Imam Abdulrahman Bin Faisal University (IAU). The authors would also like to acknowledge the support provided by the staff of the College of Engineering Mechanical Workshop and Fab-House and the use of the facilities for prototype development.
Conflicts of Interest
The authors declare no conflicts of interest.
References
- “A review of hybrid wave-tidal energy conversion technology - ScienceDirect.” Accessed: Dec. 24, 2024. [Online]. Available: https://www.sciencedirect.com/science/article/pii/S0029801824010217.
- “Design and dynamic emulation of hybrid solar-wind-wave energy converter (SWWEC) for efficient power generation | Scientific Reports.” Accessed: Dec. 24, 2024. [Online]. Available: https://www.nature.com/articles/s41598-024-72827-9.
- M. Karimirad, Offshore Energy Structures: For Wind Power, Wave Energy and Hybrid Marine Platforms. Cham: Springer International Publishing, 2014. [CrossRef]
- Y. Fan, A. Mu, and T. Ma, “Modeling and control of a hybrid wind-tidal turbine with hydraulic accumulator,” Energy, vol. 112, pp. 188–199, Oct. 2016. [CrossRef]
- “Analysis of hybrid offshore renewable energy sources for power generation: A literature review of hybrid solar, wind, and waves energy systems - ScienceDirect.” Accessed: Dec. 24, 2024. [Online]. Available: https://www.sciencedirect.com/science/article/pii/S2666165924001789.
- “Wave energy utilization: A review of the technologies - ScienceDirect.” Accessed: Dec. 24, 2024. [Online]. Available: https://www.sciencedirect.com/science/article/abs/pii/S1364032109002652.
- F. O. Falcão and J. C. C. Henriques, “Oscillating-water-column wave energy converters and air turbines: A review,” Renew. Energy, vol. 85, pp. 1391–1424, Jan. 2016. [CrossRef]
- G. Lemonis, “Wave and Tidal Energy Conversion,” in Encyclopedia of Energy, Elsevier, 2004, pp. 385–396. [CrossRef]
- G. Bryden, T. Grinsted, and G. T. Melville, “Assessing the potential of a simple tidal channel to deliver useful energy,” Appl. Ocean Res., vol. 26, no. 5, pp. 198–204, Jul. 2004. [CrossRef]
- Youssef, J. Matar, P. Rahme, and C. Bou-Mosleh, “A Nearshore Heaving-Buoy Sea Wave Energy Converter for Power Production,” Procedia Eng., vol. 145, pp. 136–143, Jan. 2016. [CrossRef]
- “Analysis, design and experiment investigation of a novel wave energy converter - Binh - 2016 - IET Generation, Transmission & Distribution - Wiley Online Library.” Accessed: Dec. 24, 2024. [Online]. Available: 89 https://ietresearch.onlinelibrary.wiley.com/doi/full/10.1049/iet-gtd.2015.0821.
- S. Chandrasekaran and B. Raghavi, “Design, Development and Experimentation of Deep Ocean Wave Energy Converter System,” Energy Procedia, vol. 79, pp. 634–640, Nov. 2015. [CrossRef]
- “Design of a cylindrical buoy for a wave energy converter - ScienceDirect.” Accessed: Dec. 24, 2024. [Online]. Available: https://www.sciencedirect.com/science/article/abs/pii/S0029801815003996.
- H. Wang et al., “A New Wave Energy Converter for Marine Data Buoy,” IEEE Trans. Ind. Electron., vol. 70, no. 2, pp. 2076–2084, Feb. 2023. [CrossRef]
- Y. Zhang, D. Li, S. Hong, and M. Zhang, “Design of a new oscillating-buoy type wave energy converter and numerical study on its hydrodynamic performance,” Brodogr. Int. J. Nav. Archit. Ocean Eng. Res. Dev., vol. 74, no. 1, pp. 145–168, 2023. [CrossRef]
- Y. Shi, J. Lin, Z. Zhuge, R. Zheng, and J. Zhang, “Conceptual Design and Dynamic Analysis of a Wind–Wave Energy Converter with a Mass-Adjustable Buoy.,” J. Mar. Sci. Eng., vol. 12, no. 8, 2024, Accessed: Dec. 24, 2024. [Online]. Available: https://search.ebscohost.com/login.aspx?direct=true&profile=ehost&scope=site&authtype=cr awler&jrnl=20771312&AN=179376658&h=DAHI6b9d4%2BeIAd0NN1ug3fBfN6TprPsYE LjwnSrNh44xQYyu1tbu5OBXeDBHdwBiaz45ie0Vk4%2BsFaMcLu%2FNxA%3D%3D&cr l=c.
- H. Sakr, S. M. Metwalli, and Y. H. Anis, “Dynamics of heaving buoy wave energy converters with a stiffness reactive controller,” Energies, vol. 14, no. 1, p. 44, 2020. [CrossRef]
- Z. Zheng, Z. Yao, Z. Chang, T. Yao, and B. Liu, “A point absorber wave energy converter with nonlinear hardening spring power-take-off systems in regular waves,” Proc. Inst. Mech. Eng. Part M J. Eng. Marit. Environ., vol. 234, no. 4, pp. 820–829, Nov. 2020. [CrossRef]
- M. Rava et al., “Low-Cost Heaving Single-Buoy Wave-Energy Point Absorber Optimization for Sardinia West Coast,” J. Mar. Sci. Eng., vol. 10, no. 3, Art. no. 3, Mar. 2022. [CrossRef]
- V. Vijayasankar, S. Kumar, A. Samad, and L. Zuo, “Analysis of an innovative compact point absorber wave energy converter concept suitable for small-scale power applications,” Phys. Fluids, vol. 35, no. 9, 2023, Accessed: Dec. 24, 2024. [Online]. Available: https://pubs.aip.org/aip/pof/article/35/9/097140/2912262.
- H. Mutsuda, S. Rahmawati, N. Taniguchi, T. Nakashima, and Y. Doi, “Harvesting ocean energy with a small-scale tidal-current turbine and fish aggregating device in the Indonesian Archipelagos,” Sustain. Energy Technol. Assess., vol. 35, pp. 160–171, 2019. [CrossRef]
- F. Behrouzi, A. Maimun, M. Nakisa, M. Hanafi, and J. Jaswar, “An innovative vertical axis current turbine design for low current speed,” J. Teknol., vol. 66, no. 2, 2014, Accessed: Dec. 24, 2024. [Online]. Available: https://journals.utm.my/jurnalteknologi/article/view/2515 90.
- C. Fernandes and A. Bakhshandeh Rostami, “Hydrokinetic energy harvesting by an innovative vertical axis current turbine,” Renew. Energy, vol. 81, pp. 694–706, Sep. 2015. [CrossRef]
- M. J. Alam and M. T. Iqbal, “A low cut-in speed marine current turbine,” J. Ocean Technol., vol. 5, no. 4, pp. 49–61, 2010.
- R. N. Silva, M. M. Nunes, F. L. Oliveira, T. F. Oliveira, A. C. P. Brasil, and M. S. S. Pinto, “Dynamical analysis of a novel hybrid oceanic tidal-wave energy converter system,” Energy, vol. 263, p. 125933, Jan. 2023. [CrossRef]
- S. Chen et al., “Design, dynamic modeling and wave basin verification of a hybrid wave–current energy converter,” Appl. Energy, vol. 321, p. 119320, 2022l. Energy, vol. 321, p. [CrossRef]
- S. Chen, B. Jiang, X. Li, Q. Xiong, J. Huang, and L. Zuo, “Design and Dynamics of Hybrid Wave and Current Energy Converter,” in Volume 8: 31st Conference on Mechanical Vibration and Noise, Anaheim, California, USA: American Society of Mechanical Engineers, Aug. 2019, p. V008T10A018. [CrossRef]
- M.-S. Park, S.-H. Lee, and S.-C. Ko, “Experimental Capture Width Ratio on Unit Module System of Hybrid Wave Energy Converter for Nearshore,” Appl. Sci., vol. 12, no. 12, Art. no. 12, Jan. 2022. [CrossRef]
- D. A. Shifler, “Understanding material interactions in marine environments to promote extended structural life,” Corros. Sci., vol. 47, no. 10, pp. 2335–2352, 2005. [CrossRef]
- E. Copping and L. G. Hemery, “OES-environmental 2020 state of the science report: environmental effects of marine renewable energy development around the world. Report for ocean energy systems (OES),” 2020, Accessed: Dec. 24, 2024. [Online]. Available: https://www.osti.gov/biblio/1632878.
- “Evaluation of the sea state near Jeddah based on recent observations and model results.” Accessed: Dec. 28, 2024. [Online]. Available: https://www.tandfonline.com/doi/epdf/10.1080/1755876X.2015.1014636?needAccess=true.
- B. Kamranzad, A. Etemad-shahidi, and V. Chegini, “Assessment of wave energy variation in the Persian Gulf,” Ocean Engineering, vol. 70, pp. 72–80, Sep. 2013. [CrossRef]
- Copernicus Marine Service, GLOBAL_MULTIYEAR_PHY_001_030 – Global Ocean Physics Reanalysis, Mercator Océan International. [Online]. Available: https://doi.org/10.48670/moi-00021 [Accessed: May 22, 2025]. [CrossRef]
- D. Brown, W. D. Brown, W. Christian, and R. M. Hanson, TRACKER: Video Analysis and Modeling Tool for Physics Education [Online]. Available: https://opensourcephysics.github.io/tracker-website/ [Accessed: June 19, 2025].
- M. E. McCormick, Ocean Wave Energy Conversion. Mineola, NY, USA: Dover Publications, 2007.
- W. Yang, Y. Hou, H. Jia, B. Liu, and R. Xiao, “Lift-type and drag-type hydro turbine with vertical axis for power generation from water pipelines,” Energy, vol. 188, p. 116070, Dec. 2019. [CrossRef]
- D. Marten, QBlade: A Modern Tool for the Aeroelastic Simulation of Wind Turbines, Ph.D. dissertation, Technische Universität Berlin, 2020. [Online]. Available: https://doi.org/10.14279/depositonce-10646 [Accessed: May 22, 2025]. [CrossRef]
- M. Drela, “XFOIL Subsonic Airfoil Development System,” Mit.edu, 2013. https://web.mit.edu/drela/Public/web/xfoil/.
- M. Mahdi and Mahdi, “Optimal blade Design of a spherical water turbine,” e-Prime - Advances in Electrical Engineering Electronics and Energy, vol. 7, pp. 100470–100470, Feb. 2024. [CrossRef]
- ANSYS Inc., AQWA Theory Manual, Release 2023 R1, ANSYS, Inc., Canonsburg, PA, USA, 2023.
- B. Devolder, Hydrodynamic Modelling of Wave Energy Converter Arrays, Ph.D. dissertation, Ghent University, 2018.
- M. Akselsen, Hydrodynamic Analysis of a Floating Renewable Energy Device, M.S. thesis, Norwegian University of Science and Technology (NTNU), 2019.
Figure 2.
Time series data: (a) significant wave height, and (b) wave period from 2013 till 2023.
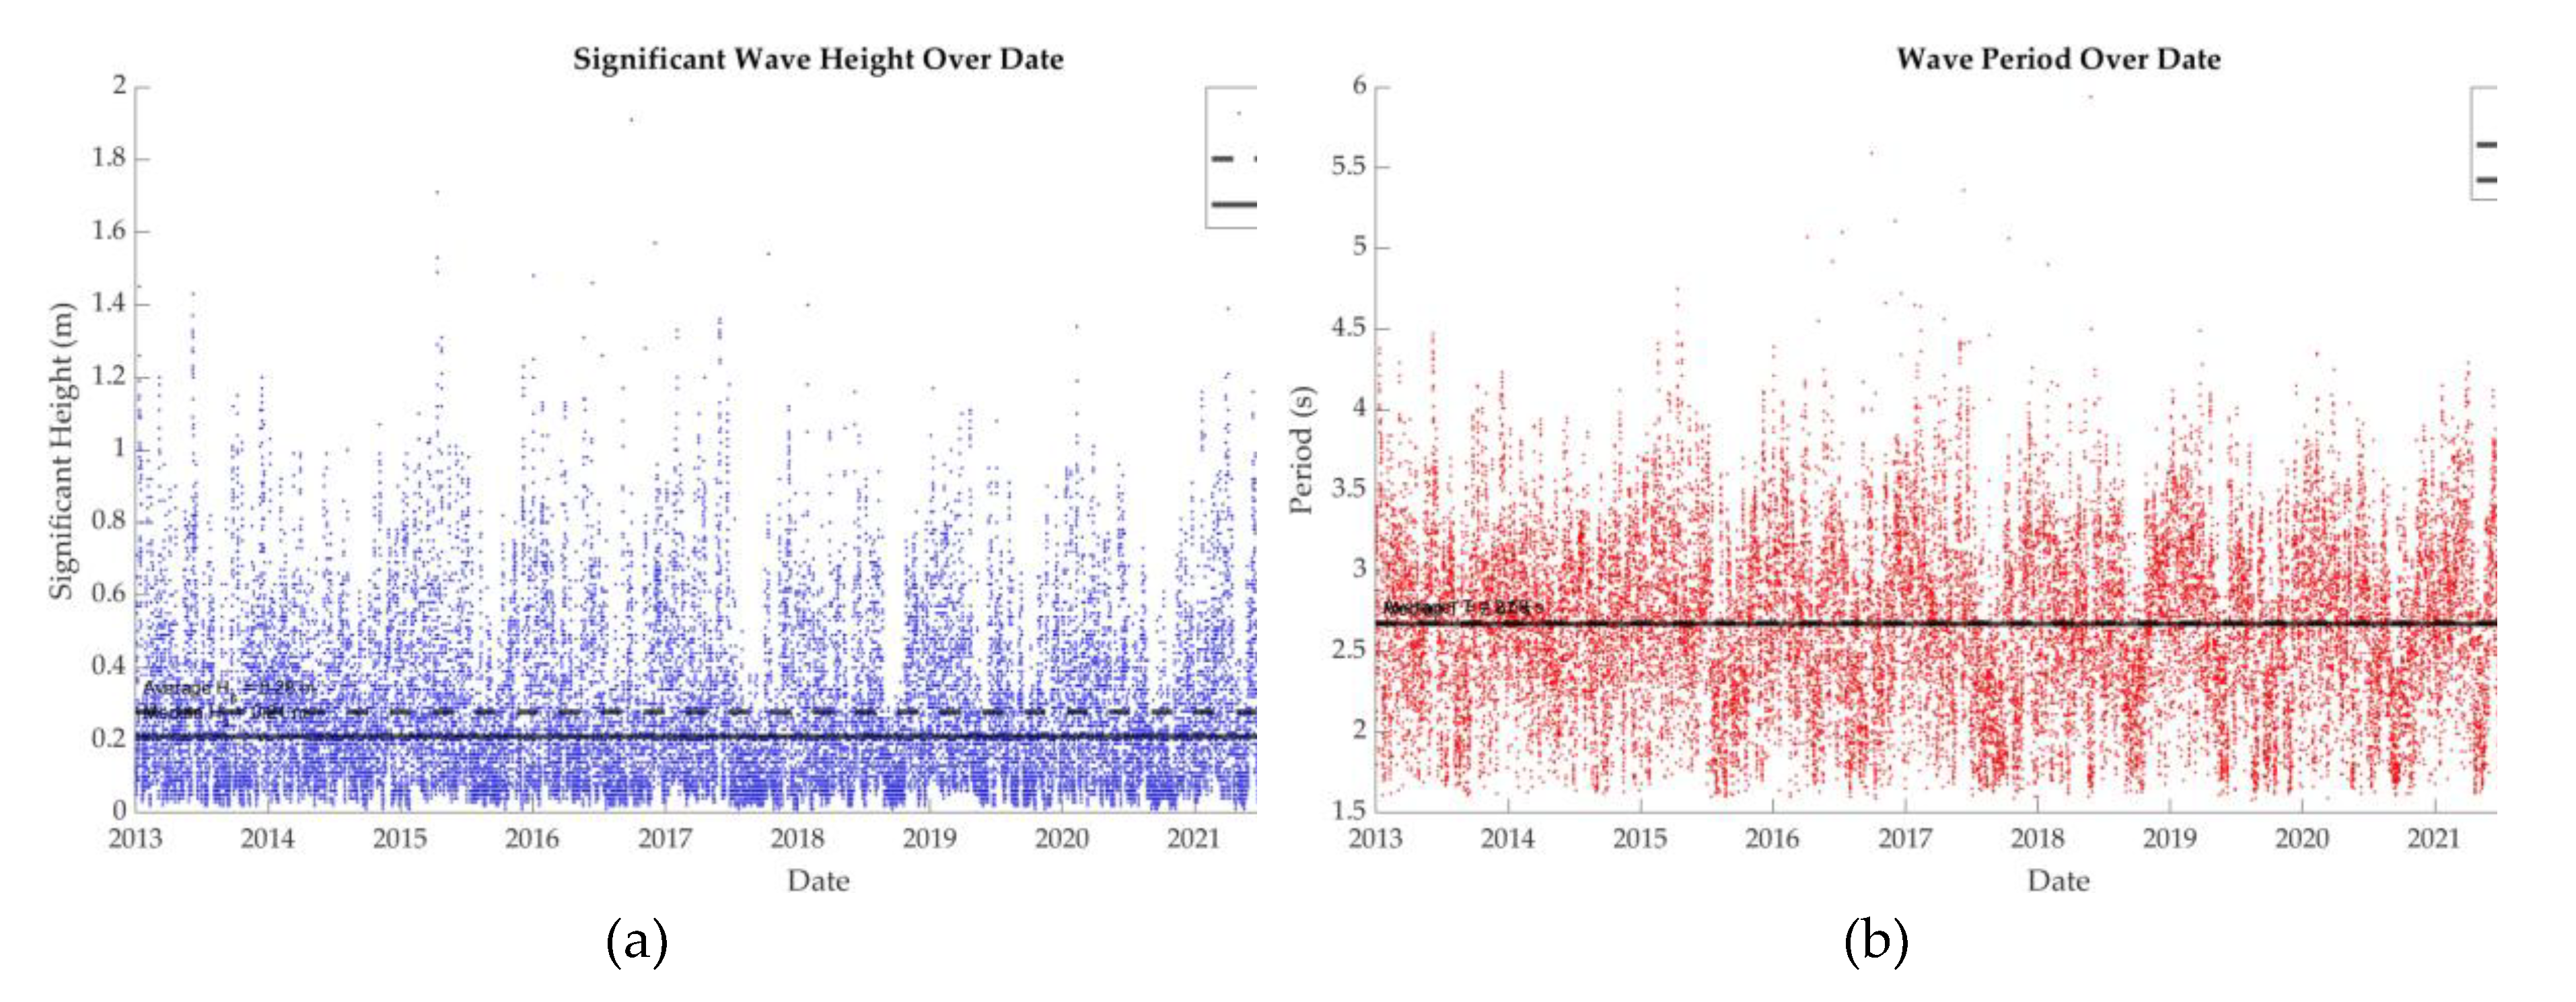
Figure 10.
The different components of the dual-rotor generator subassembly.
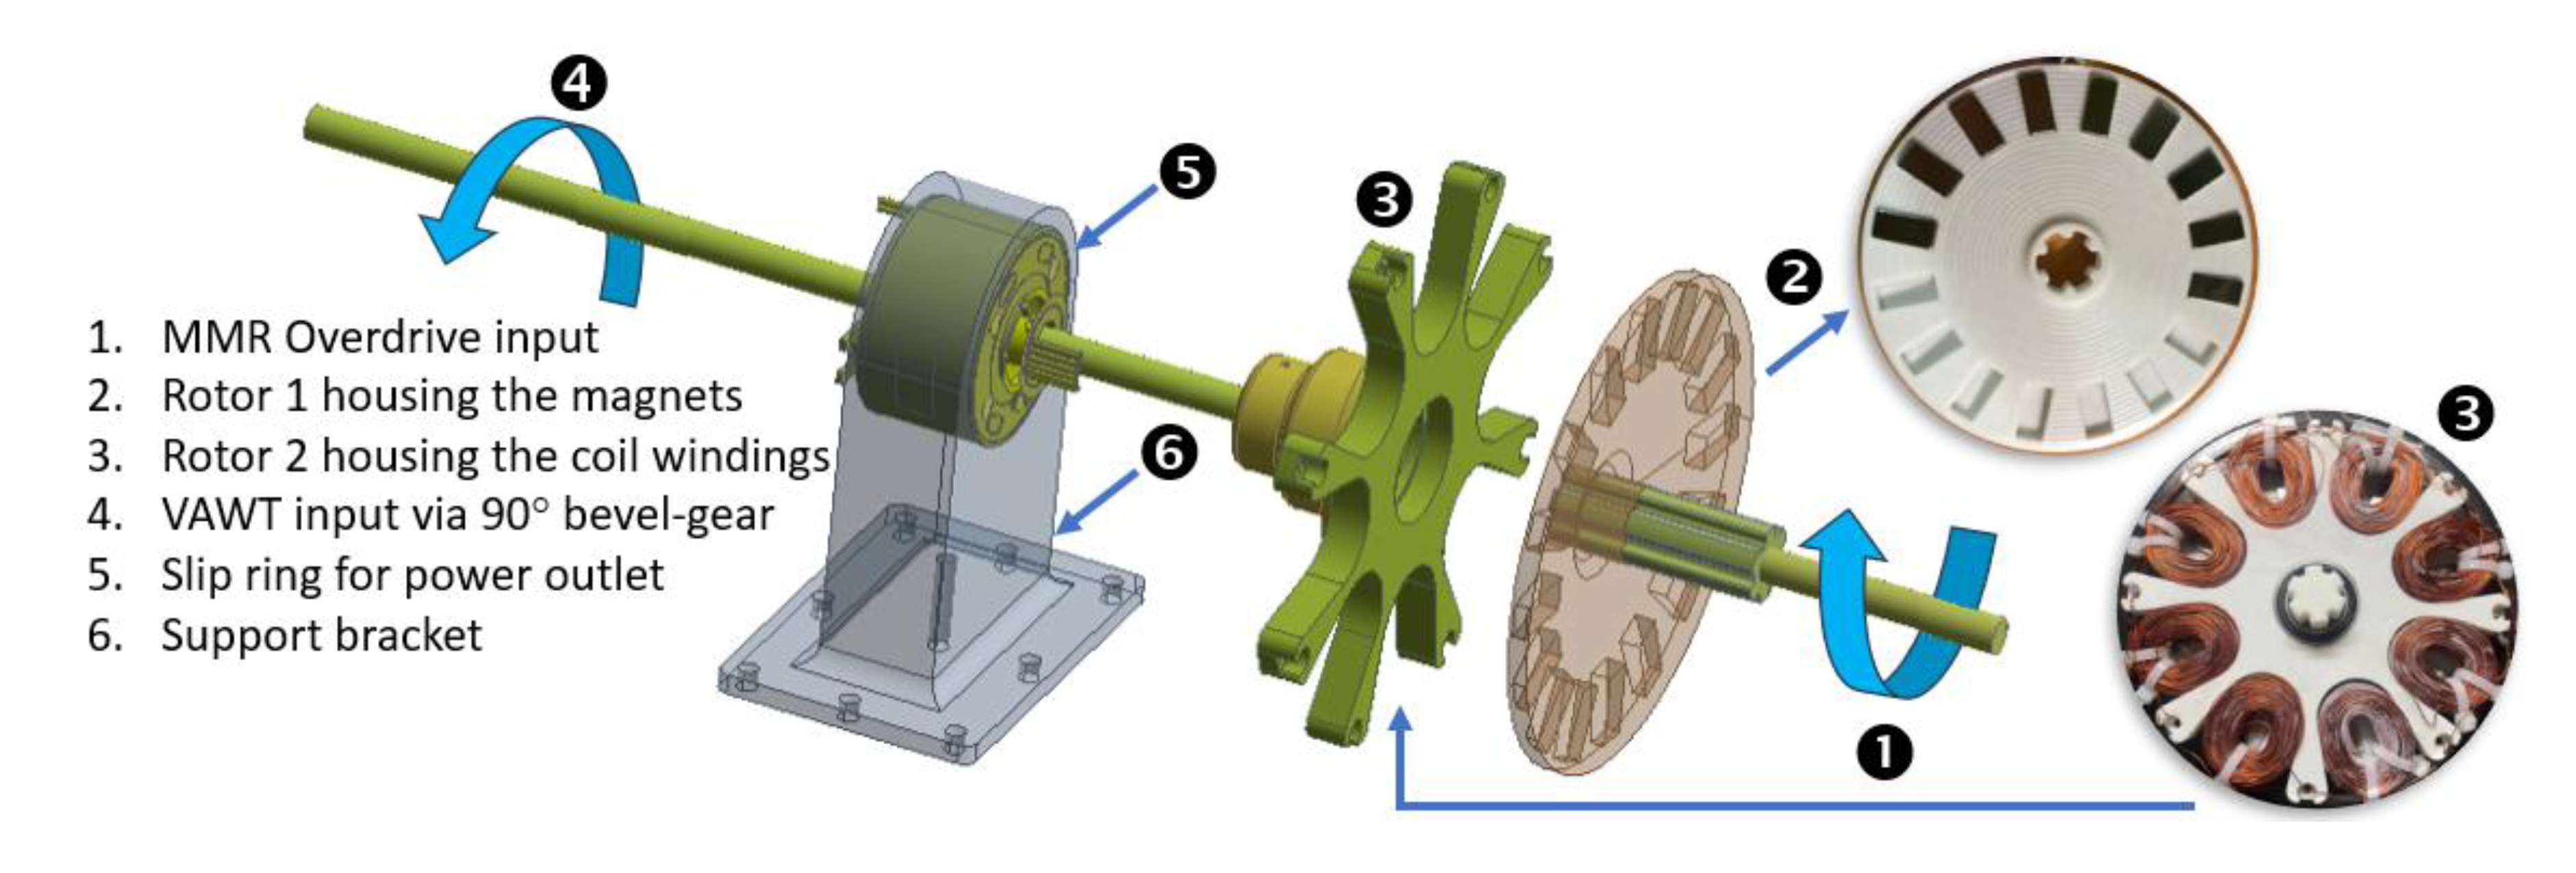
Figure 11.
The VAWT and 90°-bevel gear subassembly.
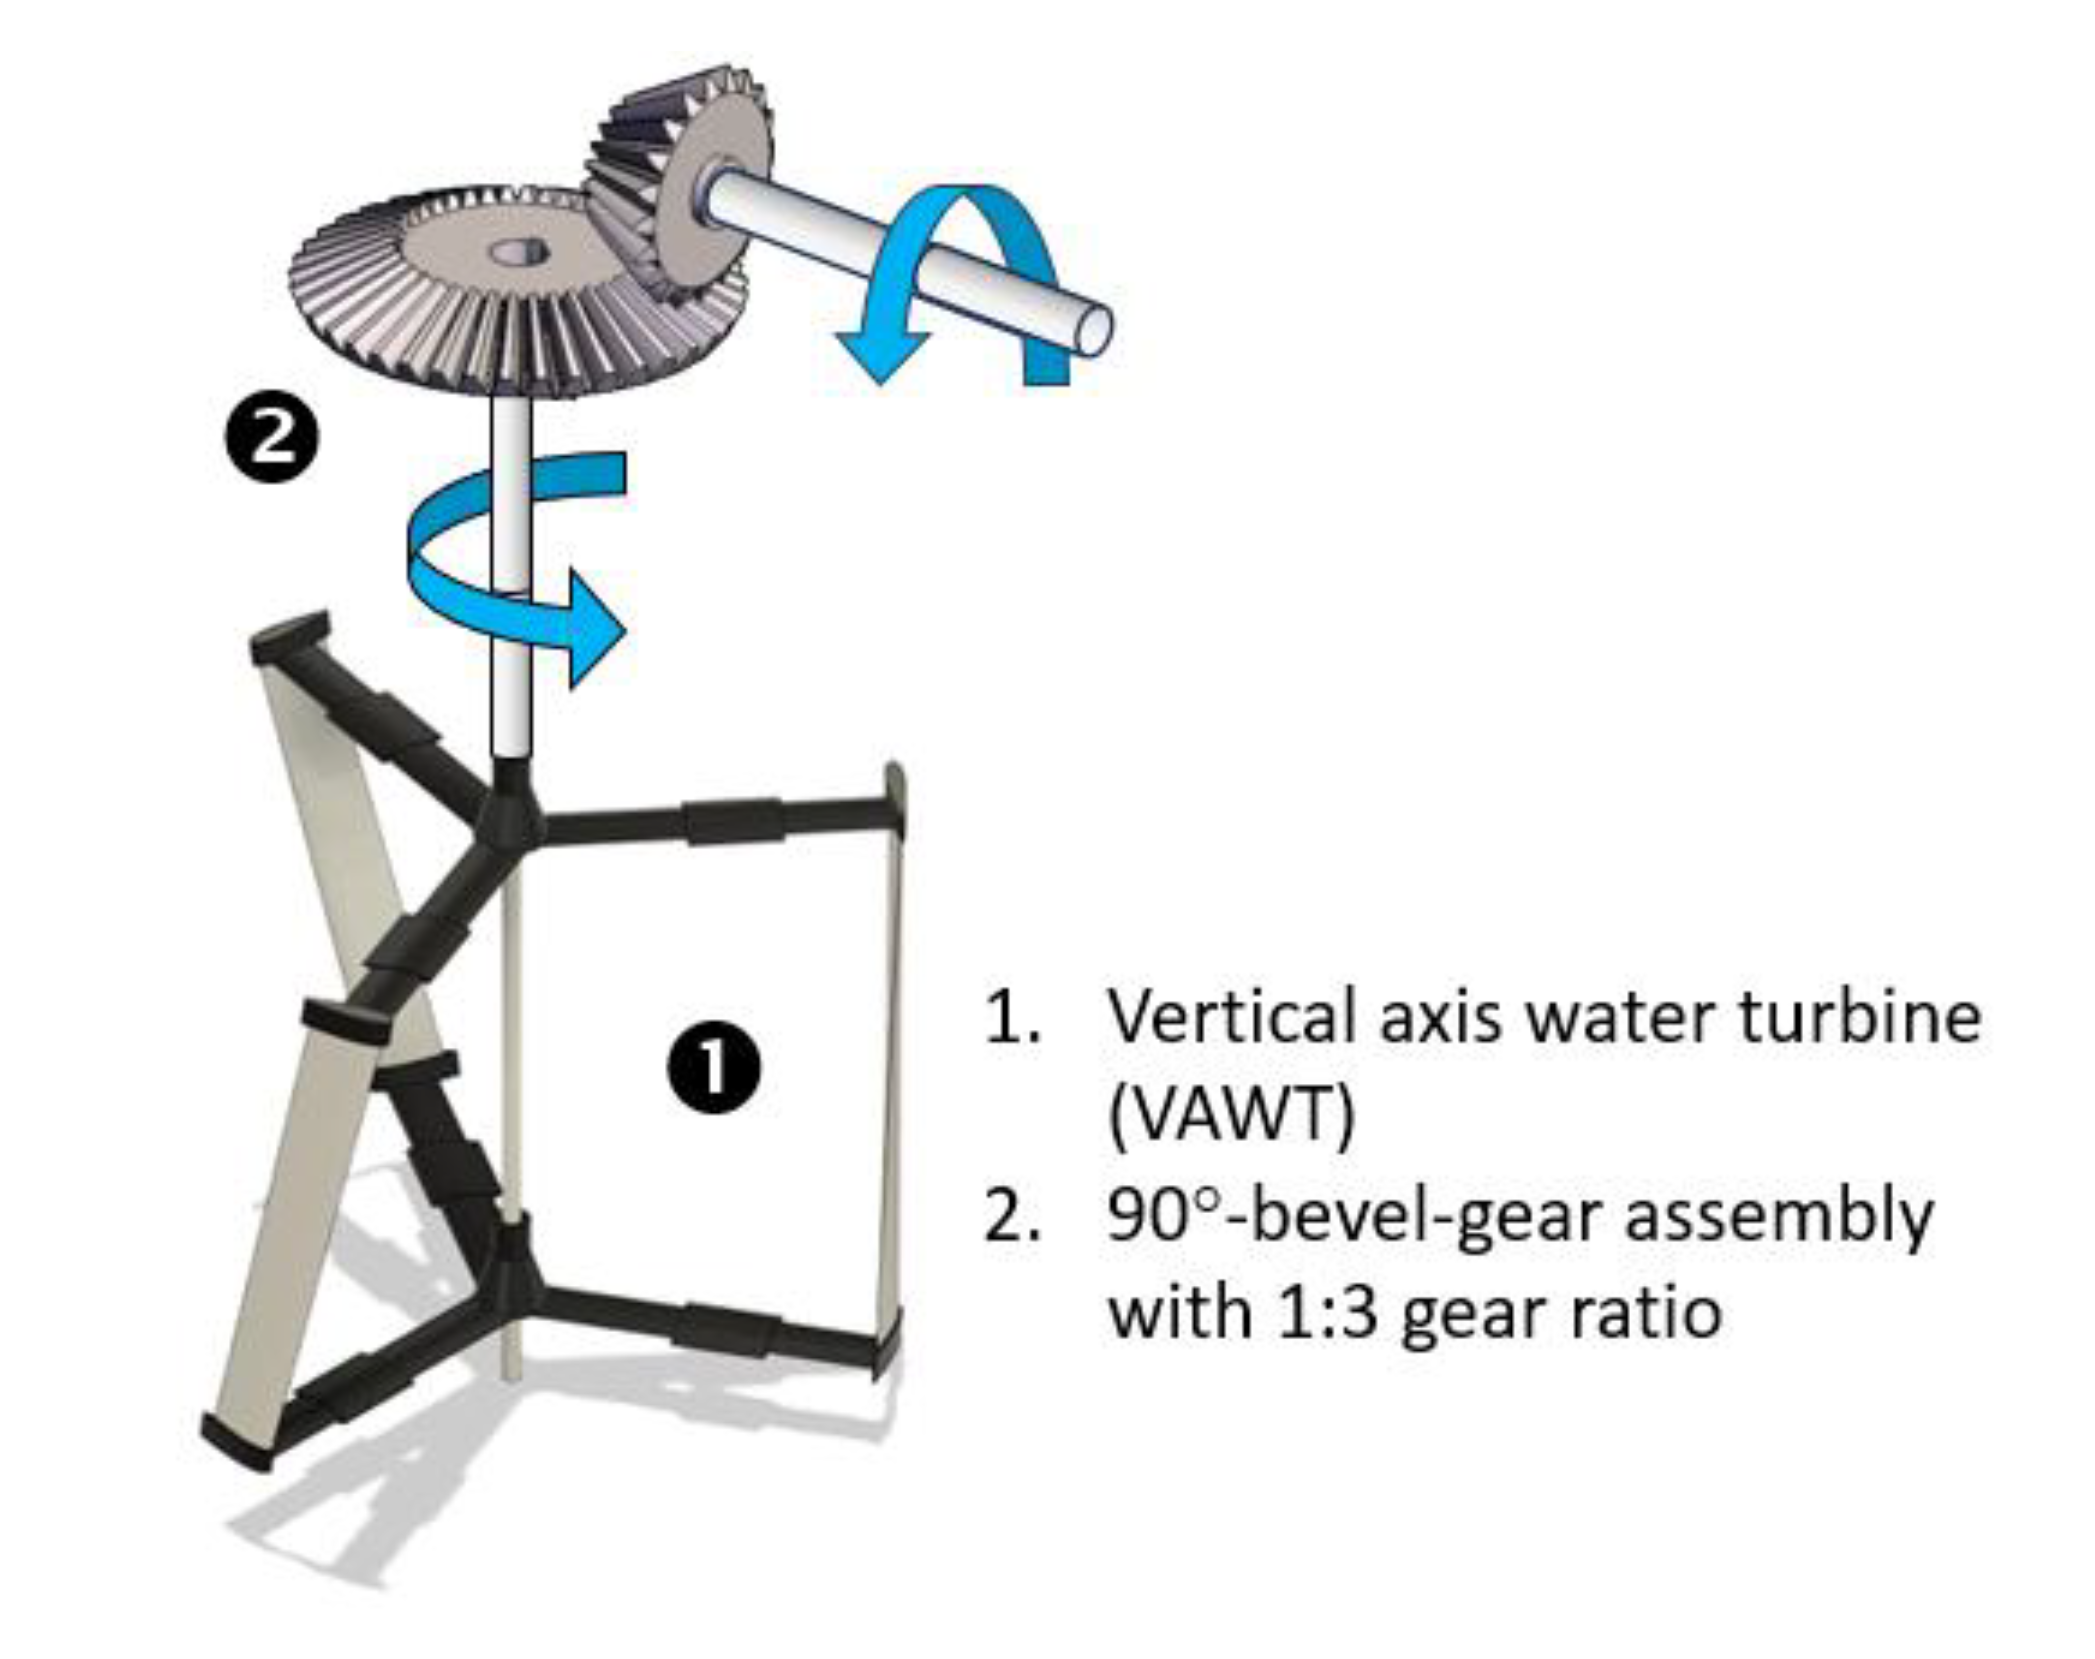
Figure 8.
The system prototype: (a) During tests, and (b) In final form.
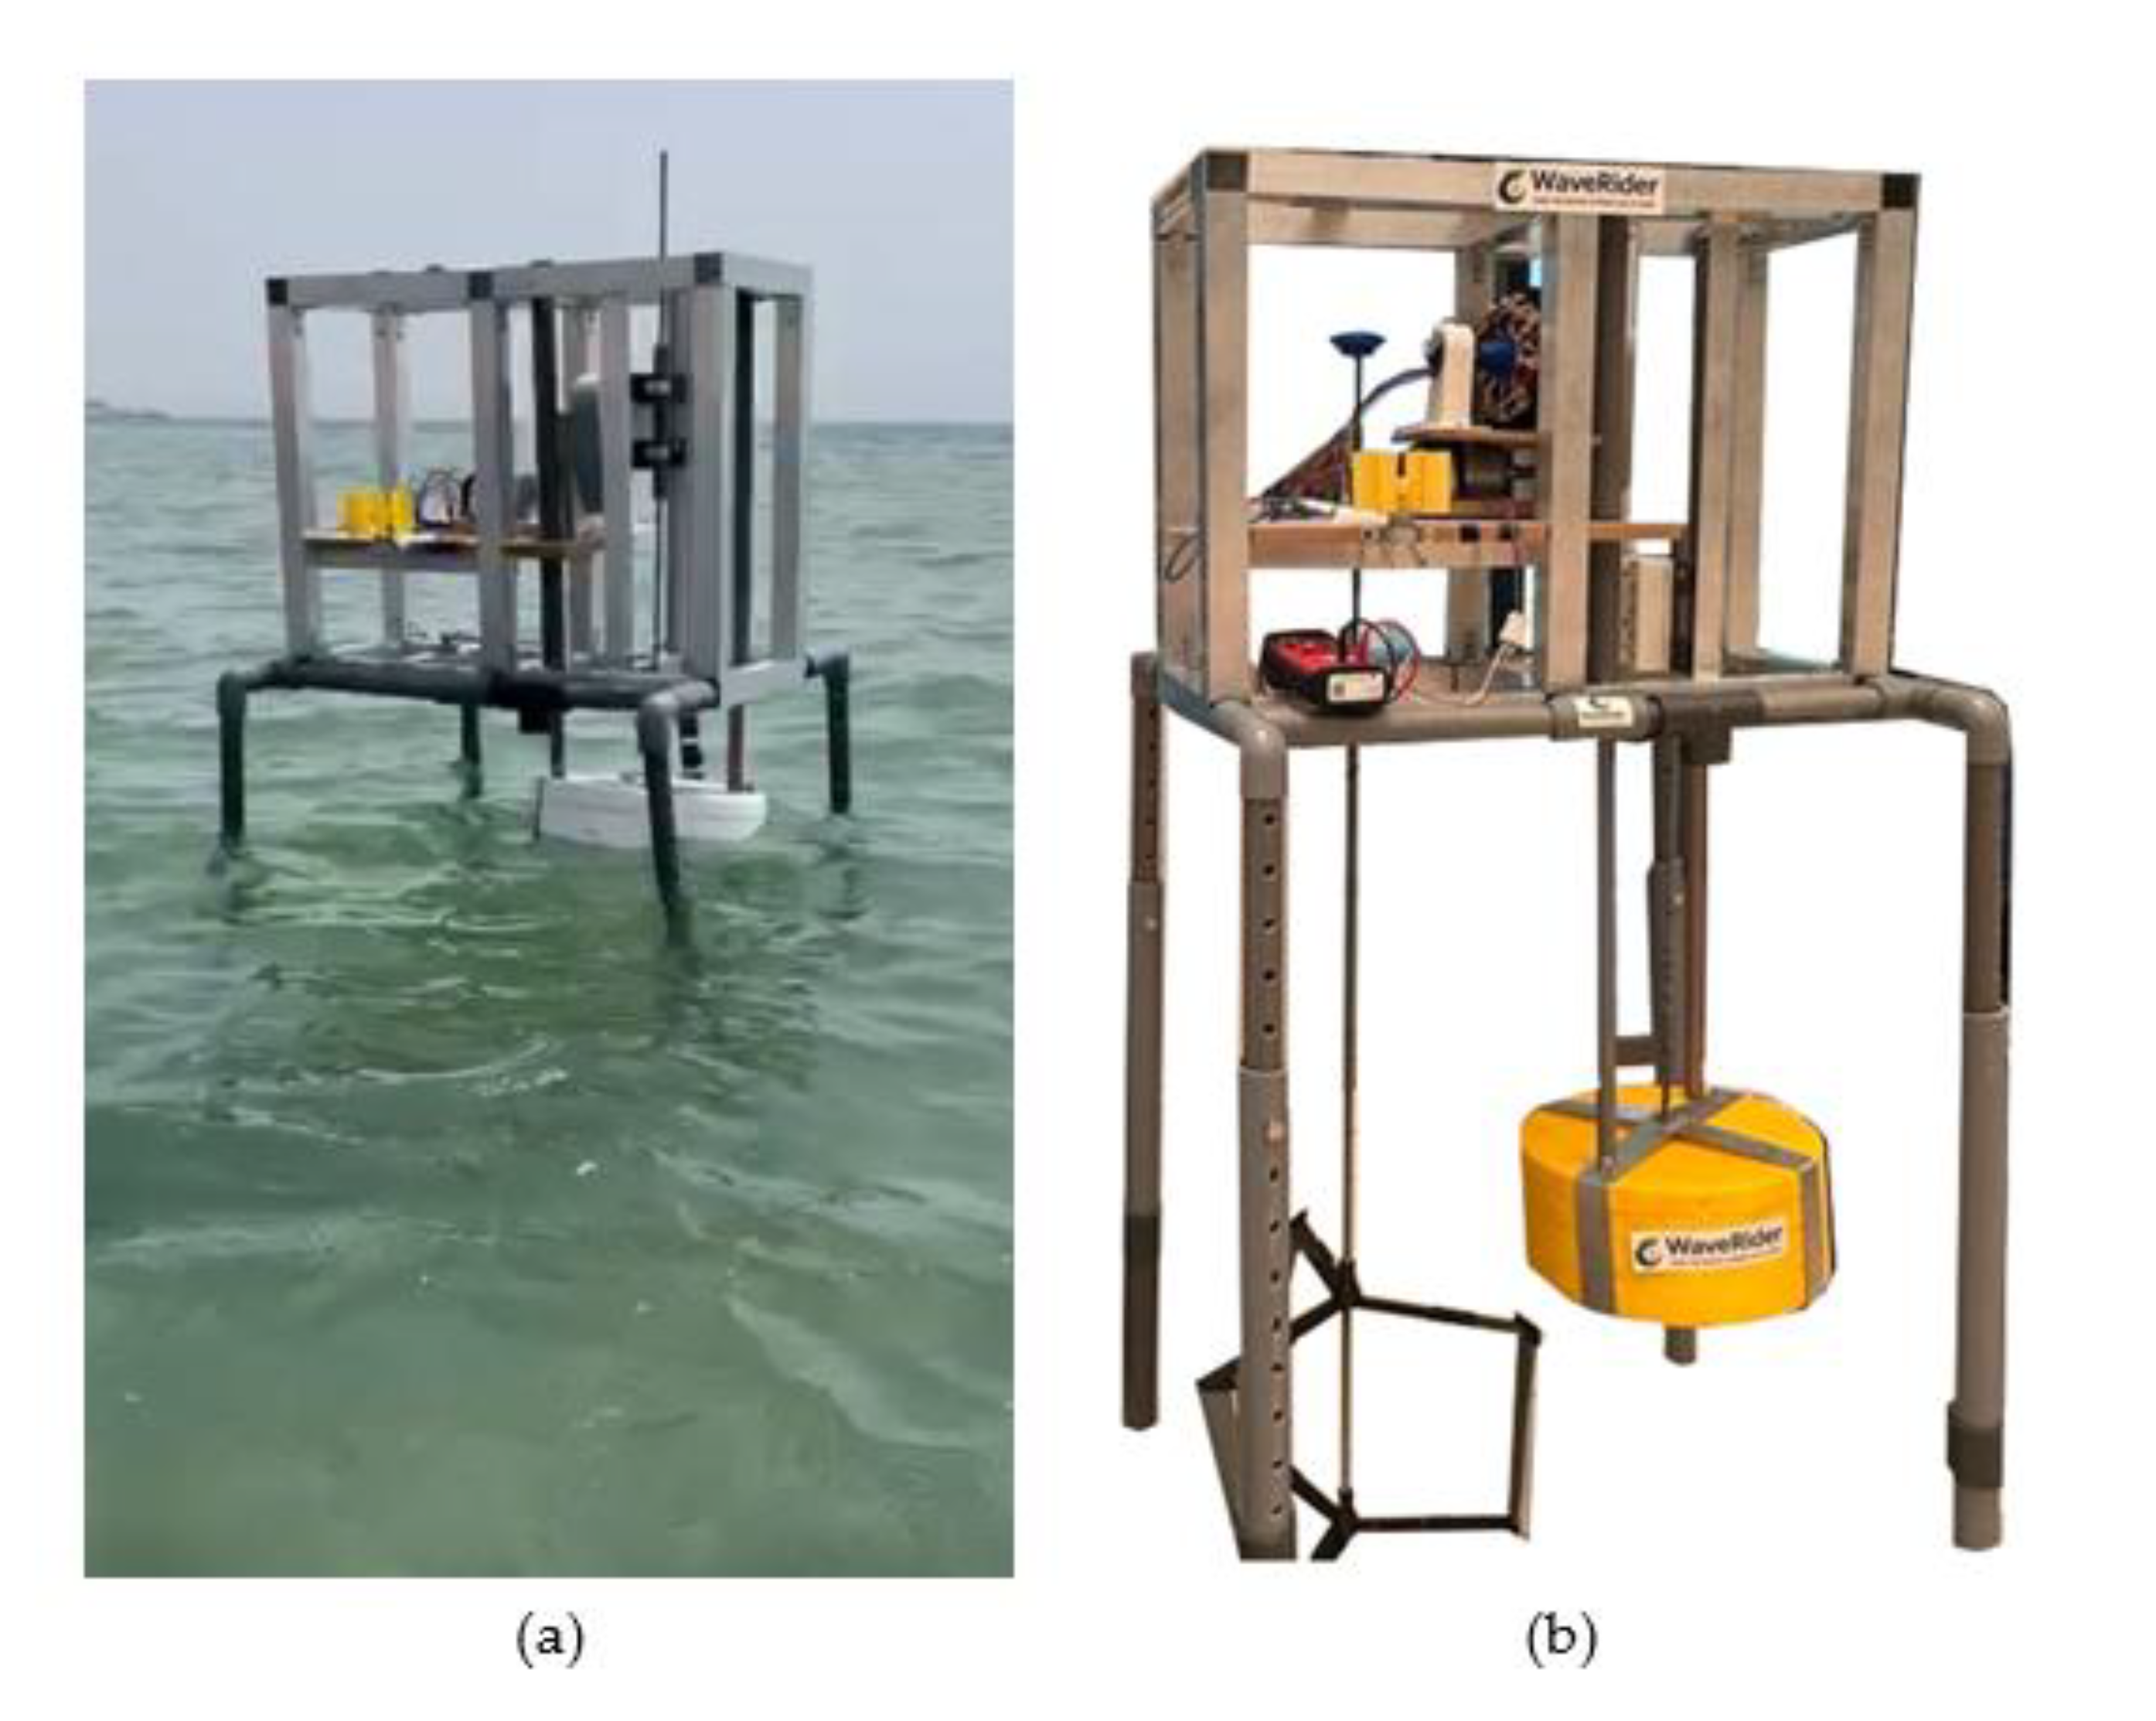
Figure 13.
(a) Heave decay response and (b) Heave power spectral density for three different release depths.
Figure 13.
(a) Heave decay response and (b) Heave power spectral density for three different release depths.
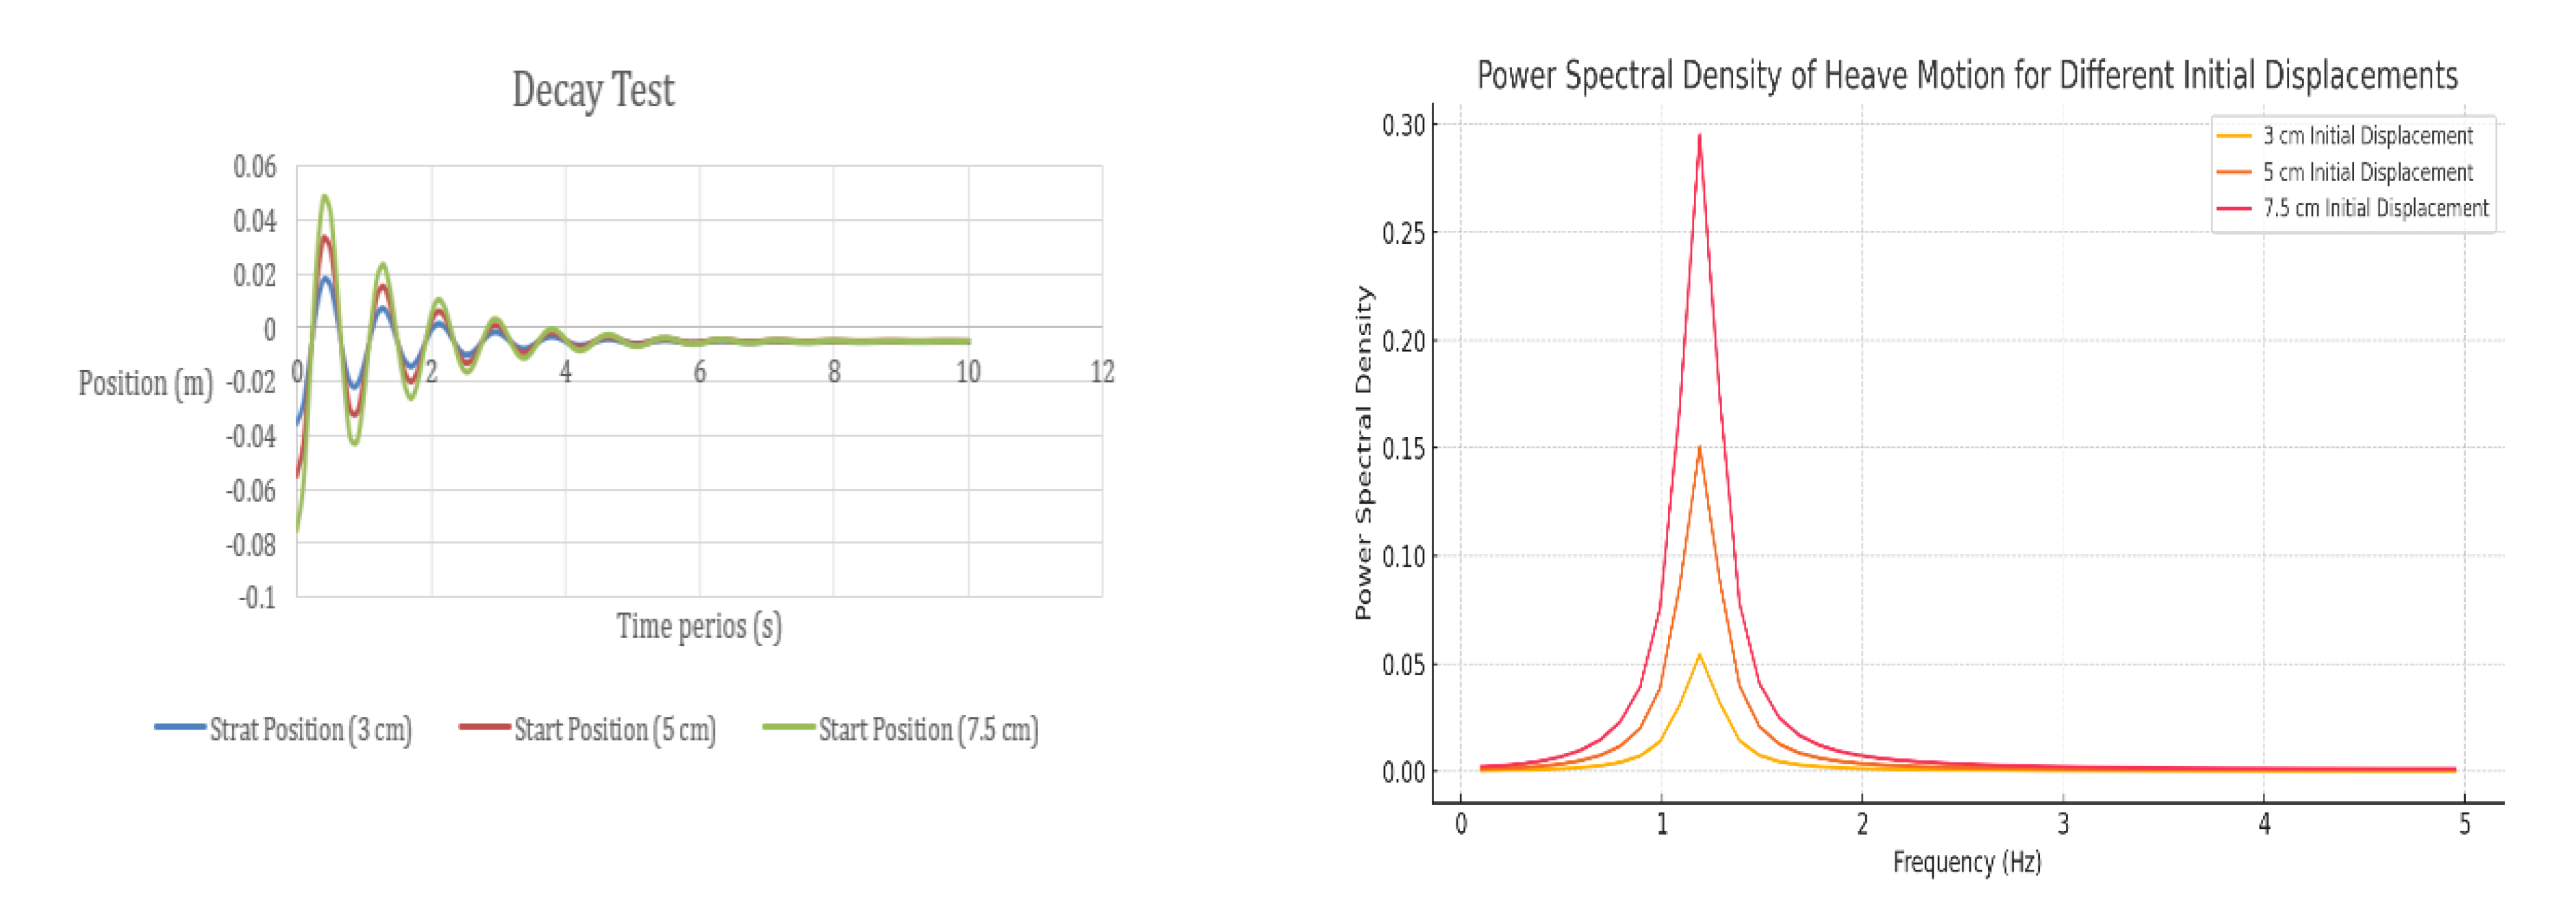
Table 1.
Predicted Frequency (Hz) for Draft-Diameter Combinations of Buoy.
| Diameters (m) | |||||
|---|---|---|---|---|---|
| - | 0.30 | 0.31 | 0.33 | 0.35 | |
| Drafts (m) | 0.50 | 0.670 | 0.664 | 0.658 | 0.657 |
| 0.75 | 0.560 | 0.550 | 0.548 | 0.540 | |
| 1.00 | 0.501 | 0.501 | 0.498 | 0.497 | |
| 1.25 | 0.433 | 0.432 | 0.431 | 0.430 | |
Table 2.
Comparison of natural periods of the selected buoy using different approaches.
| Draft (cm) | ANSYS AQWA | On Site Tests | Eq. (1) |
|---|---|---|---|
| 4.0 | 0.719 s | 0.728 s | 0.71 s |
| 5.0 | 0.722 s | 0.73 s | 0.72 s |
| 6.0 | 0.775 s | 0.733 s | 0.74 s |
| 7.5 | 0.820 s | 0.766 s | 0.78 s |
| 8.5 | 0.840 s | 0.834 s | 0.80 s |
Disclaimer/Publisher’s Note: The statements, opinions and data contained in all publications are solely those of the individual author(s) and contributor(s) and not of MDPI and/or the editor(s). MDPI and/or the editor(s) disclaim responsibility for any injury to people or property resulting from any ideas, methods, instructions or products referred to in the content. |
© 2025 by the authors. Licensee MDPI, Basel, Switzerland. This article is an open access article distributed under the terms and conditions of the Creative Commons Attribution (CC BY) license (http://creativecommons.org/licenses/by/4.0/).
Copyright: This open access article is published under a Creative Commons CC BY 4.0 license, which permit the free download, distribution, and reuse, provided that the author and preprint are cited in any reuse.


