Submitted:
23 June 2025
Posted:
25 June 2025
You are already at the latest version
Abstract
Public transport is essential for achieving net-zero emissions and sustainable urban growth. Yet, the health implications of indoor air quality (IAQ) in these vehicles are often overlooked, especially as passengers may spend hours in these enclosed spaces each day. We assessed IAQ in air-conditioned buses and trains in the metropolitan region of San Jose, Costa Rica. The tropical climate of San Jose means that high temperatures and humidity drive energy-intensive cooling on buses and trains, often powered by fossil fuels. To conserve energy, vehicle windows remain sealed, and air is mostly recirculated, undermining ventilation requirements. Our measurements revealed CO₂ concentrations reaching up to 5,000 ppm during a 45-minute bus ride. This far exceeds recommended thresholds and highlights significant ventilation deficits. These elevated CO₂ levels are indicative of potential health risks, particularly during prolonged travel. Our findings emphasize the urgent need to redesign air circulation strategies in urban public transport, especially in air-conditioned vehicles, to safeguard public health without undermining sustainability goals. Future research should focus on innovative ventilation solutions that reconcile energy efficiency with occupant well-being, supporting the transition to truly sustainable, net-zero urban mobility.
Keywords:
urban air quality
; public transport systems
; ventilation efficiency
; low-carbon mobility
; sustainable urban development
; rebreathed air volume
; airborne transmission
; SDG 11
1. Introduction
The use of heating, ventilation and air conditioning (HVAC) systems in buses and trains is becoming standard nowadays to ensure passenger comfort (Motorindia, 2018). These systems ensure comfortable thermal conditions and protect passengers from traffic noise and pollution. To improve HVAC system performance, passenger cabins have moved from openable windows to sealed windows that passengers cannot operate. Hence, the indoor environmental conditions inside buses and trains become dependent on the HVAC system and how these systems are operated. Achieving adequate air quality in these situations depends on ventilation using outside air.
In tropical regions of the world —categorized with the letter A in Köppen-Geiger climate classification system —, like most of Costa Rica, outside air is warm and humid (Peel et al., 2007). Before it can be introduced inside the vehicles, the air needs to be conditioned, at the expense of substantial energy, to get closer to desired thermal comfort conditions for passengers. The greater the differential in temperature and humidity, and the greater the exchanged volume of air, the greater the energy used by the HVAC system. In a moving vehicle, this means greater fuel consumption and reduced mileage. Thus, ventilating public transport can have an impact on the operating costs of the transportation companies (Barone et al., 2022; Göhlich et al., 2015; Widmer et al., 2025). These operating considerations and the upfront costs often mean that ventilation on the vehicle using outside air is neglected and air is mostly recirculated, as illustrated in Figure 1.
In Latin America, a significant share of passenger travel—approximately 68%—takes place on public transit or shared systems, and 42% of daily commutes are made by collective transport —based on 29 metropolitan areas— with fleets composed mainly of buses, along with some trains and shared taxis (Estupiñan et al., 2018). Although the supply of high-quality public transport has not kept pace with the growth in transport demand (Yañez-Pagans et al., 2019), buses and trains equipped with HVAC systems are gradually being introduced in Latin America to improve service quality and enhance passenger comfort (e.g., Metro de Panama; EMTU, São Paulo Brasil; La Rolita, Colombia; and Red Metropolitana, Santiago Chile).
Unfortunately, the air quality of these vehicles is rarely investigated, meaning little is known about the suitability of air quality for passengers (Ogundiran et al., 2025a). There are generally no binding regulations governing air quality or thermal comfort inside public transport vehicles in most countries, including Costa Rica; the design and operation of HVAC systems are typically at the discretion of operating companies. While there are ambient air quality standards in many jurisdictions, these do not apply to the air onboard a bus or a train. There are very few jurisdictions, like Hong Kong (ProPECC, 2003), which have established official guidelines specifying CO₂ concentration limits and thermal comfort ranges for air-conditioned buses and trains.
The bus sector in Latin America underwent widespread deregulation and privatization in the 1980s and 1990s, resulting in predominantly private ownership in many urban areas (Yañez-Pagans et al., 2019), with operations largely motivated by profit maximization (Ardila, 2008). As mentioned, public transportation —buses and trains—remains the primary mode of travel for a significant portion of the low- and middle-income population. For instance, the Regulatory Authority for Public Services of Costa Rica (ARESEP) estimates that over 900,000 Costa Ricans use the public bus system daily, nearly 60% of whom have not completed high school (ARESEP, 2021, 2021).
Within this context, our study aimed to: (i) assess indoor air quality in buses and trains equipped with HVAC systems; (ii) determine whether measured air quality parameters comply with international health and comfort standards; and (iii) estimate potential disease transmission risks using CO₂ concentrations as an indicator of ventilation adequacy. In the absence of specific health-based indoor air quality guidelines for public transport, measured values were compared against international recommendations established for the built environment.
The findings will provide transportation authorities and public health regulators with robust empirical evidence on air quality conditions in HVAC-equipped buses and trains. This evidence can guide the development of data-driven ventilation guidelines and operational strategies that balance energy efficiency, passenger comfort, and health. The results may also motivate public and private operators to adopt targeted measures that reduce passenger exposure to poorly ventilated environments and mitigate the risk of airborne disease transmission.
2. Materials and Methods
2.1. Case Study
The Ciudad Universitaria Rodrigo Facio is the main campus of the University of Costa Rica (UCR). The campus occupies approximately 75 ha. and is located in San Pedro de Montes de Oca, about 3 km from the capital, San José. Total enrollment is around 30,000 students, of which more than 60% use public transport to access the university (O`neal Coto, 2016). In addition to regular bus routes, the Rodrigo Facio campus is served by two train routes and 16 exclusive staff and student routes that connect the campus with different parts of Costa Rican Great Metropolitan Area (GMA). The most used means are the regular routes with 32% of the users, followed by the exclusive routes with 26% (O`neal Coto, 2016). No data is available on the number of students traveling by train.
A total of four collective transport routes were selected for this research based on the following eligibility criteria. The primary criterion was that the routes operated at least one bus or train equipped with an HVAC system and a sealed passenger cabin without the possibility of opening windows. Another key factor was that these buses and trains operated during peak hours to allow for air quality assessment under worst-case scenarios. Finally, the selected routes had multiple trips per day, ensuring they carried a significant volume of passengers to the university. According to the above, the selected bus routes were Alajuela-UCR y Heredia-UCR and the train routes Cartago-UCR y Alajuela-Heredia-San Jose-UCR (See Figure 2). Alajuela, Cartago, and Heredia are, with San Jose, the most populated cities of the GMA.
2.2. Collective Transport Routes
Buses in Costa Rica are owned by private companies (Ardila, 2008); thus, coach type, size, and conditions vary depending on the company. A single company can run several types of buses on the same route. Therefore, during the measuring period, research assistants traveled in both AC and non-AC buses, from which we selected only those journeys carried out in AC buses.
On both the Alajuela and Heredia routes, bus models consist of double seats on each side, separated by an aisle. The coach's capacity is around 50 seated passengers, and a certain number of standing passengers is allowed. Buses are loaded using the front door 15 to 20 minutes before departure, and passengers pay the fare as they board. Seating is unassigned, allowing passengers to choose their seats upon entry, except for designated seats reserved for individuals with disabilities.
To prevent routes that provide exclusive service to the University of Costa Rica from competing with regular routes, the Public Transportation Council— the entity responsible for regulating public transport in Costa Rica— allows the UCR-exclusive routes to make only a limited number of stops on the route when the bus is headed to or from the university. Therefore, for most of the journey, the bus does not stop, and the doors remain closed. Once the bus arrives at the last stop, all passengers exit, and the bus starts a new journey.
The investigated trains in Costa Rica consist of two Diesel Multiple Units (DMU) built by the Chinese company CRRC Qingdao Sifang Co. Each unit is 30 meters long and has four entrances on each side. The total capacity is 188 passengers per car, with 74 seated on side-placed seats and 114 standing.
The journey between Alajuela and UCR is 23 km and includes 10 stops—four between Alajuela and Heredia, and six between Heredia and UCR. These stops are mandatory. There are two travel options: the first is to take the train to Heredia and transfer to another train to UCR. The second is to travel to San Jose (Atlantico Station) and then either take one more stop to UCR or use a taxi.
Between Cartago station and San Jose, the distance is 18.6 km and there are five stops. This route can be completed on a single train line.
Except for the journey between Tres Rios and Cartago stations, which lasts 24 minutes, travel times between other stations range from four to nine minutes (median = five minutes). Trains stop at all stations, open all doors on one side, and wait about 30 seconds for passengers to board or alight. Passengers pay the fare once they are inside the train.
2.3. On-Site Measurements
Between September and November 2022, we collected CO₂ measurements with the help of an experimenter and three research assistants who volunteered to carry the measurement equipment during their regular journeys on selected train and bus routes. As regular users of these routes, the volunteers maintained their typical travel schedules to ensure the data reflected normal conditions.
We securely attached dataloggers with CO₂ sensors (specifications of the equipment are provided in section 2.4) to their backpacks (See Figure 3). While standing, the volunteers wore the backpacks on their backs, and when seated, they placed them as far as possible from their nose and mouth — as well as from other passengers — to prevent artificially elevated CO₂ readings.
Most journeys the one experimenter and three research assistants made covered nearly the entire route, with trips typically beginning at or near the starting stop and continuing to the end or close to it. Seating positions varied between trips to capture a range of conditions.
To ensure that operating conditions remained typical, we did not inform the bus and train companies, or the drivers, that measures were being taken.
2.4. Measurement Equipment
The equipment we used for environmental measurements consisted of HOBO model MX-1102 mobile data loggers, which primarily measured CO₂. Temperature and relative humidity were also recorded. We assigned one device to each route, and all devices were calibrated beforehand according to the supplier’s manual. The logging frequency was set to three minutes. We used the HOBOware monitoring software (Version 3.7.23) to program, launch, and read data from the loggers.
The equipment remained switched on throughout the entire measurement period. Measurements taken during transport were subset from the complete dataset using the drop-in and drop-off information reported by the volunteers, along with time schedules. The subset included data from 10 minutes before and after each journey.
2.4. Carbon Dioxide Concentrations as an Indicator of Ventilation Levels and Infection Risks
Carbon dioxide has served as a reliable ventilation indicator for over a century due to its direct relationship with human occupancy and exhaled breath (Persily, 2022). Elevated CO₂ levels are linked to mucous membrane irritation, headaches, fatigue, and increased risks of respiratory infections (Persily, 2015).
Carbon dioxide concentrations can be used to estimate the rebreathed air fraction – the proportion of exhaled air inhaled by others. Rebreathed air fraction is a key determinant of airborne transmission risks, as illustrated by the Rudnick-Milton model (2003)
While CO₂ monitoring is a useful tool, it should not be treated as an “end all” means for risk evaluation. There is no universal CO₂ threshold that accurately reflects risk, as factors like occupant activity, masking, community spread, and time spent indoors all play a role. Individual differences and other CO₂ sources (e.g., vehicles, cooking) further complicate interpretation. Air cleaners reduce aerosols but not CO₂, requiring adjusted risk estimates. Point-in-time CO₂ readings offer only momentary insight, while continuous monitoring is needed for ventilation assessment, which itself varies with outdoor conditions. Despite these limitations, low-cost CO₂ monitors remain valuable for large-scale risk indication.
2.5. Analysis
We conducted the data curation and analysis using R Core Team software, version 4.4.1. Our analysis process began by importing CSV files containing continuous measurements collected with the HOBO devices over the three-month measurement period. Since the HOBOs measured continuously throughout the entire experimental phase — not just during the trips— we downloaded the data using the HOBO Ware program whenever a device’s memory reached its storage capacity. We then exported the data to CSV format before relaunching the device for ongoing data collection.
We uploaded and combined the CSV data files for each route separately. Once we had obtained a complete measurement file for each route, we subset the journeys based on the drop-in and drop-off information, along with the time schedules reported by the volunteers. Each journey was labeled with the route name, date, entry time, and exit time, which allowed us to estimate travel times.
We also verified that the drop-in and drop-off information aligned with the CO₂ measurements. Since the volunteers walked to and from the bus and train stops, it was essential for the entry and exit times of the transport to align with significant changes in CO₂ levels, marking the transition from outdoors to inside a vehicle.
Finally, for each journey, we estimated the median and 95th percentile CO₂ values, as well as the percentage of time that CO₂ levels exceeded 800 ppm. This threshold of 800 ppm corresponds to a rebreathed air fraction of 1%. Increased median CO2 levels have been shown to be associated with increased risks of disease transmission (Nathavitharana et al., 2022).
2.5.1. Estimation of the Rebreathed Air Fraction
Based on the median CO₂ values measured during the journeys, we estimated the rebreathed fraction (f), which represents the proportion of indoor air that consists of previously exhaled breath. In other words, it quantifies the amount of air a person inhales that has already been exhaled by others. Rudnick and Milton (2003) proposed that the rebreathed fraction can be calculated using CO₂ measurements, as shown in Equation 1:
where Ve is the equivalent volume of exhaled breath contained in indoor air, V is the volume of the shared air space, C is the volume fraction of CO₂ in indoor air, and Co is the volume fraction of CO₂ in outdoor air. Ca is the volume fraction of CO₂ added to exhaled breath during breathing. At low levels of oxygen consumption, such as office work, sitting at a desk, or sitting inside a vehicle, the CO₂ production rate and breathing rate are approximately 0.30 l/min and 8.0 l/min, respectively, giving a Ca of 0.038.
2.5.2. Estimation of Rebreathed Air Volume
For each time point where the CO₂ level was logged, i.e., every 3 minutes, the CO₂ concentration average was taken for the time point and the subsequent time point. Using this averaged CO₂ level, a rebreathed air fraction was calculated for this 3-minute duration. Assuming, for seated people, a breathing frequency of 16 breaths per minute – which is an average of the 12 to 20 breaths per minute that is normal for healthy adults (Enis Cetin et al., 2021) – and breath volume of 0.5 L (Hallett et al., 2018), we used the rebreathed air fraction to calculate an estimate of rebreathed air volume during each trip.
Since exhaled air can contain aerosols carrying potentially infectious particles, the risk of airborne transmission of infectious diseases increases with greater volume of rebreathed air.
3. Results
We present here the results derived from the dataset of CO₂ concentrations measured inside the train and bus cabins during regular schedule trips to and from the main campus of the University of Costa Rica (UCR) across the Costa Rican Great Metropolitan Area (GMA).
3.1. Trip Descriptions
The dataset comprised 37 monitored journeys across several routes, including UCR–Cartago, Cartago–UCR, Río Segundo–Heredia, Heredia–Atlántico, Atlántico–Heredia, Heredia–Río Segundo, and UCR–Heredia (See Figure 2). Trip durations varied depending on the route and time of day (Mean = 40.1 minutes, SD = 14.7); however, all shorter trips occurred on the Río Segundo–Heredia and Heredia–Río Segundo routes. Morning trips lasted between 14 and 51 minutes, while afternoon and evening trips ranged from 19 to 78 minutes. On one train trip and five bus trips, CO₂ concentrations reached or exceeded 5,000 ppm—the upper limit of our measuring device.
3.2. Summary Statistics
As an initial step, a descriptive statistical analysis was conducted to summarize the key features of the dataset. This has been summarized in the form of an epidemiology style Table 1. As CO2 concentration was our primary concern, for the 37 trips, the data was classified into tertiles based on median CO₂ concentrations during each trip: Low (N=13), Medium (N=12), and High (N=12) tertiles.
The table provides trip duration, median temperature and humidity during the trips (a reflection of thermal comfort during the trips), 95th percentile of CO₂ concentrations (representative of ventilation on board the vehicles), fraction of trip time over 800 ppm CO₂ concentration, rebreathed air fraction, and rebreathed air volume (all representative of infection transmission risks), mode of transport and the route. As the CO₂ levels exceeded instrument limit of 5,000 ppm on six trips (as described in Section 3.1), we could not calculate precise values for these trips.
3.2.1. Ventilation Metrics and Infection Risk Indicators
The median CO₂ concentrations were 1,456 ppm for the Low tertile, 2,364 ppm for the Medium tertile, and 4,210 ppm for the High tertile. Correspondingly, the 95th percentile CO₂ values increased across tertiles: 1,702 ppm, 2,935 ppm, and 4,930 ppm. The fraction of trip time spent above 800 ppm CO₂ remained consistently high across all tertiles at 94.0%, though the interquartile ranges varied: [63.6, 100.0%] for Low, [87.0, 100.0%] for Medium, and [93.0, 100.0%] for High tertiles.
Rebreathed air fraction, as expected, also showed a clear progressive increase across CO₂ tertiles: 2.7% [1.2, 4.1] in the Low tertile, 5.2% [4.5, 6.3] in the Medium tertile, and 10.0% [7.2, 12.1] in the High tertile. Similarly, rebreathed air volume increased substantially from Low to High tertiles: 5.4 L [1.4, 14.7], 15.2 L [12.2, 22.8], and 35.5 L [24.8, 66.2].
3.2.2. Trip Characteristics, Transport Modes, and Routes
Trip duration demonstrated a positive association with CO₂ tertiles, with median durations of 22.0 minutes [14.6, 54.6] for Low, 40.5 minutes [34.1, 49.3] for Medium, and 49.5 minutes [43.7, 71.4] for High tertiles. This indicates longer trips lead to greater possibilities of being exposed to higher CO2 levels.
Median temperature showed a slight increase across tertiles: 22.0 °C [19.0, 24.4], 22.0 °C [20.6, 25.9], and 23.0 °C [19.6, 26.4] for Low, Medium, and High tertiles, respectively. Median relative humidity did not follow a consistent pattern, being highest in the Low tertile at 74% and similar in Medium and High tertiles at 58% for both. While the temperature data indicated that it was mostly within thermal comfort ranges, humidity levels often exceeded 50%.
Train trips predominantly occupied the lower CO₂ tertiles, comprising 92.3% of Low tertile trips and 100% of Medium tertile trips, but only 33.3% of High tertile trips. Conversely, bus trips were heavily concentrated in the High tertile, representing 66.7% of these trips, with minimal representation in Low (7.7%) and no representation in Medium tertiles. Route-specific patterns emerged, with Heredia-UCR and Cartago-UCR routes showing the most diverse distribution across tertiles, while Heredia-Rio Segundo and Atlantico-Heredia routes were exclusively represented in the Low tertile.
The highest recorded 95th percentile values—reaching 5,000 ppm—were observed on trips along the Heredia-UCR bus routes. Some Cartago-UCR trips also reached values over 4,900 ppm. Intermediate values were observed on the Heredia–Atlántico and Atlántico–Heredia routes.
Overall, the data in Table 1 suggest substantial CO₂ accumulation inside both train and bus cabins, particularly during longer trips. These findings point to the need for targeted interventions to improve in-cabin air quality, although even shorter routes showed persistent ventilation challenges.
3.3. Trip Duration and Infection Transmission Risk Relations
The scatter plot analysis (Figure 4) revealed distinct patterns in the relationship between trip duration and CO₂ concentrations across transport modes. For the 95th percentile CO₂ measurements, train trips (represented by green dots) consistently demonstrated lower CO₂ concentrations across all trip durations, with values generally ranging from approximately 1,000 to 3,000 ppm regardless of trip length. In contrast, bus trips (orange dots) showed considerably higher 95th percentile CO₂ concentrations, with values extending up to 5,000-6,000 ppm, particularly for longer duration trips.
The median CO₂ concentrations followed a similar pattern but with less pronounced differences between transport modes. Train trips maintained relatively stable median CO₂ levels between 1,000-2,500 ppm across varying trip durations, while bus trips exhibited greater variability and generally higher concentrations, with several trips exceeding 3,000-4,000 ppm median CO₂ levels. Both transport modes showed some degree of positive correlation between trip duration and CO₂ concentrations, though this relationship was more pronounced for bus trips.
The relationship between trip duration and rebreathed air fraction demonstrated clear modal differences. Train trips consistently maintained lower rebreathed air fractions, typically ranging from 0.01 to 0.08 (1-8%) across all trip durations. Bus trips exhibited substantially higher rebreathed air fractions, with values extending up to 0.12-0.15 (12-15%). Most bus trips with durations exceeding 40 minutes showed rebreathed air fractions above 0.06 (6%).
Rebreathed air volume showed the most pronounced differences between transport modes. Train trips generally maintained rebreathed air volumes below 20-30 litres even for longer journeys, with most trips showing volumes under 15 litres. Bus trips demonstrated substantially higher rebreathed air volumes, with several trips exceeding 50-70 litres, particularly for journeys longer than 40 minutes. The longest bus trips showed rebreathed air volumes approaching 80 litres, representing a four-fold increase compared to typical train trip values.
The scatter plots revealed clear clustering patterns by transport mode across all measured ventilation and infection risk parameters. Train trips formed a distinct cluster in the lower ranges of all metrics (CO₂ concentrations, rebreathed air fraction, and rebreathed air volume), while bus trips showed greater dispersion and consistently higher values. This clustering was most pronounced for rebreathed air volume, where the separation between train and bus trips was nearly complete, with minimal overlap between the two transport modes.
4. Discussion
Overall, the results highlight widespread challenges in maintaining good indoor air quality across public transportation modes in the GMA, with more severe issues observed in buses than trains. A finding that compares well with the relevant literature (Lee et al., 2022; Ogundiran et al., 2025a, 2025b). Future investigations should consider real-time measurements of occupancy, door opening events, outdoor weather conditions, and ventilation rates to better understand the dynamics of CO₂ buildup inside moving vehicles.
4.1. Transport Mode Differences and Ventilation Performance
The striking disparity in CO₂ concentrations between train and bus trips reflects fundamental differences in ventilation design and passenger density management. Trains demonstrated superior ventilation performance, with most trips falling within the Low and Medium CO₂ tertiles, suggesting better air exchange rates and lower air recirculation fraction. Trains also had the advantage of more frequent stops where the doors open, allowing for air exchange with the outside.
Such differences of CO₂ accumulation and rebreathed air between the transportation modes has also been noted in studies performed in South Africa, examining transmission of tuberculosis on board public transport (Andrews et al., 2013). Similar studies have shown higher risks of transmission aboard public transport, as compared to other congregate public settings (Deol et al., 2022). This implies that the public transportation system can also present a suitable target for interventions to reduce airborne transmission in community settings.
The concentration of bus trips in the High CO₂ tertile (66.7%) indicates significant ventilation challenges in the urban bus fleet studied. This pattern may reflect several factors including higher passenger density relative to vehicle volume, more frequent door openings that disrupt air circulation patterns, and potentially different operational practices regarding the mechanical ventilation use.
The clustering of train trips in the lower ranges of all ventilation metrics (in Figure 4) suggests that rail transport infrastructure provides more consistent and effective air quality management. The relatively stable performance across varying trip durations indicates that train ventilation systems are likely better designed, with the typical passenger loads
4.2. Route-Specific Ventilation Patterns and Operational Factors
The route-specific distribution of CO₂ levels reveals important operational and infrastructure-related factors. The Heredia-UCR route's predominance in the High tertile (58.3% of High tertile trips) suggests this route puts the highest exposure risks on the passengers. This could be attributed to longer trip segments without adequate air exchange, higher passenger loading factors, or the use of older/less well-maintained vehicles on this route. Conversely, routes like Heredia-Rio Segundo and Atlantico-Heredia showed exclusively Low tertile CO₂ concentrations, indicating consistently better ventilation performance. The Cartago-UCR route showed the most balanced distribution across all tertiles, suggesting heterogeneous conditions or mixed vehicle types serving this route.
4.3. Trip Duration and CO₂ Accumulation Dynamics
The clear positive association between trip duration and CO₂ tertile classification demonstrates the time-dependent nature of CO₂ accumulation in enclosed transport environments. Longer trips provide more opportunity for CO₂ buildup, particularly in vehicles with inadequate ventilation rates relative to passenger loads.
The rebreathed air metrics show particularly concerning escalation across tertiles, with the High tertile showing nearly four-fold higher rebreathed air fractions (10.0% vs 2.7%) and more than six-fold higher rebreathed air volumes (35.5 L vs 5.4 L) compared to the Low tertile. These substantial differences underscore the potential for significantly elevated infection transmission risks in poorly ventilated vehicles, especially during longer journeys.
The relation between trip duration and air quality degradation was particularly evident in bus trips. For bus trips, the steeper slopes in the duration-ventilation relationships suggest the current ventilation systems’ inadequacy for the longer journeys.
The rebreathed air volume metric showed the most dramatic duration-dependent increases, particularly for bus trips, where values could exceed 70-80 litres for longer journeys. This substantial accumulation of rebreathed air represents a significant infection transmission risk, as passengers are increasingly exposed to potentially contaminated air from other occupants.
4.4. Environmental Conditions and Thermal Comfort Considerations
The absence of a clear humidity trend across CO₂ tertiles, with the Low tertile showing the highest median humidity (74%), suggests that humidity levels are not directly correlated with ventilation performance in this dataset. This counterintuitive finding may indicate that vehicles with poorer ventilation (higher CO₂) operate with different climate control strategies, potentially prioritizing dehumidification (using cooling) over fresh air exchange.
The slight increase in temperature across CO₂ tertiles (22.0 °C to 23.0 °C median values) may reflect the higher heat load associated with higher passenger densities or reduced cooling efficiency in poorly ventilated vehicles. However, the modest temperature differences suggest that thermal comfort considerations may be the primary driver of the vehicle’s AC system operation. This potentially led to inadequate fresh air provision despite acceptable temperature conditions, while minimizing fuel usage for AC.
4.5. Operational and Policy Implications: Modal Risk Stratification
The substantial variation in infection risk indicators across transport modes and routes demonstrates the need for targeted interventions rather than uniform policies. The consistently high fraction of time above 800 ppm CO₂ (94% across all tertiles) indicates that the public transportation vehicles have very low levels of outdoor ait ventilation. This raises question regarding the adequacy of such air quality for preventing airborne transmission during peak occupancy periods.
Routes with longer trip times may require enhanced ventilation protocols, such as mandatory fresh air exchanges during intermediate stops, reduced passenger capacity limits, or deployment of vehicles with superior ventilation systems. The clear performance differences also support the implementation of mode-specific ventilation standards, thresholds for CO₂ monitoring, monitoring protocols, and targeted infrastructure investments in bus fleet ventilation systems.
The clustering patterns observed in the data indicate that simple CO₂ monitoring could effectively distinguish between acceptable and concerning ventilation performance in real-time operations. This approach could enable targeted interventions and resource allocation to address the highest-risk scenarios while maintaining practical operational flexibility.
The data also suggests that train travel may represent a lower-risk option for public transport, particularly during periods of high community transmission of respiratory pathogens.
4.7. Study Limitations
A key limitation of the present study lies in its exclusive reliance on CO₂ measurements as a proxy for air quality, which restricts the comprehensiveness of the environmental assessment. This approach does not account for other critical pollutants such as particulate matter or volatile organic compounds.
Moreover, using a single parameter might overlook spatial and functional variability within transport vehicles. The seating place during the data collection was not controlled. However, differences between driver cabins and passenger areas may exhibit distinct air quality conditions. This had been pointed out in a previous study reporting that CO₂ concentrations were higher towards the back of the bus than close to the driver position (Chiu et al., 2015).
Relying solely on CO₂ data also limits the capacity to assess long-term exposure risks for transport workers and frequent commuters, whose cumulative exposure to suboptimal environments may have significant health implications. In addition, the study did not address the energy demands associated with air conditioning systems in public transportation.
It was also beyond the scope of this research to evaluate the required minimum fresh air intake rates necessary for air quality improvements with alternative air-conditioning operation modes, nor did it consider the potential confounding effects of poor outdoor air quality in high-traffic urban environments.
Notwithstanding these limitations, our study suggests that CO₂ monitoring remains a valuable indicator for assessing ventilation effectiveness and potential exposure to rebreathed air in mass transit environments and argues for a reevaluation of current ventilation practices in public transportation.
Author Contributions
Conceptualization, JAPS and AKM; methodology, JAPS and AKM; software, JAPS and AKM; formal analysis, JAPS and AKM; investigation, JAPS, JFF, and AKM; resources, JAPS; data curation, JAPS; writing—original draft preparation, JAPS, AKM, and JFF; writing—review and editing, JAPS, AKM, and JFF; visualization, JAPS; project administration, JAPS; funding acquisition, JAPS and AKM. All authors have read and agreed to the published version of the manuscript.
Funding
AKM is a Dorothy and Marie Skłodowska-Curie fellow, partly funded by the European Union's Horizon 2020 research and innovation programme under the Marie Skłodowska-Curie grant agreement No 101034345.
Data Availability Statement
Data available upon request.
Acknowledgments
The authors thank the volunteers who assisted with data acquisition and the Laboratorio de Arquitectura Tropical (LAT-UCR) at the University of Costa Rica for providing the measurement instruments.
Conflicts of Interest
The authors declare no conflict of interest
References
- Andrews, J. R., Morrow, C., & Wood, R. (2013). Modeling the role of public transportation in sustaining tuberculosis transmission in South Africa. American Journal of Epidemiology, 177(6), 556–561. [CrossRef]
- Ardila, A. (2008). Limitation of Competition in and for the Public Transportation Market in Developing Countries: Lessons from Latin American Cities. Transportation Research Record, 2048, 8–15. [CrossRef]
- ARESEP. (2021, November 15). ARESEP transparenta datos del servicio de bus. https://aresep.go.cr/noticias/aresep-transparenta-datos-del-servicio-de-bus/.
- Barone, G., Buonomano, A., Forzano, C., Giuzio, G. F., & Palombo, A. (2022). Energy, Economic, and Environmental Impacts of Enhanced Ventilation Strategies on Railway Coaches to Reduce Covid-19 Contagion Risks. Energy, 256. [CrossRef]
- Deol, A. K., Shaikh, N., Middelkoop, K., Mohlamonyane, M., White, R. G., & McCreesh, N. (2022). Importance of ventilation and occupancy to Mycobacterium tuberculosis transmission rates in congregate settings. BMC Public Health, 22(1). [CrossRef]
- Enis Cetin, A., Ozturk, Y., Hanosh, O., & Ansari, R. (2021). Review of signal processing applications of Pyroelectric Infrared (PIR) sensors with a focus on respiration rate and heart rate detection. Digital Signal Processing: A Review Journal, 119. [CrossRef]
- Estupiñan, N., Scorcia, H., Navas, C., Zegras, C., Rodríguez, D., Vergel-Tovar, E., Gakenheimer, R., Azán-Otero, S., & Vasconcellos, E. (2018). Transporte y Desarrollo en América Latina (Vol. 1, Issue 1).
- Göhlich, D., Ly, T., Kunith, A., & Jefferies, D. (2015). Economic Assessment of Different Air-Conditioning and Heating Systems for Electric City Buses Based on Comprehensive Energetic Simulations. World Electric Vehicle Journal, 7(3), 398–406. [CrossRef]
- Hallett, S., Toro, F., & Ashurst, J. V. (2018). Physiology, Tidal Volume. In StatPearls. StatPearls Publishing LLC. https://www.ncbi.nlm.nih.gov/books/NBK482502/.
- Lee, J. J., Hwang, H., Hong, S. C., & Lee, J. Y. (2022). Effect of Air Purification Systems on Particulate Matter and Airborne Bacteria in Public Buses. Atmosphere, 13(1). [CrossRef]
- Motorindia. (2018). Air-conditioning in buses: Keeping commuters ‘Cool.’ https://www.motorindiaonline.in/air-conditioning-in-buses-keeping-commuters-cool/.
- Nathavitharana, R. R., Mishra, H., Sullivan, A., Hurwitz, S., Lederer, P., Meintjes, J., Nardell, E., & Theron, G. (2022). Predicting Airborne Infection Risk: Association Between Personal Ambient Carbon Dioxide Level Monitoring and Incidence of Tuberculosis Infection in South African Health Workers. Clinical Infectious Diseases, 75(8), 1297–1306. [CrossRef]
- O`neal Coto, K. (2016, June 3). Más del 60% de los universitarios utiliza transporte público. https://www.ucr.ac.cr/noticias/2016/06/03/mas-del-60-de-los-universitarios-utiliza-transporte-publico.html.
- Ogundiran, J. O., Nyembwe, J. P. K. B., Ogundiran, J., Ribeiro, A. S. N., & Gameiro da Silva, M. (2025a). A Systematic Review of Indoor Environmental Quality in Passenger Transport Vehicles of Tropical and Subtropical Regions. In Atmosphere (Vol. 16, Issue 2). Multidisciplinary Digital Publishing Institute (MDPI). [CrossRef]
- Ogundiran, J. O., Nyembwe, J. P. K. B., Ogundiran, J., Ribeiro, A. S. N., & Gameiro da Silva, M. (2025b). A Systematic Review of Indoor Environmental Quality in Passenger Transport Vehicles of Tropical and Subtropical Regions. In Atmosphere (Vol. 16, Issue 2). Multidisciplinary Digital Publishing Institute (MDPI). [CrossRef]
- Peel, M. C., Finlayson, B. L., & Mcmahon, T. A. (2007). Updated world map of the Koppen-Geiger climate classification. Hydrology and Earth System Sciences, 11, 1633–1644.
- Persily, A. K. (2015). Challenges in developing ventilation and indoor air quality standards: The story of ASHRAE Standard 62. Building and Environment, 91, 61–69. [CrossRef]
- Persily, A. K. (2022). Development and application of an indoor carbon dioxide metric. Indoor Air, 32(7). [CrossRef]
- ProPECC, P. N. (2003). Practice Note for Managing Air Quality in Air-conditioned Public Transport Facilities.
- Rudnick, S. N., & Milton, D. K. (2003). Risk of indoor airborne infection transmission estimated from carbon dioxide concentration. Indoor Air, 13, 237–245. www.blackwellpublishing.com/ina.
- ARESEP. (2021, February 1). Usuarios evalúan el servicio de autobús. https://aresep.go.cr/noticias/usuarios-evaluan-servicio-autobus/.
- Widmer, F., van Dooren, S., & Onder, C. H. (2025). Optimization of the Energy-Comfort Trade-Off of HVAC Systems in Electric City Buses Based on a Steady-State Model. Control Engineering Practice, 154. [CrossRef]
- Yañez-Pagans, P., Martinez, D., Mitnik, O. A., Scholl, L., & Vazquez, A. (2019). Urban transport systems in Latin America and the Caribbean: lessons and challenges. Latin American Economic Review, 28(1). [CrossRef]
Figure 1.
Ventilation modes in public transport, buses (A, B) and urban trains (C, D), where air is circulated within the cabin (A, C) without any fresh air intake, and with outdoor air intake (B, D).
Figure 1.
Ventilation modes in public transport, buses (A, B) and urban trains (C, D), where air is circulated within the cabin (A, C) without any fresh air intake, and with outdoor air intake (B, D).
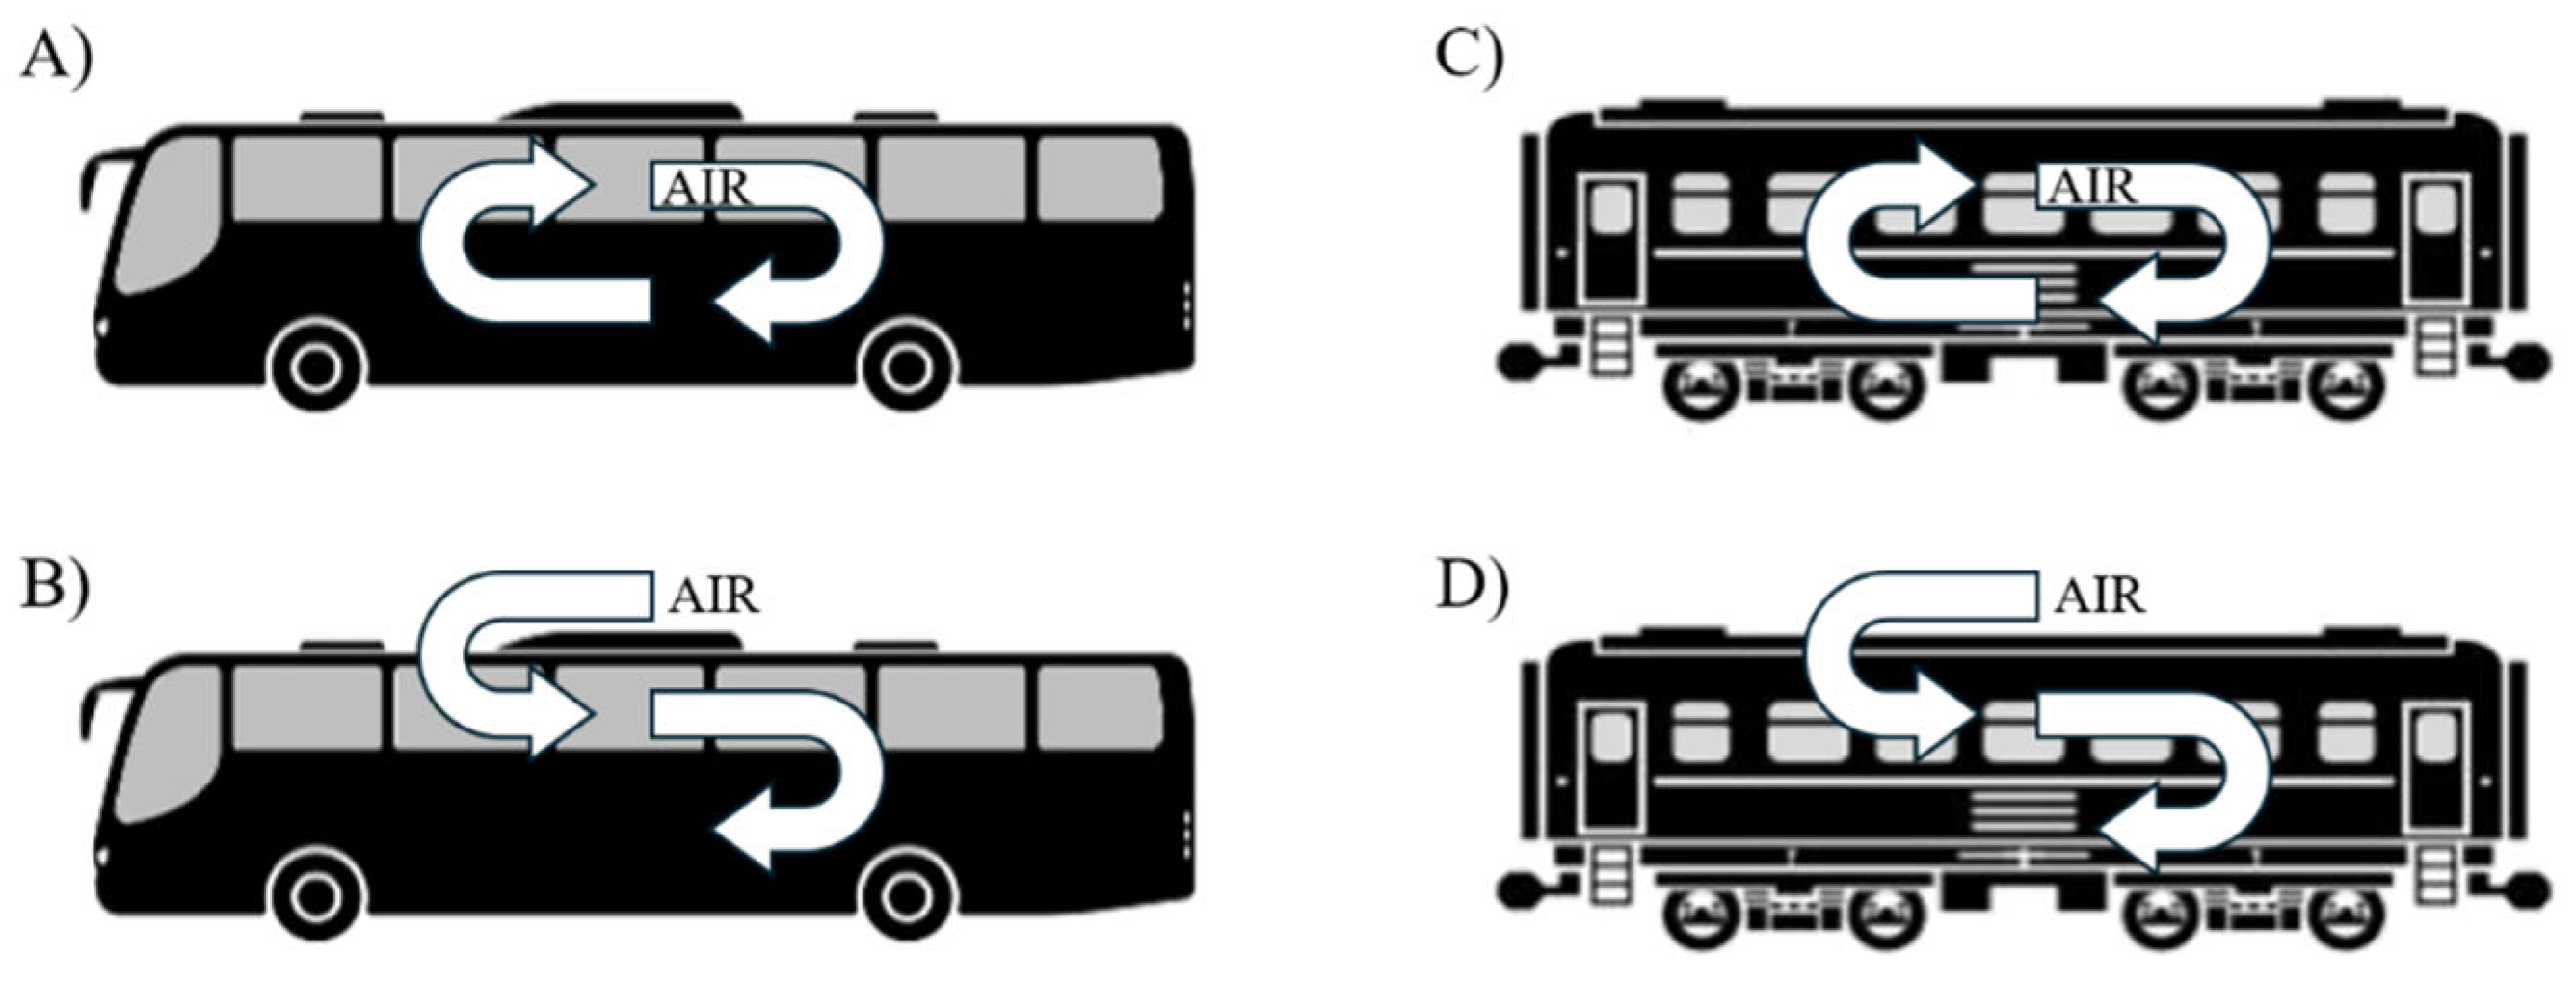
Figure 2.
The map shows the location of the cities and the selected bus routes (large, dashed line) and train routes (small, dashed line) in the central region of Costa Rica. The names of other major train stops on the route are also shown on the map.
Figure 2.
The map shows the location of the cities and the selected bus routes (large, dashed line) and train routes (small, dashed line) in the central region of Costa Rica. The names of other major train stops on the route are also shown on the map.
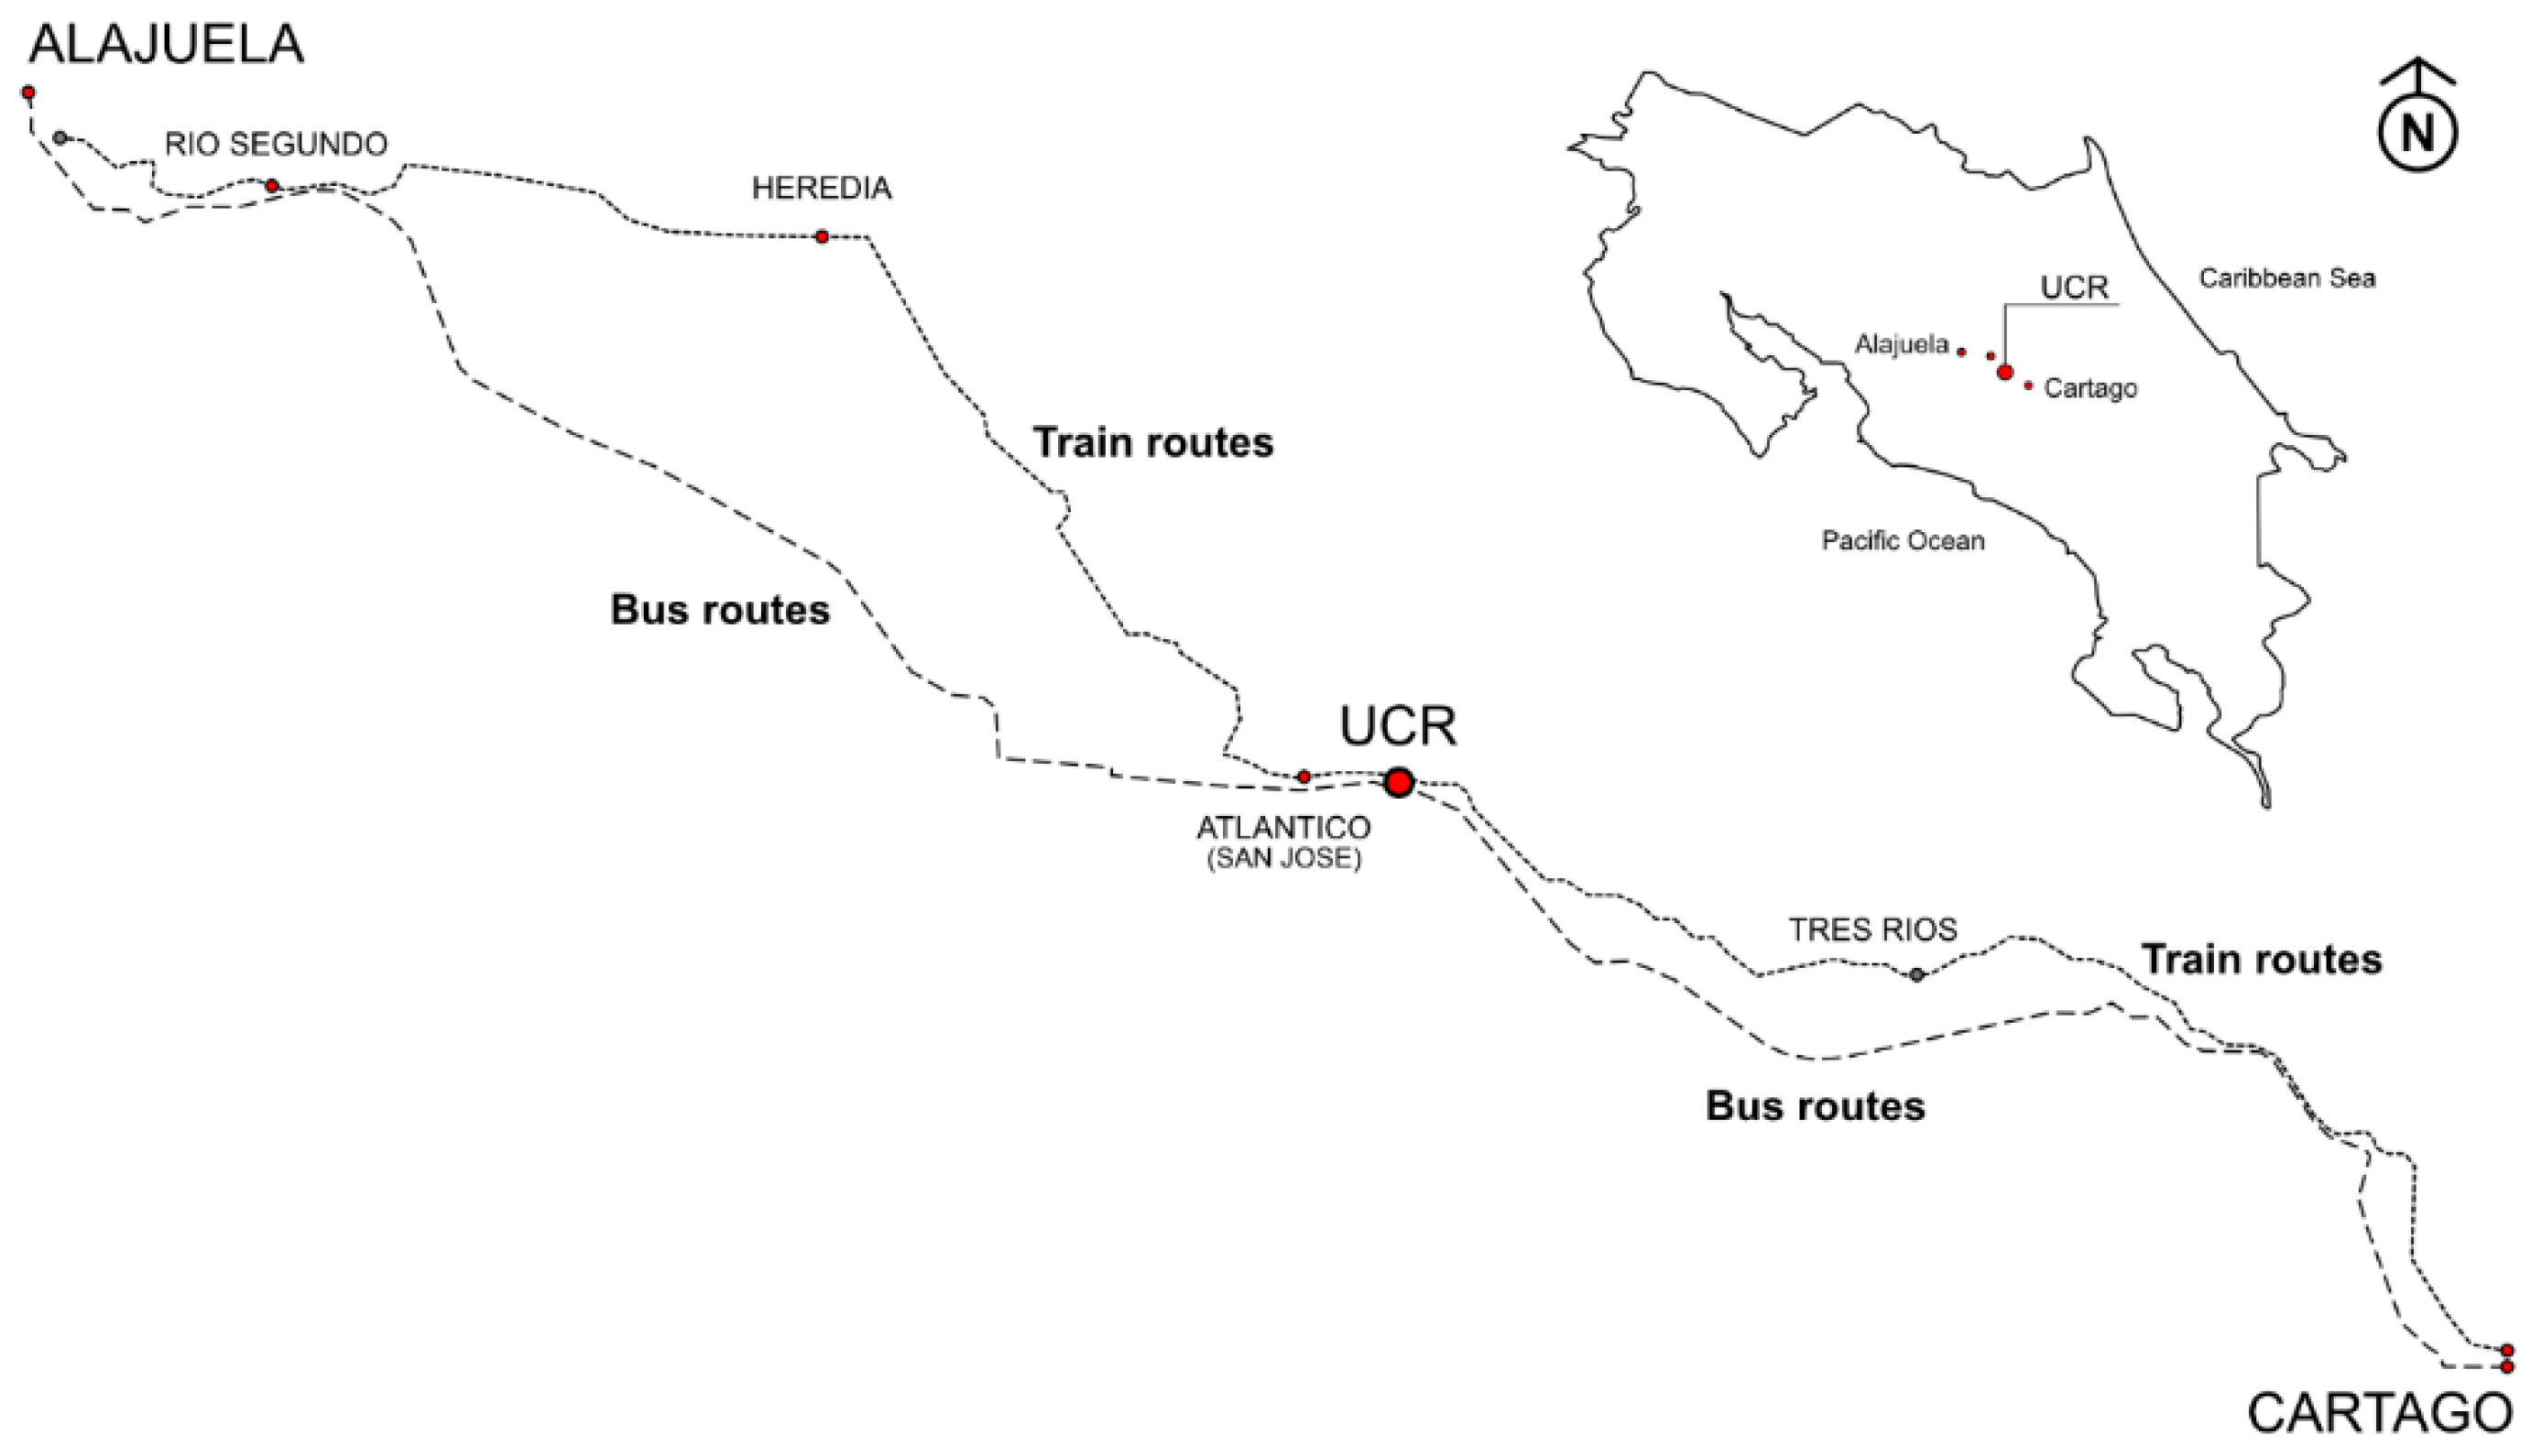
Figure 3.
Pictures 1 to 3 present the exterior (1) and interior cabins (2 and 3) of the Diesel Multiple Unit (DMU) trains. Pictures 4 and 5 show the exterior and interior of the buses, respectively. Picture 6 displays the CO₂ measurement equipment and illustrates how the sensors were securely attached to the backpack.
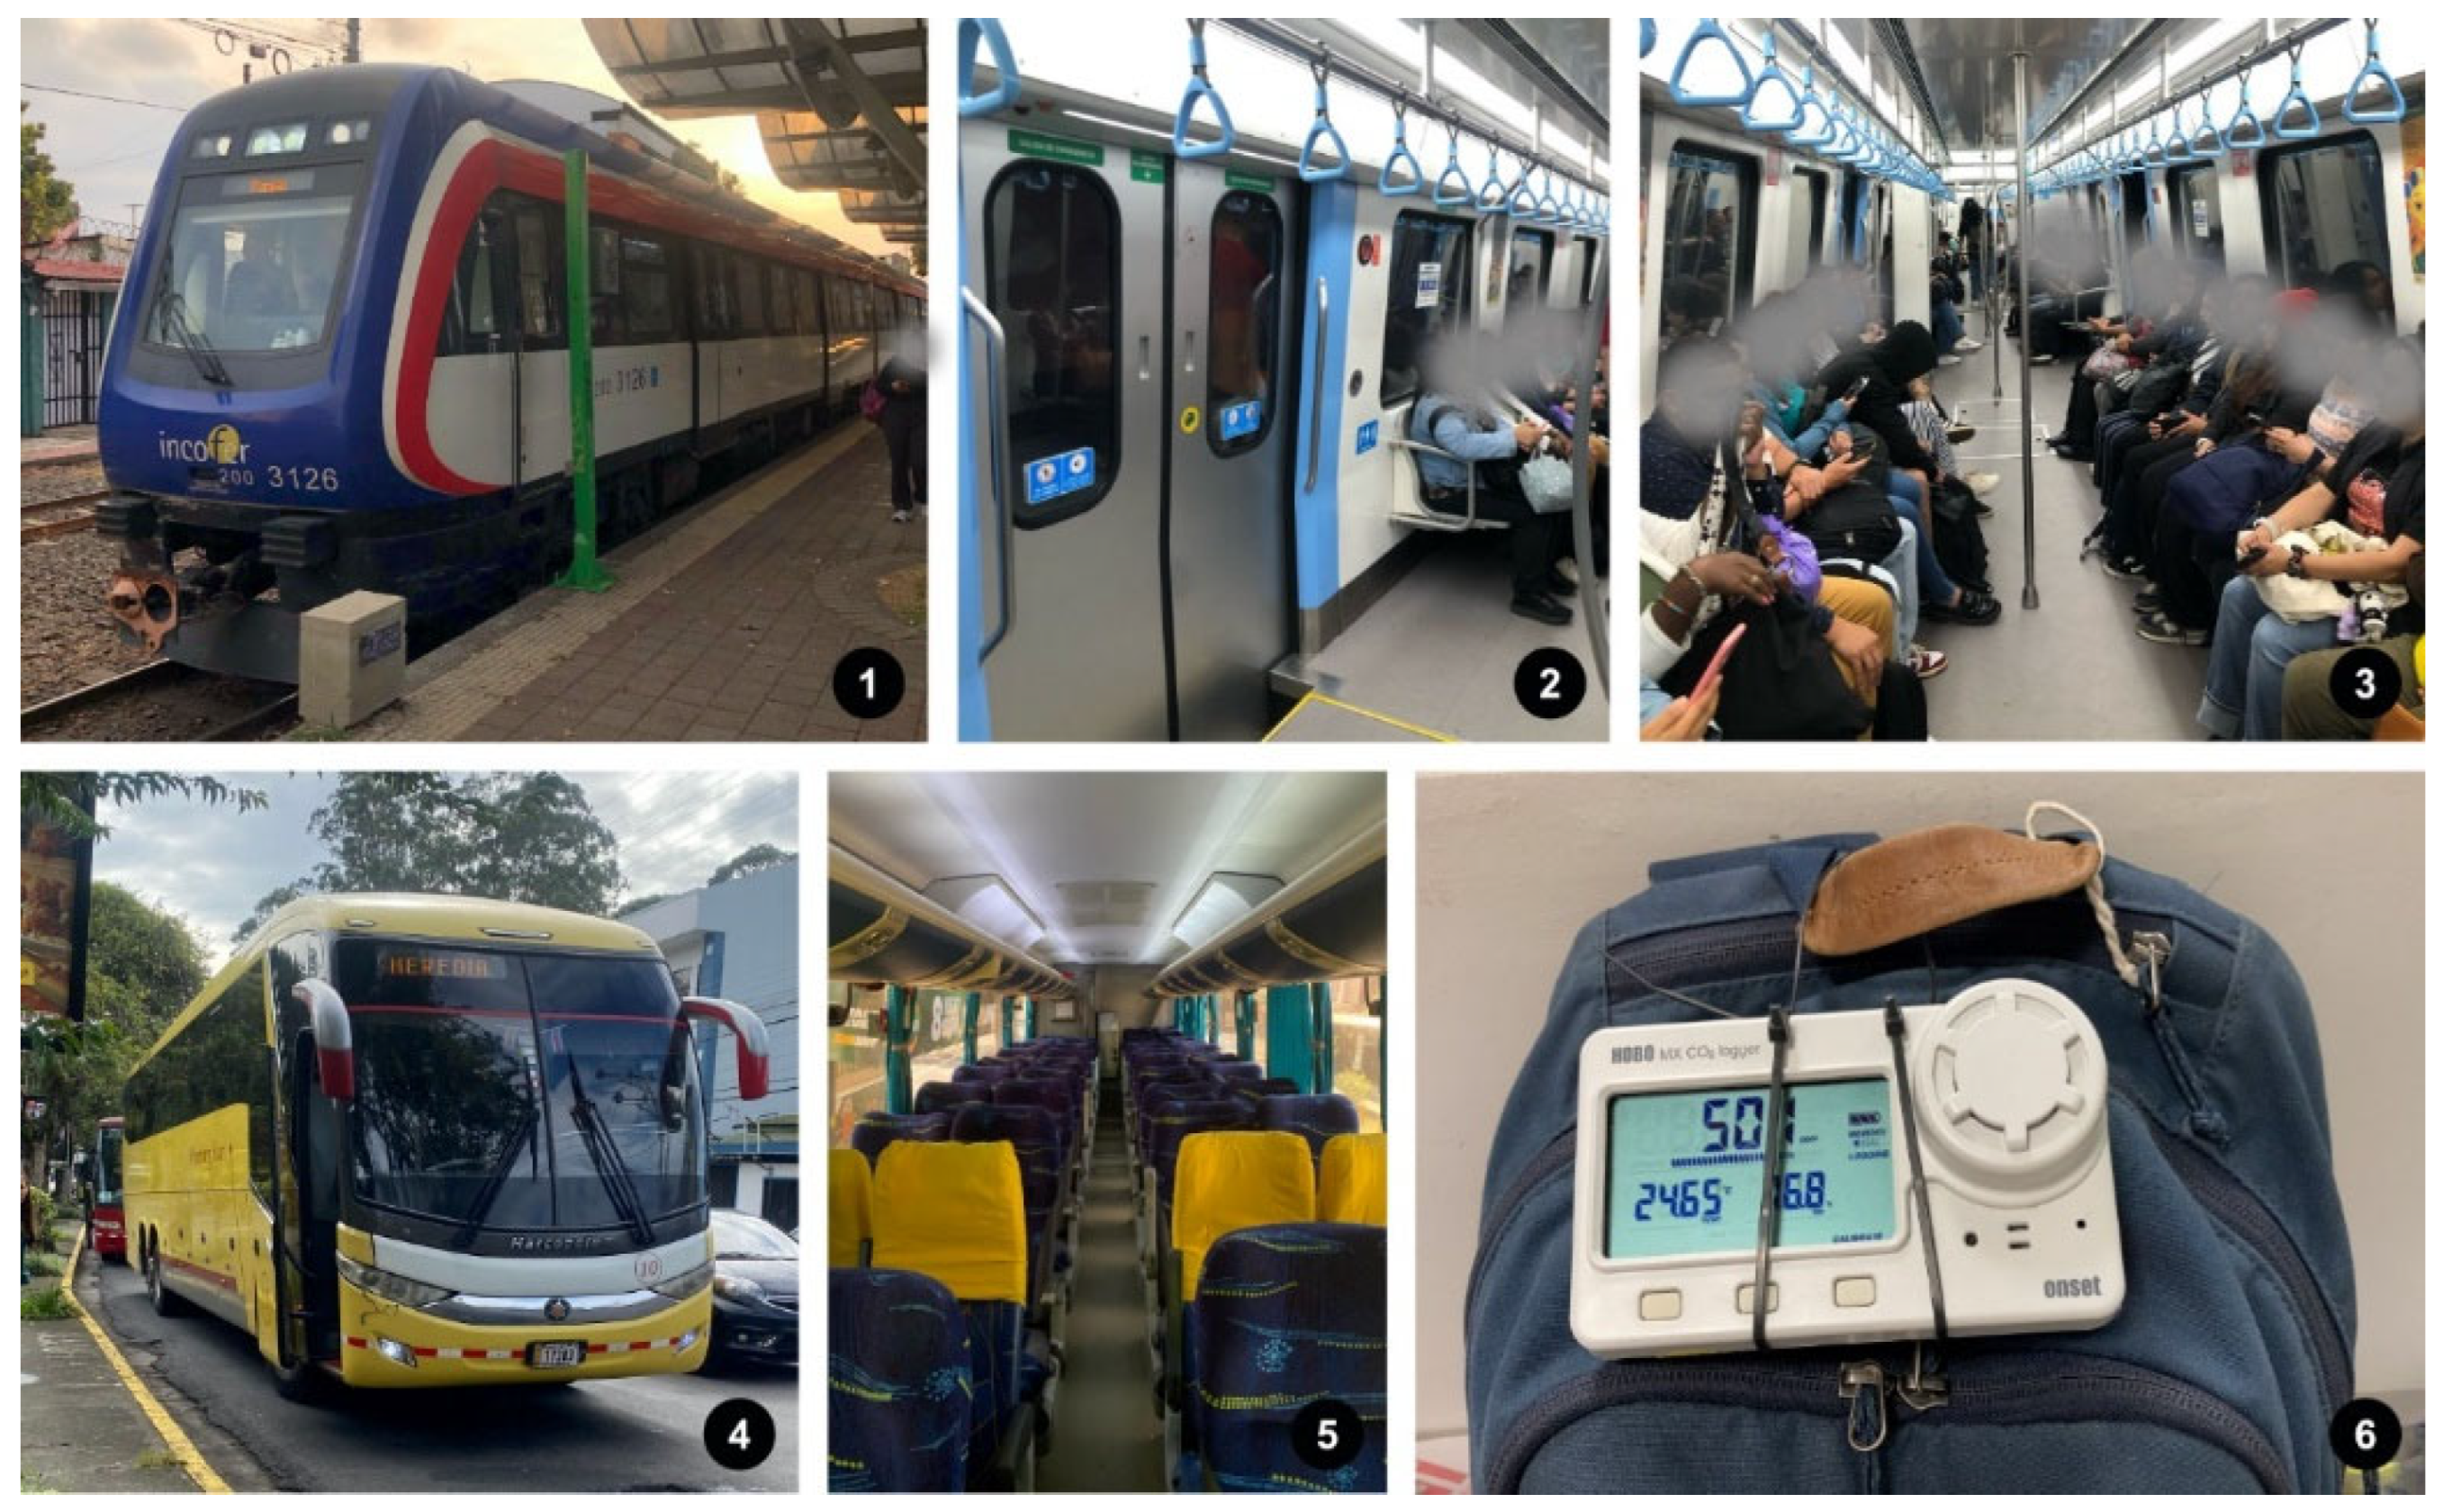
Figure 4.
Scatter plot showing the relation between the train and bus trip duration and CO₂ measurements (a. 95th percentile, b. median), rebreathed air fraction (f) (c.) as the proportion of air composed of previously exhaled breath, and rebreathed air volume (d.). Green and orange dots correspond to train and bus trips respectively.
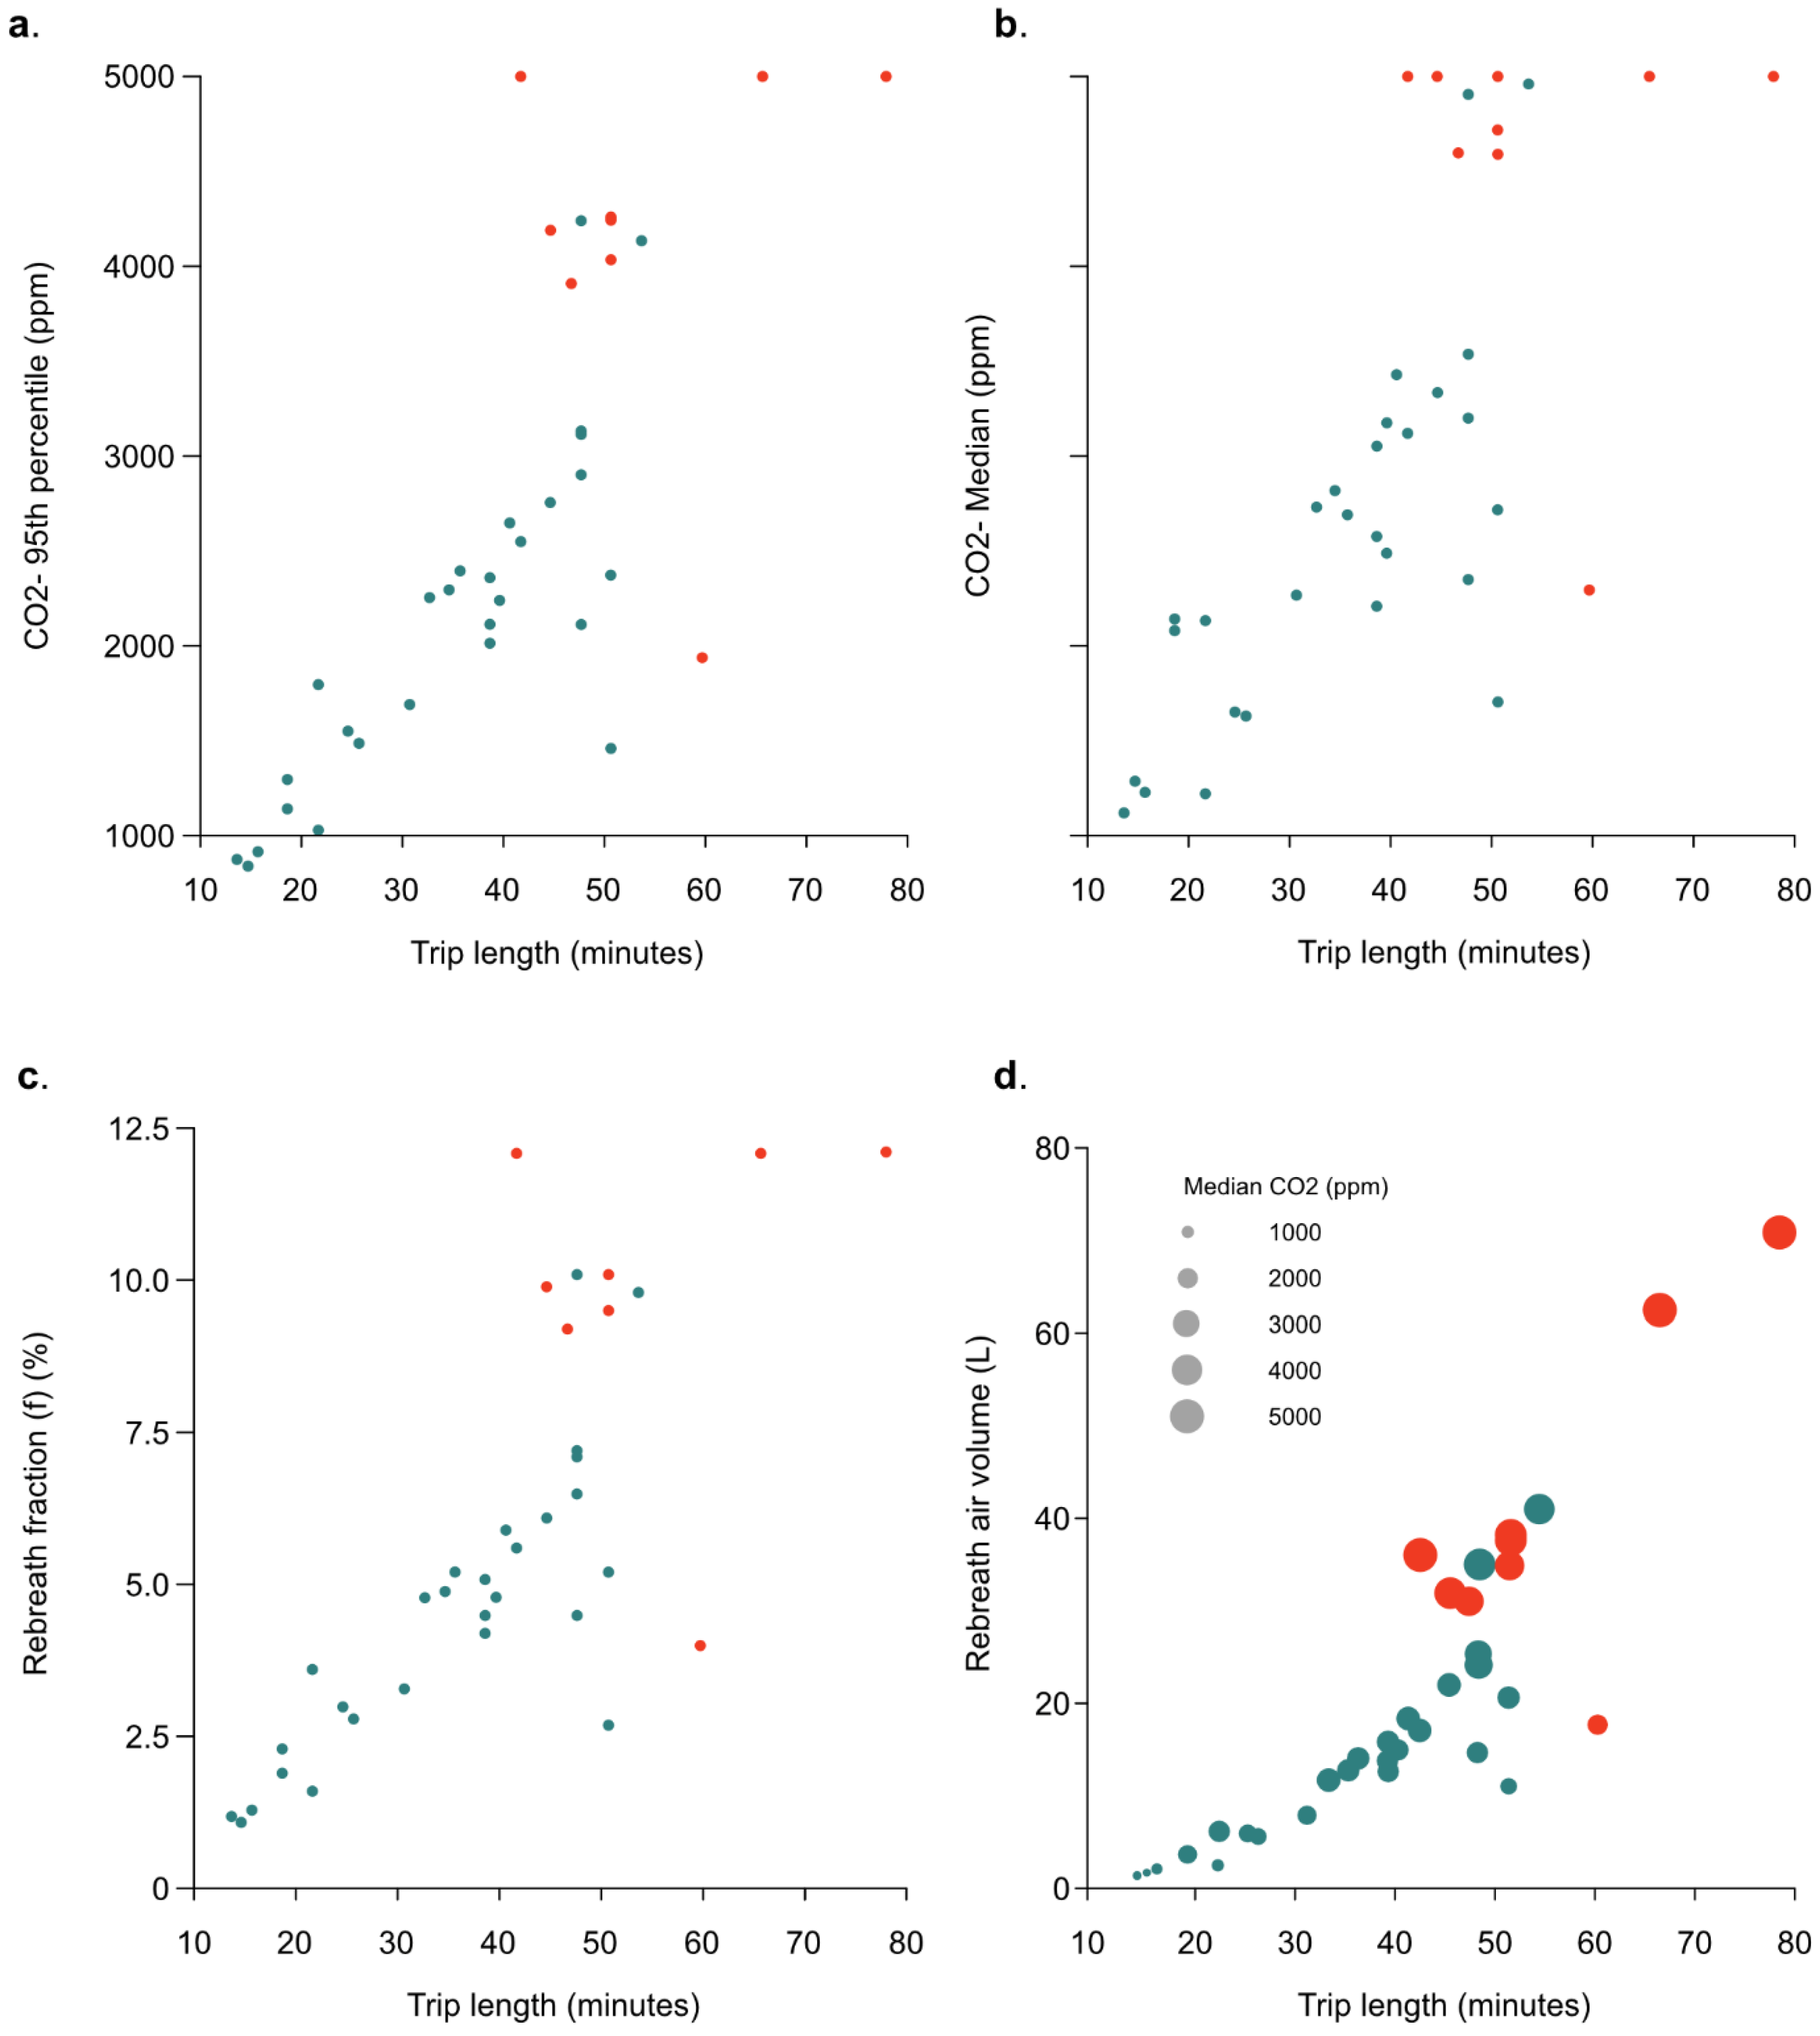

Table 1.
Summary statistics of the trips – an “epidemiology style Table 1”. Data summarized as Median [5th, 95th] percentiles.
Table 1.
Summary statistics of the trips – an “epidemiology style Table 1”. Data summarized as Median [5th, 95th] percentiles.
|
Low (N=13) |
Medium (N=12) |
High (N=12) |
Total (N=37) |
|
| Median CO₂ during trip (ppm) | 1456 [859, 1965] | 2364 [2113, 2818] | 4210 [3123, 5000] | 2354 [908, 5000] |
| Median temperature during trip (°C) | 22.0 [19.0, 24.4] | 22.0 [20.6, 25.9] | 23.0 [19.6, 26.4] | 22.0 [19.0, 26.2] |
| Median relative humidity during trip (%) | 74 [56, 89] | 58 [46, 77] | 58 [46, 77] | 63 [46, 85] |
| 95th Percentile of CO₂ during trip (ppm) | 1702 [1181, 2276] | 2935 [2474, 3378] | 4930 [3536, 5000] | 2820[1225, 5000] |
| Trip length (minutes) | 22.0 [14.6, 54.6] | 40.5 [34.1, 49.3] | 49.5 [43.7, 71.4] | 42.0 [15.8, 61.2] |
| Fraction of time over 800 ppm CO₂ (%) | 94.0 [63.6, 100.0] | 94.0 [87.0, 100.0] | 94.0 [93.0, 100.0] | 94.0 [72.0, 100.0] |
| Rebreathed air fraction (%) | 2.7 [1.2, 4.1] | 5.2 [4.5, 6.3] | 10.0 [7.2, 12.1] | 5.1 [1.3, 12.1] |
| Rebreathed air volume (L) | 5.4 [1.4, 14.7] | 15.2 [12.2, 22.8] | 35.5 [24.8, 66.2] | 15.7 [1.8, 45.3] |
| Route of the trip | ||||
| Alajuela-UCR | 0 (0%) | 0 (0%) | 1 (8.3%) | 1 (2.7%) |
| Atlantico-Heredia | 4 (30.8%) | 0 (0%) | 0 (0%) | 4 (10.8%) |
| Cartago-UCR | 2 (15.4%) | 7 (58.3%) | 4 (33.3%) | 13 (35.1%) |
| Heredia-Rio Segundo | 6 (46.2%) | 0 (0%) | 0 (0%) | 6 (16.2%) |
| Heredia-UCR | 1 (7.7%) | 5 (41.7%) | 7 (58.3%) | 13 (35.1%) |
| Mode of public transport | ||||
| Bus | 1 (7.7%) | 0 (0%) | 8 (66.7%) | 9 (24.3%) |
| Train | 12 (92.3%) | 12 (100%) | 4 (33.3%) | 28 (75.7%) |
Disclaimer/Publisher’s Note: The statements, opinions and data contained in all publications are solely those of the individual author(s) and contributor(s) and not of MDPI and/or the editor(s). MDPI and/or the editor(s) disclaim responsibility for any injury to people or property resulting from any ideas, methods, instructions or products referred to in the content. |
© 2025 by the authors. Licensee MDPI, Basel, Switzerland. This article is an open access article distributed under the terms and conditions of the Creative Commons Attribution (CC BY) license (http://creativecommons.org/licenses/by/4.0/).
Copyright: This open access article is published under a Creative Commons CC BY 4.0 license, which permit the free download, distribution, and reuse, provided that the author and preprint are cited in any reuse.


