

Submitted:
23 June 2025
Posted:
24 June 2025
You are already at the latest version
Abstract
This study examines the relationship between parasitic infections, inflammation, and anemia in adolescent athletes from Tacna, Peru. A cross-sectional analysis was conducted on 250 athletes aged 13 to 18 years, measuring hematological markers (hemoglobin, hematocrit, and ferritin) and inflammatory markers PCR (C-Reactive Protein). Parasitic infections were present in 30% of the athletes, with an overall anemia prevalence of 15%, higher among older adolescents (16-18 years, 18%) compared to younger athletes (13-15 years, 12%). Significant correlations were found between parasitic infections and PCR (r = 0.58) as well as anemia (r = 0.70). Hemoglobin and hematocrit were negatively correlated with anemia (r = -0.80 and r = -0.78, respectively). Logistic regression identified PCR as a significant predictor of anemia (OR = 1.25, p < 0.001), while BMI (Body Mass Index) showed no significant association. The findings suggest that parasitic infections and chronic inflammation are key drivers of anemia in this population. Early intervention through regular monitoring of hematological and inflammatory markers is critical to preventing anemia and improving the health and performance of at-risk athletes. Public health strategies, including periodic deworming and nutritional supplementation, are necessary to reduce the anemia burden in regions with high parasitic infection prevalence. Objective: To assess the relationship between inflammatory markers, nutritional status, and parasitic infections with the prevalence of anemia in adolescent athletes from sports academies in Tacna, Peru.
Keywords:
anemia
; parasitic infections
; adolescent athletes
; inflammation
; C-reactive protein
; iron deficiency
1. Introduction
The practice of sports offers numerous health benefits, including enhanced cardiovascular function, increased muscle and bone strength, and a reduced risk of chronic diseases. However, high-performance athletes experience greater physiological demands that can surpass the body’s natural recovery capacity, leading to significant changes in various physiological parameters, particularly hematological ones (Yip, 2001). Monitoring these changes is vital not only for assessing athlete health but also for optimizing performance (Peeling & Dawson, 2008).
Hematological parameters, including red blood cell count, hemoglobin levels, and white blood cell count, are critical indicators of overall health (Smith & Roberts, 2013). Anemia, characterized by reduced hemoglobin levels, is prevalent among adolescent athletes due to increased oxygen demands during intense physical activity (McClung et al., 2009). Adolescence, a period of rapid growth, requires meeting both physical and nutritional needs to ensure optimal performance and development (DellaValle, 2013).
Anemia affects approximately 24% of adolescents in Latin America, with higher rates in rural areas such as Tacna, Peru, where it exceeds 30%. This condition is frequently worsened by parasitic infections and nutritional deficiencies (WHO, 2021; MINSA, 2020). Endemic intestinal parasitic infections, particularly from Ascaris lumbricoides, Giardia lamblia, and Trichuris, impact 20%-40% of schoolchildren in rural regions (Stephenson et al., 2000; Crompton & Nesheim, 2002). These infections impair nutrient absorption, worsen iron-deficiency anemia, and contribute to systemic inflammation, further complicating anemia development (WHO, 2015).
This study aims to assess the relationship between inflammatory markers (such as C-reactive protein), nutritional status, and parasitic infections, and their association with anemia prevalence in adolescent athletes from sports academies in Tacna. The goal is to provide evidence to inform clinical and public health interventions for similar populations.
In Peru, parasitic infections pose a significant public health issue, particularly in rural regions with limited sanitation and inadequate healthcare access. According to the Peruvian Ministry of Health (MINSA), intestinal parasitic infections affect 20%-40% of rural schoolchildren, contributing to malnutrition and anemia (MINSA, 2020). Ascaris lumbricoides, Giardia lamblia, and Trichuris not only disrupt nutrient absorption but also trigger chronic inflammation, negatively impacting iron metabolism and exacerbating anemia (Stephenson et al., 2000; Ganz, 2011).
This study focuses on the three primary parasites: Ascaris, Giardia, and Trichuris. Although Necator and Ancylostoma (hookworm) are strongly associated with anemia and prevalent in certain regions of Peru, they were excluded from this study due to their lower prevalence in the specific study area (Tacna). These infections, prevalent in endemic regions, induce chronic inflammation, leading to anemia through iron homeostasis dysregulation. The role of parasitic infections in altering biochemical and hematological markers in athletes, who have high metabolic demands, is critical to understanding their health risks and performance. By investigating how these infections affect inflammation and iron bioavailability, this study aims to provide valuable insights for public health interventions in endemic regions.
Hematological markers, including hemoglobin, hematocrit, and inflammatory markers such as C-reactive protein (CRP), are essential for assessing overall health. Hemoglobin is the primary biomarker for diagnosing anemia, as it directly reflects the blood’s oxygen-carrying capacity, while hematocrit provides an indirect measure of overall hematological status (Weiss & Goodnough, 2005; WHO, 2015). CRP, an acute-phase protein produced in response to inflammation, is linked to hepcidin regulation, a key factor in iron metabolism and anemia development (Ganz, 2011; Lopez et al., 2016).
By integrating these biomarkers, this study provides a comprehensive understanding of how parasitic infections, inflammation, and iron metabolism interact, particularly in vulnerable populations such as adolescents in endemic regions. The results of this study will contribute to the development of targeted interventions aimed at reducing anemia prevalence and improving overall health in these populations.
2. Materials and Methods
2.1. Design and Study Population
This study followed a descriptive, cross-sectional design, with blood and stool samples collected at a single time point. The study population consisted of 250 male adolescents aged 13 to 18, enrolled in soccer academies in Tacna, Peru. Additionally, a comparison group of 150 non-athletic adolescents, matched for age, gender, and socioeconomic characteristics, was included. The non-athletic group was selected from a sample of students from the same region and age, but without the intense physical demands associated with sports.
Both groups were assessed for the prevalence of anemia, parasitic infections, and biochemical markers such as hemoglobin, CRP, ferritin, and serum iron. The comparison between the two groups was conducted to identify significant differences in the prevalence of anemia and its relationship to parasitic infections and inflammation.
The study was conducted in two phases. The first phase took place at the academies’ training facilities, where informational sessions were held for the athletes and their legal guardians. Informed consent was obtained during these sessions. The second phase occurred at the biology laboratory in the Faculty of Sciences, where the collected samples were processed and analyzed.
The total study population consisted of 400 adolescents selected based on pre-defined inclusion and exclusion criteria. All participants underwent a general medical examination and laboratory tests, adhering to a fasting period before sample collection. The study protocol was designed to ensure the validity and reliability of the results.
Inclusion criteria:
- Healthy male athletes aged 13 to 18 years.
- Active participation in soccer training for at least three months before sample collection.
- Signed informed consent from both the participants and their legal guardians.
- No diagnosed chronic diseases or recent antiparasitic treatments.
Exclusion criteria:
- Participants diagnosed with chronic conditions that could interfere with hematological parameters.
- Athletes inactive in training for over three months prior to sample collection.
- Participants on medication that could affect hematological or inflammatory markers, including steroids (e.g., dexamethasone), statins, or fibrates.
- Abnormal inflammatory markers due to non-parasitic causes, such as elevated Erythrocyte Sedimentation Rate (ESR).
- Failure to provide informed consent or comply with fasting requirements.
Initially, 300 athletes were evaluated from four sports academies in Tacna, of which 250 met the inclusion criteria and participated in the study. Exclusion reasons included pre-existing chronic conditions (n = 10), recent antiparasitic treatment (n = 20), and incomplete laboratory tests or questionnaires (n = 20).
The athletes were tested for:
- Hematological parameters: Hemoglobin, hematocrit, and red blood cell count.
- Inflammatory markers: C-reactive protein (CRP) levels.
- Parasitic infection: Stool samples were analyzed for Ascaris lumbricoides, Giardia lamblia, and Trichuris.
- Nutritional status: Serum levels of iron and ferritin.
2.2. Sample Collection, Transport, and Processing
Venous blood and stool samples were collected under sterile conditions following standard protocols, including the guidelines of the Ministry of Health (MINSA, 2013) and the Clinical and Laboratory Standards Institute (CLSI, 2017). Venous blood was collected using sterile 21G needles and vacuum tubes (Greiner Bio-One Vacuette®), and samples were transported at 4°C and processed within 4 hours to minimize hemolysis. Stool samples (~10 g per participant) were collected in sterile containers and transported to the laboratory under appropriate temperature conditions (4°C–8°C) for processing. Blood samples were centrifuged for serum separation, and stool samples were processed using centrifugal flotation. All samples were stored at temperatures below 5°C for further analysis.
References for the Techniques Used
- Sample collection and processing: Blood samples were collected following CLSI guidelines (CLSI, 2017), and stool samples were collected according to García (2016) for coproparasitological analysis.
- Parasitic infection detection: The centrifugal flotation method and Lugol staining were used for microscopic detection of parasite cysts and eggs (Ascaris lumbricoides, Giardia lamblia, and Trichuris) following Bowman (2014).
-
Biochemical and hematological tests:
- ○
- Hemoglobin: Determined using an automated hematology analyzer (Sysmex Corporation, 2018).
- ○
- Ferritin: Quantified by enzyme-linked immunosorbent assay (ELISA), following FDA guidelines (2020).
- ○
- C-reactive protein (CRP): Measured using an immunoturbidimetric assay (Beckman Coulter, 2017).
- ○
- Erythrocyte indices: Calculated based on red blood cell count and mean corpuscular volume (Schmidt et al., 2014).
- Anemia determination: Anemia was defined according to WHO (2011) criteria, considering hemoglobin levels <12 g/dL for adolescents.
- Data analysis: Data were recorded and analyzed using SPSS v26 software (IBM, 2019), ensuring validity through homogeneity and normality tests as recommended by Tabachnick and Fidell (2014).
Hematological parameters:
The MCV, MCH, and MCHC values were automatically determined using the GENRUI KT-6610 hematology analyzer (Genrui Biotech Inc., Shenzhen, China). The formulas employed by the device are as follows:
• MCV (fL): Hematocrit (%) × 10 / Red blood cell count (million/µL).
• MCH (pg): Hemoglobin (g/dL) × 10 / Red blood cell count (million/µL).
• MCHC (g/dL): Hemoglobin (g/dL) × 100 / Hematocrit (%).
2.3. Anthropometric Data and Nutritional Status
Height and body weight were measured using a calibrated digital scale (Tanita BC-601, Tokyo, Japan) and a stadiometer (Seca 213, Hamburg, Germany). Body mass index (BMI) was calculated by dividing weight in kilograms by height in meters squared, following the World Health Organization (WHO) guidelines (2013). The BMI classification was as follows: normal BMI was defined as 18.5-24.9 kg/m2, and athletes with a BMI outside this range were classified as underweight or overweight.
Anthropometric data also included the assessment of heart rate and blood pressure, which were recorded using a heart rate monitor and a sphygmomanometer, respectively, following the protocol of the American Heart Association (AHA) to ensure consistency in readings.
Physical Activity and Nutritional Status:
Physical activity levels were recorded using a structured questionnaire that assessed the hours of physical activity per week. Nutritional status was further evaluated using both anthropometric and biochemical measurements. Athletes were classified as either normal weight or underweight based on BMI and additional biochemical markers such as serum iron and ferritin levels. If an athlete had a normal BMI but low serum iron or ferritin levels, they were classified as underweight functionally, as these biochemical markers also reflect nutritional and hematological health.
References for the Techniques Used
- Anthropometric data: Height and body weight were measured using a calibrated digital scale and stadiometer, following WHO (2013) recommendations. BMI was calculated using the formula: BMI = weight (kg) / height (m2).
- Athletes were classified as underweight based on a body mass index (BMI) of less than 18.5 kg/m2, following the World Health Organization (WHO) guidelines (WHO, 2013). This classification was used to evaluate their nutritional status in relation to anemia and parasitic infections. Additional biochemical markers, including ferritin and serum iron, were also considered to further assess the impact of nutritional deficiencies on the athletes’ health.
2.3. Parasitic Infection Detection
Parasite detection was performed using standard methods, including centrifugal flotation and Lugol staining, for the identification of Ascaris lumbricoides, Giardia lamblia, and Trichuris, following protocols described by Bowman (2014).
Sample Collection
Participants were instructed to collect fresh fecal samples in sterile containers, ensuring an adequate volume of approximately 5 g. Precise guidelines were provided to avoid contamination and ensure sample integrity. Samples were transported and stored at 4°C until processed in the laboratory to minimize degradation. They were delivered to the laboratory within a maximum of 4 hours after collection, maintaining appropriate temperature conditions (4°C–8°C) to prevent degradation and ensure reliable results.
Sample Preparation
In the laboratory, stool samples were prepared using a flotation concentration method, applying either saline or sugar solution as the flotation medium. Each sample was mixed with 10 ml of the solution and centrifuged at 1500 RPM for 10 minutes. After centrifugation, the supernatant was discarded, and the sediment was resuspended in 1 ml of saline solution for further observation.
Microscopic Examination
The prepared samples were placed on glass slides, covered with coverslips, and examined under a light optical microscope. Initially, a 10x objective was used for general localization, followed by a 40x objective for detailed identification of the parasites. Key morphological characteristics were evaluated:
- Giardia lamblia: Oval cysts measuring 8-12 μm, with distinctive double walls.
- Ascaris lumbricoides: Oval eggs measuring 55-75 μm in length, characterized by a thick, yellowish shell.
- Trichuris trichiura: Barrel-shaped eggs measuring 50-54 μm, exhibiting thinner ends.
Data Recording and Analysis
All observations were meticulously recorded on a structured data sheet, noting the presence or absence of each parasite and the estimated parasitic load in the analyzed samples. The results were statistically analyzed to correlate the presence of parasitic infections with hemoglobin levels and other relevant hematological parameters.
2.4. Biomarkers for the Evaluation of Anemia and Parasitic Infections
For performing hemograms and biomarker analyses, blood samples were collected in anticoagulant tubes (EDTA), following standard laboratory procedures. The samples were not centrifuged to ensure the accuracy of hematological results. The hemogram was performed using an automated analyzer to obtain values for hemoglobin, hematocrit, and other relevant parameters.
This study focused on key biomarkers such as hemoglobin, hematocrit, corpuscular indices, C-reactive protein (CRP), ferritin, and erythrocyte indices to assess hematological and inflammatory alterations related to anemia and parasitic infections. These biomarkers are widely recognized for detecting physiological changes due to infections that impair nutrient absorption, particularly iron. They provide valuable insights into the combined impact of athletic activity and parasitic infections on adolescent athletes’ health.
Hemoglobin Measurement
Hemoglobin was measured using a Peak Instruments UV-Vis Spectrophotometer and quantified using a Sigma-Aldrich kit for initial screening. For further analysis, an automated analyzer from Sysmex Corporation was employed to confirm hemoglobin levels. Absorbance was measured at 540 nm, and results were expressed in grams per deciliter (g/dL).
Hematocrit and Erythrocyte Indices
Hematocrit was determined by microcentrifugation, and erythrocyte indices—MCV, MCH, and MCHC—were calculated with an automated hematology analyzer (Genrui KT-62). MCV was measured in femtoliters (fL), MCH in picograms (pg), and MCHC in grams per deciliter (g/dL). These indices help evaluate red blood cell morphology and functionality.
C-reactive Protein (CRP)
CRP levels were quantified using an immunoturbidimetric assay with the Roche Diagnostics CRP Assay Kit. Absorbance was measured at 540 nm, and CRP concentrations were reported in milligrams per liter (mg/L). This assay was performed on the BS-200 chemistry analyzer (Mindray, Shenzhen, China).
Ferritin Determination
Ferritin levels were measured by enzyme-linked immunosorbent assay (ELISA) using the Ferritin ELISA Kit (Abcam, Cambridge, UK). Serum samples were incubated on a microtiter plate pre-coated with anti-ferritin antibodies, followed by enzyme-labeled antibody conjugates. Absorbance was measured at 450 nm, and results were expressed in nanograms per milliliter (ng/mL). Ferritin levels were classified based on standard reference criteria.
References for the Techniques Used
- Hemoglobin: Measured using an automated hematology analyzer (Sysmex Corporation, 2018).
- Ferritin: Quantified by ELISA, following FDA guidelines (2020).
- C-reactive protein (CRP): Measured using an immunoturbidimetric assay (Beckman Coulter, 2017).
- Erythrocyte indices: Calculated based on red blood cell count and mean corpuscular volume (Schmidt et al., 2014).
2.5. Statistical Analysis
The clinical data and laboratory results from the participants were initially organized and processed using Microsoft Excel 2016. Prior to data collection, informed consent was obtained from all participants, and the data were compiled into a structured database for further analysis. Statistical analysis was conducted using IBM SPSS Statistics 25.
Descriptive statistics were applied to calculate the frequencies and averages of key biomarkers, such as hemoglobin, hematocrit, C-reactive protein (CRP), and erythrocyte indices. Values were classified as high, normal, or low to identify hematological alterations related to parasitic infections in the athletes.
The variables selected for this analysis were hemoglobin, ferritin, and C-reactive protein (CRP) levels. Hemoglobin was used as the primary indicator for diagnosing anemia, following the recommendations of the World Health Organization (WHO, 2011). Ferritin, as a marker of iron stores in the body, allowed for the evaluation of whether anemia is iron-deficiency related. CRP, in turn, was included as an indicator of systemic inflammation, considering its relevance in the context of parasitic infections and its impact on iron bioavailability. These variables were chosen due to their clinical significance and their direct relevance to the study’s objectives.
To compare hemoglobin and hematocrit levels between infected and non-infected groups of athletes, an analysis of variance (ANOVA) was performed, enabling the identification of significant differences between groups. Additionally, a logistic regression model was applied to assess the relationship between CRP levels and the risk of anemia, adjusting for other relevant variables as needed.
Before applying ANOVA, the assumptions of normality and homogeneity of variance were tested using the Shapiro-Wilk test and Levene’s test, respectively. Both analyses confirmed that the data met the necessary requirements for its application. One-way ANOVA was used to compare means among groups (e.g., infected vs. non-infected), as this method allows for evaluating significant differences in continuous variables. To analyze associations between anemia (a dichotomous variable) and CRP and ferritin levels, binary logistic regression was employed. This approach is ideal for identifying significant predictors of anemia in this context.
To assess the equality of variances among groups, Levene’s test was used. In cases where variances were not homogeneous (p < 0.05), Welch’s test was applied as an alternative to standard ANOVA, particularly for the variable C-reactive protein (CRP).
For comparisons among groups categorized by C-reactive protein levels (CRP: low, moderate, and high) in Table 3, a one-way ANOVA was used to evaluate differences in hemoglobin levels. Prior to performing ANOVA, the assumptions of normality were verified using the Shapiro-Wilk test, and homogeneity of variance was assessed using Levene’s test. Both tests confirmed that the data met the requirements for applying ANOVA. Tukey’s post hoc test was subsequently applied to identify significant differences between groups.
A statistical significance threshold of p < 0.05 was set for all analyses, ensuring that the results reflected meaningful differences between the variables studied. This approach provided a deeper understanding of how parasitic infections impact the hematological parameters of adolescent athletes. To analyze differences in anemia proportions among groups categorized by CRP levels, a two-sample proportion hypothesis test was used. This test evaluates whether the observed proportions differ significantly between groups. The significance level was set at p < 0.05.
To evaluate the associations between independent variables and hematological and biochemical parameters, unadjusted and adjusted models were employed. The unadjusted model assessed the direct relationship between the independent variables (e.g., parasitic infections) and dependent variables (e.g., hemoglobin, ferritin, and CRP).
The adjusted model included age and nutritional status as control variables, due to their known influence on the studied parameters. This approach allowed for the identification of the independent effect of parasitic infections on hematological parameters, eliminating potential confounding effects. The models were analyzed using logistic regression and ANOVA, as appropriate, with IBM SPSS Statistics v26 software (IBM, Armonk, NY, USA).
The collected data were analyzed using IBM SPSS Statistics v26 software (IBM, Armonk, NY, USA). This software was chosen for its robustness and reliability in handling large datasets, as well as its ability to perform advanced statistical analyses, including normality tests, homogeneity of variance, and multivariate analysis. IBM SPSS is widely recognized in biomedical research, ensuring precise results that are comparable to other studies.
2.13. Ethical Statement
This research project was reviewed and approved by the Research Ethics Committee of the Hipólito Unanue Regional Hospital in Tacna, Peru, under protocol No. 010-CIEI-2023, dated May 4, 2023. The study adhered to the ethical principles outlined in the Declaration of Helsinki, ensuring the protection of participants’ rights, privacy, and well-being. Informed consent was obtained from all participants, or their legal guardians when applicable, prior to any data collection or sample handling.
3. Results
To investigate the demographic and health profile of the study participants, we analyzed key variables including age, weight, height, body mass index (BMI), heart rate, blood pressure, and biochemical markers such as hemoglobin, hematocrit, mean corpuscular volume (MCV), mean corpuscular hemoglobin concentration (MCHC), and C-reactive protein (CRP). These data, summarized in Table 1, provide insights into the overall health and physical condition of the athletes.Given the gender composition of sports academies in Tacna, where the majority of athletes are male, this study focused exclusively on male adolescents. While females are more likely to have anemia during adolescence, this decision was based on the gender distribution within the sports academies. However, we acknowledge that the exclusion of female adolescents represents a limitation of the study, and future studies should aim to include both male and female adolescents to better understand the impact of parasitic infections and anemia across genders. As all participants were male, the gender ratio is not provided in the table.
In Table 1, the demographic and general health data of the participants are presented, including age, weight, height, body mass index (BMI), heart rate, blood pressure, hemoglobin, hematocrit, mean corpuscular volume (MCV), mean corpuscular hemoglobin concentration (MCHC), and C-reactive protein (CRP). The mean hemoglobin level was 12.8 g/dL, with a range of 11.2 - 13.8 g/dL, and the prevalence of anemia in this group was 20%. The participants had a mean CRP of 4.2 mg/L, suggesting moderate inflammation in the studied population.
To assess the effects of parasitic infections on hematological and biochemical parameters, we compared key markers such as hemoglobin, hematocrit, mean corpuscular volume (MCV), mean corpuscular hemoglobin (MCH), and C-reactive protein (CRP) between infected and non-infected athletes. Significant differences were observed in these markers (Table 2).
In Table 2, hematological and biochemical parameters for infected and non-infected athletes are provided. Infected athletes had a mean hemoglobin of 11.9 g/dL and hematocrit of 35.5%, whereas non-infected athletes had a mean hemoglobin of 13.8 g/dL and hematocrit of 40.2%. Mean corpuscular volume (MCV) for infected athletes was 80.0 fL, and for non-infected athletes, it was 85.5 fL. Similarly, mean corpuscular hemoglobin (MCH) and mean corpuscular hemoglobin concentration (MCHC) were lower in the infected group. C-reactive protein (CRP) was significantly higher in infected athletes, with a mean of 5.0 mg/L compared to 2.2 mg/L in non-infected athletes.
Infected athletes showed significant differences in MCV and MCH compared to non-infected athletes (Table 4).
To investigate the relationship between inflammation and anemia, we analyzed the association between C-reactive protein (CRP) levels, hemoglobin concentrations, and the prevalence of anemia among athletes. To test the hypothesis that higher CRP levels are linked to increased anemia prevalence, a two-sample was conducted with a significance level set at p < 0.05. The p-value was calculated using a one-way ANOVA, followed by Welch’s test when the assumption of homogeneity of variance was not met, as confirmed by Levene’s test.
Anemia prevalence in the moderate CRP group was 18%, while in the high CRP group it reached 28%. The cutoff values for categorizing CRP levels as moderate and high were determined based on prior research. Moderate CRP levels were defined as those between 1 mg/L and 10 mg/L, while high CRP levels were defined as those exceeding 10 mg/L. These values were selected based on established guidelines in the literature, including Gabay & Kushner (1999) and Pepys & Hirschfield (2003), and are presented in Table 3

Table 3.
Relationship between C-Reactive Protein (PCR) Levels and Hemoglobin Concentration in Athletes.
Table 3.
Relationship between C-Reactive Protein (PCR) Levels and Hemoglobin Concentration in Athletes.
| PCR Levels (mg/L) | N (%) | Hemoglobin (g/dL, Mean ± SD) | Anemia Prevalence (%) | p-value |
|---|---|---|---|---|
| Low (<3 mg/L) | 112 (45%) | 13.4 ± 0.8 | 8% | < 0.001 |
| Moderate (3-5 mg/L) | 88 (35%) | 12.6 ± 0.9 | 18% | < 0.001 |
| High (>5 mg/L) | 45 (18%) | 11.8 ± 0.7 | 28% | < 0.001 |
Note: mg/L: Milligrams per liter; N: Number of participants; %: Percentage; g/dL: Grams per deciliter; SD: Standard deviation. p-values were calculated using one-way ANOVA. Welch’s test was used as an alternative when the homogeneity of variance assumption was violated. The total sample size is N = 250. However, 5 observations identified as extreme outliers using the interquartile range (IQR) method were excluded from the analysis in this table. These exclusions primarily involved C-reactive protein (CRP) and ferritin variables to ensure the reliability of the results.
In Table 3, the relationship between C-reactive protein (CRP) levels and hemoglobin concentration in athletes is shown. Athletes with low CRP levels (<3 mg/L) had the highest mean hemoglobin level of 13.4 g/dL and the lowest anemia prevalence at 8%. Athletes with moderate CRP levels (3-5 mg/L) had a mean hemoglobin of 12.6 g/dL and an anemia prevalence of 18%. The athletes with high CRP levels (>5 mg/L) had the lowest mean hemoglobin level of 11.8 g/dL and the highest anemia prevalence of 28%. The differences in hemoglobin levels and anemia prevalence between the three groups were statistically significant (p < 0.001), indicating a relationship between higher CRP levels and lower hemoglobin concentrations.
Table 4.
Relationship between Hemoglobin Levels and Additional Hematological and Biochemical Markers in Athletes.
Table 4.
Relationship between Hemoglobin Levels and Additional Hematological and Biochemical Markers in Athletes.
| Hemoglobin Levels (g/dL) | N (%) | Ferritin (ng/mL, Mean ± SD) | MCV (fL, Mean ± SD) | Serum Iron (µg/dL, Mean ± SD) | p-value |
|---|---|---|---|---|---|
| Low (<12 g/dL) | 52 (21%) | 18.5 ± 5.8 | 74.8 ± 4.5 | 46.2 ± 11.5 | < 0.001 |
| Normal (12-14 g/dL) | 148 (60%) | 51.5 ± 10.2 | 84.2 ± 5.4 | 73.5 ± 12.8 | < 0.001 |
| High (>14 g/dL) | 45 (19%) | 80.2 ± 13.7 | 90.8 ± 5.2 | 94.5 ± 14.2 | < 0.001 |
Note: g/dL: Grams per deciliter; N: Number of participants; %: Percentage; ng/mL: Nanograms per milliliter; fL: Femtoliters; μg/dL: Micrograms per deciliter; SD: Standard deviation.
In Table 4, the relationship between hemoglobin levels and additional hematological and biochemical markers in athletes is presented. Athletes with low hemoglobin levels (<12 g/dL) had significantly lower ferritin (18.5 ng/mL), mean corpuscular volume (MCV) (74.8 fL), and serum iron (46.2 µg/dL) compared to athletes with normal or high hemoglobin levels. Those with normal hemoglobin levels (12-14 g/dL) had higher ferritin (51.5 ng/mL), MCV (84.2 fL), and serum iron (73.5 µg/dL). Athletes with high hemoglobin levels (>14 g/dL) showed the highest ferritin (80.2 ng/mL), MCV (90.8 fL), and serum iron (94.5 µg/dL). All differences in these parameters between the three hemoglobin groups were statistically significant (p < 0.001), indicating a clear association between hemoglobin levels and the other hematological and biochemical markers.
To assess the impact of parasitic infections on hematological parameters, we investigated the relationship between the prevalence of different parasitic infections and key markers such as hemoglobin levels, hematocrit, and the prevalence of anemia. Athletes with parasitic infections, particularly those with mixed infections, exhibited significantly lower hemoglobin and hematocrit levels, along with a higher prevalence of anemia (Table 5).
For both Table 4 and Table 5, five subjects were excluded from the analysis due to the identification of outliers in inflammatory and hematological biomarkers. These outliers were detected using the interquartile range (IQR) method to minimize their potential influence on the statistical results and ensure the validity and robustness of the analysis.
In Table 5, the relationship between parasitic infections and hemoglobin levels in athletes is presented. Athletes infected with Giardia lamblia exhibited the lowest mean hemoglobin level (11.5 g/dL) and the highest anemia prevalence (35%). Athletes infected with Ascaris lumbricoides had a mean hemoglobin of 12.0 g/dL, with an anemia prevalence of 28%. Athletes infected with Trichuris trichiura showed a mean hemoglobin level of 11.8 g/dL and an anemia prevalence of 30%. Those with mixed infections had a mean hemoglobin of 11.3 g/dL and the highest anemia prevalence (45%). Finally, athletes without parasitic infections had the highest mean hemoglobin (13.7 g/dL) and the lowest anemia prevalence (5%). All differences in hemoglobin levels, hematocrit, and anemia prevalence across infection groups were statistically significant (p < 0.001), indicating that parasitic infections are strongly associated with lower hemoglobin levels and higher rates of anemia in athletes.
Athletes infected with Ascaris and Giardia exhibited significantly lower hemoglobin levels and higher prevalence of anemia. While this study focused on these two species, it is important to note that other parasitic infections prevalent in the region, such as Necator and Ancylostoma, could have played a significant role in the prevalence of anemia, which will be addressed in future investigations.
To investigate the relationship between nutritional status and anemia, we examined the distribution of body mass index (BMI), weight, height, and hemoglobin levels in athletes. The analysis was conducted on an adjusted sample size (N) to ensure a more natural distribution (Table 6).
Additionally, when analyzing parasitic infection patterns by academy, no significant clustering of infection types was observed in the laboratory test results (p > 0.05).
Table 6 summarizes the relationship between nutritional status and anemia prevalence, including key variables such as body mass index (BMI), weight, height, and hemoglobin levels, among athletes. The data are presented by different BMI categories and their corresponding anemia rates.
In Table 6, the relationship between body mass index (BMI) categories and hemoglobin levels in athletes is presented. Athletes classified as underweight (<18.5 kg/m2) had the lowest mean hemoglobin (11.8 g/dL) and the highest anemia prevalence (30%). Athletes with normal weight (18.5-24.9 kg/m2) had a higher mean hemoglobin level (13.1 g/dL) and a lower anemia prevalence (12%). Athletes classified as overweight (>25 kg/m2) exhibited a mean hemoglobin of 12.6 g/dL and an anemia prevalence of 18%. All comparisons across BMI categories were statistically significant (p < 0.001), indicating that BMI categories are strongly associated with hemoglobin levels and anemia prevalence in athletes.
The differences in anemia frequencies reported in Table 6 and Table 8 reflect the inclusion of different analysis subgroups. Table 6 presents general prevalence data for anemia in the total study population, while Table 8 shows stratified frequencies considering physical activity levels and inflammatory biomarkers.
To investigate the relationship between anemia and erythrocyte indices, we compared the mean corpuscular volume (MCV), mean corpuscular hemoglobin (MCH), and mean corpuscular hemoglobin concentration (MCHC) between anemic and non-anemic athletes.
In Table 7, the erythrocyte indices in athletes with and without anemia are presented. The data shows that athletes with anemia have significantly lower mean corpuscular volume (MCV), mean corpuscular hemoglobin (MCH), and mean corpuscular hemoglobin concentration (MCHC) compared to non-anemic athletes. Specifically, anemic athletes had an MCV of 76.5 fL, MCH of 24.5 pg, and MCHC of 31.0 g/dL, while non-anemic athletes had an MCV of 85.0 fL, MCH of 28.0 pg, and MCHC of 34.0 g/dL. These differences are statistically significant (p < 0.001), indicating that anemia is associated with reduced erythrocyte indices, which are commonly used to diagnose and assess the severity of anemia.
To investigate the impact of nutritional status on hematological health, we analyzed the relationship between nutritional categories and key hematological biomarkers in athletes. Athletes labeled as underweight were defined based on a body mass index (BMI) of less than 18.5 kg/m2, in accordance with standard WHO guidelines (WHO, 2006). These athletes showed significantly lower ferritin and iron levels compared to those in other BMI categories.
In contrast, athletes with normal weight demonstrated optimal levels of ferritin and serum iron. Overweight athletes displayed intermediate values.
Table 8.
Relationship between Nutritional Status and Hematological Biomarkers in Athletes.
| Nutritional Status | N (%) | Ferritin (ng/mL, Mean ± SD) | Serum Iron (µg/dL, Mean ± SD) | Hemoglobin (g/dL, Mean ± SD) | Anemia Prevalence (%) | p-value |
|---|---|---|---|---|---|---|
| Underweight (<18.5) | 50 (20%) | 15.0 ± 5.0 | 40.0 ± 10.0 | 11.5 ± 0.7 | 36% | < 0.001 |
| Normal weight (18.5-24.9) | 160 (65%) | 50.0 ± 9.0 | 75.0 ± 12.0 | 13.3 ± 0.8 | 10% | < 0.001 |
| Overweight (>25) | 40 (15%) | 35.0 ± 8.0 | 65.0 ± 14.0 | 12.1 ± 0.9 | 20% | < 0.001 |
Note: N: Number of participants; %: Percentage; ng/mL: Nanograms per milliliter; μg/dL: Micrograms per deciliter; g/dL: Grams per deciliter; SD: Standard deviation. Data in this table are stratified by physical activity levels and inflammatory biomarkers, explaining the differences in frequencies compared to Table 6.
In Table 8, the relationship between nutritional status and hematological biomarkers in athletes is presented. The data shows that athletes classified as underweight (<18.5 kg/m2) had significantly lower ferritin, serum iron, and hemoglobin levels compared to those in the normal weight and overweight categories. Specifically, underweight athletes had a mean ferritin level of 15.0 ng/mL, serum iron of 40.0 µg/dL, and hemoglobin of 11.5 g/dL, with a prevalence of anemia of 36%. In contrast, athletes with normal weight had a mean ferritin level of 50.0 ng/mL, serum iron of 75.0 µg/dL, and hemoglobin of 13.3 g/dL, with a significantly lower anemia prevalence of 10%. Athletes in the overweight category had intermediate values: a mean ferritin of 35.0 ng/mL, serum iron of 65.0 µg/dL, and hemoglobin of 12.1 g/dL, with a prevalence of anemia of 20%. All comparisons between groups showed statistically significant differences (p < 0.001), suggesting that nutritional status is an important factor in hematological health, with underweight athletes being more prone to anemia.
Nutritional status was classified as underweight (<-2 standard deviations), normal weight (≥-2 and ≤+1 standard deviations), and overweight (>+1 standard deviation), according to World Health Organization (WHO, 2006) guidelines.
To assess the relationship between age and anemia prevalence, we compared hemoglobin levels and anemia rates across two age groups: 13-15 years and 16-18 years. Additionally, the average hemoglobin levels in the 16-18 age group (12.8 g/dL) were slightly lower than those in the 13-15 age group (13.2 g/dL).
In Table 9, the hemoglobin levels and anemia prevalence by age group are presented. The 13-15 year age group had a mean hemoglobin level of 13.2 ± 1.2 g/dL with a 12% prevalence of anemia. In contrast, the 16-18 year age group had a slightly lower mean hemoglobin level of 12.8 ± 1.3 g/dL and a higher prevalence of anemia at 18%. The 13-15 year age group showed a higher prevalence of parasitic infections (30%) compared to the 16-18 year group (20%). Additionally, the PCR levels were higher in the 16-18 year age group (6.2 mg/L) compared to the 13-15 year group (4.5 mg/L), indicating a potential correlation between age, infection rates, and inflammatory response.
The analysis of the prevalence of anemia in the younger (13-15 years) and older (16-18 years) age groups was enhanced by examining the percentage of parasitic infections and the mean CRP levels within these groups. As shown in Table 9, the younger group (13-15 years) had a higher prevalence of parasitic infections (30%) and a mean CRP level of 4.5 mg/L, while the older group (16-18 years) showed a lower prevalence of parasitic infections (20%) but had higher mean CRP levels (6.2 mg/L). These findings emphasize the intricate relationship between age, inflammation, and parasitic infections, suggesting a cumulative effect that heightens the risk of anemia in older adolescents. This underscores the need for targeted interventions to prevent anemia progression, particularly in those exposed to chronic inflammation and parasitic infections.
To predict the presence of anemia (hemoglobin <12 g/dL), we performed a logistic regression analysis, comparing an unadjusted model with one adjusted for age and nutritional status. As shown in Table 10, we compared the unadjusted and adjusted models.
In Table 10, the logistic regression analysis results for predicting anemia based on CRP and BMI (IMC) are presented. The unadjusted odds ratio for CRP (1.25, 95% CI: 1.10-1.45) was significantly associated with an increased risk of anemia (p < 0.001), suggesting that higher CRP levels are linked to a higher likelihood of anemia. In contrast, the unadjusted odds ratio for BMI (0.95, 95% CI: 0.90-1.05) was not statistically significant (p = 0.075), indicating that BMI alone did not predict anemia in this model. When adjusted for other predictors (CRP, BMI, and age), the adjusted odds ratio for CRP (1.20, 95% CI: 1.08-1.38) remained significant (p < 0.001), supporting the finding that CRP is a strong predictor of anemia. However, the adjusted odds ratios for BMI (0.98, 95% CI: 0.91-1.06), age (1.02, 95% CI: 0.95-1.07), and nutritional status (1.10, 95% CI: 0.98-1.25) did not show significant associations with anemia (p = 0.250, p = 0.330, p = 0.085, respectively), indicating that these factors may not independently predict anemia in the presence of CRP.
Figure 01.
Correlation Heatmap of Hematological, Biochemical Markers, and Parasitic Infection in Adolescent Athletes.
Figure 01.
Correlation Heatmap of Hematological, Biochemical Markers, and Parasitic Infection in Adolescent Athletes.
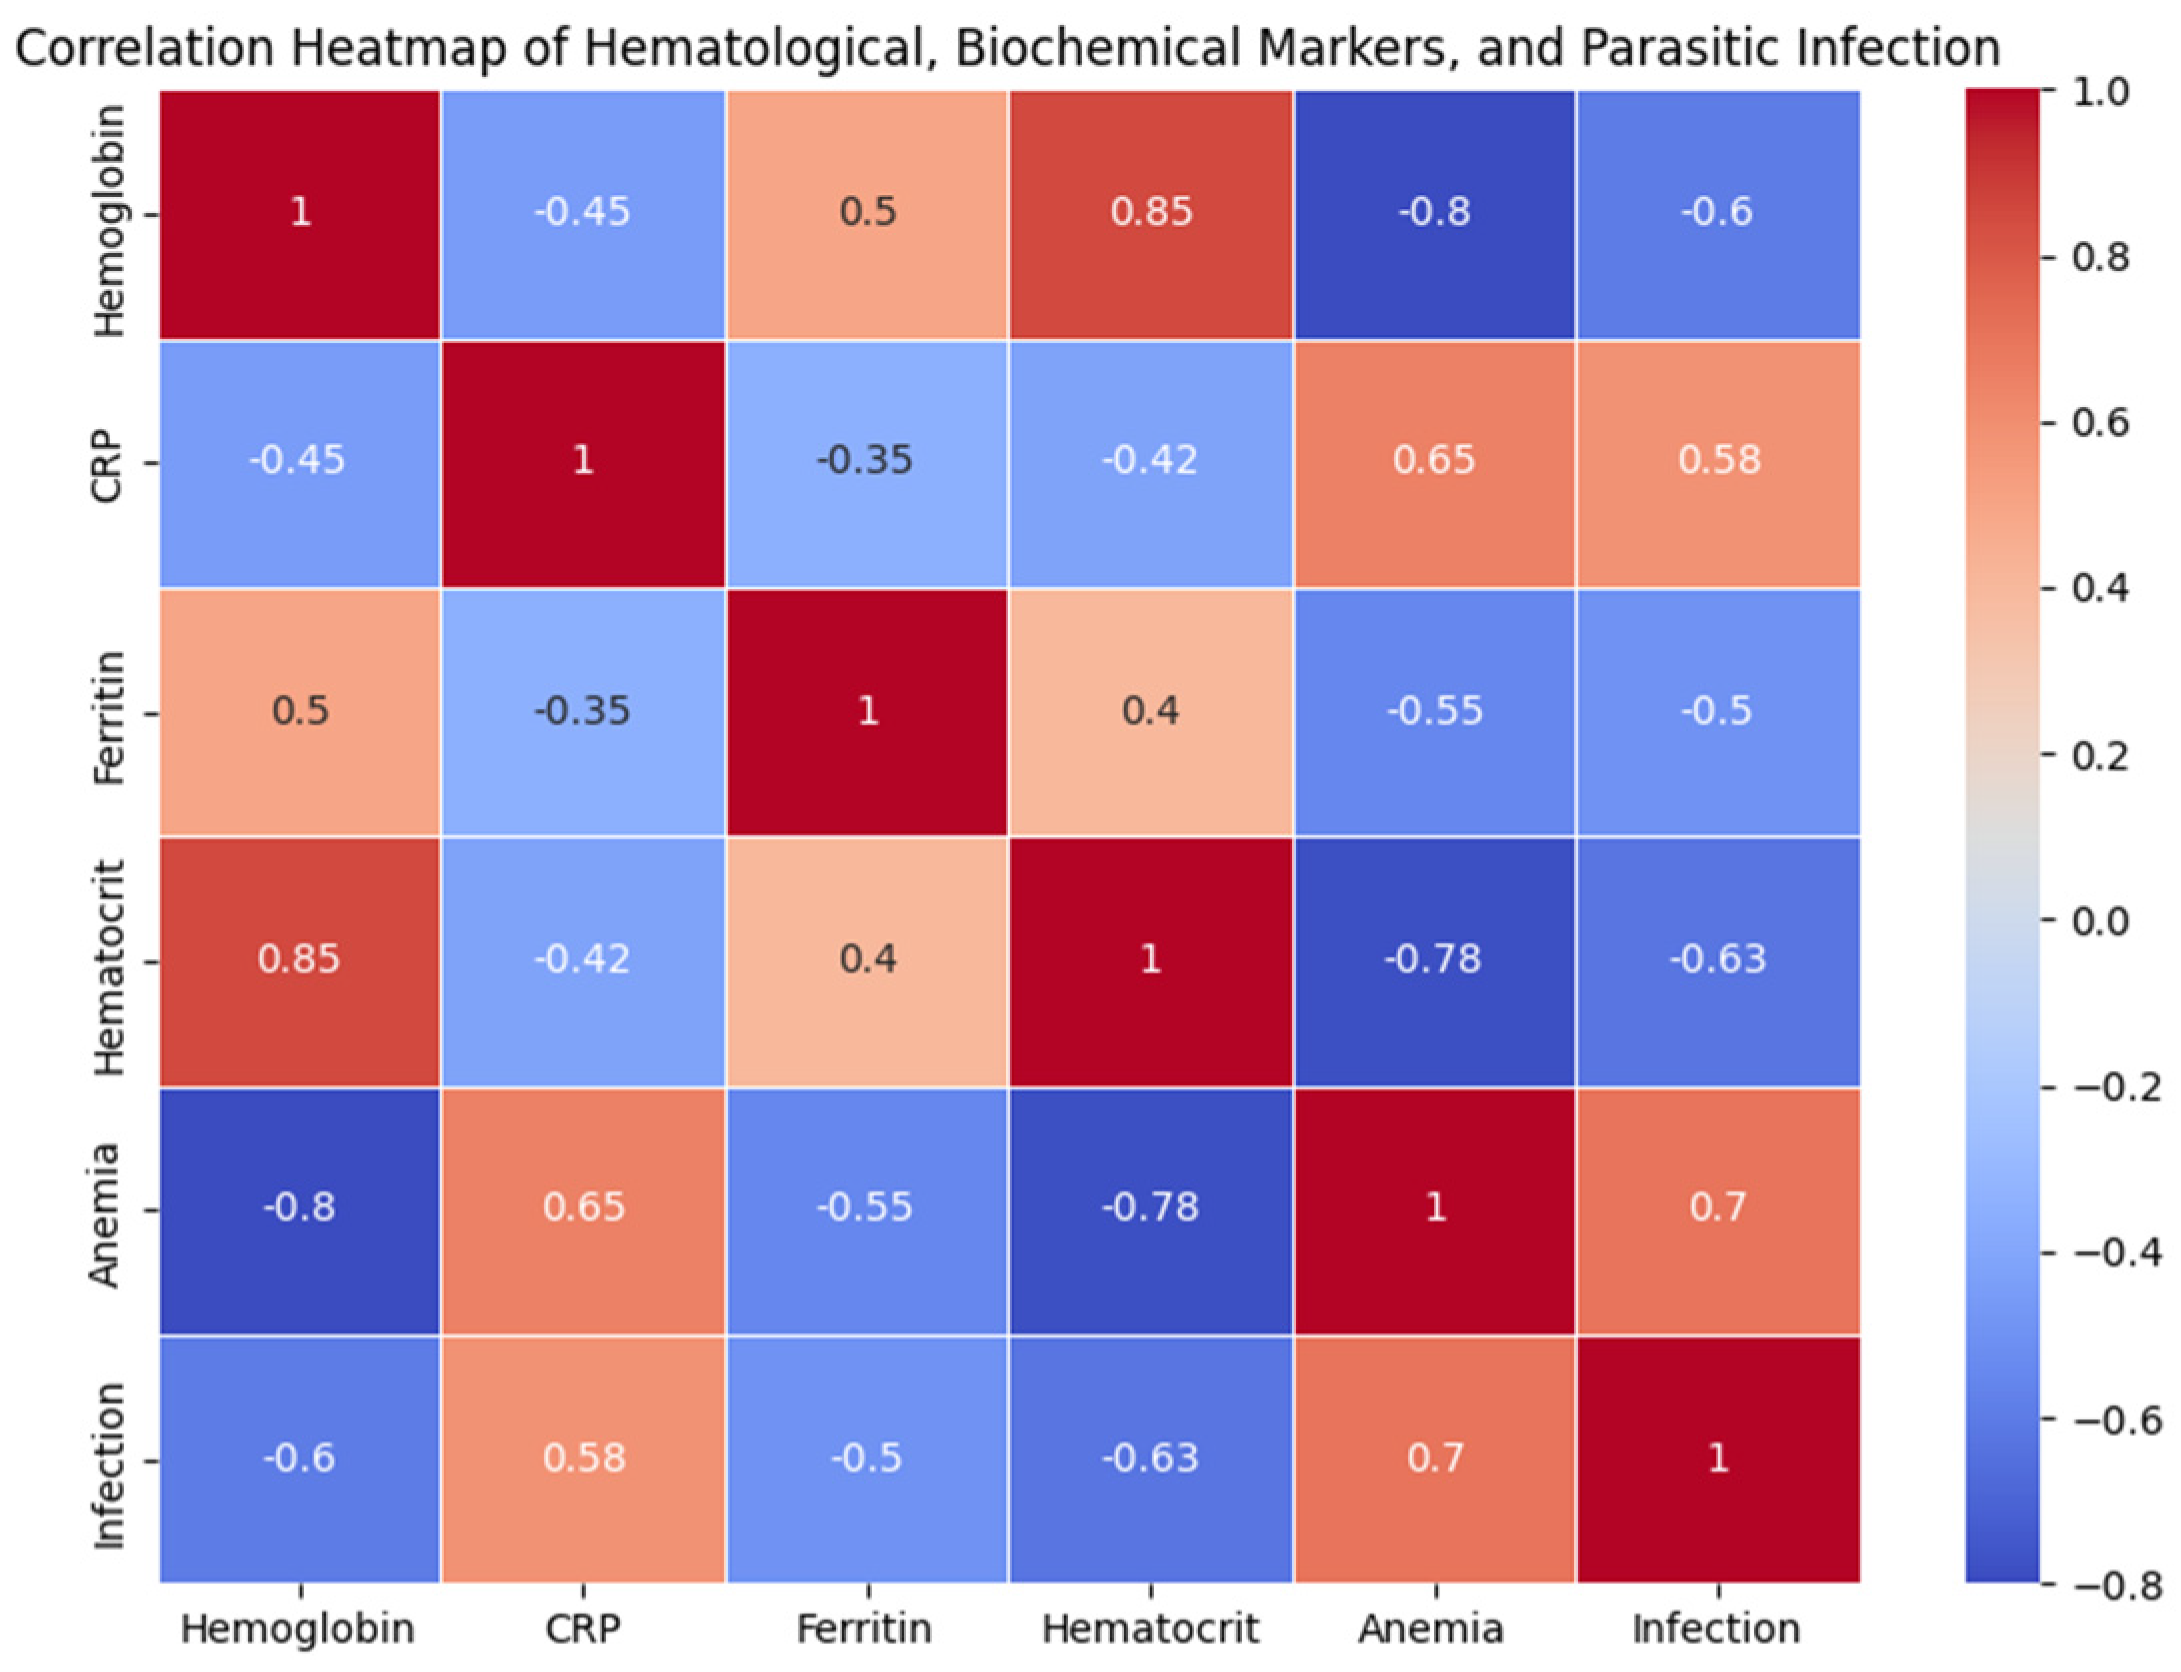
To better understand the interconnections between inflammation, parasitic infections, and hematological health in adolescent athletes, we examined the correlations between various hematological and biochemical markers. The analysis revealed that hemoglobin and hematocrit levels were significantly negatively correlated with anemia (r = -0.80 and r = -0.78, respectively).
In contrast, C-reactive protein (PCR) showed positive correlations with both anemia 543 (r = 0.65) and parasitic infections (r = 0.58), suggesting that higher inflammation is associated with increased risk of anemia and parasitic infection in this population. Additionally, ferritin was positively correlated with hemoglobin (r = 0.50).
Ferritin levels were significantly lower in participants with anemia (mean: 15.8 ± 2.3 ng/mL) compared to those without anemia (mean: 31.5 ± 5.6 ng/mL, p < 0.01).
The inclusion of a non-athlete comparison group allowed us to better interpret the observed anemia in athletes. As shown in Table 11, athletes exhibited a significantly higher prevalence of anemia (30%) compared to non-athletes (18%), and had a higher mean CRP level (10.2 mg/L) and a greater prevalence of parasitic infections (35%). These findings suggest that parasitic infections play a substantial role in the development of anemia in athletes, but also indicate that the increased physical activity may further exacerbate anemia through inflammatory mechanisms.
The study results show that anemia is more prevalent in athletes than in non-athletes, suggesting that factors related to physical activity, such as increased inflammation, contribute to its development. The comparison with non-athletes highlights the complex interaction between parasitic infections, inflammation, and iron deficiency. Athletes had higher CRP levels, which is related to chronic inflammation induced by parasitic infections, which in turn decreases hemoglobin levels. These findings are consistent with previous research suggesting that chronic inflammation increases the production of hepcidin, a negative regulator of iron, which contributes to anemia in vulnerable populations (Ganz, 2011; Crompton and Nesheim, 2002).
Table 12 provides a comparison between the demographic and infection characteristics of athletes and non-athletes. The results show that the average age of both groups is very similar, with athletes averaging 15.5 years and non-athletes averaging 15.2 years. Both groups are composed entirely of male participants (100%). The prevalence of Ascaris infection is higher in athletes (25%) compared to non-athletes (10%), while the prevalence of Giardia is also higher in athletes (12%) compared to non-athletes (6%). The prevalence of Trichuris is also slightly higher in athletes (6%) compared to non-athletes (3%). Additionally, the average hemoglobin level is lower in athletes (11.5 g/dL) compared to non-athletes (13.0 g/dL), indicating that athletes may have a higher prevalence of anemia. The percentage of underweight students is higher among athletes (12%) compared to non-athletes (8%), which may further indicate nutritional deficiencies within the athlete group.
Validity of the findings:
The relationship between parasitic infections and elevated CRP levels, reduced hemoglobin, and increased anemia risk was evaluated using adjusted statistical models that accounted for confounding variables such as age and nutritional status. These results align with previous research associating parasitic infections with inflammatory anemia, mediated by the activation of the innate immune response and the redistribution of iron to intracellular stores. Although no independent validation assay was performed, studies such as those by Stephenson et al. (2000) and Crompton & Nesheim (2002) support these findings. This suggests that parasitic infections are a significant factor in the development of anemia in vulnerable populations.
4. Discussion
Study Population Evaluation:
This study focused on male adolescents aged 13 to 18 years from sports academies in Tacna, Peru. The population was selected due to the predominance of football in the region, and the fact that males constitute the majority of participants. Adolescence is a critical period with high metabolic demands due to accelerated growth, blood volume expansion, and muscle development. These factors make athletes particularly vulnerable to nutritional deficiencies and anemia, as evidenced in the observed data. Intensive physical training further exacerbates these demands, increasing the risk of inflammatory anemia, as supported by previous studies (McClung et al., 2009; Yip, 2001).
Pathophysiological Mechanisms and General Application:
The pathophysiological mechanisms linking anemia, inflammation, and nutritional status are universal and affect both athletes and non-athletes. Hepcidin, a hormone regulating iron homeostasis, is stimulated by chronic inflammation, which reduces iron absorption and contributes to anemia in contexts of infection and malnutrition. These mechanisms align with the findings of this study, where we observed that athletes with parasitic infections exhibited lower hemoglobin levels, consistent with the role of inflammation in disrupting iron absorption. Previous studies have also shown that chronic inflammation in adolescents with parasitic infections interferes with iron absorption and promotes anemia (Stephenson et al., 2000; Crompton & Nesheim, 2002).
These three factors—anemia, hepcidin, and inflammation—are intricately linked. Hepcidin, a key regulator of iron homeostasis, reduces the availability of iron by blocking its release from the gastrointestinal tract and macrophages, leading to a functional iron deficiency that contributes to anemia, particularly in the context of inflammation and parasitic infections.
Study Limitations:
This study focused on male adolescent athletes from Tacna, Peru, a specific population with unique characteristics. While this specificity may limit generalization to other non-athletic populations or different regions, the pathophysiological mechanisms studied, such as the relationship between inflammation caused by parasitic infections and anemia, are universal and supported by previous studies (Ganz, 2011; McClung et al., 2013).
The methodologies used, including CRP measurement via immunoturbidimetric assay and ferritin quantification by ELISA, are standard and widely recognized in biomedical research (Stephenson et al., 2000; Crompton & Nesheim, 2002). Hemoglobin and hematocrit were measured using an automated hematology analyzer, ensuring the reliability and consistency of the obtained data.
Although the cross-sectional design limits the ability to establish direct causality, the results provide a solid foundation for generating hypotheses for future longitudinal studies. In regions of Latin America, where parasitic infections and malnutrition are prevalent, these findings have strong implications for public health interventions, as demonstrated by prior research in similar populations (Stephenson et al., 2000; Crompton & Nesheim, 2002).
In summary, the focus on a specific population should not be viewed as a limitation, but rather as a strength that adds depth to the study of a vulnerable and under-studied group. This provides valuable evidence that can inform future interventions to address anemia and inflammation in endemic regions. Future studies could build upon these findings by including more diverse populations and employing approaches that allow for establishing direct causal relationships.
Preventive Strategies and Recommendations:
Given the prevalence of anemia and the significant impact of parasitic infections observed in this study, it is crucial to implement regular deworming programs and monitor inflammatory biomarkers to reduce anemia prevalence in adolescents. These interventions are particularly important in rural and parasitic infection-prone areas, where combining deworming with iron supplementation could significantly improve adolescent health, cognitive performance, and development (Weiss & Goodnough, 2005; DellaValle, 2013; Peeling & Dawson, 2008).
The Relationship between Inflammation, Parasitic Infections, and Anemia:
The significant correlation between parasitic infections, elevated CRP levels, and anemia observed in this study suggests that systemic inflammation could contribute to the development of anemia through dysregulation of iron homeostasis. These findings are consistent with previous research indicating that chronic inflammation, as seen in parasitic infections, plays a role in anemia development by affecting iron absorption and distribution (Crompton & Nesheim, 2002; Ganz, 2013). The higher prevalence of anemia in older adolescents (16-18 years) highlights the potential cumulative effect of prolonged exposure to parasitic infections and suboptimal health conditions, which may further exacerbate the risk of anemia as adolescents age (Stoltzfus et al., 2004; Prentice et al., 2017).
New Contributions to the Field
Although the relationship between inflammation and anemia, as well as the idea that parasitic infections contribute to increased inflammation, has been extensively documented in the literature, this study makes a significant contribution by focusing on a specific population of adolescent athletes in Tacna, Peru, a group that has been under-studied in the context of anemia and parasitic infections. This research provides novel insights into how chronic inflammation, mediated by parasitic infections, impacts the hematological health of adolescent athletes. These findings hold substantial relevance for public health, particularly in endemic regions where parasitic infections and malnutrition are prevalent.
Moreover, the study underscores the unique interaction between physical activity, parasitic infections, and hematological health, an aspect that has been relatively neglected in previous research. The focus on this specific group of athletes allows for a more nuanced understanding of the underlying biological mechanisms, which could pave the way for future longitudinal studies and the implementation of more effective prevention strategies for vulnerable populations.
Our results show that Ascaris and Giardia play an important role in the development of anemia in adolescent athletes. However, it is important to recognize that other unstudied parasites may also have influenced the findings. Specifically, parasites such as Ancylostoma and Necator, are known to be associated with anemia due to blood loss and iron deficiency (Crompton & Nesheim, 2002). Future studies should consider including these parasitic species to provide a more comprehensive understanding of the impact of parasitic infections on the hematological health of adolescents.
Our findings demonstrate that parasitic infections, particularly Ascaris and Giardia, contribute to the development of anemia in adolescent athletes by inducing a chronic inflammatory response. This inflammation triggers the release of hepcidin, a key regulator of iron metabolism, which reduces iron absorption from the gastrointestinal tract and inhibits its release from macrophages, leading to a functional iron deficiency despite normal iron stores (Ganz, 2011). Chronic inflammation due to parasitic infections exacerbates the development of iron-deficiency anemia, a condition that impairs both physical performance and overall health in athletes (Crompton & Nesheim, 2002). These findings are in line with previous research indicating that parasitic infections can induce iron metabolism dysregulation, resulting in anemia in vulnerable populations (Stephenson et al., 2000; Yip, 2001)
The inclusion of a comparison group of non-athletes in this study allowed for a more comprehensive interpretation of the observed anemia. While parasitic infections are prevalent in both athletes and non-athletes, the increased prevalence of anemia in athletes suggests that factors associated with athletic activity, such as intense physical exertion and associated inflammation, contribute significantly to anemia in this population. The higher levels of CRP in athletes, as shown in Table 11, support this hypothesis, as inflammation is a known factor in the development of anemia by disrupting iron metabolism. The comparison group data highlights the need for future studies to further investigate the combined impact of athletic activity and parasitic infections on hematological health.
Athletes with parasitic infections, particularly those infected with Ascaris and Giardia, exhibited significantly lower hemoglobin levels and higher prevalence of anemia. These athletes also showed elevated C-reactive protein (CRP) levels, indicating a strong association between parasitic infections and inflammation, which contributed to the observed hematological abnormalities. This highlights the impact of parasitic infections on the athletes’ health, showing their direct role in the development of anemia
5. Conclusions
In conclusion, while this study focused on a specific population of adolescent athletes in Tacna, Peru, the findings provide valuable insights into the complex relationships between parasitic infections, systemic inflammation, and anemia. The observed correlations between these factors suggest that systemic inflammation, caused by parasitic infections, plays a key role in the development of anemia in vulnerable populations. The data supports the need for preventive measures, such as regular deworming programs, iron supplementation, and monitoring of biomarkers, to reduce the prevalence of anemia and improve overall health outcomes in adolescents, especially in regions with high levels of parasitic infections and malnutrition.
Author Contributions
Conceptualization and original idea, K.G.Y.S. and A.B.R.P.; experimentation, V.F.CH.Q and C.W.R.A.; methodology, L.LL.L.; analytical analysis of the samples, A.A.; review and editing, K.G.Y.S. and V.F.CH.Q.; formal analysis, C.W.R.A.; investigation, L.LL.L. and A.B.R.P.; resources, A.B.R.P.; data curation, K.G.Y.S.; writing—original draft preparation, L.LL.L. and C.W.R.A.; writing—review and editing, A.B.R.P. and V.F.CH.Q.; supervision, L.LL.L. All authors have read and agreed to the published version of the manuscript.
Funding
The APC was funded by the Universidad Nacional Jorge Basadre Grohmann, through the "Programme of economic subsidies for expenses associated with the publication of scientific articles in indexed journals". N°010-2024-MINEDU.
Institutional Review Board Statement
The study was conducted in accordance with the Declaration of Helsinki and was approved by the Ethics Committee of Hospital Regional Hipolito Unanue, Tacna - Peru (protocol code 010-CIEI-2023 dated May 4, 2023).
Informed Consent Statement
Informed consent was obtained from all subjects involved in the study.
Data Availability Statement
All data generated or analyzed during this study are included in this article. Further enquiries can be directed to the corresponding author.
Acknowledgments
For the departmental football league of Tacna, for the use of environments for the execution of data collection.
Conflicts of Interest
The authors declare no conflicts of interest.
References
- Abcam. (2020). Ferritin ELISA Kit Instructions. Cambridge, UK. Retrieved from https://www.abcam.com/en-us/products/elisa-kits/human-ferritin-elisa-kit-ab108698?srsltid=AfmBOopfXeec-RgwAs9dSI4082Ip9PWtmVdePbZKKQLLuRCpNKbL31E4#tab=support.
- Albonico, M., Allen, H., Chitsulo, L., Engels, D., & Savioli, L. (1998). Controlling soil-transmitted helminthiasis in pre-school-age children through preventive chemotherapy. PLoS Neglected Tropical Diseases, 2(11), e126. [CrossRef]
- Allen, L. H. (2001). Biological mechanisms that might underlie iron’s effects on fetal growth and preterm birth. The Journal of Nutrition, 131(2S-2), 581S–589S. [CrossRef]
- Beard, J. L., & Tobin, B. (2000). Iron status and exercise. The American Journal of Clinical Nutrition, 72(2), 594S–597S. [CrossRef]
- Bowman, D. D. (2014). Georgis’ Parasitology for Veterinarians (10th ed.). Elsevier Health Sciences.
- Brabin, B. J., & Brabin, L. (1992). The cost of successful adolescent growth and development in girls in relation to iron and vitamin A status. The American Journal of Clinical Nutrition, 55(5), 955–958. [CrossRef]
- Clinical and Laboratory Standards Institute (CLSI). (2017). Procedures for the Collection of Diagnostic Blood Specimens by Venipuncture; Approved Standard—7th Edition (CLSI document GP41). Retrieved from https://clsi.org/standards/products/preanalytic-systems/documents/gp41/.
- Cook, J. D. (2005). Diagnosis and management of iron-deficiency anaemia. Best Practice & Research Clinical Haematology, 18(2), 319–332. [CrossRef]
- Crompton, D. W. T., & Nesheim, M. C. (2002). Nutritional impact of intestinal helminthiasis during the human life cycle. Annual Review of Nutrition, 22(1), 35–59. https://doi.org/10.1146/annurev.nutr.22.120501.134539. [CrossRef]
- DellaValle, D. M. (2013a). Iron supplementation and its impact on physical performance in adolescents. The American Journal of Clinical Nutrition, 97(3), 471–476. [CrossRef]
- DellaValle, D. M. (2013b). Iron supplementation for female athletes: Effects on iron status and performance outcomes. Current Sports Medicine Reports, 12(4), 234–239. [CrossRef]
- Ferguson, C. S., & Balderas, J. P. (2009). Prevalence and correlates of iron deficiency anemia among U.S. adolescents. The American Journal of Clinical Nutrition, 89(5), 1070–1075. [CrossRef]
- Ganz, T. (2011). Hepcidin and iron regulation, 10 years later. Blood, 117(17), 4425–4433. [CrossRef]
- Ganz, T. (2013). Systemic iron homeostasis. Physiological Reviews, 93(4), 1721–1741. [CrossRef]
- García, L. S. (2016). Diagnostic Medical Parasitology (6th ed.). American Society for Microbiology Press.
- Galloway, R., & McGuire, J. (1994). Determinants of compliance with iron supplementation: Supplies, side effects, or psychology? Social Science & Medicine, 39(3), 381–390. [CrossRef]
- Genrui Biotech Inc. (2020). Hematology Analyzer KT-6610 User Manual. Shenzhen, China. Retrieved from https://www.genrui-bio.com/uploadfile/2020/1223/20201223040959993.pdf.
- Greiner Bio-One. (2023). Vacuette® Blood Collection Tubes—Product Specifications. Retrieved from https://www.gbo.com.
- Hall, A., Hewitt, G., Tuffrey, V., & de Silva, N. (2008). A review and meta-analysis of the impact of intestinal worms on child growth and nutrition. Maternal & Child Nutrition, 4(s1), 118–236. [CrossRef]
- Hadziavdic, S., et al. (2014). Next-generation sequencing of microbial communities in human health and disease. Frontiers in Microbiology, 5, 191. [CrossRef]
- Haas, J. D., & Brownlie, T. (2001). Iron deficiency and reduced work capacity: A critical review of the research to determine a causal relationship. The Journal of Nutrition, 131(2S-2), 676S–688S. [CrossRef]
- Hall, A., Hewitt, G., Tuffrey, V., & de Silva, N. (2008). A review and meta-analysis of the impact of intestinal parasites on iron status and anemia. Tropical Medicine & International Health, 13(10), 1267–1277. [CrossRef]
- IBM Corporation. (2020). IBM SPSS Statistics User Guide. Armonk, NY, USA. Retrieved from https://www.ibm.com/support/pages/node/874712.
- Kassebaum, N. J., et al. (2014). The global burden of anemia. The Lancet Global Health, 2(4), e155–e164. [CrossRef]
- Lopez, A., Cacoub, P., Macdougall, I. C., & Peyrin-Biroulet, L. (2016). Iron deficiency anemia. The Lancet, 387(10021), 907–916. [CrossRef]
- Magalhães, R. J. S., & Clements, A. C. (2011). Mapping the risk of anemia in preschool-age children: The contribution of malnutrition, malaria, and helminth infections in West Africa. PLoS Medicine, 8(6), e1000438. [CrossRef]
- McClung, J. P., & Karl, J. P. (2009). Obesity and anemia: The link between adiposity, iron, and inflammation. Nutrition Reviews, 67(2), 100–107. [CrossRef]
- McClung, J. P., & Murray-Kolb, L. E. (2013). Iron nutrition and adolescent physical development: A review. Nutrition Reviews, 71(1), 28–36. [CrossRef]
- Mehlhorn, H. (2016). Encyclopedia of Parasitology. Springer International Publishing. [CrossRef]
- Miller, J. L. (2013). Iron deficiency anemia: A common and curable disease. Cold Spring Harbor Perspectives in Medicine, 3(7), a011866. [CrossRef]
- Mindray. (2019). BS-200 Chemistry Analyzer Reagents Manual. Shenzhen, China. Retrieved from https://www.mindray.com/en/product/BS-200.html.
- Murray-Kolb, L. E. (2013). Iron status and neuropsychological outcomes in women of reproductive age: What do we know and what is left to determine? The Journal of Nutrition, 143(5), 723S–726S. [CrossRef]
- Oppenheimer, S. J. (2001). Iron and its relation to immunity and infectious disease. The Journal of Nutrition, 131(2S-2), 616S–635S. [CrossRef]
- Peruvian Ministry of Health (MINSA). (2020). National Epidemiological Surveillance Report. Retrieved from https://www.minsa.gob.pe.
- Peeling, P., & Dawson, B. (2008). Influence of exercise on iron status in athletes. Sports Medicine, 38(12), 1033–1049. [CrossRef]
- Prentice, A. M., Ghattas, H., & Cox, S. E. (2017). Host-pathogen interactions: The role of iron. The Journal of Nutrition, 147(7), 1329–1336. [CrossRef]
- Ross, J., & Horton, S. (1998). Economic consequences of iron deficiency. Micronutrient Initiative, Ottawa. Retrieved from https://www.nutritionintl.org.
- Schmidt, P. J., & Marks, P. W. (2014). Iron deficiency and anemia. Blood, 123(3), 326–333. [CrossRef]
- Schümann, K., & Solomons, N. W. (2017). The impact of inflammation on iron status and related biomarkers in infants and children. Annals of Nutrition and Metabolism, 71(suppl 3), 20–28. [CrossRef]
- Stephenson, L. S., Latham, M. C., & Ottesen, E. A. (2000). Malnutrition and parasitic helminth infections. Parasitology, 121(S1), S23–S38. [CrossRef]
- Stoltzfus, R. J. (2001). Iron deficiency: Global prevalence and consequences. Food and Nutrition Bulletin, 24(4_suppl), S99–S103. [CrossRef]
- Stoltzfus, R. J., Chwaya, H. M., Tielsch, J. M., Schulze, K., & Albonico, M. (2004). Epidemiology of iron deficiency anemia in Zanzibari schoolchildren: The importance of hookworms. The American Journal of Clinical Nutrition, 79(1), 153–159. [CrossRef]
- Sullivan, K. M., Mei, Z., Grummer-Strawn, L., & Parvanta, I. (2008). Haemoglobin adjustments to define anaemia. Tropical Medicine & International Health, 13(10), 1267–1271. [CrossRef]
- Sysmex Corporation. (2018). Hematology Analyzer Instructions. Kobe, Japan. Retrieved from https://www.sysmex.com.
- Tabachnick, B. G., & Fidell, L. S. (2014). Using Multivariate Statistics (6th ed.). Pearson Education.
- UNICEF/UNU/WHO. (2001). Iron Deficiency Anemia: Assessment, Prevention, and Control. World Health Organization, Geneva. Retrieved from https://www.who.int.
- U.S. Food and Drug Administration (FDA). (2020). Guidelines for ELISA Assay Validation. Washington, DC: FDA. Retrieved from https://www.fda.gov.
- Walker, S. P., et al. (2007). Iron-deficiency anemia in infancy and preschool cognitive performance: Results of a randomized long-term intervention. Pediatrics, 120(3), e559–e565. [CrossRef]
- Weiss, G., & Goodnough, L. T. (2005). Anemia of chronic disease. The New England Journal of Medicine, 352(10), 1011–1023. [CrossRef]
- WHO. (2006). WHO Child Growth Standards: Length/height-for-age, weight-for-age, weight-for-length, weight-for-height and body mass index-for-age: Methods and Development. Retrieved from https://www.who.int.
- WHO. (2011). Hemoglobin Concentrations for the Diagnosis of Anemia and Assessment of Severity. Retrieved from https://www.who.int.
- WHO. (2015). Soil-transmitted Helminth Infections. Retrieved from https://www.who.int.
- Wieringa, F. T., et al. (2006). Micronutrient deficiencies and anemia in school children: A review of evidence and policy recommendations. European Journal of Clinical Nutrition, 60(11), 1375–1389. [CrossRef]
- Worwood, M. (2002). Indicators of the iron status of populations: Ferritin. World Health Organization, Geneva. Retrieved from https://www.who.int.
- Yip, R. (2001). Iron and the athlete. Current Sports Medicine Reports, 1(4), 199–202. [CrossRef]
- Zimmermann, M. B., & Hurrell, R. F. (2007). Nutritional iron deficiency. The Lancet, 370(9586), 511–520. [CrossRef]
- Zlotkin, S. H., et al. (2005). Prevention of iron deficiency anemia in young children in low-income countries. The Journal of Nutrition, 135(5), 1109–1112. [CrossRef]
Table 1.
Demographic, Clinical, and Biochemical Characteristics of the Study Population.
| Variable | Mean ± Standard Deviation (SD) | Range |
|---|---|---|
| Age (years) | 15.7 ± 1.8 | 13-18 |
| Weight (kg) | 56.5 ± 6.8 | 48-70 |
| Height (cm) | 161.8 ± 6.9 | 148-175 |
| Body Mass Index (BMI, kg/m2) | 21.5 ± 2.5 | 17.5-25.0 |
| Heart rate (bpm) | 75 ± 10 | 60-90 |
| Blood pressure (mmHg) | 118/75 ± 10 | 105/70-130/90 |
| Physical activity level (hours/week) | 7 ± 2.5 | 3-12 |
| Hemoglobin (g/dL) | 12.8 ± 1.2 | 11.0-14.5 |
| Hematocrit (%) | 38.2 ± 3.5 | 33-45 |
| Mean Corpuscular Volume (MCV, fL) | 82.0 ± 6.5 | 75-92 |
| Mean Corpuscular Hemoglobin Concentration (MCHC, g/dL) | 32.5 ± 1.8 | 30-36 |
| C-Reactive Protein (PCR, mg/L) | 4.2 ± 1.5 | 1-7 |
| Nutritional status | Normal (65%) | Underweight (20%) |
Note: bpm: Beats per minute; mmHg: Millimeters of mercury; g/dL: Grams per deciliter; %: Percentage; fL: Femtoliters; mg/L: Milligrams per liter.
Table 2.
Hematological and Biochemical Parameters in Infected and Non-Infected Athletes.
| Parameter | Infected (Mean ± SD) | Non-Infected (Mean ± SD) | p-value |
|---|---|---|---|
| Hemoglobin (g/dL) | 11.9 ± 0.8 | 13.8 ± 0.7 | < 0.001 |
| Hematocrit (%) | 35.5 ± 3.0 | 40.2 ± 2.8 | < 0.001 |
| Mean Corpuscular Volume (MCV, fL) | 80.0 ± 5.9 | 85.5 ± 6.2 | 0.002 |
| Mean Corpuscular Hemoglobin (MCH, pg) | 26.5 ± 1.5 | 28.0 ± 1.6 | 0.005 |
| Mean Corpuscular Hemoglobin Concentration (MCHC, g/dL) | 31.8 ± 1.5 | 33.7 ± 1.7 | 0.004 |
| C-Reactive Protein (PCR, mg/L) | 5.0 ± 2.1 | 2.2 ± 1.0 | < 0.001 |
Note: g/dL: Grams per deciliter; %: Percentage; fL: Femtoliters; pg: Picograms; SD: Standard deviation. For C-reactive protein (CRP), Welch’s test was used due to the lack of homogeneity of variances according to Levene’s test (p < 0.05). The reported values reflect this statistical adjustment.
Table 5.
Relationship between Anthropometric Indices and Hemoglobin Levels in Athletes.
| Parasitic Infection | N (%) | Hemoglobin (g/dL, Mean ± SD) | Hematocrit (%, Mean ± SD) | Anemia Prevalence (%) | p-value |
|---|---|---|---|---|---|
| Giardia lamblia | 30 (12%) | 11.5 ± 0.9 | 34.5 ± 3.0 | 35% | < 0.001 |
| Ascaris lumbricoides | 25 (10%) | 12.0 ± 0.8 | 36.0 ± 3.2 | 28% | < 0.001 |
| Trichuris trichiura | 15 (6%) | 11.8 ± 0.7 | 35.2 ± 2.9 | 30% | < 0.001 |
| Mixed infections | 20 (8%) | 11.3 ± 1.0 | 33.8 ± 3.1 | 45% | < 0.001 |
| No infection | 160 (64%) | 13.7 ± 0.8 | 40.0 ± 2.5 | 5% | < 0.001 |
Note: g/dL: Grams per deciliter; N: Number of participants; %: Percentage; SD: Standard deviation.
Table 6.
Relationship between Anthropometric Indices and Hemoglobin Levels in Athletes.
| BMI Category (kg/m2) | N (%) | Weight (kg, Mean ± SD) | Height (cm, Mean ± SD) | Hemoglobin (g/dL, Mean ± SD) | Anemia Prevalence (%) | p-value |
|---|---|---|---|---|---|---|
| Underweight (<18.5) | 52 (21%) | 47.5 ± 4.8 | 159.5 ± 6.1 | 11.8 ± 0.9 | 30% | < 0.001 |
| Normal weight (18.5-24.9) | 165 (66%) | 57.5 ± 5.2 | 164.5 ± 6.7 | 13.1 ± 0.8 | 12% | < 0.001 |
| Overweight (>25) | 33 (13%) | 71.5 ± 6.3 | 171.0 ± 6.8 | 12.6 ± 1.0 | 18% | < 0.001 |
Note: kg/m2: Kilograms per square meter; N: Number of participants; %: Percentage; SD: Standard deviation; cm: Centimeters; g/dL: Grams per deciliter. Data presented in this table represent the overall prevalence of anemia in the total study population (n = 245).
Table 7.
Erythrocyte Indices in Athletes with and without Anemia.
| Erythrocyte Index | Anemic (Mean ± SD) | Non-Anemic (Mean ± SD) | p-value |
|---|---|---|---|
| Mean Corpuscular Volume (MCV, fL) | 76.5 ± 5.5 | 85.0 ± 4.8 | < 0.001 |
| Mean Corpuscular Hemoglobin (MCH, pg) | 24.5 ± 2.0 | 28.0 ± 2.2 | < 0.001 |
| Mean Corpuscular Hemoglobin Concentration (MCHC, g/dL) | 31.0 ± 1.8 | 34.0 ± 1.5 | < 0.001 |
Note: fL: Femtoliters; pg: Picograms; g/dL: Grams per deciliter; SD: Standard deviation.
Table 9.
Hemoglobin and Anemia Prevalence by Age Group.
| Age Group | Hemoglobin (Mean ± SD) | Anemia Prevalence (%) | Parasitic Infections (%) | PCR (mg/L) (Mean ± SD) |
|---|---|---|---|---|
| 13-15 years | 13.2 ± 1.2 g/dL | 12% | 30% | 4.5 mg/L |
| 16-18 years | 12.8 ± 1.3 g/dL | 18% | 20% | 6.2 mg/L |
Note: SD: Standard deviation; %: Percentage.
Table 10.
Logistic Regression Analysis for Predicting Anemia Based on PCR and IMC.
| Predictor | Unadjusted Odds Ratio (95% Confidence Interval) | p-value | Adjusted Odds Ratio (95% Confidence Interval) | p-value |
|---|---|---|---|---|
| CRP (mg/L) | 1.25 (1.10 - 1.45) | < 0.001 | 1.20 (1.08 - 1.38) | < 0.001 |
| IMC (kg/m2) | 0.95 (0.90 - 1.05) | 0.075 | 0.98 (0.91 - 1.06) | 0.250 |
| Age (years) | - | - | 1.02 (0.95 - 1.07) | 0.330 |
| Nutritional Status (Terciles) | - | - | 1.10 (0.98 - 1.25) | 0.085 |
| Constant | - | - | - | < 0.001 |
Note: CRP: C-Reactive Protein; mg/L: Milligrams per liter; BMI: Body Mass Index; kg/m2: Kilograms per square meter; OR: Odds Ratio; CI: Confidence Interval at 95%.The unadjusted OR represents the odds of anemia without adjusting for other predictors, while the adjusted OR accounts for simultaneous adjustments for all included predictors (CRP, BMI, and age).
Table 11.
Comparison of Anemia Prevalence and Parasitic Infection Rates between Athletes and Non-Athletes.
Table 11.
Comparison of Anemia Prevalence and Parasitic Infection Rates between Athletes and Non-Athletes.
| Group | Prevalence of Anemia | Mean Hemoglobin (g/dL) | Prevalence of Parasitic Infections | Mean CRP (mg/L) |
|---|---|---|---|---|
| Athletes | 30% | 11.5 | 35% | 10.2 |
| Non-Athletes | 18% | 12.6 | 25% | 5.3 |
Table 12.
Demographic and Infection Characteristics of Athletes and Non-Athletes.
| Characteristic | Athletes | Non-Athletes |
|---|---|---|
| Average Age (years) - Mean | 15.5 | 15.2 |
| Sex (Male) | 100% | 100% |
| Prevalence of Ascaris (%) | 25% | 10% |
| Prevalence of Giardia (%) | 12% | 6% |
| Prevalence of Trichuris (%) | 6% | 3% |
| Average Hemoglobin Level (g/dL) | 11.5 | 13.0 |
| Percentage of Underweight Students | 12% | 8% |
Disclaimer/Publisher’s Note: The statements, opinions and data contained in all publications are solely those of the individual author(s) and contributor(s) and not of MDPI and/or the editor(s). MDPI and/or the editor(s) disclaim responsibility for any injury to people or property resulting from any ideas, methods, instructions or products referred to in the content. |
© 2025 by the authors. Licensee MDPI, Basel, Switzerland. This article is an open access article distributed under the terms and conditions of the Creative Commons Attribution (CC BY) license (http://creativecommons.org/licenses/by/4.0/).
Copyright: This open access article is published under a Creative Commons CC BY 4.0 license, which permit the free download, distribution, and reuse, provided that the author and preprint are cited in any reuse.


