
Submitted:
20 June 2025
Posted:
24 June 2025
You are already at the latest version
Abstract
Electrochemical sensors based on PET track-etched membranes (TeMs) photograft copolymerization of N-vinylformamide (N-VFA) and trimethylolpropane trimethacrylate (TMPTMA). The modification, structure and properties of the modified PET TeMs were thoroughly characterized using scanning electron microscopy (SEM) and atomic force microscopy (AFM), thermogravimetric analysis (TGA), Fourier-transform infrared (FTIR) spectroscopy, gas permeability measurements and contact angle analysis. Parameters affecting the degree of membrane modification were identified and optimized. Moreover, the modified membranes were employed for the detection of Eu3+, Gd3+, La3+, Ce3+ ions using square wave anodic voltammetry (SW-ASV). The sensors exhibited linear detection range from 10-7 M to 10-3 M, with limits of detection of 1.0 × 10⁻⁶ M (Eu3+), 6.0 × 10⁻⁶ M (Gd3+), 2.0 × 10⁻⁴ M (La3+) and 2.5 × 10⁻⁵ M (Ce3+). The results demonstrated a significant enhancement in electrochemical response due to the grafted PET TeMs-g-N-PVFA-TMPTMA structure. Furthermore, tests conducted in tap water confirmed that the constructed sensors are suitable for real-world applications, providing reliable accuracy and reproducibility for rare earth element ion detection.
Keywords:
PET track-etched membranes
; UV photograft copolymerization
; rare earth metal ions
; sensor
; square wave anodic voltammetry
1. Introduction
In recent decades, there has been a rapid increase in the use of rare earth elements in various industries, from electronics and renewable energy to metallurgy, medicine. The widespread use of rare earth elements (REE) is due to their unique magnetic, luminescent and catalytic properties [1]. However, along with technological progress, concerns about their impact on the environment and human health are growing [2].
Due to irrational consumption and insufficient disposal, REE ions are increasingly found in soil, water and living organisms. Although many of these elements were previously considered slightly toxic, recent studies show their ability to cause oxidative stress, disrupt the functioning of the kidneys, liver and central nervous system and accumulate in biological tissues [2,3].
In this regard, monitoring the content of REE in the environment is becoming increasingly important. High-precision analytical methods such as inductively coupled plasma mass spectrometry (ICP-MS), X-ray fluorescence spectroscopy, laser-induced breakdown spectroscopy (LIBS) and atomic emission spectroscopy are used to determine REE [4,5]. Despite their high sensitivity, these methods require complex equipment, high costs and significant time for sample preparation. Therefore, alternative approaches are becoming increasingly relevant, in particular electrochemical methods of analysis that combine sensitivity, portability, ease of use and possibility of automation.
Due to their closely related physical and chemical properties, the accurate detection of individual REE remains a complex task. This challenge becomes even more pronounced when a specific REE must be detected within a mixture of other lanthanides, as their mutual interferences and overlapping characteristics can significantly hinder selectivity and analytical accuracy [6,7]. Electrochemical methods that combine sensor-based selectivity, operational simplicity and prompt analysis provide a promising platform for real-time monitoring of REE [8,9]. This platform should ensure reliable, reproducible and operationally efficient detection. The significance of these performance parameters can vary depending on the specific technique employed [7,10]. Efficient control and quantification of the interaction between an analyte and a sensing element is achieved using a wide range of electrochemical methods [11]. Among them, voltammetric and potentiometric techniques stand out as particularly effective methods, offering high sensitivity at a cost-effective and time-efficient rate for identifying specific analytes.
An alternative electrochemical method involves utilizing ion-imprinted electrodes, enabling the detection of specific metal ions via voltammetry. In this context, Cao et al. created an electrochemical sensor for detecting Eu(III) ions using a modified screen-printed electrode (SPE) [12]. The ease and speed of production for screen-printed electrodes, coupled with their affordability, make them highly suitable for use in electrochemical sensors. Screen-printed based electrodes have a big advantage in the possibility to be modified, not only with regard to metal-sensitive film formation, but also by incorporating molecules or nano-size materials. This versatility, together with their miniaturized size, makes them good candidates for on-site determination of target analytes with portable instrumentation, not only in environmental monitoring, but also in food, agricultural and biomedical analysis. Differential pulse adsorptive stripping voltammetry (DPASV) was employed to detect Eu3+ using the developed sensor, which exhibited a linear response in the concentration range of 1.0×10⁻⁷ to 1.0×10⁻³ mol\L and achieved a detection limit of 4.0×10⁻⁸ mol\L under optimized conditions (-0.2 V accumulation potential, 360 s accumulation time) [13]. H. A. Zamani and co-workers reported the development of several gadolinium (III)-selective polyvinyl chloride (PVC) membrane sensors, employing a variety of molecules as ionophores [14]. At the same time, N-vinylformamide (N-VFA) monomer readily undergoes free-radical homo- and copolymer important vinyl monomers [15]. In addition, under acidic and basic conditions homo- and copolymers of N-VFA easily hydrolyze to polymers containing vinylamine units have also a great potential for use in water purification [16].
2. Materials and Methods
2.1. Equipment and Materials
N-vinylformamide(N-VFA), trimethylolpropane trimethacrylate (TMPTMA), benzophenone (BP) and isopropanol (99.9%) were purchased from Sigma-Aldrich. Sodium acetate, N, N-dimethylformamide (DMF), europium, gadolinium, lanthanum and cerium standard samples were analytical grade and used without further purification. Deionized water purchased from Akvilon-D301 was used for preparing all the solutions. Square wave anodic stripping voltammetry (SW-ASV) measurements were performed on PalmSens EmStat3+ potentiostat.
2.2. Membrane Preparation and Surface Treatment
The object of this investigation comprised polyethylene terephthalate (PET) films of the Hostaphan® brand, produced by Mitsubishi Polyester Film (Germany), with a nominal thickness of 12 μm. Ion irradiation was performed using 84Kr15+ ions at energy of 1.75 MeV/nucleon, using the DC-60 heavy ion accelerator (The Institute of Nuclear Physics, Astana, Kazakhstan). The irradiation fluence was 1×10⁸ ions\cm2. Membranes were obtained through photosensitization using a 30 W UV-C lamp (OSRAM HNS G13), irradiating each side for 30 minutes at a distance of 10 cm. Subsequent chemical etching was conducted in NaOH (C=2.2M) solution at 85°C for 3 minutes, resulting in the formation of membranes containing pores with diameters of 300±20nm. Following the etching procedure, the samples were stored at room temperature under standard laboratory conditions.
2.2.1. Surface Modification via UV-Initiated Grafting
Modification of PET track-etched membranes (TeMs) was performed via UV graft polymerization. Prior to the reaction, the membranes were pre-cleaned by sequential washing in deionized water and isopropanol for 10 minutes. The samples were then immersed in a 5% benzophenone (BP) solution in N, N-dimethylformamide for 24 hours, followed by drying and brief washing with isopropanol. Subsequently, the membranes were transferred into isopropanol solutions (99.9%) of the N-VFA monomer at varying concentrations (2.5, 5, 10, 15 and 20%) together with a crossing agent TMPTMA (trimethylolpropane trimethacrylate, C=5%). Argon gas is used to purge the reaction mixtures, eliminating dissolved oxygen. UV-induced graft polymerization was conducted using an OSRAM Ultra Vitalux E27 lamp (UVA: 315-400 nm, 13.6 W; UVB: 280-315 nm, 3.0 W) for durations ranging from 15 to 90 minutes. The temperature was maintained constant at 39-40°C using a fan. After irradiation, the modified membranes were thoroughly washed in water, dried and weighed to determine the grafting degree.
where: m1 and m2 indicate the sample masses before and after grafting, respectively.
2.2.2. Structural and Surface Characterization of Modified Membranes
Surface morphology of the PET TeMs before and after modification were performed using a Phenom ProX G6 scanning electron microscope (Thermo Fisher Scientific, Eindhoven, The Netherlands) scanning electron microscope (SEM). Furthermore, membrane pore size was independently assessed using gas permeability method at a pressure of 20 kPa (data presented in Table 1). To study the chemical functionalities, FTIR spectra were recorded using an InfraLUM FT-08 IR Fourier spectrometer with an ATR attachment (GladiATR from Pike Technologies). Spectral data were collected within the range of 400 to 4000 cm-1, accumulating 20 scans per spectrum at a controlled temperature between 20-25°C. Spectral acquisition and processing were performed utilizing the SpectraLUM software package.
Thermogravimetric analysis (TGA) was performed to investigate the thermal characteristics of the pristine PET track-etched membrane, PET TeMs-g-N-PVFA-TMPTMA and the pure N-PVFA polymer. This technique enabled the assessment of sample thermal stability, the pathway of thermal decomposition and the associated mass loss as a function of temperature. Thermal stability of the samples was tested by using thermogravimetric analyzer Themys One+ (Setaram). Measurements were conducted under an inert argon atmosphere at a controlled heating rate of 10°C/min, spanning a temperature range from 25 to 800°C.
2.2.3. Surface Morphology and Mechanical Properties of Membranes Using AFM
The structure of the membrane surface was studied by atomic force microscopy (AFM, NT-206, ALC Mikrotesmachines, Republic of Belarus) in the contact mode of the AFM using standard silicon cantilevers NSG 03 (TipsNano), with a stiffness of 1.7 N/m and a radius of curvature of no more than 10 nm.
2.2.4. Nano-Roughness Analysis
Based on the results of AFM scanning of 5×5 μm areas with a resolution of 256×256 points in the SurfaceExplorer processing program, the arithmetic mean and root mean square roughness of the sample surfaces were determined. The average values were calculated for 5 scanning areas.
The Ra index characterizes the variability in Z of the membrane surface within the selected area and is calculated using the formula:
where: N is the number of scanning matrix points, Zi,j is the height at position(x, y), is the arithmetic mean value of the height in the entire scanning matrix.
The root mean square deviation (Rq) is calculated using the formula:
2.2.5. Contact Angle (CA) Measurement
The wettability of the membrane surface was analyzed based on the measured CA values using the DSA 100E setup (KRUSS, Germany) using the sessile drop method. The principle of measuring the CA is based on constructing a tangent at a three-phase point: liquid-substrate-air. Distilled water and diiodomethane (Sigma-Aldrich, 99%) were used at test liquids. Based on the CA values, the free surface energy (γ) and its specific polar component (γp) were calculated using the WORK (Ounce, Wendt, Rabel and Kjelble) method. The accuracy of measuring the contact angle is ±0.1°.
2.3. Electrochemical Stripping Voltammetry
2.3.1. Track-Etched Membrane Sensors: Design and Development
Sensors based on PET TeMs-g-N-PVFA-TMPTMA obtained under optimal conditions (t=60 min, N-VFA concentration 10% and a distance from the UV lamp of 10 cm, T=38-40°C) were produced by magnetron sputtering of gold with a thickness of 40-50 nm on both sides of the membrane using a template, as presented in [17]. Size of the gold surfaces is 5×10 mm. Electrical connections to these gold surfaces were established using 0.4 mm diameter copper cables secured with silver paste to minimize interfacial resistance and subsequently insulated with layers of fingernail varnish and wax to prevent short circuits and ensure electrochemical isolation. The sensor was configured as a two-electrode system, with one gold surface serving as the working electrode (WE) and the opposing gold surface acting as the counter electrode (CE). Electrochemical measurements were conducted using a PalmSens EmStat3+ potentiostat in conjunction with an external Ag/AgCl reference electrode immersed in KCl (C=3 M) solution.
SW-ASV was performed using solutions of europium, lanthanum, gadolinium and cerium by dissolving the appropriate amount of their nitrate or chloride in 100 ml of 0.1 M sodium acetate. Prepared sensors were kept in an analyzed solution for 30 min before the measurements. SW-ASV signals were taken at deposition potential of -1.2 V for 60 s, then scanning from -1 V to 1 V at a frequency of 50 Hz and amplitude of 20 mV. The concentration of Eu3+, Gd3+, La3+ and Ce3+ ions varied from 10-3 M to 10-7 M. Then, in the presence of a reference electrode (Ag/AgCl) at a potential of Eu3+, Gd3+, La3+, Ce3+ ions were precipitated for 60 s. A scan was then performed from -1 to 1 V to oxidize rare earth metal ions at a redox potential of -0.6-0.3 V.
3. Results
3.1. PET TeMs Surface Modification
The modification of PET TeMs was achieved through a UV-initiated graft polymerization process involving N-VFA and TMPTMA, TMPTMA was used as a crosslinking agent. Before the UV irradiation, BP generates reactive radicals, which abstract hydrogen atoms from the PET surface, creating active radical sites. These sites initiate the polymerization of N-VFA, leading to the formation of poly(N-vinylformamide) chains covalently bonded to the TeMs. Then, TMPTMA monomer, with multiple methacrylate groups, participates in the grafting process and promotes crosslinking due to their multifunctional structure. As a result, a co-grafted layer composed of both N-PVFA and a crosslinked TMPTMA network forms on the membrane surface combining the functional properties of N-PVFA with the structural stability imparted by TMPTMA. The resulting crosslinked N-PVFA network on the PET membrane surface provides binding sites (carbonyl oxygen atoms and nitrogen, oxygen atoms in the amide groups PVFA) for the rare earth metal ions. The crosslinked structure influenced the stability and accessibility of these binding sites.
The parameters that can affect the grafting degree, monomer concentration, reaction time and distance from the UV lamp were optimized to get a high grafting degree while maintaining the membrane pore structure; the results are presented in Table 1 and Figure 1. Isopropanol (IPA) was selected as the solvent due to its effective solubilization of the N-VFA monomer. The grafting degree increased from 1.06% to 12.93% as the reaction time extended from 15 to 60 minutes consistently enhanced the grafting degree, whereas increasing the monomer concentration beyond 10% resulted in a slight decline in grafting efficiency.
3.1.1. Characterization of Surface Changes on PET TeMs
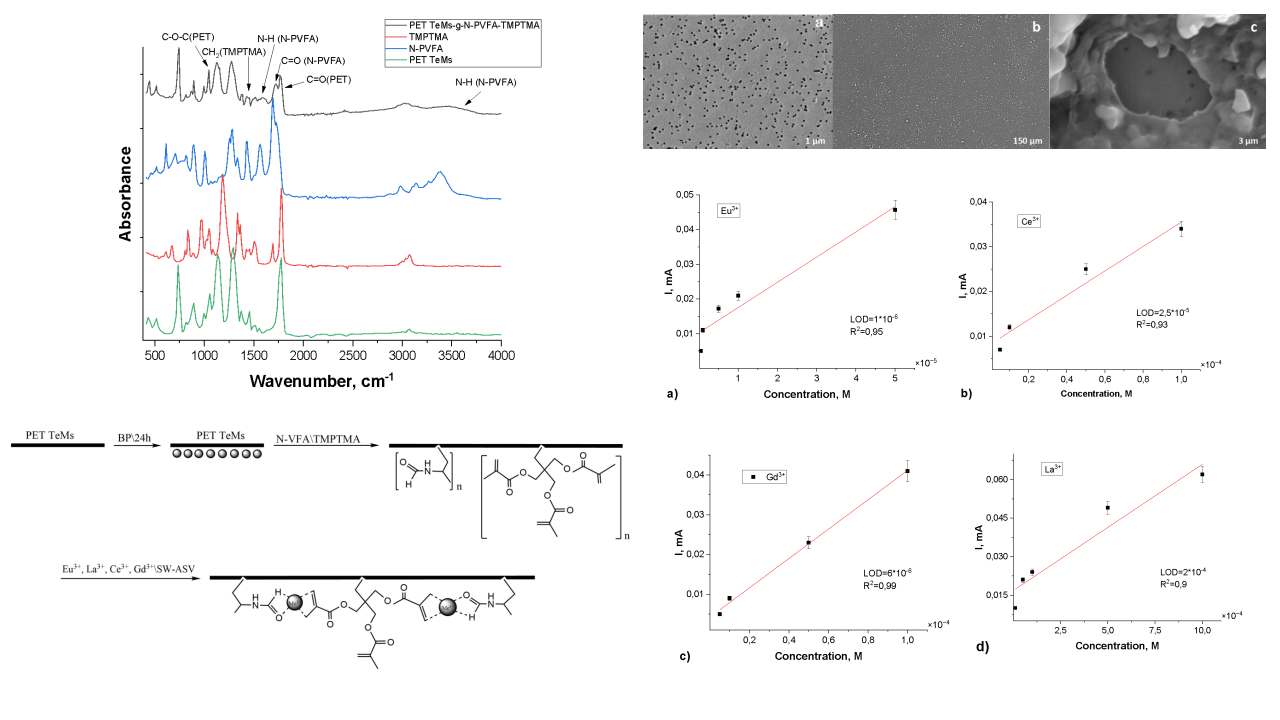
The FTIR spectra of the initial PET TeMs, N-PVFA, TMPTMA and PET TeMs-g-N-PVFA-TMPTMA are shown in Figure 2. The initial PET TeMs have the main absorption peaks at 2950-3100 cm-1 (aliphatic CH), 1714 cm-1 (C=O) 1634, 1554, 1454 cm-1 (aromatic vibrations of the carbon skeleton), 1242 cm-1 (C(O)-O) and 974 cm-1 (O-CH2). Photograft polymerization of N-PVFA led to the appearance of new peaks at 3300 cm-1, N-H bond in the amide group leads to wide stretching vibrations in this region. Also, the pronounced shoulder at 1650-1690 cm-1 corresponds to the stretching vibrations of the carbonyl (C-O) group of formamide. FTIR analysis confirms the participation of the carbonyl groups of the formamide fragments in the interaction, as evidenced by the shift in the C=O bond stretching frequency from 1640 to 1620 cm⁻¹. The polymerization of TMPTMA is confirmed by the increased intensity in the C=O region (~1720 cm⁻¹) due to the additional ether carbonyl groups and the appearance of CH2 bending in the region of 1454 and 1386-1408 cm⁻¹.
Most studies have shown that block copolymers of TMPTMA, along with similar monomers containing carboxyl and hydroxyl groups, can be polymerized and grafted onto various polymers using free-radical or radiation initiation. This process results in the formation of crosslinking networks, which improve the mechanical and thermal properties of the material. The crosslinking significantly enhances the mechanical strength, stability and chemical resistance of the membrane, making it more durable and suitable for a wide range of applications [18,19].
Figure 3 shows a simplified representation of the PET membrane with a grafted poly(N-VFA) chain. The units of N-VFA and TMPTMA are linked to the PET surface after photoinitiated grafting. TMPTMA was used to form a strong bond between the PET TeMs surface and poly(N-VFA) chain. The second part illustrates the coordination of rare earth metal ions to the carbonyl oxygen atoms of the formamide groups on the grafted poly(N-VFA) and TMPTMA chains.
3.1.2. Morphological and Structural Characterization via SEM, AFM and TGA
The surface morphology of PET TeMs and PET TeMs-g-N-PVFA-TMPTMA coated on PET TeMs before and after modification were observed by scanning electron micrographs. It can be seen from Figure 4 that the modified membrane (b) is smooth and homogeneous. The SEM micrographs clearly demonstrate that the modification of the PET TeMs with N-PVFA-TMPTMA leads to a substantial change on the surface morphology, characterized by the covering of the original pores, resulting in a partial clogging of these pores.
The thermogram of the PET TeMs demonstrates (Figure 5) notable thermal stability up to 380 °C, beyond which a significant mass loss event is observed within the temperature range of 380-450 °C, indicative of the primary polymer backbone degradation. A residual mass of 9.6% of the initial weight remains at the maximum analyzed temperature of 800 °C, attributable to the formation of thermally stable char. Conversely, the N-PVFA homopolymer (blue line) exhibits a multi-stage degradation process. An initial gradual mass loss commences around 100 °C, likely due to the release of volatile byproducts or moisture, followed by a more pronounced decomposition phase between 250 °C and 450 °C, corresponding to the thermal scission of the polymer chains. Near-complete decomposition is observed by 800 °C, with minimal residual mass [20]. The PET TeMs-g-N-PVFA-TMPTMA (t=60 min, N-VFA concentration 10% and L=10 cm UV distance, T=38-40°C) composite (red line) displays a thermal degradation profile that is intermediate between the pristine PET TeMs and the N-PVFA homopolymer, reflecting the successful grafting of the N-PVFA based polymer onto the PET TeMs. The thermogram exhibits an initial minor mass loss at lower temperatures, followed by a more substantial decomposition event commencing 380 °C and extending to 450 °C. This broad degradation range suggests the concurrent decomposition of both the PET substrate and the grafted polymeric layer. The residual mass at 450 °C is lower than that of the unmodified PET TeMs but higher than the pure N-PVFA, further supporting the compositional nature of the modified membrane.
AFM data on the surface structure of the PET TeMs samples after modification are shown in Figure 6. It is shown that samples s1 and s2 are characterized by a developed surface. The highest nanoroughness values were found for sample s1 (Ra = 15.66 nm, Rq = 20.72 nm) (Table 1). The pore boundaries of sample 2 are not clearly defined (Ra = 4.12 nm, Rq = 5.64 nm). With an increase in the monomer concentration to 10% (s3 (Ra = 6.18 nm, Rq = 9.02 nm)) and 15% (s4), the degree of polymerization reaches values of about 13%. The pore boundaries are uniform; the interpore space is characterized by a dense uniform structure (s3, s4). The lowest surface roughness values were noted for sample s4, which indicates the uniformity of the studied surface (Ra = 2.88 nm ± 10%, Rq = 4.24 nm ± 10%).
All types of samples are hydrophilic (Table 2), the CA is about 40° and does not depend on the monomer concentration. However, the dispersion component contributes a significant specific weight (2/3) to the surface energy values, which is due to the nature of the polymers used.
3.2. Electrochemical Measurement
3.2.1. Voltammetric Properties of Eu3+, Gd3+, La3+, Ce3+on Track-Etched Membrane Sensor Surfaces
Among the rare earth ions studied, europium (Eu3+) exhibited the most significant enhancement in peak height and analytical sensitivity under acidic conditions, particularly at pH 6. As illustrated in Figure 7, the square-wave anodic stripping voltammetry (SW-ASV) peak current (I, mA) displayed a strong dependence on the solution pH. Beyond pH 7, a pronounced decrease in peak current was observed, possibly due to formation of weaker coordination complexes between REE ions and functional groups of the polymer chains. By comparison, at lower pH values, electrochemical detection of REE ions becomes increasingly compromised by the onset of hydrogen evolution, typically occurring in the potential range of -0.9 to -0.8 V. To balance sensitivity and signal clarity, optimal pH values were selected for each ion in subsequent analyses: pH 6 for Eu3+, pH 5 for Gd3+, pH 4 for La3+ and pH 7 for Ce3+, respectively.
To optimize the adsorption time for electrochemical detection, PET TeMs modified via photograft polymerization with N-PVFA and TMPTMA were immersed in 10-3 M solutions of Eu3+, Gd3+, La3+, Ce3+ ions prepared in 0.1 M sodium acetate for 30 minutes. Electrochemical deposition and reduction of these rare earth metal ions were subsequently carried out with an applied potential of -1.2 V for 60 seconds using the Ag/AgCl reference electrode. Following deposition, a potential sweep from -1 V to +1 V is performed to record the oxidation signals corresponding to each ion species.
Subsequent sensor performance evaluation was conducted across a concentration range of 10-3 to 10-7 M for the target rare earth elements. The resulting calibration curves (depicted in Figure 8) demonstrated the following limits of detection (LOD): Eu3+ - 1.0×10⁻⁶ M (R2 = 0.95), Gd3+ - 6.0×10⁻⁶ M (R2 = 0.99), La3+ - 2.0×10⁻⁴ M (R2 = 0.90) and Ce3+ - 2.5×10⁻⁵ M (R2 = 0.93). These findings indicate that the surface modification of PET TeMs via photograft polymerization of N-PVFA with TMPTMA significantly enhances the electrochemical sensing capabilities for rare earth metal ions. The repeatability of the PET TeMs-g-N-PVFA-TMPTMA based sensor was evaluated by conducting ten consecutive measurements of rare earth elements at the concentration of 10-3 M in wastewater. The standard deviation remained below 6%, demonstrating a good reproducibility and stability of the sensor under complex conditions.
The developed electrochemical sensor was evaluated for its practical application by individually detecting REE ions in tap water. To evaluate the practicability, the obtained PET TeMs-g-N-PVFA-TMPTMA was used to detect REE in tap water after the membrane filtration. The results demonstrate that the PET TeMs-g-N-PVFA-TMPTMA-modified sensor offers high analytical sensitivity and reliable performance in selectively identifying Eu3+, Gd3+, La3+and Ce3+ions.

Table 3.
Results of determination of REE ions in water samples.
| Sample | Added\(C=10-3M) | ∆I,mA | pH | % |
| Deionized water | Eu³⁺ Gd³⁺ La³⁺ Ce³⁺ |
0.09 0.061 0.051 0.052 |
3.5 5-5.5 4 7(n) |
100 100 100 100 |
| Tap water | Eu³⁺ Gd³⁺ La³⁺ Ce³⁺ |
0.082 0.063 0.047 0.04 |
3.5 5-5.5 4 7(n) |
91 103.3 92.2 77 |
4. Conclusions
In this study, we demonstrated that UV polymerization of N-vinylformamide, followed by crosslinking with trimethylolpropane trimethacrylate on poly(ethylene terephthalate) track-etched membranes, significantly enhances the functional properties of electrochemical sensors. The resulting sensors were tested for the electrochemical detection of Eu3+, Gd3+, La3+and Ce3+ions using square wave anodic stripping voltammetry over a concentration range of 10-3 to 10-7 M. By controlling the modification conditions, effective complexation of rare earth ions on the sensor surface was achieved. The calibration curves demonstrated that the sensor exhibits reliable sensitivity for REE detection, with limits of detection of 1.0×10⁻⁶ M for Eu3+(R2 = 0.95), 6.0×10⁻⁶ M for Gd3+(R2 = 0.99), 2.0×10⁻⁴ M for La3+(R2 = 0.90) and 2.5×10⁻⁵ M for Ce3+ (R2 = 0.93). The obtained results confirm the efficiency of the developed sensor, which enables selective and sensitive detection of rare earth element ions.
Author Contributions
Investigation, N.Z., A.Y. and G.M.; writing—original draft preparation, N.Z.; resources, A.Z., S.C.; supervision, I.K.; visualization, A.Y., data curation, G.M., S.C., A.Z.; writing—review and editing, I.K.; All authors have read and agreed to the published version of the manuscript.
Funding
This research is funded by the Ministry of Energy of the Republic of Kazakhstan (BR23891691).
Conflicts of Interest
The authors report no conflicts of interest.
References
- Binnemans, K., Jones, P. T., Blanpain, B., Van Gerven, T., Yang, Y., Walton, A., & Buchert, M. (2013). Recycling of rare earths: A critical review. Journal of Cleaner Production, 51, 1–22. [CrossRef]
- Wang, W., Yang, Y., Wang, D., & Huang, L. (2024). Toxic effects of rare earth elements on human health: A review. Toxics, 12(5), 317. [CrossRef]
- Gwenzi, W., Mangori, L., Danha, C., Chaukura, N., Dunjana, N., & Sanganyado, E. (2018). Sources, behaviour, and environmental and human health risks of high-technology rare earth elements as emerging contaminants. Science of the Total Environment, 636, 299–313. [CrossRef]
- Ardini, F., Soggia, F., Rugi, F., Udisti, R., & Grotti, M. (2010). Comparison of inductively coupled plasma spectrometry techniques for the direct determination of rare earth elements in digests from geological samples. Analytica Chimica Acta, 678(1), 18–25. [CrossRef]
- Balaram, V. (2019). Rare earth elements: A review of applications, occurrence, exploration, analysis, recycling, and environmental impact. Geoscience Frontiers, 10(4), 1285–1303. [CrossRef]
- De Vito, I., Olsina, R., & Masi, A. (2000). Enrichment method for trace amounts of rare earth elements using chemofiltration and XRF determination. Fresenius' Journal of Analytical Chemistry, 368, 392–396. [CrossRef]
- Adhikari, B., & Majumdar, S. (2004). Polymers in sensor applications. Progress in Polymer Science, 29(7), 699–766. [CrossRef]
- Zawisza, B., Pytlakowska, K., Feist, B., Polowniak, M., Kita, A., & Sitko, R. (2011). Determination of rare earth elements by spectroscopic techniques: A review. Journal of Analytical Atomic Spectrometry, 26, 2373–2390. [CrossRef]
- Brown, R. J. C., & Milton, M. J. T. (2005). Analytical techniques for trace element analysis: an overview. Trends in Analytical Chemistry, 24(3), 266–274. [CrossRef]
- Brett, C. M. A. (2001). Electrochemical sensors for environmental monitoring: Strategy and examples. Pure and Applied Chemistry, 73(12), 1969–1977. [CrossRef]
- Li, X. Z., & Sun, Y. P. (2007). Evaluation of ionic imprinted polymers by electrochemical recognition of rare earth ions. Hydrometallurgy, 87(1-2), 63–71. [CrossRef]
- Chen, J., Bai, H., Xia, J., Li, Z., Liu, P., & Cao, Q. (2018). Electrochemical sensor for detection of europium based on polycatechol and ion-imprinted sol–gel film modified screen-printed electrode. Journal of Electroanalytical Chemistry, 824, 32–38. [CrossRef]
- Chen, J., Bai, H., Li, Y., Zhang, J., Liu, P., & Cao, Q. (2018). Stripping voltammetric determination of europium via ultraviolet-trigger synthesis of ion imprinted membrane. Sensors and Actuators B: Chemical, 273, 749–755. [CrossRef]
- Zamani, H. A., Mohammadhosseini, M., Mohammadrezazadeh, S. H., Faridbod, F., Ganjali, M. R., Meghdadi, S., & Davoodnia, A. (2012). Gadolinium(III) ion selective sensor using a newly synthesized Schiff’s base as a sensing material. Materials Science and Engineering: C, 32(3), 712–717. [CrossRef]
- Witek, E., Pazdro, M., & Bortel, E. (2007). Mechanism for Base Hydrolysis of Poly(N-vinylformamide). Journal of Macromolecular Science, Part A, 44, 503 - 507. [CrossRef]
- Pinschmidt, R. (2010). Polyvinylamine at last. Journal of Polymer Science Part A: Polymer Chemistry, 48(10), 2257–2283. [CrossRef]
- Korolkov, V., Mashentseva, A. A., Guven, O., & Taltenov, A. A. (2015). UV-induced graft polymerization of acrylic acid in the sub-micronchannels of oxidized PET track-etched membrane. Nuclear Instruments and Methods in Physics Research B, 365, 419–423. [CrossRef]
- Tayebi, S., Jahani, Y., & Arabi, H. (2019). Trimethylolpropane trimethacrylate functionalized polypropylene/polyhexene-1 blend with enhanced melt strength. Polymer-Plastics Technology and Materials, 59(6), 555–571. [CrossRef]
- Mousavi-Saghandikolaei, S., Frounchi, M., Dadbin, S., Augier, S., Passaglia, E., & Ciardelli, F. (2007). Modification of isotactic polypropylene by the free-radical grafting of 1,1,1-trimethylolpropane trimethacrylate. Journal of Applied Polymer Science, 104, 950–958. [CrossRef]
- Sütekin, S. D., Demirci, S., Kurt, S. B., Güven, O., & Sahiner, N. (2021). Tunable fluorescent and antimicrobial properties of poly(vinyl amine) affected by the acidic or basic hydrolysis of poly(N-vinylformamide). Journal of Applied Polymer Science, 140(11), e51234. [CrossRef]
Figure 1.
Grafting degree depending on UV irradiation time (a) and monomer concentration (b).
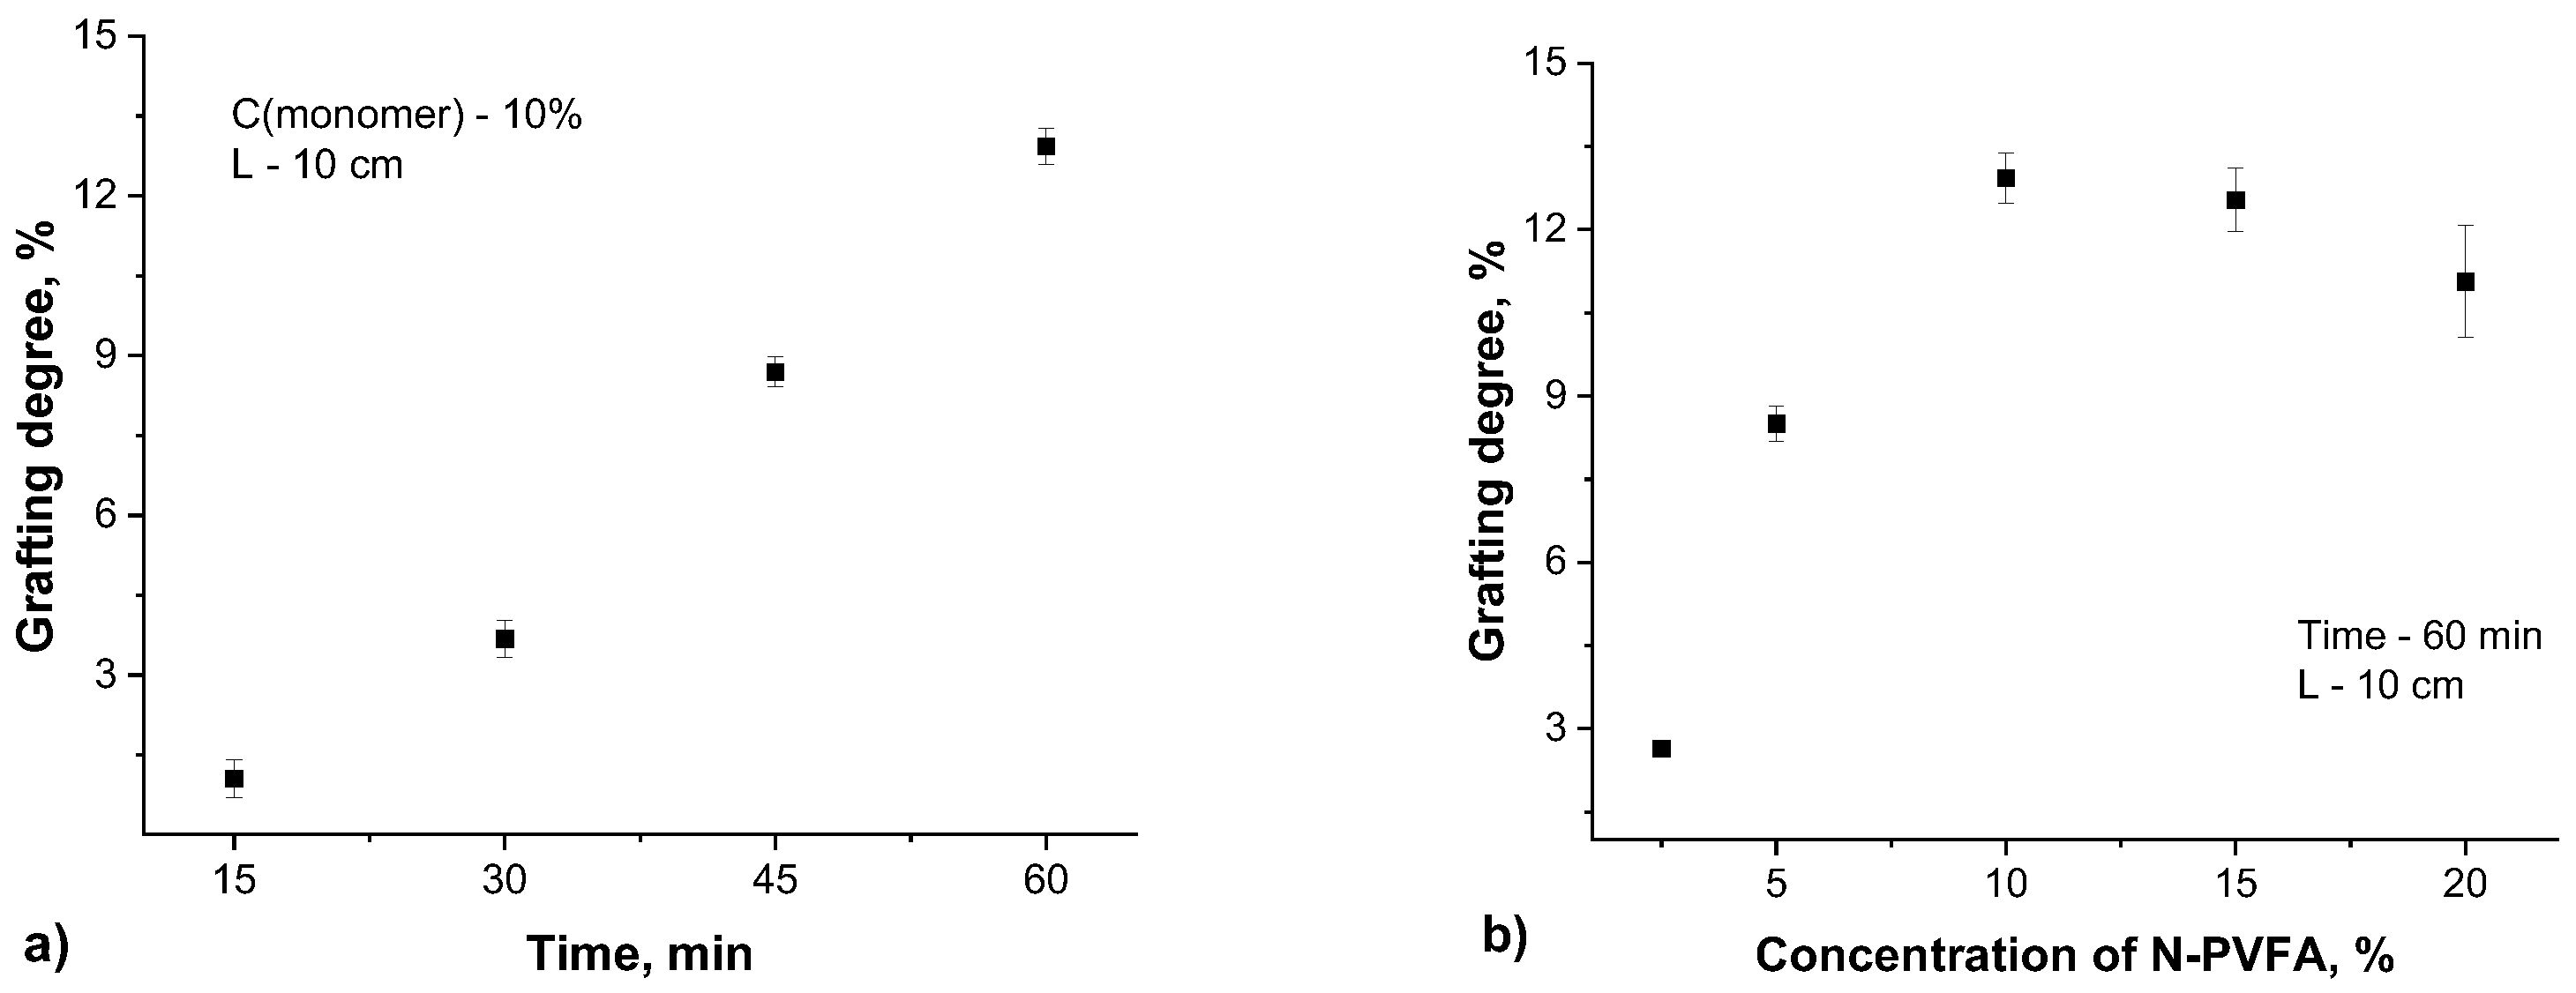
Figure 2.
FTIR spectra of modified PET TeMs-g-N-PVFA-TMPTMA.
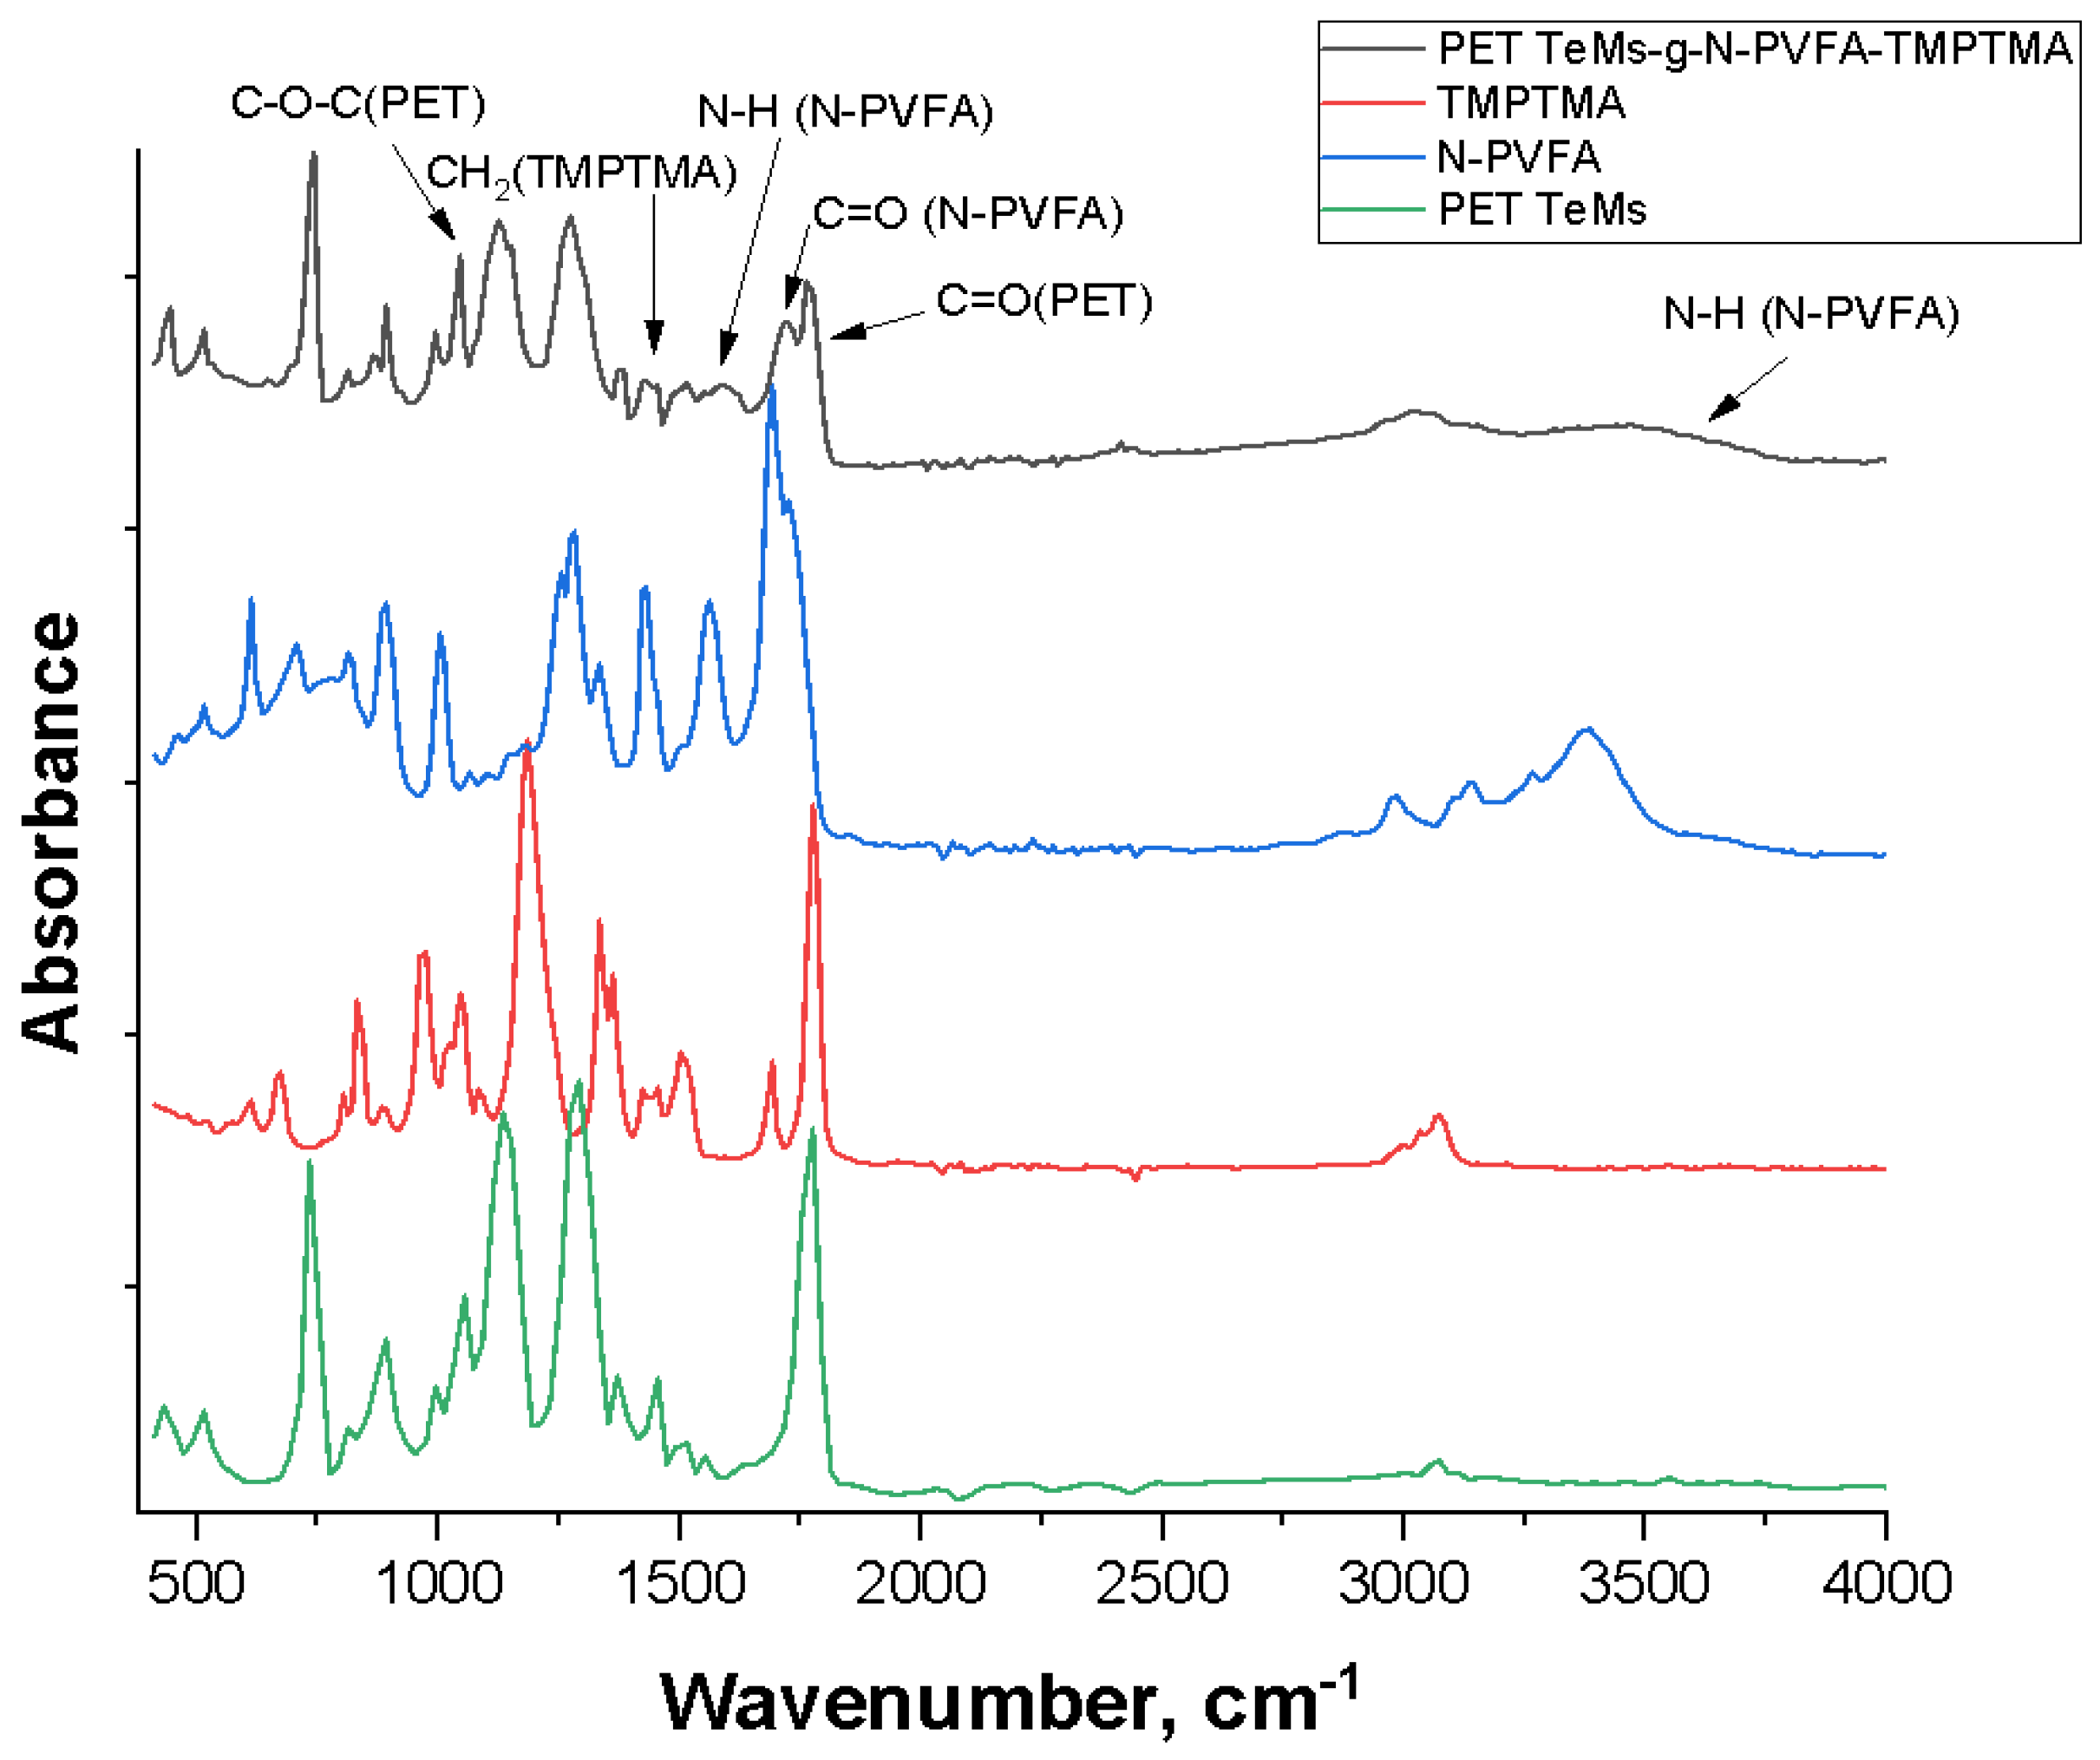
Figure 3.
Scheme of PET TeMs-g-N-PVFA-TMPTMA modification.
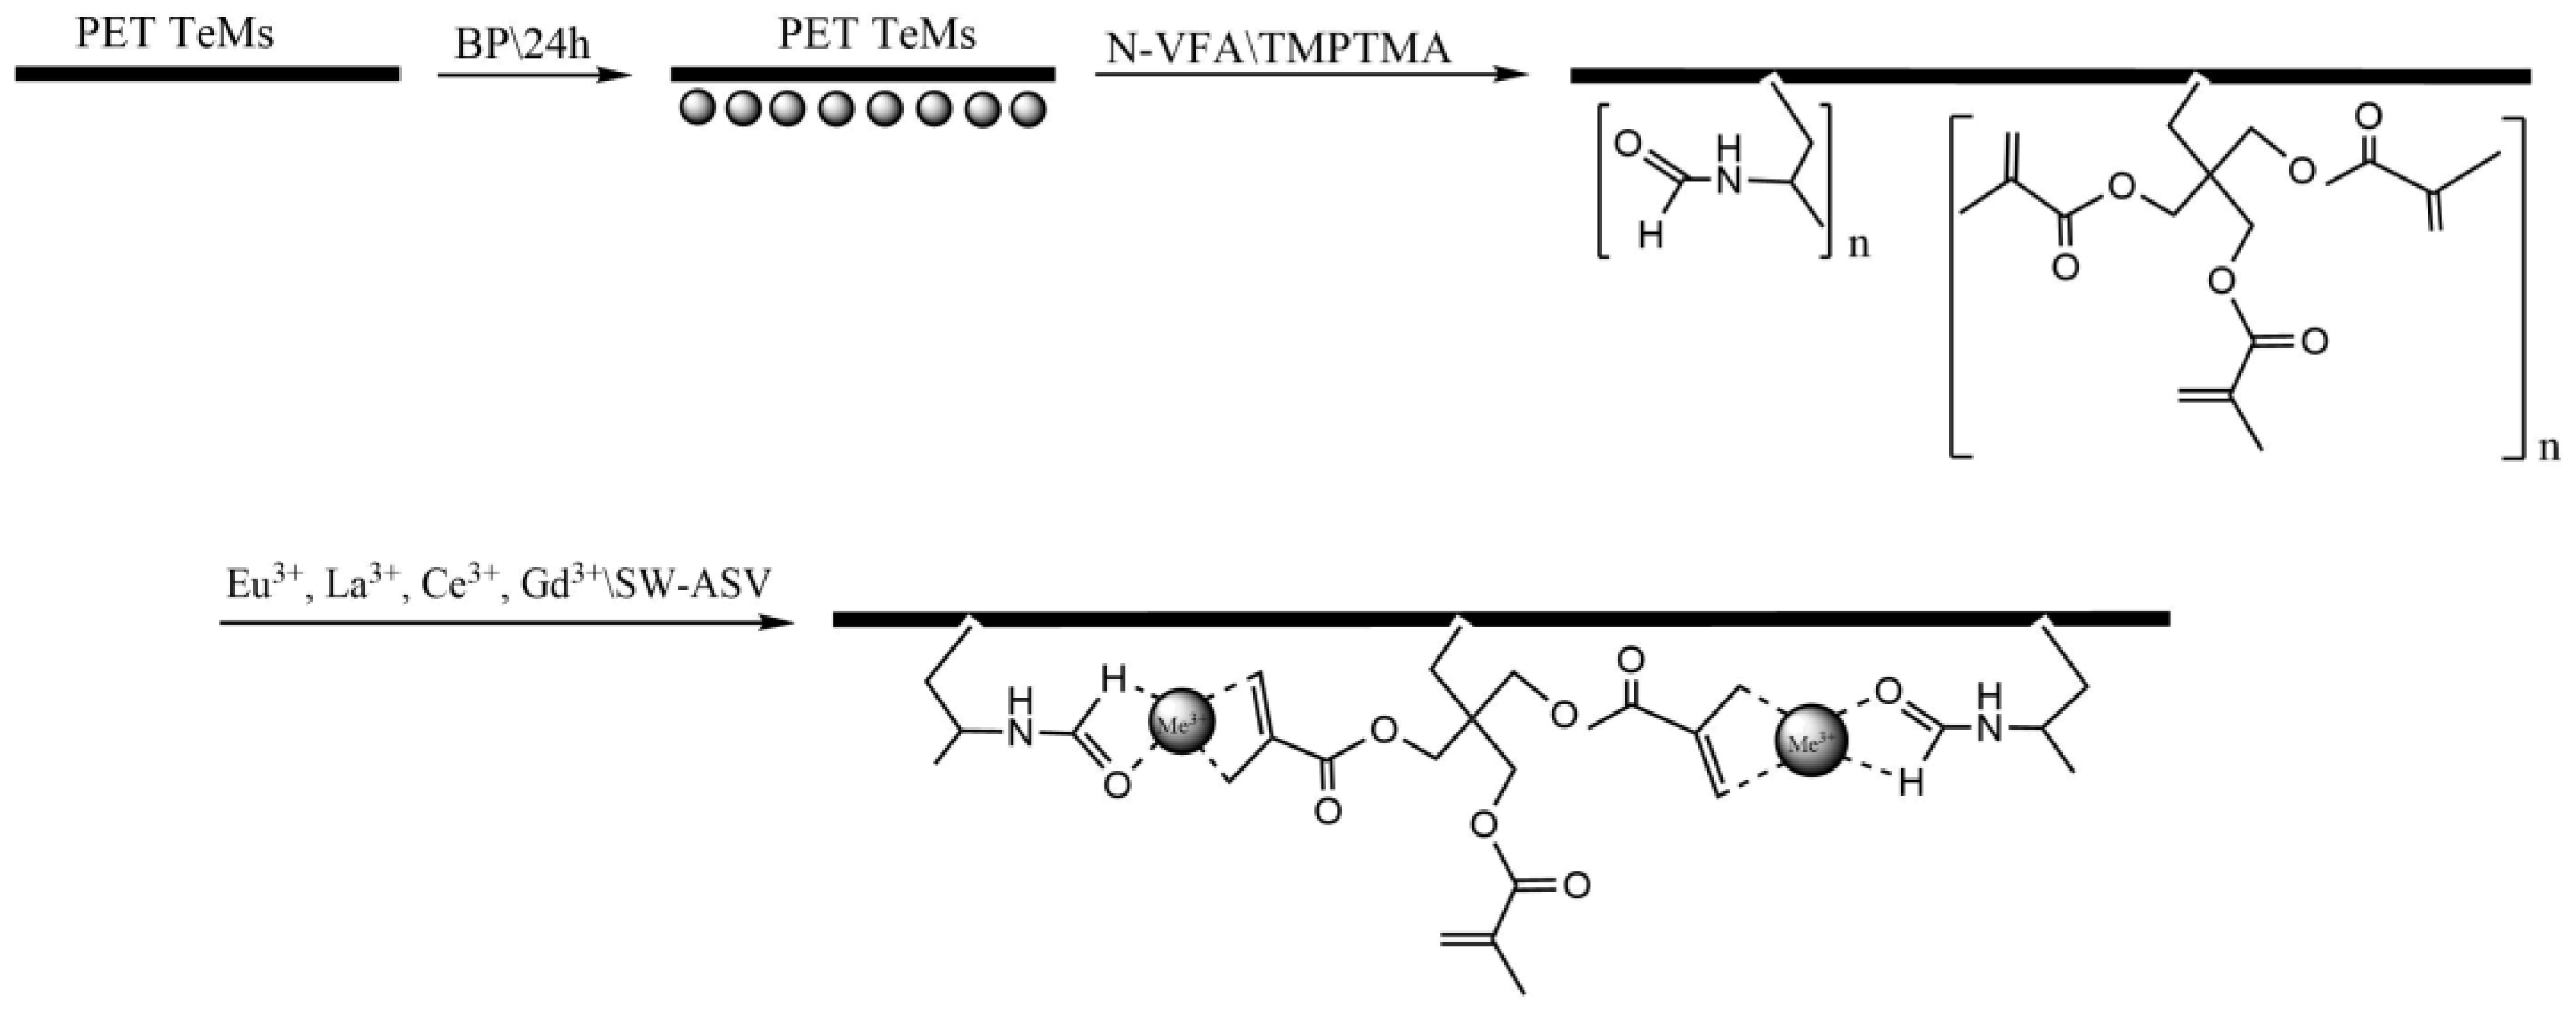
Figure 4.
SEM micrographs of the original PET TeMs (a) and the modified PET TeMs-g-N-PVFA-TMPTMA (t=60 min, N-VFA (C=10%), L=10 cm) at different magnifications: 1000× (b) and 50000× (c) .
Figure 4.
SEM micrographs of the original PET TeMs (a) and the modified PET TeMs-g-N-PVFA-TMPTMA (t=60 min, N-VFA (C=10%), L=10 cm) at different magnifications: 1000× (b) and 50000× (c) .
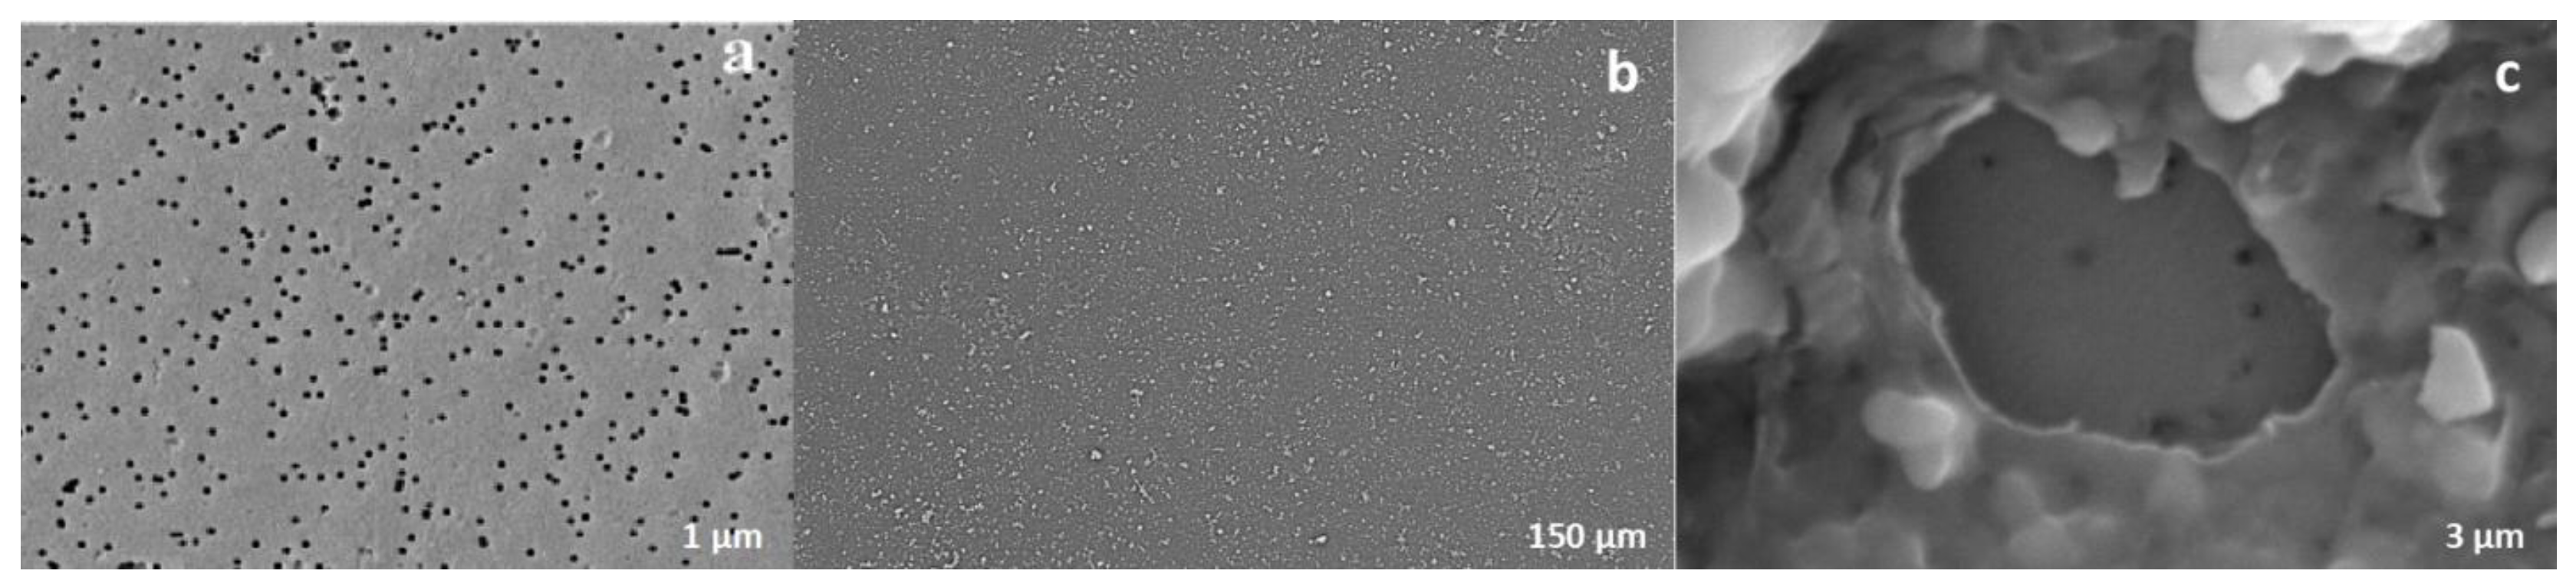
Figure 5.
Thermogravimetric (TGA) analyses results.
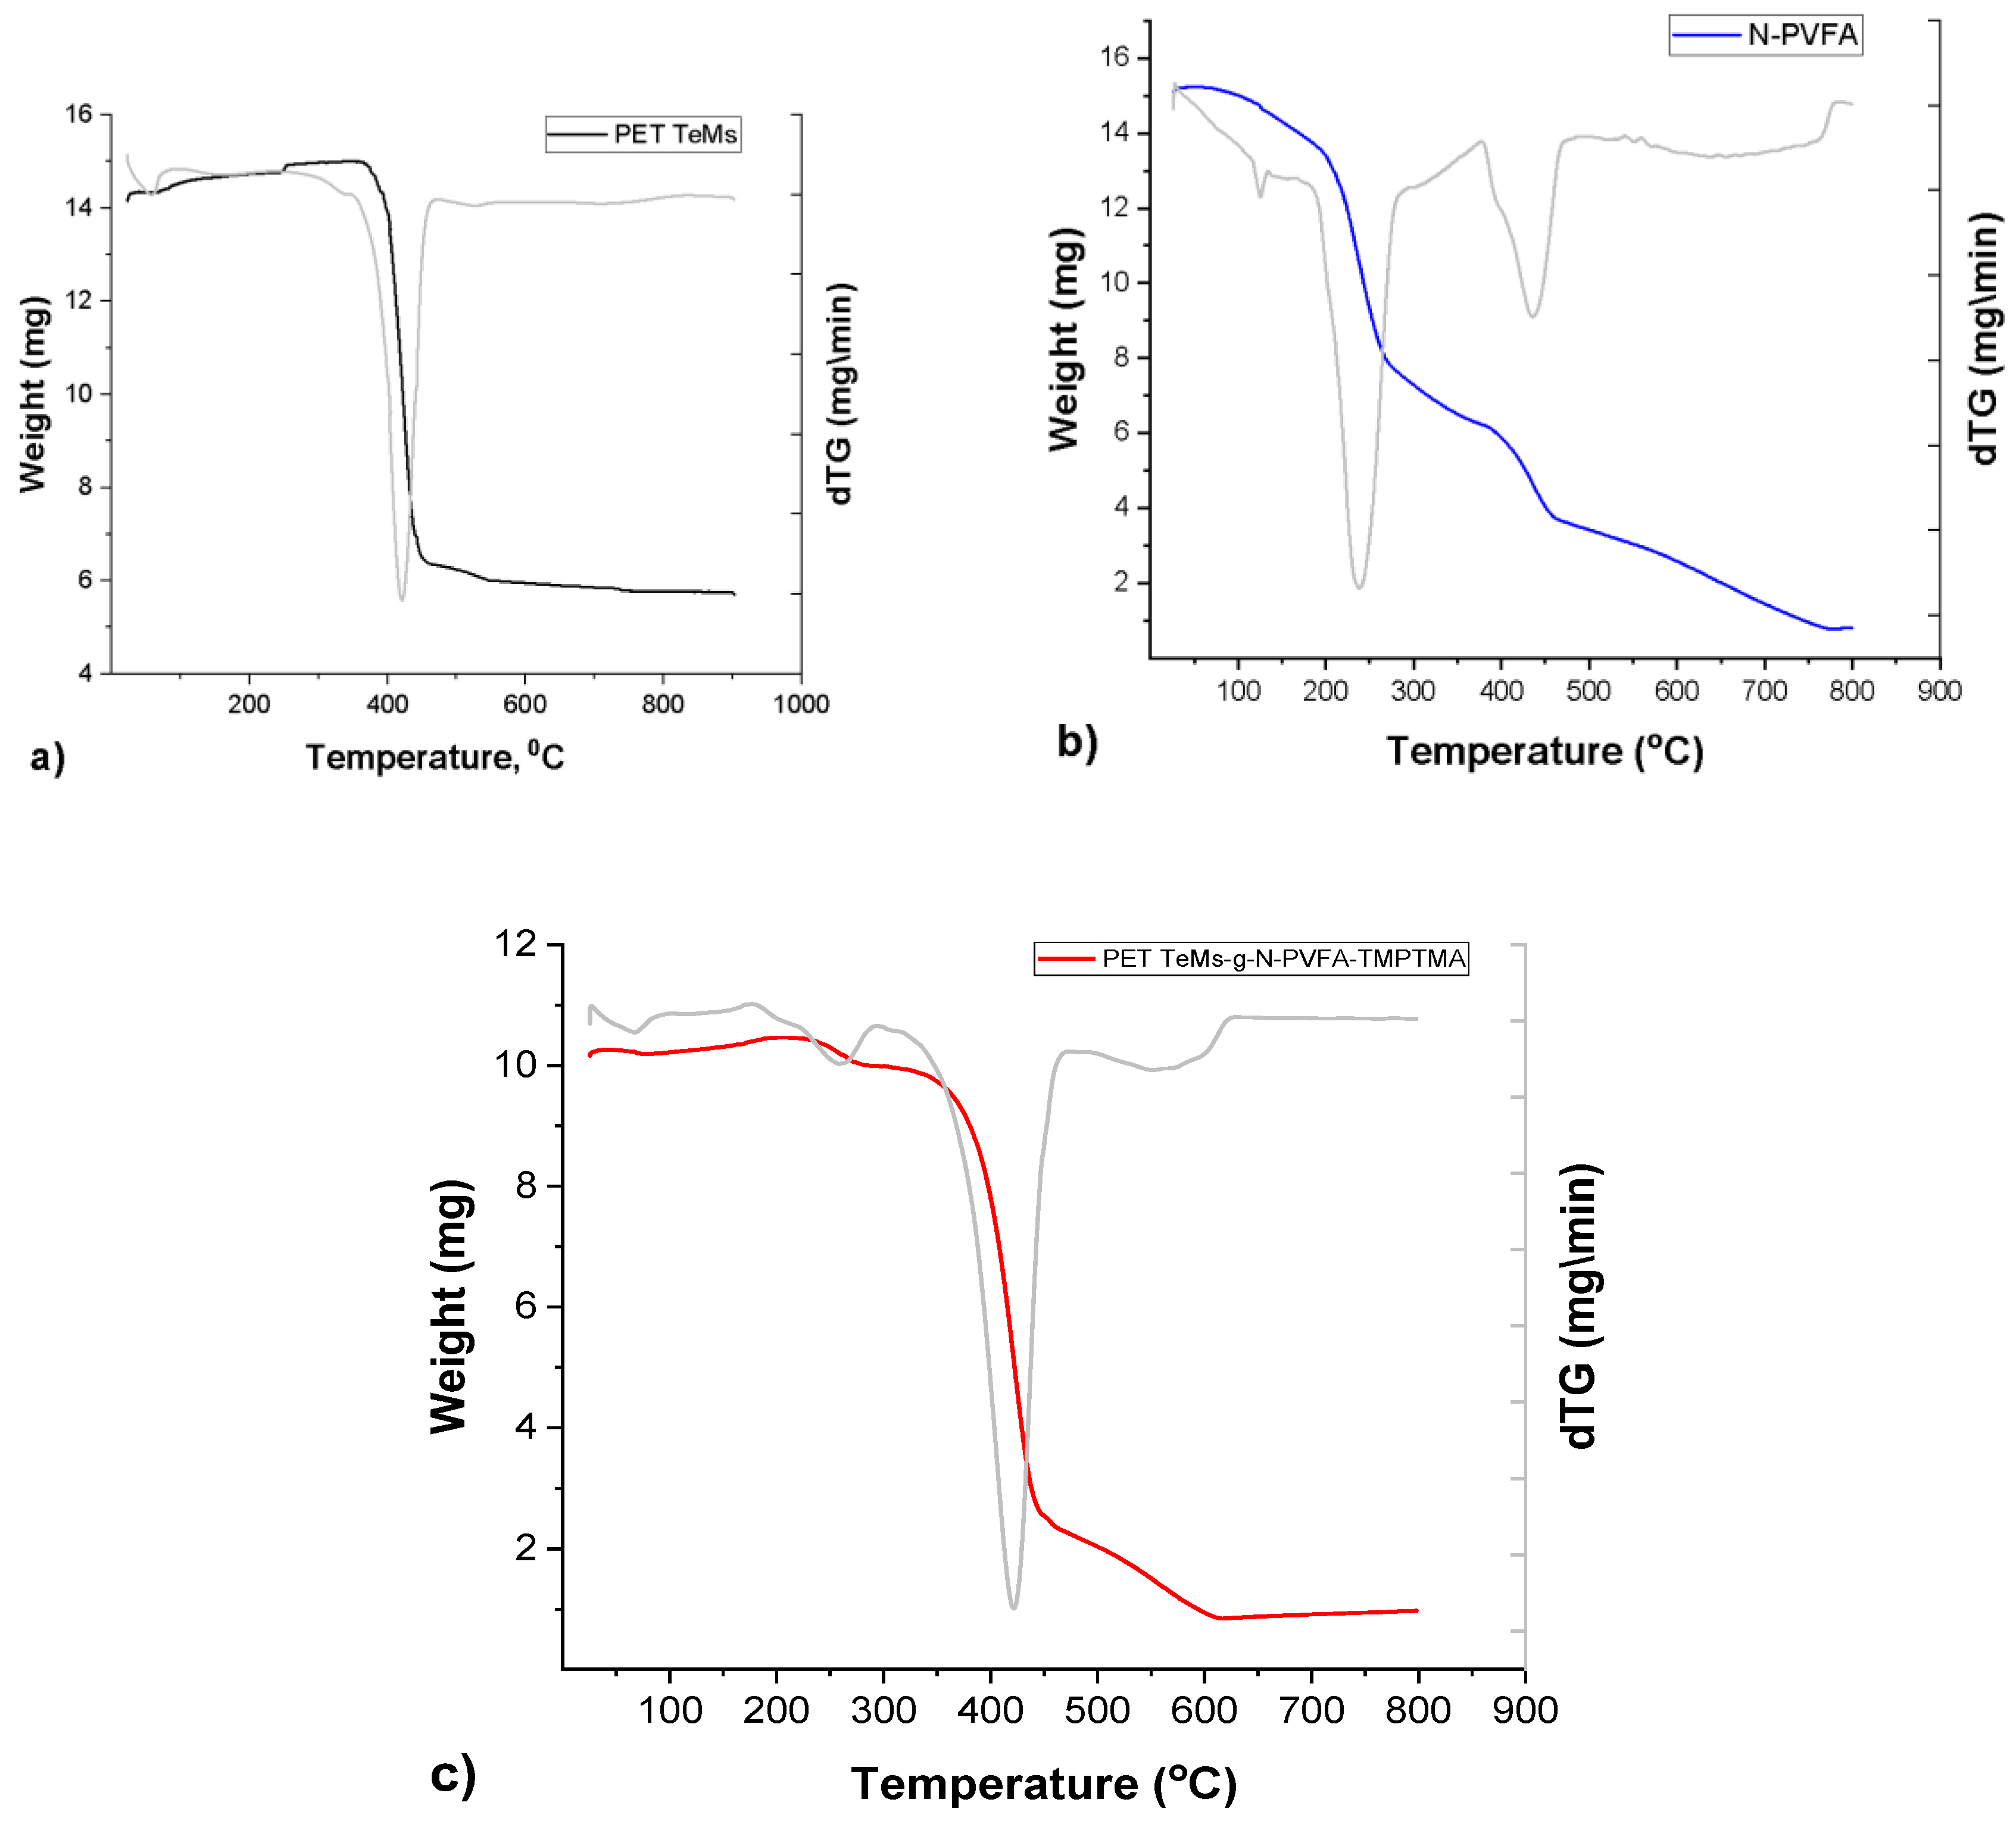
Figure 6.
The surface structure of PET TM in the AFM operating mode “Topography” (a, d, g, j), “Torsion” (b, e, h, k), “3D” (c, f, i, l) and the initial PET TeMs (m, n, o).
Figure 6.
The surface structure of PET TM in the AFM operating mode “Topography” (a, d, g, j), “Torsion” (b, e, h, k), “3D” (c, f, i, l) and the initial PET TeMs (m, n, o).
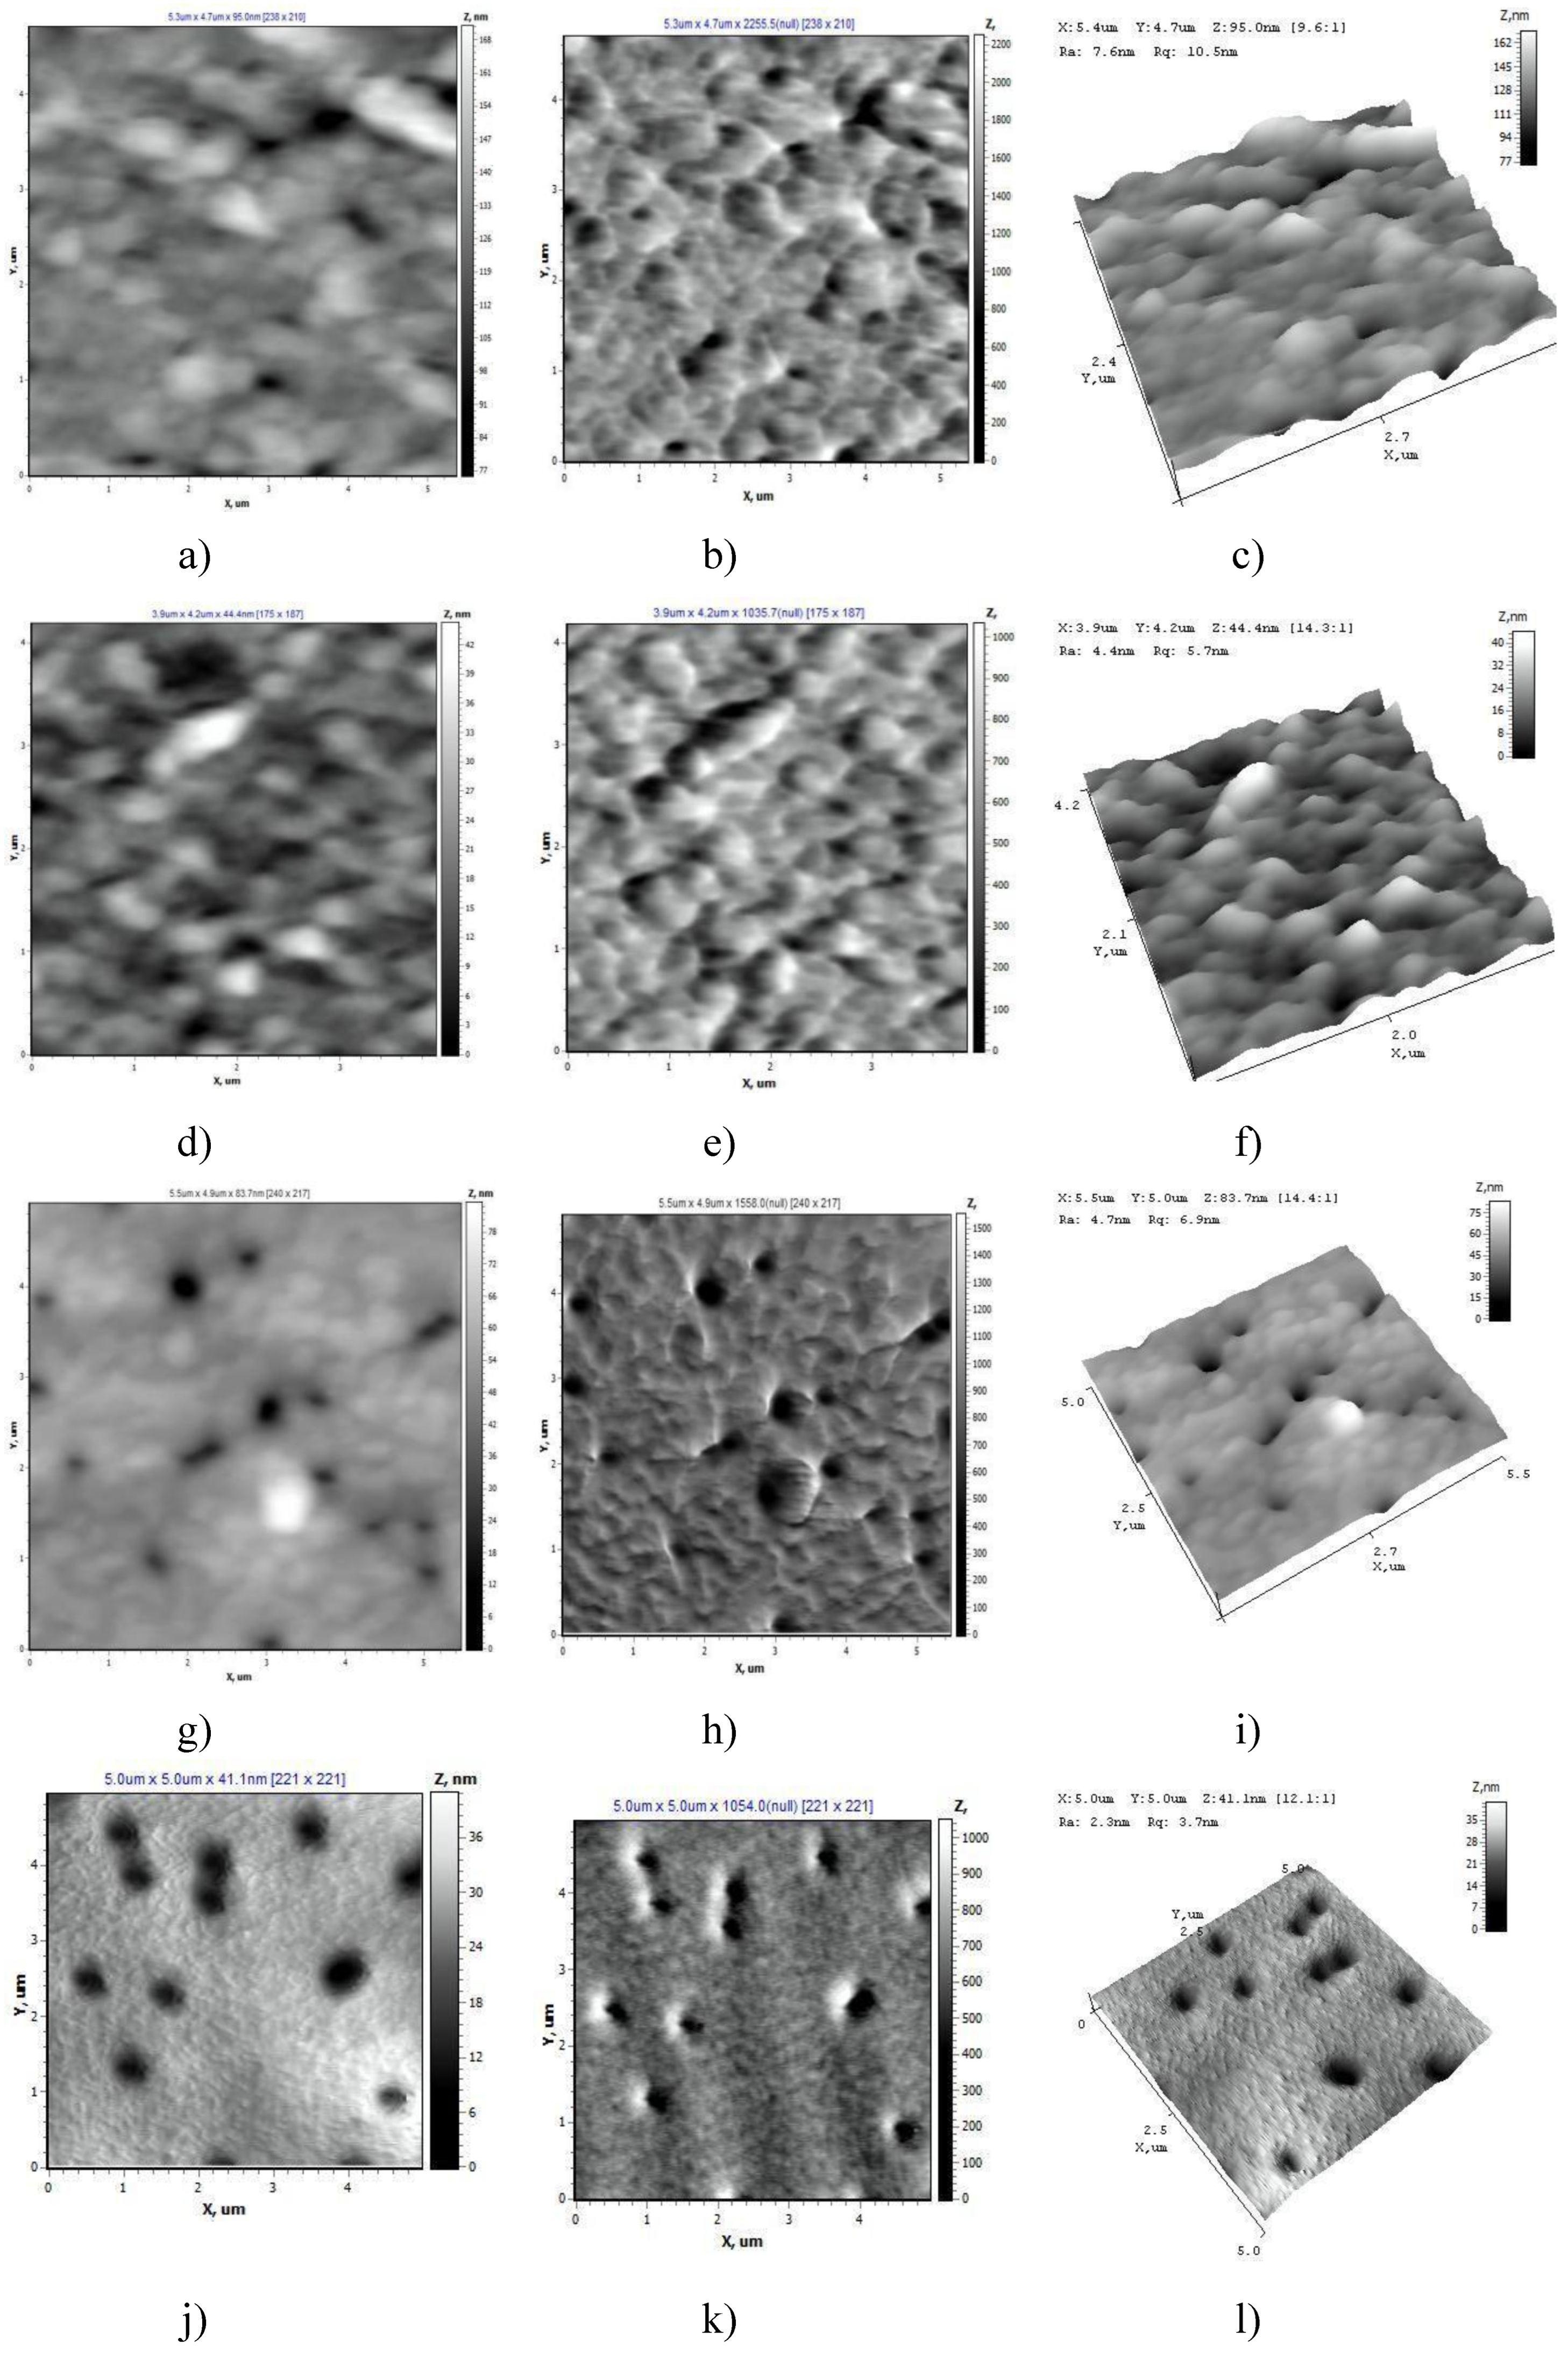
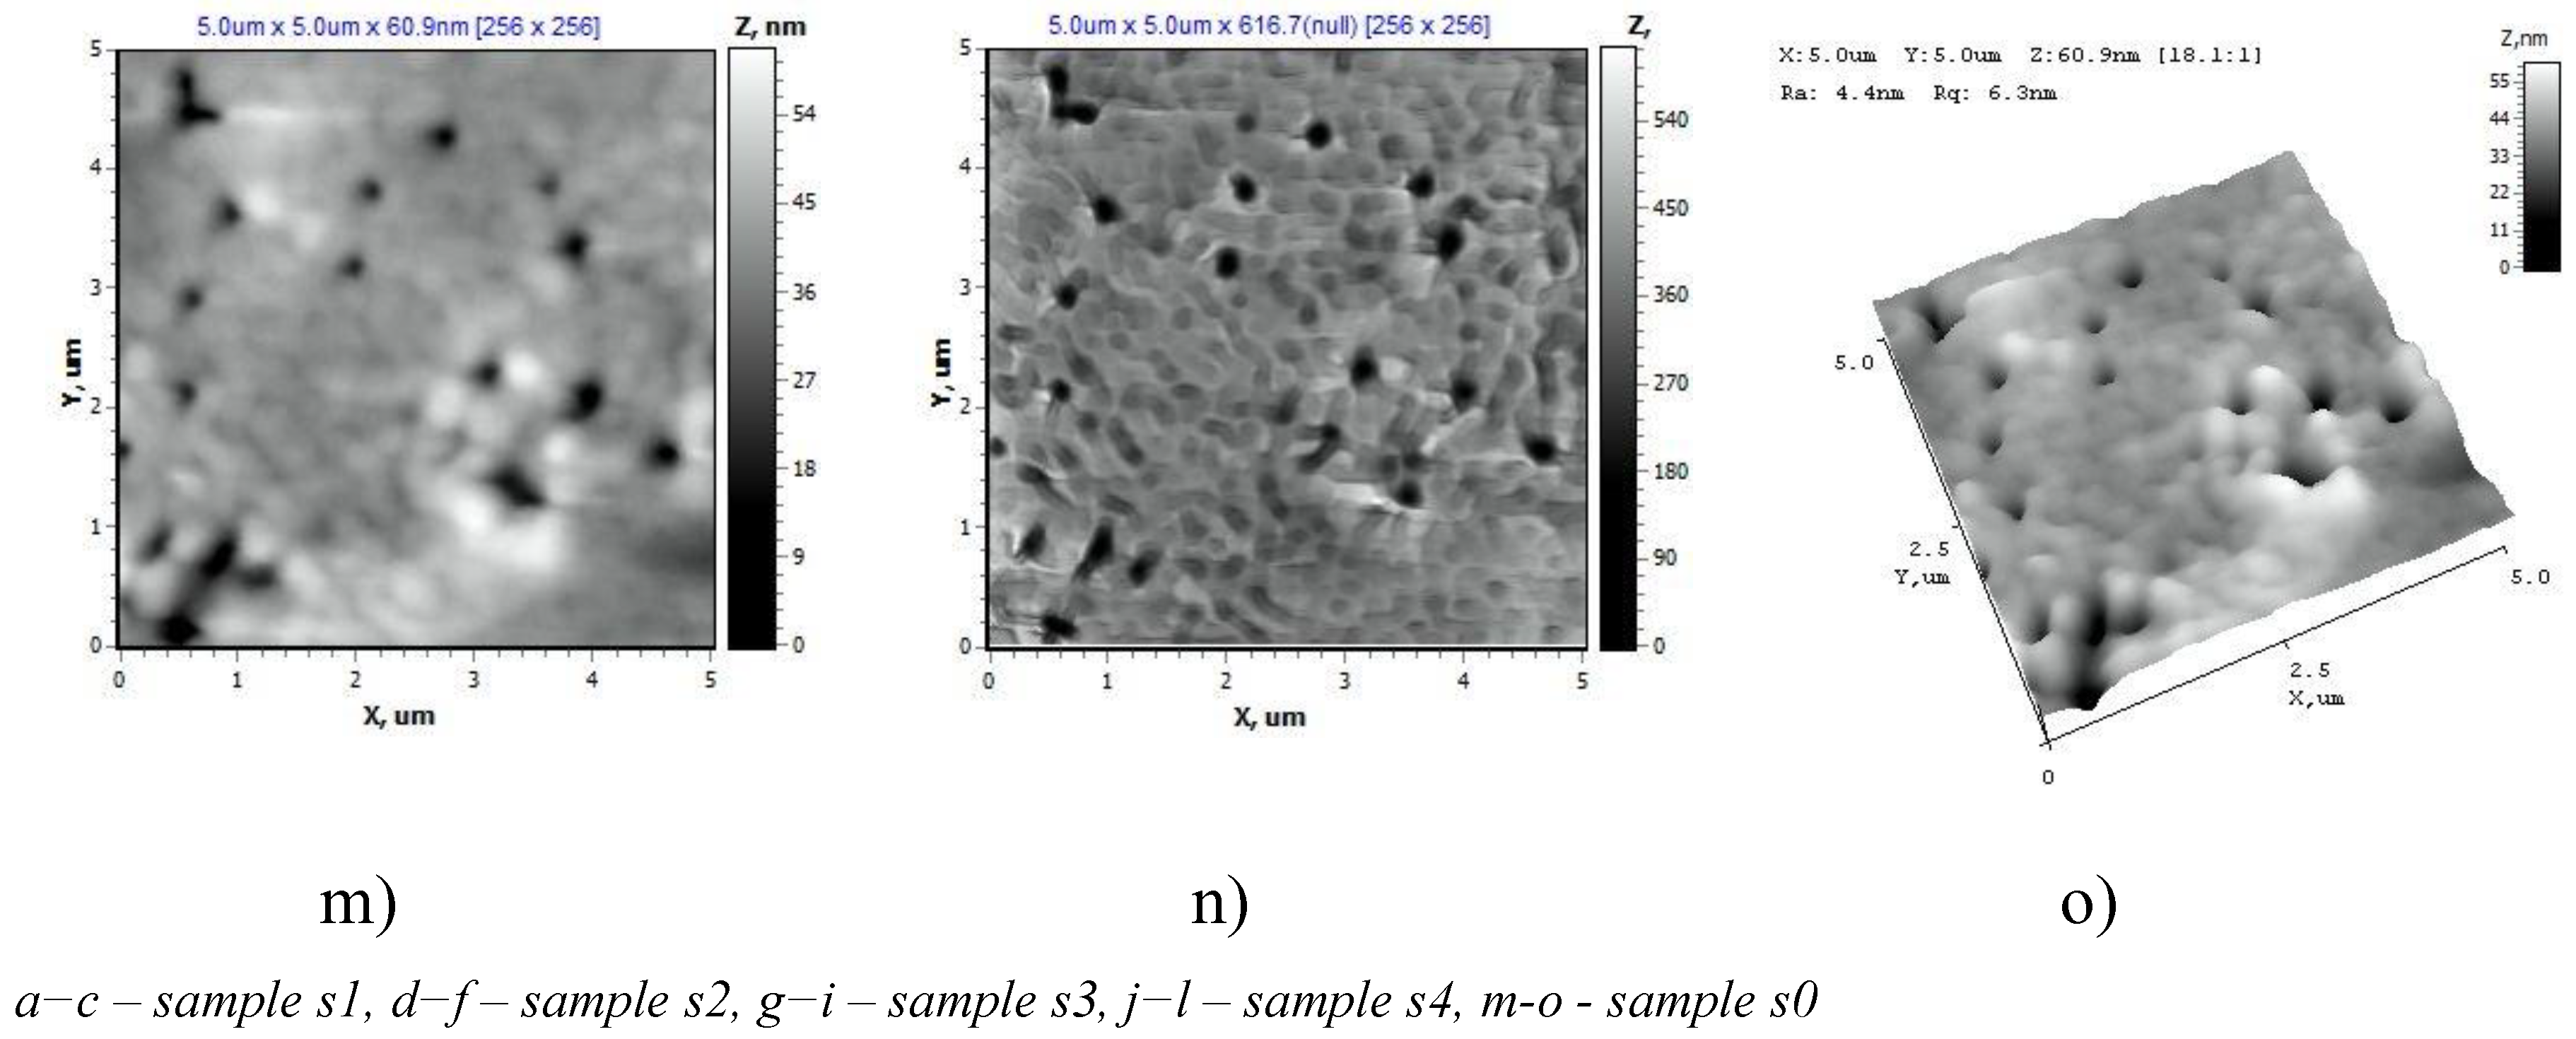
Figure 7.
Adsorption kinetics versus peak height of Eu3+, Gd3+, La3+, Ce3+ions (10-3M) deposition at -1.2 V for 60 s.
Figure 7.
Adsorption kinetics versus peak height of Eu3+, Gd3+, La3+, Ce3+ions (10-3M) deposition at -1.2 V for 60 s.
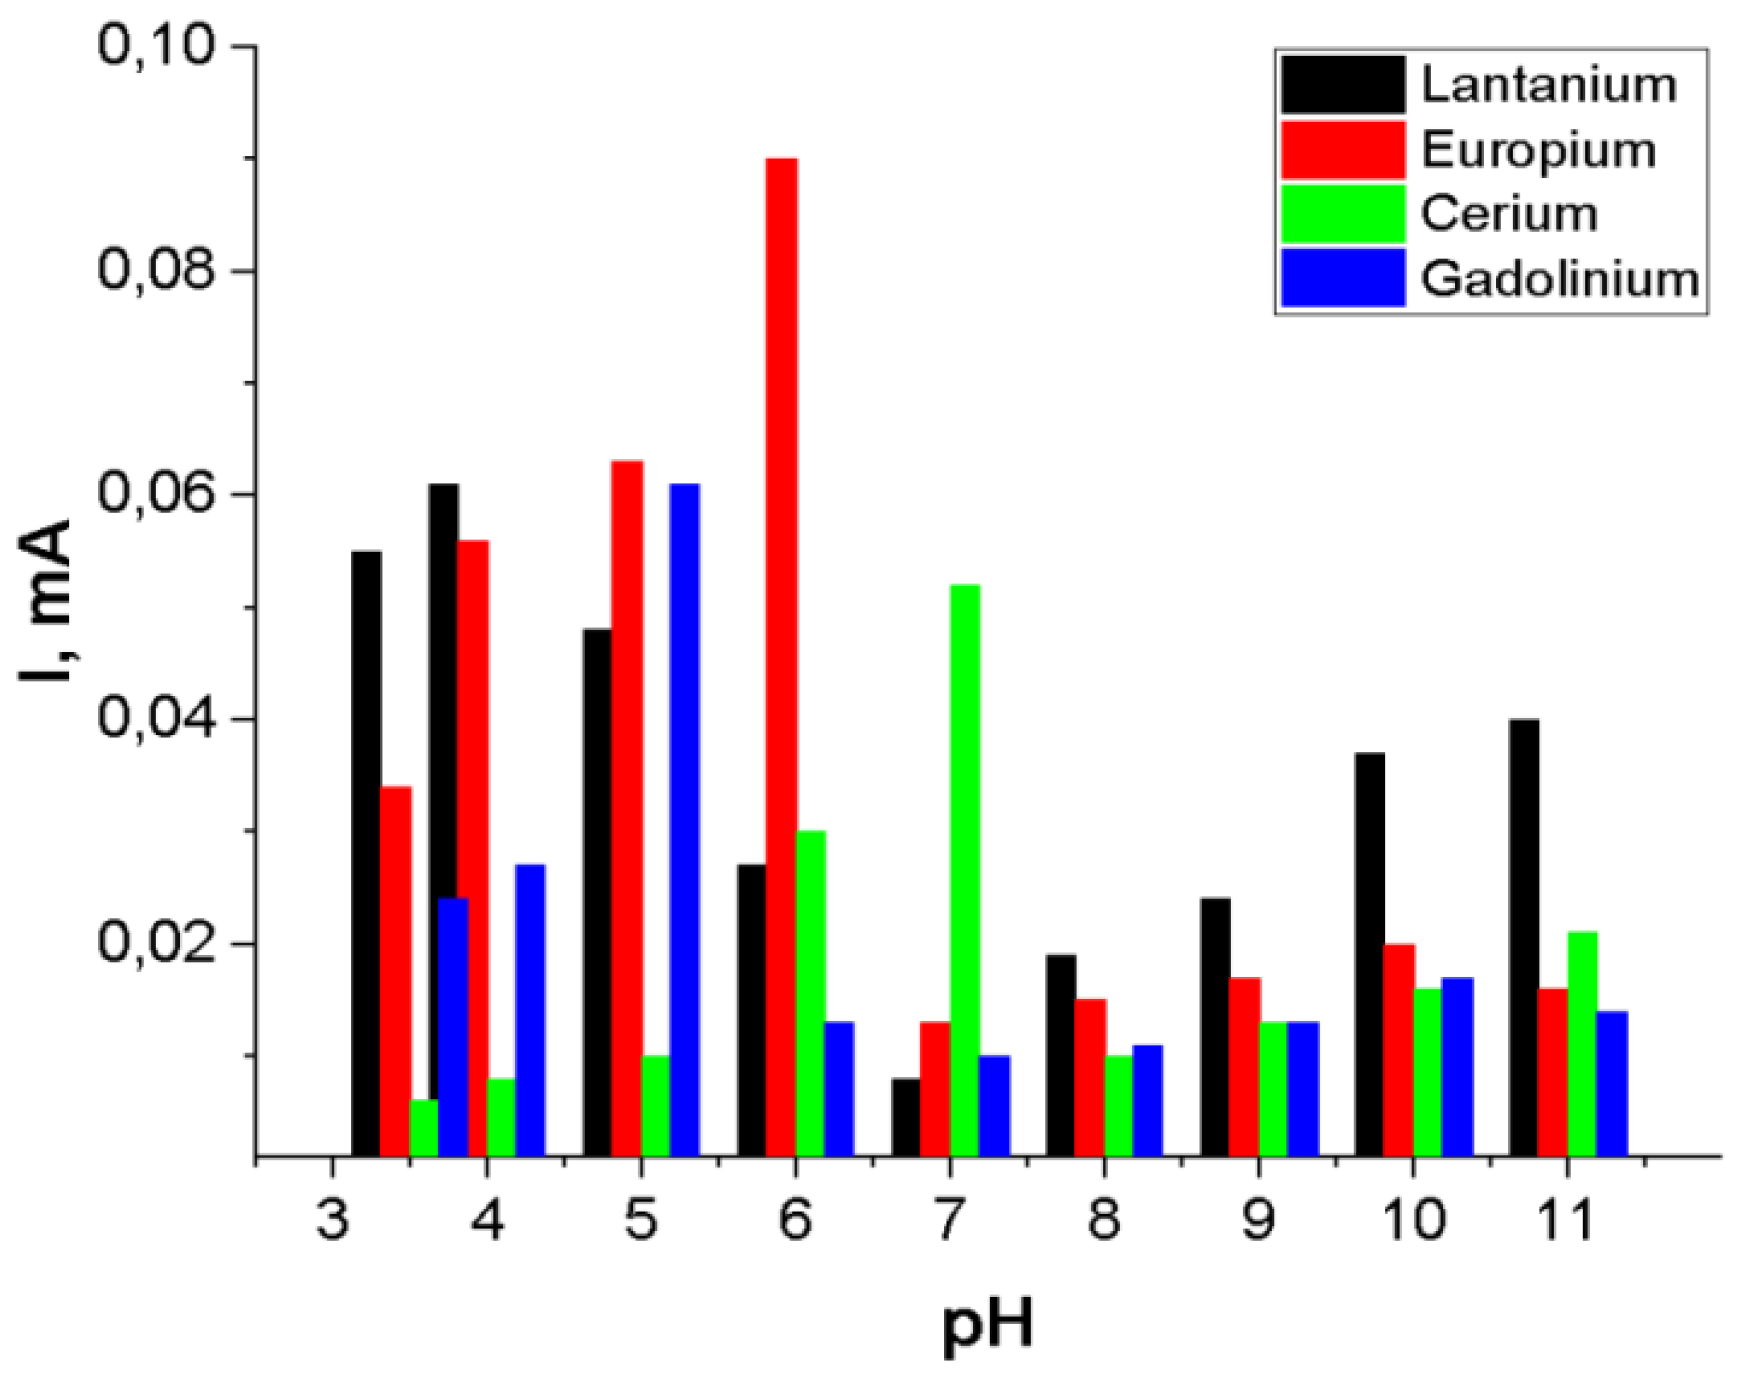
Figure 8.
Calibration curves of peak currents for Eu3+(a), Ce3+(b), Gd3+(c), La3+(d) concentration for the SW-ASV after 30 min of adsorption in appropriate Eu3+, Gd3+, La3+, Ce3+ solution in 0.1 M sodium acetate electrolyte.
Figure 8.
Calibration curves of peak currents for Eu3+(a), Ce3+(b), Gd3+(c), La3+(d) concentration for the SW-ASV after 30 min of adsorption in appropriate Eu3+, Gd3+, La3+, Ce3+ solution in 0.1 M sodium acetate electrolyte.
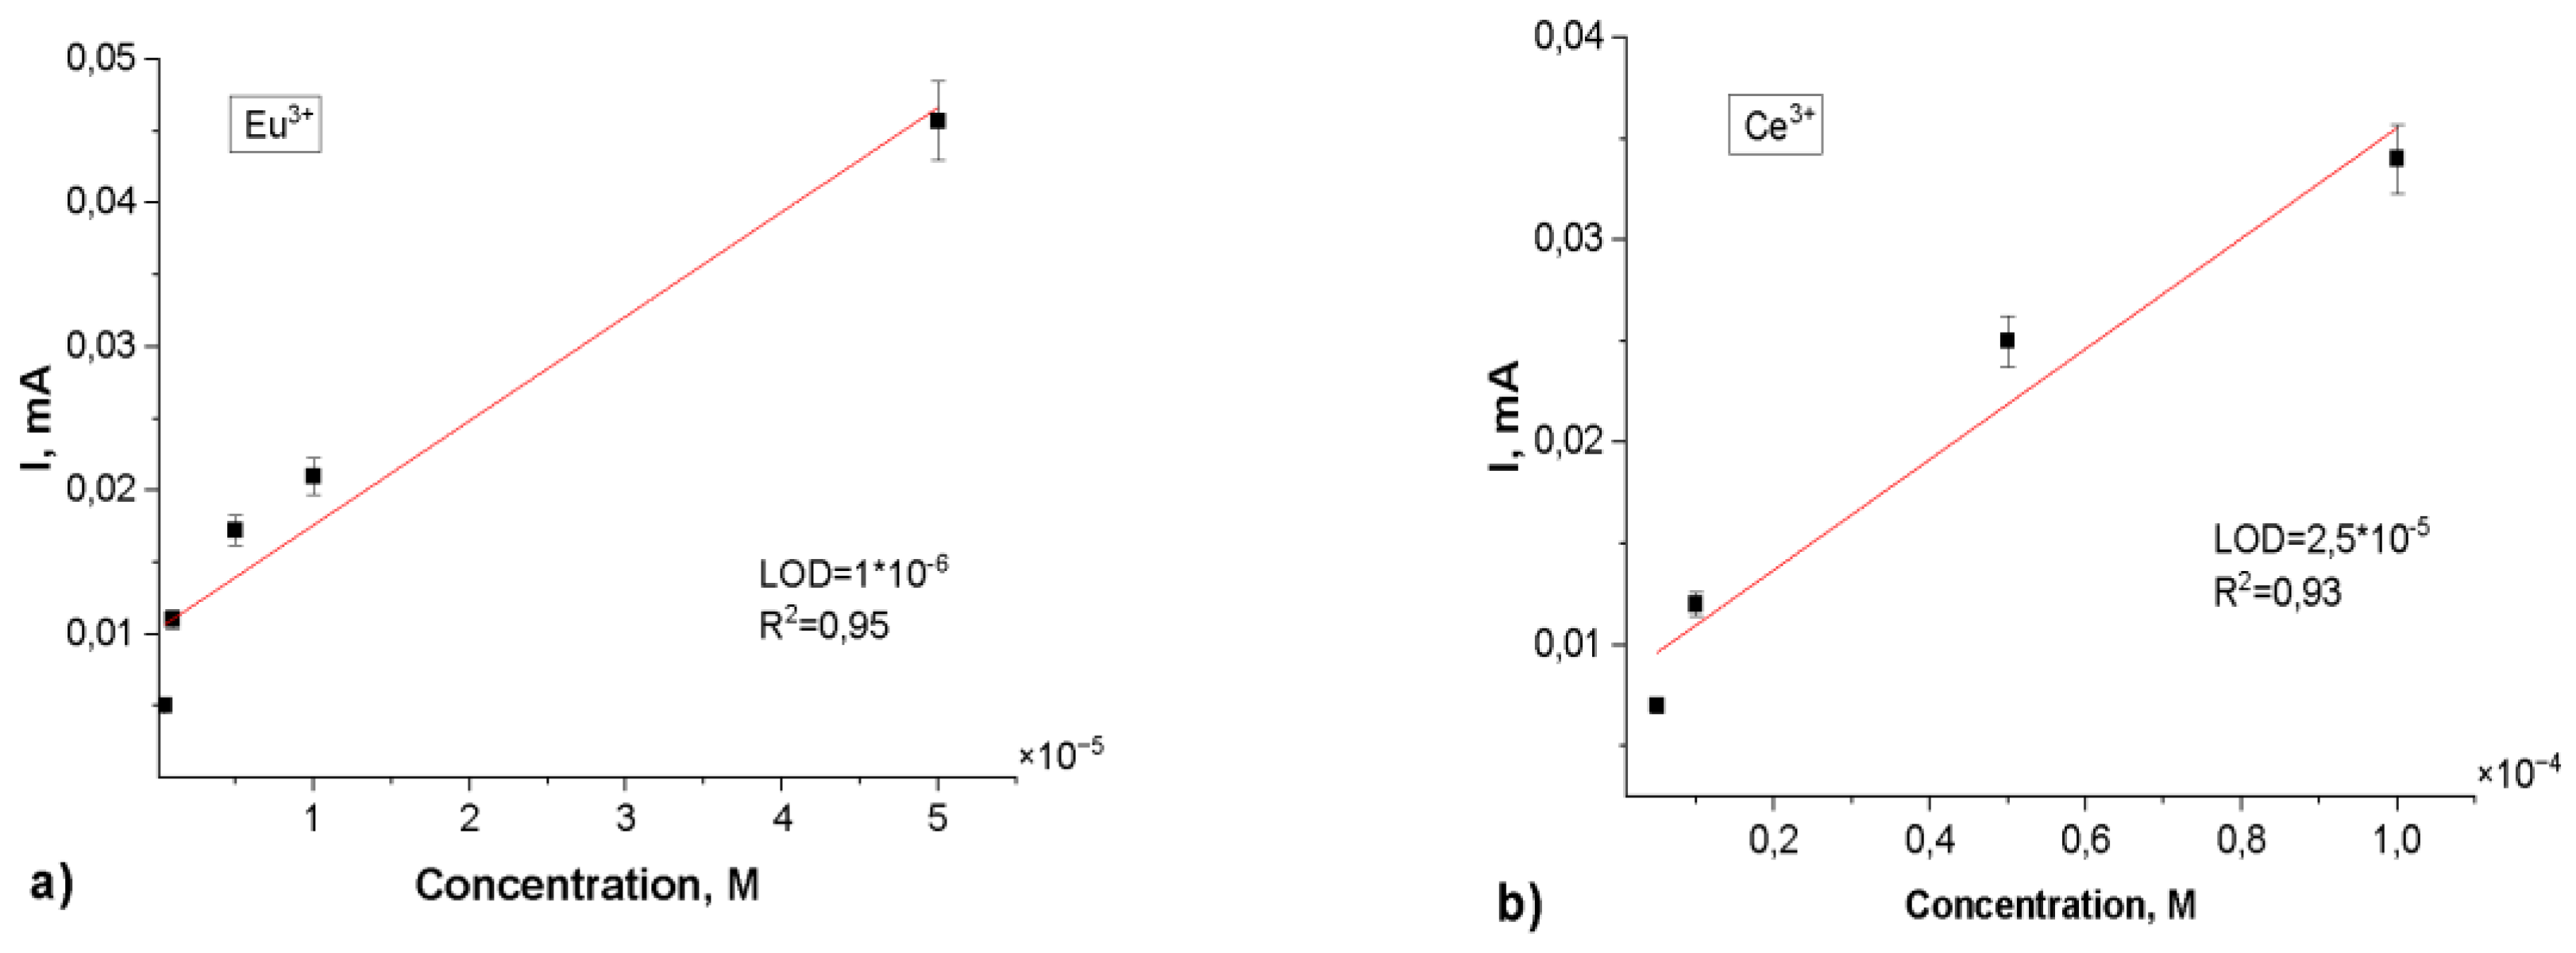
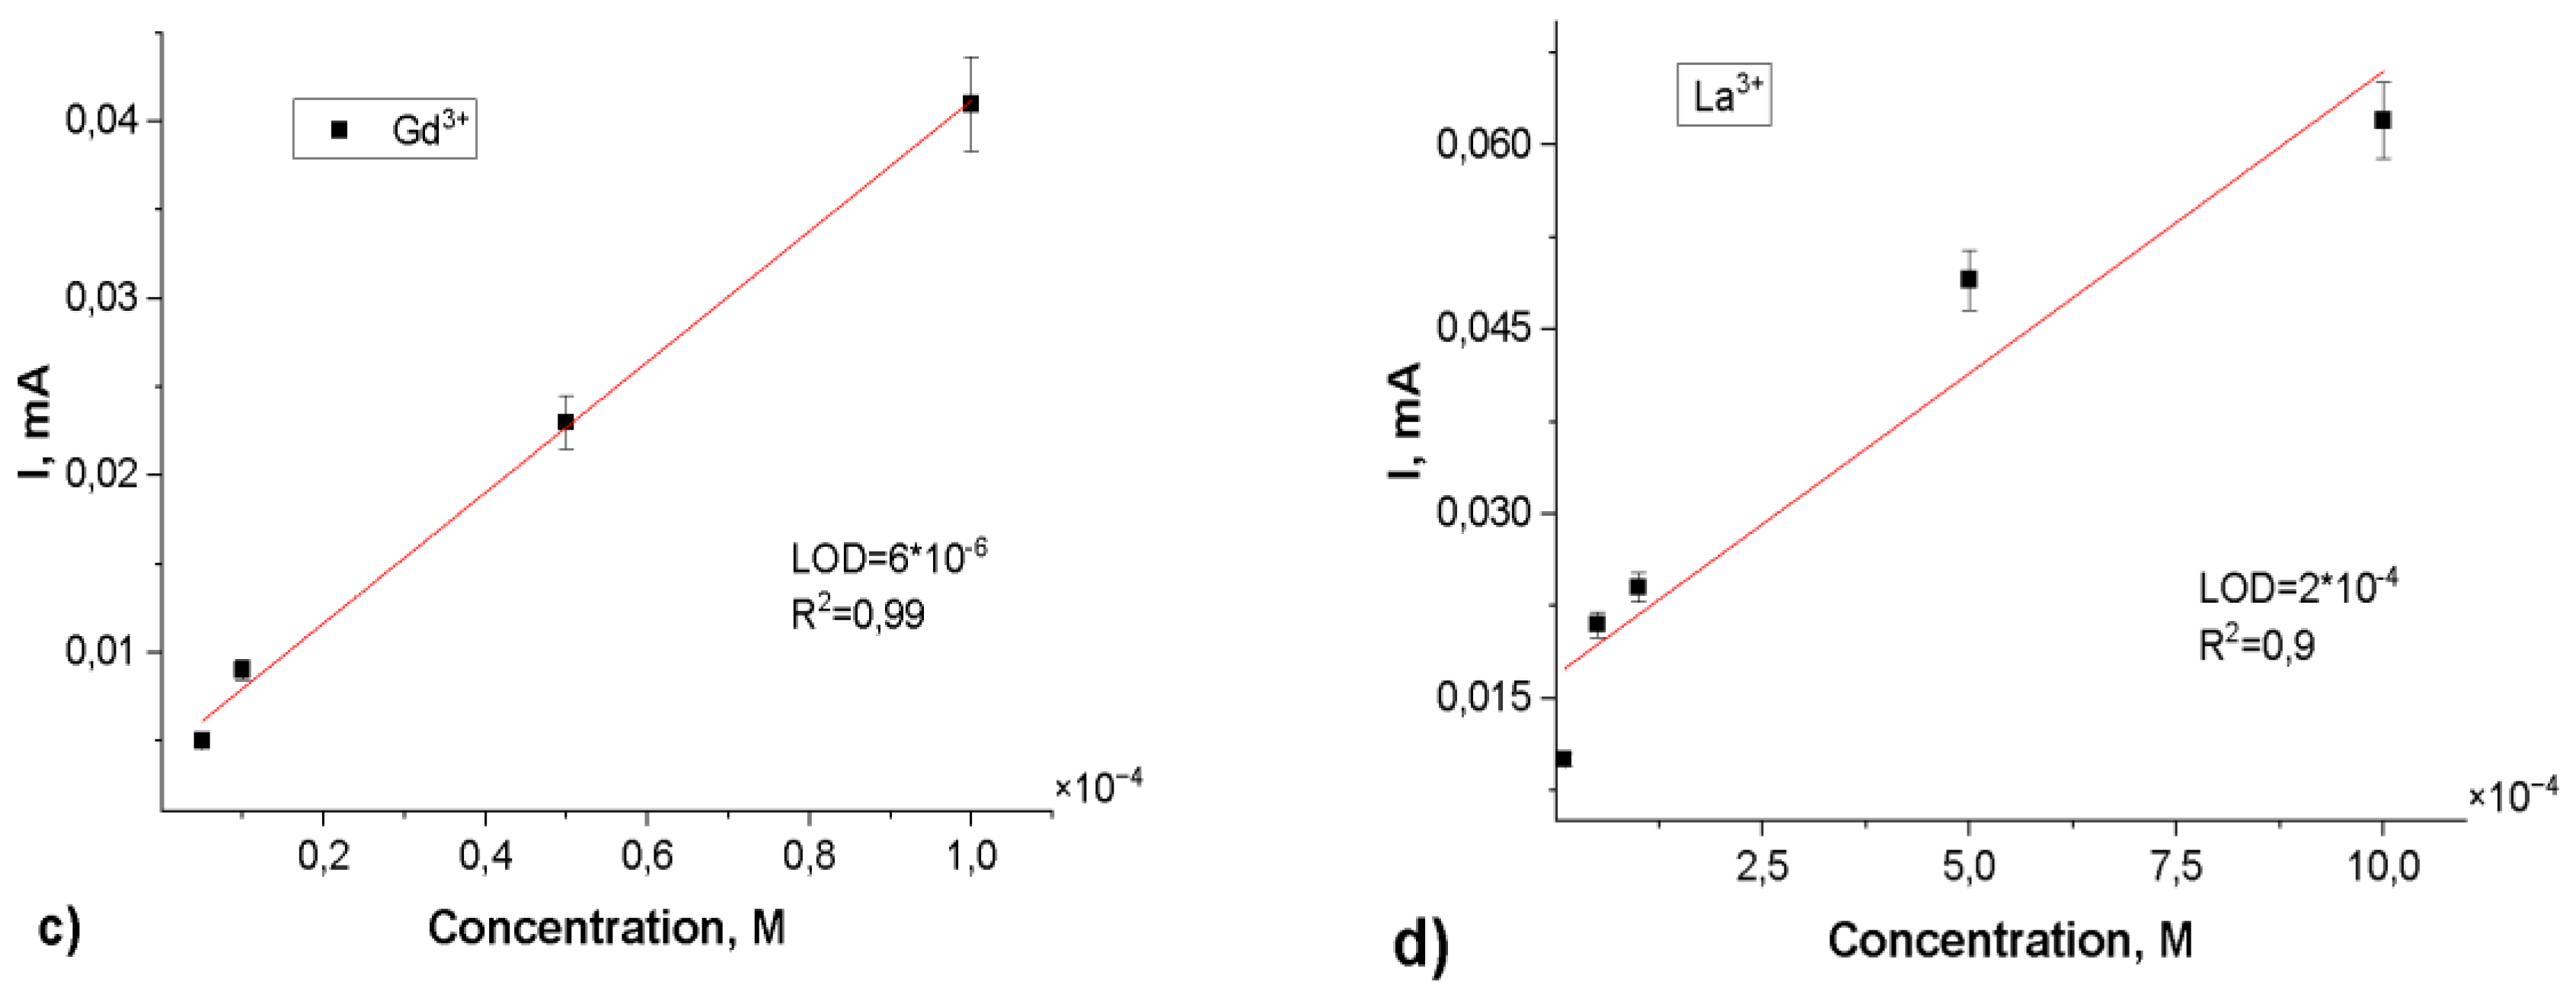
Table 1.
Impact of different modification parameters on grafting degree and PET TeMs pore sizes.
| № | Reaction time (t,min) | N-VFA Concentration (C,%) | TMPTMA Concentration (C,%) | Distance from UV lamp (L,cm) | Grafting degree (η,%) | Pore diameter after modification (D,nm) |
| s0 | 0 | - | - | - | 334±15 | |
| s1 | 60 | 2.5 | 5 | 10 | 2.64±0.10 | 317±12 |
| s2 | 60 | 5 | 5 | 10 | 8.5±0.32 | 250±8 |
| s3 | 60 | 10 | 5 | 10 | 12.93±0.34 | 198±13 |
| s4 | 60 | 15 | 5 | 10 | 12.54±0.57 | 210±17 |
| s5 | 60 | 20 | 5 | 10 | 11.06±1.01 | 215±6 |
| s6 | 15 | 10 | 5 | 10 | 1.06±0.35 | 330±9 |
| s7 | 30 | 10 | 5 | 10 | 3.68±0.34 | 314±11 |
| s8 | 45 | 10 | 5 | 10 | 8.69±0.28 | 261±17 |
| s9 | 60 | 10 | 5 | 10 | 12.93±0.34 | 198±13 |
| s10 | 90 | 10 | 5 | 10 | - | - |
| s11 | 60 | 10 | 5 | 7.5 | - | - |
| s12 | 60 | 10 | 5 | 10 | 12.93±0.34 | 198±13 |
| s13 | 60 | 10 | 5 | 12.5 | 1.1±0.2 | 310±9 |
| s14 | 60 | 10 | 5 | 15 | 0.9±0.10 | 324±14 |
| s15 | 60 | 10 | 5 | 20 | 0.28±0.10 | 331±11 |
Table 2.
Change in the CA and specific surface energy (γ) of PET TeMs samples after modification.
| Sample | θ°, water | γ, mJ/m² | γp, mJ/m² | γd, mJ/m² |
| s1 | 38.78±0.76 | 67.72±0.39 | 21.31±0.39 | 46.41±0.39 |
| s2 | 48.51±4.25 | 57.36±2.54 | 20.1±2.54 | 37.26±2.54 |
| s3 | 41.96±6.23 | 62.94±3.49 | 22.24±3.49 | 40.7±3.49 |
| s4 | 42.75±0.57 | 64.15±0.31 | 20.38±0.31 | 43.77±0.31 |
Disclaimer/Publisher’s Note: The statements, opinions and data contained in all publications are solely those of the individual author(s) and contributor(s) and not of MDPI and/or the editor(s). MDPI and/or the editor(s) disclaim responsibility for any injury to people or property resulting from any ideas, methods, instructions or products referred to in the content. |
© 2025 by the authors. Licensee MDPI, Basel, Switzerland. This article is an open access article distributed under the terms and conditions of the Creative Commons Attribution (CC BY) license (http://creativecommons.org/licenses/by/4.0/).
Copyright: This open access article is published under a Creative Commons CC BY 4.0 license, which permit the free download, distribution, and reuse, provided that the author and preprint are cited in any reuse.


