
Submitted:
21 June 2025
Posted:
23 June 2025
You are already at the latest version
Abstract
Abstract: With the development of urban scale and economic growth, the challenges posed by limited resources and insufficient environmental carrying capacity become increasingly severe, making the sustainable improvement of production efficiency an urgent requirement. Based on panel data for cities in the Dianzhong Urban Agglomeration and the Chengdu–Chongqing Economic Circle in Southwest China (2012–2021), this study elucidates the positive effect of urban compactness on green total factor productivity (GTFP). By constructing a composite index to measure urban compactness and employing a super-efficiency SBM model to quantify GTFP, we find that a 1% increase in urban compactness leads to a 0.65% increase in GTFP. A mediating-effect analysis reveals that green technological innovation serves as a significant mediator, with a mediating effect value of 0.363. Heterogeneity analysis uncovers differing mechanisms of influence: urban compactness exerts a positive effect in regions with higher levels of economic development, while its impact is not significant in regions with lower economic development, indicating that the effect of compactness varies with economic context. Threshold-effect analysis further shows that there is a threshold in the proportion of industrial output value, beyond which the influence of compactness on GTFP becomes even stronger. Our research quantitatively explores both linear and nonlinear relationships between urban compactness and GTFP, clarifying the linkage between urban spatial dynamics and green production efficiency, and provides empirical evidence and scholarly support for urban planning and economic development.
Keywords:
urban compactness
; green total factor productivity
; urban agglomerations
; fixed effects modeling
1. Introduction
1.1. Research Background
Since the 1970s, the global population has continued to expand and urban development has accelerated, making the challenges of limited resources and insufficient environmental carrying capacity increasingly severe. To address these challenges, promoting the sustainable development of production efficiency has become one of the feasible strategies. In 2008, the International Labour Organization (ILO) proposed the concept of “green economy and green jobs,” advocating sustainable economic growth, reduced resource consumption, lower carbon emissions, and the promotion of green industries (such as renewable energy and energy-saving technologies) to achieve a comprehensive enhancement of environmental, social, and economic benefits [1]. In 2011, the Organisation for Economic Co-operation and Development (OECD) introduced the “green growth” strategy, aiming for a win–win outcome between environmental protection and economic growth; other international organizations have also issued relevant guidance documents to improve global resource use efficiency and reduce greenhouse gas emissions, thereby promoting the development of green technologies and innovation [2,3,4].
In recent years, with the advancement of the Sustainable Development Goals (SDGs), academic research on Green Total Factor Productivity (GTFP) has been continually deepening. The resulting findings not only provide scientific support for the green economy and green growth strategies proposed by international organizations such as the ILO and the OECD, but also enhance the practical feasibility of these strategies through quantitative assessment and pathway optimization [5,6]. The introduction of the GTFP concept breaks through the limitations of traditional Total Factor Productivity (TFP), which focuses solely on inputs such as capital and labor and on economic growth, by incorporating resource consumption and pollutant emissions as undesirable outputs into the efficiency evaluation system, thus constructing a tripartite analytical framework of “economic growth – resource allocation efficiency improvement – environmental sustainability” [7,8].
Meanwhile, in the context of rapid global urbanization, the “compact city” has emerged as a new urban development model and has been widely adopted in city planning around the world, gradually becoming the direction of urbanization for many cities. A compact city emphasizes improving resource-use efficiency and reducing the disorderly exploitation of natural resources by increasing urban density, optimizing land use, enhancing infrastructure efficiency, and promoting public transportation [9,10]. It not only seeks to boost economic benefits but also aims to lower energy consumption and pollution, thereby fostering green and sustainable development. From a sustainability perspective, there is a close link between compact cities and GTFP: by raising land-use efficiency and improving the effectiveness of transportation and infrastructure to conserve urban resource consumption [11,12], urban compactness may exert a positive influence on GTFP.
Although the concept of compact cities is theoretically linked to enhancing GTFP, existing literature seldom directly examines their specific relationship. In particular, how compact-city strategies can drive improvements in green productivity—and the heterogeneous effects of compactness on GTFP across city clusters with different development conditions—remains underexplored.
In light of the current research gap, this study aims to delve into the mechanisms by which compact cities influence GTFP and to discuss the heterogeneity of this influence under varying levels of urban economic development. This not only offers further reference for future studies on the potential connection between urban compactness and GTFP but also provides policymakers with theoretical foundations and practical guidance for adjusting urban development plans to promote green productivity.
1.2. Literature Review
1.2.1. Green Total Factor Productivity Studies
Green Total Factor Productivity (GTFP) measures improvements in the efficiency of a production system—between inputs and outputs—while accounting for environmental factors. Unlike traditional Total Factor Productivity (TFP), GTFP incorporates environmental resource constraints and externalities; it therefore not only focuses on increases in economic output but also emphasizes achieving green growth, that is, reducing negative environmental impacts while maintaining or enhancing economic output [13]. In summary, the concept of GTFP is grounded in sustainable development theory—particularly the coordinated development of the economy, society, and environment—with a central concern for optimizing production processes and promoting green innovation in the context of limited resources and increasing environmental pressures [13,14].
The methods for measuring GTFP are similar to those used for traditional productivity measurement but incorporate environmental factors. Common approaches include Data Envelopment Analysis (DEA) and the Slack-Based Measure (SBM) model. Building on these, extensions to the traditional Malmquist index decompose environmental factors into technical progress and changes in technical efficiency, enabling a more scientific and objective estimation of overall GTFP levels [15,16].
Current Research Progress
In recent years, research on GTFP has deepened, with three main directions emerging: technological innovation, regional heterogeneity of policy impacts, and economic and financial factors.
With respect to the impact of technological innovation on GTFP, case studies in China’s manufacturing sector have demonstrated that innovations such as intelligent production and the application of green technologies enhance GTFP, and that servitization transformations promote green growth by optimizing resource allocation and improving technical efficiency [17].
The role of government policy in boosting green productivity is another research hotspot, especially concerning the heterogeneity of policy effects on GTFP. Jing et al. found that the carbon emissions trading pilot policy significantly increased GTFP, with this effect varying by development stage and region [18]. Similarly, Liu et al. showed through heterogeneity analysis that metal-mineral extraction exerts the strongest suppressive effect on GTFP in Latin American regions, highlighting the special policy needs of resource-dependent areas [19]. In comparison, Mao et al. focused more on the mechanisms by which urban agglomeration policies affect GTFP, noting that city clusters in eastern China exhibit stronger green-development competitiveness due to policy support and technology spillovers—a finding that underscores the importance of regional policy coordination for city-cluster integration [20].
In the economic and financial realm, current research particularly focuses on the interconnected effects of green finance, the digital economy, and GTFP. Zhang et al., using data from 30 Chinese provinces, confirmed that the development of green finance promotes green technological change, which in turn significantly increases GTFP, and revealed that this mechanism exhibits regional heterogeneity: in underdeveloped areas such as Western China, the effect is not significant due to inadequate financial development, whereas in relatively advanced regions the effect is more pronounced [21]. This heterogeneous effect has been further corroborated in similar studies [22]. In research on the digital economy’s impact on GTFP, most studies agree that digital-economy development helps optimize industrial structure and thereby improves GTFP; as in other fields of GTFP research, these studies also discuss the regional heterogeneity of the underlying mechanisms in considerable depth [23,24].
Based on the above analysis, recent GTFP research has mainly concentrated on the relationships among technological innovation, the regional heterogeneity of policy impacts, and economic and financial factors. However, current GTFP research has paid relatively little attention to its integration with urban spatial characteristics, and the influence of urban form on GTFP remains insufficiently explored.
1.2.2. Urban Compactness Research
Since the concept of the “compact city” was first introduced in 1973, extensive studies have been conducted in various countries and regions. Through the analyses and developments of scholars such as Jenks and Burton, the prevailing academic view now defines a compact city as an urban form characterized by high density and mixed land-use functions, diversity, efficient transportation with a pedestrian orientation, and socio-economic heterogeneity [9,25].
Recent research on compact cities has concentrated on economic benefits, environmental efficiency, and production efficiency. Studies indicate that high-density urban areas can improve land and infrastructure utilization efficiency and reduce per-unit-area costs, thereby driving economic growth and regional competitiveness. They also reveal that compactness and urban efficiency exhibit asynchrony and regional differentiation, underscoring the need for large cities to optimize functional deconcentration to enhance overall efficiency [26]. Yao et al. decomposed urban efficiency into economic efficiency and technical efficiency and found heterogeneous effects of compactness across city sizes: higher population density and a compact urban form benefit the economic efficiency of large cities but impair the technical efficiency of small cities, while road density in compact cities supports the efficiency of medium-sized and small cities but hinders the technical efficiency of large cities [27]. Research on the impact of urban compactness on environmental efficiency has further narrowed its focus to city clusters, confirming that compact development reduces carbon emissions per unit of GDP through economic agglomeration, although this effect must be reinforced by an industrial green transition [28].
In summary, although a substantial body of work has examined the relationship between urban compactness and production efficiency, most studies have centered on compactness in relation to economic efficiency or production efficiency, and relatively few have explored how urban density affects production efficiency within a sustainability framework.
1.2.3. Integration of Two Fields
In summary, although direct studies on the mechanism by which urban compactness affects GTFP are still rare, research on factors common to both fields has gradually become an interdisciplinary area. Some scholars have explored the relationship between urban compactness and Total Factor Productivity (TFP); since GTFP is a derived concept based on TFP that incorporates environmental benefits, findings from TFP-related studies offer theoretical insights for further uncovering the mechanisms through which urban compactness influences GTFP. In some studies, the indicators used to assess the impact of urban compactness on economic and environmental benefits are closely related to urban GTFP, indirectly providing a theoretical basis for examining the relationship between compactness and GTFP. Thus, although the specific linkage or mechanism between compact cities and GTFP has yet to be fully discussed, existing research on the effects of urban compactness on TFP, economic benefits, and environmental benefits provides a foundation for further work in this area.
1.3. Research Questions and Contributions
1.3.1. Core Research Questions
This study aims to clarify the mechanisms by which urban compactness—and its characteristics such as economic density, population density, land-use efficiency, and transport efficiency—directly or indirectly affect Green Total Factor Productivity (GTFP). Specifically, we focus on how high-density urban forms impact city-level GTFP and whether they can promote GTFP improvements by enhancing resource-use efficiency, driving green technological innovation, and improving public services. Additionally, we will examine potential heterogeneous factors and threshold effects in the compactness–GTFP relationship to reveal differentiated influences under varying conditions.
1.3.2. Research Contributions
While the existing literature includes numerous studies on the correlation or mechanisms by which urban compactness affects productivity and green technologies, the specific mechanisms through which compactness influences GTFP, as well as any heterogeneous factors, have not been fully explored. This study seeks to address this gap by providing a systematic analysis of the relationship between urban compactness and GTFP. Most prior research on compactness and productivity has been descriptive and has lacked an in-depth exploration of underlying mechanisms. Our work not only analyzes how compactness affects GTFP but also investigates mediating mechanisms—such as whether compactness influences GTFP through factors like technological innovation and industrial agglomeration. Finally, we will link our findings to the global Sustainable Development Goals (SDGs), thereby making a theoretical contribution to the advancement of worldwide green-growth objectives.
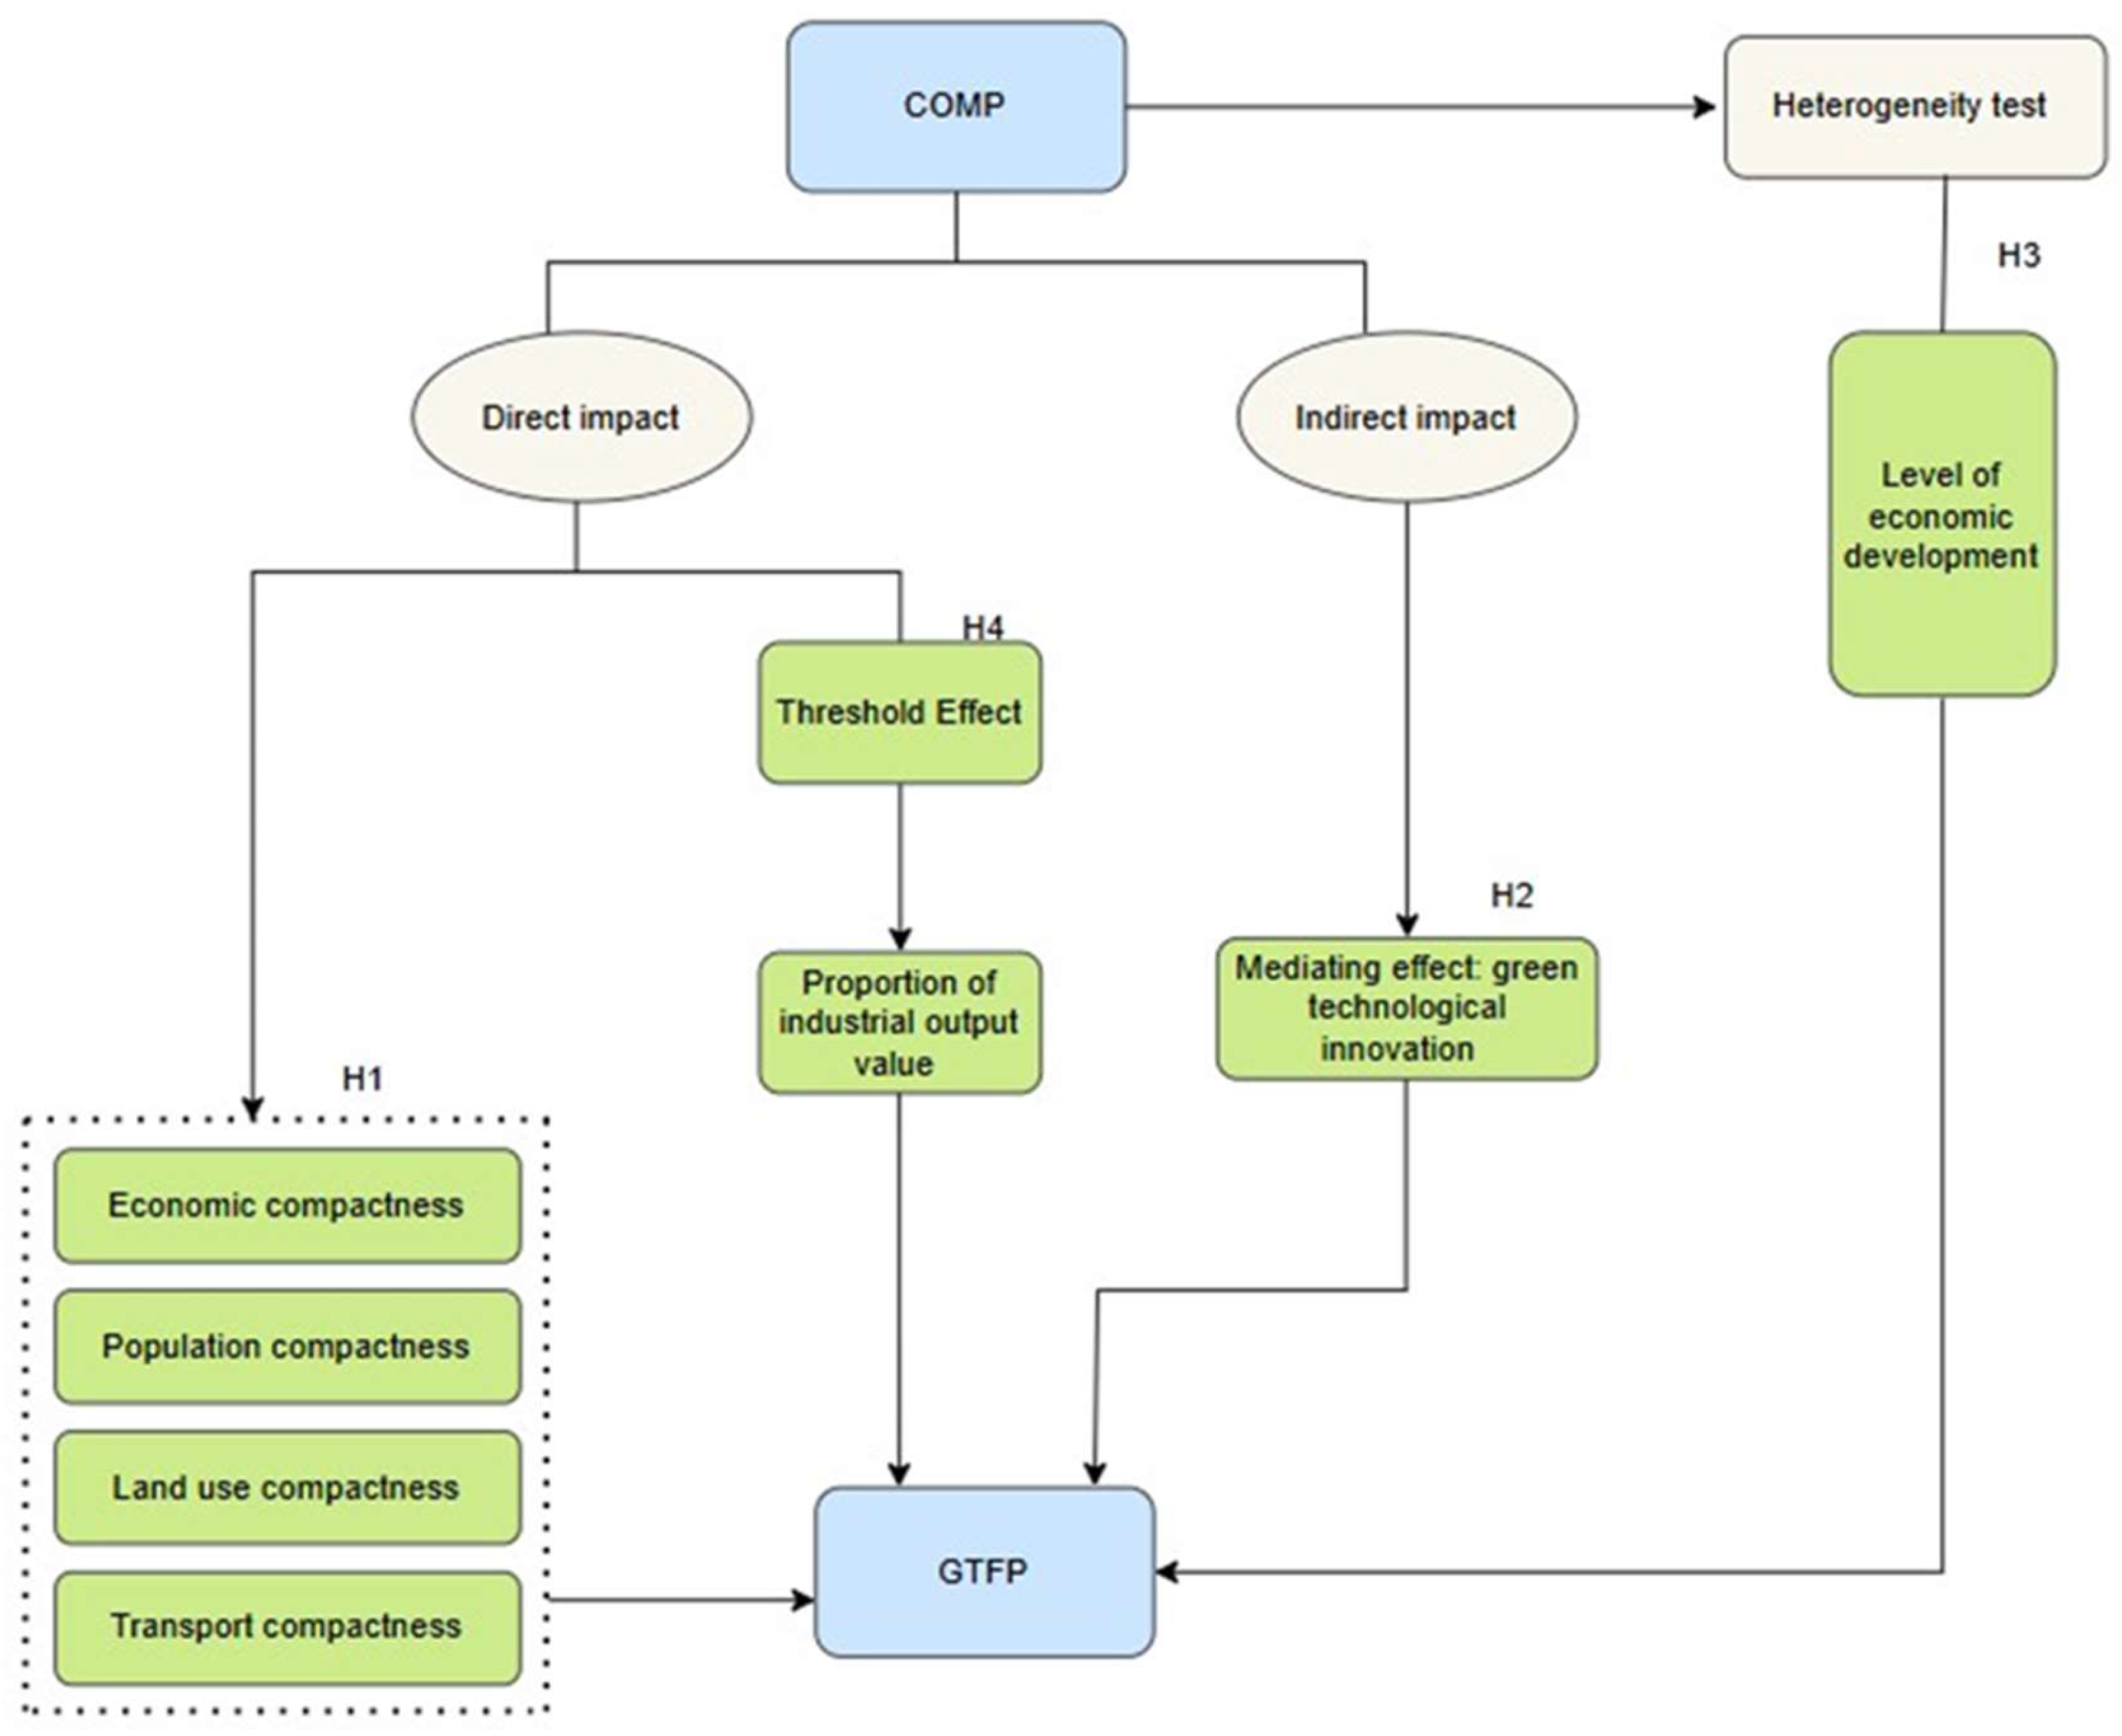
2. Theoretical Hypotheses
2.1. Impact of Urban Compactness on GTFP
A compact city is characterized by high density, mixed and diverse land-use functions, efficient and pedestrian-friendly transportation, and socio-economic diversity. It influences GTFP primarily through four dimensions: economic activity, population, land use, and transportation.
First, economic activities in compact cities are highly concentrated, creating economic agglomeration. Such agglomeration accelerates the concentration of firms and labor in the central city, reducing information asymmetry within the urban economy and thereby facilitating faster matching of production factors and improving productivity [27]. Moreover, large-scale agglomeration can generate economies of scale through shared production equipment and facilities, further enhancing the efficiency of resource allocation [19]. Economic agglomeration not only concentrates firms and people but also leads to more compact and diverse land use, increasing land-use efficiency and average land output value, which boosts economic performance and in turn raises GTFP [29]. Additionally, higher-density cities tend to cluster industrial and commercial activities within the urban core, enabling more centralized energy supply, improving energy-use efficiency, and thus enhancing urban GTFP.
Second, compact cities generate scale effects in the urban core through the concentration of talent, capital, and resources. The aggregation of skilled labor and financial capital fosters knowledge spillovers that drive technological innovation and optimize urban industrial structure \[30]. For example, the clustering of manufacturing can accelerate green technological progress and improve green economic efficiency, thereby enhancing pollution control technologies, reducing the environmental impact of industrial emissions, and increasing GTFP. However, if labor, capital, and other factors become overly concentrated without adequate management, they may exceed the city’s environmental carrying capacity and adversely affect urban sustainability [19].
Third, compact urban spaces feature higher accessibility and spatial proximity, providing cities with dense road networks that improve connectivity between functional zones and enhance transport efficiency. From another perspective, pedestrian-friendly, dense street layouts help reduce private car usage, yielding environmental benefits and boosting GTFP.
From the above analysis, compact cities improve infrastructure and energy-use efficiency through the agglomeration of economic activities, talent, capital, resources, and through compact spatial and road networks; they promote the optimization of urban industrial structure and foster green technological innovation; and they enhance land-use efficiency. However, beyond a certain threshold, such concentration may negatively impact urban ecology and energy conservation and emission reduction. Hence, we propose Hypothesis 1: Within a certain range, increases in urban compactness have a positive effect on GTFP.
2.2. Mediating-Effect Analysis
2.2.1. The Driving Effect of Urban Compactness on Green Technological Innovation
By increasing land-use density and adopting an intensive spatial layout, enhanced urban compactness raises land costs and intensifies resource competition, thereby forcing traditional, low-value-added, high-energy-consumption industries (e.g., conventional manufacturing) to transform. At the same time, it attracts knowledge-intensive, technology-intensive, and service-oriented industries to cluster, promoting an upgrade of the industrial structure toward higher-end and lower-carbon activities.
Moreover, greater compactness shortens the physical distance between firms, facilitating the frequent flow of talent, technology, and information. This fosters the formation of innovation networks and industrial clusters, accelerates technology diffusion and industrial synergies, and lays a technological foundation for the development of high-tech, energy-saving, and emission-reduction industries as well as modern service sectors.
In addition, through the adoption of specific policies, increased urban compactness promotes more efficient land use and facilitates centralized investment in green infrastructure. Policy measures and market mechanisms—such as imposing carbon taxes and establishing industry-entry standards to phase out outdated capacity—can guide capital toward green industries [31].
2.2.2. Pathways by Which Green Technological Innovation Enhances GTFP
High-end industries have a strong demand for green technology upgrades, typically featuring higher energy-use efficiency and lower pollution-emission intensity. Their technology spillover effects can stimulate green innovation across the entire economic system and optimize the allocation of production factors [32]. Moreover, the service and knowledge sectors rely less on natural resources and more on human capital and digital technologies; this shift in factor structure directly lowers the environmental cost per unit of output, thereby promoting GTFP growth.
On the other hand, industrial upgrading is generally accompanied by both vertical integration and horizontal collaboration within the value chain. Through resource sharing and waste recycling models, industries can achieve emission reductions and resource regeneration at scale, and further enhance production efficiency via shared technologies and supporting infrastructure [33].
2.2.3. The Mediating Role of Green Technological Innovation between Urban Compactness and GTFP
As a mediating variable, green technological innovation links compact cities and GTFP primarily through two mechanisms: structural emission reduction and the innovation multiplier effect.
Structural Emission Reduction
An increased share of high-value-added industries helps lower energy consumption and carbon-emission intensity per unit of GDP. Thus, optimizing the industrial structure via green technology upgrades is more conducive to energy conservation and emission reduction, easing environmental pressures and enhancing urban GTFP.
Innovation Multiplier Effect
In compact cities, knowledge-intensive industries (such as digital services and clean-energy technologies) tend to be relatively concentrated. Green innovations emerging in these sectors not only boost efficiency within their own industries but also, through scale effects and technology diffusion, benefit traditional industries and drive green technological progress across the entire region.
Accordingly, Hypothesis 2 is proposed: Green technological innovation serves as a mediating variable in the impact of urban compactness on GTFP.
2.3. Heterogeneity in the Impact of Urban Compactness on GTFP
Cities with higher and lower levels of economic development exhibit different effects of compactness on GTFP, which may stem from variations in resource allocation efficiency, industrial base, and innovation-absorption capacity. In economically advanced cities, more developed transport infrastructure and a higher-level industrial structure reduce commuting costs through increased transport efficiency, helping to curb greenhouse gas emissions. Under such advanced industrial structures, greater urban compactness facilitates industrial agglomeration, promotes the diffusion and absorption of green technologies, and enhances resource allocation efficiency, so that the net effect of compactness on GTFP tends to be positive. In contrast, in cities with lower levels of economic development, infrastructure is often underdeveloped and pillar industries remain in the secondary sector transition phase, weakening their capacity to adopt green technologies and industries. Moreover, these cities typically face weaker fiscal positions, with limited revenues directed toward basic infrastructure and public services, leaving little room to support emerging green industries and even risking a crowding-out effect. Therefore, we expect urban compactness to have a negative impact on GTFP in lower-development contexts.
Accordingly, Hypothesis 3 is proposed: The impact of urban compactness on GTFP exhibits heterogeneity across different levels of economic development.
2.4. Threshold Effect
The impact of urban compactness on GTFP may be nonlinear, reflecting differing stages of industrial development across cities. In the early stage of industrialization—when the industrial structure is dominated by inefficient, high-energy-consumption, and heavily polluting traditional industries—a compact urban form may exacerbate pollution, thereby weakening any positive effect on GTFP. Cities with a low share of industrial output also lack incentives for technological upgrading, and a compact layout may instead reinforce firms’ dependence on low-cost land and labor, potentially suppressing green innovation. Once industrial development reaches a certain level, with complete supporting facilities and reserves of capital and technology, green technological upgrading becomes more feasible. In such compact urban spaces, industrial agglomeration and scale effects are more pronounced, and green technology upgrades easily produce diffusion effects that more significantly boost GTFP. Based on these inferences, we propose Hypothesis 4: The effect of urban compactness on GTFP exhibits a threshold effect with respect to the share of industrial output value.
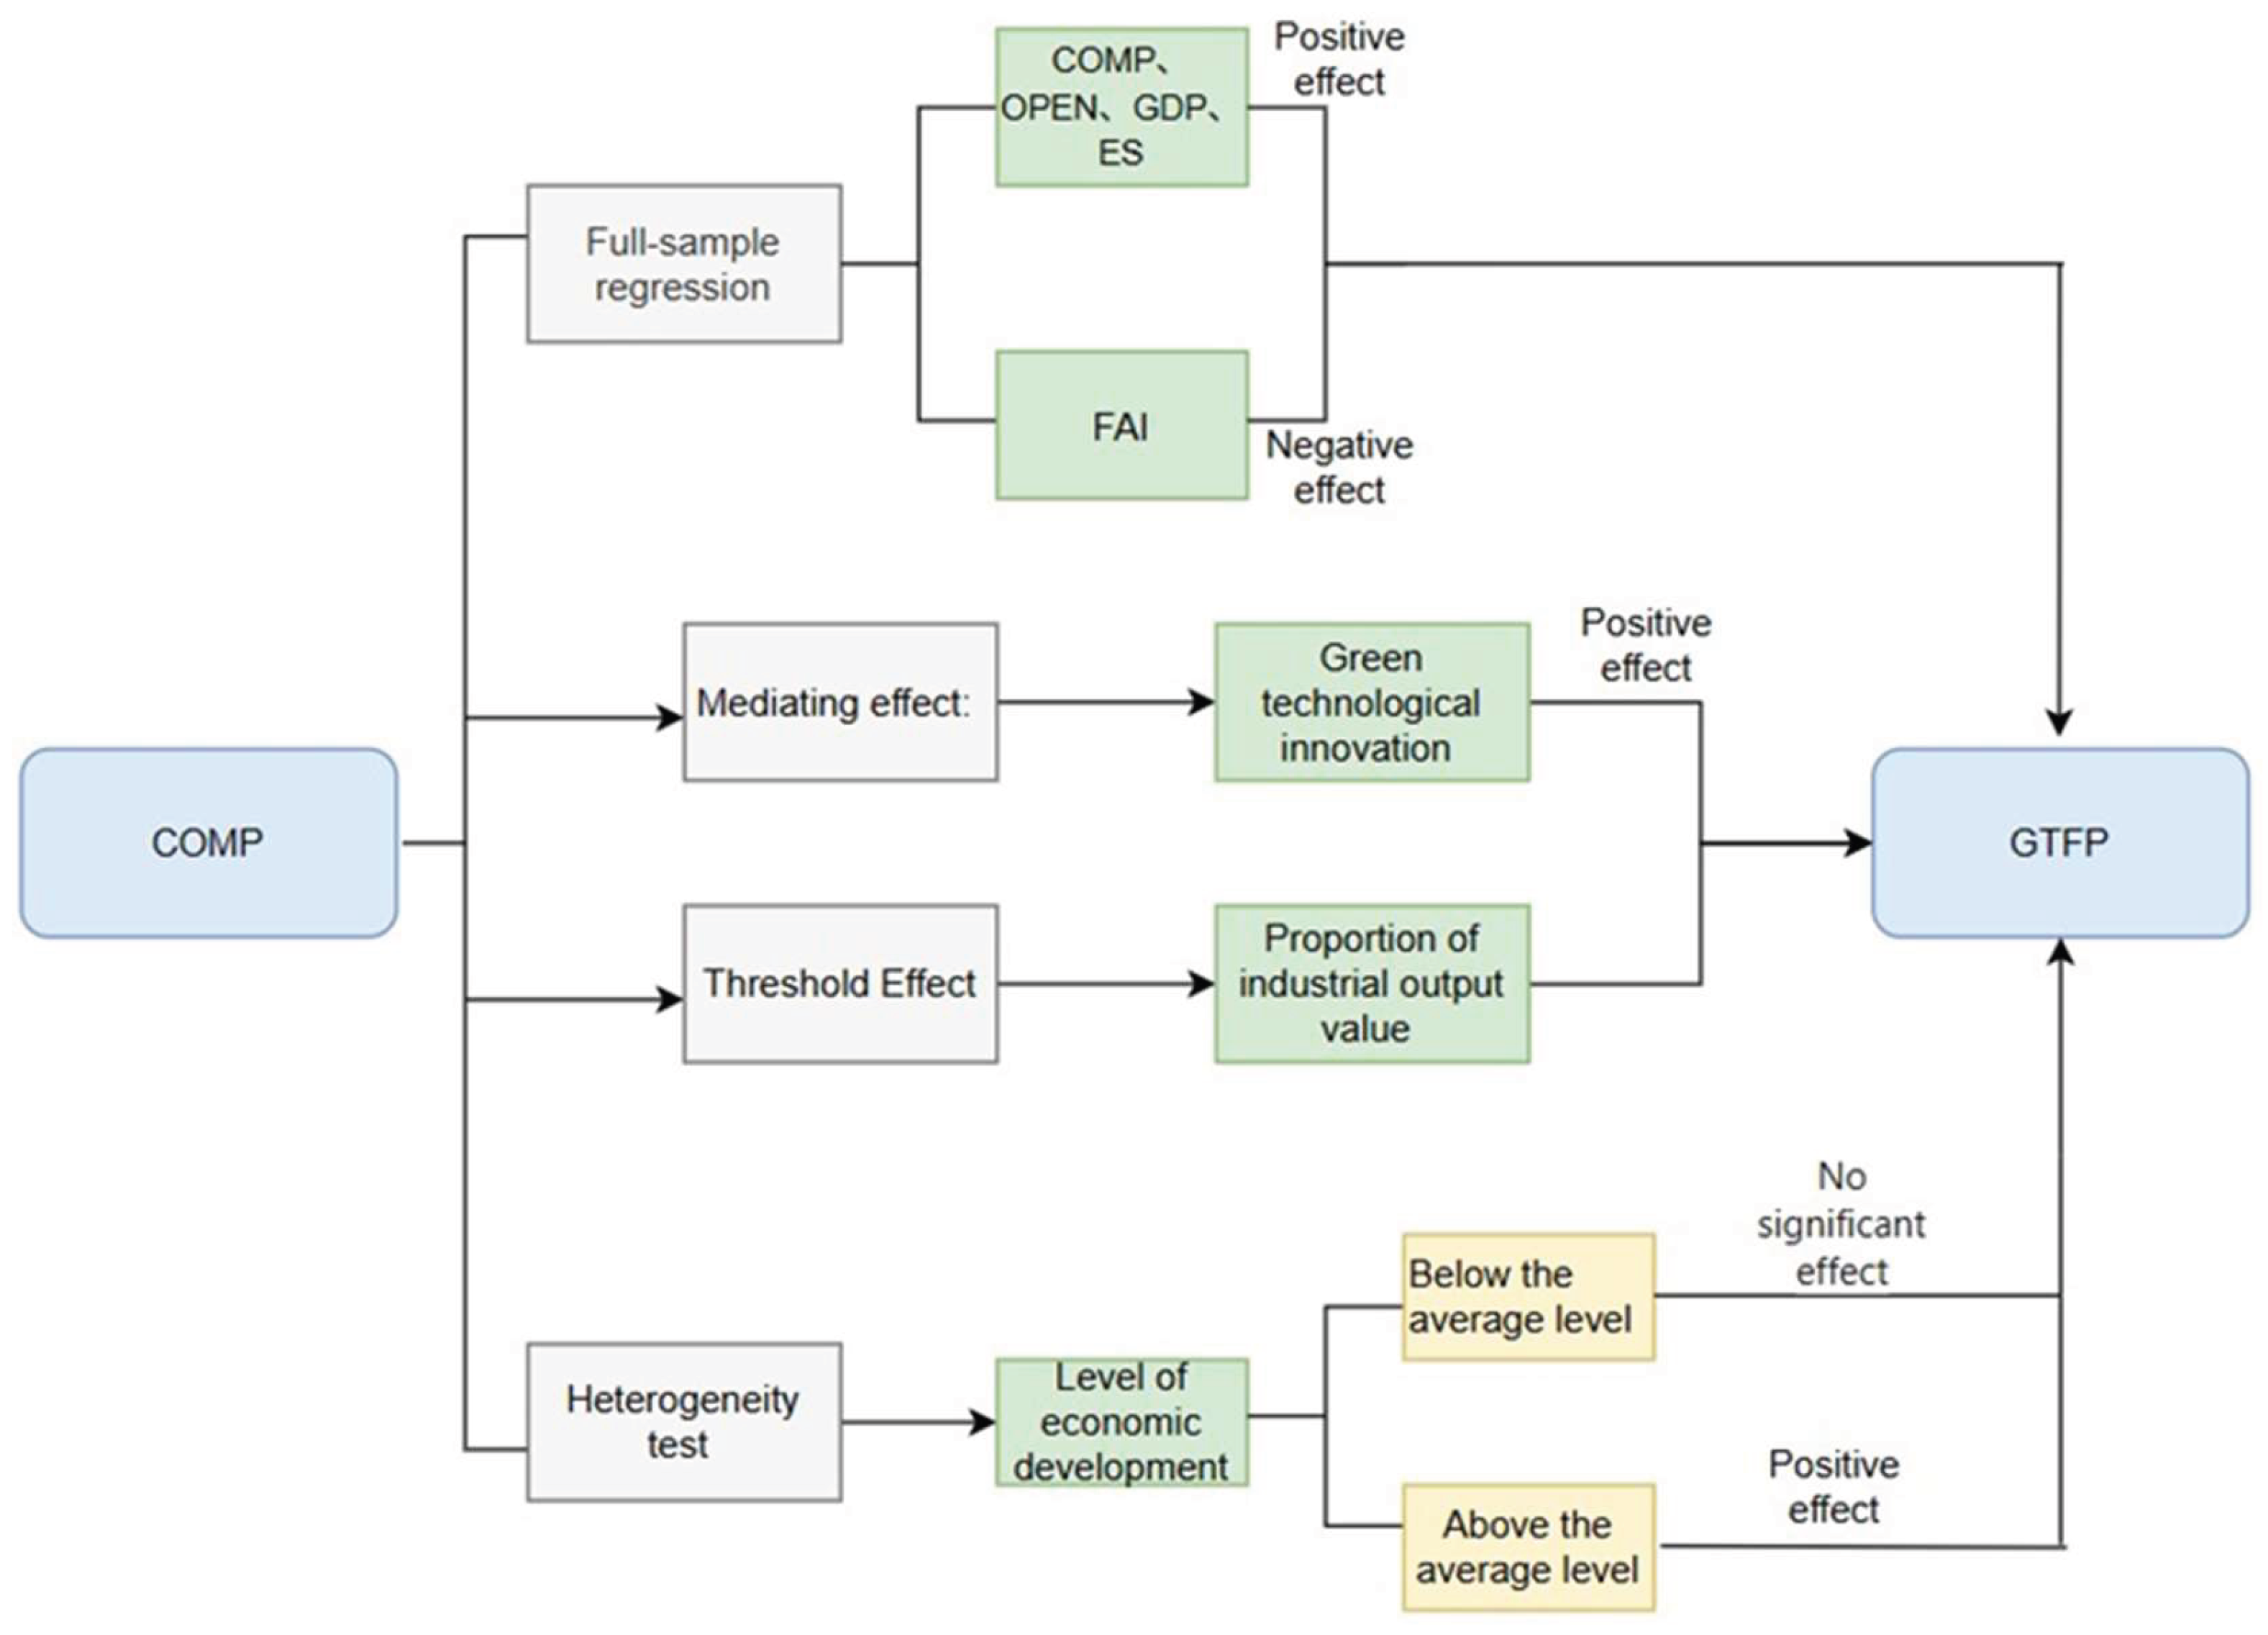
The theoretical framework of this study is illustrated in Fig. 1.
Figure 1.
Theoretical framework.
3. Research Design
3.1. Variable Selection and Indicator System Construction
(1) Dependent Variable
The dependent variable in this study is Green Total Factor Productivity (GTFP), which is measured using an SBM model and requires both input and output indicators. The SBM model can incorporate undesirable outputs into the GTFP estimation, thereby allowing for a more accurate assessment of urban GTFP levels.
Input Indicators:
Labor input: represented by the average number of on-the-job employees in each region.
Capital input: represented by the fixed-capital stock of each prefecture-level city.
Resource input: represented by the total electricity consumption of each prefecture-level city.
Output Indicators:
Desired output: Real gross domestic product.
Undesirable outputs: industrial wastewater discharge, industrial sulfur dioxide (SO₂) emissions, and industrial smoke (dust) emissions [34].
The resulting indicator system for measuring GTFP is presented in Table 1.
(2) Key Explanatory Variable
In this study, urban compactness serves as the key explanatory variable. To ensure scientific rigor, we draw on previous research and construct an indicator system measuring urban compactness from four dimensions: economic compactness, population compactness, land-use compactness, and transportation compactness. The specific indicators are detailed in Table 2.
(3) Control Variables
A Openness to Foreign Investment
Foreign capital inflows, driven by the pursuit of higher economic returns and shaped by local regulatory constraints, tend to target technology-intensive and environmentally friendly industries that employ more efficient green production technologies. Their entry into local markets often intensifies competition, compelling domestic firms to allocate additional resources toward improving green technological capabilities, thereby enhancing urban GTFP. We measure openness to foreign investment by the amount of actual utilized foreign capital. In the empirical analysis, we take the natural logarithm of this variable. The expected effect of actual utilized foreign capital on GTFP is positive.
B Government Fiscal Decentralization
Compared with the overall economic development level of Chinese cities, the cities in our study area lag behind, resulting in relatively limited tax revenues. Most fiscal expenditures are allocated to social welfare, infrastructure, and other basic projects, leaving little capacity to support the development of green, innovation-driven industries. Moreover, these cities, located in China’s inland Southwest, attract comparatively low levels of foreign investment, exhibit lower degrees of market liberalization, and experience higher degrees of government intervention, all of which constrain firms’ autonomy in exploring diversified innovation pathways. We measure the degree of fiscal decentralization by the ratio of government general revenue to government general expenditure, and we expect its effect on GTFP to be negative.
C Economic Value per Unit of Carbon Emission
Growth in the economic value per unit of carbon emission typically coincides with a rising share of technology-intensive industries—such as new energy, advanced manufacturing, and digital services—which possess stronger R\&D capabilities and apply cleaner technologies. This shift reduces energy consumption in production and thereby effectively enhances GTFP. As the economic value per unit of carbon emission increases, traditional energy-intensive and high-pollution industries are gradually squeezed out by market and policy mechanisms, prompting the reallocation of production factors toward high-efficiency, low-environmental-cost sectors and improving overall resource allocation efficiency. We measure economic value per unit of carbon emission as the ratio of actual GDP to total carbon emissions, and we expect its effect on GTFP to be positive.
D Employment Structure
Compared with other sectors, the tertiary sector exhibits higher value added and lower pollution emissions. Therefore, the reallocation of human resources and capital toward the tertiary sector contributes to improved production efficiency and, in turn, enhances green total factor productivity. We measure employment structure by the ratio of tertiary-sector employment to total employment, and we expect its effect on GTFP to be negative.
(4) Mediator Variable
Based on the mediation-effect hypothesis, this study selects the total number of green patent authorizations per 10,000 people as the mediator. To avoid inaccuracies arising from inconsistent units in the regression, the green patent authorization data are normalized. The per-10,000-population green patent authorization is calculated as the total number of green patents authorized divided by the resident population.
(5) Threshold Variable
Based on the threshold-effect hypothesis, this study uses the share of regional industrial output value as the threshold variable, measured as regional industrial output value divided by GDP.
3.2. Measurement Method for Green Total Factor Productivity
The dependent variable, Green Total Factor Productivity (GTFP), is measured using the Slack-Based Measure (SBM) model. The SBM model is a derivative of the traditional DEA framework. Traditional radial models tend to ignore slacks in inputs and outputs, which can bias research conclusions. To address the neglect of slack variables in efficiency evaluation by radial models, Tone (2001) proposed the SBM model (Slack-Based Measure). This model accounts for slacks in both input and output variables, substantially improving the robustness of the results. Therefore, this study employs the SBM model to measure GTFP. The model is specified as follows:
In equation(1) and (2), m is the number of input indicators; Sg and Sb are the numbers of desirable and undesirable outputs, respectively; x0、y0、b0 denote the input, desirable-output, and undesirable-output vectors of the decision-making unit under evaluation ; X、Yg、Yb are the corresponding data matrices for all n decision-making units in the sample; λare the intensity weights ;S-、S+、Sb are the slack variables for input excess, desirable-output shortfall, and undesirable-output excess, respectively. When all slack variables are zero, the DMU lies on the efficient frontier; When ρ∗ <1 , indicates inefficiency, with smaller values reflecting greater distance from the frontier and thus lower efficiency.
3.3. Method for Measuring Urban Compactness
To ensure measurement objectivity, this study similarly employs the entropy weight method for weight assignment and quantification of the Urban Density index system. The methodological procedure consists of the following steps:
- ➀
- Pre-processing of data for entropy weight method calculation
First, the data are normalized and inverted:
Positive indicators:
Negative indicators: (1)
In the formula, is the data that were dimensionless using the polarization method , , are maximum and minimum value of index.
- ➁
- Calculation of information entropy using the entropy method
is the information entropy of index; denotes the sample city ; is the indicator data after dimensionless processing.
- ➂
- Calculation of the weights of the indicators
is the weight of index , is the sample city ,is the information entropy of city .
- ➃
- Calculating Urban Density
is the weight of index , is the sample city , is compactness of a city, is the indicator data after dimensionless processing.
3.4. Model Construction and Data Sources
(1) Model Construction
Based on the above analysis, the following model is constructed:
Model 1: (5)
In the equation, GTFP denotes green total factor productivity; Compact represents urban compactness; FDI indicates the level of foreign investment; FAI refers to the degree of fiscal decentralization; GDP denotes the economic value per unit of carbon emission; ES indicates the employment structure; ε is the random error term; a₀ to a₅ are the parameters to be estimated; and i and t represent city and time, respectively.
Model 2: (6)
Model 3: (7)
In Equation (6), M represents the mediating variable, namely green technological innovation. Control denotes the set of four control variables. To test for mediation effects, regression analysis is conducted based on Model 2 to examine whether urban compactness has a significant impact on green technological innovation. If both coefficients α₁ and β₂ are statistically significant, a significant mediation effect is present. If β₂ is not significant while α₁ is, this indicates full mediation. If both are significant, it indicates partial mediation. If the stepwise regression results are not significant, further tests using the Sobel test and Bootstrap method are conducted to verify the existence of the mediation effect.
Model 4: (8)
In Equation (8), GTFP denotes Green Total Factor Productivity, COMP represents urban compactness, and qit is the threshold variable indicating the proportion of industrial output, γis the threshold value to be estimated, Xit represents control variables,λdenotes time fixed effects, andεis the random disturbance term. I(qit≤γ) takes the value 0 when the threshold variable is less than or equal toγ; I(qit>γ) takes the value 1 when the threshold variable is greater than .
(2) Research Scope and Data Description
This study covers cities within the Dianzhong Urban Agglomeration and the Chengdu–Chongqing Urban Agglomeration. The Dianzhong Urban Agglomeration is located in China’s southwestern frontier region, where economic development is relatively lagging; the implementation of the Belt and Road Initiative has positioned it as China’s frontier for opening to the southwest. The Chengdu–Chongqing Urban Agglomeration, by contrast, has a higher overall level of economic development, and with the inauguration of the Chengdu–Kunming and Chongqing–Kunming high-speed railways, its linkage with the Dianzhong Urban Agglomeration has become increasingly close—making their coordinated development a focal point of both research and practice. Both agglomerations lie in the upper reaches of the Yangtze River, an ecologically sensitive area, and their administrative regions encompass diverse landforms such as mountains, hills, and plains. Identifying the pathways through which urban compactness affects GTFP in these two city clusters can inform their coordinated development and the formulation of differentiated urban spatial planning policies. Due to severe data gaps and difficulty in obtaining reliable statistics for Chuxiong City, it is excluded from this study.
The data used to measure urban compactness, Green Total Factor Productivity (GTFP), regional gross domestic product, the share and value added of secondary and tertiary industries, resident population, average number of employees at year-end, administrative land area, per-capita road area, number of buses per 10 000 people, number of taxis per 10 000 people, total fixed-asset investment, number of green patent authorizations, fiscal expenditure within budget, total foreign capital utilization, and total energy consumption (10 000 tons of standard coal) are primarily drawn from the 2011–2022 editions of the China City Statistical Yearbook and the statistical yearbooks of each case city. Data on built-up area, construction land area, and residential land area were obtained through consultation with local government Natural Resources Bureaus and Housing and Urban–Rural Development Bureaus. Industrial sulfur dioxide (SO₂) emissions, industrial waste-gas emissions, and industrial wastewater emissions were collected via local government Ecological Environment Bureaus, supplemented by the China City Statistical Yearbook and each case city’s statistical yearbook. Total electricity consumption and average on-the-job employee counts were sourced from local government reports and the case cities’ statistical yearbooks. To ensure the scientific rigor and accuracy of the research, the foreign capital utilization variable was logarithmically transformed to reduce data distortion. Missing values were filled using interpolation and ARIMA methods. Descriptive statistics for all variables are presented in Table 3.
4. Empirical Results and Analysis
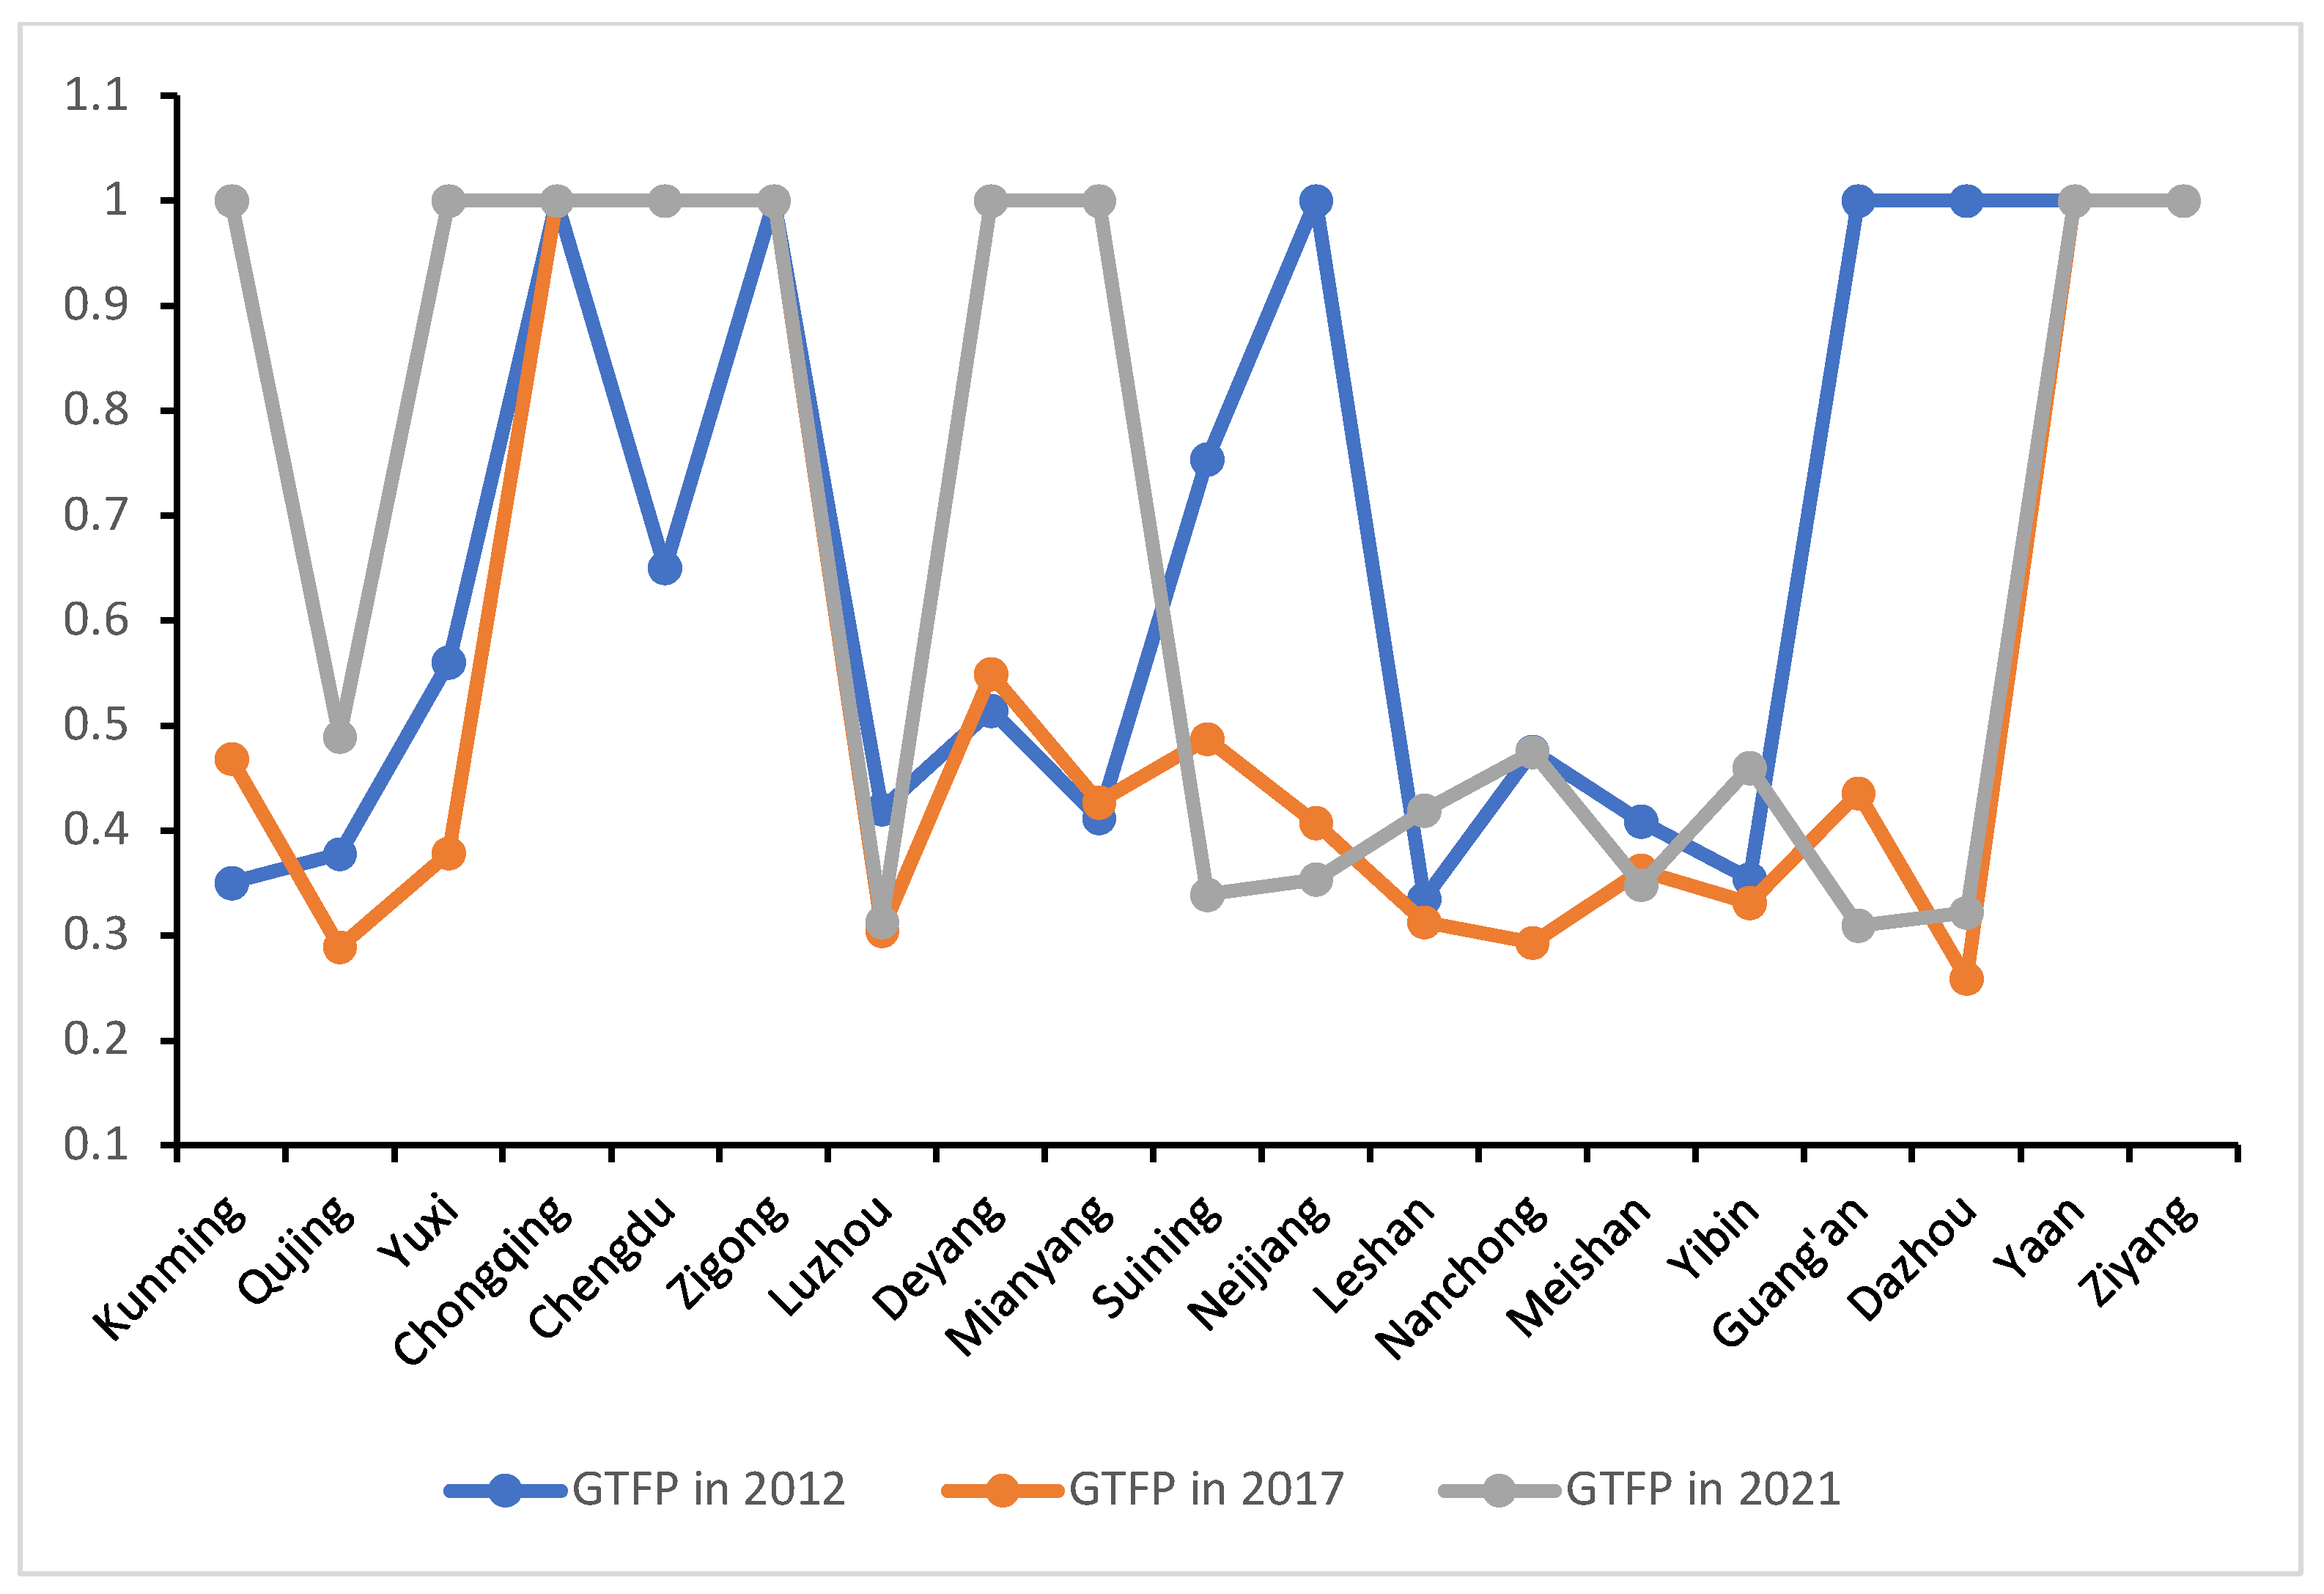
4.1. Trends in Urban Compactness and GTFP
By applying the entropy-weight method, we calculated the weights and scores of each indicator for urban compactness, and we used a SBM model to compute composite GTFP scores (Figure 4 and Figure 5). We then selected the 2011, 2017, and 2021 scores for urban compactness and GTFP and visualized them in Figure 4 and Figure 5. By comparing the two charts, we observe that, aside from a few cities showing a downward trend, both urban compactness and GTFP levels have generally increased in sync over the eleven-year period, providing a preliminary data foundation for further examination of the mechanisms through which compactness influences GTFP.
Figure 4.
Trends in Urban Compactness.
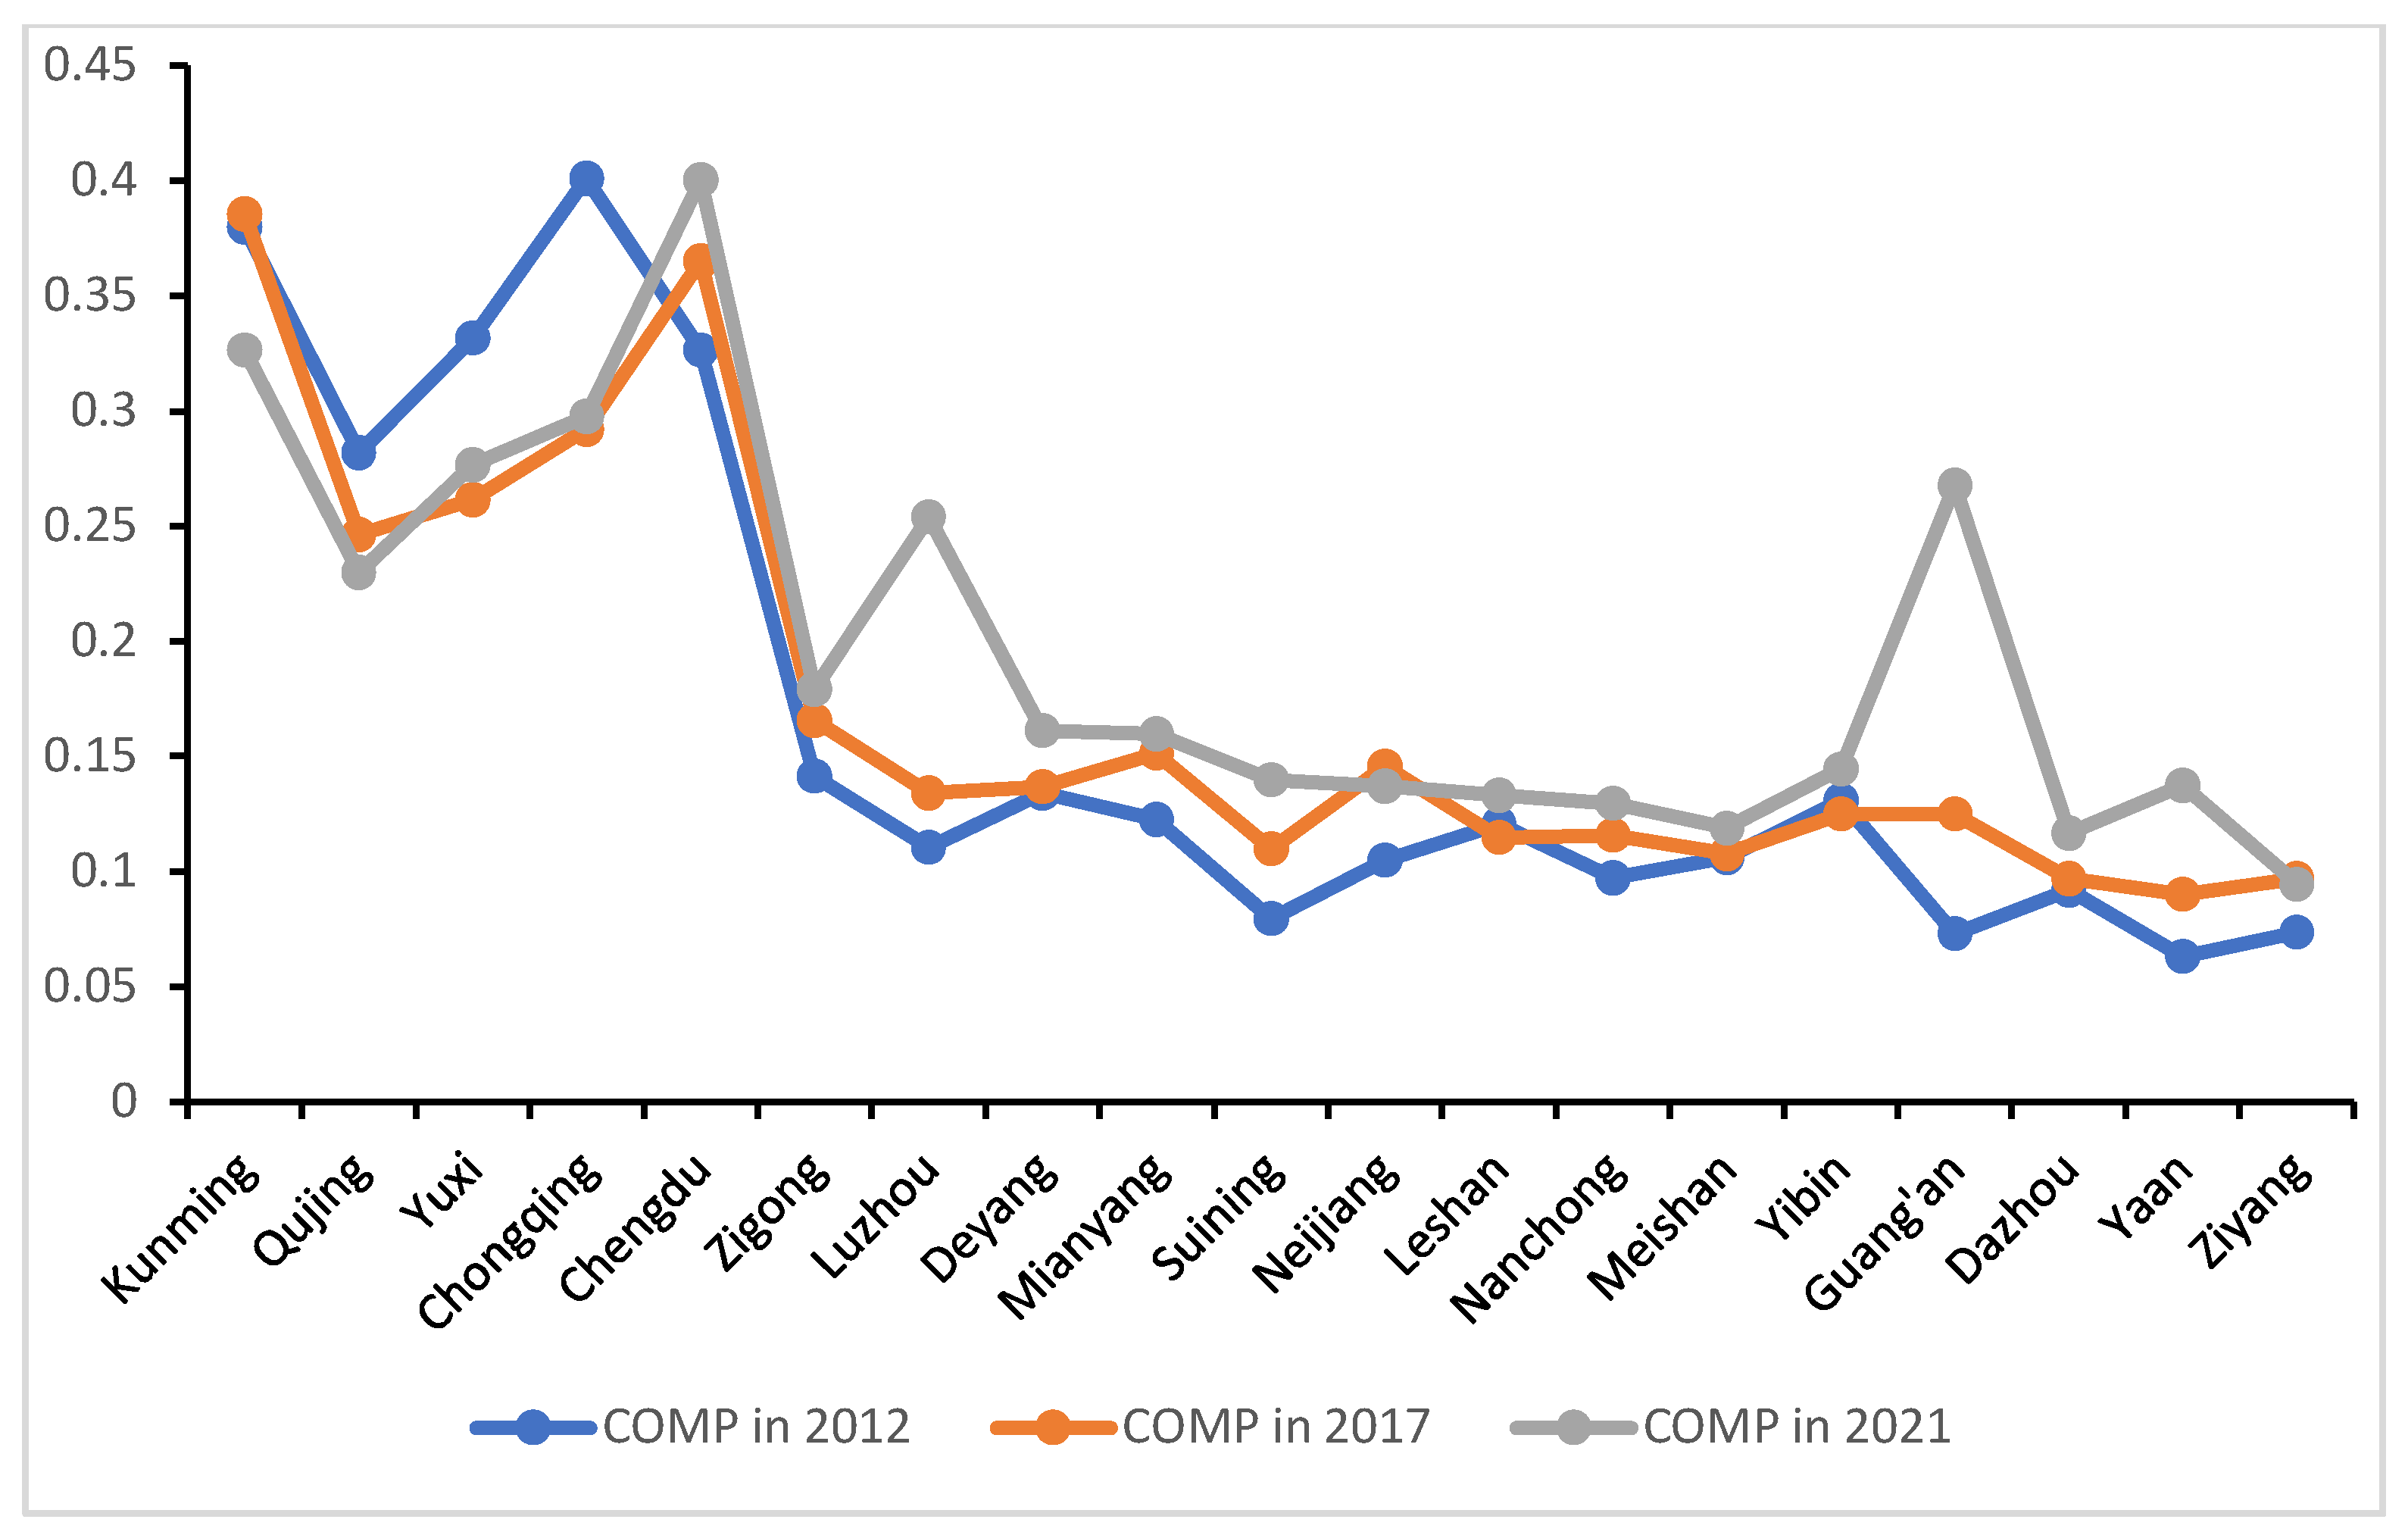
Figure 5.
Trends in GTFP.
4.2. Analysis of Full-Sample Regression Results
To avoid errors arising from multicollinearity, we first conducted a multicollinearity test on the variables involved in the study, as shown in Table 4. All variables have VIF values below 5, indicating that multicollinearity is weak in the regression model.
Before conducting the overall regression, we performed a Hausman test on the model to assess its appropriateness, with results shown in Table 5. The Hausman test rejects the null hypothesis (P < 0.01), indicating that the fixed-effects model is more suitable for the empirical analysis.
On this basis, we conducted a full-sample regression, and the results are presented in Table 6. Urban compactness has a positively significant effect on GTFP at the 5% level (0.65), indicating that greater compactness can promote GTFP improvement. As economic compactness increases and economic activities become more concentrated, economies of scale emerge, boosting production efficiency and reducing resource consumption, thereby enhancing urban GTFP. Through denser road-network planning combined with compact spatial planning, increases in network density and functional-zone compactness reduce greenhouse-gas emissions caused by excessive traffic and long commuting distances, further improving GTFP. Moreover, higher population density and concentrated human capital improve labor productivity. For example, the spillover of high-quality education and medical resources from central cities raises the human-capital level in surrounding areas. A concentrated population also fully leverages shared public services (e.g., transportation and healthcare), lowering living costs, attracting more highly skilled people, and creating a positive cycle that provides a human-capital advantage for upgrading urban industrial technology, thus affecting GTFP.
Among the control variables, the level of foreign direct investment, the economic value per unit of carbon emissions, and the employment structure each have a positive and significant impact on GTFP at the 1% level. In contrast, fiscal decentralization has a negative and significant effect on GTFP at the 1% level.
OPEN also shows a positive and significant effect on GTFP, suggesting that higher openness advances marketization, fosters a fairer competitive environment for enterprises, and helps channel production factors such as capital and labor toward high-technology, high-efficiency, lower-energy-consumption, and higher-value-added firms, thereby optimizing resource allocation. A higher level of external investment typically reflects stronger intellectual-property protection and more thoroughly price-mediated production factors, which encourage firms to pursue green technological innovation, gain competitive advantage, and in turn drive improvements in GTFP.
The positive and significant effect of GDP on GTFP indicates that increasing this metric helps enhance GTFP. Higher economic returns per unit of carbon emissions optimize the return on investment in green technologies, raise their economic value, and facilitate their diffusion and application, thereby boosting GTFP. In addition, a higher economic value per unit of carbon emissions improves resource-allocation efficiency: strong economic incentives steer capital and production inputs toward low-carbon industries such as renewable energy and services, further enhancing GTFP.
The negative and significant effect of FAI on GTFP suggests that excessive administrative intervention may occur in resource allocation. When governments allocate resources through administrative directives rather than market signals, capital and labor may flow into suboptimal sectors, inhibiting the green transformation of industry. In the Dianzhong and Chengdu–Chongqing urban agglomerations, economic development lags overall and local fiscal revenues are limited, making these regions heavily dependent on higher-level transfer payments. Preferring broad, short-term spending to quickly generate revenue, local governments fail to provide targeted support for green industries and struggle to build long-term green-technology capacity.
The positive and significant impact of ES on GTFP indicates that a higher share of tertiary-industry employment promotes GTFP growth. Compared with primary and secondary sectors, the tertiary industry typically generates greater economic value with lower pollution emissions. Moreover, tertiary-industry jobs usually offer higher incomes, and increasing their share supports higher household incomes, drives an upgrade in consumption patterns, and stimulates spending on culture, education, and entertainment. This shift encourages green consumption and influences producers to adopt green-industry practices and technological upgrades.
4.3. Robustness Check
(1) Two-sided Winsorization of the Core Explanatory Variable
To perform a robustness check, the core explanatory variable, urban compactness (COMP), was subjected to two-sided Winsorization. The results, shown in Table 7, indicate that the significance and signs of the coefficients for COMP and the control variables are largely consistent with the original regression results. The effects of each variable on the dependent variable remain essentially unchanged, confirming the robustness of the regression findings.
(2) Robust Regression
Building on the original regression model, we conducted a robust-standard-errors test to examine model stability. The results in Table 8 show that urban compactness still has a significantly positive effect on GTFP (P < 0.01), and the significance levels and directions of the remaining control variables remain unchanged, confirming the robustness of the findings.
4.4. Mediation Effect Test
To ensure the scientific rigor and reliability of the mediation-effect test, we applied the bootstrap method to assess the robustness of the mediation effect. The results are shown in Table 9. The total-effect coefficient is 0.653, which represents the estimated overall effect of the independent variable (urban compactness) on the dependent variable (GTFP) via the mediator (green technological innovation). The “a” coefficient (0.977) measures the effect of COMP on the mediator, and the “b” coefficient (0.371) measures the effect of the per-10,000-population green patent authorizations on GTFP. The direct-effect coefficient (c′) is the coefficient on COMP from the full model. Hence, the product a × b (0.363) is the mediation-effect value, with P < 0.01 and a 95% confidence interval that does not include zero, indicating a robust mediation effect.
The coefficient of 0.977 for the effect of urban compactness on green technological innovation (a-value) indicates that increased compactness promotes green technological innovation. Through intensive land use, cities can implement centralized green infrastructure investments, providing policy and environmental support for firms’ green transformation; compact spatial layouts intensify land-price competition, forcing low-value-added, high-energy-consumption industries either to relocate or to upgrade via green technologies, thereby enhancing GTFP; and compact urban forms facilitate the efficient flow of information, technology, and talent, improving resource-allocation efficiency, accelerating technology diffusion, and fostering industrial synergies that underpin the development of low-energy-consumption, high-tech industries and modern services.
The effect of green technological innovation on GTFP is positive and significant at the 5% level, with a coefficient of 0.371 (b-value), demonstrating that green technological innovation fosters GTFP improvement. Green technological innovation raises firms’ production efficiency and reduces energy consumption, aiding traditional manufacturing in its structural transformation and weakening carbon-emission intensity. Moreover, it drives firms to diversify green-product portfolios and lower production costs, which tends to reduce prices, satisfy and stimulate green-consumer demand, and thus support the sustainable growth of GTFP.
4.5. Heterogeneity Analysis
The above sections have examined the overall effect of urban compactness on GTFP and the mediating role of green technological innovation. However, cities in our sample belong to different geographic contexts and stages of economic development, so the impact of compactness on GTFP may vary with economic development level. To test this, we used the 2021 per-capita GDP of each city: those above the sample average were classified as “higher-development” cities, and those below as “lower-development” cities. The higher-development group comprises nine cities: Kunming, Yuxi, Chongqing, Chengdu, Zigong, Deyang, Mianyang, Leshan, and Yibin; the lower-development group comprises ten cities: Qujing, Luzhou, Suining, Neijiang, Nanchong, Meishan, Guang’an, Dazhou, Ya’an, and Ziyang.
4.5.1. Heterogeneity Test by Economic Development Level
We divided the sample into the two development-level groups and estimated the effect of urban compactness on GTFP separately for each. The results, shown in Table 10, indicate that for cities with above-average economic development, compactness has a positive and significant impact on GTFP, with a coefficient of 0.88. In contrast, for cities below the average, the effect of compactness on GTFP is not statistically significant.
Cities with higher economic development typically have more advanced industrial structures and higher value added, which raises the demand for green technological innovation to reduce production costs. Moreover, the clustering of technology-intensive industries facilitates green-technology learning and diffusion among firms, further improving productivity and GTFP growth. Conversely, less-developed cities often lack adequate infrastructure and remain in an industrial transition phase, with limited capacity to absorb green industries. Their constrained fiscal resources are largely directed toward basic infrastructure and social services, weakening support for emerging green sectors and potentially crowding out green investment, which may explain the insignificant effect of compactness on GTFP in these cities.
The threshold-effect regression results are shown in Table 11. The test indicates that when the share of industrial output is at a lower level, urban compactness has a positive and significant effect on GTFP at the 5% level, with a coefficient of 0.606. Once the industrial-output share exceeds the threshold value, compactness exerts a positive and significant effect on GTFP at the 1% level, with a coefficient of 1.528. This suggests that at lower levels of industrial output, a more compact urban form reduces transportation costs and improves land-use efficiency, thereby enhancing overall resource-allocation efficiency and positively driving GTFP. However, because the industrial system is relatively small at this stage, the spillover effects of green technology are limited, so the impact of compactness on GTFP remains modest.
When the industrial-output share is at a higher stage, infrastructure and public services are more fully developed. In this context, the economies-of-scale and agglomeration effects induced by spatial compactness become more pronounced, attracting greater green-technology investment and providing sufficient research funding, which strengthens the capacity for green-technology development and diffusion. Furthermore, advancing a compact spatial layout facilitates knowledge sharing and accelerates green-technology progress.
Fig 2 plots the nonlinear marginal-effect curve of urban compactness on GTFP across different compactness scores. The figure shows that once the threshold (0.464) is exceeded, the slope of the compactness–GTFP relationship increases markedly, consistent with the analysis above.
Figure 2.
Threshold-Effect Visualization.
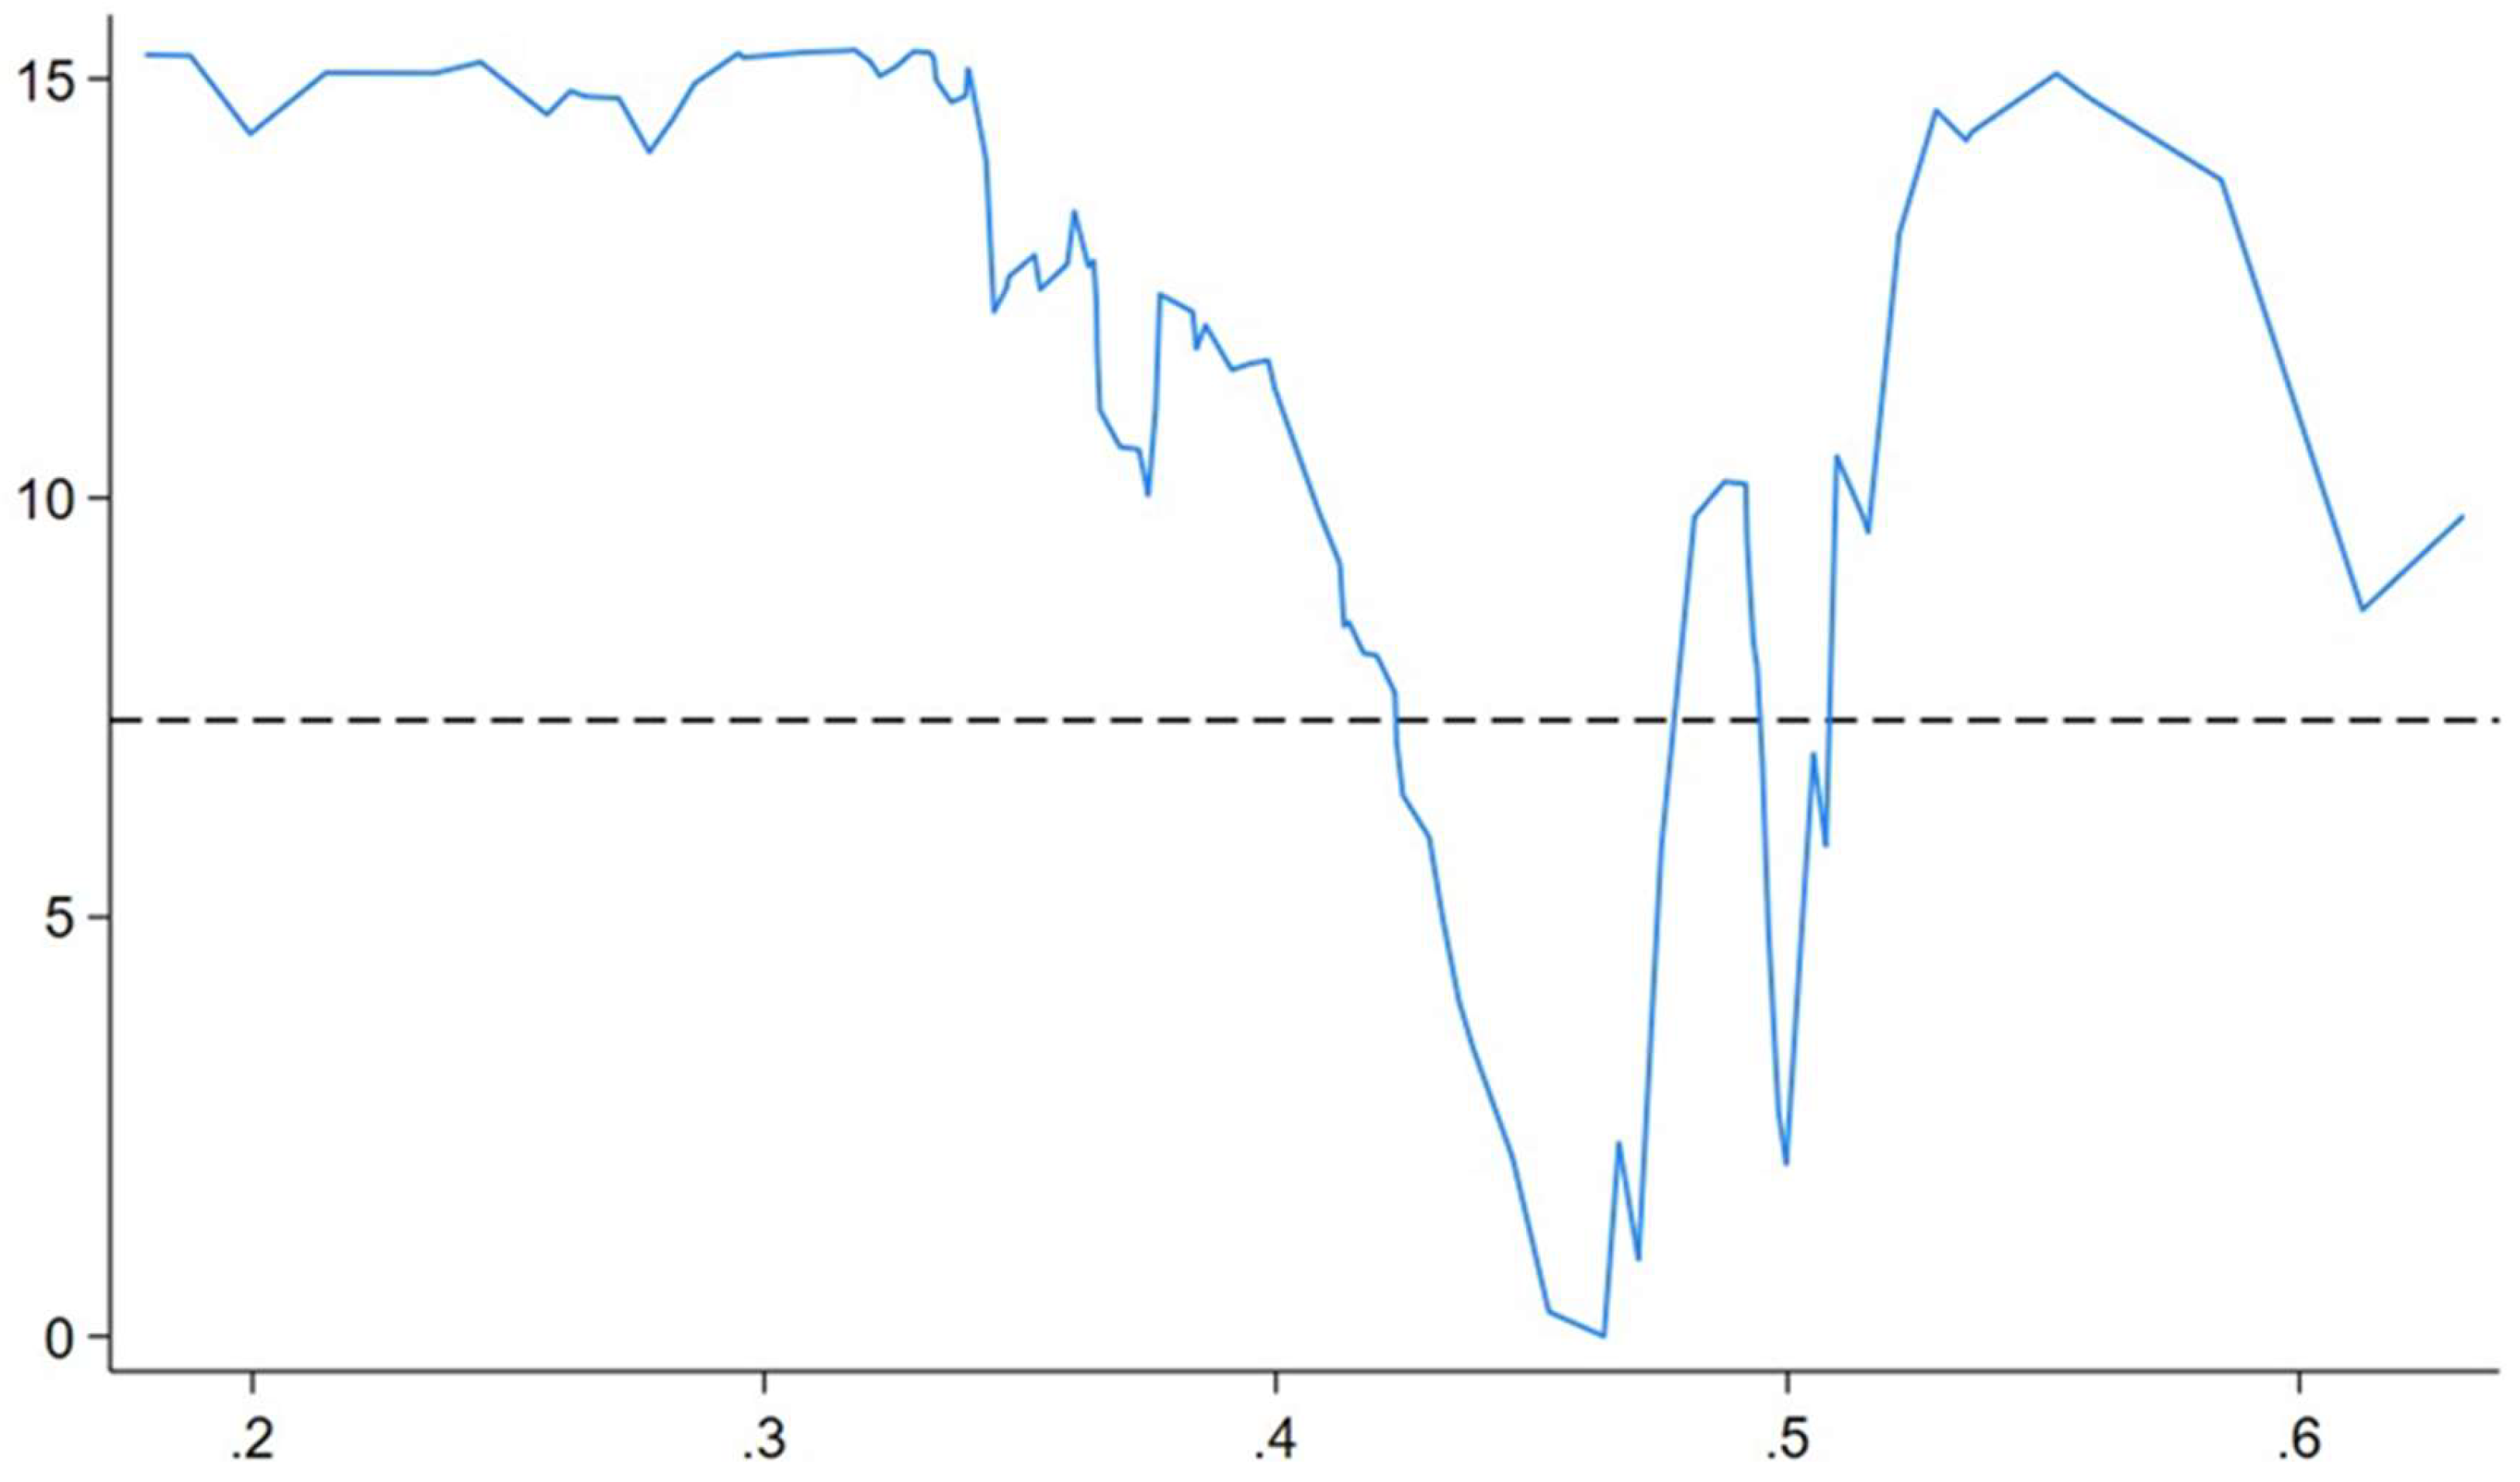
Table 12 presents the bootstrap test results, with P < 0.01, indicating that the threshold-effect test is robust.
5. Discussion
5.1. Key Findings
Using panel data from 2012–2021 for cities in the Dianzhong Urban Agglomeration and the Chengdu–Chongqing Urban Agglomeration, this study examined the mechanisms through which urban compactness affects GTFP. First, the full-sample regression results show that urban compactness has a positive and significant effect on GTFP. Second, the mediation-effect analysis indicates that green technological innovation fully mediates the relationship between urban compactness and GTFP; in particular, the positive impact of green technological innovation on production efficiency effectively raises GTFP levels. Third, heterogeneity tests demonstrate that the effect of urban compactness on GTFP varies with economic development level: in regions with above-average economic development, compactness positively influences GTFP, whereas in regions below the average, the effect is not significant. Fourth, the threshold-effect test shows that when the share of industrial output is low, the impact of compactness on GTFP is weaker, but once the industrial-output share exceeds the threshold, this impact becomes stronger. These conclusions are visualized in Fig 3.
Figure 3.
Summary of conclusion.
5.2. Policy Recommendations
Based on the empirical analysis results, this study proposes the following recommendations:
5.2.1. Implement Differentiated Compact Urban Development Strategies Based on the Development Stage of Each City
The full-sample regression shows a significantly positive impact of urban compactness on GTFP, suggesting that compact city construction generally contributes to GTFP improvement. However, heterogeneity analysis reveals that the mechanism of this influence varies with the level of economic development. Cities with above-average economic development should actively promote compact city strategies, accelerating the agglomeration of population and production factors to generate economies of scale and enhance GTFP. A dynamic land supply list could be established, prioritizing land allocation toward central urban areas while strictly limiting the expansion of inefficient industrial land to enhance industrial clustering efficiency. In urban master planning, flexible land use areas can be reserved to accommodate potential demands from industrial transformation.
5.2.2. Promote Green Upgrading of Industrial Structure
The full-sample regression results indicate that both the economic value of carbon emissions per unit and the employment share in the tertiary sector can significantly promote GTFP growth. Local governments can use administrative tools to advance industrial upgrading by enforcing entry restrictions on low-end, high-pollution, labor-intensive industries. Fiscal measures should also be used to support green industrial transformation, such as subsidizing technology R\&D to reduce enterprise transformation costs.
At the same time, enterprises should recognize the economic opportunities of green transformation and actively adjust their development strategies. Currently, green products are gradually capturing a larger market share—for example, the integration of new energy vehicles with artificial intelligence is helping them gain ground over traditional fuel vehicles in regions like Asia and Europe. Compared with traditional industries, green industries often exhibit lower production costs and higher productivity. To improve enterprise profitability, governments should consider providing moderate subsidies to support green industrial transformation and upgrading.
Enterprise-level green transformation not only enhances economic performance but also contributes to advancing urban economic development and ensuring the sustainable improvement of total factor productivity.
5.2.3. Enhance the Level of Openness
The full-sample regression results indicate that foreign investment has a positive impact on GTFP, suggesting that continued openness to the outside world contributes to the sustainable improvement of urban productivity. Therefore, cities within the study area should gradually expand their openness and adopt a green technology-oriented approach when attracting foreign investment. Preferential tax policies should be offered to foreign enterprises in sectors such as clean energy, carbon capture, and new energy batteries.
In addition, blind introduction of foreign investment should be avoided. Cities at different stages of economic development may have varying industrial foundations and employment structures. Thus, foreign investment should be introduced based on regional development conditions to match local development needs and labor market structures precisely. A foreign investment access mechanism should also be established to avoid the influx of high-pollution, high-energy-consumption, and low-efficiency enterprises, which could otherwise hinder improvements in local living standards and productivity.
5.2.4. Encourage Green Technology Upgrading
Mediation effect test results indicate that green technological advancement plays an intermediary role in the impact of urban compactness on GTFP and can exert a positive effect on GTFP. Special green technology innovation funds can be established to support innovations such as building-integrated photovoltaics (BIPV) and emission reductions in transportation infrastructure, with appropriate subsidies provided for green technology R\&D.
The test results also suggest that compact urban spatial patterns can promote green technological innovation. Therefore, on the basis of compact industrial clusters, a negative list of industries can be introduced to push high-energy-consuming sectors to reduce emissions, improve production efficiency, and encourage enterprises to seek green technological upgrades.
5.2.5. Optimize Urban Compactness in Phases
There is a threshold effect in the influence of urban compactness on GTFP depending on the level of industrialization. At lower levels of industrial output, moderate increases in spatial compactness should be promoted to optimize infrastructure construction, improve transportation efficiency, and provide spatial support for the layout of green industries. At higher levels of industrial output, where economic agglomeration and industrial scale effects have reached a certain degree, high-density industrial clusters should be leveraged to attract technology-intensive enterprises. This will foster collaborative innovation with manufacturing sectors and promote the transformation of scientific research outcomes.
5.3. Research Limitations and Future Research Plan
5.3.1. Research Limitations
This study measures urban compactness using the entropy weight method, which may be influenced by a few extreme values, potentially affecting the final measurement results. To mitigate this concern, the author has reviewed a large body of literature for theoretical justification. Moreover, based on the measurement results, the weights of each variable are relatively balanced and aligned with the research hypothesis, suggesting that the influence of extreme values on the final results is likely minimal.
The study focuses on cities within the Central Yunnan and Chengdu-Chongqing urban agglomerations. Due to severe data deficiencies and the relative administrative uniqueness of Chuxiong City within the Central Yunnan urban agglomeration, it was not possible to obtain data from relevant government departments. As a result, Chuxiong City was excluded from the study sample, inevitably leading to a smaller sample size for the Central Yunnan urban agglomeration.
In terms of model specification, this study employs a time fixed-effects model to examine the impact mechanism of urban compactness on GTFP. GTFP may be influenced by time-related factors such as technological progress, policy adjustments, or macroeconomic fluctuations. By incorporating time dummy variables, the time fixed-effects model controls for all time-varying but cross-sectionally invariant trends, thereby avoiding estimation bias caused by the omission of temporal confounding factors. However, controlling only for time fixed effects may still leave the analysis vulnerable to endogeneity issues.
To address this, we analyzed potential endogeneity between GTFP and urban compactness based on existing literature and urban economics theory. The analysis suggests that the likelihood of significant endogeneity in their relationship is relatively low, and any resulting bias from endogeneity is expected to have a minimal impact on the empirical findings.
5.3.2. Future Research Plan
This study uses the entropy weight method to measure urban compactness. Future research should consider combining objective weighting methods with subjective ones (such as the Analytic Hierarchy Process, AHP) to further ensure measurement objectivity. The limited sample size from the Central Yunnan urban agglomeration is a constraint.
In future studies, data collection should be expanded—potentially through field investigations—to include county-level and district-level units within the urban agglomeration. This will help broaden the research scope and more accurately identify internal differences in influencing mechanisms, enabling a heterogeneity analysis within the agglomeration. Furthermore, spatial regression models should be employed to test for spatial spillover effects and other spatial influences of urban compactness on GTFP.
References
- International Labour Organization; United Nations Environment Programme; International Trade Union Confederation; International Organisation of Employers. Green Jobs: Towards Decent Work in a Sustainable, Low-Carbon World; International Labour Organization: Geneva, Switzerland, 2008. [Google Scholar]
- OECD. Towards Green Growth; OECD Publishing: Paris, France, 2011. [Google Scholar]
- OECD. Towards Green Growth: Monitoring Progress – OECD Indicators; OECD Publishing: Paris, France, 2011. [Google Scholar]
- United Nations Environment Programme. Towards a Green Economy: Pathways to Sustainable Development and Poverty Eradication; UNEP: Nairobi, Kenya, 2011. [Google Scholar]
- Färe, R.; Grosskopf, S.; Pasurka, C.A. Environmental production functions and environmental directional distance functions. Energy 2007, 32, 1055–1066. [Google Scholar] [CrossRef]
- Zhou, P.; Ang, B.W.; Han, J.Y. Total factor carbon emission performance: A Malmquist index analysis. Energy Economics 2010, 32, 194–201. [Google Scholar] [CrossRef]
- Chung, Y.H.; Färe, R.; Grosskopf, S. Productivity and undesirable outputs: A directional distance function approach. Journal of Environmental Economics and Management 1997, 31, 229–240. [Google Scholar] [CrossRef]
- Wang, Q.; Zhang, F. Does green innovation facilitate green total factor productivity? Evidence from Chinese cities. Energy Economics 2021, 98, 105237. [Google Scholar] [CrossRef]
- Burton, E. Measuring urban compactness in UK towns and cities. Environment and Planning B: Planning and Design 2002, 29, 219–250. [Google Scholar] [CrossRef]
- Jenks, M.; Burton, E.; Williams, K. The Compact City: A Sustainable Urban Form? Taylor & Francis: London, UK, 1996. [Google Scholar]
- Shi, X.; Cheng, Y.; Zhang, J.; Zhang, Y.; Wei, L.; Wang, Y. Impacts of the Urban Form Structure on Carbon Emission Efficiency in China’s Three Major Urban Agglomerations: A Study from an Urban Economic Activities Perspective. Sustainability 2025, 17, 3984. [Google Scholar] [CrossRef]
- Niu, Y.; Zhu, L.; Li, L.; Dong, S.; Liu, D. Study on Spatial-Temporal Coupling Coordination between Sustainable Land Use and Urbanization in Yuxi City. Sustainable Development 2024, 14, 3. [Google Scholar] [CrossRef]
- Liu, Y.; Wu, A.; Wang, J.; Taghizadeh-Hesary, F.; Dong, X. Green growth in the global south: How does metallic minerals affect GTFP enhancement? Resources Policy 2023, 81, 104505. [Google Scholar] [CrossRef]
- Färe, R.; Primont, D. Multi-Output Production and Duality: Theory and Applications; Kluwer Academic: Boston, MA, USA, 1995. [Google Scholar]
- Tone, K. A slacks-based measure of efficiency in data envelopment analysis. European Journal of Operational Research 2001, 130, 498–509. [Google Scholar] [CrossRef]
- Orea, L. A generalized Malmquist productivity index. Top 2002, 10, 81–101. [Google Scholar]
- Wang, H.; Lockett, M.; He, D.; Lv, Y. Enhancing green total factor productivity through manufacturing output servitization: A case study in China. Heliyon 2024, 10, e23769. [Google Scholar] [CrossRef] [PubMed]
- Jing, Z.; Liu, Z.; Wang, T.; Zhang, X. The impact of environmental regulation on green TFP: A quasi-natural experiment based on China’s carbon emissions trading pilot policy. Energy 2024, 295, 132357. [Google Scholar] [CrossRef]
- Liu, Y.; Wu, A.; Wang, J.; Taghizadeh-Hesary, F.; Dong, X. Green growth in the global south: How does metallic minerals affect GTFP enhancement? Resources Policy 2023, 81, 104505. [Google Scholar] [CrossRef]
- Mao, J.; Yu, Z.; Wang, Y.; Wang, L.; Wang, M. Spatial convergence and influencing factors of green total factor productivity of China’s urban agglomerations. Frontiers in Environmental Science 2023, 11, 1138396. [Google Scholar] [CrossRef]
- Zhang, M.; Li, C.; Zhang, J.; Chen, H. How Green Finance Affects Green Total Factor Productivity—Evidence from China. Sustainability 2024, 16, 270. [Google Scholar] [CrossRef]
- Feng, C.; Zhong, S.; Wang, M. How can green finance promote the transformation of China’s economic growth momentum? A perspective from internal structures of green total-factor productivity. Research in International Business and Finance 2024, 72, 102356. [Google Scholar] [CrossRef]
- Liu, Y.; Yang, Y.; Zhong, K.; Li, H. Digital economy development, industrial structure upgrading and green total factor productivity: Empirical evidence from China’s cities. International Journal of Environmental Research and Public Health 2022, 19, 1524. [Google Scholar] [CrossRef]
- Zhang, X.; Qiu, F.; Liu, J. Digital Economy’s Impact on Carbon Emission Performance: Evidence from the Yangtze River Delta, China. Chinese Geographical Science 2025, 35, 217–233. [Google Scholar] [CrossRef]
- Jenks, M.; Burton, E.; Williams, K. The Compact City: A Sustainable Urban Form? Taylor & Francis: London, UK, 1996. [Google Scholar]
- Huang, Y.; Dong, S.; Bai, Y. Spatiotemporal characteristics of the relationship between urban compactness and urban efficiency in China. Chinese Journal of Population, Resources and Environment 2015, 3, 64–73. [Google Scholar]
- Yao, Y.; et al. Do compact cities have higher efficiencies of agglomeration economies? Land Use Policy 2022, 115, 106005. [Google Scholar] [CrossRef]
- Shi, X.; et al. Impacts of urban form structure on carbon emission efficiency in China’s three major urban agglomerations. Sustainability 2025, 17, 3984. [Google Scholar] [CrossRef]
- Wang, F. Measurement and evaluation of the efficiency of urban green economy development in China based on SBM-GML model. Sustainable Development 2023, 13, 1–12. [Google Scholar] [CrossRef]
- Li, Z.; Shi, Y.; Wojewodzki, M.; Wei, Y.; Guo, M. The Impact of New-Type Urbanization Policy on Urban Green Total Factor Productivity: New Evidence from China. Sustainability 2024, 16, 5220. [Google Scholar] [CrossRef]
- Xu, S.; Liu, M.; Hua, P.; Chen, Y. How Has Land Restriction Policy Influenced Green Total Factor Productivity? Evidence from Chinese Cities. Land 2024, 13, 2249. [Google Scholar] [CrossRef]
- Wang, Y.; Bai, Y.; Quan, T.; Ran, R.; Hua, L. Influence and effect of industrial agglomeration on urban green total factor productivity—On the regulatory role of innovation agglomeration and institutional distance. Economic Analysis and Policy 2023, 78, 1023–1038. [Google Scholar] [CrossRef]
- Guan, H.; Wang, J.; Zhao, A. Free trade zone policies and green development: An empirical examination based on China’s free trade zone cities. Environment, Development and Sustainability 2024. [CrossRef]
- Tong, L.; Wang, P. (2021). Spatiotemporal evolution and trend prediction of green total factor productivity in the Beijing-Tianjin-Hebei urban agglomeration. Journal of Tongji University (Social Science Edition), 32(5), 76–82 + 124.
- Jia, M.Y.; Liu, X.Y.; Chen, T.; Wang, Y.; Li, J.; Sun, L.; et al. (2019). Measurement of urban density in Chinese prefecture-level and above cities. Urban Problems, (11), 4–12. [CrossRef]
- Li, J.; Xia, S.W. (2016). Measurement of urban density and analysis of multiple effects in mega-cities of China. Urban Development Studies, 23(11), 109–116.

Table 1.
Indicator System for Measuring Green Total Factor Productivity.
| Category | Indicator | Measurement | Unit |
| Input Indicators | Labor Input | The average number of employees on the payroll | Ten thousand persons |
| Capital Input | Stock of fixed capital in each prefecture-level city | Hundred million yuan | |
| Resource Input | Total electricity consumption in each prefecture-level city | Hundred million kilowatt-hours | |
| Output Indicators | Desired Output | Real Gross Domestic Product | Hundred million yuan |
| Undesired Output | Industrial Wastewater Emissions | Ton(s) | |
| Industrial SO₂ Emissions | Ton(s) | ||
| Industrial Particulate Emissions | Ton(s) |
Table 2.
Urban Density Measurement.
| First-level Indicator | Second-level Indicator | Computational method |
| Economic Compactness | GDP Density | District GDP per Urban Area |
| Fixed Asset Investment Ratio | District Fixed Asset Investment /District GDP | |
| Secondary and Tertiary Industry Value Added to GDP Ratio | Share of Secondary and Tertiary Industries in GDP | |
| Population Compactnessa | Urban Population Density | Urban Population /Urban Area |
| Non-agricultural Employment Ratio | Share of Secondary and Tertiary Industries in Total Employment | |
| Employment Density | Employment / Urban Area | |
| Land Use Compactness | Land Utilization Rate | Built-up Area / Constructed Land Area |
| Constructed Land per Capita | Constructed Land Area / Urban Population | |
| Residential Land Ratio | Residential Land Area / Constructed Land Area | |
| Transportation Compactness | Buses per Ten Thousand People | Buses per Urban Population at Year-end |
| Taxis per Ten Thousand People | Taxis per Urban Population at Year-end | |
| Road Area per Capita | Urban Road Area / Capita |
Table 3.
Descriptive Statistics of All Variables.
| Name | Sample | Min | Max | Mean | Standard Error | Median |
| GTFP | 190 | 0.243 | 1.000 | 0.611 | 0.281 | 0.487 |
| Comp | 190 | 0.063 | 0.491 | 0.180 | 0.104 | 0.134 |
| OPEN | 190 | 0.0014 | 0.413 | 0.075 | 0.096 | 0.036 |
| FAI | 190 | 0.088 | 0.816 | 0.382 | 0.162 | 0.342 |
| GDP | 190 | 0.078 | 3.916 | 0.932 | 0.762 | 0.704 |
| ES | 190 | 0.151 | 1.266 | 0.554 | 0.119 | 0.538 |
| GTI | 190 | 0.018 | 3.136 | 0.450 | 0.506 | 0.259 |
| ISGDP | 190 | 0.179 | 0.985 | 0.405 | 0.119 | 0.385 |
Table 4.
Multicollinearity Test.
| Terms | VIF Value | Tolerance |
| GTFP | 1.521 | 0.658 |
| COMP | 4.04 | 0.25 |
| OPEN | 3.411 | 0.293 |
| FAI | 4.391 | 0.228 |
| GDP | 1.836 | 0.545 |
| ES | 1.294 | 0.773 |
| ISGDP | 1.494 | 0.669 |
| GTI | 3.029 | 0.330 |
Table 5.
Hausman Test Results.
| Fixed | Random | Difference | Std. err. | |
| COMP | 0.6540237 | 0.4920713 | 0.1619524 | 0.0474337 |
| OPEN | 0.6555248 | 0.868878 | -0.2133532 | 0.0948815 |
| FAI | -0.6265612 | -0.5822432 | -0.044318 | 0.0279696 |
| GDP | 0.1634321 | 0.1312779 | 0.0321542 | 0.0083813 |
| ES | 0.5959216 | 0.5014658 | 0.0944559 | 0.0347071 |
| Test of H0: Difference in coefficients not systematic | ||||
| Prob > chi2 = 0.0003 | ||||
Table 6.
Regression Results.
| Variable Name | Results |
| COMP | 0.6539936 ** (2.12) |
| OPEN | 0.6558551*** (2.08) |
| FAI | -0.6266296*** (-3.19) |
| GDP | 0.1635069 *** (6.69) |
| ES | 0.5963981 *** (4.09) |
| _cons | 0.2013882** (2.14) |
| R2(within) | 0.3884 |
| F | 22.22*** |
| Sample Size (N) | 190 |
Note: ***, **, * denote significance at the 1%, 5%, and 10% levels, respectively.
Table 7.
Two-Sided Winsorization of the Core Explanatory Variable.
| Variable Name | Results |
| COMP | 0.6678539 ** (2.14) |
| OPEN | 0.6513715 ** (2.06) |
| FAI | -0.6287661*** (-3.20) |
| GDP | 0.163838 *** (6.70) |
| ES | 0.596667 *** (4.09) |
| _cons | 0.1997694** (2.12) |
| R2(within) | 0.3886 |
| F | 22.25*** |
| Sample Size (N) | 190 |
Note: ***, **, * denote significance at the 1%, 5%, and 10% levels, respectively.
Table 8.
Robust Regression Results.
| Variable Name | Results |
| COMP | 0.6539936 ** (2.28) |
| OPEN | 0.6558551*** (3.44) |
| FAI | -0.6266296*** (-3.43) |
| GDP | 0.1635069*** (6.70) |
| ES | 0.5963981*** (4.90) |
| _cons | 0.2013882*** (3.89) |
| R2(within) | 0.3884 |
| F | 46.60*** |
| Sample Size (N) | 190 |
Note: ***, **, * denote significance at the 1%, 5%, and 10% levels, respectively.
Table 9.
Bootstrap Test Results for the Mediation Effect.
| Term | c Total effect |
a | b | a*b | a*b (Boot SE) |
a*b (z value) |
a*b (p value) |
a*b (95% BootCI) |
c’ |
| Comp=>GTI=>GTFP | 0.653** | 0.977** | 0.371* | 0.363 | 0.055 | 6.587 | 0.000 | 0.036 ~ 0.255 | 0.290 |
Note: ***, **, * denote significance at the 1%, 5%, and 10% levels, respectively.
Table 10.
Heterogeneity Test Results by Economic Development Level.
| Variable Name | Higher-than-average economic development level | Lower-than-average economic development level |
| COMP | 1.701584*** (3.76) | 0.0576127 (0.12) |
| CONTROL | control | control |
| _cons | 0.6645051*** (4.68) | 0.1499312 (0.84) |
| R2(within) | 0.4273 | 0.4071 |
| F | 11.19*** | 11.67 *** |
| N | 90 | 100 |
Note: ***, **, * denote significance at the 1%, 5%, and 10% levels, respectively.
Table 11.
Threshold-Effect Regression Results.
| Variable Name | Results |
| COMP 0 1 |
0.606445* (2.15) 1.52941*** (4.22) |
| OPEN | 0.9724558 *** (5.38) |
| FAI | -0.7218389*** (-3.34) |
| GDP | 0.1450842*** (5.54) |
| ES | 0.6861586 *** (6.01) |
| _cons | 0.1506098 ** (2.52) |
| Threshold | 0.4641 |
| R2(within) | 0.4404 |
| F | 93.10*** |
| Sample Size (N) | 190 |
Note: ***, **, * denote significance at the 1%, 5%, and 10% levels, respectively.
Table 12.
Bootstrap Test Results of Threshold Effect.
| Threshold | RSS | MSE | Fstat | Prob | Crit10 | Ctit5 | Crit1 |
| Single | 8.0714 | 0.0472 | 15.91 | 0.0033 | 8.9855 | 10.2819 | 12.6431 |
Disclaimer/Publisher’s Note: The statements, opinions and data contained in all publications are solely those of the individual author(s) and contributor(s) and not of MDPI and/or the editor(s). MDPI and/or the editor(s) disclaim responsibility for any injury to people or property resulting from any ideas, methods, instructions or products referred to in the content. |
© 2025 by the authors. Licensee MDPI, Basel, Switzerland. This article is an open access article distributed under the terms and conditions of the Creative Commons Attribution (CC BY) license (http://creativecommons.org/licenses/by/4.0/).
Copyright: This open access article is published under a Creative Commons CC BY 4.0 license, which permit the free download, distribution, and reuse, provided that the author and preprint are cited in any reuse.


