Submitted:
20 June 2025
Posted:
23 June 2025
You are already at the latest version
Abstract
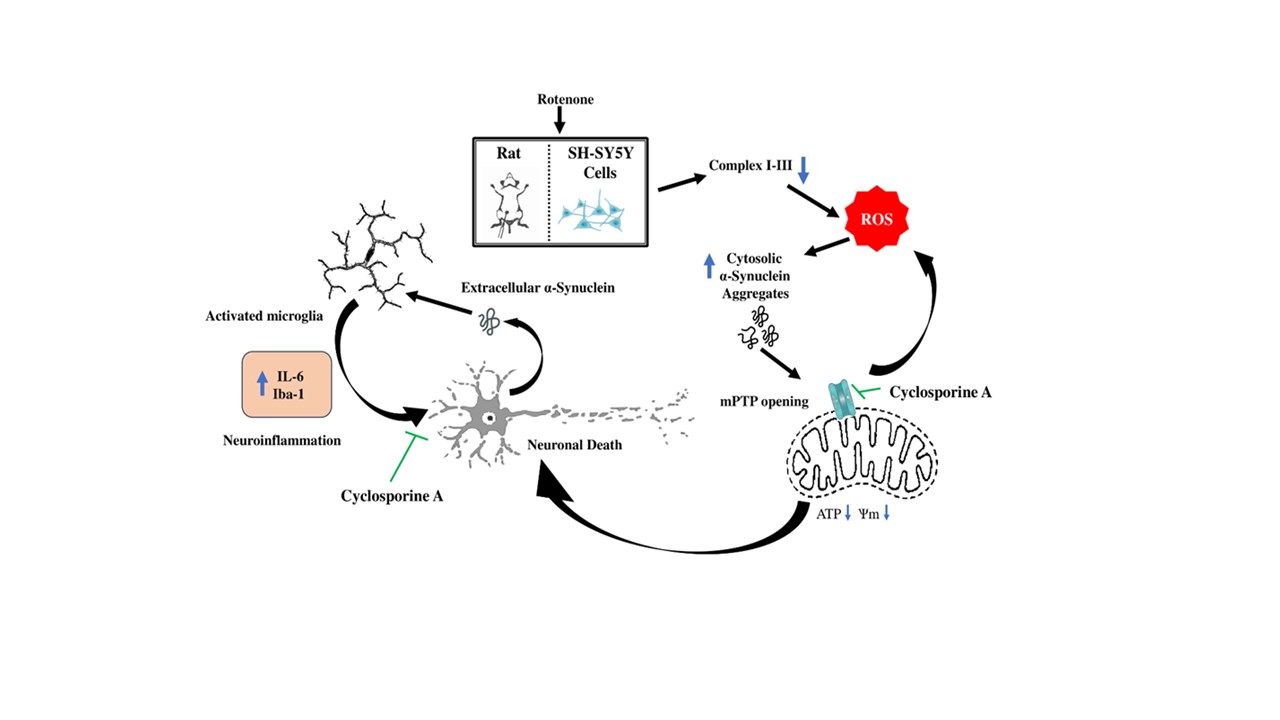
Rotenone, the inhibitor of mitochondrial complex I, is widely used to develop the experimental models of Parkinson’s disease, but the mechanism of neurotoxicity of rotenone is still not clearly established. In the current study we showed that rotenone mediated mitochondrial dysfunctions and cell death in SH-SY5Y cells (human neuroblastoma cell line) over an incubation period of 48 h are triggered by the accumulation of α-synuclein, and silencing of α-synuclein protein expression by specific siRNA abolished the cytotoxic effects of rotenone. Based on the current and earlier published data, the deleterious action of α-synuclein in SH-SY5Y cells has been ascribed to the activation of mitochondrial permeability transition pore (mPTP). In rotenone induced rat model of Parkinson’s disease, nigral dopaminergic neuronal death and altered functions of isolated midbrain mitochondria such as mitochondrial membrane depolarization, decreased ATP synthesis, increased ROS production and inhibition of complex I-III were observed which could be prevented markedly (except complex I-III inhibition) by cyclosporine A which is a well-known blocker of mPTP. The nigral accumulation of α-synuclein after rotenone treatment of rats, however, was not noticeably prevented by cyclosporine A. Additionally, cyclosporine A prevented neuroinflammation in the midbrain region of rotenone treated rats. These results have implications in the pathogenesis and also highlight the therapeutic potential of cyclosporine A for Parkinson’s disease.
Keywords:
mitochondria
; rotenone
; α-synuclein
; cyclosporine A
; neuroinflammation
; reactive oxygen species
1. Introduction
The pathogenesis of sporadic Parkinson’s disease (PD), the most prevalent form of the disease, presumably results from interactions among aging, genetic risk factors and multiple environmental and life-style factors [1,2]. Pathologically, the disease shows a characteristic loss of dopaminergic neurons in substantia nigra projecting into striatum which accounts for the motor disability in PD, but other parts of the brain and non-dopaminergic neurons are also affected; the appearance of cytoplasmic inclusions called Lewy bodies (LBs), primarily composed of the protein α-synuclein, in degenerating dopaminergic neurons is also a characteristic feature of PD pathology [3,4]. The underlying mechanisms of PD pathogenesis are not fully elucidated, but oxidative stress, mitochondrial dysfunctions, the accumulation and aggregation of α-synuclein, neuroinflammation through the activation of microglial cells, proteasomal and lysosomal impairment are some of the suggested mechanisms which interact in varied ways resulting in the neuronal death of PD [3,5,6]. These pathogenic mechanisms are suggested on the basis of post-mortem studies of PD brains and experiments with genetic or toxin-induced PD models.
Toxin-based models using animals or non-mammalian species or cultured primary mesencephalic neurons or dopaminergic cell lines commonly employ rotenone or 6-hydroxydopamine or 1-methyl-4-phenyl-1,2,3,6-tetrahydropyridine (MPTP); these have provided important clues not only in understanding PD pathogenesis, but also in identifying potential neuroprotective compounds for this disease [7,8] Rotenone induced animal models of PD, apart from showing the characteristic motor deficits and degeneration of nigrostriatal dopaminergic neurons, exhibit several important pathogenic characteristics of the disease such as mitochondrial complex I inhibition, α-synuclein accumulation and aggregation as well as neuroinflammation [9,10,11]. However, it is not clear how in the rotenone based model, the different PD-related pathogenic elements such as α-synuclein accumulation, oxidative stress, mitochondrial dysfunction and neuroinflammation are causally linked in a defined pathway to bring in the final neurodegeneration. In a recent study from our lab, we showed that in SH-SY5Y cells (dopaminergic human neuroblastoma cell line) the rotenone exposure for an extended period of 48 h caused cell death along with a loss of mitochondrial membrane potential, depletion of cellular ATP and enhanced production of reactive oxygen species (ROS); all these effects were markedly prevented by cyclosporine A implying that the activation of mitochondrial permeability transition pore (mPTP) in this process [12]. The structural organization of mPTP is not fully resolved, but its activation can lead to mitochondrial bioenergetic failure and enhanced formation of ROS with eventual cell death [13]. When tested in rotenone-based PD model of rats, cyclosporine A was able to rescue the motor deficits as well as the loss of dopaminergic neurons in the substantia nigra [12].
The current study delves deeper into the mechanisms of rotenone toxicity in experimental PD models using cell based and animal studies, and we have attempted to define a pathway by mechanistically linking the ROS production, accumulation of α-synuclein, mPTP activation, mitochondrial bioenergetic failure and eventual neuronal death and neuroinflammation. Additionally, the neuroprotective action of cyclosporine A against rotenone toxicity has been analyzed for a pre-clinical assessment of this drug as a possible therapeutic agent for PD.
2. Materials and Methods
2.1. Cell Culture
SH-SY5Y cells (ATCC, USA) were grown and maintained in cell culture flasks or multi-well plates in a mixture consisting of 2 volumes of DMEM and 1 volume of F12 Ham’s medium (Sigma, USA) containing 10% fetal bovine serum (FBS) (Gibco, USA), penicillin (50 units/mL), streptomycin (50 µg/mL) and amphotericin B (2.5 µg/mL) at 370 C under an atmosphere of 5% CO2 and 95% air; all incubations of cells for experimental purposes were conducted under similar conditions.
2.2. Transfection of Cells and Treatment Protocols
SH-SY5Y cells were either non-transfected (Wild-type) or transfected with α-synuclein specific siRNA to knock down the expression of α-synuclein protein (α-Syn KD) or transfected with scrambled siRNA (Scram). The transfection experiments were conducted using Xfect transfection kit (Takara, USA) following the manufacturer’s instructions as published earlier by us; the final siRNA concentration during the transfection was 12 nM [14]. The Wild-type, α-Syn KD and Scram cells were then incubated without or with 0.5 µM rotenone (Sigma, USA) at 370 C for 48 h and analyzed for cell death and mitochondrial functional parameters.
For some experiments, non-transfected SH-SY5Y cells were incubated at 370 C without any addition (control) or with rotenone (0.5 µM) in the absence or presence of cyclosporine A (1 µM) or N-acetylcysteine (2.5 mM) for 4 h or 48 h and analyzed for mitochondrial ROS production and intracellular α-synuclein accumulation.
2.3. Cell Death Assays
The cell death was assessed by a fluorometric method using double-staining with Hoechst 33258 (Sigma, USA) and propidium iodide (PI) (Sigma, USA) as well as the assay of lactate dehydrogenase (LDH) released in the medium.
In the fluorometric method, the membrane permeable Hoechst 33258 enters both live and dead cells and binds to double-stranded DNA in the nucleus emitting blue fluorescence; on the other hand, PI enters only the dead cells with compromised membrane integrity and binds to nuclear DNA by intercalation emitting red fluorescence. The higher ratio of red fluorescence to blue fluorescence is thus indicative of higher percentage of cell death. In brief, the floating and degenerating cells in each well were collected by centrifugation of the medium; the adherent cells were collected by the routine trypsinization protocol. Both fractions of the cells suspended in phosphate buffered saline (PBS) were combined followed by centrifugation, and the resultant pellet was treated with 70% methanol for 10 min for fixation of the cells. The cells were then washed twice with PBS, incubated for 20 min at 37°C in the dark with a staining solution containing 1 µg/ml Hoechst 33258 and 1 µM PI, followed by two more washings with PBS. The final cell pellet was re-suspended in 200 µL of PBS and fluorescence emissions were measured on a multi-mode microplate reader (Molecular Devices, USA) at λex 350 nm/λem 461 nm for Hoechst 33258 and ʎex 493 nm/ λem 636 nm for PI. The method was validated by using several well-known cytotoxic agents.
The assay of LDH released in the medium from the dead cells was performed as described in our earlier publication by a spectrophotometric method based on the pyruvate linked oxidation of NADH which was monitored by the decrease in absorbance at 340 nm [12].
2.4. Assessment of Mitochondrial Functional Parameters in SH-SY5Y Cells
The mitochondrial membrane potential was determined by using the fluorescence probe tetramethyl rhodamine ethyl ester or TMRE (Sigma, USA) as published earlier; the intracellular ATP content was estimated by the luciferin-luciferase based assay using a commercial kit (Sigma, USA) and utilizing a calibration curve of pure ATP following the procedure published earlier [12]. All values related to TMRE assay or the assay of ATP content were finally expressed as percentages with respect to the control.
Mitochondrial ROS production was measured by using the fluorogenic probe MitoSox red (Thermo Fisher, USA), a cationic derivative of dihydroethidium, which selectively accumulates within the mitochondria and gets oxidized by superoxide radicals to generate red fluorescence [15]. In brief, after removing the media the adherent cells in 12-well plates were gently washed twice with PBS, and subsequently incubated at 37˚C for 30 min in serum-free medium containing 5 μM MitoSOX red in the dark. At the end of the incubation, the cells were twice washed with PBS, and then covered with 500 μL of PBS. The fluoroscence was measured using a multi-mode microplate reader (ʎex 510 nm, ʎem 580 nm); the emission intensity was normalized to the protein content of the corresponding well and expressed as percentages relative to the control.
2.5. Immunoblotting of α-Synuclein
For some experiments, the cell lysates were analysed for α-synuclein content after performing immunoblotting experiments as adapted from earlier published procedure (14Ganguly et al., 2020). The rabbit polyclonal anti-α-synuclein antibody (Thermo Fisher, USA) was used as the primary antibody (1:1000 dilution), while horse radish peroxidase (HRP) – conjugated anti-rabbit IgG (Abcam, USA) was employed as the secondary antibody (1: 2000 dilution). The blot was developed by enhanced chemiluminescence method and imaged in a gel documentation system (Azure Biosystems, USA); ß-actin was used as the loading control.
2.6. Treatment Protocols for Animals
Wistar rats of both sexes, aged 6–8 months, were housed in polypropylene cages with free access to commercial rat chow and water and maintained under a 12-hour day/night cycle at 25°C ± 1°C. Rats, 51 in number, were randomly assigned to three groups of 17 animals using a computer-based random number generator: the control group (Con), the experimental group (Rot) treated with rotenone (Sigma, USA), and the experimental group (Rot + CsA) treated with both rotenone and cyclosporine A (obtained from hospital pharmacy as a proprietary drug). In the Con group, rats were injected intraperitoneally with sterile sunflower oil (98%) plus 2% dimethyl sulphoxide or DMSO (Himedia, India) for 8 consecutive days. In the Rot group, the animals were treated with rotenone for 8 consecutive days by intraperitoneal injections at a dose of 1.5 mg/kg body- weight, dissolved in 98% sterile sunflower oil and 2% DMSO. In the Rot + CsA group, rats were orally administered cyclosporine A at a dose of 10 mg/kg body weight daily, beginning 7 days prior to rotenone treatment and continuing throughout the 8-day period of intraperitoneal rotenone treatment at a dose of 1.5 mg/kg body- weight, dissolved in 98% sterile sunflower oil and 2% DMSO. The method was adopted from our earlier published work which also described the details of oral administration of cyclosporine A [12]. There was no mortality in any of the groups during the treatment schedule.
All animals were assessed by neurobehavioral tests in the beginning and at the end of the treatment schedule as described in our earlier publication [12]. Out of 17 animals in each group, 3 were sacrificed for immunohistochemical studies, 8 were sacrificed to determine the mitochondrial parameters and the remaining 6 were utilized to estimate the level of interleukin-6 (IL-6). Wherever statistical comparisons were involved, the number of animals in each group was determined by using the resource equation [16].
2.7. Immunohistochemical Staining
Immunohistochemical analysis of substantia nigra targeting tyrosine hydroxylase (TH), α-synuclein and microglial activation marker, ionized calcium binding adaptor molecule or Iba1, was conducted following established protocols [12]. In brief, the animal was anesthetized and the brain perfused with 4% paraformaldehyde in phosphate-buffered saline (PBS) to effectively clear blood from the cerebral vasculature; serial coronal sections of 15 μm thickness were obtained spanning the substantia nigra using a cryostat microtome (Leica, Germany) and collected on slides coated with poly-L-lysine (Sigma, USA) as described in earlier publication [12]. The sections were delicately washed with PBS to remove any debris or contaminants, treated with 3% hydrogen peroxide to quench endogenous peroxidase activity and finally subjected to a treatment with 10% methanol. For permeabilization, the sections were incubated for 30 min in PBS containing 0.1% Triton X-100 (Acros Organics, Belgium); following another wash in PBS, the sections were blocked with 5% bovine serum albumin (BSA, Himedia, India) in PBS for 1 h. The primary antibodies used for different targets were: a rabbit polyclonal primary antibody (Invitrogen, USA) diluted 1:2000 for α-synuclein, a mouse monoclonal antibody (Thermo Fisher, USA) diluted 1:100 for Iba1, a mouse monoclonal antibody (Santa Cruz, USA) diluted 1:50 for TH. The incubation with the primary antibody was at 4 0C overnight. The secondary antibodies were: fluorescein isothiocyanate (FITC)- conjugated goat anti-rabbit IgG (Genei, India) diluted 1:4000, for the detection of α-synuclein and horse radish peroxidase (HRP)-conjugated rabbit anti mouse- IgG (Abcam,USA, Cat no. ab6728), diluted 1:300, for the detection of TH and Iba1. Finally, images were captured using a fluorescence microscope (Carl Zeiss, Germany) for FITC-labelled secondary antibody or a light microscope (Labovision, India) for HRP-labelled secondary antibody employing a 3, 3′-diaminobenzidine (DAB)-based chromogen; multiple random images were captured from each section.
2.8. PI Staining of Brain Cryosections
The tissue sections were initially fixed with 70% ethanol for a duration of 10 minutes, followed by two subsequent rinses in PBS. Subsequently, the tissues were incubated with1 μM PI (Sigma, USA) solution in PBS for 20 minutes at 37°C. After the incubation period, the stained sections were washed in PBS to remove any excess dye. Finally, the sections were examined under a fluorescence microscope (Carl Zeiss, Germany), and multiple images were randomly captured for analysis.
2.9. Isolation of Brain Mitochondria
The animals were decapitated, brains removed over an ice-cold petri dish and quickly dissected to obtain midbrain and striatum. Mitochondria were isolated from the combined midbrain and striatal tissues by differential centrifugation and treatment with digitonin (SRL, India) as described in earlier publications [17]. The final mitochondrial pellet was resuspended either in the incubation buffer IB (145 mM KCl, 50 mM sucrose, 5 mM NaCl, 1 mM EGTA, 1 mM MgCl2, and 10 mM phosphate buffer, pH 7.4) or in 50 mM phosphate buffer, pH 7.4, as required for subsequent experiments.
2.10. Measurement of Mitochondrial Functional Parameters and ROS Production In Vitro
The membrane potential of isolated mitochondria was assessed using the mitochondrial membrane potential-sensitive fluorescence probe 5,5′,6,6′-tetrachloro-1,1′,3,3′-tetraethyl-benzamidazolocarbocyanine iodide (JC-1, Sigma, USA), following previously published procedures [17,18]. The monomeric JC-1 (λex 490 nm, λem 530 nm), a lipophilic positively charged fluorescent dye, accumulates within the mitochondria and forms aggregates (J-aggregates) with a shift in the emission spectrum (λex 490 nm, λem 590 nm). Aliquots of mitochondria were incubated at 37°C for 30 min in IB in the presence of 10 mM pyruvate, 10 mM succinate, 1 mM ADP and 5 μM JC-1. At the end of the incubation, the mitochondria were collected by centrifugation, washed twice with IB and suitably resuspended in the same buffer for the measurement of the fluorescence emission of J-aggregates in a multi-mode microplate reader (Molecular Devices, USA).
Aliquots of freshly prepared mitochondria in incubation buffer A were utilized for assessing ATP production in vitro during an incubation for 15 min in the presence of pyruvate (10 mM), succinate (10 mM), and ADP (1 mM); ATP was estimated luminometrically on a multi-mode microplate reader (Molecular Devices, USA) employing a luciferin-luciferase-based assay kit (Sigma, USA), in accordance with our previous publication [18].
The quantification of H2O2 production by isolated brain mitochondria was done using the fluorogenic dye N-acetyl-3,7-dihydroxyphenoxazine or Amplex Red (Sigma, USA) which reacts with H2O2 with high specificity in the presence of horseradish peroxidase generating a strongly fluorescent product [17]. Aliquots of mitochondria were incubated in IB containing 10 mM pyruvate, 10 mM succinate, and 1 mM ADP for 15 min at 37°C; the supernatant was collected by centrifugation and subsequently incubated for 10 min at room temperature with 50 μM Amplex Red and 1 U/ml horseradish peroxidase; the fluorescence emission was measured (λex 560 nm, λem 590 nm) in a spectrofluorometer (Jasco, Japan). The amount of H2O2 formed during the incubation period of 15 min was calculated using a calibration curve of H2O2 (50 to 500 nM) and the values were normalized to the protein content.
For the analysis of respiratory complexes, mitochondrial suspensions in 50 mM phosphate buffer, pH 7.4 and stored at -20°C were used within 3 days. A portion of the mitochondrial suspension was suitably diluted in 10 mM phosphate buffer, pH 7.4 followed by three cycles of freeze-thawing prior to the assay. Spectrophotometric determination of mitochondrial complex I-III and complex II-III activities were conducted as described in earlier publications [18,19].
2.11. Immunoassay of Interleukin-6 (IL-6) in Rat Brain
The midbrain and striatum were cleanly dissected out from the brain and homogenised in a buffer containing Tris (10 mM) and EDTA (1 mM), pH 7.4 containing phenylmethylsulphonyl fluoride or PMSF (0.2 mM); the homogenate was centrifuged at 16,000 x g and the resulting supernatant collected for the estimation of IL-6 according to the manufacturer’s instructions utilizing an enzyme-linked immunosorbent assay kit (Invitrogen, USA).
2.12. Protein Estimation
The protein was estimated in samples using bicinchoninic acid or BCA (Sigma, USA) assay.
2.13. Statistical Analysis
For all quantitative measurements, the statistical comparisons among three groups were made by one-way analysis of variance (ANOVA) followed by post-hoc Tukey’s test; the data normality was confirmed by Shapiro-Wilk test before applying the ANOVA. The number of animals used for each analysis is mentioned in the corresponding legend; a p value of ≤ 0.05 was considered statistically significant. The data analysis was performed by GraphPad Prism software (version 8.4).
3. Results
3.1. Knock Down of α-Synuclein Protein Expression Prevents Rotenone Toxicity
Non-transfected (Wild type) SH-SY5Y cells and those transfected with either α-synuclein-specific siRNA to reduce α-synuclein protein expression (α-Syn KD) or with scrambled siRNA (Scram), were exposed to rotenone (0.5 µM) for 48 h. The knock-down of α-synuclein protein expression was confirmed by immunoblottintg; in both Wild type and Scram cells, a distinct α-synuclein could be seen under basal condition (- rotenone) which was much enhanced after rotenone treatment (+ rotenone), but in α-Syn KD cells both in the absence or presence of rotenone, the α-synuclein band was barely visible as represented in Figure 1A. Figure 1B presents the full-blot view of α-synuclein band with molecular weight markers. Results presented in Figure 1C and Figure 1D show very dramatic cell death, measured by fluorometric dual staining method (PI / Hoechst 33258 ratio) and LDH release assay respectively, after 48 h of rotenone treatment for both Wild type and Scram cells, but in α-Syn KD cells rotenone induced cell death was completely abolished [one-way ANOVA among groups indicate statistically significant differences; Figure 1C: F5, 30 = 519.0, p < 0.0001; Figure 1D: F5, 30 = 495.6, p < 0.0001; Tukey’s post-hoc test in Figure 1C and Figure 1D: very significant effect (p<0.0001) of rotenone on cell death in Wild type and Scram cells, non-significant difference in cell death in α-Syn KD cells between rotenone treated (+ rotenone) and untreated (- rotenone) groups]. On examination of cell morphology under an inverted microscope (Figure 2), it was observed that rotenone induced a drastic change in cell morphology in Wild type and Scram cells but not in α-Syn KD cells (Figure 2).
3.2. α-Synuclein Knock Down Prevents Rotenone Induced Mitochondrial Impairment
Results in Figure 3A show that in non-transfected (Wild type) SH-SY5Y cells and in Scram cells (transfected with scrambled siRNA), an exposure to rotenone for 48 h caused a pronounced decrease in mitochondrial transmembrane potential compared to that in untreated cells; the knock down of α-synuclein protein expression (α-Syn KD cells), however, abolished the rotenone induced mitochondrial membrane depolarization [statistical comparisons by one-way ANOVA among different groups: F 5, 18 = 269.0, p < 0.0001; Tukey’s post-hoc test, highly significant (p<0.0001) effect of rotenone in Wild-type and Scram cells with respect to untreated (- rotenone) group, in α-synuclein KD cells non-significant difference, rotenone treated versus untreated groups].
There was a marked depletion of ATP content in Wild type and Scram cells on treatment with rotenone compared to untreated group, but in α-Syn KD cells the rotenone mediated ATP depletion was mitigated considerably (Figure 3B) [one-way ANOVA across all the groups: F5, 18 = 279.4, p < 0.0001; Tukey’s post-hoc test, very significant differences (p<0.0001) rotenone treated versus untreated groups in Wild-type and Scram cells, statistically non-significant (p = 0.0715) effect of rotenone in α-Syn KD cells].
A noticeable increase (around 7 fold more than the basal level) in mitochondrial ROS production was observed after 0.5 µM rotenone treatment of non-transfected (Wild type) cells for 48 h, and a similar effect of rotenone was observed in Scram cells; the rotenone induced enhancement of mitochondrial ROS production was, however, abolished in α-Syn KD cells transfected with α-synuclein specific siRNA (Figure 3C) [statistical comparisons using one-way ANOVA reveals group differences: F5, 30 = 319.7, p < 0.0001; Tukey’s post-hoc test, significant differences (p<0.0001) between rotenone treated and untreated groups for Wild type and Scram SH-SY5Y cells, non-significant difference (p = 0.9982) rotenone treated versus untreated groups for α-Syn KD cells].
3.3. ROS Production in Mitochondria and α-Synuclein Accumulation During Early and Late Phases of Rotenone Exposure
Results presented in Figure 4A and Figure 4B show that rotenone treatment caused a dramatic enhancement of mitochondrial ROS production in SH-SY5Y cells at early (4 h) and late (48 h) phases as measured by MitoSox Red assay; cyclosporine A significantly prevented the enhanced ROS formation following rotenone treatment only in the late phase, but not in the early phase. Statistical comparisons was performed by one-way ANOVA among different groups in Figure 4A (F2, 12 = 998.6, p<0.0001) followed by Tukey’s post-hoc analysis which revealed significant difference (p<0.0001) between control and rotenone treated cells, but non-significant (p=0.9757) difference in rotenone treated versus rotenone plus cyclosporine A treated cells. Likewise, one-way ANOVA showed significant group differences in Figure 4B (F2, 12 = 16100, p<0.0001) and Tukey’s post-hoc test revealed statistically very significant effect (p<0.0001) of rotenone with respect to control which was significantly (p<0.0001) prevented by cyclosporine A (Figure 4B).
The accumulation of α-synuclein at the early (4 h) and late (48 h) phases of rotenone exposure was examined by immunoblotting experiments as shown in the representative blot from a set of 3 independent experiments (Figure 4C). A noticeable accumulation of α-synuclein in SH-SY5Y cells after 4 h of incubation with rotenone occurred, which was further enhanced during 48 h of incubation; N-acetylcysteine, a general antioxidant, prevented the rotenone induced accumulation of α-synuclein very remarkably at both the time points (Figure 4C).
3.4. Mitochondrial Alterations in Rotenone-Treated Rats: Protection by Cyclosporine A
Mitochondria isolated from the midbrain and striatal regions were analysed for several functional parameters in vitro for three groups of rats such as control (Con), rotenone treated (Rot) and rotenone plus cyclosporine A co-treated rats (Rot + CsA). Mitochondrial complex I-III activity was expectedly diminished by around 46 percent after rotenone-treatment of rats, but cyclosporine A co-treatment of the rats (Rot + CsA) failed to overcome the rotenone-mediated inhibition of complex I-III activity with statistical significance (Figure 5A). [statistical analysis by one-way ANOVA (F2, 21 = 6.031, p = 0.0085), and post-hoc comparison by Tukey’s test, a statistically significant (p=0.0062) difference between the Con and Rot groups, non-significant (p=0.2626) difference between the Rot and Rot + CsA groups]. As shown in Figure 5B, the activities of mitochondrial complex II-III, unlike complex I-III, remained statistically similar in all three groups [statistical analysis by one-way ANOVA (F2, 15 = 0.5259, p=0.6016), Tukey’s post-hoc test, non-significant differences, (p=0.6201) Rot versus Con, (p=0.9904) Rot versus Rot + CsA].
In the Rot group the mitochondrial membrane potential was decreased by nearly 50 percent with respect to Con, but the decrease was prevented by the co-treatment with cyclosporine A in the Rot + CsA group (Figure 5C). Likewise in the Rot group the mitochondrial capacity to synthesize ATP was grossly diminished (by around 55 percent) with respect to Con group, but it was conspicuously prevented by cyclosporine A co-treatment (Rot + CsA) as shown in Figure 5D. The mitochondrial ROS production was found to be significantly higher (around 2.3-fold) in the Rot group animals than in the controls, but this phenomenon was markedly attenuated in the Rot + CsA animals (Figure 5E). Statistical analysis using one-way ANOVA was performed for 3 groups in each figure [Figure 5C: F2, 15 = 13.60, p = 0.0004; Figure 5D: F2, 15 = 16.21, p = 0.0002; Figure 5E (F2, 15 = 21.62, p< 0.0001] followed by Tukey’s post-hoc comparisons which revealed statistically very significant differences between Con and Rot groups in all mitochondrial parameters (p=0.0004 in Figure 5C, p=0.0002 in Figure 5D and p<0.0001 in Figure 5E) and a statistically significant prevention of rotenone effect on mitochondria by cyclosporine A (p=0.0077 in Figure 5C, p=0.0037 in Figure 5D and p=0.0023 in Figure 5E).
3.5. Dopaminergic Neuronal Death and α-Synuclein Accumulation in PD Rat Model
When the cryostat sections in the region of substantia nigra were examined for TH-positive dopaminergic neurons, a remarkable loss of TH-immunoreactivity could be seen in the Rot group; a conspicuous recovery of TH-positivity, however, was observed by the co-treatment with cyclosporine A in the Rot + CsA group of animals (Figure 6A). When the sections were stained with the membrane-impermeable PI and examined under the fluorescence microscope, numerous bright red fragmented nuclei from the dead neurons could be observed in the nigral region in the Rot group in comparison to Con animals; in the Rot + CsA animals the number of PI stained neurons was considerably decreased (Figure 6B). When the accumulation of α-synuclein was examined by the immunofluorescence imaging in the nigral region, a very distinct presence of α-synuclein aggregates with green fluorescence was noted both in the Rot and Rot + CsA groups in comparison to control animals apparently indicating that cyclosporine A treatment had no major effect on rotenone induced accumulation of α-synuclein (Figure 6C).
3.6. Microglial Activation and Neuroinflammation: Protection by Cyclosporine A
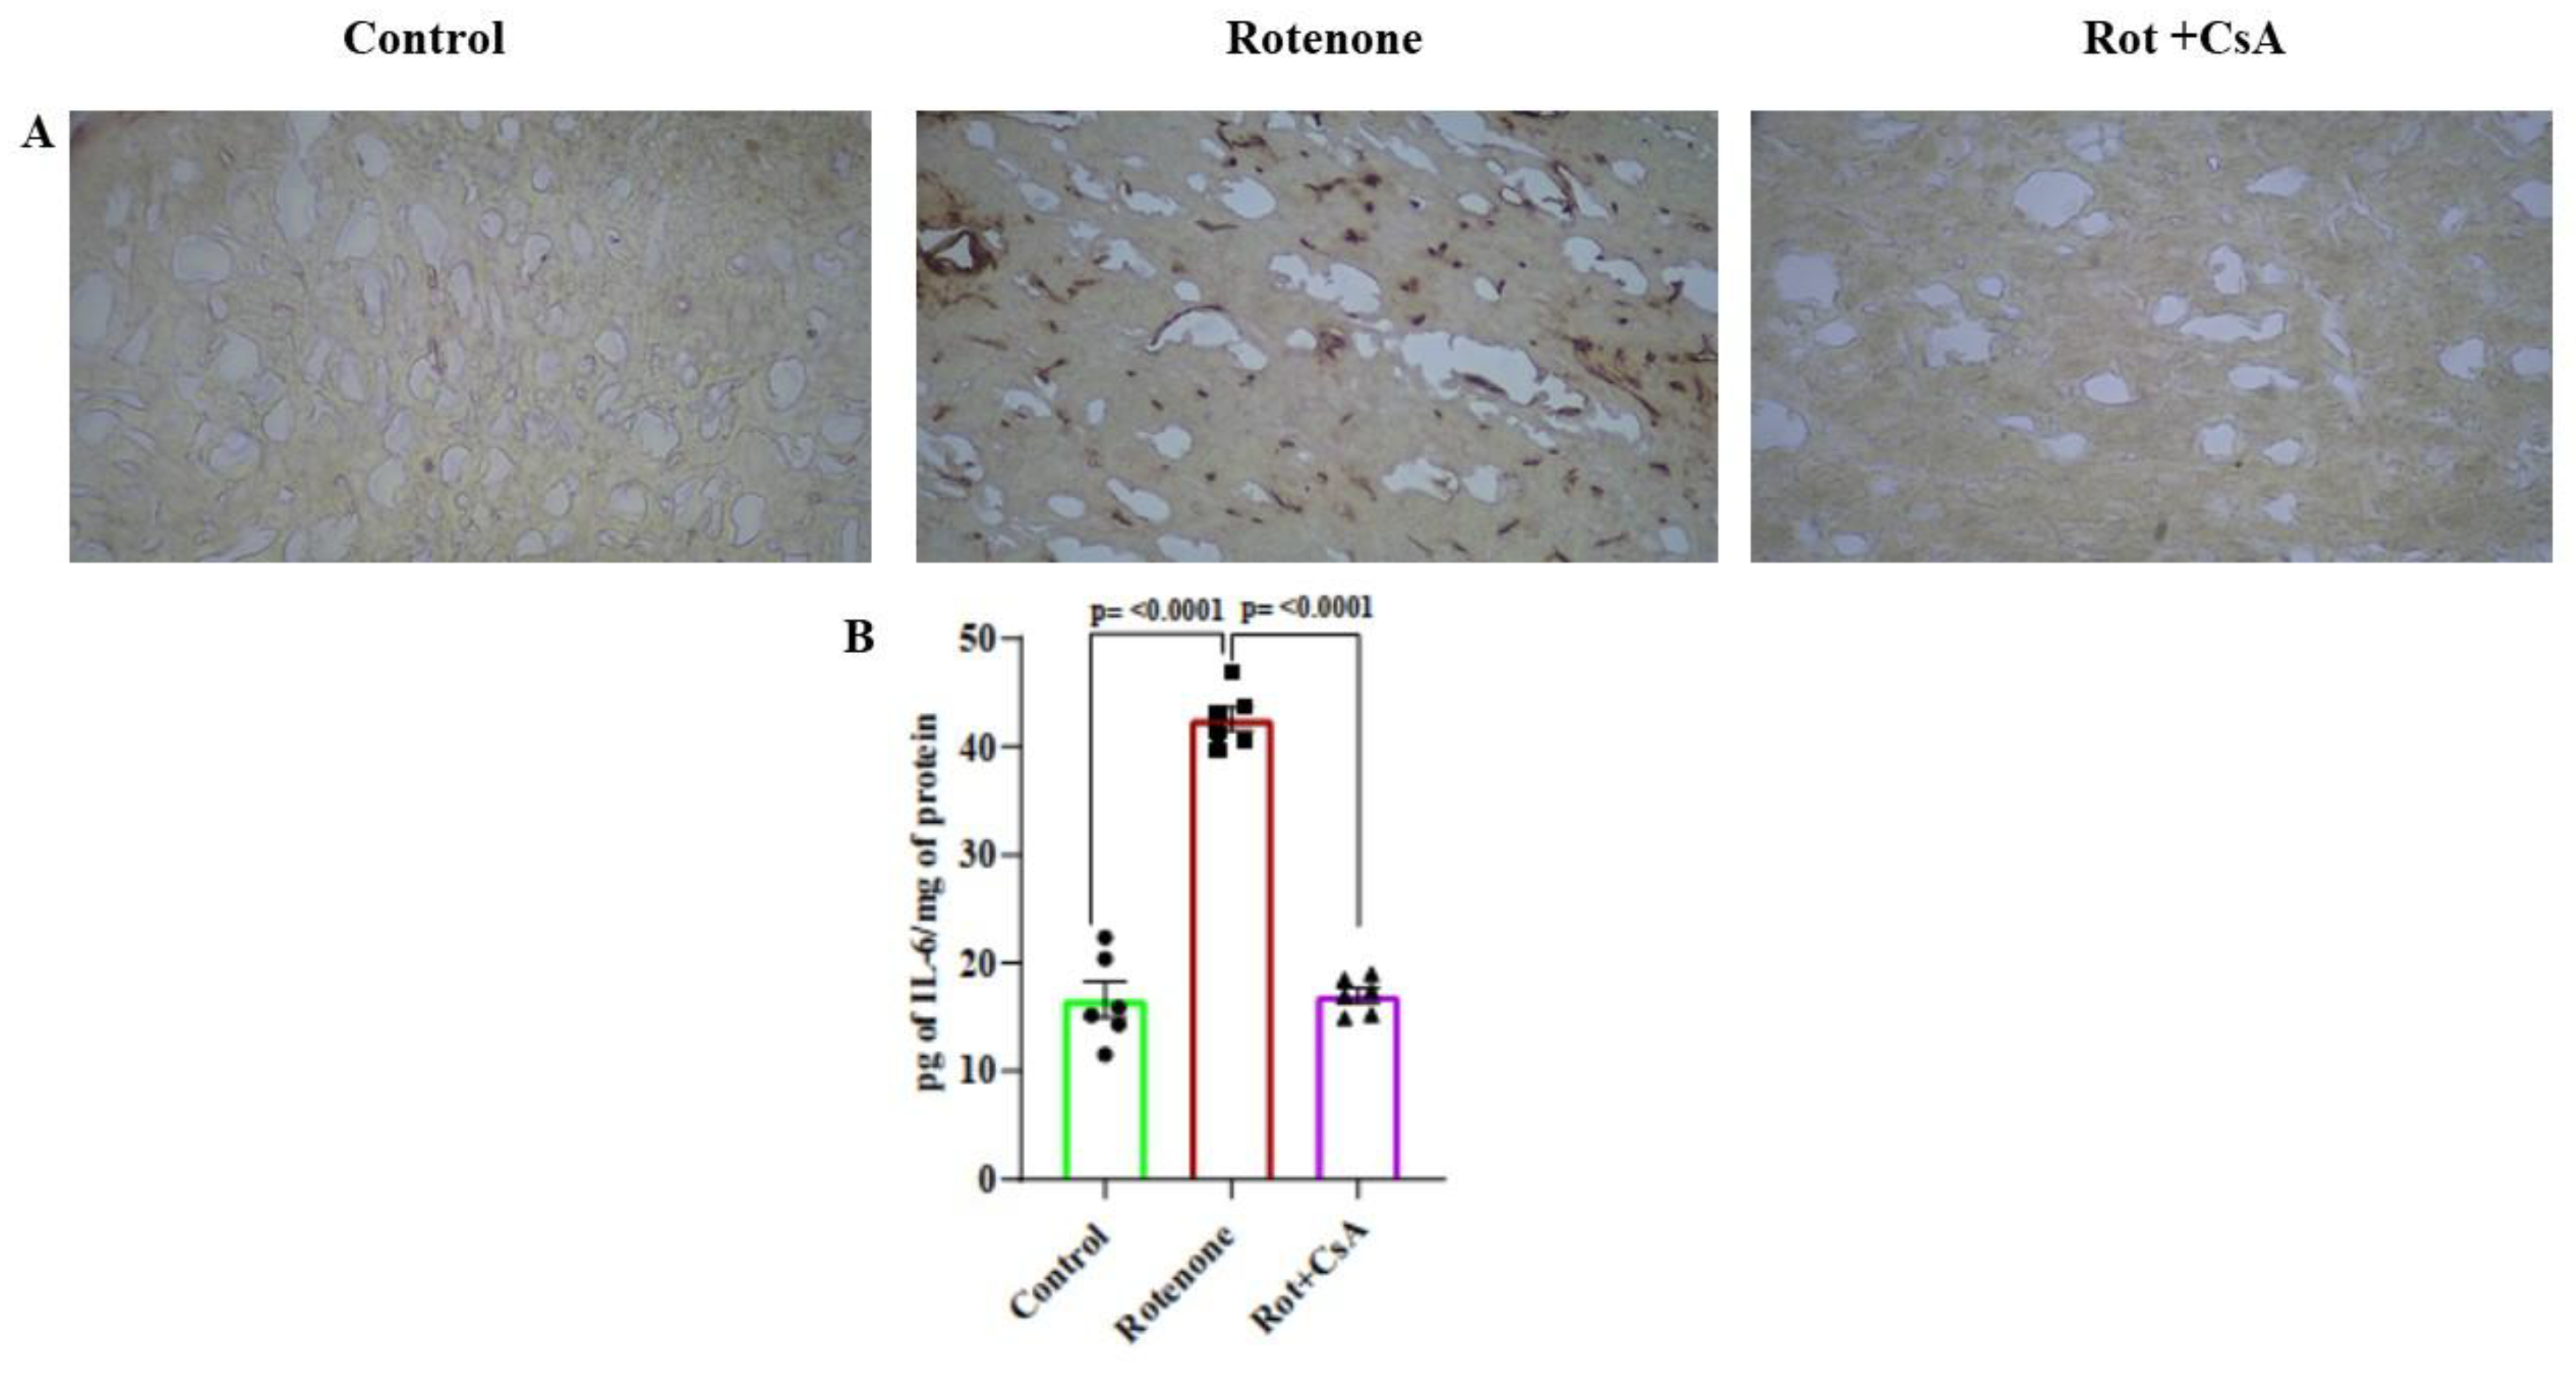
The microglial response was examined in the substantia nigra by immunostaining of glial activation antigen Iba1; in the Rot group of rats, a very prominent Iba1-immunoreactivity was noticed compared to control animals which was nearly abolished in the Rot + CsA group of rats (Figure 7A). As a marker of neuroinflammation, the level of IL-6 was estimated in the tissue from midbrain and striatal regions. A dramatic rise of IL-6 level (around 2.5-fold) was noticed in the Rot group compared to the Con group, which was prevented nearly completely by the co-treatment with cyclosporine A (Figure 7B)[statistical analysis by one-way ANOVA: F 2, 15 = 153.1, p < 0.0001 indicating significant differences among groups; Tukey’s post-hoc test, a statistically highly significant (p<0.0001) difference between Rot and Con groups, statistically very significant (p < 0.0001) protection against rotenone effect by cyclosporine A in Rot + CsA group].
4. Discussion
Our current results demonstrate the pivotal role of α-synuclein in rotenone toxicity as knocking down α-synuclein expression by specific siRNA prevents the death of SH-SY5Y cells, mitochondrial impairment and enhanced ROS production after 48 h of rotenone exposure (Figure 1, Figure 2 and Figure 3). In our earlier publication we showed that the mitochondrial membrane depolarization, depletion of intracellular ATP, increased ROS production and cell death induced in SH-SY5Y cells by rotenone could also be prevented markedly by the co-treatment of the cells with cyclosporine A indicating that activation of mPTP is crucial in rotenone cytotoxicity [12]. Thus, we are prompted to believe that the α-synuclein accumulation and its subsequent interaction with mPTP leading to the activation of this mega channel is a critical phenomenon in rotenone toxicity. Several earlier studies by different groups demonstrated direct interactions of α-synuclein with components of mPTP such as voltage-dependent anion channel (VDAC), adenine nucleotide translocase (ANT) and F-ATP synthase producing varied effects on mPTP [20,21,22,23]. The activation of mPTP is known to cause a burst of ROS production, loss of mitochondrial membrane potential and decreased ATP synthesis with eventual cell death by several regulated cell death pathways [13,24,25,26,27].
Further, in the current study it is observed that the enhanced mitochondrial ROS production is differentially sensitive to cyclosporine A in the early and late phase of rotenone exposure (Figure 4). In the early phase of rotenone exposure (4 h), cyclosporine A fails to prevent the increased ROS formation ruling out the involvement of mPTP activation, and presumably this is caused by the inhibition of complex I by rotenone (Figure 4). On the other hand, the later phase of mitochondrial ROS production at 48 h is markedly preventable by cyclosporine A implying that the activation of mPTP is involved in this phase (Figure 4). The early phase of ROS production (4 h), however, is sufficient to cause a noticeable accumulation of α-synuclein preventable by the general antioxidant N-acetylcysteine; presumably the accumulated α-synuclein interacts with mPTP causing further ROS release and more accumulation of α-synuclein at 48 h (Figure 4). The reason for ROS dependent accumulation of α-synuclein after rotenone treatment might be related to impaired proteasomal clearance of this protein as a result of Parkin inactivation which we observed in SH-SY5Y cells after exposure to ferric ammonium citrate in an earlier study [14]. Alternatively, a direct inactivation of proteasome by ROS in rotenone exposed HEK and SK-N-MC cells was also demonstrated by others [28]. Although the redox regulation of proteasome is complex, oxidative stress in many pathological conditions has been shown to impair proteasome function [29].
Under in vivo condition in our PD models in rats, rotenone treatment leads to profound mitochondrial alterations such as complex I-III inhibition, mitochondrial membrane depolarization, diminished capacity of ATP synthesis and an enhanced ROS production as examined in isolated midbrain mitochondria; the rotenone effects are prevented significantly by co-administration of oral cyclosporine A with the notable exception of the inhibition of complex I-III (Figure 5). These in vivo effects of rotenone on mitochondria are in agreement with our current results as well as those published earlier using SH-SY5Y cells [12]. On examination of TH (+) dopaminergic neurons in substantia nigra, it is observed that the rotenone induced loss of dopaminergic neurons is markedly prevented by co-administration of oral cyclosporine A (Figure 6). Taken together, the results from animal studies confirm the central role of mPTP activation with consequent mitochondrial bioenergetic failure in rotenone induced neuronal death in PD models. The results also emphasize the fact that complex I-III inhibition by rotenone per se is not responsible for neuronal death because cyclosporine A is capable of preventing the neuronal death without rescuing the complex I-III activity. Several earlier studies suggested that oxidative damage was a key element of rotenone toxicity in PD animal models which was attributed to the inhibition of complex I activity by this toxin [30,31]. However, our results have clearly shown that increased ROS production by isolated mitochondria from rotenone treated rats is substantially preventable by the co-treatment with cyclosporine A implying that the process to a large extent is consequent upon the opening of mPTP (Figure 5). Interestingly, the large number of PI-stained fragmented nuclei in substantia nigra in rotenone treated animals is indicative of an early apoptosis followed by a necrotic disruption of cell membranes; expectedly this is preventable by cyclosporine A (Figure 6). This finding is also in conformity of our earlier published results from SH-SY5Y cells where features of apoptosis and necrosis were apparent after rotenone treatment; this also agrees well with the involvement of mPTP activation which is linked to both apoptosis and necrosis [12,13]. Another important observation is the accumulation of α-synuclein in substantia nigra of rotenone treated rats which is in tune with our findings in SH-SY5Y cells; apparently cyclosporine A does not have a major effect on rotenone induced accumulation of α-synuclein in substantia nigra (Figure 6). Thus, the neuroprotective effect of cyclosporine A in rotenone treated rats is presumably mediated by blocking the activation of mPTP by the accumulated α-synuclein.
An important element of pathogenesis in clinical PD as well as in experimental PD models is neuroinflammation mediated by microglia and astrocytes with additional contribution from adaptive immune response from peripheral lymphocytes infiltrating the brain; the triggers and mechanisms of this neuroinflammation are varied and highly complex, and most importantly damaged neurons and microglia or astrocytes interact bidirectionally [32,33]. In our rat model of PD, α-synuclein oligomers or aggregates released from the dead dopaminergic neurons could serve as damage-associated molecular patterns (DAMPs) triggering neuroinflammation through activation of microglia [33,34,35,36]. Our results have shown that rotenone treatment leads to a strong microglial activation in the substantia nigra and a rise in the level pro-inflammatory cytokine (IL-6) in the midbrain area in the PD rat model which is considerably suppressed by cyclosporine A (Figure 7). It is conceivable that cyclosporine A by preventing neuronal death by blocking mPTP activation inhibits the release of intracellular α-synuclein aggregates and consequent inflammatory response in rotenone treated rats. Additionally, the immunosuppressive action of cyclosporine A may also contribute to the inhibition of neuroinflammation.
Taken together our current results establish the pivotal role of α-synuclein and mPTP in rotenone induced PD models in cultured neural cells and animals and also highlight the neuroprotective action of cyclosporine A in such models. The neuroprotective action of cyclosporine A in ischemic brain damage or traumatic brain injury has been documented in multiple animal models where the inhibition of mPTP activation by cyclosporine A has been highlighted [37,38,39]. Likewise in clinical cases of ischemic brain injury, cyclosporine A has shown some beneficial neuroprotective effect though the studies are limited in number [40]. Thus, the neuroprotective potential of cyclosporine A should also be explored vigorously in further pre-clinical studies for re-purposing this drug in the therapy of PD.
Author Contributions
Conceptualization: Sasanka Chakrabarti, Sukhpal Singh, Sankha Shubhra Chakrabarti, Bimal Kumar Agrawal; Methodology and Investigation: Sukhpal Singh, Aritri Bir, Arindam Ghosh, Rahul Thakur, Aman Chauhan, Rooma Devi; Supervision and Data Analysis: Sasanka Chakrabarti, Bimal Kumar Agrawal; Resources: Sasanka Chakrabarti, Amit Mittal, Sankha Shubhra Chakrabarti; Writing and Editing: Sukhpal Singh, Sasanka Chakrabarti, Sankha Shubhra Chakrabarti, Amit Mittal.
Funding
The work was supported by a research grant from Indian Council of Medical Research, New Delhi, India (Sanction No.5/4-5/191/Neuro/2019-NCD-I). The authors wish to thank the authority of Maharishi Markandeshwar (Deemed to be University) for the routine funding and administrative support.
Institutional Review Board Statement
The study was approved by the Animal Ethical Committee of the institute and conducted as per the guidelines (approval no. MMIMSR/961 dated 29.07.2022).
Conflict of Interest
The authors declare no potential conflict of interest.
Data Availability Statement
The data will be available from the corresponding author on reasonable request.
References
- Jankovic, J.; Tan, E.K. Parkinson’s disease: etiopathogenesis and treatment. J. Neurol. Neurosurg. Psychiatry 2020, 91, 795–808. [Google Scholar] [CrossRef] [PubMed]
- Blauwendraat, C.; Nalls, M.A.; Singleton, A.B. The genetic architecture of Parkinson’s disease. Lancet Neurol. 2020, 19, 170–178. [Google Scholar] [CrossRef] [PubMed]
- Hartmann, A. Postmortem studies in Parkinson’s disease. Dialogues Clin. Neurosci. 2004, 6, 281–293. [Google Scholar] [CrossRef] [PubMed]
- Stefanis, L. α-Synuclein in Parkinson’s disease. Cold Spring Harb. Perspect. Med. 2012, 2, a009399. [Google Scholar] [CrossRef]
- Morris, H.R.; Spillantini, M.G.; Sue, C.M.; Williams-Gray, C.H. The pathogenesis of Parkinson’s disease. Lancet 2024, 403, 293–304. [Google Scholar] [CrossRef]
- Schapira, A.H.; Jenner, P. Etiology and pathogenesis of Parkinson’s disease. Mov. Disord. 2011, 26, 1049–1055. [Google Scholar] [CrossRef]
- Blandini, F.; Armentero, M. Animal models of Parkinson’s disease. FEBS J. 2012, 279, 1156–1166. [Google Scholar] [CrossRef]
- Falkenburger, B.H.; Saridaki, T.; Dinter, E. Cellular models for Parkinson’s disease. J. Neurochem. 2016, 139, 121–130. [Google Scholar] [CrossRef]
- Betarbet, R.; Sherer, T.B.; MacKenzie, G.; Garcia-Osuna, M.; Panov, A.V.; Greenamyre, J.T. Chronic systemic pesticide exposure reproduces features of Parkinson’s disease. Nat. Neurosci. 2000, 3, 1301–1306. [Google Scholar] [CrossRef]
- Cannon, J.R.; Tapias, V.; Na, H.M.; Honick, A.S.; Drolet, R.E.; Greenamyre, J.T. A highly reproducible rotenone model of Parkinson’s disease. Neurobiol. Dis. 2009, 34, 279–290. [Google Scholar] [CrossRef]
- Li, C.; Chen, X.; Zhang, N.; Song, Y.; Mu, Y. Gastrodin inhibits neuroinflammation in rotenone-induced Parkinson’s disease model rats. Neural Regen. Res. 2012, 7, 325–331. [Google Scholar] [PubMed]
- Singh, S.; Ganguly, U.; Pal, S.; Chandan, G.; Thakur, R.; Saini, R.V.; Chakrabarti, S.S.; Agrawal, B.K.; Chakrabarti, S. Protective effects of cyclosporine A on neurodegeneration and motor impairment in rotenone-induced experimental models of Parkinson’s disease. Eur. J. Pharmacol. 2022, 929, 175129. [Google Scholar] [CrossRef]
- Kinnally, K.W.; Peixoto, P.M.; Ryu, S.-Y.; Dejean, L.M. Is mPTP the gatekeeper for necrosis, apoptosis, or both? Biochim. Biophys. Acta. 2011, 1813, 616–622. [Google Scholar] [CrossRef] [PubMed]
- Ganguly, U.; Banerjee, A.; Chakrabarti, S.S.; Kaur, U.; Sen, O.; Cappai, R.; Chakrabarti, S. Interaction of α-synuclein and Parkin in iron toxicity on SH-SY5Y cells: implications in the pathogenesis of Parkinson’s disease. Biochem. J. 2020, 477, 1109–1122. [Google Scholar] [CrossRef] [PubMed]
- Wang, Q.; Zou, M.-H. Measurement of reactive oxygen species (ROS) and mitochondrial ROS in AMPK knockout mice blood vessels. In: Neumann, D.; Viollet, B. (Eds.), Methods Mol. Biol. 2018, Springer New York, New York, NY, pp. 507–517.
- Charan, J.; Kantharia, N.D. How to calculate sample size in animal studies? J. Pharmacol. Pharmacother. 2013, 4, 303–306. [Google Scholar] [CrossRef]
- Jana, S.; Sinha, M.; Chanda, D.; Roy, T.; Banerjee, K.; Munshi, S.; Patro, B.S.; Chakrabarti, S. Mitochondrial dysfunction mediated by quinone oxidation products of dopamine: implications in dopamine cytotoxicity and pathogenesis of Parkinson’s disease. Biochim. Biophys. Acta. 2011, 1812, 663–673. [Google Scholar] [CrossRef]
- Banerjee, K.; Sinha, M.; Pham, C.L.L.; Jana, S.; Chanda, D.; Cappai, R.; Chakrabarti, S. α-Synuclein induced membrane depolarization and loss of phosphorylation capacity of isolated rat brain mitochondria: implications in Parkinson’s disease. FEBS Lett. 2010, 584, 1571–1576. [Google Scholar] [CrossRef]
- Bagh, M.B.; Thakurta, I.G.; Biswas, M.; Behera, P.; Chakrabarti, S. Age-related oxidative decline of mitochondrial functions in rat brain is prevented by long term oral antioxidant supplementation. Biogerontology 2011, 12, 119–131. [Google Scholar] [CrossRef]
- Zhu, Y.; Duan, C.; Lü, L.; Gao, H.; Zhao, C.; Yu, S.; Uéda, K.; Chan, P.; Yang, H. α-Synuclein overexpression impairs mitochondrial function by associating with adenylate translocator. Int. J. Biochem. Cell Biol. 2011, 43, 732–741. [Google Scholar] [CrossRef]
- Bernardi, P.; Di Lisa, F.; Fogolari, F.; Lippe, G. From ATP to PTP and back: a dual function for the mitochondrial ATP synthase. Circ. Res. 2015, 116, 1850–1862. [Google Scholar] [CrossRef]
- Rostovtseva, T.K.; Gurnev, P.A.; Protchenko, O.; Hoogerheide, D.P.; Yap, T.L.; Philpott, C.C.; Lee, J.C.; Bezrukov, S.M. α-Synuclein shows high affinity interaction with voltage-dependent anion channel, suggesting mechanisms of mitochondrial regulation and toxicity in Parkinson disease. J. Biol. Chem. 2015, 290, 18467–18477. [Google Scholar] [CrossRef] [PubMed]
- Ludtmann, M.H.R.; Angelova, P.R.; Horrocks, M.H.; Choi, M.L.; Rodrigues, M.; Baev, A.Y.; Berezhnov, A.V.; Yao, Z.; Little, D.; Banushi, B.; et al. α-Synuclein oligomers interact with ATP synthase and open the permeability transition pore in Parkinson’s disease. Nat. Commun. 2018, 9, 2293. [Google Scholar] [CrossRef] [PubMed]
- Batandier, C.; Leverve, X.; Fontaine, E. Opening of the mitochondrial permeability transition pore induces reactive oxygen species production at the level of the respiratory chain complex I. J. Biol. Chem. 2004, 279, 17197–17204. [Google Scholar] [CrossRef] [PubMed]
- Zorov, D.B.; Juhaszova, M.; Sollott, S.J. Mitochondrial reactive oxygen species (ROS) and ROS-induced ROS release. Physiol. Rev. 2014, 94, 909–950. [Google Scholar] [CrossRef]
- Kwong, J.Q.; Molkentin, J.D. Physiological and pathological roles of the mitochondrial permeability transition pore in the heart. Cell Metab. 2015, 21, 206–214. [Google Scholar] [CrossRef]
- Redza-Dutordoir, M.; Averill-Bates, D.A. Activation of apoptosis signalling pathways by reactive oxygen species. Biochim. Biophys. Acta. 2016, 1863, 2977–2992. [Google Scholar] [CrossRef]
- Chou, A.P.; Li, S.; Fitzmaurice, A.G.; Bronstein, J.M. Mechanisms of rotenone-induced proteasome inhibition. Neurotoxicology 2010, 31, 367–372. [Google Scholar] [CrossRef]
- Lefaki, M.; Papaevgeniou, N.; Chondrogianni, N. Redox regulation of proteasome function. Redox Biol. 2017, 13, 452–458. [Google Scholar] [CrossRef]
- Sherer, T.B.; Betarbet, R.; Testa, C.M.; Seo, B.B.; Richardson, J.R.; Kim, J.H.; Miller, G.W.; Yagi, T.; Matsuno-Yagi, A.; Greenamyre, J.T. Mechanism of toxicity in rotenone models of Parkinson’s disease. J. Neurosci. 2003, 23, 10756–10764. [Google Scholar] [CrossRef]
- Testa, C.M.; Sherer, T.B.; Greenamyre, J.T. Rotenone induces oxidative stress and dopaminergic neuron damage in organotypic substantia nigra cultures. Brain Res. Mol. Brain Res. 2005, 134, 109–118. [Google Scholar] [CrossRef]
- Tansey, M.G.; Wallings, R.L.; Houser, M.C.; Herrick, M.K.; Keating, C.E.; Joers, V. Inflammation and immune dysfunction in Parkinson disease. Nat. Rev. Immunol. 2022, 22, 657–673. [Google Scholar] [CrossRef]
- Weiss, F.; Labrador-Garrido, A.; Dzamko, N.; Halliday, G. Immune responses in the Parkinson’s disease brain. Neurobiol. Dis. 2022, 168, 105700. [Google Scholar] [CrossRef]
- Standaert, D.G.; Childers, G.M. Alpha-synuclein–mediated DNA damage, STING activation, and neuroinflammation in Parkinson’s disease. Proc. Natl. Acad. Sci. U.S.A. 2022, 119, e2204058119. [Google Scholar] [CrossRef] [PubMed]
- Gao, C.; Jiang, J.; Tan, Y.; Chen, S. Microglia in neurodegenerative diseases: mechanism and potential therapeutic targets. Signal. Transduct. Target. Ther. 2023, 8, 359. [Google Scholar] [CrossRef] [PubMed]
- Yildirim-Balatan, C.; Fenyi, A.; Besnault, P.; Gomez, L.; Sepulveda-Diaz, J.E.; Michel, P.P.; Melki, R.; Hunot, S. Parkinson’s disease-derived α-synuclein assemblies combined with chronic-type inflammatory cues promote a neurotoxic microglial phenotype. J. Neuroinflammation 2024, 21, 54. [Google Scholar] [CrossRef]
- Leger, P.-L.; De Paulis, D.; Branco, S.; Bonnin, P.; Couture-Lepetit, E.; Baud, O.; Renolleau, S.; Ovize, M.; Gharib, A.; Charriaut-Marlangue, C. Evaluation of cyclosporine A in a stroke model in the immature rat brain. Exp. Neurol. 2011, 230, 58–66. [Google Scholar] [CrossRef]
- Nighoghossian, N.; Ovize, M.; Mewton, N.; Ong, E.; Cho, T.-H. Cyclosporine A, a potential therapy of ischemic reperfusion injury. A common history for heart and brain. Cerebrovasc. Dis. 2016, 42, 309–318. [Google Scholar] [CrossRef] [PubMed]
- Hansson, M.J.; Elmér, E. Cyclosporine as therapy for traumatic brain injury. Neurother. 2023, 20, 1482–1495. [Google Scholar] [CrossRef]
- Matsumoto, S.; Murozono, M.; Kanazawa, M.; Nara, T.; Ozawa, T.; Watanabe, Y. Edaravone and cyclosporine A as neuroprotective agents for acute ischemic stroke. Acute Med. Surg. 2018, 5, 213–221. [Google Scholar] [CrossRef]
Figure 1.
α-Synuclein knock-down in SH-SY5Y cells prevents rotenone induced cell death. Cells were either non-transfected or Wild-type or transfected with α-synuclein-specific siRNA (α-Syn KD) or transfected with scrambled siRNA (Scram). The cells were incubated without or with 0.5 µM rotenone for 48 h and analyzed for α-synuclein protein expression and cell death. A: A typical blot showing α-synuclein protein in Wild-type, Scram and α-synuclein KD cells without or with exposure to rotenone; β-actin loading control is also seen. B: A full blot view of α-synuclein protein with molecular weight (MW) markers in kDa. C: Cell death assay by fluorometric double staining method (PI/Hoechst 33528). D: Cell death measurement by LDH release assay (expressed as % of wild type without rotenone treatment); n=6, means ± SEM.
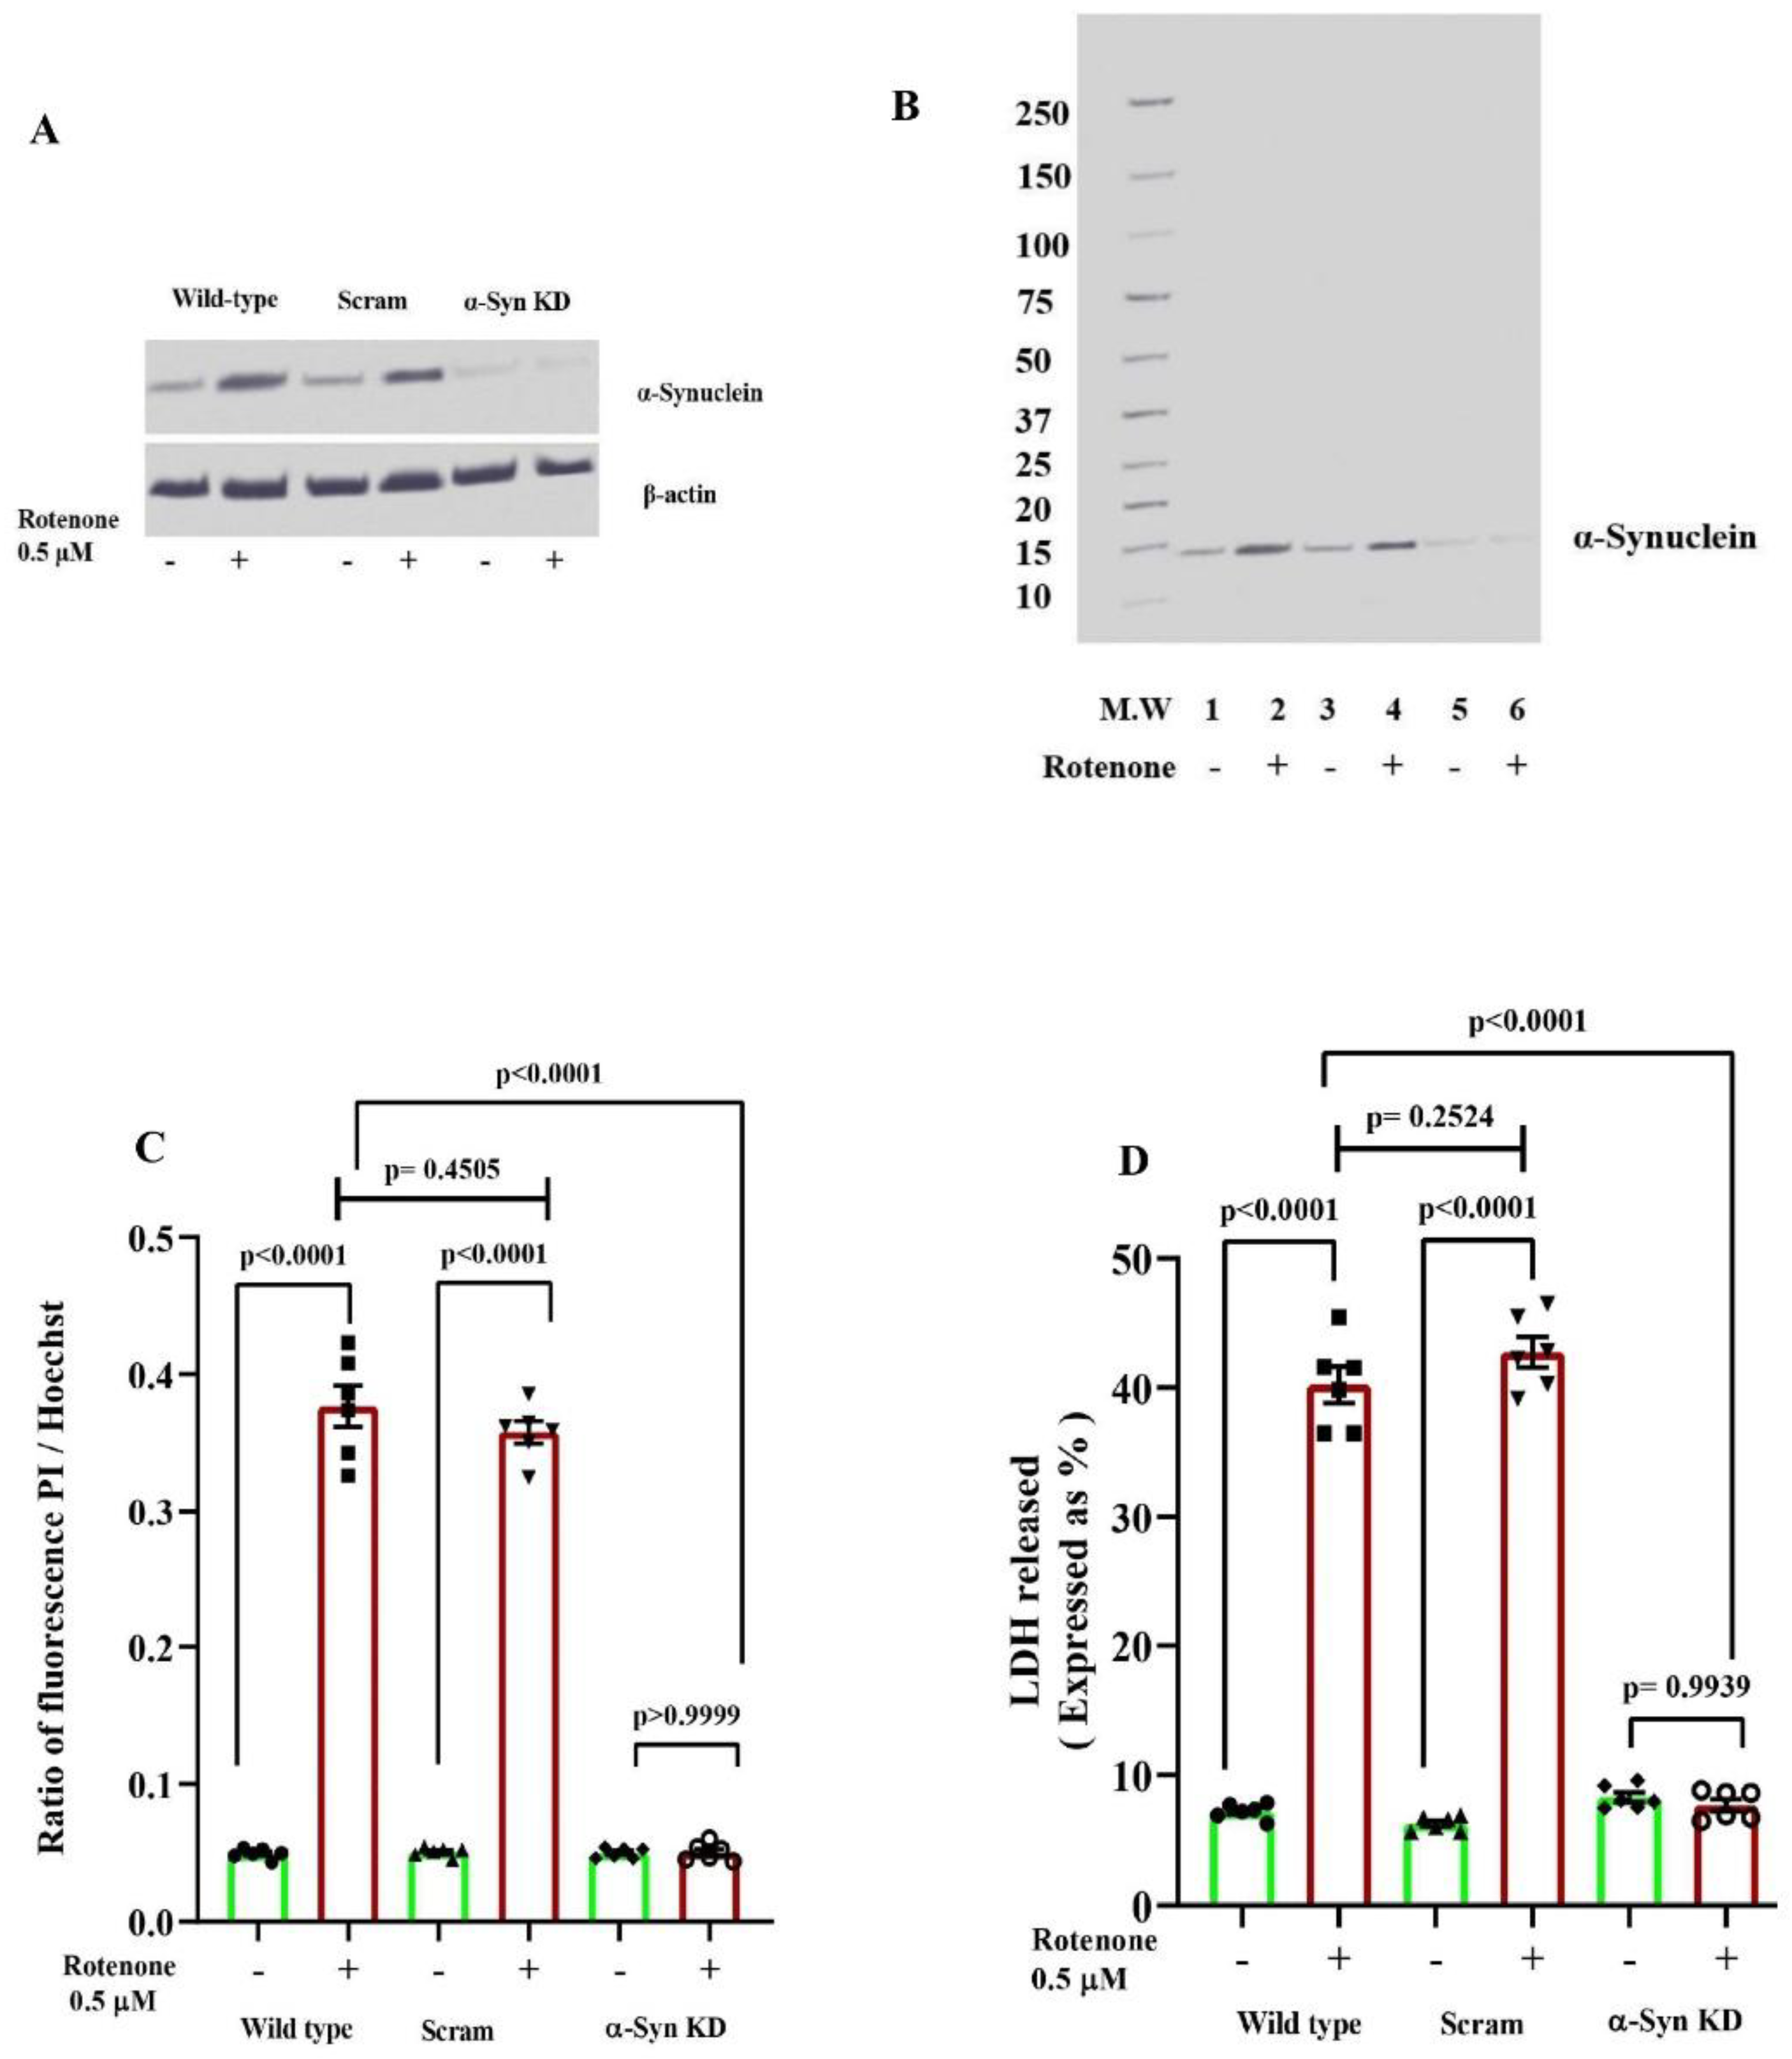
Figure 2.
α-Synuclein knock-down prevents rotenone cytotoxicity in SH-SY5Y cells. Morphology of cells (Wild-type, α-Syn KD and Scram) was examined under bright field inverted microscopy after 48 h of rotenone treatment as described in the text. Upper panel: cells without rotenone treatment (- Rot); Lower panel: cells exposed to rotenone (+ Rot).
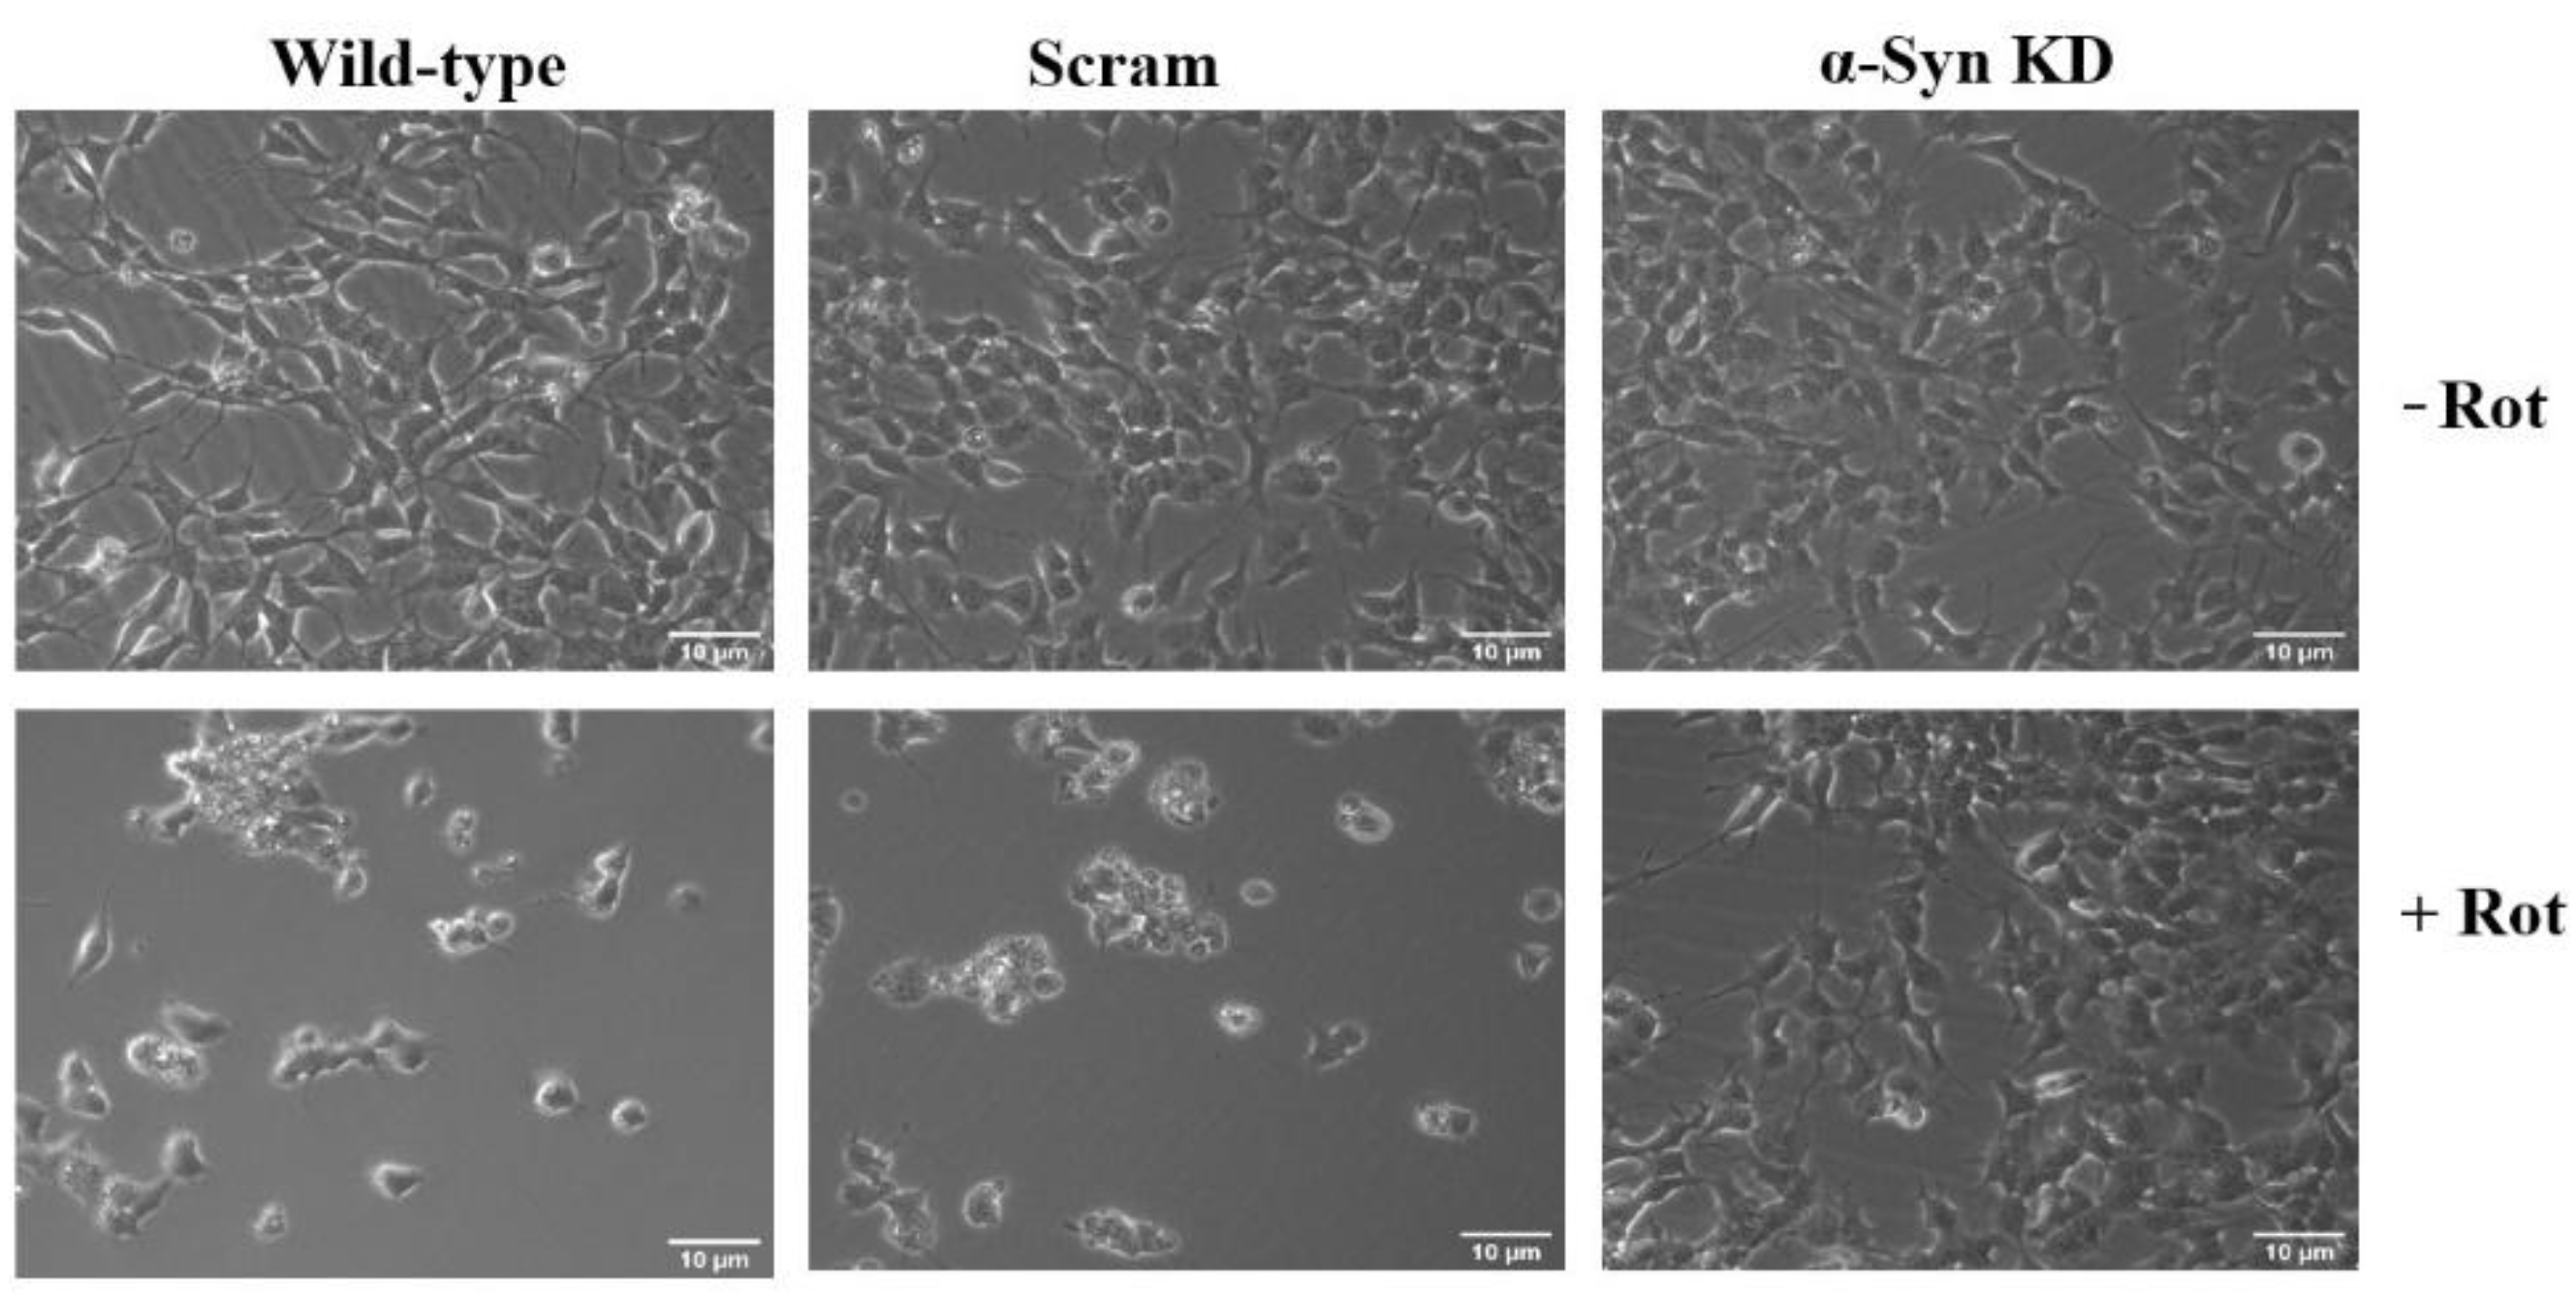
Figure 3.
Silencing of α-synuclein expression prevents mitochondrial dysfunctions on rotenone exposure. Non-transfected (Wild-type) or transfected with α-synuclein-specific siRNA (α-Syn KD) or transfected with scrambled siRNA (Scram) cells were incubated for 48 h without or with rotenone and analysed for mitochondrial functions; mitochondrial ROS using the MitoSox Red assay (A), membrane depolarization by TMRE assay (B), and ATP level with the luciferin-luciferase assay (C) were determined. Values are calculated as % of Wild- type without rotenone treatment. Results are presented as the means ± SEM from six (A) and four (B, C) independent experiments.
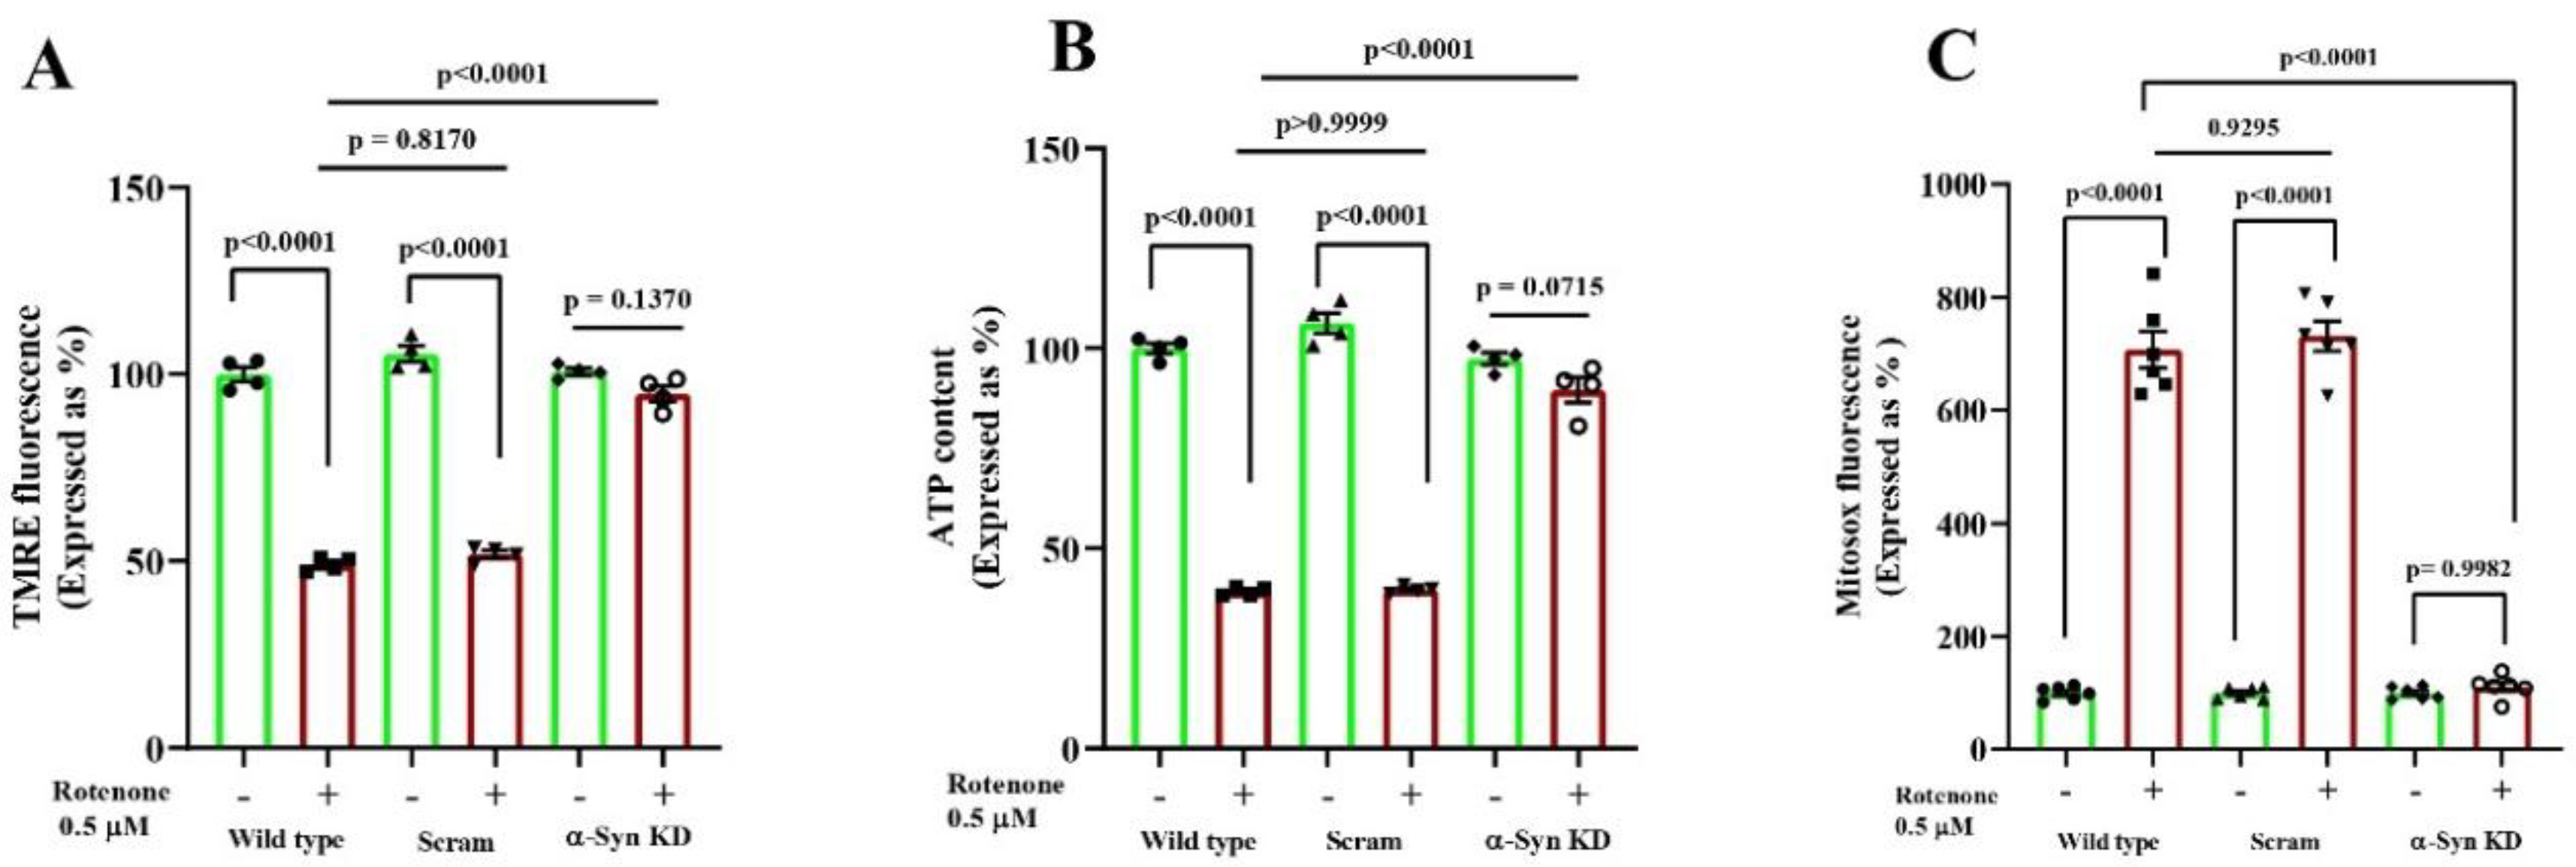
Figure 4.
ROS production and α-synuclein accumulation in SH-SY5Y cells during early and late phases of rotenone treatment. A and B: Control, rotenone treated and rotenone plus cyclosporine A co-treated (Rot + CsA) SH-SY5Y cells were incubated for 4 h or 48 h following which ROS production was measured using the MitoSox Red assay. The values (calculated as % of the control) are presented as the means ± SEM of 5 independent observations. C: Control, rotenone treated as well as rotenone plus N-acetylcysteine co-treated (Rot + NAC) cells were incubated for 4 h or 48 h followed by immunoblotting for α-synuclein. A representative blot (from three similar experiments) with β-actin as the loading control is presented for both the time points.
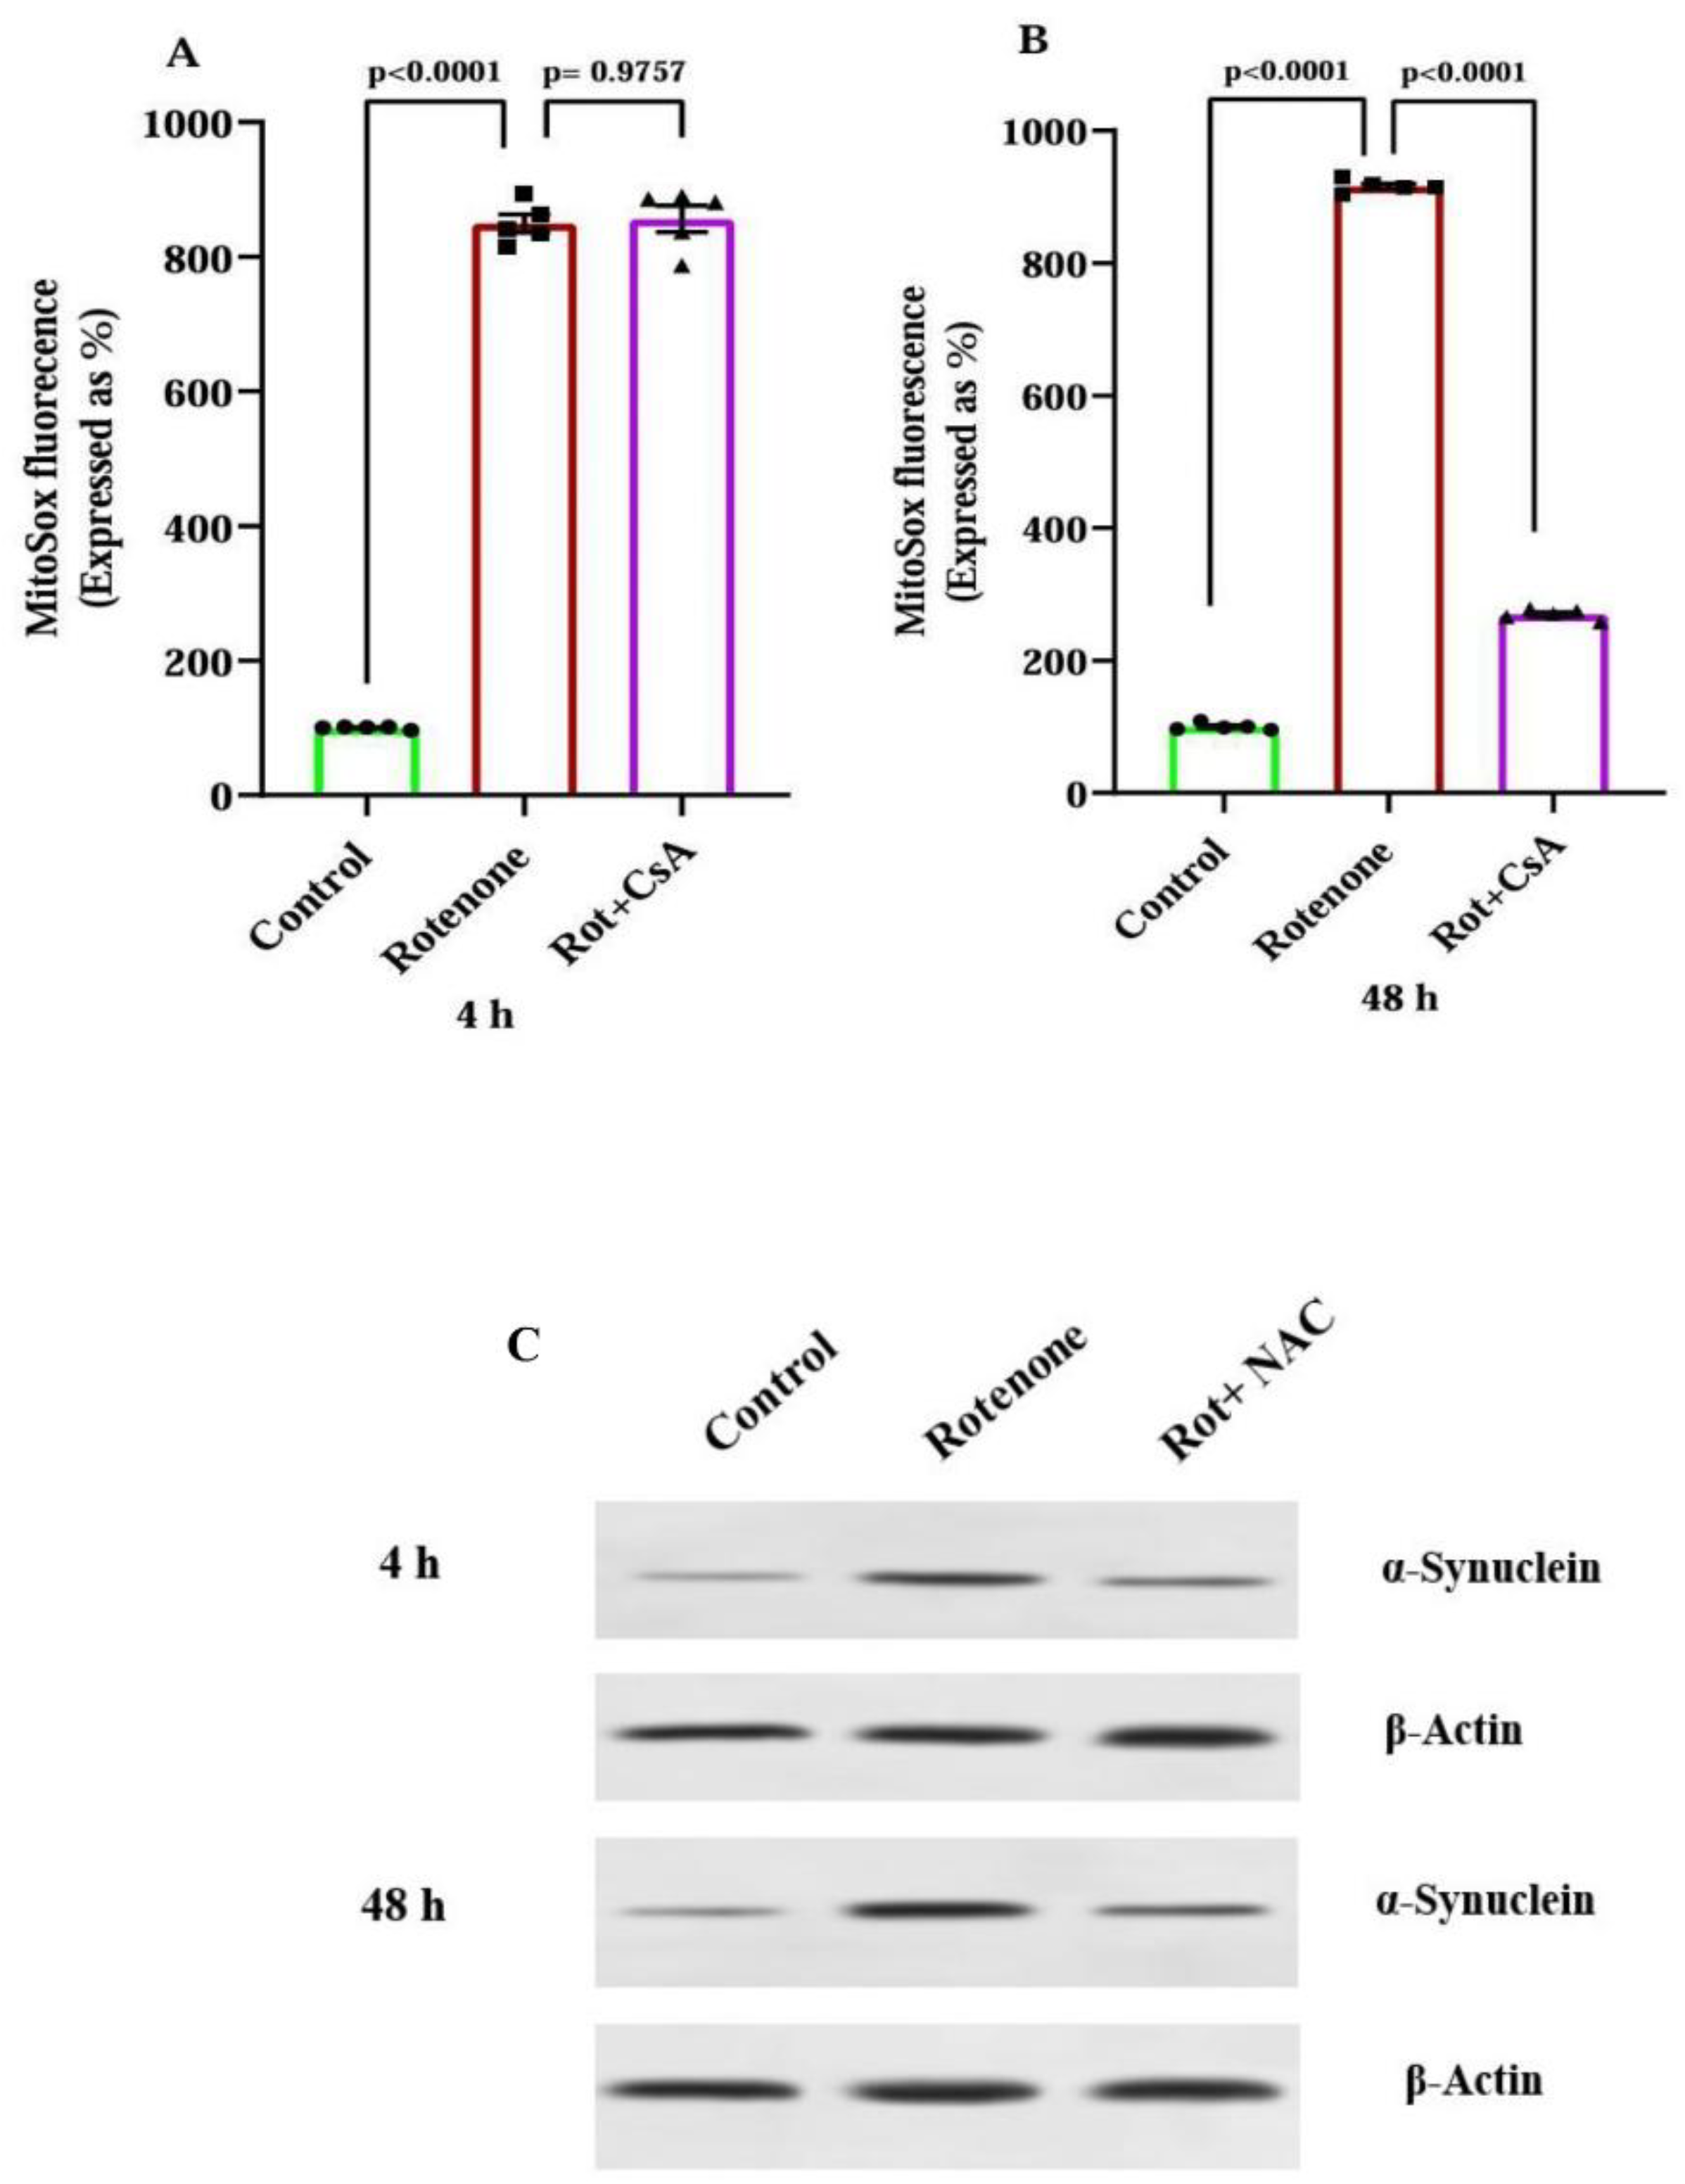
Figure 5.
Mitochondrial alterations in rotenone induced PD rat model: protection by cyclosporine A. Mitochondria were separated from the brain tissue(midbrain and striatum) from control (Con), rotenone treated (Rot), and rotenone + cyclosporine A treated (Rot + CsA) rats. Mitochondrial functional parameters were analyzed in vitro; complex I-III activity (A), complex II-III activity (B), transmembrane potential using JC-1 assay (C), ATP synthesis rate (D) and H2O2 production using the Amplex Red assay (E) were determined; values are the means ± SEM, n=8 in (A), n=6 in (B), (C), (D), (E).
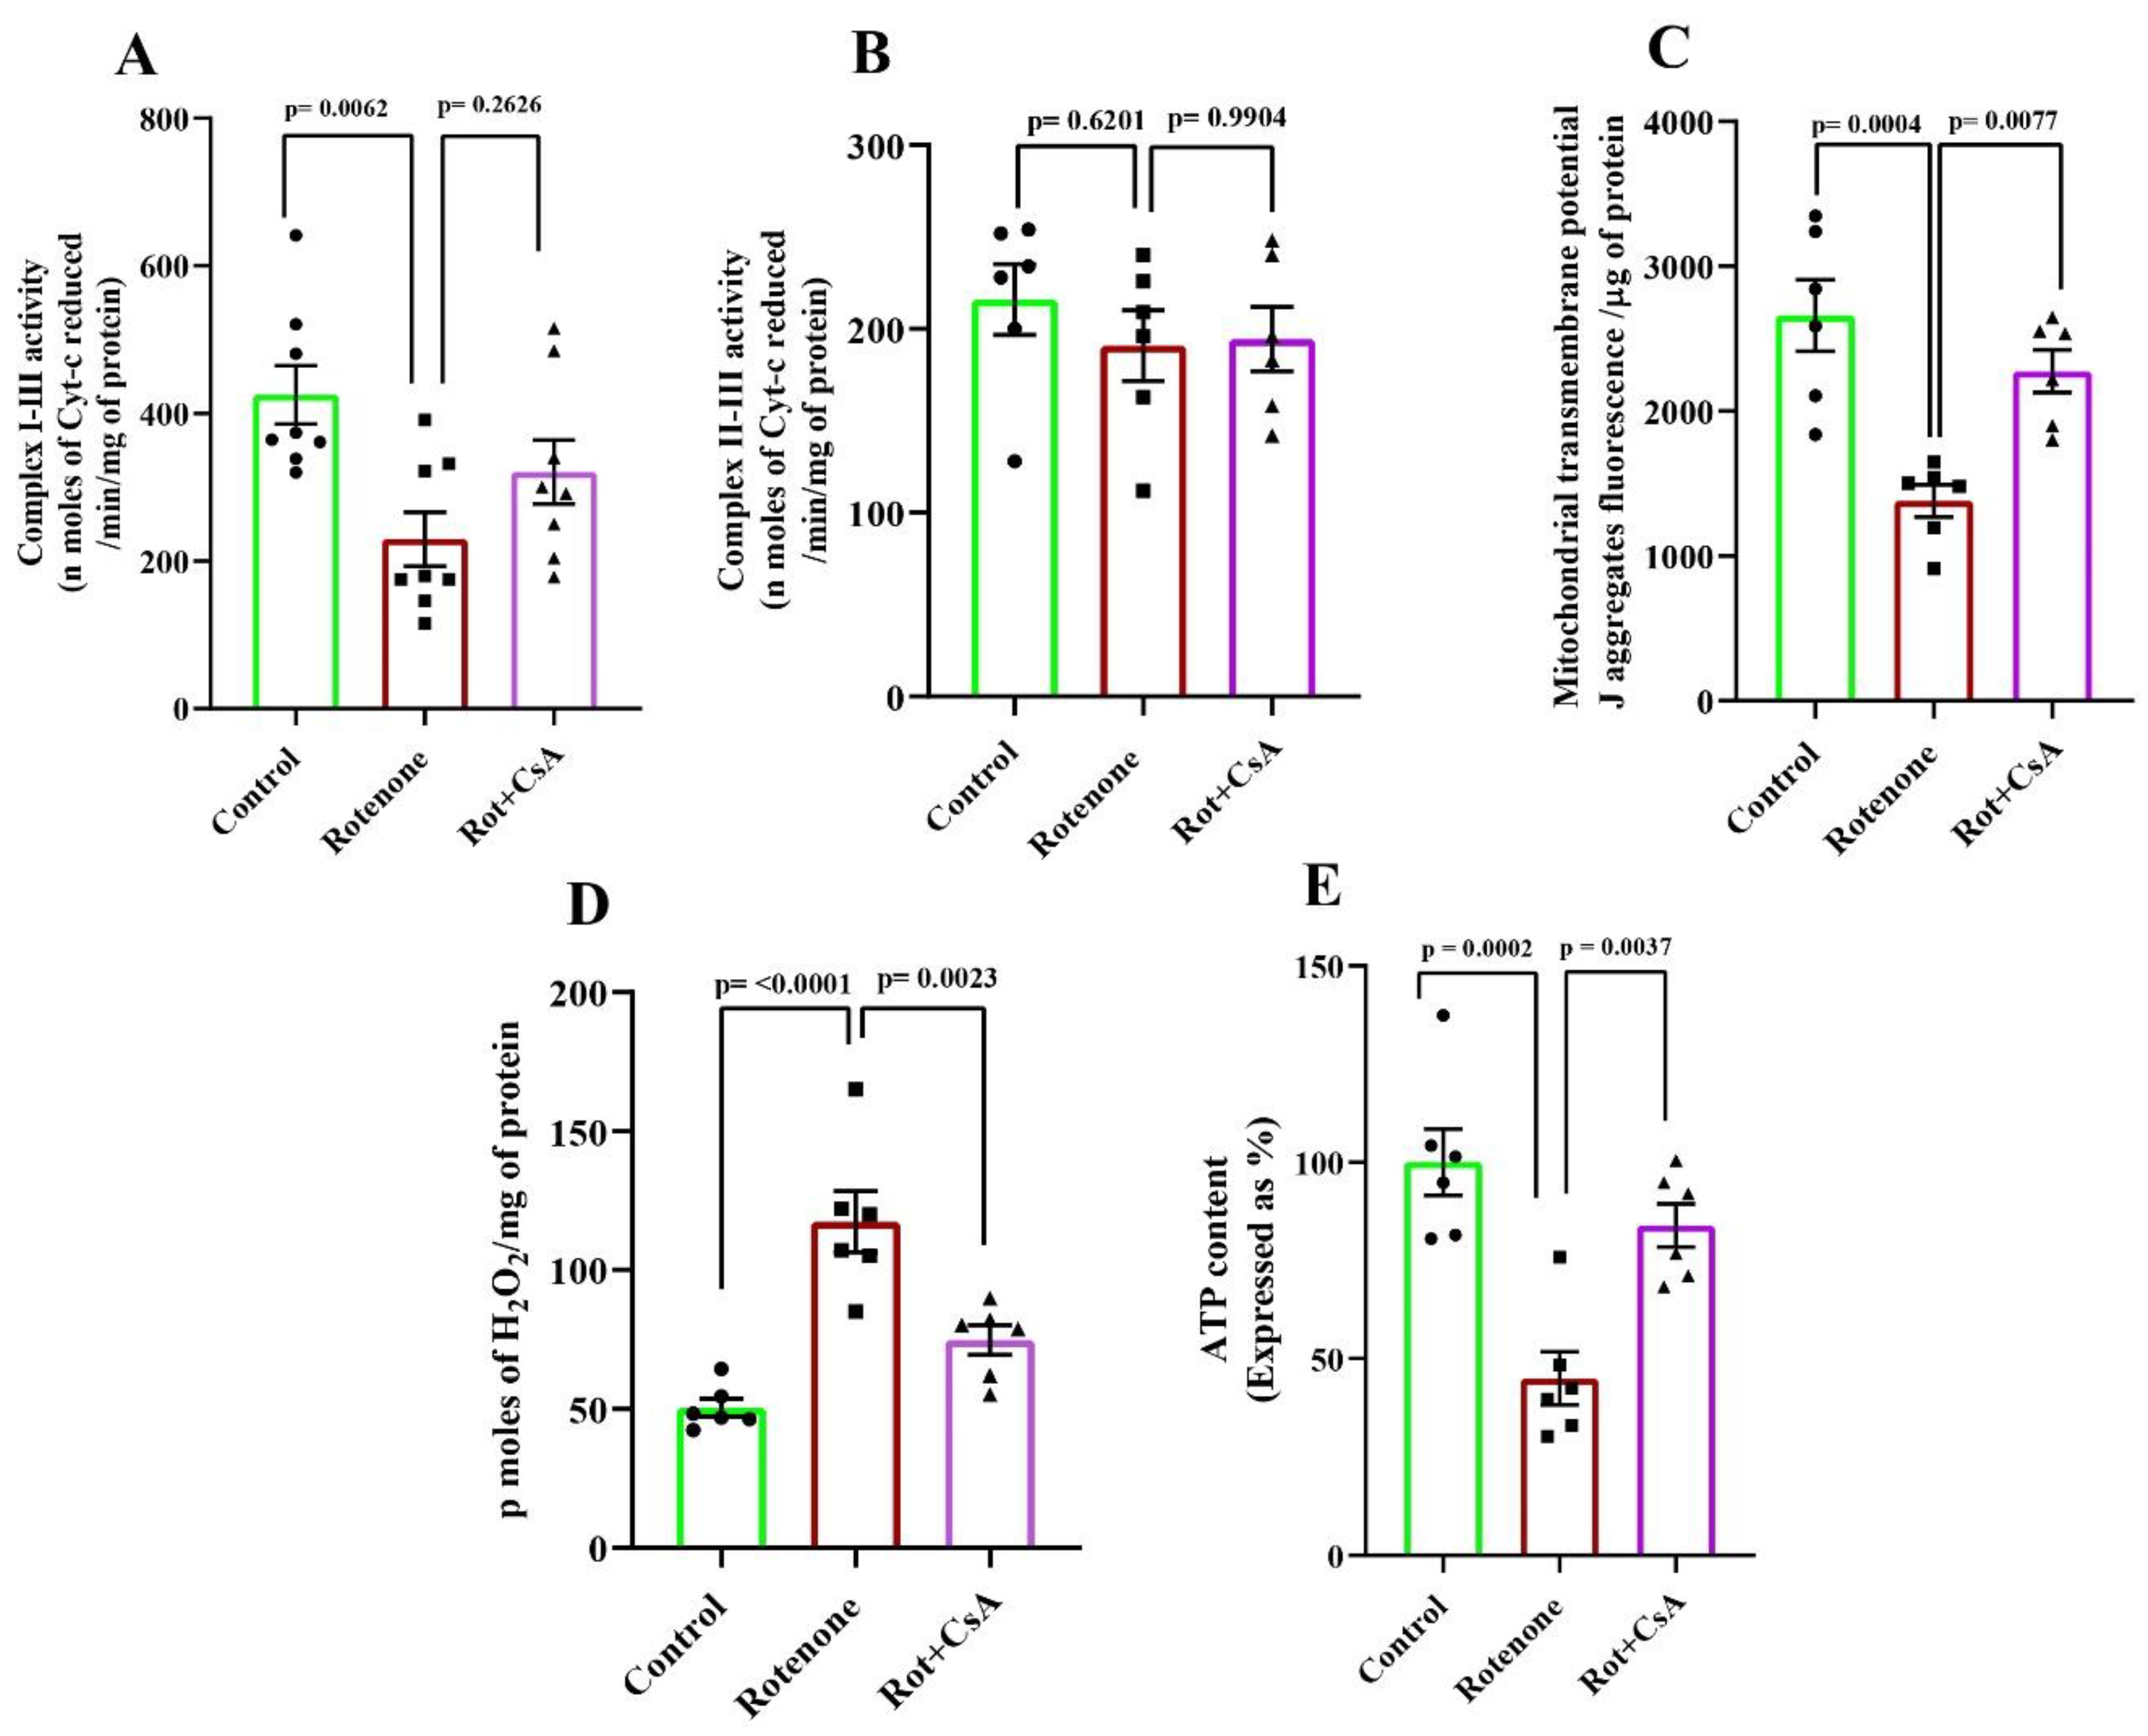
Figure 6.
Cyclosporine A effects on neuronal death and α-synuclein accumulation in substantia nigra in rotenone induced PD models. Cryo-sections from the substantia nigra of Con, Rot and Rot + CsA rats were obtained and analysed for TH- positive neurons by immunohistochemistry (A), neuronal death by PI staining (B) and α-synuclein accumulation by immunofluorescence (C) as described in the Materials and Methods. A representative image is presented from each group for each parameter; the experiments were conducted with 3 animals in each group.
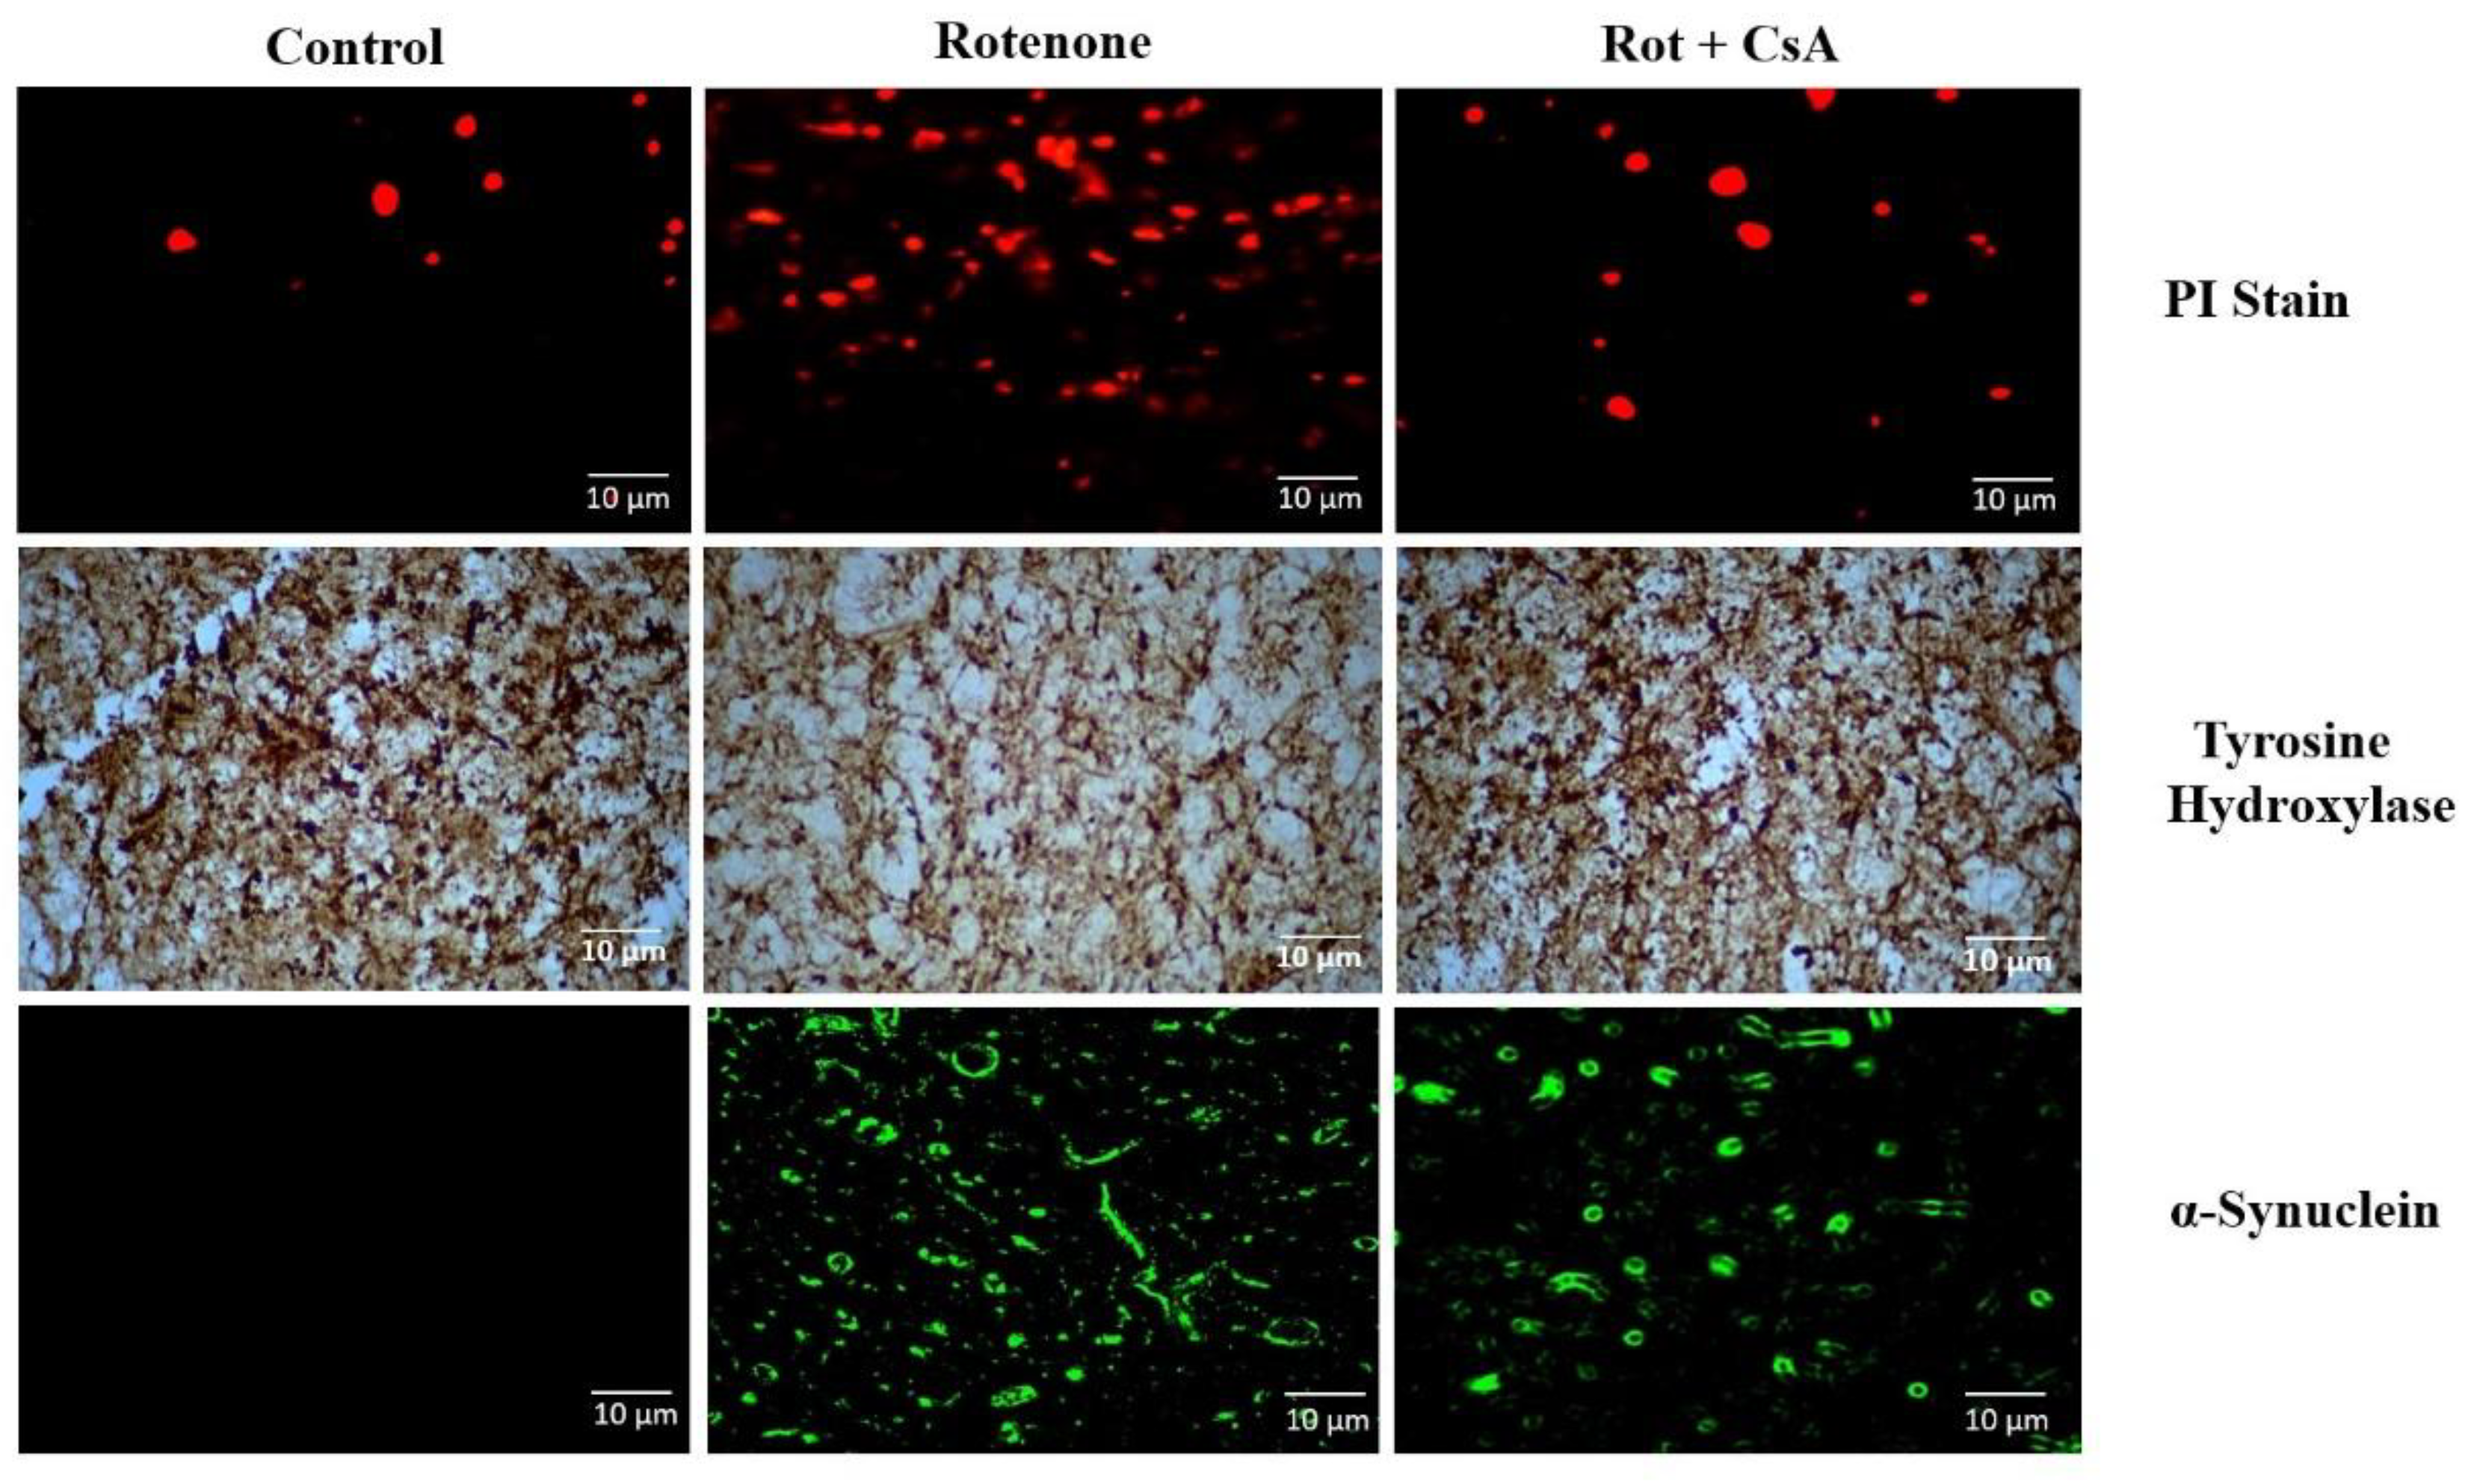
Figure 7.
Neuroinflammation in the rotenone-induced rat PD model: protection by cyclosporine A. Microglial activation was assessed by immunohistochemical detection of Iba1in the sections from substantia nigra (A) and the pro-inflammatory cytokines measured by immunoassay (B) in the midbrain and striatum from Con, Rot and Rot + CsA groups of rats as detailed in the text. A: Representative images from each group are presented; three independent experiments were conducted from each group. B: Values are the means ± SEM of 6 animals in each group.
Disclaimer/Publisher’s Note: The statements, opinions and data contained in all publications are solely those of the individual author(s) and contributor(s) and not of MDPI and/or the editor(s). MDPI and/or the editor(s) disclaim responsibility for any injury to people or property resulting from any ideas, methods, instructions or products referred to in the content. |
© 2025 by the authors. Licensee MDPI, Basel, Switzerland. This article is an open access article distributed under the terms and conditions of the Creative Commons Attribution (CC BY) license (http://creativecommons.org/licenses/by/4.0/).
Copyright: This open access article is published under a Creative Commons CC BY 4.0 license, which permit the free download, distribution, and reuse, provided that the author and preprint are cited in any reuse.


