Submitted:
20 June 2025
Posted:
23 June 2025
You are already at the latest version
Abstract
Livebirths and stillbirths are key public health indicators, with significant social and economic consequences. This study applies time series modeling to the quarterly data of livebirths and stillbirths recorded at Obafemi Awolowo University Teaching Hospital Complex (OAUTHC), Ile-Ife, from 2001 to 2020. Using Augmented Dickey-Fuller tests, the data were confirmed to be stationary. Appropriate ARMA models ARMA(2,3) for livebirths and ARMA(1,3) for stillbirths were fitted based on minimum values of AIC, BIC, and HQIC. Forecasts indicate a sharp increase in livebirths between 2021 and 2023, with a relatively stable trend in stillbirths. These findings underscore the importance of continuous improvement in maternal healthcare and data-driven planning.
Keywords:
Livebirths
; Stillbirths
; ARMA models
; Time Series
; Forecasting
; Hospital Records
1. Introduction
Childbirth is a critical indicator in global public health monitoring. It can result in either livebirths or stillbirths, both of which carry health system implications. In Nigeria, a high burden of stillbirth persists despite advances in maternal healthcare. With a stillbirth rate of over 40 per 1,000 births in recent years, data-driven approaches are vital to understanding and curbing this trend. This study investigates the pattern of livebirths and stillbirths over a 20-year period using time series models, with the goal of providing reliable forecasts and informing policy interventions at OAUTHC, Ile-Ife.
2. Literature Review
Previous studies have identified multiple maternal, fetal, and environmental risk factors contributing to stillbirths (Odendaal et al., 2021; Malacova et al., 2018). Moreover, the World Health Organization emphasizes the use of accurate and complete data in evaluating maternal health interventions. Time series methods, particularly ARIMA-based models, have been widely used in medical forecasting due to their robustness in handling temporal patterns (Box & Jenkins, 1976).
3. Methodology
3.1. Data Source
Quarterly data from 2001 to 2020 were obtained from the Health Information Management Department, OAUTHC, Ile-Ife.
3.2. Model Selection Process
Stationarity Test: Augmented Dickey-Fuller (ADF) test was used to confirm stationarity.
Model Identification: ACF and PACF plots helped suggest potential ARMA models.
Model Selection: Models were compared using Akaike Information Criterion (AIC), Bayesian Information Criterion (BIC), and Hannan-Quinn Criterion (HQIC).
Diagnostic Checks: Residual plots and normality tests were used to confirm model adequacy.
3.3. Software Tools
Data analysis was conducted using Microsoft Excel and GRETL software.
4. Results
4.1. Livebirths
Figure 1.
Shows an upward linear trend of livebirth was observed over the 20-year period.
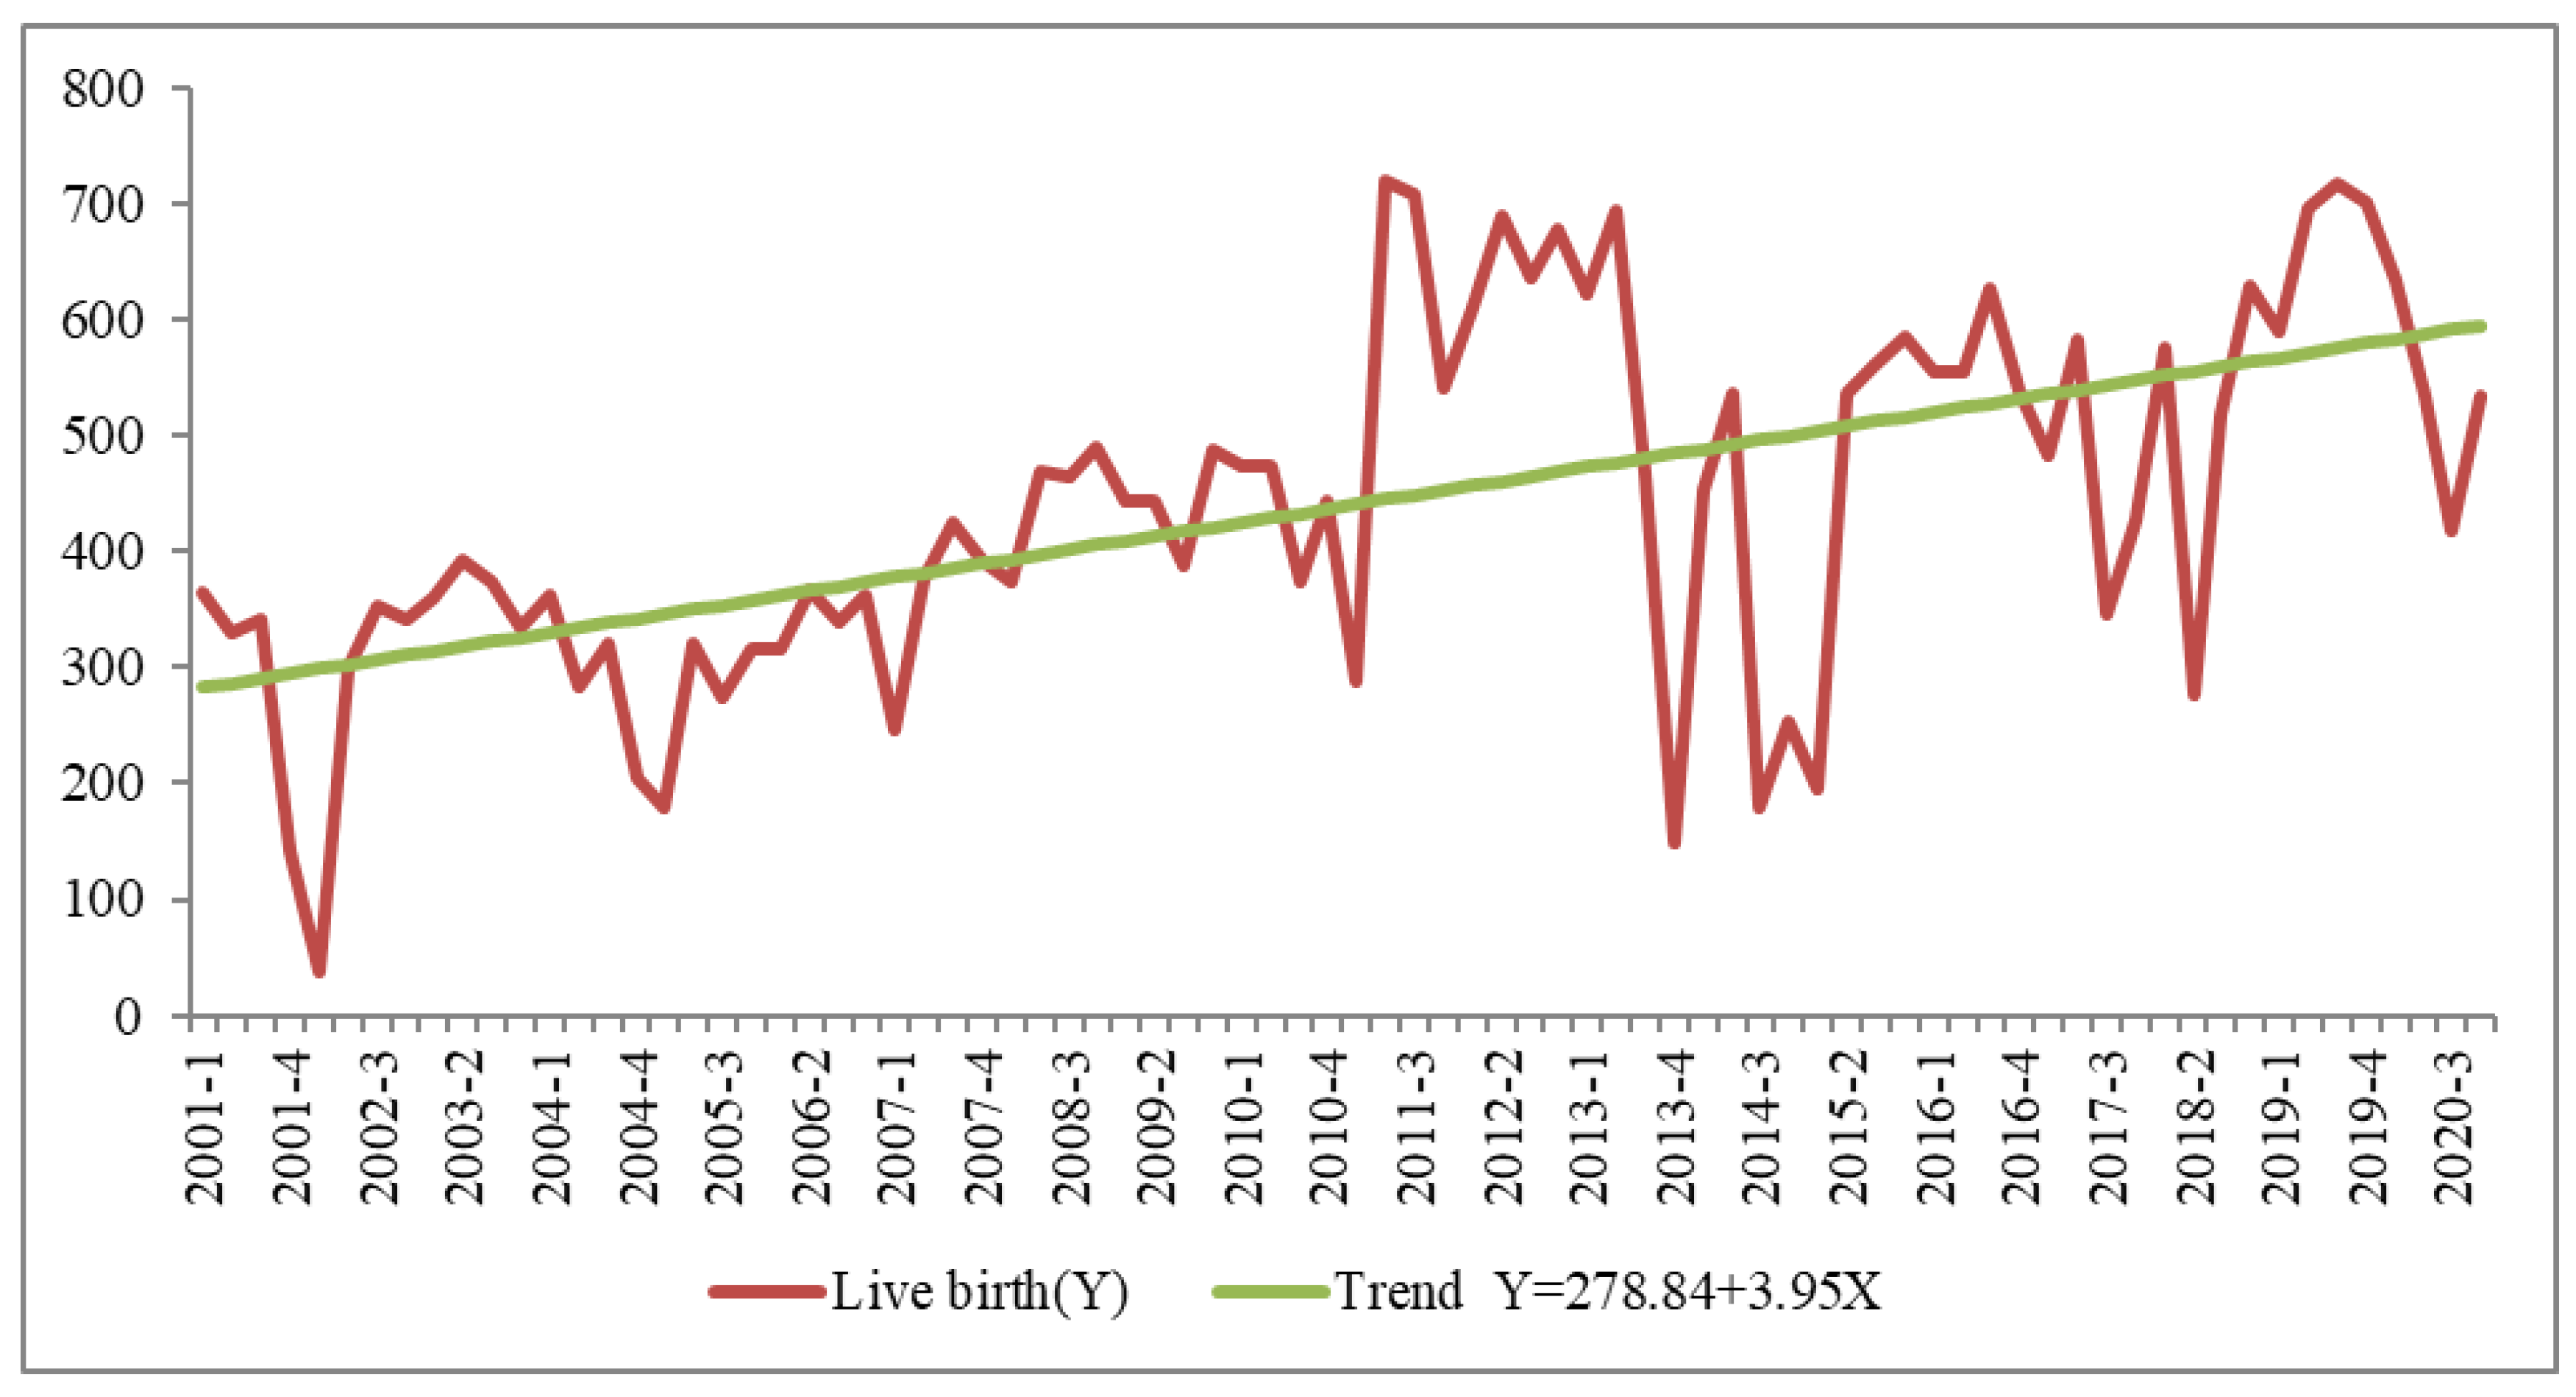
Test of Stationary for live birth of the original data from 2001 to 2020
The test of stationary is done by using Augumented Dickey Fuller test
Ho. The series is not stationary
H1: The series is stationary
Test Statistic: α = 0.05

Table 1.
Result for Augmented Dickey Fuller (ADF) test at original Level .
| Dickey fuller | -0.352922 |
| P-value | 0.001950 |
Decision Rule: Reject H0 if p value is less than 0.05 otherwise do not reject Ho
Decision: Since the p-value is less than 0.05 the null hypothesis is therefore rejected
Conclusion: Hence the mean and variance of time series is constant in the whole series which implies that there is no presence of unit root in the series indicating stationarity.
Model Identification
To get an appropriate time series model, the smallest value of the Akaike (AIC), Schwarz, and Hannan Quinn Criterion of the identified model is selected.
Table 2: reveals that out of the three criterions Akaike, and Hannah-quinn Criterion has the smallest value in ARMA(2,3) compare to the other models, indicating that ARMA(2,3) is the best model.
Table 2.
Result for Model Identification using ARMA (p,q) for live birth.
| S/N | Model | Akaike Criterion | Schwarz Criterion | Hannan Quinn Criterion |
|---|---|---|---|---|
| 1. | ARMA(1,1) | 996.8713 | 1006.399 | 1000.691 |
| 2. | ARMA(1,2) | 997.7951 | 1009.705 | 1002.570 |
| 3. | ARMA(1,3) | 997.0495 | 1011.342 | 1002.780 |
| 4. | ARMA(1,4) | 997.1770 | 1013.851 | 1003.862 |
| 5. | ÀRIMA(2,1) | 998.4753 | 1010.385 | 1003.250 |
| 6. | ARIMA(2,2) | 998.7319 | 1013.024 | 1004.462 |
| 7. | ARMA(2,3) | 990.1766 | 1006.851 | 996.8618 |
| 8. | ARMA(2,4) | 992.0821 | 1011.138 | 999.7223 |
| 9. | ARIMA(3,1) | 997.8235 | 1012.116 | 1003.554 |
| 10. | ARMA(3,2) | 999.8183 | 1016.493 | 1006.503 |
| 11. | ARMA(3,3) | 992.0782 | 1011.134 | 999.7184 |
| 12. | ARMA(3,4) | 992.3840 | 1013.822 | 1000.979 |
| 13. | ARMA(4,1) | 999.8184 | 1016.493 | 1006.504 |
| 14. | ARMA(4,2) | 992.8446 | 1011.901 | 1000.485 |
| 15. | ARMA(4.3) | 994.0780 | 1015.516 | 1002.673 |
| 16. | ARMA(4,4) | 993.1728 | 1016.993 | 1002.723 |
Figure 2.
shows that the residual ACF and PACF value at lag 1 to lag 16 hover around zero line, this made the model valid and adequate.
Figure 2.
shows that the residual ACF and PACF value at lag 1 to lag 16 hover around zero line, this made the model valid and adequate.
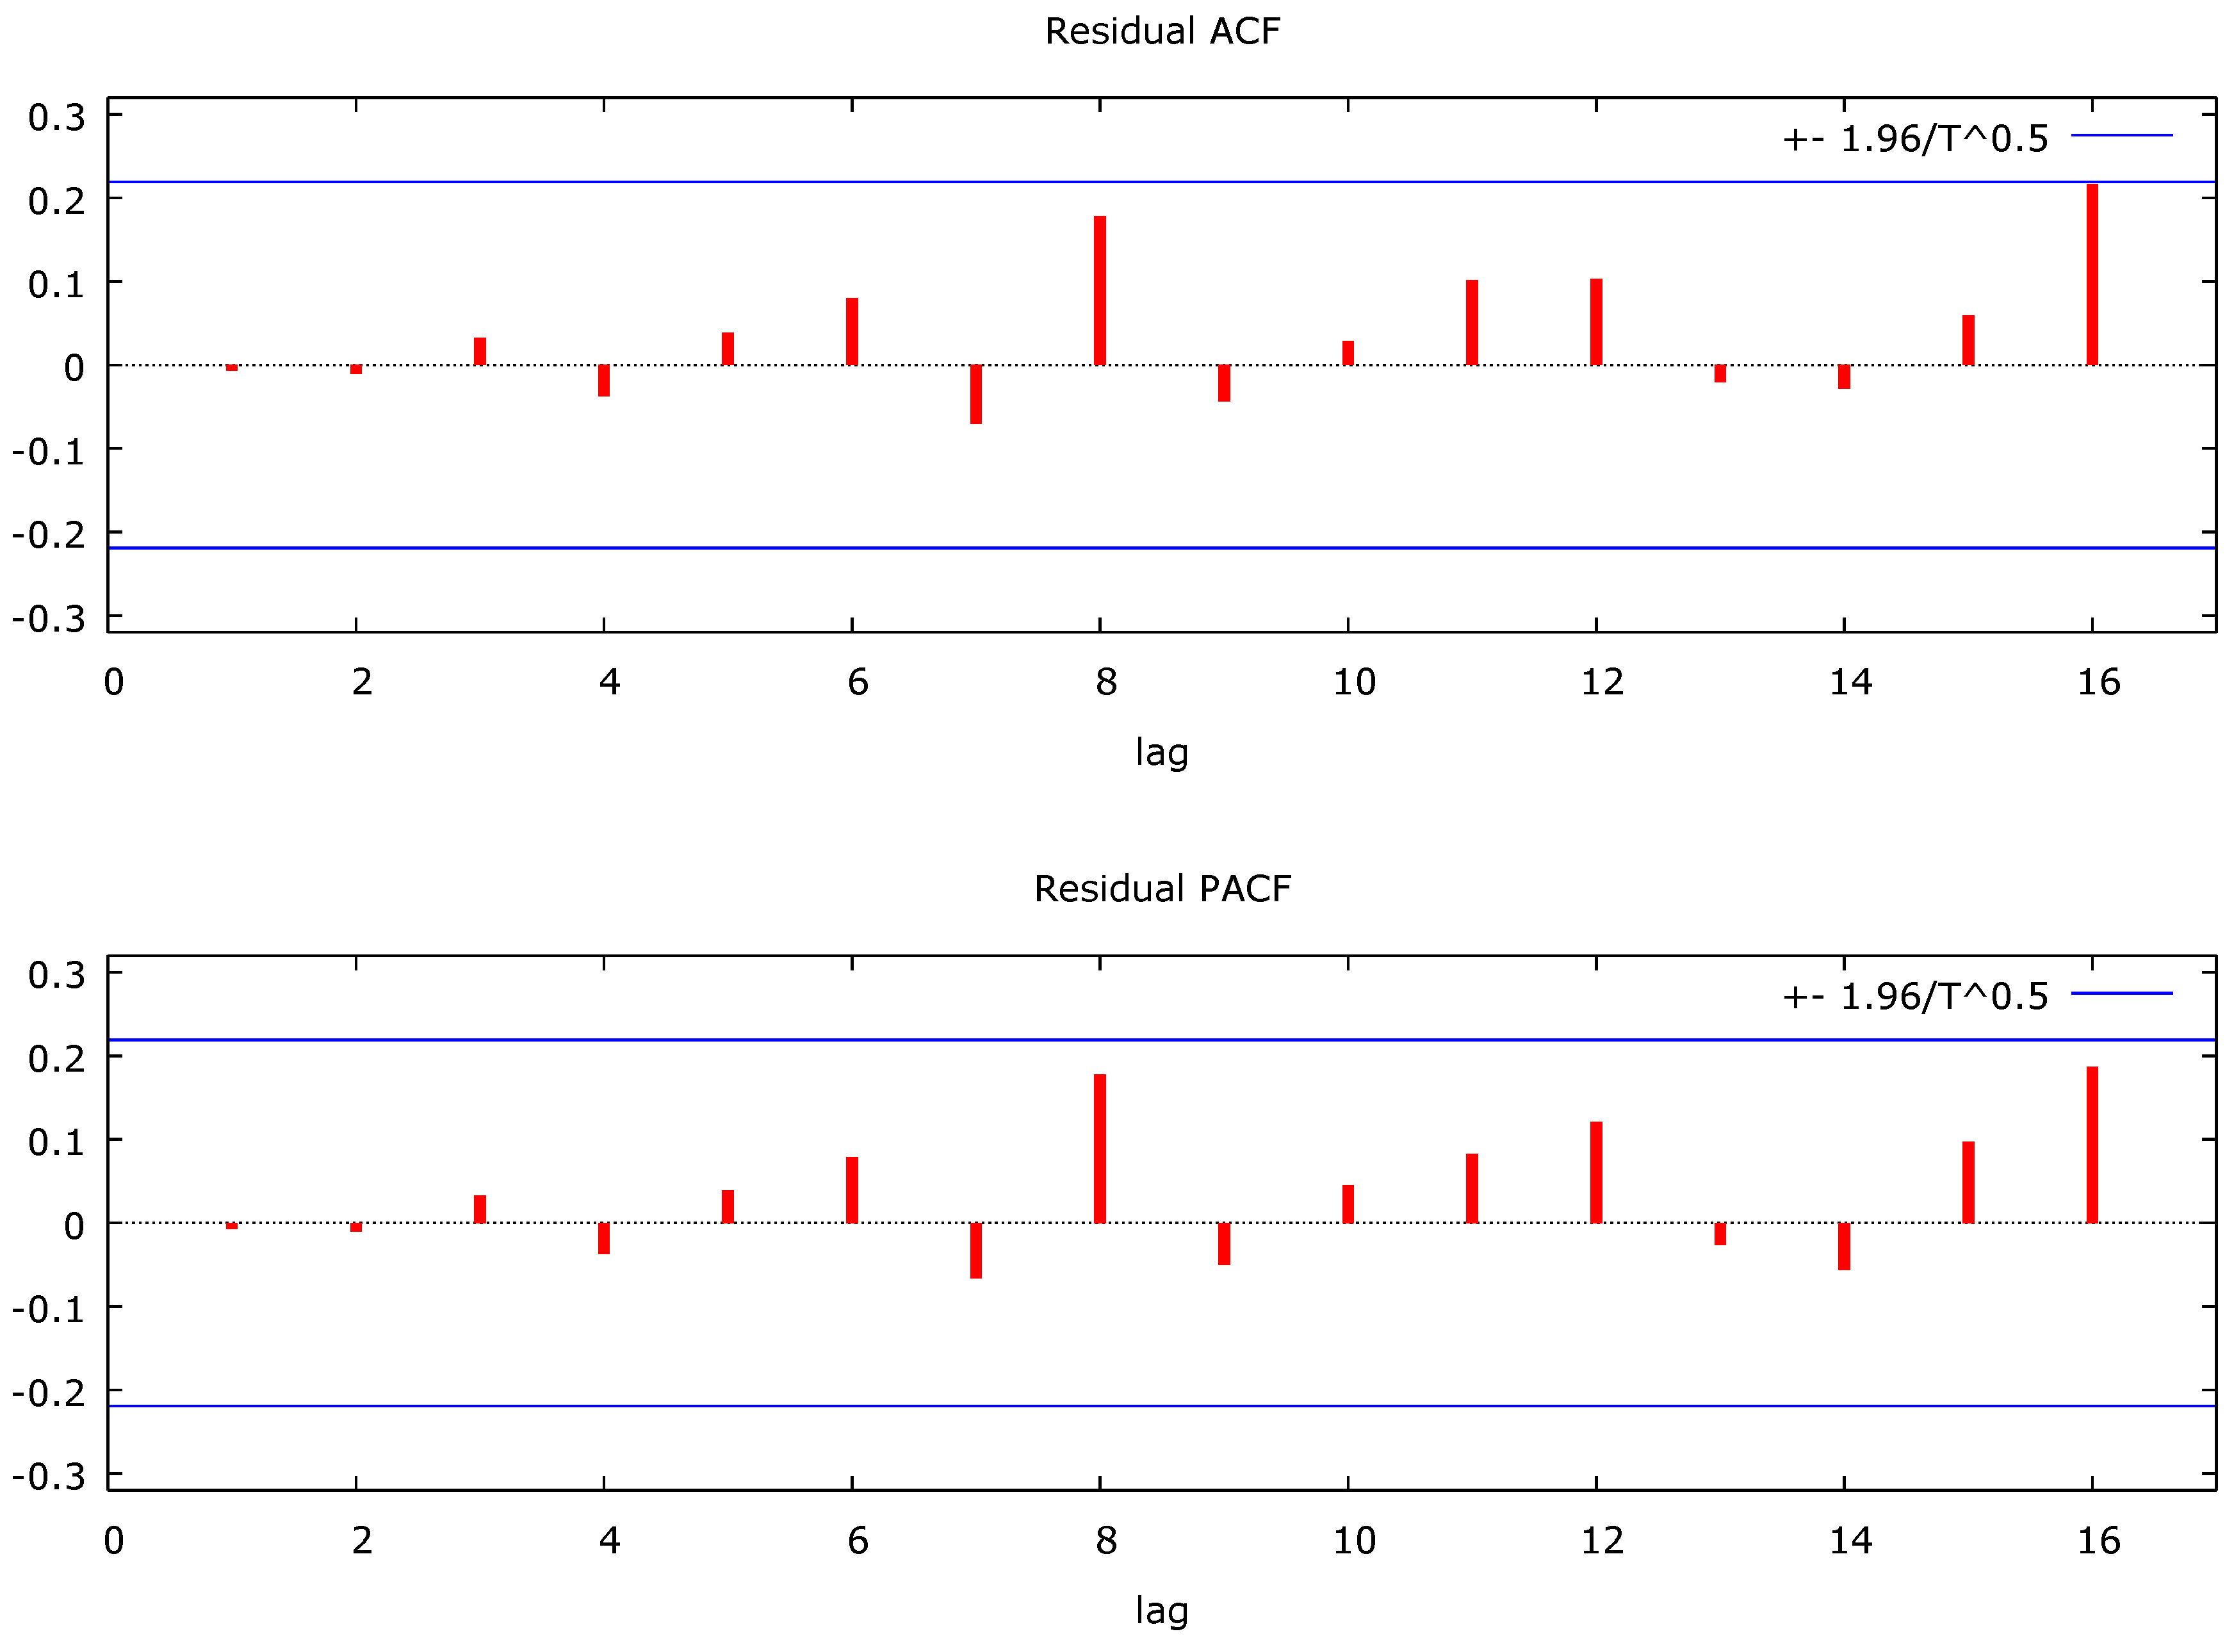
Table 3.
Result for the Forecast of Live birth from 2021 to 2023.
| Observation | Prediction | std. Error | 95% Interval |
|---|---|---|---|
| 2021:1 | 445.584 | 104.061 | (241.628, 649.540) |
| 2021:2 | 343.792 | 112.902 | (122.508, 565.076) |
| 2021:3 | 325.178 | 115.072 | (99.6402, 550.716) |
| 2021:4 | 337.374 | 124.964 | (92.4492, 582.299) |
| 2022:1 | 369.199 | 137.392 | (99.9154, 638.483) |
| 2022:2 | 408.186 | 146.375 | (121.297, 695.075) |
| 2022:3 | 443.702 | 150.379 | (148.964, 738.440) |
| 2022:4 | 468.810 | 151.146 | (172.570, 765.050) |
| 2023:1 | 480.793 | 151.161 | (184.523, 777.063) |
| 2023:2 | 480.597 | 151.831 | (183.013, 778.181) |
| 2023:3 | 471.614 | 153.125 | (171.495, 771.732) |
| 2023:4 | 458.255 | 154.363 | (155.709, 760.801) |
Figure 4.
shows the forecast from 2021 to 2023 which predicted a sharp increase in livebirths, reaching a quarterly average of approximately 480 by 2023.
Figure 4.
shows the forecast from 2021 to 2023 which predicted a sharp increase in livebirths, reaching a quarterly average of approximately 480 by 2023.

4.2. Stillbirths
Figure 5.
Shows a linear increasing trend of stillbirths, less pronounced than livebirths.
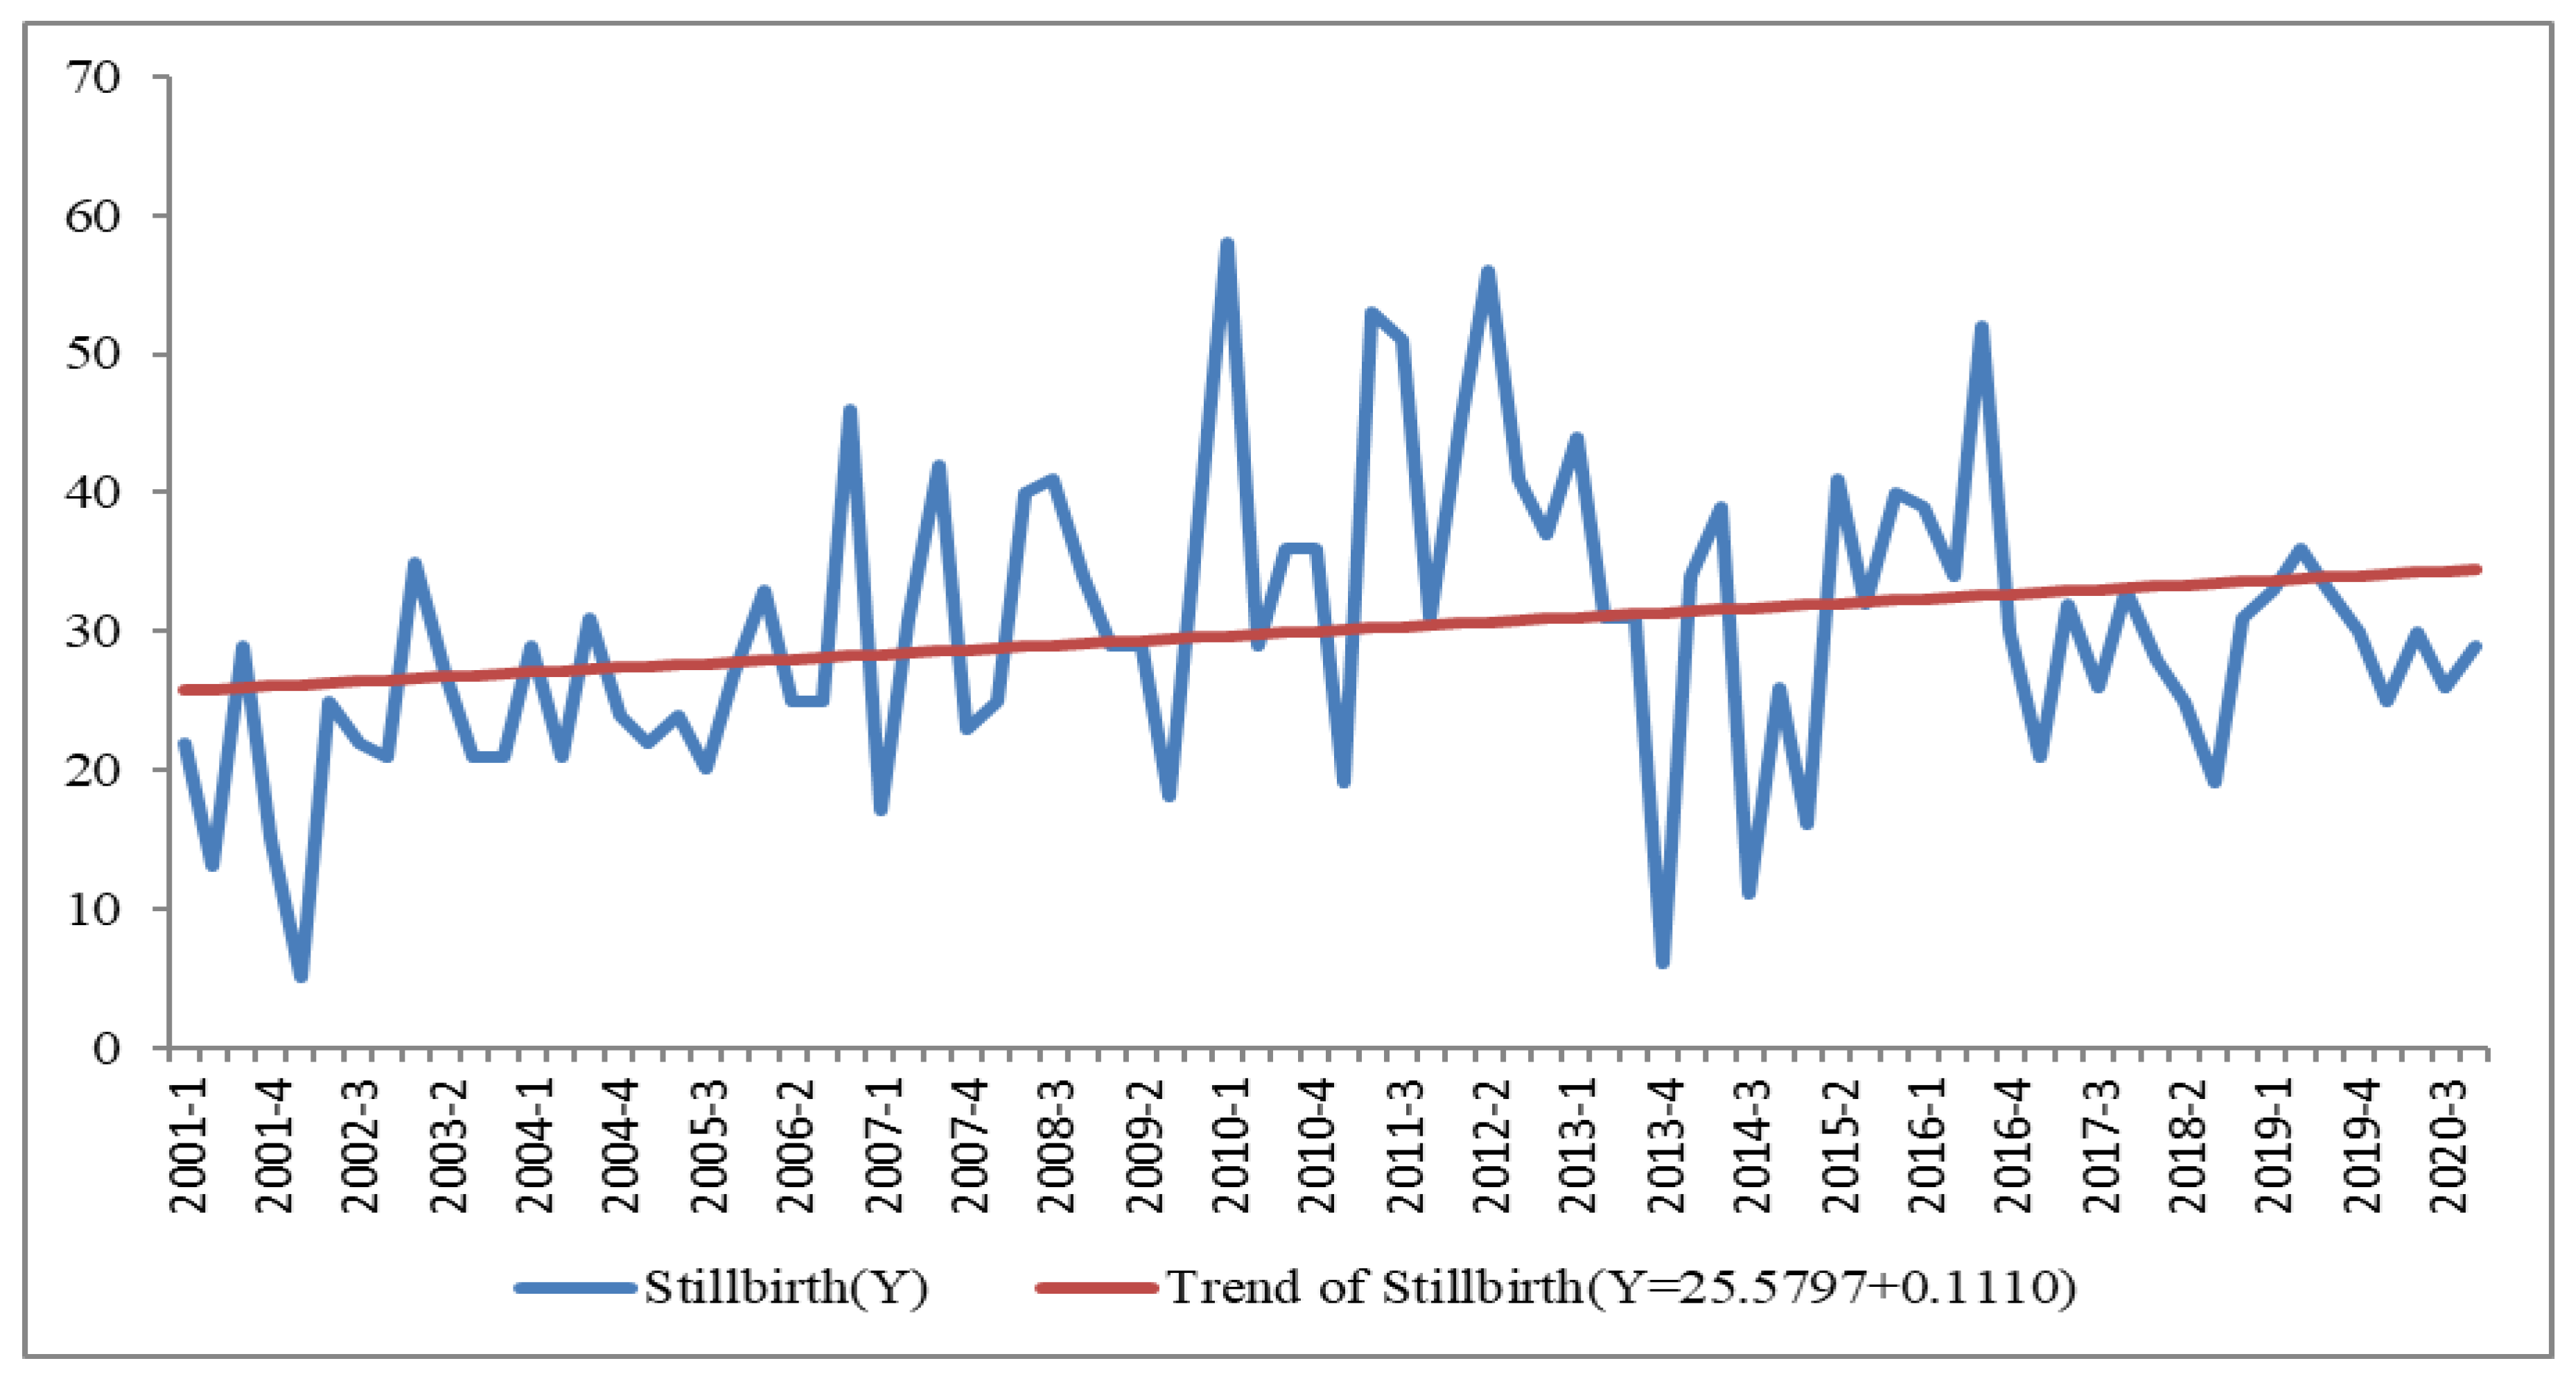
Table 4.
Result for Augumented Dickey Fuller (ADF) test at Original Level of number of stillbirth.
| Dickey fuller | -0.765746 |
| P-value | 1.609e-007 |
Decision Rule: Reject Ho if p value is less than 0.05 otherwise do not reject Ho
Decision: Since the p-value is less than 0.05 the null hypothesis is therefore rejected
Conclusion: Hence the mean and variance of time series is constant in the whole series indicating stationarity.
4.2.1. Model Identification
To get an appropriate time series model, the smallest value of the Akaike, Schwarz, and Hannan Quinn Criterion of the identified model is selected.
Table 5: reveals clearly that out of the three criterions Akaike, and Hannah-quinn Criterion was found to be the smallest value in ARMA(1,3) compare to the other models, so the best model is ARMA(1,3).
Table 5.
Result for model identification ARMA (p,q) for number of Stillbirth.
| S/N | Model | Akaike Criterion | Schwarz Criterion | Hannan-Quinn Criterion |
|---|---|---|---|---|
| 1. | ARMA(1,1) | 600.6147 | 610.1428 | 604.4348 |
| 2 | ARMA(1,2) | 602.6021 | 614.5122 | 607.3772 |
| 3 | ARMA(1,3) | 597.7584 | 612.0506 | 603.4885 |
| 4 | ARMA(1,4) | 599.0405 | 615.7147 | 605.7257 |
| 5 | ARMA(2,1) | 602.6082 | 614.5183 | 607.3833 |
| 6 | ARMA(2,2) | 599.5910 | 613.8832 | 605.3212 |
| 7 | ARMA(2,3) | 598.3764 | 615.0506 | 605.0616 |
| 8 | ARIMA(2,4) | 600.3763 | 619.4325 | 608.0165 |
| 9 | ARMA(3,1) | 598.1364 | 612.4286 | 603.8666 |
| 10 | ARMA(3,2) | 598.2832 | 614.9574 | 604.9683 |
| 11 | ARMA(3,3) | 600.2506 | 619.3069 | 607.8908 |
| 12 | ARMA(3,4) | 602.2506 | 623.6889 | 610.8458 |
Figure 6.
Residual ACF and PACF of the Best ARIMA Model for Stillbirth.
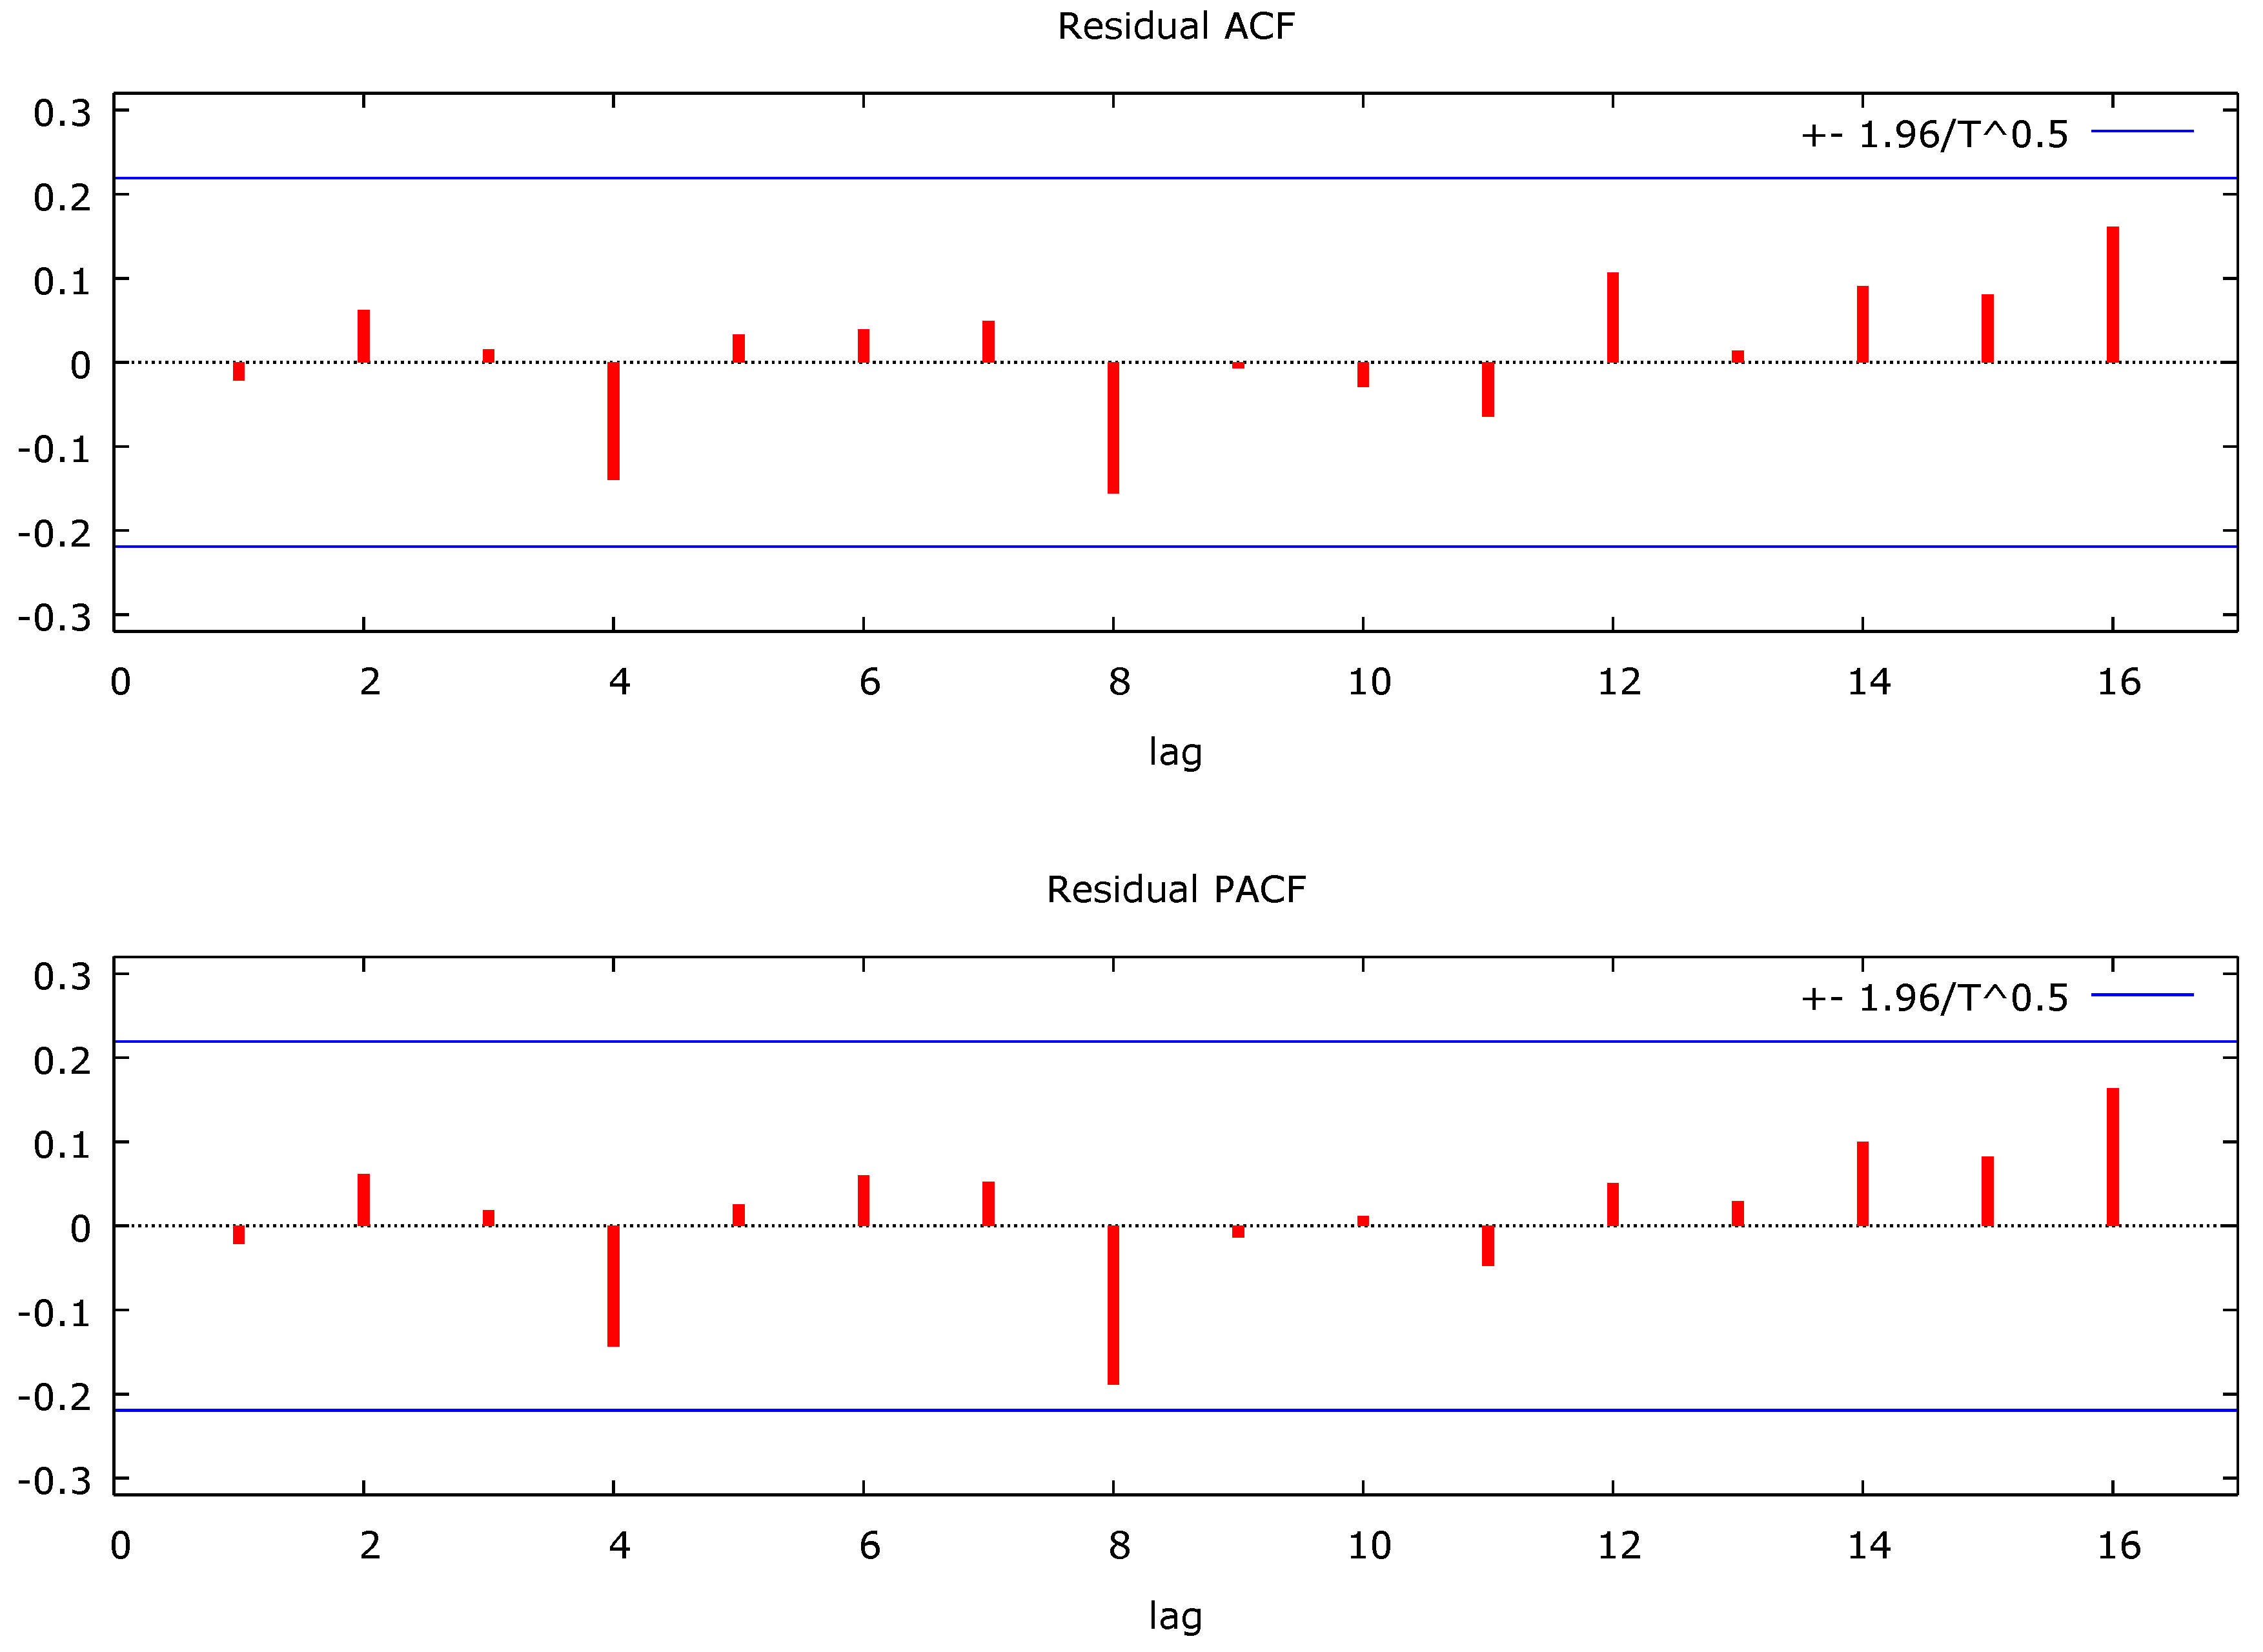
Figure 6: shows residual ACF and PACF value at lag 1 to lag 16 hover around zero line, this made the model valid and adequate.
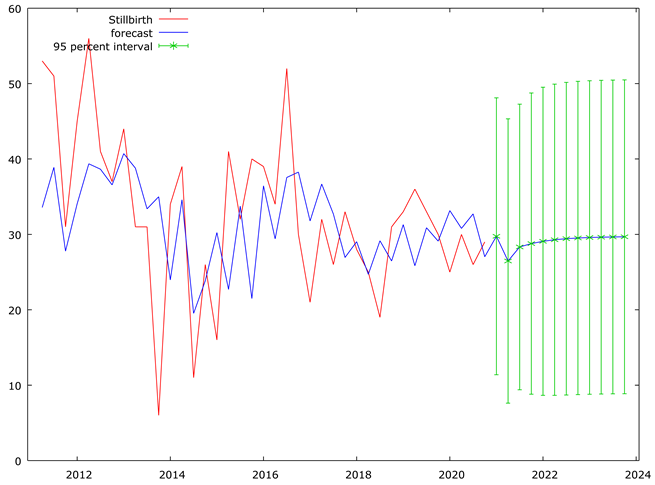
Table 6 and Figure 7 shows forecast from 2021 to 2023 predicted that stillbirths is expected to remain relatively stable, with minor fluctuations.
Table 6.
Result for the Stillbirth Forecast from year 2021 to 2023.
| Observation | Prediction | std. Error | 95% Interval |
|---|---|---|---|
| 2021:1 | 29.7517 | 9.37009 | (11.3867, 48.1168) |
| 2021:2 | 26.4700 | 9.62007 | (7.61505, 45.3250) |
| 2021:3 | 28.3299 | 9.66421 | (9.38836, 47.2714) |
| 2021:4 | 28.7793 | 10.1915 | (8.80434, 48.7544) |
| 2022:1 | 29.0838 | 10.4245 | (8.65212, 49.5155) |
| 2022:2 | 29.2900 | 10.5297 | (8.65220, 49.9278) |
| 2022:3 | 29.4297 | 10.5776 | (8.69799, 50.1614) |
| 2022:4 | 29.5243 | 10.5995 | (8.74967, 50.2989) |
| 2023:1 | 29.5884 | 10.6095 | (8.79408, 50.3827) |
| 2023:2 | 29.6318 | 10.6141 | (8.82847, 50.4351) |
| 2023:3 | 29.6612 | 10.6162 | (8.85374, 50.4686) |
| 2023:4 | 29.6811 | 10.6172 | (8.87175, 50.4904) |
5. Discussion
The upward trend in livebirths and the stabilization of stillbirths may reflect improvements in healthcare delivery, particularly antenatal and intrapartum services at OAUTHC. These findings support global calls for investment in maternal health infrastructure and skilled birth attendance.
6. Conclusion and Recommendations
The ARMA models provided a good fit for the birth data and were effective in forecasting future values. The hospital management is encouraged to:
- Continue improving maternal health services
- Promote facility-based delivery
- Monitor and evaluate interventions using hospital data
References
- Blencowe, H. , Cousens, S., et al. (2016). Lancet Global Health.
- Box, G.E.P. , & Jenkins, G.M. (1976). Time Series Analysis: Forecasting and Control.
- Odendaal, H.J. , et al. (2021). JAMA Network Open.
- Malacova, E. , et al. (2018). International Journal of Epidemiology.
- WHO (2015). Stillbirth Estimates by Country.
- United Nations & WHO (2014). Civil Registration Guidelines.
Disclaimer/Publisher’s Note: The statements, opinions and data contained in all publications are solely those of the individual author(s) and contributor(s) and not of MDPI and/or the editor(s). MDPI and/or the editor(s) disclaim responsibility for any injury to people or property resulting from any ideas, methods, instructions or products referred to in the content. |
© 2025 by the authors. Licensee MDPI, Basel, Switzerland. This article is an open access article distributed under the terms and conditions of the Creative Commons Attribution (CC BY) license (http://creativecommons.org/licenses/by/4.0/).
Copyright: This open access article is published under a Creative Commons CC BY 4.0 license, which permit the free download, distribution, and reuse, provided that the author and preprint are cited in any reuse.


