
Submitted:
18 June 2025
Posted:
19 June 2025
You are already at the latest version
Abstract
Aiming to contribute to environmental remediation strategies, this work proposes a novel fabrication of photoelectrocatalytic electrodes containing a BiOI coating deposited onto non-conductive glass (NCG) for CO2 conversion applications. Since the BiOI electrodes are not deposited onto FTO or ITO conductive supports, the electrochemical measurements enable the registration of the (photo)electrochemical response for bare BiOI, thereby excluding remnant signals from the conductive support and reporting an exclusive and proper photoelectrocatalytic BiOI response. A systematic procedure was carried out to improve the physicochemical properties of BiOI through a simple variation of the reagents amount employed in a solvothermal synthesis, thus increasing the crystallite size and surface area of the resulting material (BiOI-X3-20wt.%). The tailored BiOI coating on a non-conductive support showed activity in performing the CO2 photoelectroreduction under UV-Vis irradiation in aqueous media. Finally, the BiOI-X3-20wt.% sample was evaluated to perform the photocatalytic CO2 conversion in gaseous media, producing CO as the reaction product. This study confirms that BiOI is a suitable and easily synthesized material with potential applications for CO2 capture and conversion when employed as a photoactive coating for environmental remediation.
Keywords:
Coatings
; CO2 reduction
; Photocatalysis
; Electrochemistry
1. Introduction
The greenhouse effect (GHE) is crucial to allow life on our planet since it is responsible for keeping an adequate temperature and making it habitable. However, the exponential increase in greenhouse gases (GHG) after the post-industrial era has led to a critical global temperature rise, causing negative impacts associated with climate change [1]. Among the GHGs are carbon dioxide (CO2), nitrous oxide (N2O), methane (CH4), fluorinated gases (FG), and water vapor; however, CO2 is the most significant GHG since it is produced by the combustion of fossil fuels including oil, coal, and natural gas [2]. In addition, deforestation and other anthropogenic human activities have contributed to the increase in CO2, thereby promoting global warming, which is responsible for extreme weather events, ecosystem disruption, rising sea levels, and threats to human health and well-being [3].
Several efforts have been made to mitigate the greenhouse effect, such as transitioning to renewable energy, improving industrial processes, implementing governmental policies, and exploring new and clean energy sources. This last strategy involves new energy generation processes [4]. In this way, photocatalysis has emerged as a novel technology for environmental remediation, harnessing the power of light and utilizing catalytic materials to purify air and water. It harnesses photons to generate superficial charge carriers (electron-hole pairs), which drive chemical reactions that break down harmful and contaminant substances into harmless reaction products [5]. Since photocatalytic reactions are superficial, coatings are an effective strategy for optimizing semiconductor deposition. Photocatalytic coatings can be applied to various surfaces, including concrete, ceramics, and glass, to harness sunlight and generate charge carriers, thereby contributing to environmental remediation [6].
In recent years, photocatalytic coatings have been increasingly utilized in novel photocatalytic surface technologies for environmental applications, thereby leveraging the technology to create surfaces with self-cleaning, air-purifying, and antimicrobial properties. The primary advantage of coatings is their ease of application to various substrates, including glass, ceramics, metals, polymers, and composites, creating active, functional surfaces that interact with surrounding pollutants [7]. Even though photocatalytic coatings are mainly used in self-cleaning applications, they can also be used to improve air quality by reacting and decomposing harmful contaminants, such as nitrogen oxides (NOx) or volatile organic compounds (VOCs), into harmless substances like water and carbon dioxide [8]. If coatings are applied to surfaces exposed to outdoor air, such as facades, building surfaces, or glass windows, they can help eliminate contaminants present in air pollution. The main challenges for photocatalytic coatings are optimizing their efficiency in real-world conditions and enhancing their stability and durability. Photocatalytic coatings have become a versatile and sustainable solution for enhancing environmental air conditions [9]. However, optimizing challenges such as efficiency and stability, reducing costs, scaling production, and integrating photocatalytic developments into existing infrastructure are necessary to make photoactive coatings a common-use technology.
On the other hand, the critical component of a photocatalytic coating is the photoactive material. Bismuth oxyiodide (BiOI) is a novel material that has garnered significant attention in recent years due to its wide range of applications, particularly in optoelectronics, photovoltaics, and photocatalysis. It also presents unique properties that make it attractive in technological developments [10]. BiOI presents a crystal arrangement consisting of a layered structure, where bismuth atoms are "sandwiched" between the iodine and the oxygen atoms. Such a specific arrangement confers particular semiconductor properties and enables its diverse functionalities [11]. Due to its narrow bandgap (1.9 to 2.1 eV), BiOI is known for its excellent photoactivity under visible light irradiation; additionally, through variations in its synthesis method, surface modification, and doping strategies, it is possible to tailor its physicochemical properties to meet specific requirements and applications [12]. BiOI exhibits significant promise in various domains; however, current research in photocatalytic applications focuses on enhancing its performance, stability, and scalability for real-world applications.
Regarding electrode characterization, the classical methodology for evaluating the electrochemical response of semiconductor materials involves depositing photoactive powders onto a conductive support, commonly FTO or ITO, for this purpose [13, 14]. However, since FTO and ITO contain SnO2 and In2O3, they already present photoactive properties which can interfere if the studied coating is not homogeneously deposited onto this surface; even when the surface seems to cover the substrate, fissures or material's porosity can allow the FTO or ITO exposure, thus interfering with the electrochemical measurements and registering data coming from the substrate. In this way, it is desirable to cover the substrate appropriately or modify the electrode fabrication process to ensure that the electrochemical signals registered are obtained from the semiconductor material deposited over the support.
The present work aims to fabricate a photocatalytic coating that contains BiOI as the photoactive material. The coating was deposited onto non-conductive glass (NCG) to avoid substrate interference signals, and the electrodes were electrochemically characterized and evaluated towards the carbon dioxide reduction reaction (CO2RR). The photoactive material exhibited photoelectrochemical and photocatalytic activity, enabling this reaction to occur under UV-Vis irradiation, and generated CO as a reaction product. The material improvement, the novel electrode fabrication method, and the photoactivity presented by the BiOI coating, make it a promising material for environmental remediation applications.
2. Materials and Methods
2.1. Synthesis of Bismuth Oxyiodide
The fabrication of the BiOI photocatalyst was achieved following a solvothermal methodology. In short, 1 mmol of bismuth nitrate (Bi(NO3)3⋅5H2O, 99.99%, Sigma Aldrich) and 1 mmol of potassium iodide (KI, 99.3%, FERMONT) were added into a Teflon reactor employing 10 ml of ethylene glycol as the solvent. The Teflon reactor was placed into a stainless-steel reactor. Four synthesis conditions were studied to analyze the effect of temperature on the reaction. The solvothermal reactor was heated to 140 °C, 150 °C, 160 °C, and 170 °C for 12h. After annealing, the reactor was kept inside until it reached room temperature (≈ 25°C). Then, the reaction products were rinsed with ethanol (20 mL) and water (20 mL) to remove ethylene glycol from the final samples. The resulting orange powder was dried for 4 h at 60 °C in an air atmosphere. Once dried, the powders were ground in an agate mortar and finally stored. In a second stage, aiming to obtain higher amounts of BiOI, the above procedure was followed, but this time the reagent amounts were doubled (X2) and tripled (X3) at 160 °C. The resulting powders were characterized to determine if this procedure modification resulted in any physicochemical changes.
2.2. Preparation of the Electrodes with a Conductive Support
The electrodes were fabricated as follows; i) FTO glass was cut to obtain rectangular pieces (10 x 15 mm), ii) silver conductive paint was deposited at the end of the FTO to cover an area of 5 x 5 mm, iii) hot welding was deposited onto the silver conductive paint (SPI supplies), iv) a copper wire was welded to the FTO glass, and v) al the metal exposed regions were covered with hot silicone to leave exposed just the FTO glass. Afterwards, 10 mg of BiOI, 250 µL of Nafion (5 wt.%), and 1,250 µL of ultra-pure water (18 MΩ∙cm) were mixed to obtain an electrocatalytic ink. 10 µl of the catalytic ink were deposited through spin coating onto a conductive FTO glass (1 cm2). The ink-deposited electrodes were dried under N2 at 25 °C. The electrode fabrication scheme is depicted in Figure S1a.
2.3. Preparation of the Electrodes with a Non-Conductive Support
The electrodes were fabricated as follows; i) NCG was cut to obtain rectangular pieces (10 x 15 mm), ii) silver conductive paint was deposited at the end of the NCG to cover an area of 5 x 10 mm, iii) hot welding was deposited onto the silver conductive paint (SPI supplies), iv) a copper wire is welded to the NCG, and v) all the metal exposed regions are covered with hot silicone; however, an area of 5 x 5 mm of silver conductive paint remained uncovered on purpose onto the NCG. Afterwards, a paint coating was fabricated mixing 400 mg of BiOI, 500 mg of Calcium Hydroxide (ACS reagent, ≥ 95%, Sigma Aldrich), and 2 ml of a 5 wt.% Polyvinyl Alcohol (PVA) solution (99+ % hydrolyzed, Sigma Aldrich). The resulting coating was applied by paint-brushing onto the NCG electrode (1 cm²). The ink-deposited electrodes were dried under N2 at 25 °C. The electrode fabrication scheme is depicted in Figure S1b.
2.4. Instrumentation
X-ray diffraction (XRD) measurements were performed using a Bruker D8 diffractometer operating at 40 kV and 40 mA with Cu Kα radiation (λ = 1.5406 Å) and a step size of 0.05°, with a counting time of 0.05 s per step, over a 2θ range of 15° to 70°. The morphology of the materials was analyzed using a scanning electron microscope (SEM, JEOL 6490LV) in secondary electron mode under high vacuum and an accelerating voltage of 20 kV. Surface area determination (SBET) was obtained using physical nitrogen adsorption with a Belsorp II mini-instrument. Before registering the N2 adsorption-desorption plots, the materials were degassed at room temperature for 30 minutes under vacuum. The electrochemical measurements were carried out in a potentiostat/galvanostat AUTOLAB PGSTAT302N coupled with the FRA32M module to carry out the electrochemical impedance spectroscopy (EIS) analysis in potentiostatic and potentiodynamic mode and employing a standard three electrodes electrochemical cell at 25°C, a nitrogen-saturated 0.1M KHCO3 aqueous solution was used as the electrolyte; meanwhile, a CO2-saturated 0.1M KHCO3 solution was employed to evaluate the CO2 reduction reaction (CO2RR). The (photo)electrochemical (PEC) measurements were carried out in a quartz photoelectrochemical cell (RRPG147 PINE-Research) with a Pt plate and Ag/AgCl 3M KCl electrode as counter electrode and reference electrode, respectively. The PEC measurements were performed under UV–Vis illumination (Newport 66884, QTH lamp, 250W output). The experiments were carried out at 25°C. All the potential values were converted and reported against the reference hydrogen electrode (RHE). Finally, to perform the CO2 conversion in the gaseous phase, the experiments were conducted in a CEL-GPRT100 photocatalytic reactor, which was connected online to a gas chromatography system (GC-FID/TCD, Agilent Technologies 8890) for analyzing the generated products.
Diluted CO2 was fed to the reactor (He 10% v/v balance) with a flow rate of 2 mL min-1 and passed through a bubbler to obtain the water vapor (50% relative humidity). The photoreactor was covered with a quartz window to harvest photons from a 300 W Xe lamp (150 mW cm-2) used as an irradiation source (λ =300-1100 nm). To ensure the system's hermeticity, the chamber was He-saturated at a pressure of 2 bar for 30 min. Before the photocatalytic tests, the semiconductor material was pretreated with a helium flow rate of 30 cm3 min-1 at 80 °C for 1h.
3. Results and Discussion
3.1. X-ray Diffraction Analysis
The X-ray diffraction (XRD) measurements for BiOI synthesized at different temperatures are depicted in Figure 1a. All the samples shown the main BiOI XRD signals at ca. 24.3°, 29.5°, 31.8°, 32.6°, 45.5°, and 55.1° corresponding to the planes (001), (012), (110), (111), (020), and (122), respectively (ICDD 00-010-0445). However, the samples synthesized at 140 °C and 170 °C show additional signals at 22.2°, 27.1°, 37.9°, and 39.7°, indicating non-desirable bismuth metal traces (ICDD 00-044-1246). Even when the BiOI synthesized at 150 °C and 160 °C presents a pure BiOI phase, the last sample exhibits a rougher surface (Figure S2), which could enhance the catalytic activity of this material [15]. As mentioned in section 2.1, the reagents employed to synthesize BiOI were doubled (X2) and tripled (X3) following the solvothermal method at 160 °C. Figure 1b shows the XRD signals to determine the changes caused by this procedure modification. The reagent increase does not generate the presence of non-desirable products or phases; all diffraction peaks correspond to BiOI. However, the synthesis of X2 and X3 increases the intensity of the BiOI diffraction signal peaks, thus indicating an increase in crystallite size, which was calculated using the full-width at the half maximum (FWHM) peaks through the Scherrer equation; L=kλ/βcos(θ), where L corresponds to the crystallite size, k represents the Scherrer constant (0.9), λ is the wavelength of the X-ray radiation (0.15418 nm for Cu Kα), β is the full width at half maximum (FWHM) of the diffraction peak at 2θ, and θ is the preferential angle diffraction peak [16]. The crystallite sizes for BiOI-X1, BiOI-X2, and BiOI-X3 were 45.6 nm, 61.1 nm, and 63.5 nm, respectively. Such a result indicates that the increase of reagents affects the crystallite size proportionally. Considering the fundamental catalytic principles that indicate materials with large crystallites present enhanced photocatalytic activity in the visible spectrum [17], and that semiconductor materials presenting larger crystal sizes tend to produce a specific product when they perform the CO2 reduction reaction in gaseous media [18, 19], BiOI-X3 could benefit from these features.
3.2. Microscopy Characterization
Figure 2 shows the scanning electron microscopy images for BiOI synthesized at different temperatures. BiOI-140°C (Figure 2a) presents amorphous and not well-defined particles. On the other hand, BiOI-150°C exhibits a more defined morphology, characterized by micrometric rough spheres (Figure 2b). Similarly, BiOI-160°C (Figure 2c) exhibits micrometric spherical particles; although these spheres are rougher, they appear to have a sponge ball-like morphology, suggesting a higher surface area. Finally, (Figure 2d) depicts BiOI-170°C, where scarce smooth quasi-spheres are observed. Considering the superior roughness presented by BiOI-160°C, the synthesis process at 160 °C was repeated, with the reagent amounts X2 and X3 increased proportionally (see Section 2.1). Figure 3a, 3b, and 3c show the micrographs for the samples BiOI-X1, BiOI-X2, and BiOI-X3, respectively. Compared to the original sample synthesized at 160 °C, BiOI-X2 exhibits the same morphology but with a slight reduction in particle size. In contrast, BiOI-X3 displays a more defined rough surface, which could be advantageous for catalytic purposes.
3.3. BET Area (Asbet) and Pore Radius Estimations
The N2 adsorption-desorption isotherms were obtained to calculate the specific surface area (asBET) using the Brunauer, Emmett, and Teller method. Additionally, pore diameter was determined using the Barrett-Joyner-Halenda (BJH) model, and the results are shown inFigure 4a and 4b, respectively. The three samples exhibit the characteristic shape of a Type V isotherm [20, 21]. BiOI-X1, BiOI-X2, and BiOI-X3 presented a surface area of 50.5 m2 g-1, 55.5 m2 g-1, and 62.7 m2 g-1, respectively, thus indicating that BiOI-X3 shows the highest adsorption volume. In agreement with the BET surface area, the pore diameter decreases when the BET area increases; BiOI-X1, BiOI-X2, and BiOI-X3 show a pore radius of 9.9 Å, 8.9 Å, and 6 Å; since the shortest pore radius increases the catalytic activity, BiOI-X3 tends to be the most efficient catalytic material [22], in this way, BiOI-X3 was selected to perform the (photo)electrochemical measurements and CO2 photo(electro)reduction.
3.4. Electrochemical Characterization
3.4.1. Open Circuit Potential Transients
Open-circuit potential (OCP) transient measurements were performed to determine the charge carrier separation efficiency and identify the semiconductor type. The sample used for electrochemical measurements was BiOI synthesized at 160 °C and tripling the initial reagents amount (BiOI-X3). Figure 5 presents the electrochemical response of two electrodes fabricated through different methodologies (see sections 2.2 and 2.3). Figure 5a and b show the OCP response of bare FTO support and the electrode fabricated by depositing the electrocatalytic ink containing 20 wt.% of BiOI-X3, respectively. On the other hand, Figure 5c and d depict the OCP response of the NCG electrode and an electrode deposited with an active coating containing 20 wt.% of BiOI-X3 onto the NCG, respectively. Regarding the OCP transient response, if the semiconductor material presents a n-type behavior, the curve presents a potential decrease due to an electron accumulation on the material surface; on the other hand, a p-type semiconductor depicts a potential increment since the presence of holes is the signal registered onto the semiconductor surface [23].
The bare FTO response (Figure 5a) shows a potential decrease when the electrode is irradiated, such behavior is in agreement with the n-type feature for FTO electrodes [24]; however, when BiOI is deposited onto the FTO electrode (Figure 5b) the signal is not stable, and it is possible observe periods where the potential tends to decrease even when the material is under irradiation, since BiOI is reported as a p-type semiconductor, the BiOI photoactivation should promote a potential increase. Such instability results from a non-homogeneous BiOI deposition over the FTO support. On the other hand, Figure 5c presents the OCP response for the NCG; as expected, there is no electric signal. However, when this electrode is modified by adding BiOI (Figure 5d), an evident potential variation occurs under irradiation, indicating the p-type feature of BiOI. Although this signal is less intense than the response of the BiOI/FTO electrode, it does not exhibit potential inverse signals, indicating a clear signal that corresponds to the BiOI semiconductor. This electrode fabrication procedure thus makes it a suitable tool for conducting accurate PEC measurements on semiconductor materials.
3.4.2. Photo(Electro)Chemical Response
Photocurrent response for electrodes where BiOI-X3 (1, 3, 5, 10, 15, and 20 wt.%) was deposited onto NCG (Figure 6a). Electrodes were measured into a KHCO3 0.1M solution at the equilibrium potential. From this plot, it is evident that electrodes exhibit photoactivity when exposed to light. Since the electrodes were not fabricated employing FTO glass, the signals confirm the p-type semiconductor feature of BIOI [25]. According to the BiOI amount, the electrodes increase the photocurrent proportionally, the sample containing 20 wt.% showed the highest photocurrent value. BiOI-X3-20wt.%-NCG was used to evaluate the PEC CO2 reduction activity, Figure 6b depicts the LSV where it is possible to observe the BiOI electrode in a solution, i) N2 saturated and ii) CO2 saturated; in the first condition, the electrochemical reduction signal is attributed to the PEC hydrogen evolution reaction (HER); however, under CO2 saturation conditions it is possible to observe three features in the current-potential curve: i) an onset potential decrease, ii) the reduction current is shifted towards less negative potential, and iii) the final current at -1.17 V vs. RHE increases from -0.85 to -1.35 mA cm-2, thus indicating PEC CO2 reduction activity onto BiOI-X3-20wt.%-NCG.
3.4.3. Photocatalytic Activity in Gaseous Media
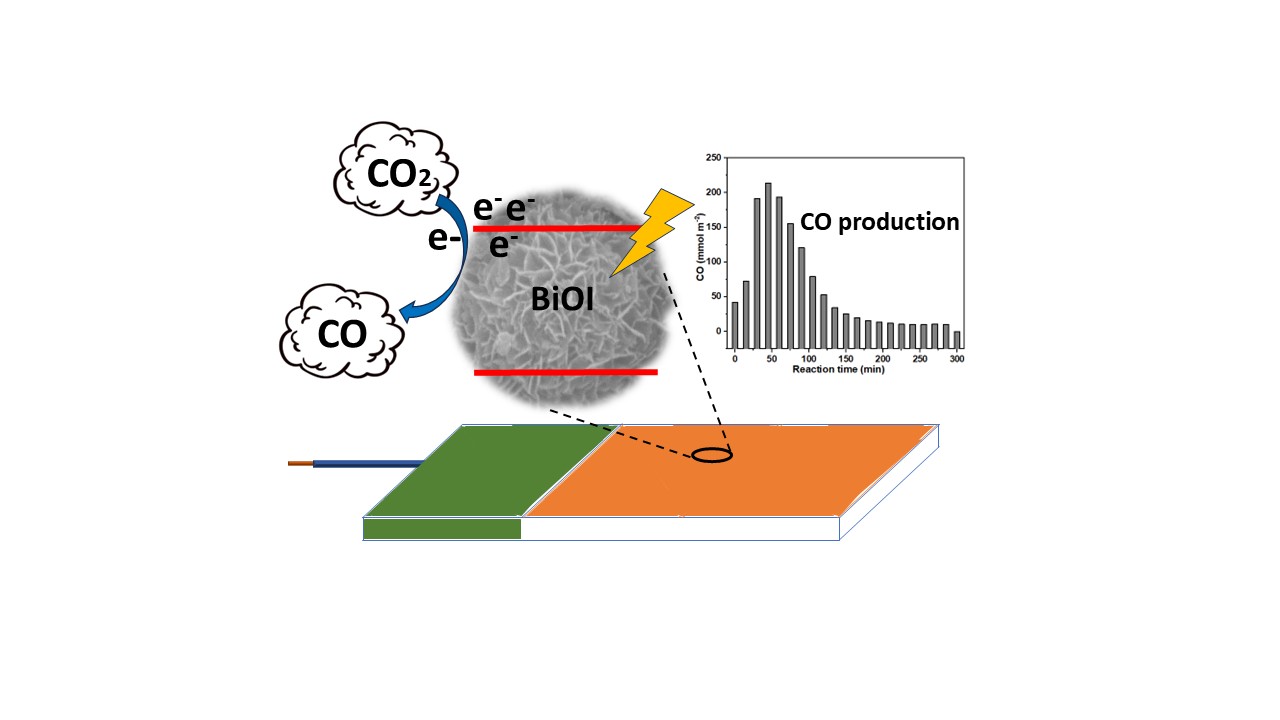
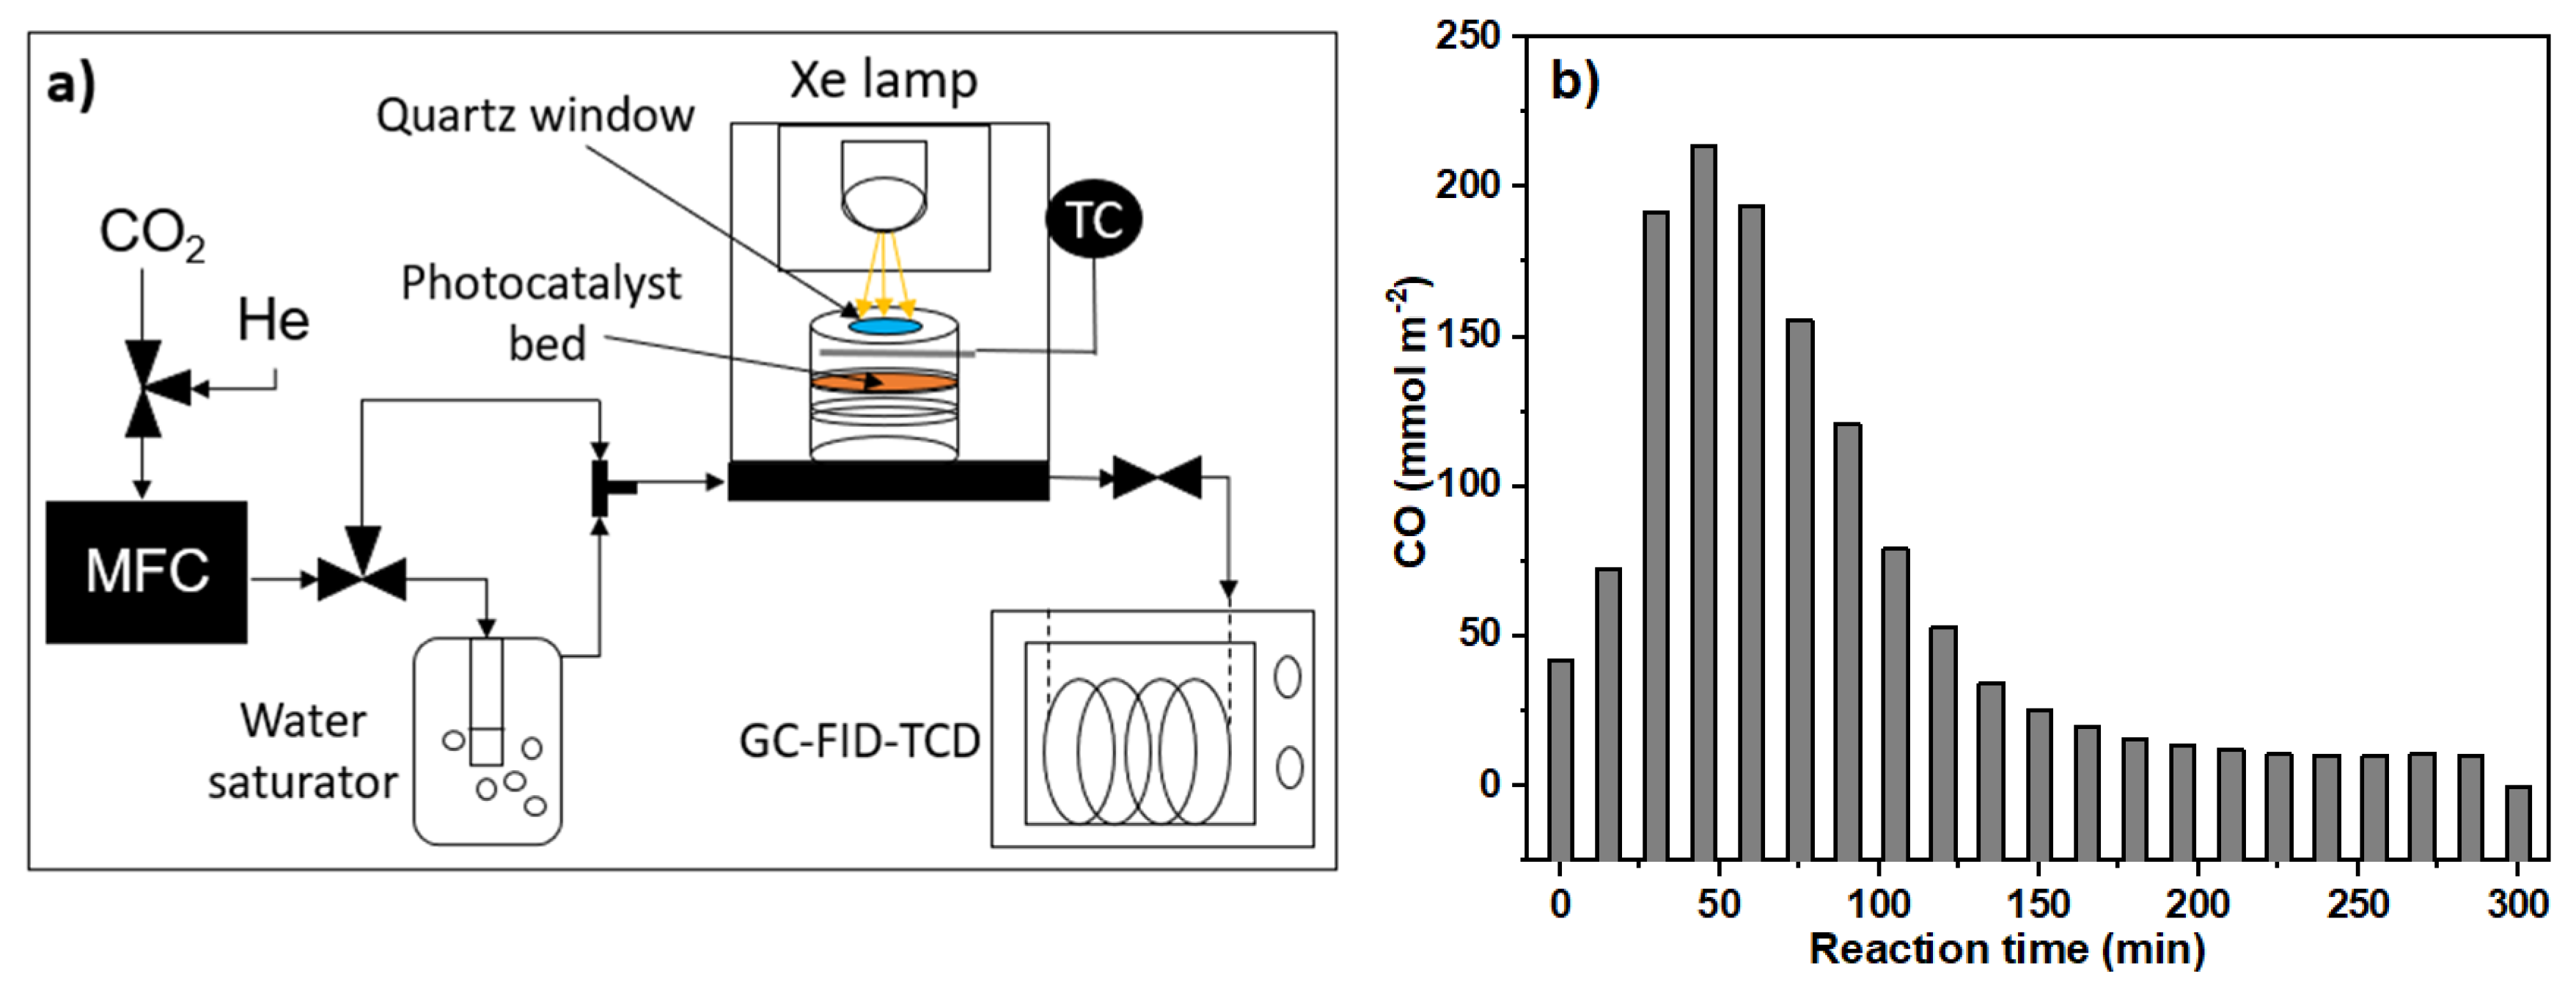
The photocatalytic CO2 conversion reaction was conducted using a continuous-flow system. Meanwhile, the reactor effluent was analyzed using a gas chromatograph, as shown in Figure 7a. The reactor CEL-GPRT100 consists of a glass container with a gas diffusion glassy porous filter (4.5 cm diameter) where the photocatalytic material (250 mg) was evenly supported.
The test was performed at 80 °C using an electronic proportional-integral-derivative temperature control (TC). The reactor feed and effluent were analyzed using a gas chromatograph (GC) equipped with a flame ionization detector (FID) and a thermal conductivity detector (TCD), connected to a GS-Gaspro column (30 m x 0.32 mm) for product separation. As a result of the photocatalytic test, as shown in Figure 7b, it is possible to observe that CO was the main reduction product detected; the maximum CO production (214 mmol m-2) was achieved within the first 150 min. After this period, the CO amount reached a value below 25 mmol m-2, and this CO production continued until the end of the test (300 min). Such an evaluation confirms that BiOI-X3 exhibits photocatalytic activity towards CO2 reduction in gaseous media. To ensure material stability, a new XRD measurement was performed after the photocatalytic evaluation, revealing that the material does not undergo structural modification (Figure S3). This indicates that BiOI-X3 is a suitable and stable material for the preparation of photoactive coatings for CO2 conversion.
Considering the physicochemical properties, electrochemical characterization, and photo(electro)catalytic tests, BiOI-X3-20wt.%-NCG (material synthesized tripling the reagents at 160 °C, containing 20 wt.% of BiOI and supported onto NCG) depicted photocatalytic activity to perform the CO2RR. Such performance is boosted by a smaller pore size, rougher surface, and enhanced surface area, which are promoted by the modification in the synthesis parameters. As expected, the photocatalytic test in gaseous media revealed that BiOI presents activity in converting CO2 to CO. In this way, electro- and photocatalytic tests confirmed a promising application of BiOI oxyhalide as a photocatalytic coating for air pollution remediation.
4. Conclusions
A modification in the solvothermal synthesis process, consisting of an equimolar increase (tripling) of reagents, allows the fabrication of a BiOI compound (BiOI-X3) with a narrow pore size, rougher particles, and a higher surface area. Such enhanced properties were exploited to fabricate a photocatalytic BiOI coating deposited onto NCG, which was characterized electrochemically through the fabrication of electrodes. Fabricating non-conventional electrodes using non-conductive supports enables the registration of the electrochemical response of pure BiOI, thereby avoiding photocatalytic signals from the conductive supports (FTO or ITO) typically used for electrode fabrication. The photoelectrocatalytic response of the coatings revealed that the electrodes containing 20 wt.% of BiOI showed the highest photocurrent. In the presence of an aqueous solution containing CO2, BiOI-X3-20wt.%-NCG presented activity to perform the photoelectrochemical CO2RR. Finally, the photoactive BiOI material was evaluated for photocatalytic CO2 conversion in a gaseous phase. The evaluation showed an effective conversion registering CO as the reaction product; the results allowed for considering BiOI as a valuable material for coating fabrication for environmental remediation.
Supplementary Materials
The following supporting information can be downloaded at the website of this paper posted on Preprints.org.
Acknowledgments
The authors thank Secihti for financial support for this research through the following projects: Investigadoras e Investigadores por Mexico Secihti – ID7708. I want to thank L.Q.I, Milton Ronaldo Perez Magdaleno, for the technical assistance in performing the photocatalytic tests.
References
- Fernandez-Guzman, D.; et al. A scoping review of the health co-benefits of climate mitigation strategies in South America. The Lancet Regional Health - Americas 2023, 26, 100602. [Google Scholar] [CrossRef]
- Filonchyk, M.; et al. Greenhouse gases emissions and global climate change: Examining the influence of CO2, CH4, and N2O. Science of The Total Environment 2024, 935, 173359. [Google Scholar] [CrossRef]
- Prăvălie, R. Major perturbations in the Earth's forest ecosystems. Possible implications for global warming. Earth-Science Reviews 2018, 185, 544–571. [Google Scholar] [CrossRef]
- Deng, H.-M.; et al. Co-benefits of greenhouse gas mitigation: a review and classification by type, mitigation sector, and geography. Environmental Research Letters 2017, 12, 123001. [Google Scholar] [CrossRef]
- Chakravorty, A.; Roy, S. A review of photocatalysis, basic principles, processes, and materials. Sustainable Chemistry for the Environment 2024, 8, 100155. [Google Scholar] [CrossRef]
- Atacan, K.; Güy, N.; Özacar, M. Recent advances in photocatalytic coatings for antimicrobial surfaces. Current Opinion in Chemical Engineering 2022, 36, 100777. [Google Scholar] [CrossRef]
- Pichat, P. 4.16 - Photocatalytic Coatings, in Comprehensive Materials Processing, S. Hashmi; et al. Editors. 2014, Elsevier: Oxford. p. 413-423.
- Brattich, E.; et al. The effect of photocatalytic coatings on NOx concentrations in real-world street canyons. Building and Environment 2021, 205, 108312. [Google Scholar] [CrossRef]
- Gandolfo, A.; et al. The impact of photocatalytic paint porosity on indoor NOx and HONO levels. Physical Chemistry Chemical Physics 2020, 22, 589–598. [Google Scholar] [CrossRef]
- Yu, X.; et al. Facile one-step synthesis of BiOCl/BiOI heterojunctions with exposed {001} facet for highly enhanced visible light photocatalytic performances. Inorganic Chemistry Communications 2016, 71, 45–49. [Google Scholar] [CrossRef]
- Jagt, R.A.; et al. Controlling the preferred orientation of layered BiOI solar absorbers. Journal of Materials Chemistry C 2020, 8, 10791–10797. [Google Scholar] [CrossRef]
- Liu, J.; Shi, J.; Deng, H. Current status of research on BiOX-based heterojunction photocatalytic systems: Synthesis methods, photocatalytic applications and prospects. Journal of Environmental Chemical Engineering 2023, 11, 110311. [Google Scholar] [CrossRef]
- Zhang, X.; et al. A universal method for the preparation of functional ITO electrodes with ultrahigh stability. Chemical Communications 2015, 51, 6788–6791. [Google Scholar] [CrossRef]
- de la Cruz, P.T.S.; et al. Preparation of FTO/CU2O Electrode Protected by PEDOT:PSS and Its Better Performance in the Photoelectrocatalytic Reduction of CO2 to Methanol. Electrocatalysis 2020, 11, 546–554. [Google Scholar] [CrossRef]
- Sriwong, C.; Choojun, K.; Sriwong, S. High photocatalytic performance of 3D porous-structured TiO2@natural rubber hybrid sheet on the removal of indigo carmine dye in water. SN Applied Sciences 2019, 1, 864. [Google Scholar] [CrossRef]
- Burton, A.W.; et al. On the estimation of average crystallite size of zeolites from the Scherrer equation: A critical evaluation of its application to zeolites with one-dimensional pore systems. Microporous and Mesoporous Materials 2009, 117, 75–90. [Google Scholar] [CrossRef]
- Nandiyanto, A.B.D.; Zaen, R.; Oktiani, R. Correlation between crystallite size and photocatalytic performance of micrometer-sized monoclinic WO3 particles. Arabian Journal of Chemistry 2020, 13, 1283–1296. [Google Scholar] [CrossRef]
- Murillo-Sierra, J.C.; et al. Promoting multielectron CO2 reduction using a direct Z-scheme WO3/ZnS photocatalyst. Journal of CO2 Utilization 2022, 63, 102122. [Google Scholar] [CrossRef]
- Chico-Vecino, M.; et al. Preparation of WO3/In2O3 heterojunctions and their performance on the CO2 photocatalytic conversion in a continuous flow reactor. Journal of Environmental Chemical Engineering 2023, 11, 110372. [Google Scholar] [CrossRef]
- Buttersack, C. Modeling of type IV and V sigmoidal adsorption isotherms. Physical Chemistry Chemical Physics 2019, 21, 5614–5626. [Google Scholar] [CrossRef]
- Gediz Ilis, G. Influence of new adsorbents with isotherm Type V on performance of an adsorption heat pump. Energy 2017, 119, 86–93. [Google Scholar] [CrossRef]
- Karthik, P.; et al. Synthesis of highly visible light active TiO2-2-naphthol surface complex and its application in photocatalytic chromium(VI) reduction. RSC Advances 2015, 5, 39752–39759. [Google Scholar] [CrossRef]
- Zare, M.; et al. Evolution of rough-surface geometry and crystalline structures of aligned TiO2 nanotubes for photoelectrochemical water splitting. Scientific Reports 2018, 8, 10870. [Google Scholar] [CrossRef] [PubMed]
- Prasad Kafle, B. Effect of Precursor Fluorine Concentration Optical and Electrical Properties of Fluorine Doped Tin Oxide thin Films. Materials Today: Proceedings 2021, 47, 6389–6397. [Google Scholar] [CrossRef]
- Mora-Hernandez, J.M.; et al. An enhanced photo(electro)catalytic CO2 reduction onto advanced BiOX (X = Cl, Br, I) semiconductors and the BiOI–PdCu composite. Heliyon 2023, 9, e20605. [Google Scholar] [CrossRef]
Figure 1.
X-ray diffraction patterns for a) BiOI synthesized at different temperatures and b) BiOI synthesized at 160 °C, doubling (X2) and tripling (X3) the reagents amount.
Figure 1.
X-ray diffraction patterns for a) BiOI synthesized at different temperatures and b) BiOI synthesized at 160 °C, doubling (X2) and tripling (X3) the reagents amount.
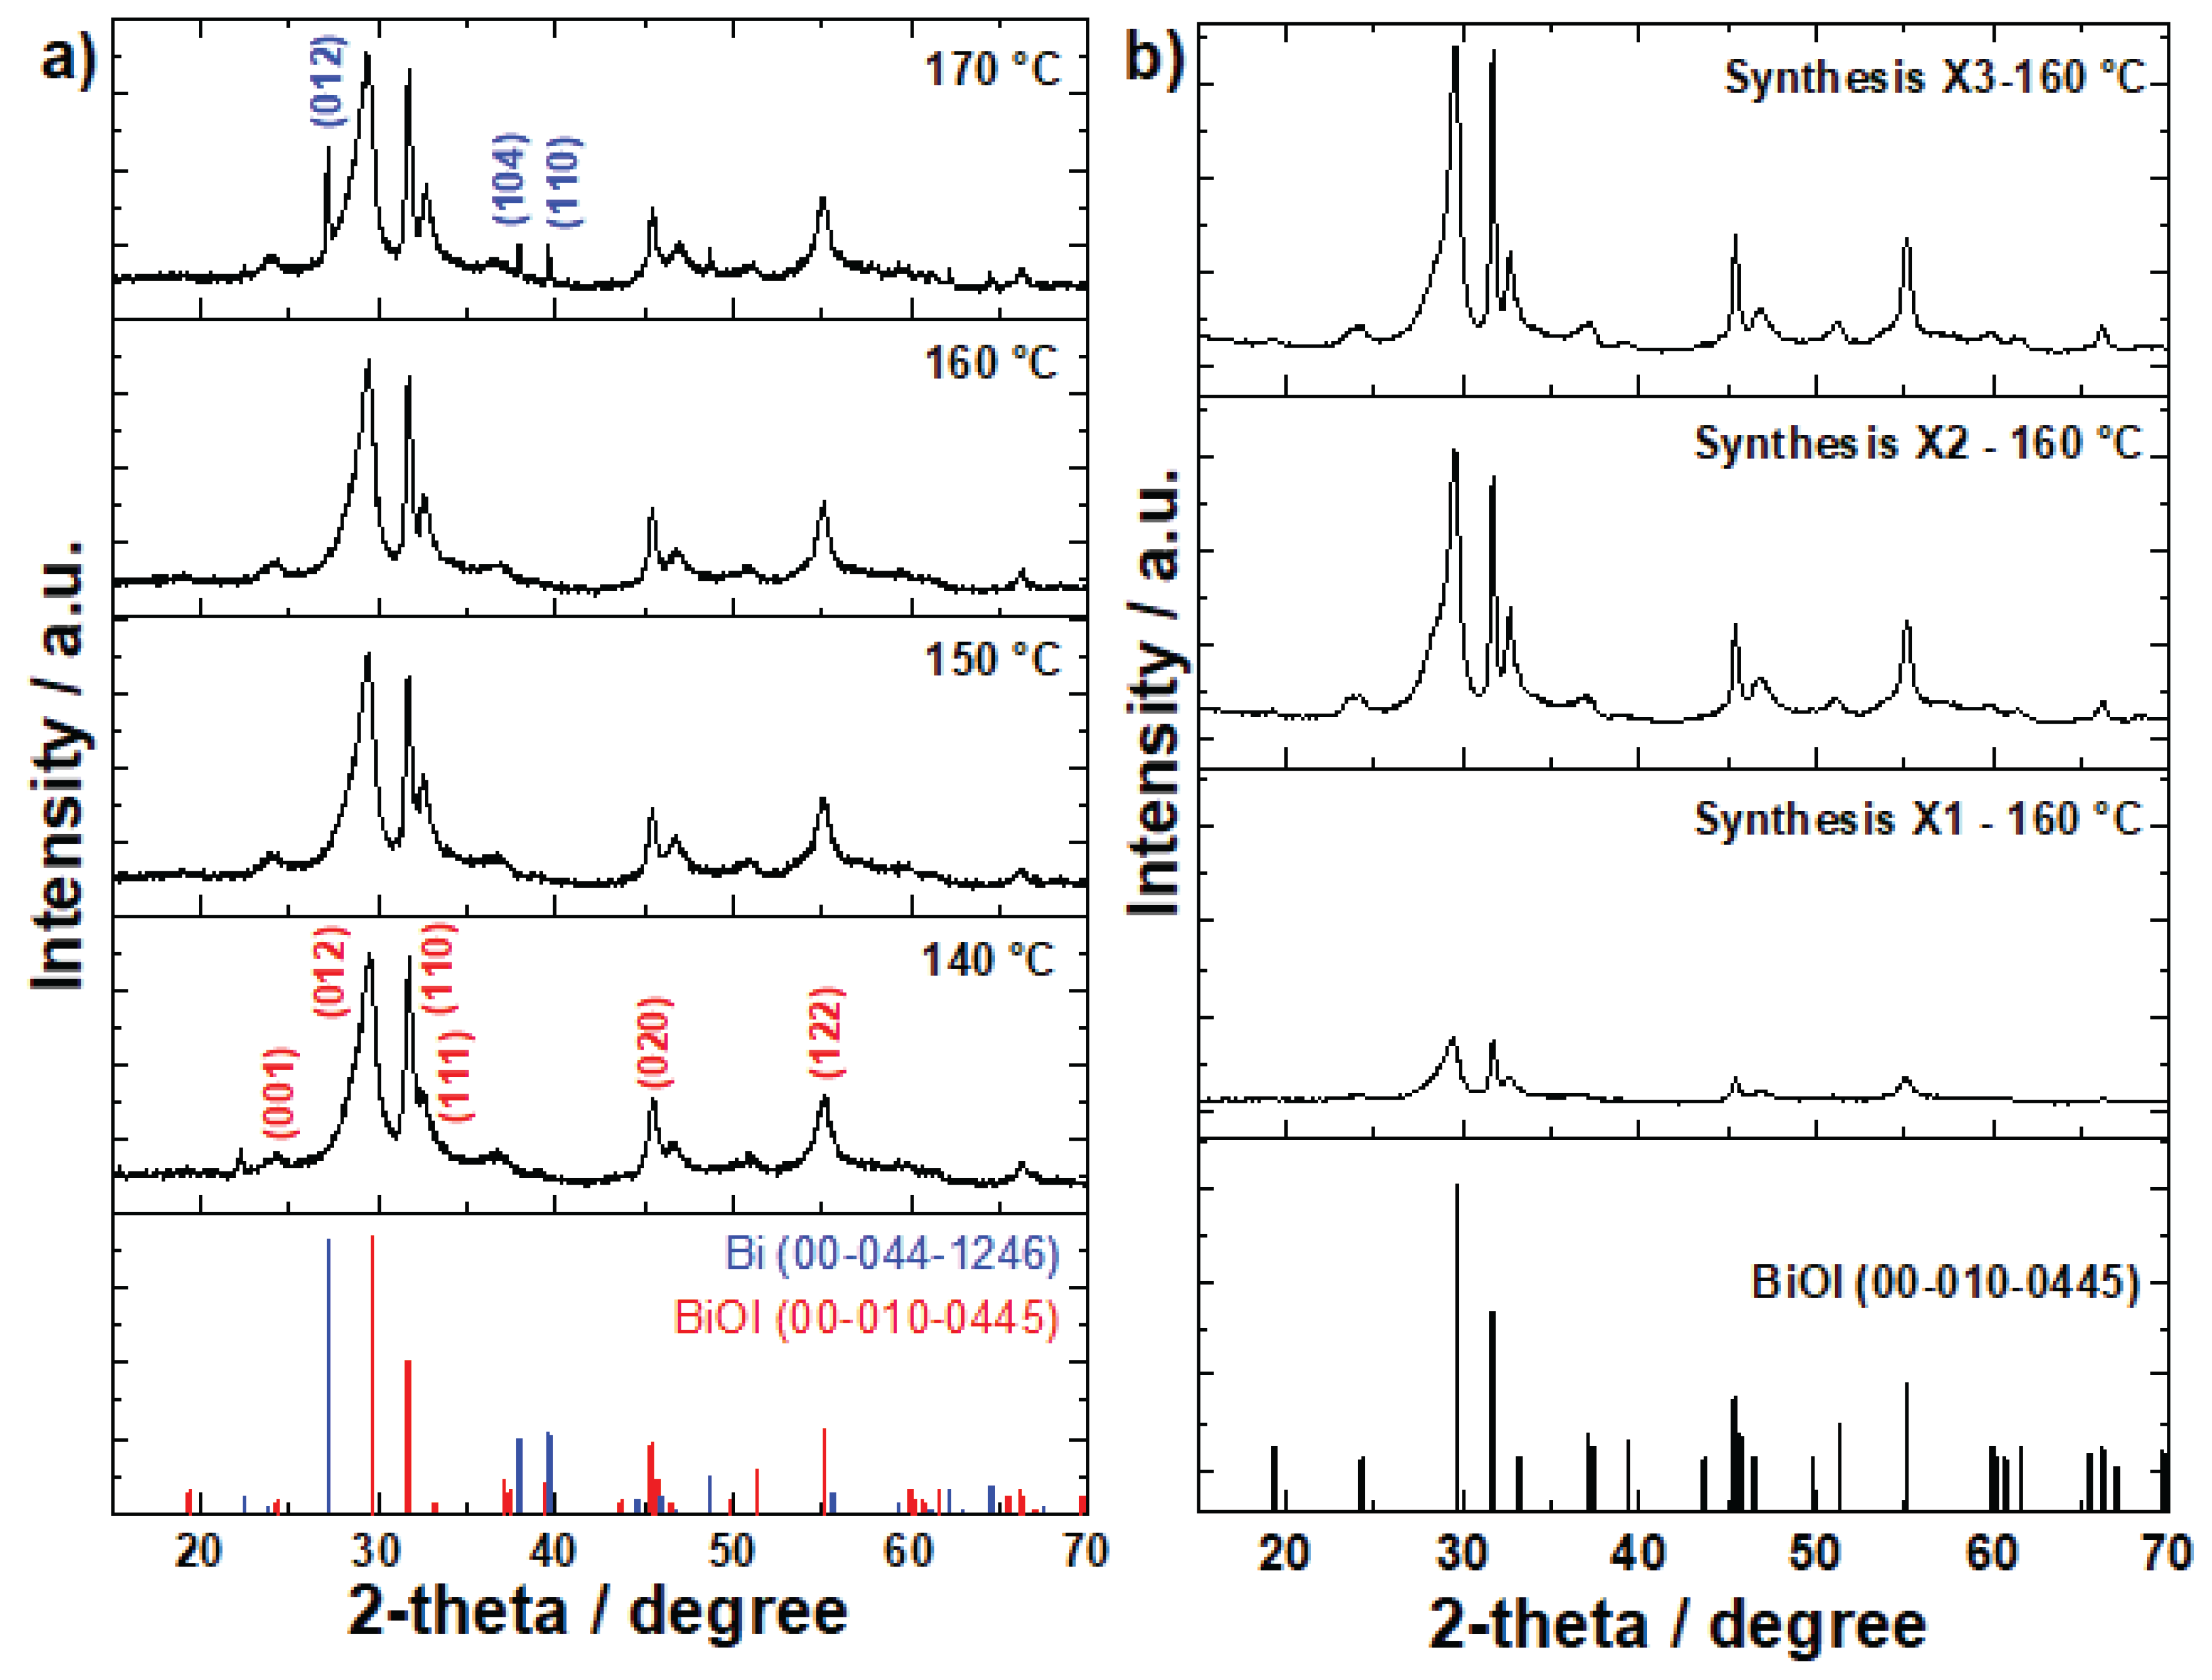
Figure 2.
Scanning electron microscopy at 10,000X for BiOI synthesized at a) 140 °C, b) 150 °C, c) 160 °C, and d) 170 °C.
Figure 2.
Scanning electron microscopy at 10,000X for BiOI synthesized at a) 140 °C, b) 150 °C, c) 160 °C, and d) 170 °C.
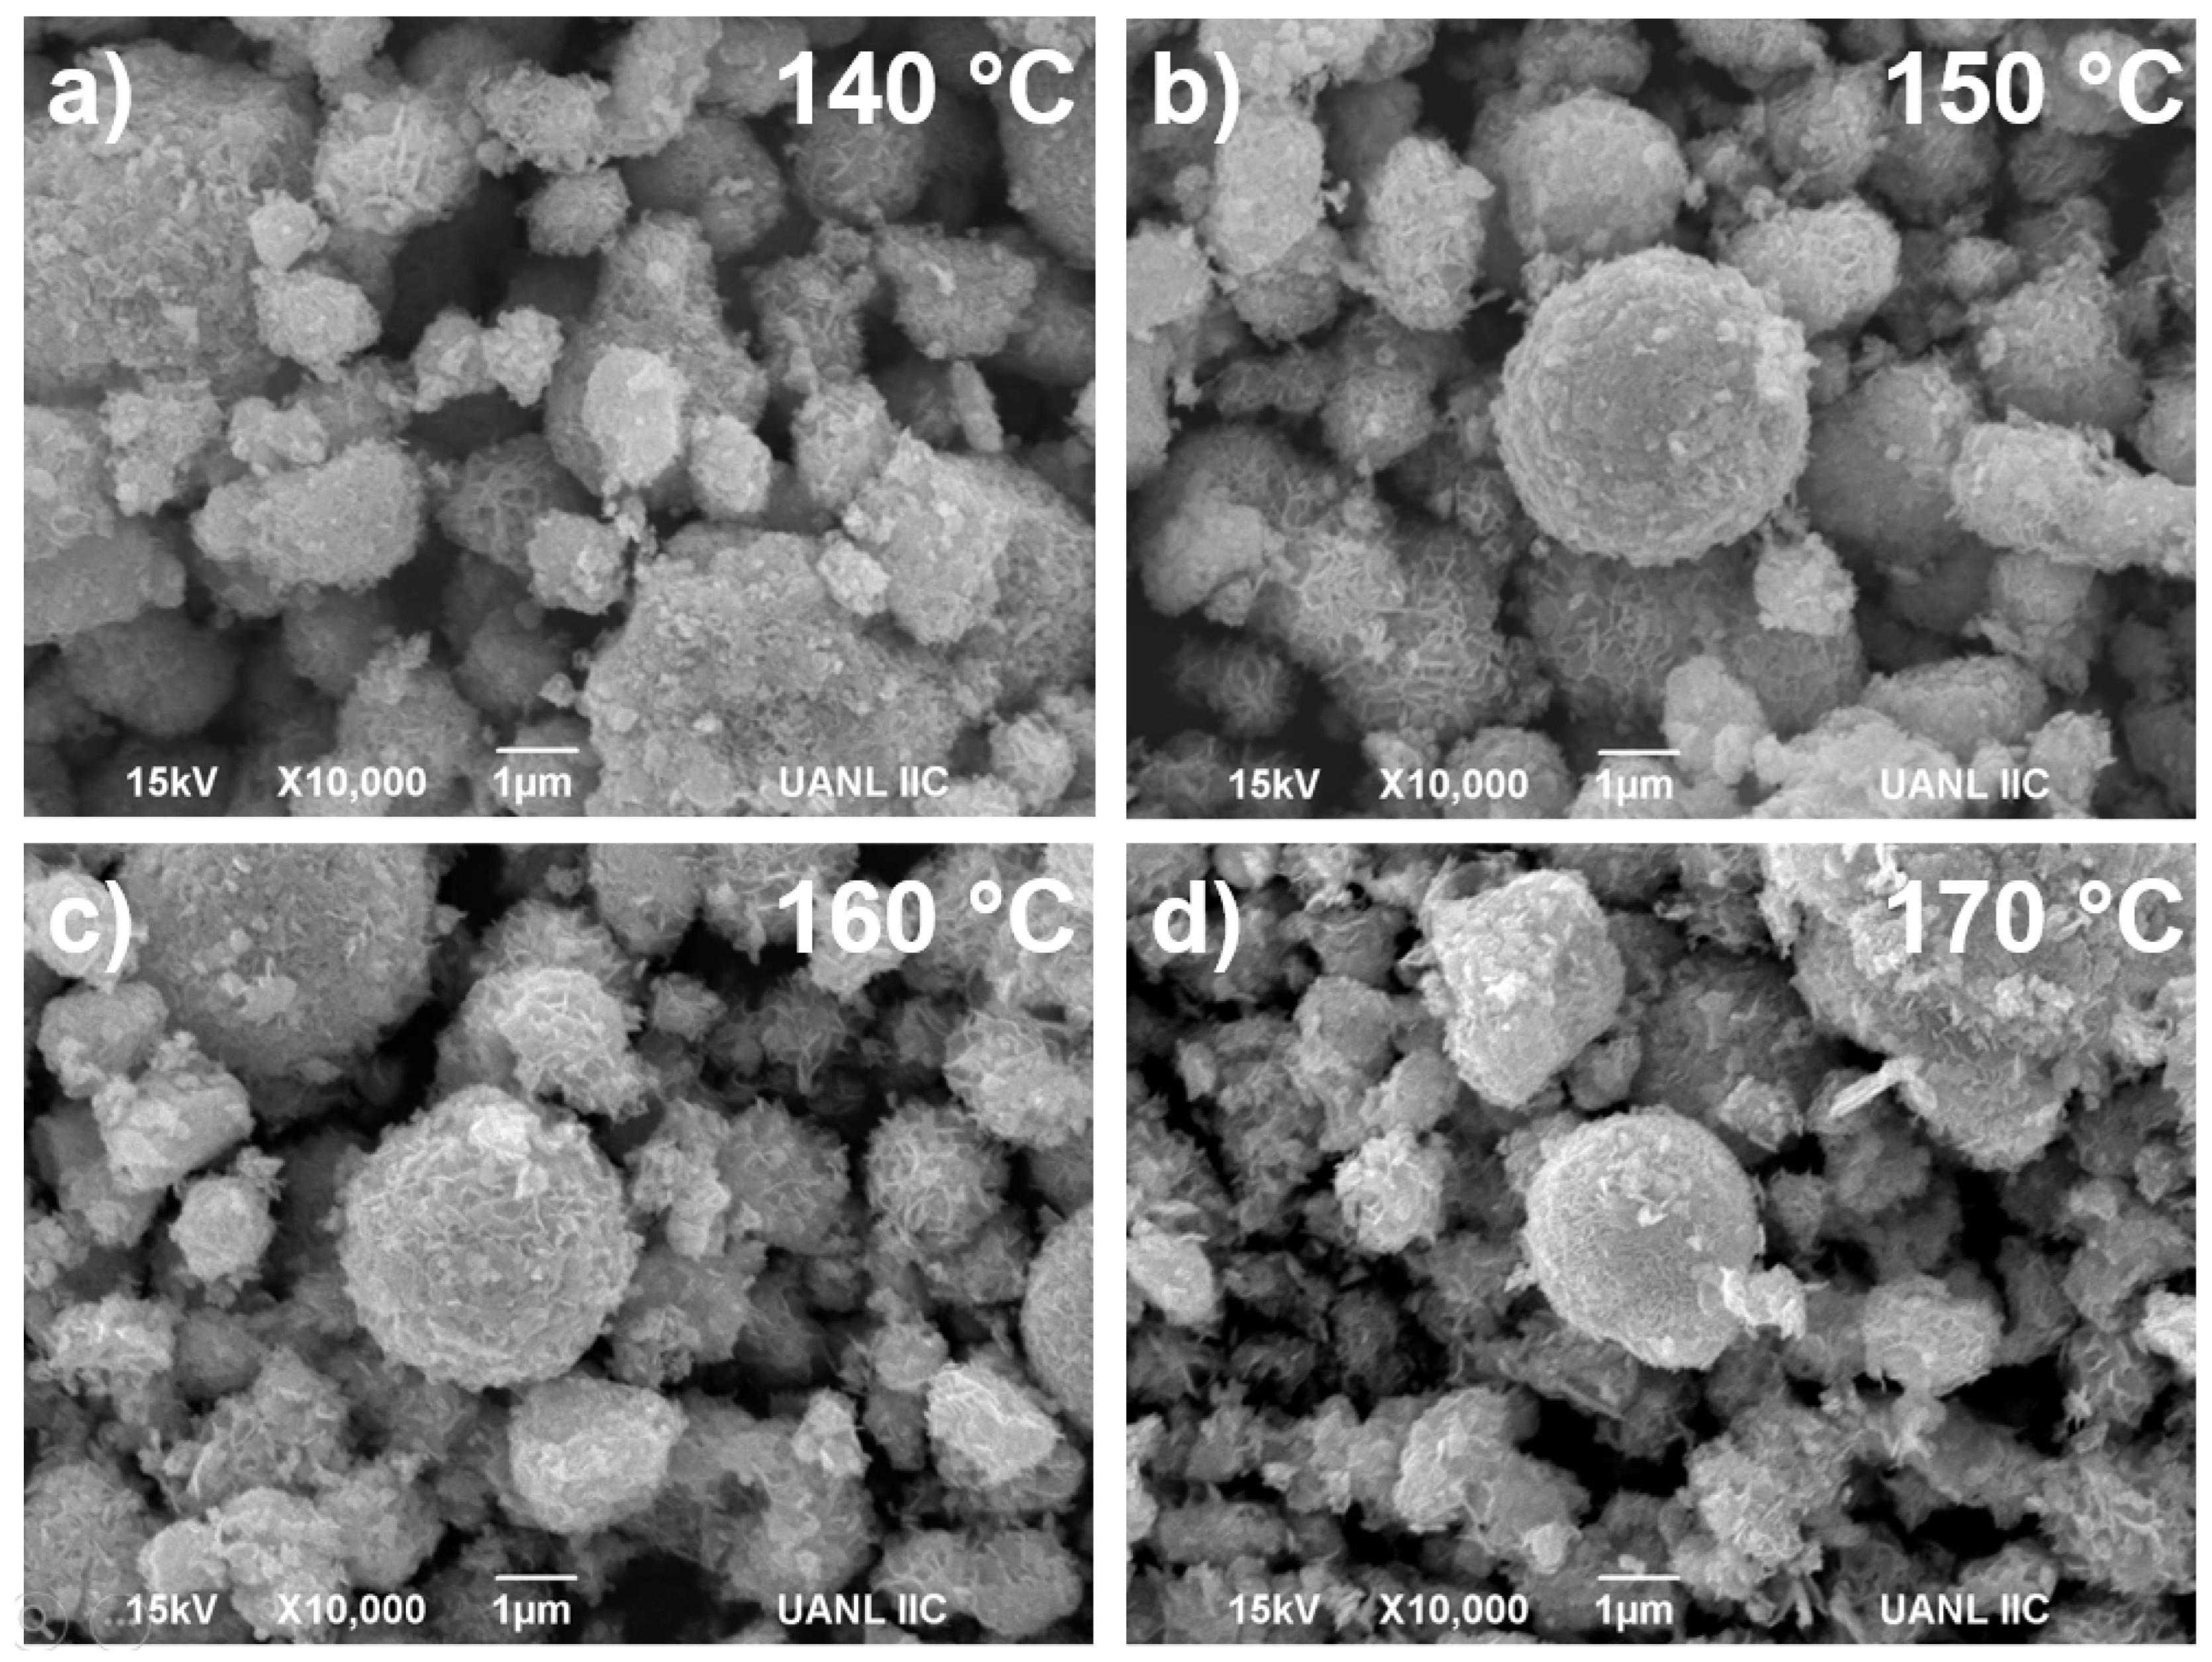
Figure 3.
Scanning electron microscopy at 20,000X for BiOI at 160 °C; a) (X1), b) doubling (X2), and c) tripling (X3) the reagents amount.
Figure 3.
Scanning electron microscopy at 20,000X for BiOI at 160 °C; a) (X1), b) doubling (X2), and c) tripling (X3) the reagents amount.
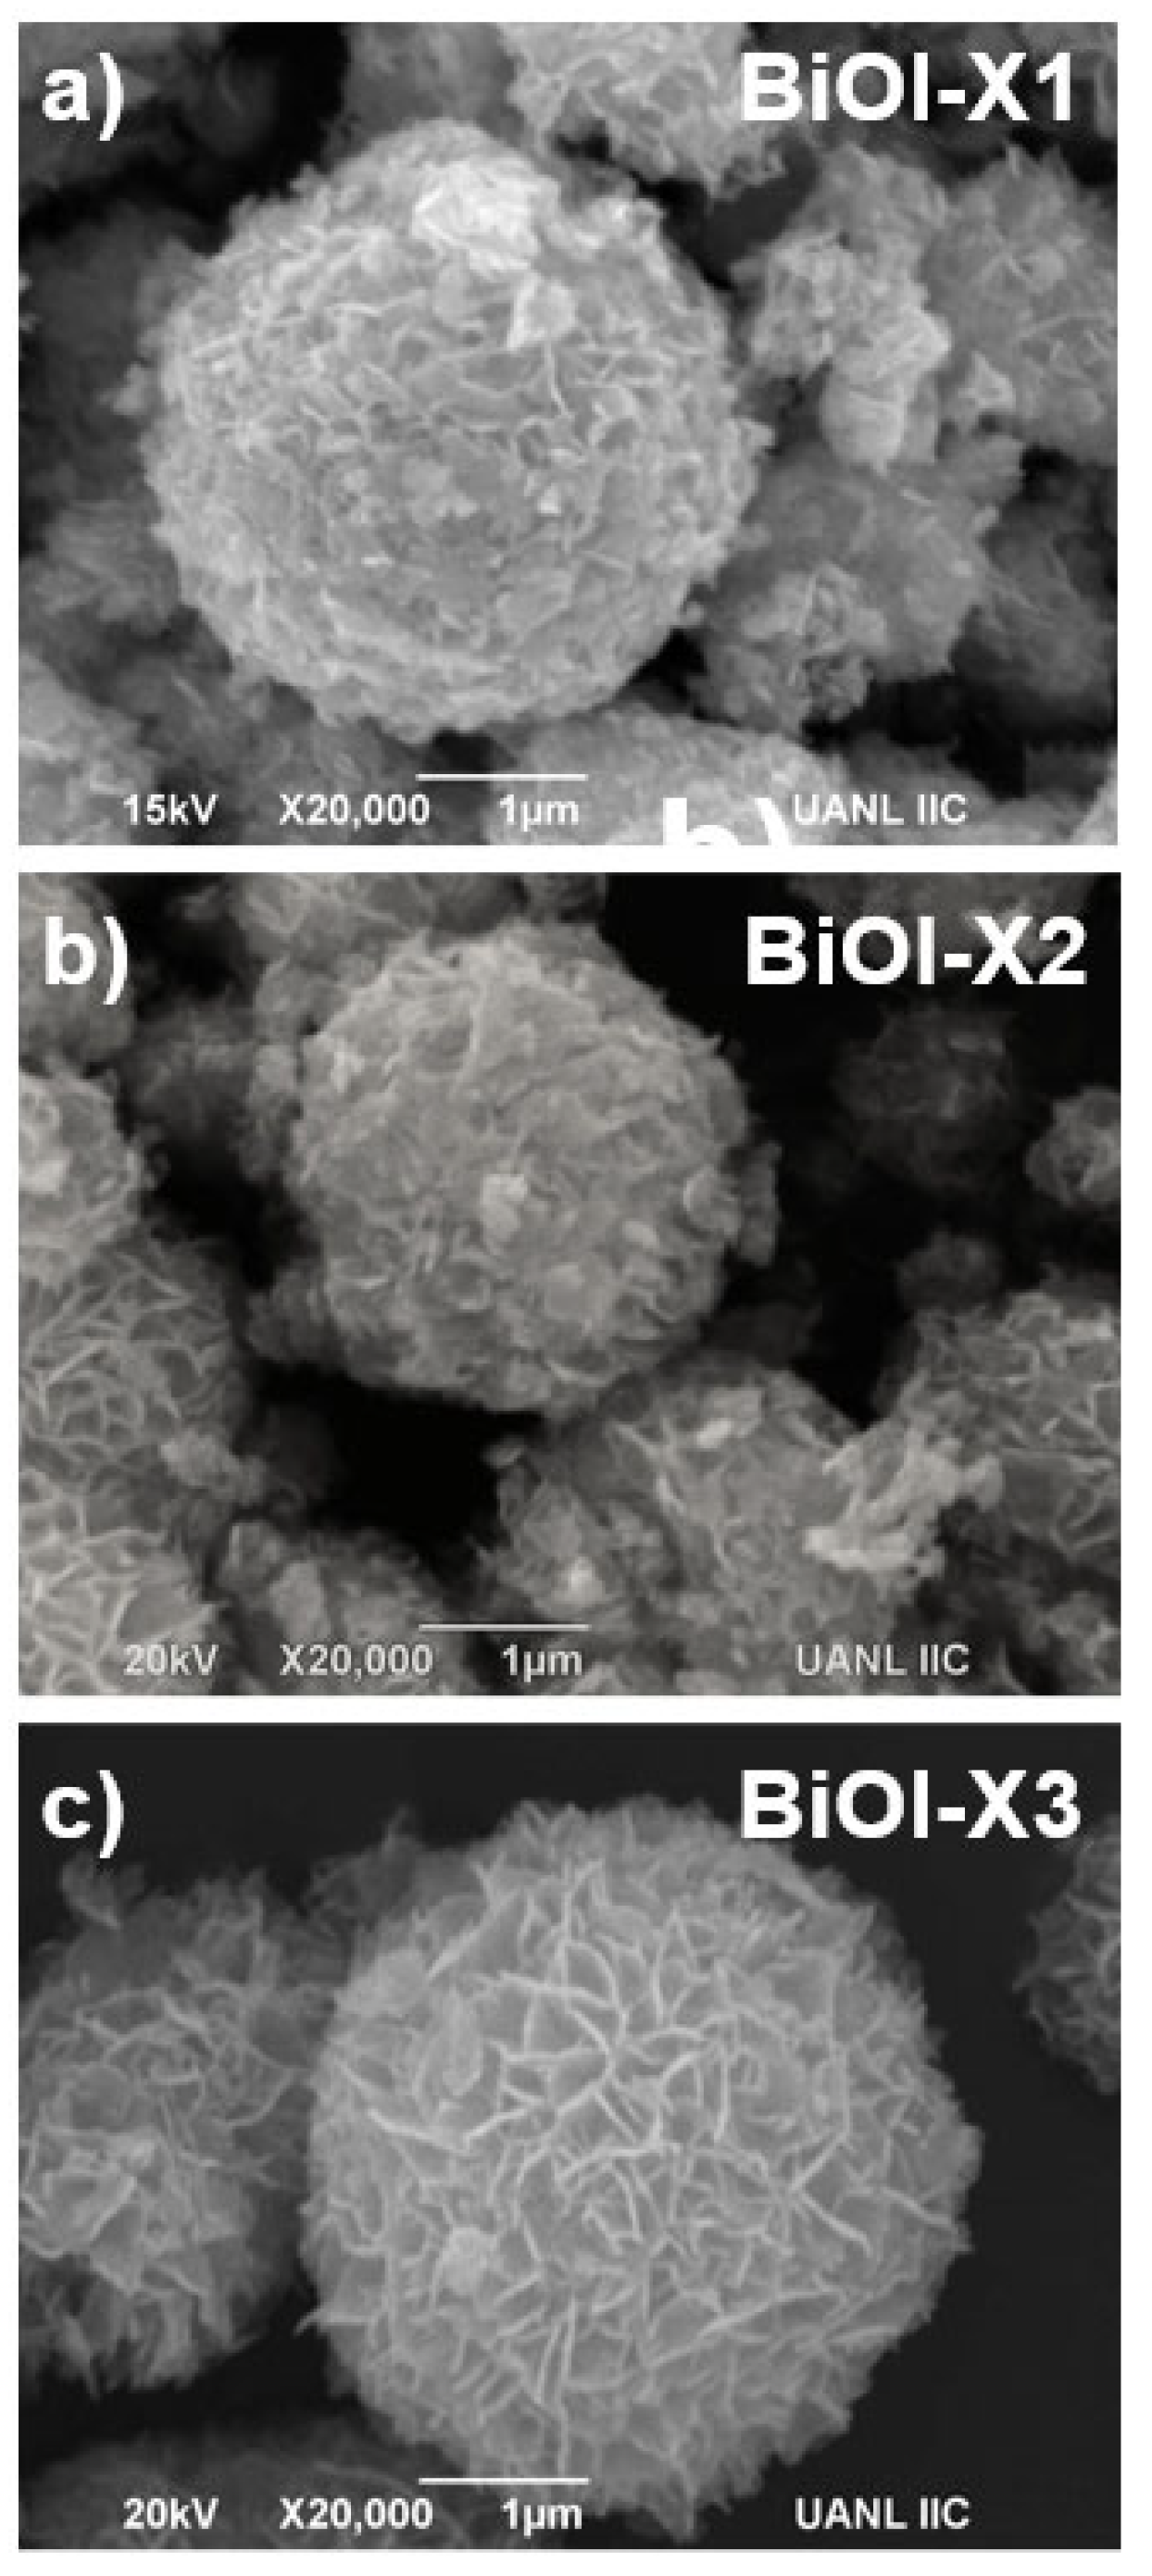
Figure 4.
a) N2 adsorption-desorption isotherms and b) Surface area (asBET) and pore radius estimations.
Figure 4.
a) N2 adsorption-desorption isotherms and b) Surface area (asBET) and pore radius estimations.
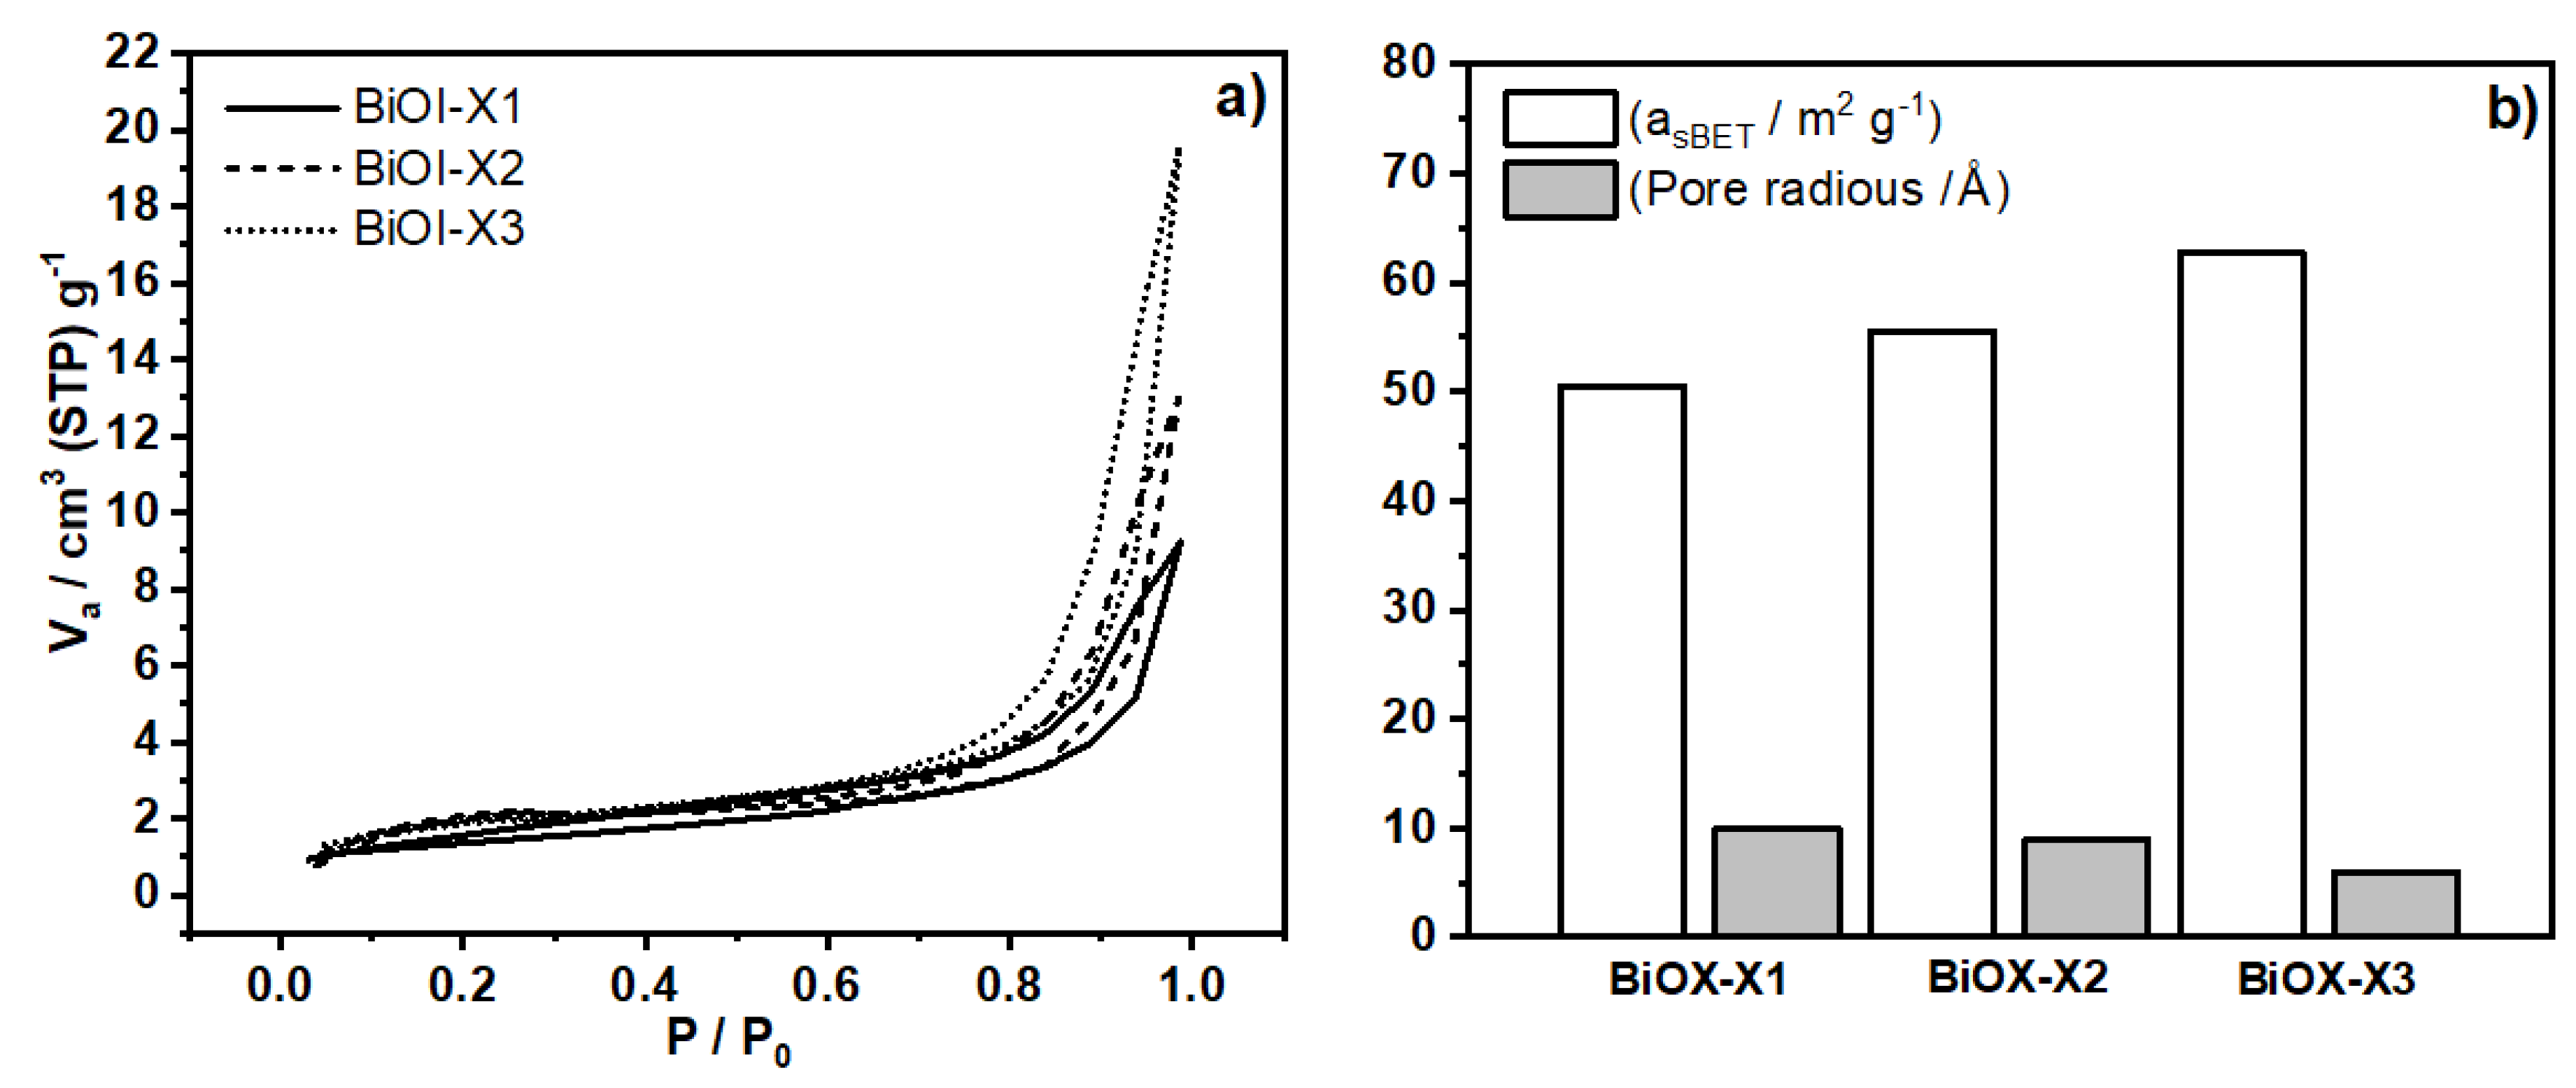
Figure 5.
OCP transient measurements for a) FTO glass, b) BiOI onto FTO glass, c) NCG, and d) BiOI onto NCG.
Figure 5.
OCP transient measurements for a) FTO glass, b) BiOI onto FTO glass, c) NCG, and d) BiOI onto NCG.
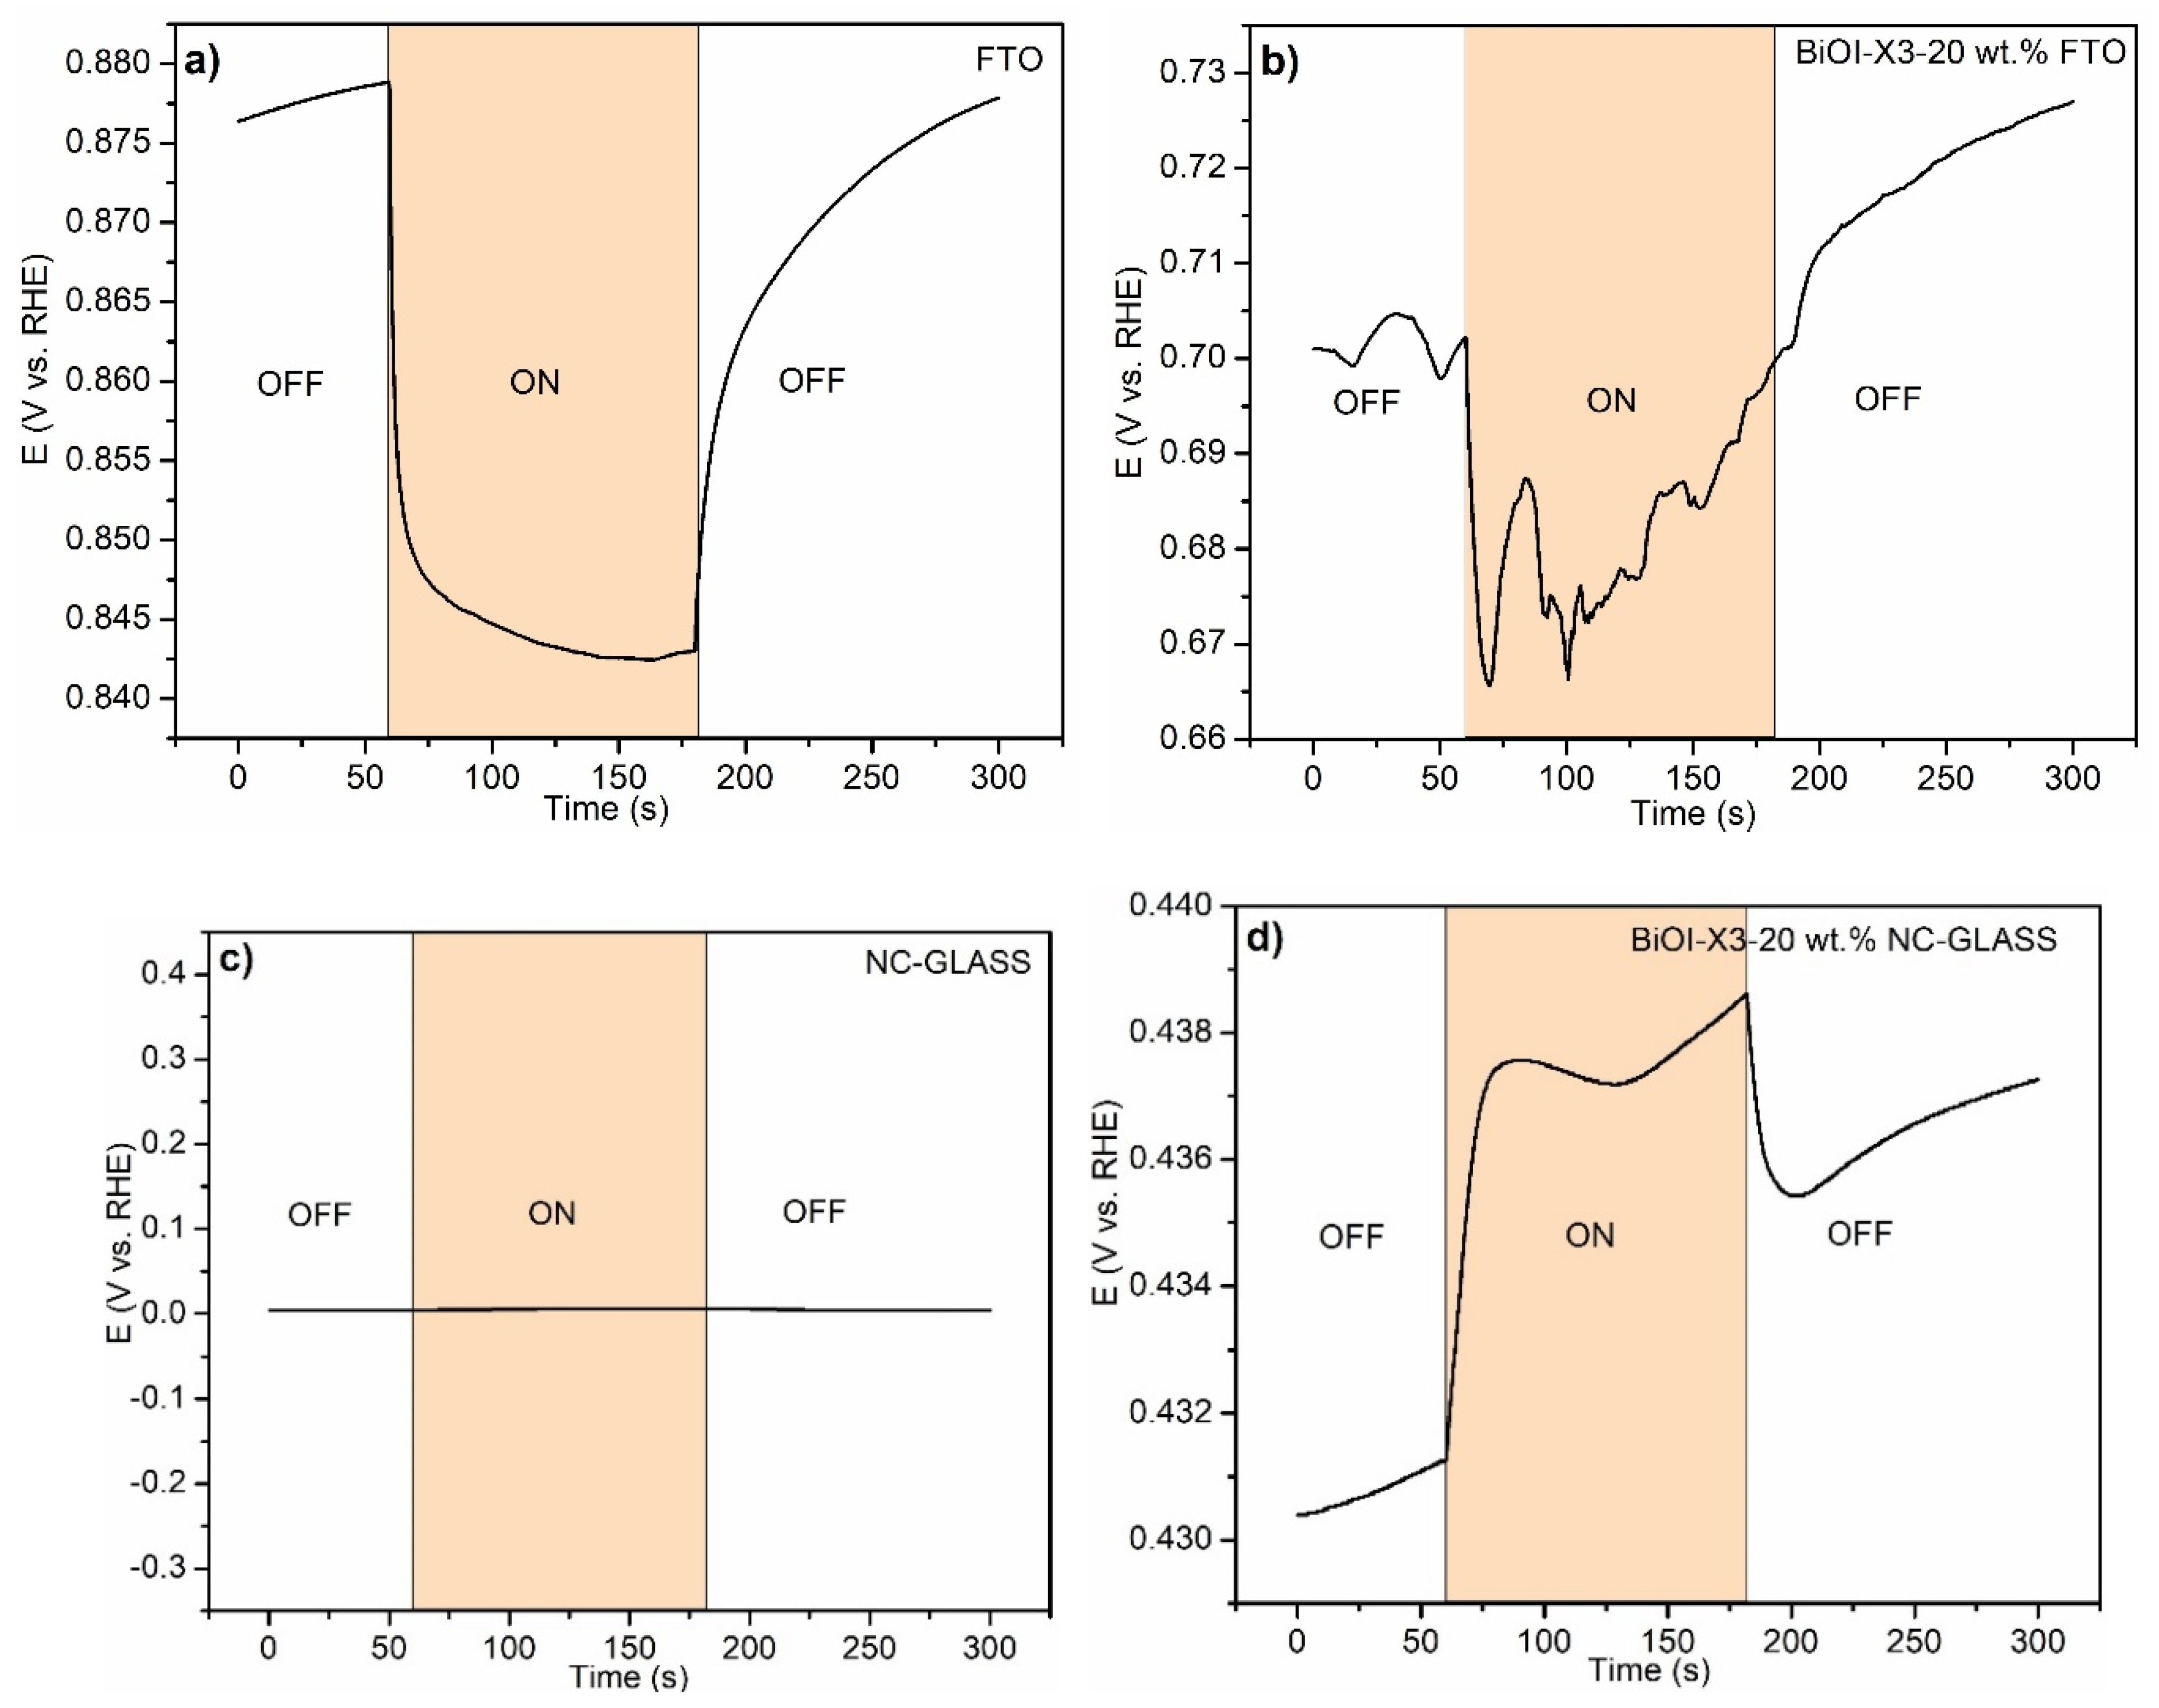
Figure 6.
a) Chronoamperometry transient measurements for a) FTO glass, b) BiOI onto FTO glass, c) NCG, and d) BiOI onto NCG.
Figure 6.
a) Chronoamperometry transient measurements for a) FTO glass, b) BiOI onto FTO glass, c) NCG, and d) BiOI onto NCG.
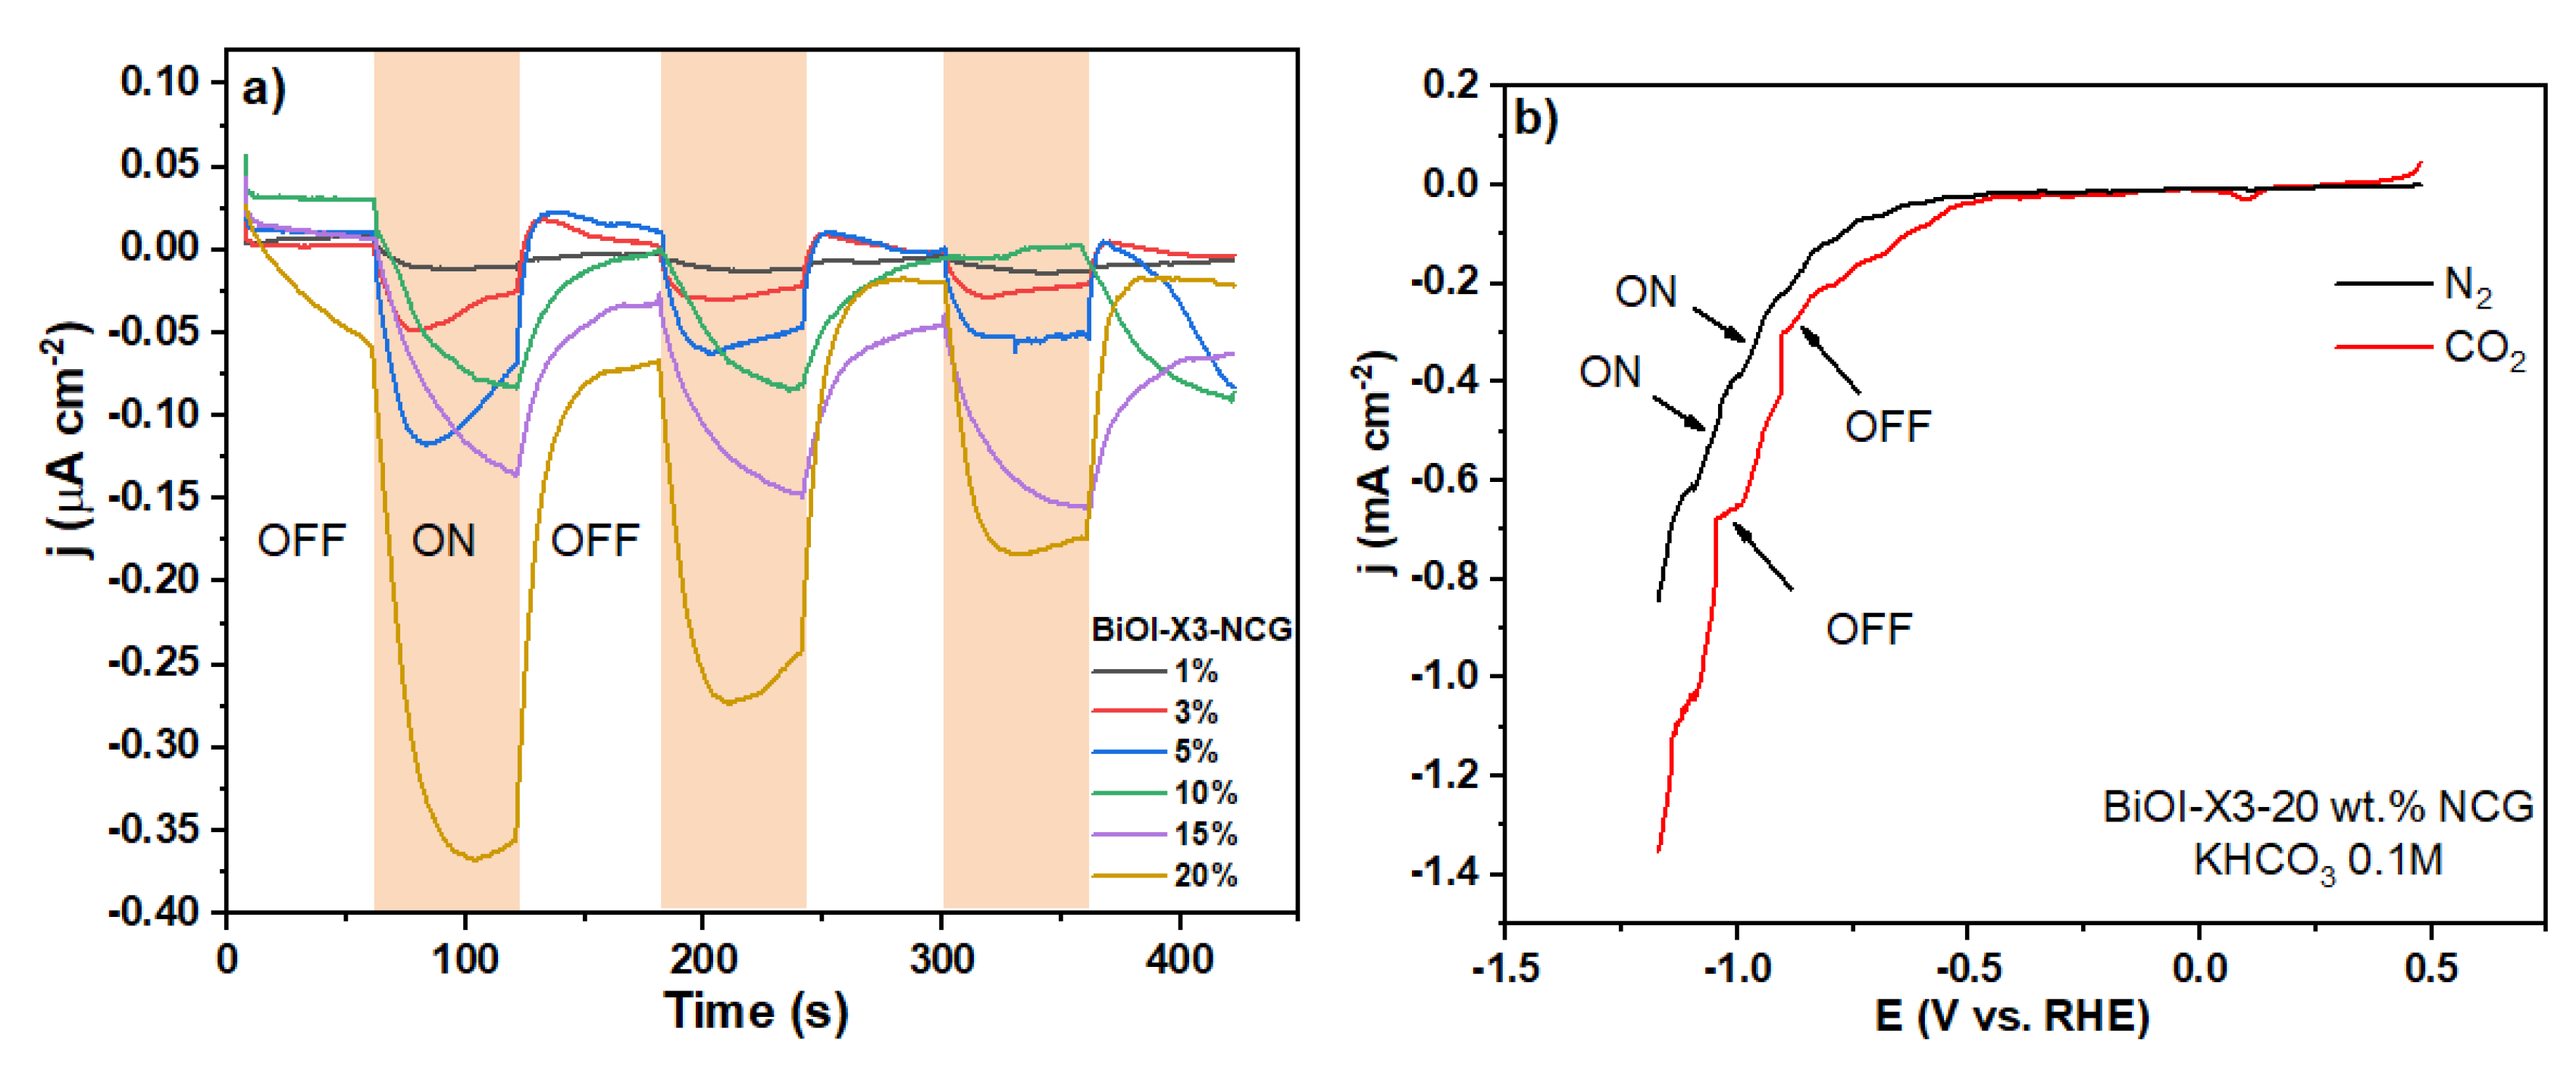
Figure 7.
a) Experimental arrangement for the photocatalytic evaluation in gaseous media, b) CO photocatalytic production in gaseous media.
Figure 7.
a) Experimental arrangement for the photocatalytic evaluation in gaseous media, b) CO photocatalytic production in gaseous media.
Disclaimer/Publisher’s Note: The statements, opinions and data contained in all publications are solely those of the individual author(s) and contributor(s) and not of MDPI and/or the editor(s). MDPI and/or the editor(s) disclaim responsibility for any injury to people or property resulting from any ideas, methods, instructions or products referred to in the content. |
© 2025 by the authors. Licensee MDPI, Basel, Switzerland. This article is an open access article distributed under the terms and conditions of the Creative Commons Attribution (CC BY) license (http://creativecommons.org/licenses/by/4.0/).
Copyright: This open access article is published under a Creative Commons CC BY 4.0 license, which permit the free download, distribution, and reuse, provided that the author and preprint are cited in any reuse.


