
Submitted:
19 June 2025
Posted:
19 June 2025
You are already at the latest version
Preprints on COVID-19 and SARS-CoV-2
Abstract
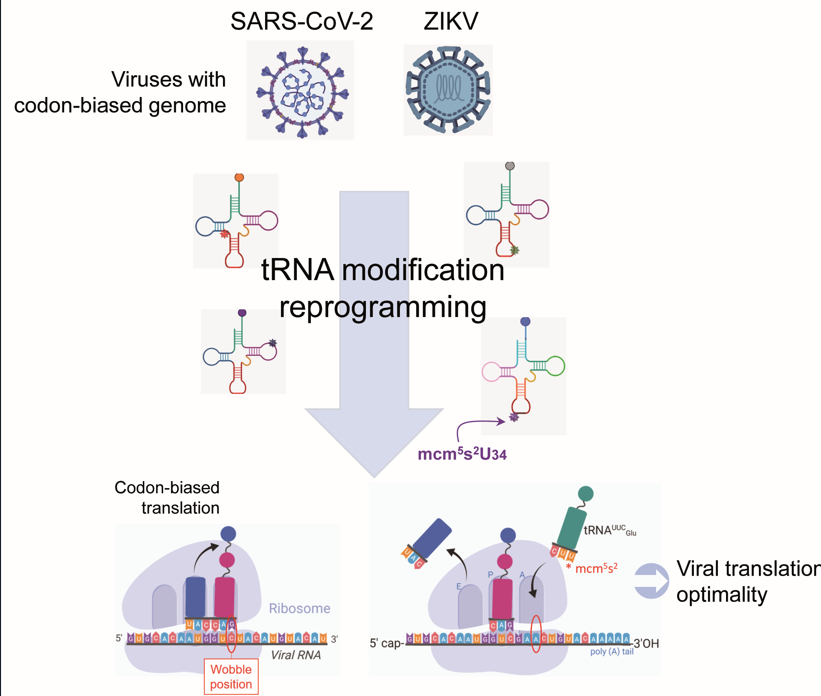
tRNA modifications are crucial for efficient protein synthesis, impacting codon recognition, tRNA stability, and translation rates. RNA viruses hijack the host’s translational machinery, including the pool of modified tRNA, to translate their own genomes. However, the mismatch between viral and host codon usage can lead to limited availability of specific tRNA leading to ribosome stalling, and posing a significant challenge for efficient protein translation. While some viruses address this challenge through codon optimization, we show here that SARS-CoV-2 (Coronavirus) and Zika virus (ZIKV; Flavivirus) adopt a different approach, manipulating the host tRNA epitranscriptome. Analysis of codon bias indices confirmed substantial divergence between viral and host codon usage, revealing a strong preference in viral genes for codons decoded by tRNAs requiring U34 wobble modification. Monitoring tRNA modification dynamics in infected cells showed that both SARS-CoV2 and ZIKV enhance U34 tRNA modifications during infection. Strikingly, impairing U34 tRNAs profoundly impacted viral replication underscoring the strict reliance of SARS-CoV-2 and ZIKV on manipulating the host tRNA epitranscriptome to support efficient translation of their genome.
Keywords:
SARS-CoV-2
; ZIKV
; tRNA epitranscriptome
; codon bias
; translation
1. Introduction
Transfer RNA (tRNA) modifications are essential for protein synthesis and overall cellular function [1]. These modifications, which include methylation, thiolation, and other more complex forms [2], occur at various positions within the tRNA molecule, especially in the anticodon loop [3,4,5]. By influencing codon recognition, tRNA stability, and ribosome interactions, these modifications impact the efficiency and accuracy of translation [6]. They modulate tRNA affinity for specific codons, stabilize tRNA structure, and regulate translation rates. The diverse combination of possible modifications allows for precise tuning of tRNA function across different cellular contexts. Furthermore, tRNA modification levels are dynamically regulated in response to environmental changes and cellular stress, with some modifications even being actively reversed [7,8]. This dynamic regulation of tRNA modifications contributes to cellular fitness and protein homeostasis under diverse conditions [3,9] and also plays a role in viral infections [10].
Among these modifications, the mcm5s2U (5-methoxycarbonylmethyl-2-thiouridine) modification at the U34 position (wobble base) of tRNA is critically important [11,12]. Eukaryotic cells use a single tRNA species (tRNALysUUU, tRNAGlnUUG, tRNAGluUUC) with a U at position 34 to decode both AA- and AG-ending codons (AAA/G for Lys, CAA/G for Gln, GAA/G for Glu). However, efficient translation of the AA-ending codons depends significantly on the presence of the mcm5s2U modification at U34. This dependence on U34 modifications for proper decoding extends beyond Lys, Gln, and Glu to other amino acids with A-ending codons [13], including Arg (AGA/G), Ser (UCA/G), and Pro (CCA/G), whose respective tRNAs also require U34 modifications (mcm5U for tRNAArgUCU; ncm5U for tRNASerUGA and tRNAProUGG).
The redundancy of the genetic code, where multiple synonymous codons can specify a single amino acid, results in codon usage bias (CUB), which varies between organisms [14]. tRNA modifications, particularly those within the anticodon-stem-loop region, are crucial for decoding certain synonymous codons and, in concert with a gene's specific CUB, influence both the efficiency and accuracy of protein translation [15].
Viruses must use host cell machinery for protein synthesis, but differences between viral and host codon usage bias (CUB) can lead to inefficient translation due to limited tRNA availability. Some viruses have evolved to match their host's CUB patterns, optimizing their protein production efficiency. Studies have demonstrated that viruses with narrow host ranges exhibit a higher degree of codon usage matching with their hosts compared to broad-spectrum viruses [16]. This adaptation process has been observed in canine parvovirus type 2 (CPV-2), which progressively aligned its CUB with that of its new canine host after jumping from felines [17]. Similar observations have more recently been made in the case of Porcine epidemic diarrhea virus (PEDV) [18] and Avian Influenza A viruses (AIVs) [19] that both adapted their CUB to better fit to their respective host codon preferences. Coincidentally, where viral and host codon usage are inherently similar, as exemplified by poliovirus (PV) [20] and foot-and-mouth disease virus (FMDV) [21], competition for tRNAs for protein synthesis can attenuate viral translation [22]. Nevertheless, the vast majority of RNA viruses have not followed this evolutionary path. Instead, they have developed an alternative strategy, the focus of this report, based on the manipulation of tRNA modifications to enhance viral protein synthesis. We illustrate this strategy using two unrelated RNA viruses that recently emerged and triggered global threats, the Coronavirus SARS-CoV-2 and the Flavivirus Zika (ZIKV).
SARS-CoV-2, which caused the COVID-19 pandemic [23,24], has tragically affected global health, infecting over 600 million people and resulting in more than 6 million deaths (https://covid19.who.int). This betacoronavirus, with a positive-sense, single-stranded RNA genome of ~30 kb, is closely related to other human-infecting coronaviruses, including SARS-CoV-1 and MERS-CoV. Along with other betacoronaviruses (like HCoV-HKU1 and HCoV-OC43), and alphacoronaviruses (like HCoV-229E and HCoV-NL63), it belongs to the Nidovirales order. Given their shared classification, SARS-CoV-1 and MERS-CoV exhibit similar structural features to SARS-CoV-2 already detailed [25,26], and were thus included in downstream codon analyses.
ZIKV, a mosquito-borne flavivirus, causes serious neurological disorders in human, including microcephaly in newborns. Discovered in Uganda in 1947 and initially causing sporadic cases, ZIKV later caused major outbreaks in the Pacific and South America, facilitated by the widespread Aedes mosquito vectors. The 2015 outbreak in Brazil rapidly spread throughout Latin America and the Caribbean [27,28,29]. ZIKV has a ~10.7 kb positive-sense single-stranded RNA genome encoding a polyprotein that is processed into structural and non-structural proteins. Our codon analysis will also include two related Flaviviruses: West Nile virus (WNV), spread by Culex mosquitoes and capable of infecting birds, humans, and horses worldwide, and Usutu virus (USUV), a more recent emergence in Africa and Europe, also primarily transmitted by Culex mosquitoes. While USUV predominantly affects birds, human infections are rare.
We first investigated the relationship between viral and host codon usage by comparing viral codon adaptation index (CAI) to that of human genes across a wide range of expression levels, and further analyzing relative synonymous codon usage (RSCU). This approach revealed how much each virus's codon bias differs from that of highly expressed human genes. Additionally, it uncovered the preference of both viruses for codons interpreted by cognate tRNAs carrying U34 modifications, referred to as U34-sensitive codons [25]. Concomitantly, we experimentally showed that SARS-CoV-2 and ZIKV infections induce a substantial increase in U34 tRNA modifications (ncm5U, mcm5U, and mcm5s2U), consistent with the high prevalence of U34-sensitive codons in the viral genomes. Finally, we further validated the critical dependence of both viruses on enhanced U34 tRNA modification by the observation of profoundly decreased translation and attenuated replication upon impairment of normal U34-modified tRNA generation in target cells.
This research represents a significant advance in our understanding of viral strategies for survival and replication, potentially opening new avenues for therapeutic intervention in viral diseases.
2. Results
2.1. Analysis of SARS-CoV-2 and ZIKV Codon Bias
The Codon Adaptation Index (CAI) measures the extent to which a gene's codon usage aligns with that of highly expressed genes within a given organism [30]. It is particularly useful for evaluating codon usage compatibility between a virus and its host, with values ranging from 0 (indicating no adaptation) to 1 (signifying perfect adaptation to the host). We first compared the CAI values of coronaviruses and flaviviruses to those of human genes expressed at varying protein levels. As shown in Figure 1A, the CAI calculated for the entire viral genome suggests that neither of SARS-CoV2 nor ZIKV are fully adapted to the human host. SARS-CoV-2, with a CAI of 0.701, aligns with human genes that are poorly expressed in human cells, while ZIKV, with a CAI of 0.756, shows slightly better compatibility with the human environment. However, neither of these viruses achieves CAI values comparable to those of the most highly expressed human genes, such as beta-tubulin, GAPDH or beta-myosin. Figure 1B shows the CAI values caculated for individual viral gene segments, revealing their deviation from the overall viral CAI. Notably, among the viral genes, E in SARS-CoV-2 and NS2B in ZIKV exhibit the lowest host adaptation, while N in SARS-CoV-2 and NS1 in ZIKV are adapted to humans. In addition, SARS-CoV-2 genes, as a whole, display lower Nc (total number of codons used) values than ZIKV genes, indicating a more restricted codon usage and thus, a stronger codon usage bias.
The use of Relative Synonymous Codon Usage (RSCU) provides a more detailed view of codon usage bias compared to CAI [31], revealing the specific codons that each virus preferentially uses in comparison to its host [32]. Analysis of over-represented (RSCU > 1.6) and under-represented (RSCU < 0.6,) codons showed similar codon usage patterns within the Coronavirus and the Flavivirus families (Figure 1C). However, these patterns differed significantly from those of their respective hosts (humans for coronaviruses, and both humans and Aedes aegypti mosquitoes for flaviviruses). A closer examination showed that coronaviruses collectively favors 35 overused codons and 47 underused codons, while flaviviruses exhibit a more moderate bias, with 13 overused codons and 30 underused codons in flavivirus, suggesting again stronger codon usage preferences in coronavirus. Even if the three coronaviruses share similar codon usage patterns, SARS-CoV-2 demonstrates the most pronounced difference in codon usage compared to its human host. To a lower extend, ZIKV shows slightly more differences to its hosts than the two other flaviviruses.
To investigate the relationship between viral codon usage and human protein expression, we performed hierarchical clustering and principal component analysis (PCA) based on RSCU values, incorporating human genes with varying protein abundance (as defined in Figure 1A) (Figure 2A,B). This analysis revealed distinct clustering patterns, effectively separating highly expressed human genes from the viral sequences. Notably, coronavirus sequences clustered closely with poorly expressed human proteins, consistent with the PCA results shown in Figure 2B. In contrast, flavivirus sequences occupied an intermediate position, indicating a codon usage pattern distinct from both highly expressed human proteins and from coronaviruses. Specifically, both SARS-CoV-2 and, to a lesser extent, ZIKV demonstrate a prominent preference for codons read by tRNAs modified at the U34 wobble position, including ncm5U (noted as “o”), mcm5U (“oo”), or mcm5s2U (“ooo”). It is clearly the case for SerUCA, ThrACA, ProCCA, ArgAGA, GluCAA and to a lesser degree LysAAA and GlnCAA. While ZIKV displays approximately half the number of U34-sensitive codon as SARS-CoV-2, the trend remains significant. Given the crucial role of U34 tRNA modifications in efficient decoding, both viral genomes likely employ a shared mechanism to optimize translation by leveraging specific, and potentially limiting, host tRNA species.
2.2. tRNA Modification Remodeling During ZIKV and SARS-CoV-2 Infection
We previously observed distinct codon usage biases in ZIKV and SARS-CoV-2, raising the hypothesis that these viruses manipulate host tRNA modification patterns to optimize translation. To investigate this, we used mass spectrometry to measure tRNA modification levels in ZIKV-infected astrocytes and SARS-CoV-2-infected Caco2 cells at 24 hours post-infection (Figure 3). Both viruses induced significant alterations in the host tRNA modification profile, notably affecting modifications at the wobble U34 position although the specific direction and magnitude of these changes, as well as changes in other modifications (Figure 3A,C,D), differed significantly between ZIKV and SARS-CoV-2. This suggests that each virus has evolved distinct strategies to manipulate the U34 modification pathway (Figure 3B). These findings highlight the importance of U34 modifications during viral infection and suggest a key mechanism by which viruses fine-tune host translation.
2.3. Impaired U34 tRNA Generation Decreases Translation and Limits SARS-CoV-2 and ZIKV Replication
Elongator complex deficiency in Familial Dysautonomia impairs SARS-CoV-2 and ZIKV replication - While these data provide strong evidence for virus-induced changes in U34 tRNA modification, a direct assessment of the causal link between these modifications and viral translation remained to be established. To definitively assess the role of U34 modifications in viral replication, we next infected cells with impaired U34 modification pathways. We first made use of human primary fibroblasts derived from patients affected by Familial Dysautonomia (FD) (Figure 4A), a condition characterized by the loss of Elp1 expression (IKBKAP-/-) [34] a key component of the Elongator complex essential for the biosynthesis of mcm5s2U-modified tRNA (Figure 3B) [35]. We first validated the relevance of this cellular model by confirming the substantial decrease of ncm5U, mcm5U and mcm5s2U tRNA levels in FD cells (Figure 4B), consistent with the intrinsic splicing defect in Elp1 mRNA previously reported in this disorder [36]. Upon infection with SARS-CoV-2, FD cells exhibited a marked reduction in viral infection levels compared to wild-type (wt) controls across all tested MOIs, with a substantial decrease of approximately 57-64% at higher MOIs (0.1 and 0.2) (Figure 4C). A similar trend was observed for ZIKV, with infection levels decreased by 65-72% at high MOI (Figure 4D), further supporting the dependence of both viruses on intact U34 tRNA modification pathway for efficient replication. Note that both FD and wt cells are naturally permissive to ZIKV, while they were previously transduced with an ACE2-expressing lentivector to ensure efficient SARS-CoV-2 viral entry, as fibroblasts are not naturally permissive to SARS-CoV-2 (Figure 4A).
Downstream U34 modification enzymes, ALKBH8 and CTU1 are essential for both SARS-CoV-2 and ZIKV replication - According to the U34 modification pathway (Figure 3B), alteration of the two enzymatic steps downstream Elongator complex (ELP1-6) to generate mcm5s2U, would also affect viral infection. We used an shRNA-based approach to examine the role of ALKBH8 and CTU1, key enzymes acting downstream of Elongator in the U34 pathway, in SARS-CoV-2 and ZIKV infection (Figure 5A). We confirmed efficient knockdown of both ALKBH8 and CTU1 at the protein level (Figure 5B). ShRNAs targeting ALKBH8 and CTU1, both led to a significant reduction in SARS-CoV-2 and ZIKV infection levels compared to cells treated with the control shRNA (IRV1) (Figure 5C,D). Specifically, ALKBH8 and CTU1 knockdowns both resulted in approximately a 60% reduction in SARS-CoV-2 infection and in 90-95% reduction in ZIKV infection. These findings, consistent across six independent experiments robustly demonstrate that SARS-CoV-2 and ZIKV infection relies on both ALKBH8 and CTU1/2 complex functions, in addition to Elongator complex, to promote efficiently U34 tRNA modifications and ensure optimal infection.
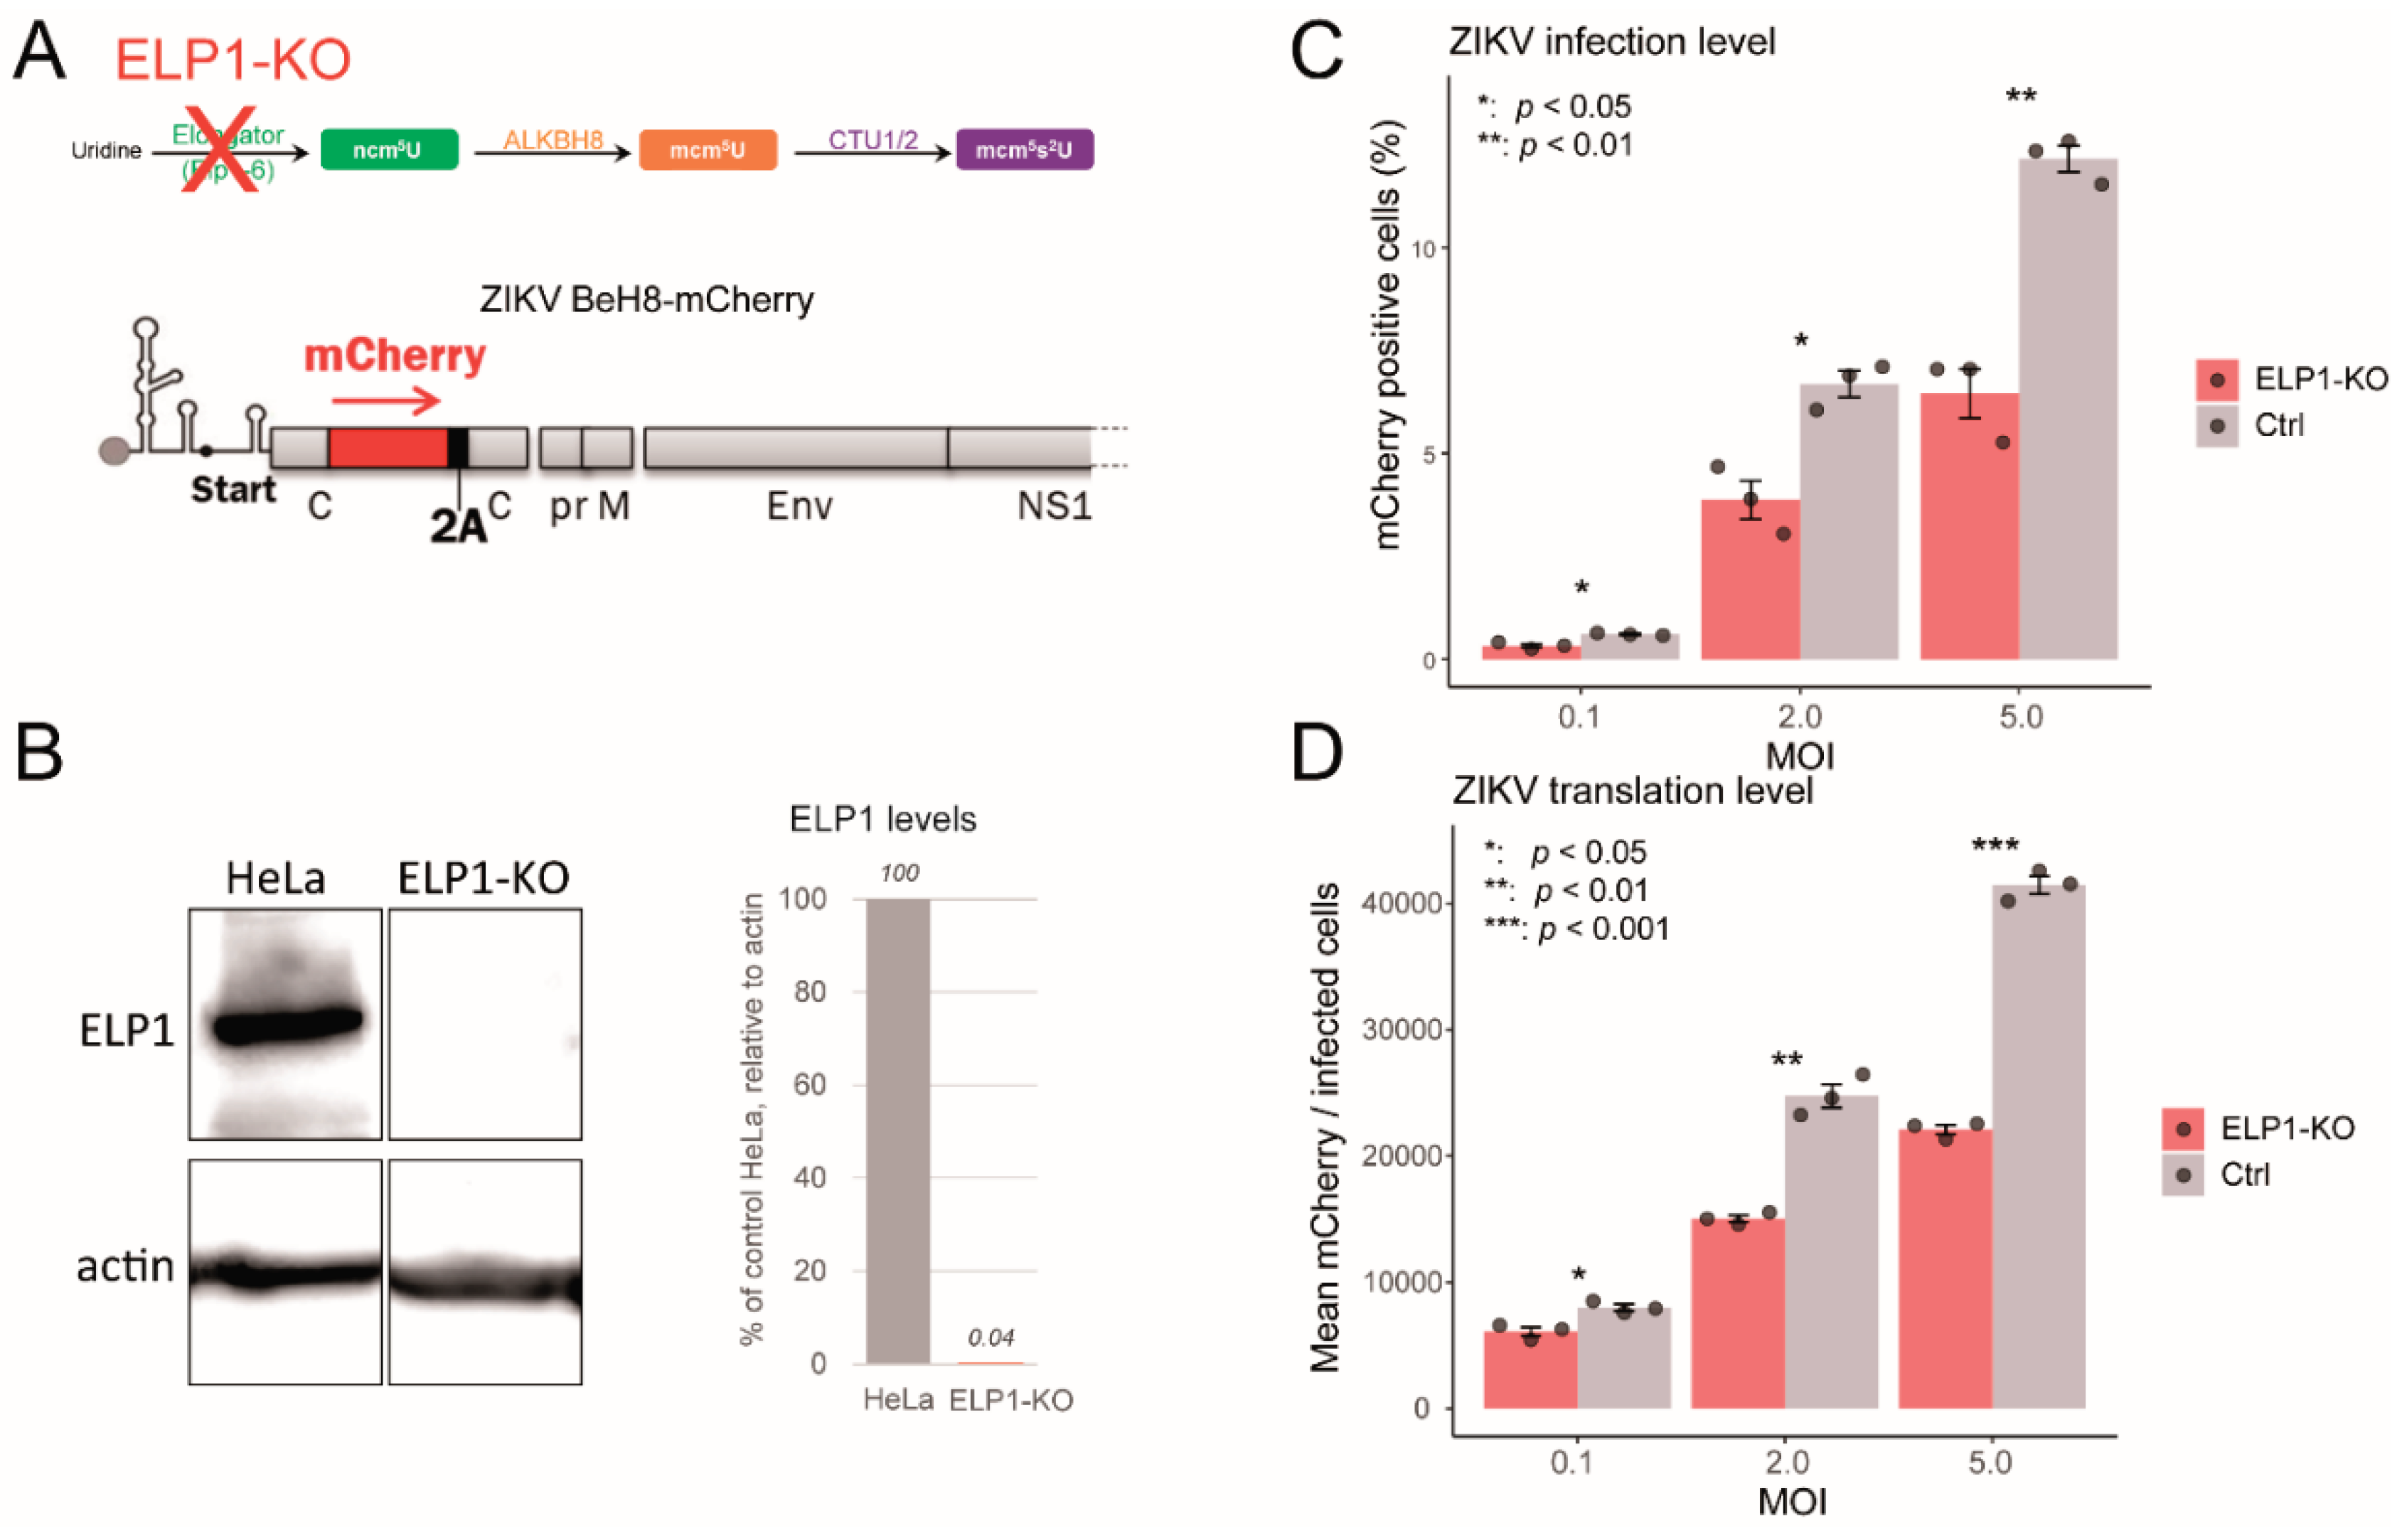
ELP1 knockout reduces both ZIKV infection rate and viral translation efficiency - To strengthen the tight relationship between U34 tRNA modifications and viral translation, we used a recombinant ZIKV expressing mCherry as a quantitative reporter of viral protein synthesis. Due to the lack of a comparable SARS-CoV-2 system with a fluorescent translation reporter, we couldn't study both viruses in parallel. To achieve higher infection levels than in primary fibroblasts (wt or FD), we used CRISPR/Cas9 to generate an ELP1 knockout (ELP1-KO) HeLa cell clone (Figure 6A), which showed a near-complete loss of ELP1 protein compared to control HeLa cells (Figure 6B). ZIKV infection levels, measured by the percentage of mCherry-positive cells, were significantly reduced in ELP1-KO cells compared to control cells at all MOIs tested (0.1, 2, and 5) (Figure 6C) ranging from approximately 42% to 47%. Consistent with the infection data, ZIKV viral translation, deduced from the mean mCherry intensity per infected cell, was also significantly reduced in ELP1-KO cells, with a decrease of approximately 39% to 47% across the same MOIs (Figure 6D). These results strongly suggest that ELP1, and consequently proper U34 tRNA modification, is essential for efficient ZIKV infection and viral translation. The substantial reduction in both infection levels and mCherry intensity underscores the importance of ELP1 for optimal ZIKV replication.
Collectively, these results suggest that the U34 tRNA modification pathway (comprising Elongator/ELP1, ALKBH8, and CTU1/2) significantly contributes to ZIKV and SARS-CoV-2 infection. They support the notion that these viruses manipulate the host tRNA epitranscriptome to adapt the host tRNA pool to their codon biased viral genome through U34 modification to enhance their own translation.
3. Discussion
Our findings reveal a sophisticated strategy employed by SARS-CoV-2 and ZIKV to optimize their protein synthesis through manipulation of host tRNA modifications, rather than evolving codon optimization towards their host codon usage. This conclusion is supported by both computational analysis of viral codon usage and experimental evidence of tRNA modification dynamics during infection.
The codon usage analysis revealed that both viruses, particularly SARS-CoV-2, maintain a distinct codon bias from their human host. With CAI values lower for SARS-CoV-2 than for ZIKV, both viruses align more closely with poorly expressed human genes than with highly expressed ones. This apparent "non-optimization" of codon usage is particularly striking for SARS-CoV-2, which shows the most pronounced deviation from human codon preferences among the coronaviruses analyzed. The hierarchical clustering and PCA analysis further confirmed this distinction, with viral sequences clustering separately from highly expressed human proteins. Notably, both viruses show a marked preference for codons requiring U34-modified tRNAs for efficient decoding, including SerUCA, ThrACA, ProCCA, ArgAGA, and GluCAA codons. This preference is especially pronounced in SARS-CoV-2, which shows approximately twice as many instances of U34-sensitive codon usage compared to ZIKV. Rather than being a limitation, we proposed that this distinct codon usage represents an evolutionary strategy to manipulate host cell translation machinery. These findings align with and extend previous work demonstrating both the suboptimal translational adaptation of SARS-CoV-2 in infected human cells [25] and the preferential use of AA-ending codons in ZIKV that require U34-modified tRNAs for efficient decoding [37].
Our experimental data strongly support the hypothesis that SARS-CoV-2 and ZIKV actively remodel the host tRNA epitranscriptome to accommodate their codon usage. We observed a significant increase in U34 tRNA modifications (ncm5U, mcm5U, and mcm5s2U) upon infection with both viruses. This manipulation of the host tRNA epitranscriptome, consistent with our previous findings on SARS-CoV-2 [25] and ZIKV [37], has also been reported in other RNA viruses with limited experimental backing, such as Chikungunya virus (CHIKV) [39] and Dengue virus (DENV) [39], suggesting a common viral strategy [41].
The importance of U34 tRNA modifications for efficient viral replication was further underscored by experiments using cells with impaired U34 tRNA generation. Fibroblasts from Familial Dysautonomia (FD) patients, lacking functional ELP1 and consequently exhibiting reduced mcm5s2U levels, showed a substantial decrease in both SARS-CoV-2 and ZIKV infection levels demonstrating a direct link between U34 tRNA modification status and viral replication capacity.
To validate these findings and identify specific components of the modification pathway that are essential for viral infection, we performed shRNA targeted knockdowns of ALKBH8 and CTU1. The significant reduction in SARS-CoV-2 and ZIKV infection levels following these knockdowns corroborates our findings from FD cells and suggests that multiple components of the U34 modification pathway are important for viral infection. Although ALKBH8 or CTU1 knockdown cells may retain normal levels of ncm5U- or mcm5U-modified tRNAs, respectively, our data show that the presence of these intermediate modifications is not sufficient to support proper viral translation, highlighting the importance of the ultimate U34 modification, mcm5s2U.
To strengthen the link between U34 tRNA modifications and viral translation, we evaluated ZIKV-directed expression of an mCherry reporter as an indicator of viral protein translation. Using ELP1-KO cells, we confirmed that ELP1, and by extension, proper U34 tRNA modification, is essential for efficient ZIKV infection and viral protein synthesis. The parallel reduction in both infection and translation strongly suggests that the availability of properly modified tRNAs directly impacts the ability of the virus to efficiently translate its genome and produce progeny virions.
In conclusion, through multiple complementary approaches, including U34 modification, deficient FD cells, targeted shRNA-mediated knockdowns, and ELP1 knockout, we demonstrate that disruption of the U34 modification pathway significantly impairs the replication efficiency of both SARS-CoV2 and ZIKV. We also establish the concomitant ability of both viruses to manipulate the host tRNA epitranscriptome, specifically targeting the U34 modification pathway. Given their pronounced codon usage bias relative to their human host, this strategy likely represents a novel viral adaptation to overcome translational bottlenecks. By actively enhancing the levels of specific tRNA modifications (ncm5U, mcm5U and mcm5s2U), both viruses effectively fine-tune the host translation machinery to prioritize viral proteins synthesis. This mechanism likely plays a crucial role in ensuring efficient viral replication and may represent a critical vulnerability that could be targeted for antiviral therapy. Future research should focus on elucidating the precise molecular mechanisms by which these viruses manipulate the U34 pathway and exploring whether pharmacological targeting of this pathway can effectively suppress viral replication in vivo. Furthermore, investigating the long-term consequences of viral-driven remodeling of the tRNA epitranscriptome on host cell homeostasis warrants further attention. Understanding the intricate interplay between viruses and the host translation machinery will be key to developing innovative and effective antiviral strategies.
4. Material and Methods
4.1. Bio-Informatics - Codon Analysis
Codon adaptation index (CAI) and Relative Synonymous Codon Usage (RSCU) calculations were carried out using CAIcal web-available tools (http://genomes.urv.es/CAIcal/) [42]. Nc data were obtained using CAIcal and plotted with Rstudio-ggplot2. Principal component analysis was performed with ClustVis 2.0 (https://biit.cs.ut.ee/clustvis/) [43]. Codon frequencies were calculated using the Codon Utilization Tool (CUT) of HIVE-CUTs databases (https://dnahive.fda.gov/) [44]. Cluster analysis was carried out using Genesis 1.8.1 [45] and Cluster 3.0 [[46,176] and visualizations were made with Java Treeview (Version: 2.11.4.0; https://www.jalview.org) [47]. Protein abundance levels were derived from PaxDb database version 4.1 (https://pax-db.org) (Accession numbers are available in Supplementary Table I) [48]. Accession numbers of the virus sequences used in this report are listed in Supplementary Table II and were downloaded from the NCBI database with the exception of SARS-CoV-2 FRA, which was downloaded from the European Virus Archive (http://www.european-virus-archive.com, accessed on 8 June 2020) and corresponded to the exact 2020 isolate from Paris-Ile-de-France that we used in our infection experiments.
4.2. Cells and Viruses
HeLa, A549, HEK293T, VeroE6, Caco2 cells and human primary astrocytes (obtained from ScienCell) were cultured in DMEM Glutamax medium (GIBCO) supplemented with Penicillin/Streptomycin and 5% of Fetal calf serum. Patient primary fibroblasts were from the Coriell Institute: GMO1652 derived from non-FD control (Skin fibroblast (arm) from 11-year-old Caucasian female); GMO4959 derived from FD patient (Skin fibroblast (arm) from 10-year-old Caucasian female). Fibroblasts were cultured as above. The SARS-CoV-2 was a French Ile de France isolate (www.european-virus-archive.com/virus/sars-cov-2-isolate-betacovfranceidf03722020). Viral stocks were generated by amplification on VeroE6 cells (epithelial kidney of an African green monkey, ATCC CRL-1586). The supernatant was collected, filtered through a 0.45 µm membrane, and tittered using a TCID50 assay. Caco2 cells (epithelial colon adenocarcinoma, ATCC HTB-37) were used for tRNA modification quantification upon SARS-CoV-2 infection. For SARS-CoV-2 infection of primary fibroblasts or A549 cells, the cells were previously transduced with a Lentiviral vector expressing ACE2 using the lentiviral construct RRL.sin.cPPT.SFFV/Ace2.WPRE (MT136) kindly provided by Caroline Goujon (Addgene plasmid # 145842). Seventy-two hours after transduction, accurate ACE2 expression was controlled on Western blot probed with anti-ACE2 antibody (Human ACE-2 Antibody, AF933, R&D systems). ZIKV virus used was either the isolate from French Polynesia (PF13), generated from molecular clone from Mathew Evans [49] or the BeH8 (mCherry reporter) ZIKV replicon [50] from Andres Merits (University of Tartu, Estonia). Virus production and titration were performed in VeroE6 cells.
4.3. Quantification of tRNA Modifications by Mass Spectrometry (LC-MS/MS)
RNA preparations enriched in tRNAs were obtained using mirVana™ miRNA Isolation Kit (Thermo Fisher Scientific, USA). RNA samples were then digested by Nuclease P1 and treated by Alkaline phosphatase. Samples were then injected into an LC-MS/MS spectrometer. The nucleosides were separated by reverse phase ultra-performance liquid chromatography on a C18 column with online mass spectrometry detection using an Agilent 6490 triple-quadrupole LC mass spectrometer in multiple reactions monitoring (MRM) positive electrospray ionization (ESI) mode. Quantification was performed by comparison with the standard curve obtained from pure nucleoside standards running with the same batch of samples.
4.4. Gene Invalidation (CRISPR/Cas9 and shRNA)
The plasmids for CRISPR-Cas9 were obtained from the Montpellier Genomic Collection Platform (Biocampus, Montpellier, France). Guide RNA targeting ELP1 was designed using three online gRNA-optimizing softwares: CRISPR design (http://crispr.mit.edu.insb.bib.cnrs.fr), CRISPR RNA Configurator (http://dharmacon.gelifesciences.com/gene-editing/edit-r/custom-crrna), and CRISPR gRNA Design tool (https://www.dna20.com/eCommerce/cas9). The guide used was: 5’-GACTGTTGGAAACTATCACTGG-3’ (the PAM is underlined). The guide was cloned into pUC57 attB U6 gRNA vectors [50]. The generated plasmid pUC57 attB U6 gRNA was transfected into HeLa cells with Lipofectamine 2000, along with the pSpCas9(BB)-2A-GFP (PX458) plasmid [51]. At 6 h after transfection, the cells were trypsin treated and resuspended in complete DMEM medium at 2 × 10⁴ cells per ml. Portions (200 μl) of the cell suspension (4 × 10³ cells) were used to inoculate 96-well plates and to isolate single cell-derived clones by serial dilution. Isolated green fluorescent protein (GFP)-positive clones were amplified and analyzed by Western blotting to check target gene expression. ShRNAs were Mission shRNAs from SIGMA cloned into plKO.1-puro with the following sequences: ALKBH8 (NCBI ID 91801, exon 12) 5’-CCGGCAGGTGGGAAGGCACTCATTTCTCGAGAAATGAGTGCCTTCCCACCTGTTTTTG-3’; CTU1 (NCBI ID 90353, exon 3) 5’- CCGGCTTCTCCGAGGAGTGCGTCTACTCGAGTAGACGCACTCCTCGGAGAAGTTTTTG-3’, with bold sequences reverse complementary. Irrelevant shRNA sequence (IRV1): 5’- CCGGGCGCGATAGCGCTAATAATTTCTCGAGAAATTATTAGCGCTATCGCGCTTTTT-3’. Corresponding VSV-G pseudo-typed virus-like-particles were produced in HEK293T cells as previously described [53] and used to transduce A549 cells. Individual clones were isolated after puromycin selection and analyzed by Western blotting to check target gene expression.
4.5. Assays for Viral Replication
Cells were lysed with the Luna cell-ready lysis module (New England Biolabs). The amplification reaction was run on a LightcyclerR 480 thermocycler (Roche Diagnostics) using the Luna Universal One-Step RT-qPCR kit (New England Biolabs), and SARS_For: 5′-ACAGGTACGTTAATAGTTAATAGCGT; SARS_Rev: 5′-ATATTGCAGCAGTACGCACACA; ZIKV_For: 5′- AGGATCATAGGTGATGAAGAAAAGT (hybridizes at the end of NS5 sequence); ZIKV_Rev: 5′- CCTGACAACATTAAGATTGGTGC (hybridizes in the 3’UTR region); GAPDH_For: 5′-GCTCACCGGCATGGCCTTTCGCGT and GAPDH_Rev: 5′-TGGAGGAGTGGGTGTCGCTGTTGA primers. Each qPCR was performed in triplicate, and the means and standard deviations were calculated. Relative quantification of data obtained from RT-qPCR was used to determine changes in viral gene expression across multiple samples after normalization to the internal reference GAPDH gene. In cells infected with the ZIKV-mCherry translation reporter virus, infection level (% of mCherry-positive cells) and translation efficiency (relative mean of mCherry fluorescence intensity) were quantitated by flow cytometry on Novocyte (MRI CNRS facility, Montpellier).
Supplementary Materials
The following supporting information can be downloaded at the website of this paper posted on Preprints.org.
References
- Schultz, S.K.; Kothe, U. RNA Modifying Enzymes Shape tRNA Biogenesis and Function. Journal of Biological Chemistry 2024, 300, 107488. [Google Scholar] [CrossRef] [PubMed]
- Boccaletto, P.; Machnicka, M.A.; Purta, E.; Piątkowski, P.; Bagiński, B.; Wirecki, T.K.; de Crécy-Lagard, V.; Ross, R.; Limbach, P.A.; Kotter, A.; et al. MODOMICS: A Database of RNA Modification Pathways. 2017 Update. Nucleic Acids Research 2018, 46, D303–D307. [Google Scholar] [CrossRef]
- Nedialkova, D.D.; Leidel, S.A. Optimization of Codon Translation Rates via tRNA Modifications Maintains Proteome Integrity. Cell 2015, 161, 1606–1618. [Google Scholar] [CrossRef] [PubMed]
- Ranjan, N.; Rodnina, M.V. tRNA Wobble Modifications and Protein Homeostasis. Translation 2016, 4, e1143076. [Google Scholar] [CrossRef] [PubMed]
- Tuorto, F.; Lyko, F. Genome Recoding by tRNA Modifications. Open Biol 2016, 6, 160287. [Google Scholar] [CrossRef]
- Jackman, J.E.; Alfonzo, J.D. Transfer RNA Modifications: Nature’s Combinatorial Chemistry Playground. WIREs RNA 2013, 4, 35–48. [Google Scholar] [CrossRef]
- Barraud, P.; Tisné, C. To Be or Not to Be Modified: Miscellaneous Aspects Influencing Nucleotide Modifications in tRNAs. IUBMB life 2019, iub.2041. [Google Scholar] [CrossRef]
- Huang, H.-Y.; Hopper, A. Multiple Layers of Stress-Induced Regulation in tRNA Biology. Life 2016, 6, 16. [Google Scholar] [CrossRef]
- Yared, M.-J.; Marcelot, A.; Barraud, P. Beyond the Anticodon: tRNA Core Modifications and Their Impact on Structure, Translation and Stress Adaptation. Genes (Basel) 2024, 15, 374. [Google Scholar] [CrossRef]
- Nunes, A.; Ribeiro, D.R.; Marques, M.; Santos, M.A.S.; Ribeiro, D.; Soares, A.R. Emerging Roles of tRNAs in RNA Virus Infections. Trends in Biochemical Sciences 2020, 45, 794–805. [Google Scholar] [CrossRef]
- Goffena, J.; Lefcort, F.; Zhang, Y.; Lehrmann, E.; Chaverra, M.; Felig, J.; Walters, J.; Buksch, R.; Becker, K.G.; George, L. Elongator and Codon Bias Regulate Protein Levels in Mammalian Peripheral Neurons. Nature Communications 2018, 9, 889. [Google Scholar] [CrossRef] [PubMed]
- Johansson, M.J.O.; Esberg, A.; Huang, B.; Björk, G.R.; Byström, A.S. Eukaryotic Wobble Uridine Modifications Promote a Functionally Redundant Decoding System. Molecular and Cellular Biology 2008, 28, 3301–3312. [Google Scholar] [CrossRef]
- Agris, P.F.; Narendran, A.; Sarachan, K.; Väre, V.Y.P.; Eruysal, E. The Importance of Being Modified: The Role of RNA Modifications in Translational Fidelity. The Enzymes 2017, 41, 1–50. [Google Scholar] [CrossRef]
- Komar, A.A. The Yin and Yang of Codon Usage. Human Molecular Genetics 2016, 25, R77–R85. [Google Scholar] [CrossRef] [PubMed]
- Grosjean, H.; de Crécy-Lagard, V.; Marck, C. Deciphering Synonymous Codons in the Three Domains of Life: Co-Evolution with Specific tRNA Modification Enzymes. FEBS Letters 2010, 584, 252–264. [Google Scholar] [CrossRef]
- Tian, L.; Shen, X.; Murphy, R.W.; Shen, Y. The Adaptation of Codon Usage of +ssRNA Viruses to Their Hosts. Infection, Genetics and Evolution 2018, 63, 175–179. [Google Scholar] [CrossRef]
- Franzo, G.; Tucciarone, C.M.; Cecchinato, M.; Drigo, M. Canine Parvovirus Type 2 (CPV-2) and Feline Panleukopenia Virus (FPV) Codon Bias Analysis Reveals a Progressive Adaptation to the New Niche after the Host Jump. Mol Phylogenet Evol 2017, 114, 82–92. [Google Scholar] [CrossRef]
- Si, F.; Jiang, L.; Yu, R.; Wei, W.; Li, Z. Study on the Characteristic Codon Usage Pattern in Porcine Epidemic Diarrhea Virus Genomes and Its Host Adaptation Phenotype. Front Microbiol 2021, 12, 738082. [Google Scholar] [CrossRef] [PubMed]
- Luo, W.; Tian, L.; Gan, Y.; Chen, E.; Shen, X.; Pan, J.; Irwin, D.M.; Chen, R.-A.; Shen, Y. The Fit of Codon Usage of Human-Isolated Avian Influenza A Viruses to Human. Infect Genet Evol 2020, 81, 104181. [Google Scholar] [CrossRef]
- Mueller, S.; Papamichail, D.; Coleman, J.R.; Skiena, S.; Wimmer, E. Reduction of the Rate of Poliovirus Protein Synthesis through Large-Scale Codon Deoptimization Causes Attenuation of Viral Virulence by Lowering Specific Infectivity. J Virol 2006, 80, 9687–9696. [Google Scholar] [CrossRef]
- Zhou, J.-H.; Gao, Z.-L.; Zhang, J.; Ding, Y.-Z.; Stipkovits, L.; Szathmary, S.; Pejsak, Z.; Liu, Y.-S. The Analysis of Codon Bias of Foot-and-Mouth Disease Virus and the Adaptation of This Virus to the Hosts. Infect Genet Evol 2013, 14, 105–110. [Google Scholar] [CrossRef] [PubMed]
- Chen, F.; Wu, P.; Deng, S.; Zhang, H.; Hou, Y.; Hu, Z.; Zhang, J.; Chen, X.; Yang, J.R. Dissimilation of Synonymous Codon Usage Bias in Virus–Host Coevolution Due to Translational Selection. Nature Ecology and Evolution 2020, 4, 589–600. [Google Scholar] [CrossRef]
- Zhou, P.; Yang, X.L.; Wang, X.G.; Hu, B.; Zhang, L.; Zhang, W.; Si, H.R.; Zhu, Y.; Li, B.; Huang, C.L.; et al. A Pneumonia Outbreak Associated with a New Coronavirus of Probable Bat Origin. Nature 2020, 579, 270–273. [Google Scholar] [CrossRef]
- Zhu, N.; Zhang, D.; Wang, W.; Li, X.; Yang, B.; Song, J.; Zhao, X.; Huang, B.; Shi, W.; Lu, R.; et al. A Novel Coronavirus from Patients with Pneumonia in China, 2019. New England Journal of Medicine 2020, 382, 727–733. [Google Scholar] [CrossRef]
- Eldin, P.; David, A.; Hirtz, C.; Battini, J.-L.; Briant, L. SARS-CoV-2 Displays a Suboptimal Codon Usage Bias for Efficient Translation in Human Cells Diverted by Hijacking the tRNA Epitranscriptome. Int J Mol Sci 2024, 25, 11614. [Google Scholar] [CrossRef] [PubMed]
- Kirtipal, N.; Bharadwaj, S.; Kang, S.G. From SARS to SARS-CoV-2, Insights on Structure, Pathogenicity and Immunity Aspects of Pandemic Human Coronaviruses. Infect Genet Evol 2020, 85, 104502. [Google Scholar] [CrossRef]
- Gubler, D.J.; Vasilakis, N.; Musso, D. History and Emergence of Zika Virus. J Infect Dis 2017, 216, S860–S867. [Google Scholar] [CrossRef] [PubMed]
- Krauer, F.; Riesen, M.; Reveiz, L.; Oladapo, O.T.; Martínez-Vega, R.; Porgo, T.V.; Haefliger, A.; Broutet, N.J.; Low, N. Zika Virus Infection as a Cause of Congenital Brain Abnormalities and Guillain-Barré Syndrome: Systematic Review. PLoS medicine 2017, 14, e1002203. [Google Scholar] [CrossRef]
- Kuno, G.; Chang, G.-J.J. Full-Length Sequencing and Genomic Characterization of Bagaza, Kedougou, and Zika Viruses. Archives of Virology 2007, 152, 687–696. [Google Scholar] [CrossRef]
- Sharp, P.M.; Li, W.H. The Codon Adaptation Index--a Measure of Directional Synonymous Codon Usage Bias, and Its Potential Applications. Nucleic Acids Res 1987, 15, 1281–1295. [Google Scholar] [CrossRef]
- RoyChoudhury, S.; Mukherjee, D. A Detailed Comparative Analysis on the Overall Codon Usage Pattern in Herpesviruses. Virus Research 2010, 148, 31–43. [Google Scholar] [CrossRef] [PubMed]
- Su, M.-W.; Lin, H.-M.; Yuan, H.S.; Chu, W.-C. Categorizing Host-Dependent RNA Viruses by Principal Component Analysis of Their Codon Usage Preferences. Journal of Computational Biology 2009, 16, 1539–1547. [Google Scholar] [CrossRef]
- Johansson, M.J.O.; Xu, F.; Byström, A.S. Elongator-a tRNA Modifying Complex That Promotes Efficient Translational Decoding. Biochimica et biophysica acta. Gene regulatory mechanisms 2018, 1861, 401–408. [Google Scholar] [CrossRef]
- Donadon, I.; Pinotti, M.; Rajkowska, K.; Pianigiani, G.; Barbon, E.; Morini, E.; Motaln, H.; Rogelj, B.; Mingozzi, F.; Slaugenhaupt, S.A.; et al. Exon-Specific U1 snRNAs Improve ELP1 Exon 20 Definition and Rescue ELP1 Protein Expression in a Familial Dysautonomia Mouse Model. Hum Mol Genet 2018, 27, 2466–2476. [Google Scholar] [CrossRef]
- Karlsborn, T.; Tükenmez, H.; Chen, C.; Byström, A.S. Familial Dysautonomia (FD) Patients Have Reduced Levels of the Modified Wobble Nucleoside mcm5s2U in tRNA. Biochemical and Biophysical Research Communications 2014, 454, 441–445. [Google Scholar] [CrossRef] [PubMed]
- Yoshida, M.; Kataoka, N.; Miyauchi, K.; Ohe, K.; Iida, K.; Yoshida, S.; Nojima, T.; Okuno, Y.; Onogi, H.; Usui, T.; et al. Rectifier of Aberrant mRNA Splicing Recovers tRNA Modification in Familial Dysautonomia. Proceedings of the National Academy of Sciences of the United States of America 2015, 112, 2764–2769. [Google Scholar] [CrossRef]
- Eldin, P.; Bernard, E.; Vågbø, C.B.; George, L.; Ajiro, M.; Hagiwara, M.; Slupphaug, G.; Briant, L. Zika Virus Reprograms the Host tRNA Epitranscriptome to Adapt Translation to A-Ending Codon Bias. bioRxiv 2025. [Google Scholar] [CrossRef]
- Jungfleisch, J.; Böttcher, R.; Talló-Parra, M.; Pérez-Vilaró, G.; Merits, A.; Novoa, E.M.; Díez, J. CHIKV Infection Reprograms Codon Optimality to Favor Viral RNA Translation by Altering the tRNA Epitranscriptome. Nat Commun 2022, 13, 4725. [Google Scholar] [CrossRef] [PubMed]
- Chan, C.; Kwan Sze, N.S.; Suzuki, Y.; Ohira, T.; Suzuki, T.; Begley, T.J.; Dedon, P.C. Dengue Virus Exploits the Host tRNA Epitranscriptome to Promote Viral Replication. bioRxiv 2023. [Google Scholar] [CrossRef]
- Talló-Parra, M.; Muscolino, E.; Díez, J. The Host tRNA Epitranscriptome: A New Player in RNA Virus Infections. Front. Virol. 2022, 2. [Google Scholar] [CrossRef]
- Puigbò, P.; Bravo, I.G.; Garcia-Vallve, S. CAIcal: A Combined Set of Tools to Assess Codon Usage Adaptation. Biology Direct 2008, 3, 38. [Google Scholar] [CrossRef] [PubMed]
- Metsalu, T.; Vilo, J. ClustVis: A Web Tool for Visualizing Clustering of Multivariate Data Using Principal Component Analysis and Heatmap. Nucleic Acids Research 2015, 43, W566–W570. [Google Scholar] [CrossRef] [PubMed]
- Athey, J.; Alexaki, A.; Osipova, E.; Rostovtsev, A.; Santana-Quintero, L.V.; Katneni, U.; Simonyan, V.; Kimchi-Sarfaty, C. A New and Updated Resource for Codon Usage Tables. BMC Bioinformatics 2017, 18, 391. [Google Scholar] [CrossRef]
- Sturn, A.; Quackenbush, J.; Trajanoski, Z. Genesis: Cluster Analysis of Microarray Data. Bioinformatics 2002, 18, 207–208. [Google Scholar] [CrossRef]
- de Hoon, M.J.L.; Imoto, S.; Nolan, J.; Miyano, S. Open Source Clustering Software. Bioinformatics 2004, 20, 1453–1454. [Google Scholar] [CrossRef]
- Saldanha, A.J. Java Treeview--Extensible Visualization of Microarray Data. Bioinformatics 2004, 20, 3246–3248. [Google Scholar] [CrossRef]
- Wang, M.; Herrmann, C.J.; Simonovic, M.; Szklarczyk, D.; von Mering, C. Version 4.0 of PaxDb: Protein Abundance Data, Integrated across Model Organisms, Tissues, and Cell-Lines. PROTEOMICS 2015, 15, 3163–3168. [Google Scholar] [CrossRef]
- Schwarz, M.C.; Sourisseau, M.; Espino, M.M.; Gray, E.S.; Chambers, M.T.; Tortorella, D.; Evans, M.J. Rescue of the 1947 Zika Virus Prototype Strain with a Cytomegalovirus Promoter-Driven cDNA Clone. mSphere 2016, 1, e00246-16. [Google Scholar] [CrossRef] [PubMed]
- Mutso, M.; Saul, S.; Rausalu, K.; Susova, O.; Žusinaite, E.; Mahalingam, S.; Merits, A. Reverse Genetic System, Genetically Stable Reporter Viruses and Packaged Subgenomic Replicon Based on a Brazilian Zika Virus Isolate. Journal of General Virology 2017, 98, 2712–2724. [Google Scholar] [CrossRef]
- Shen, B.; Zhang, W.; Zhang, J.; Zhou, J.; Wang, J.; Chen, L.; Wang, L.; Hodgkins, A.; Iyer, V.; Huang, X.; et al. Efficient Genome Modification by CRISPR-Cas9 Nickase with Minimal off-Target Effects. Nat Methods 2014, 11, 399–402. [Google Scholar] [CrossRef]
- Ran, F.A.; Hsu, P.D.; Lin, C.-Y.; Gootenberg, J.S.; Konermann, S.; Trevino, A.E.; Scott, D.A.; Inoue, A.; Matoba, S.; Zhang, Y.; et al. Double Nicking by RNA-Guided CRISPR Cas9 for Enhanced Genome Editing Specificity. Cell 2013, 154, 1380–1389. [Google Scholar] [CrossRef] [PubMed]
- Eldin, P.; Péron, S.; Galashevskaya, A.; Denis-Lagache, N.; Cogné, M.; Slupphaug, G.; Briant, L. Impact of HIV-1 Vpr Manipulation of the DNA Repair Enzyme UNG2 on B Lymphocyte Class Switch Recombination. Journal of Translational Medicine 2020, 18, 310. [Google Scholar] [CrossRef] [PubMed]
Figure 1.
Codon Adaptation Index (CAI) and Relative Synonymous Codon Usage (RSCU) Analysis of Human Genes and Viral Genomes. (A) Correlation between CAI and protein abundance (parts per million, ppm) for selected human genes. The dashed line represents a trendline visualizing the general relationship between these two variables. Highlighted human proteins serve as reference points for comparison with viral CAI values. Arrows indicate the CAI values for the analyzed viruses (SARS-CoV-2, SARS-CoV-1, MERS-CoV, ZIKV, USUV, and WNV). Note the logarithmic scale for abundance. The viral CAI values are shown in parentheses after the virus name. (B) Scatter plot of total number of codons (Nc) values versus human CAI for individual viral proteins of SARS- CoV-2 and ZIKV. (C) Heatmap showing the Relative Synonymous Codon Usage (RSCU) for select codons in the analyzed virus coding genomes and host genomes (human and Aedes aegypti mosquito). Red indicates RSCU > 1.6 (over-utilization), yellow indicates RSCU between 0.6 and 1.6, and green indicates RSCU < 0.6 (under-utilization). The modifications at the position U34 of corresponding tRNA anticodons are also indicated (* ncm5U, ** mcm5U, *** mcm5s2U). "i", "p" and “m5” denote inosine, pseudouridine and m5G modifications, respectively. The amino acids corresponding to each codon are listed on the right.
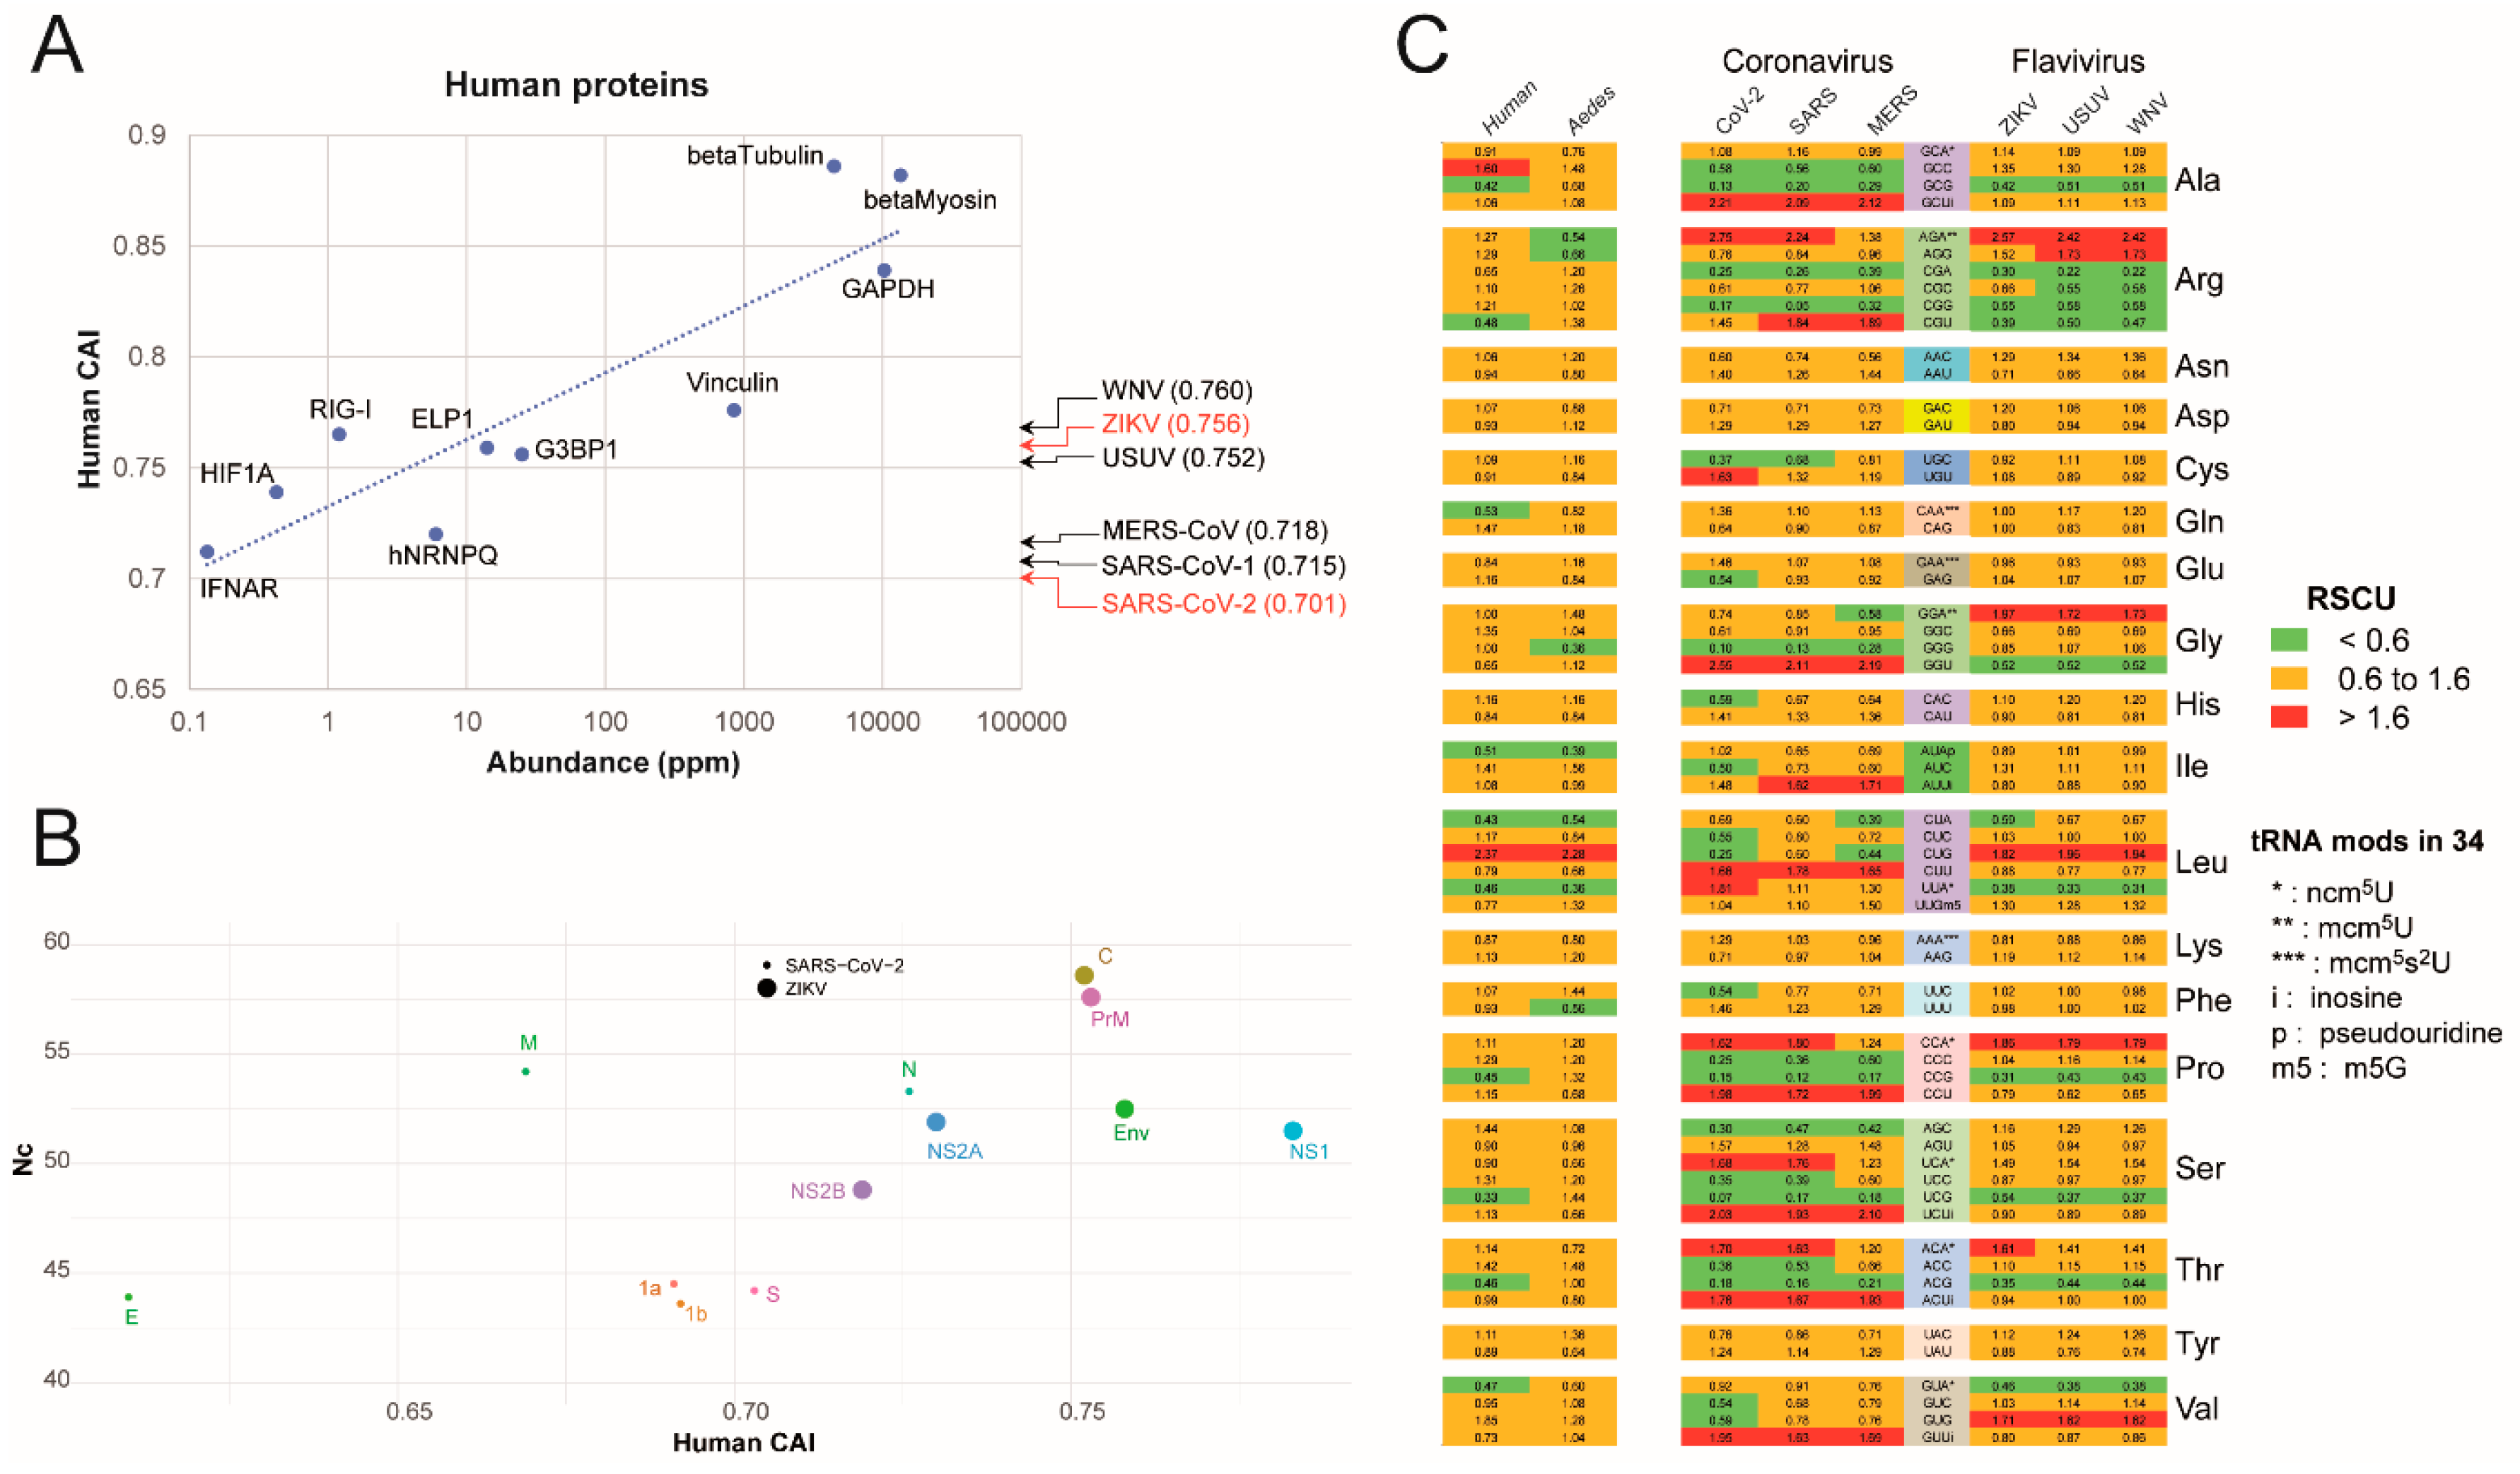
Figure 2.
Codon Usage Bias in Human genes and Viral Genomes. (A) Heatmap of Relative Synonymous Codon Usage (RSCU) values for selected codons across human genes, viral genomes, and Homo sapiens whole coding sequences (columns). Specific modifications at the U34 position of tRNA anticodons are indicated with "o" (ncm5U), "oo" (mcm5U), and "ooo" (mcm5s2U) to the right of the corresponding codons. (B) Principal Component Analysis (PCA) of RSCU values. The plot shows the distribution of human proteins (black circles), viral sequences (colored circles) and Homo sapiens genome (yellow/black circle) along the first two principal components (PC1 and PC2). The percentage of variance explained by each component is indicated in parentheses on the axes. Dashed circles highlight groupings of viral families.
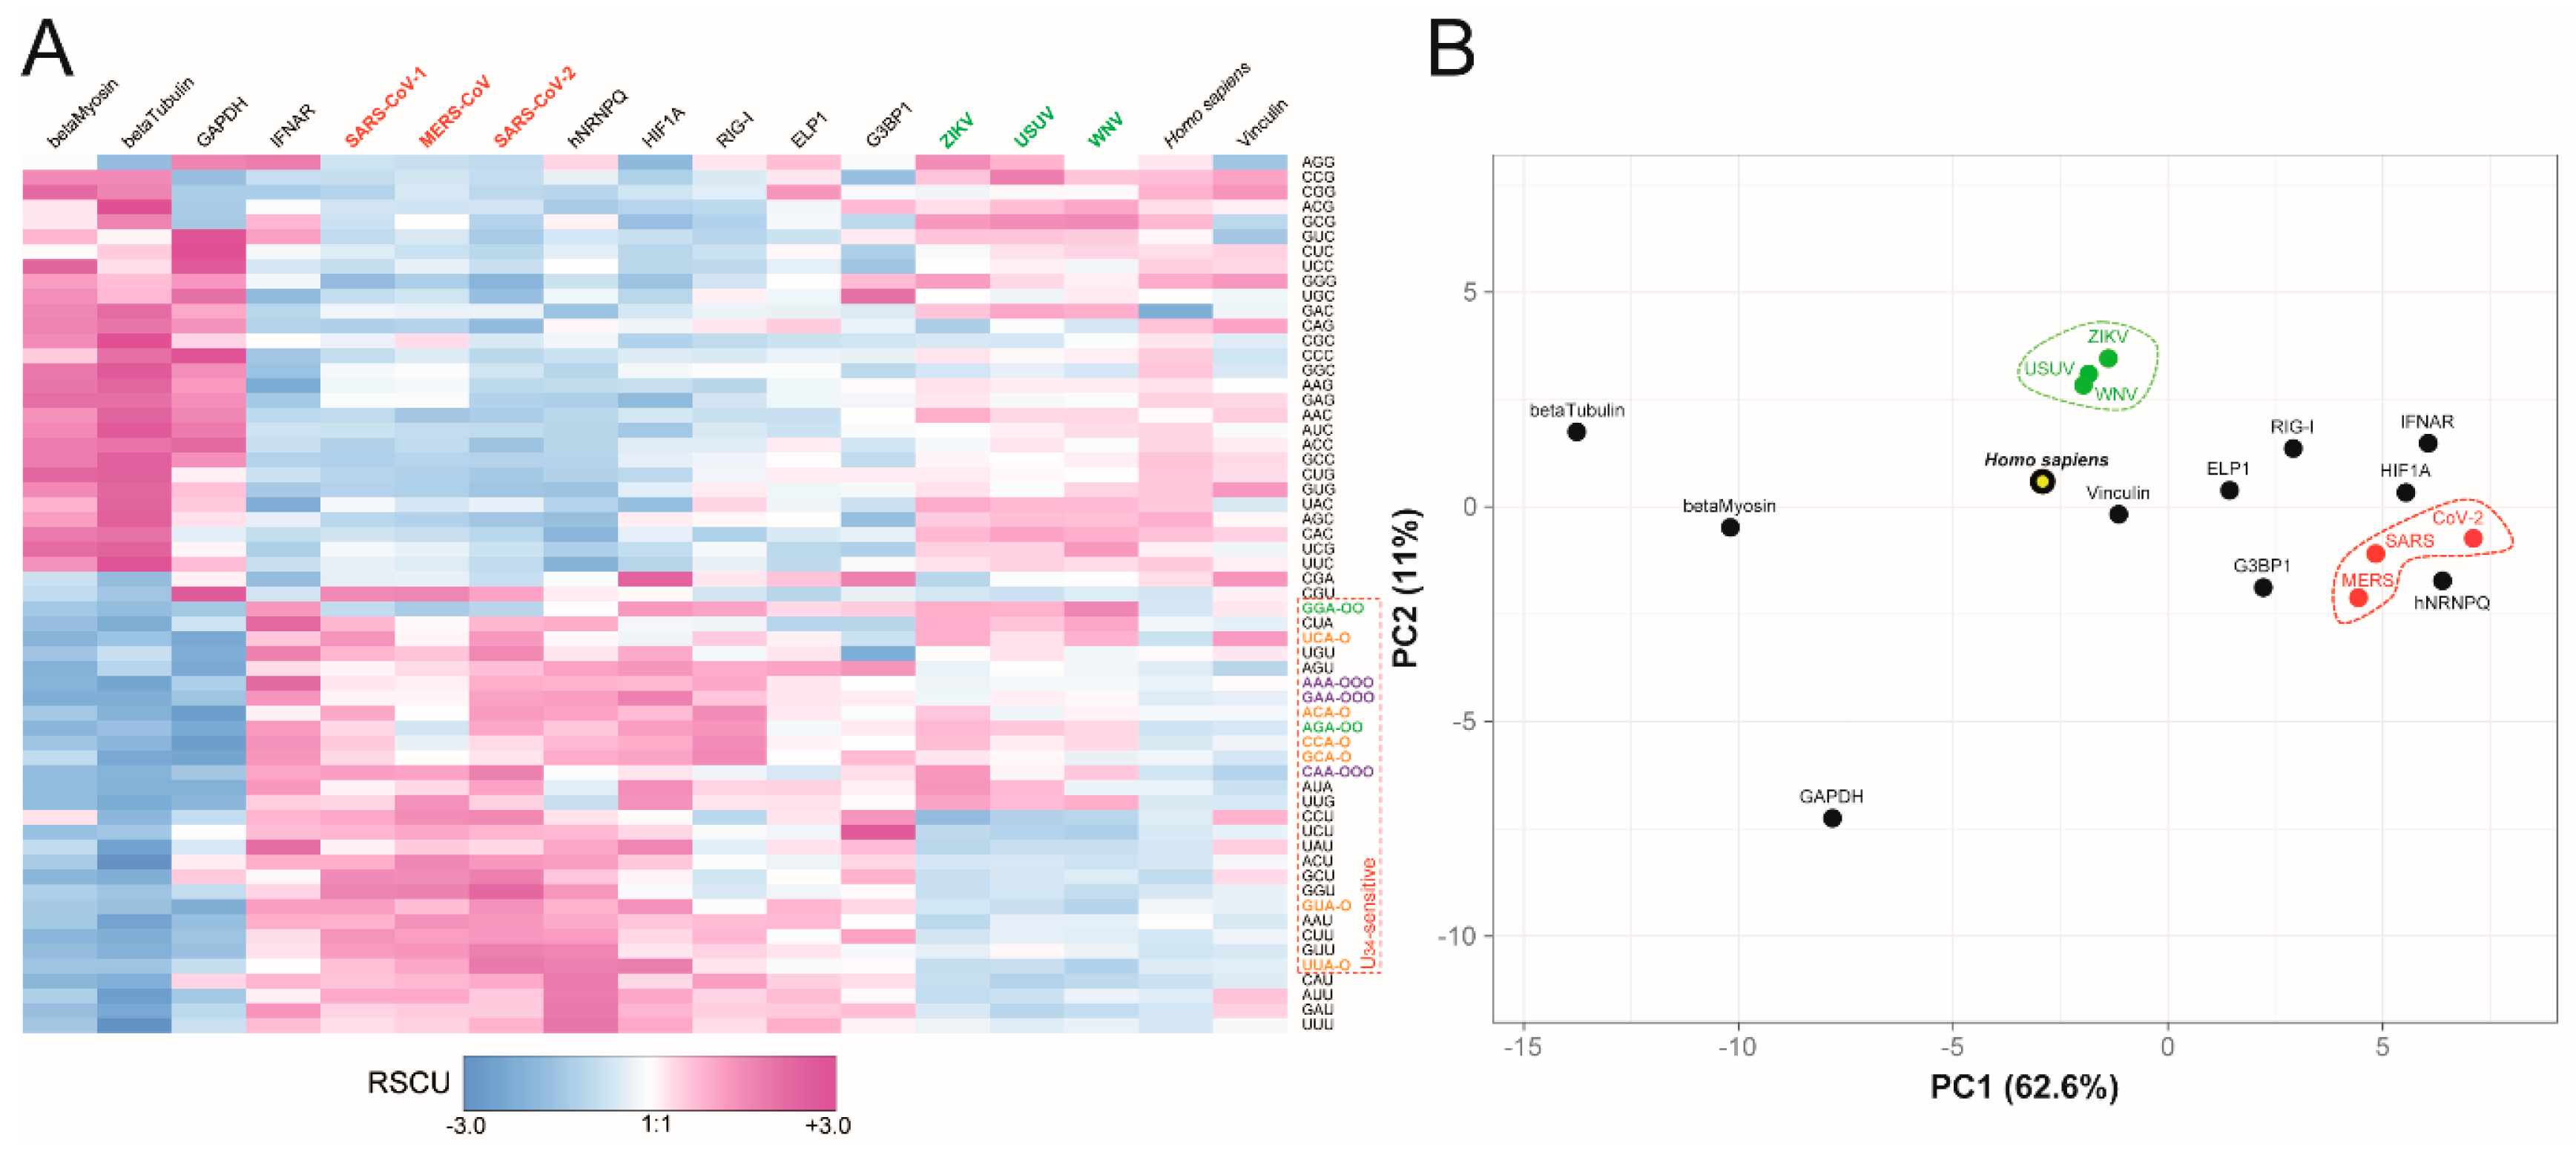
Figure 3.
Changes in tRNA U34 Modifications During ZIKV and SARS-CoV-2 Infection. (A) Schematic representation of a typical tRNA molecule, illustrating the conserved secondary structure (cloverleaf) with acceptor stem (amino acid attachment) and anticodon loop (mRNA codon recognition). Variable, D and T loops are also indicated. The positions of different modifications are color-coded across the tRNA, while the three modifications at the U34 site are specifically shown in red. (B) The enzymatic pathway of chemical modifications occurring at the wobble U34 position (ncm5U, mcm5U, and mcm5s2U) involves successively the Elongator complex (ELP1-6), ALKBH8 and CTU1/2 complex [33]. Red dotted boxes highlight modified chemical groups. (C) Changes in tRNA modification levels detected in human astrocytes 24 hours after ZIKV infection (MOI=2). (D) Changes in tRNA modification levels in SARS-CoV-2 infected Caco2 cells at 24 hours post-infection (MOI=0.2). The C and D graphs show the log2-fold change in modification levels compared to mock-infected controls. Error bars indicate ± SD variations. Histogram of each modification is color-coded according to its location in panel A. Um appears with a color gradient since it can be found at different positions (4, 18, 34 and 44).
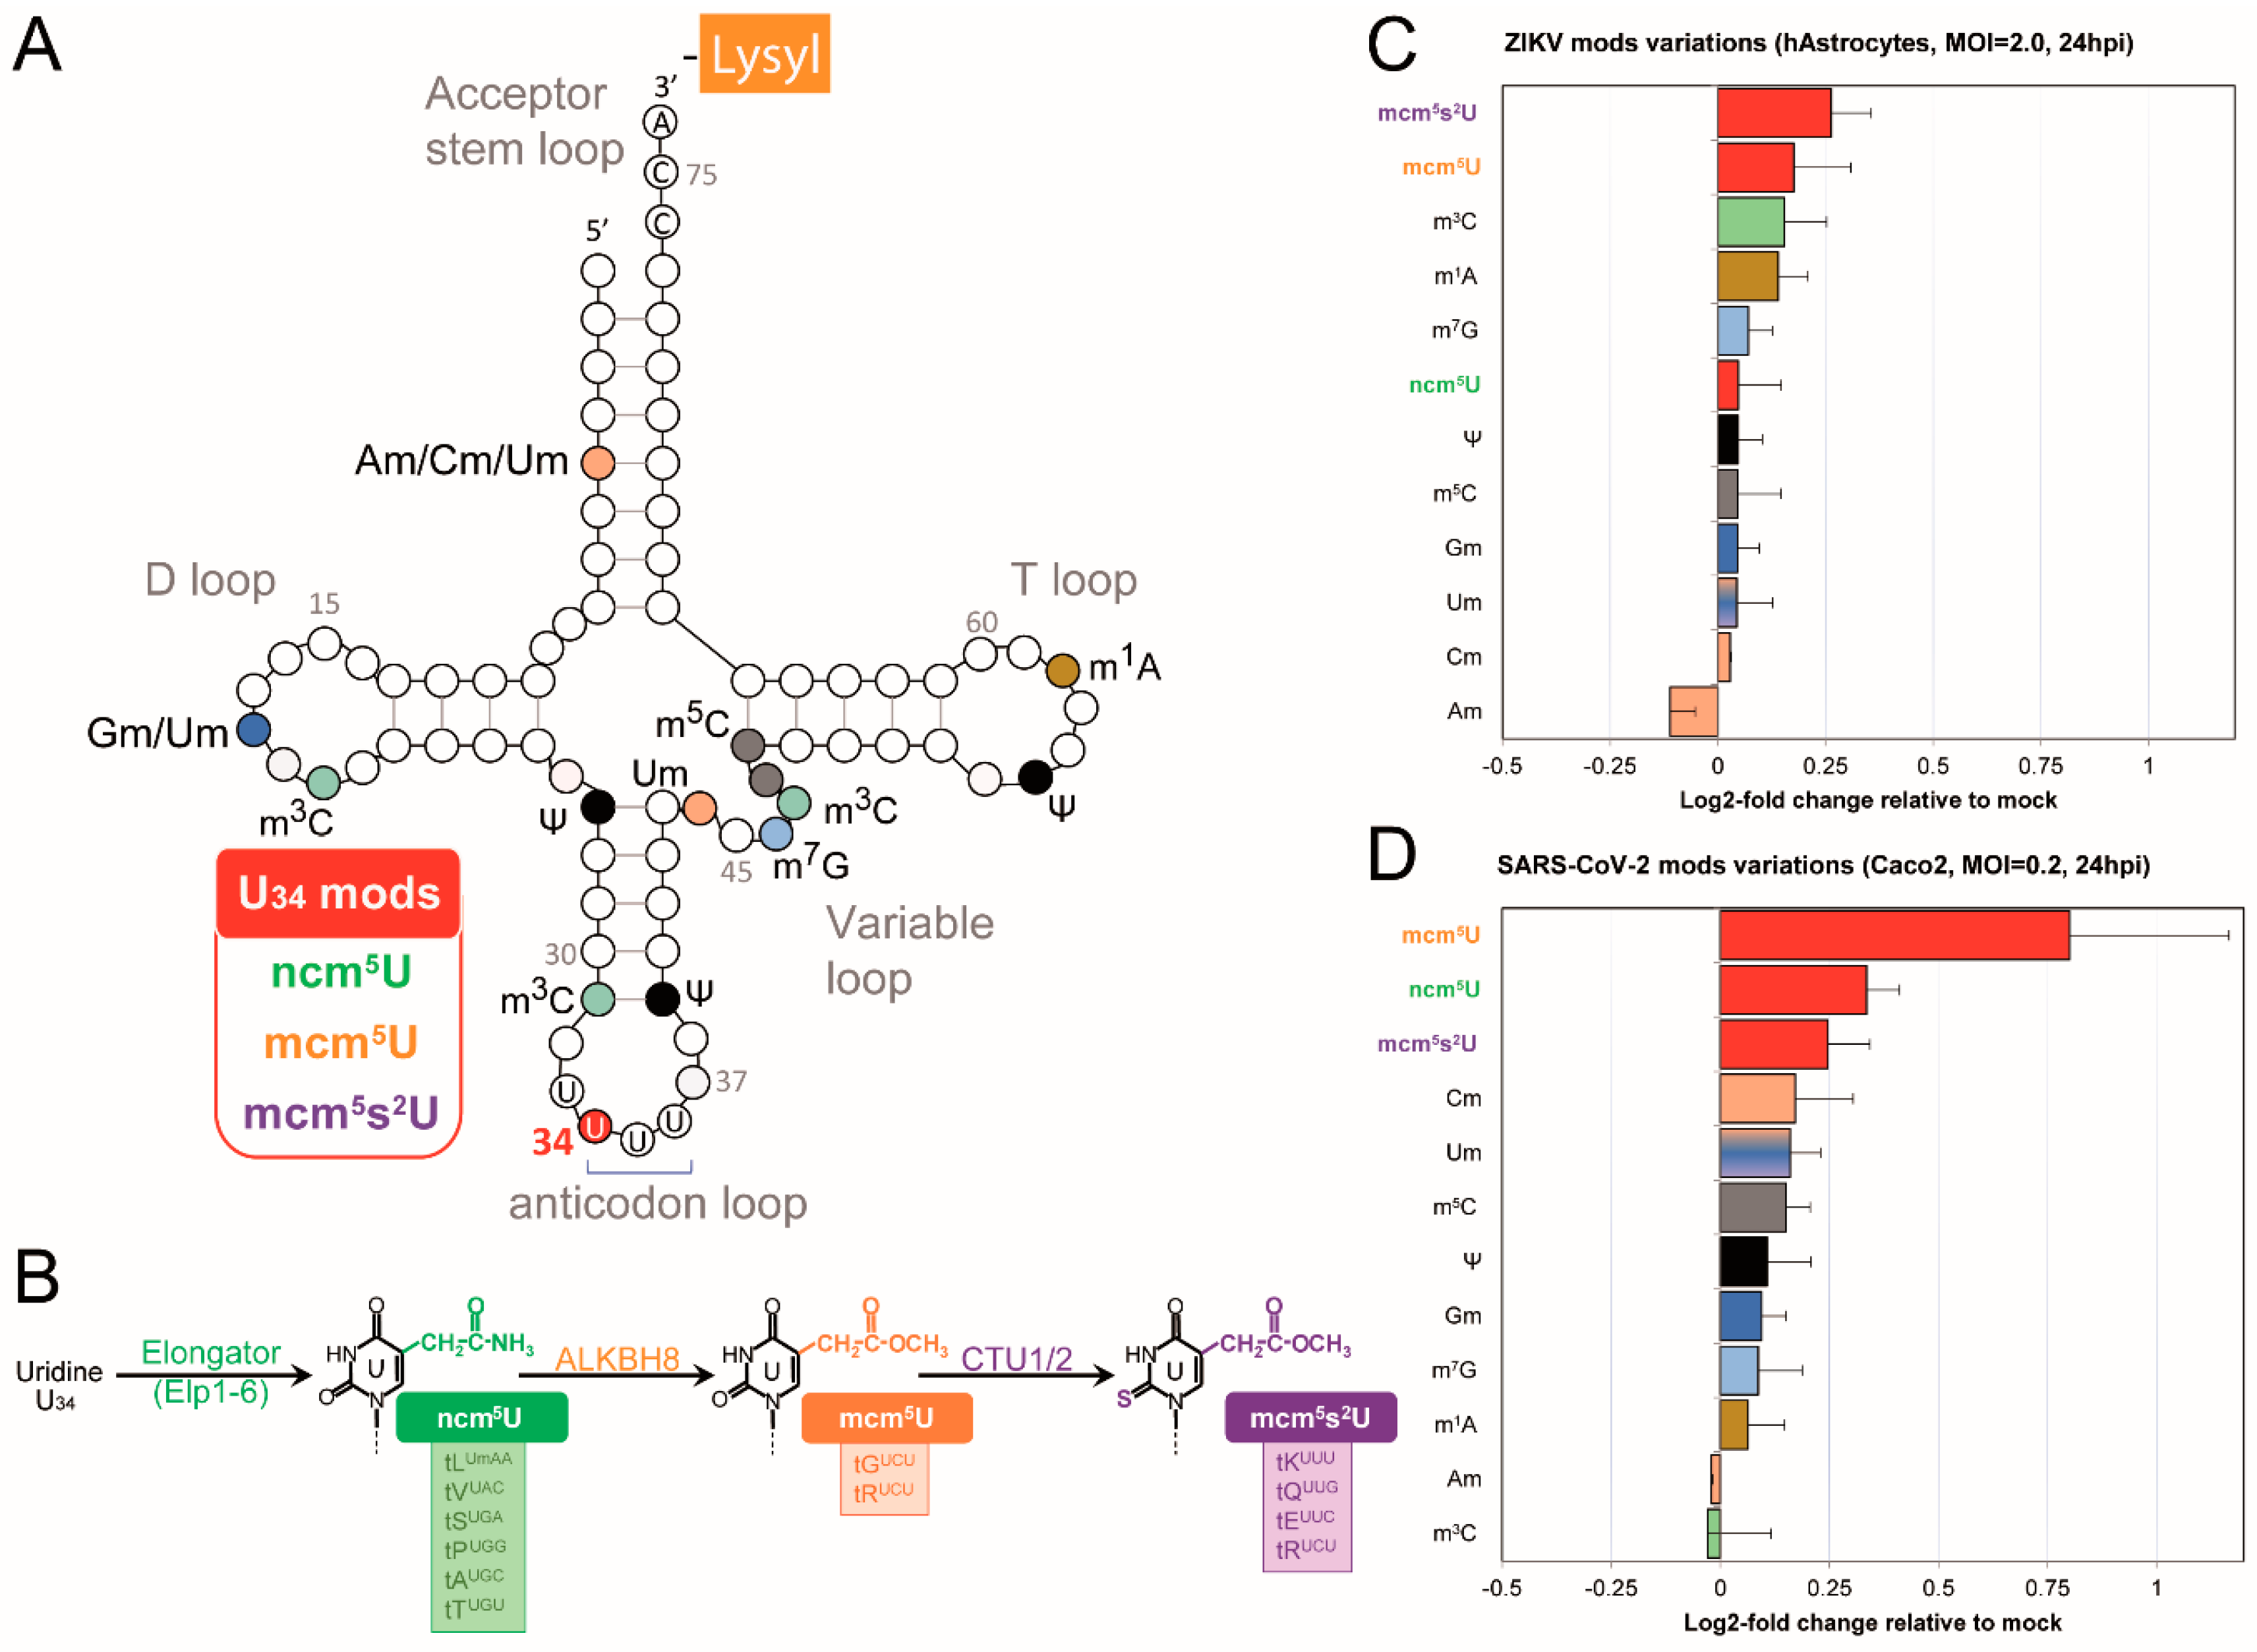
Figure 4.
Elongator Complex Loss Reduces SARS-CoV-2 and ZIKV Infection. (A) Schematic representation of U34 tRNA modification pathway in FD (ELP1-deficient) cells. The western blot shows ACE2 receptor and actin levels in cells transduced by ACE2-expressing lentivector (VLPACE2). (B) Quantification of U34 modification levels (ncm5U, mcm5U, mcm5s2U) in wild-type (wt) versus FD cells determined by mass spectrometry on tRNA-enriched RNA fractionations. (C) SARS-CoV-2 infection levels measured by RT-qPCR in wt and FD cells at different multiplicities of infection (MOI) 24 hours post-infection. (D) ZIKV infection levels measured by RT-qPCR in wt and FD cells at different MOIs 48 hours post-infection.
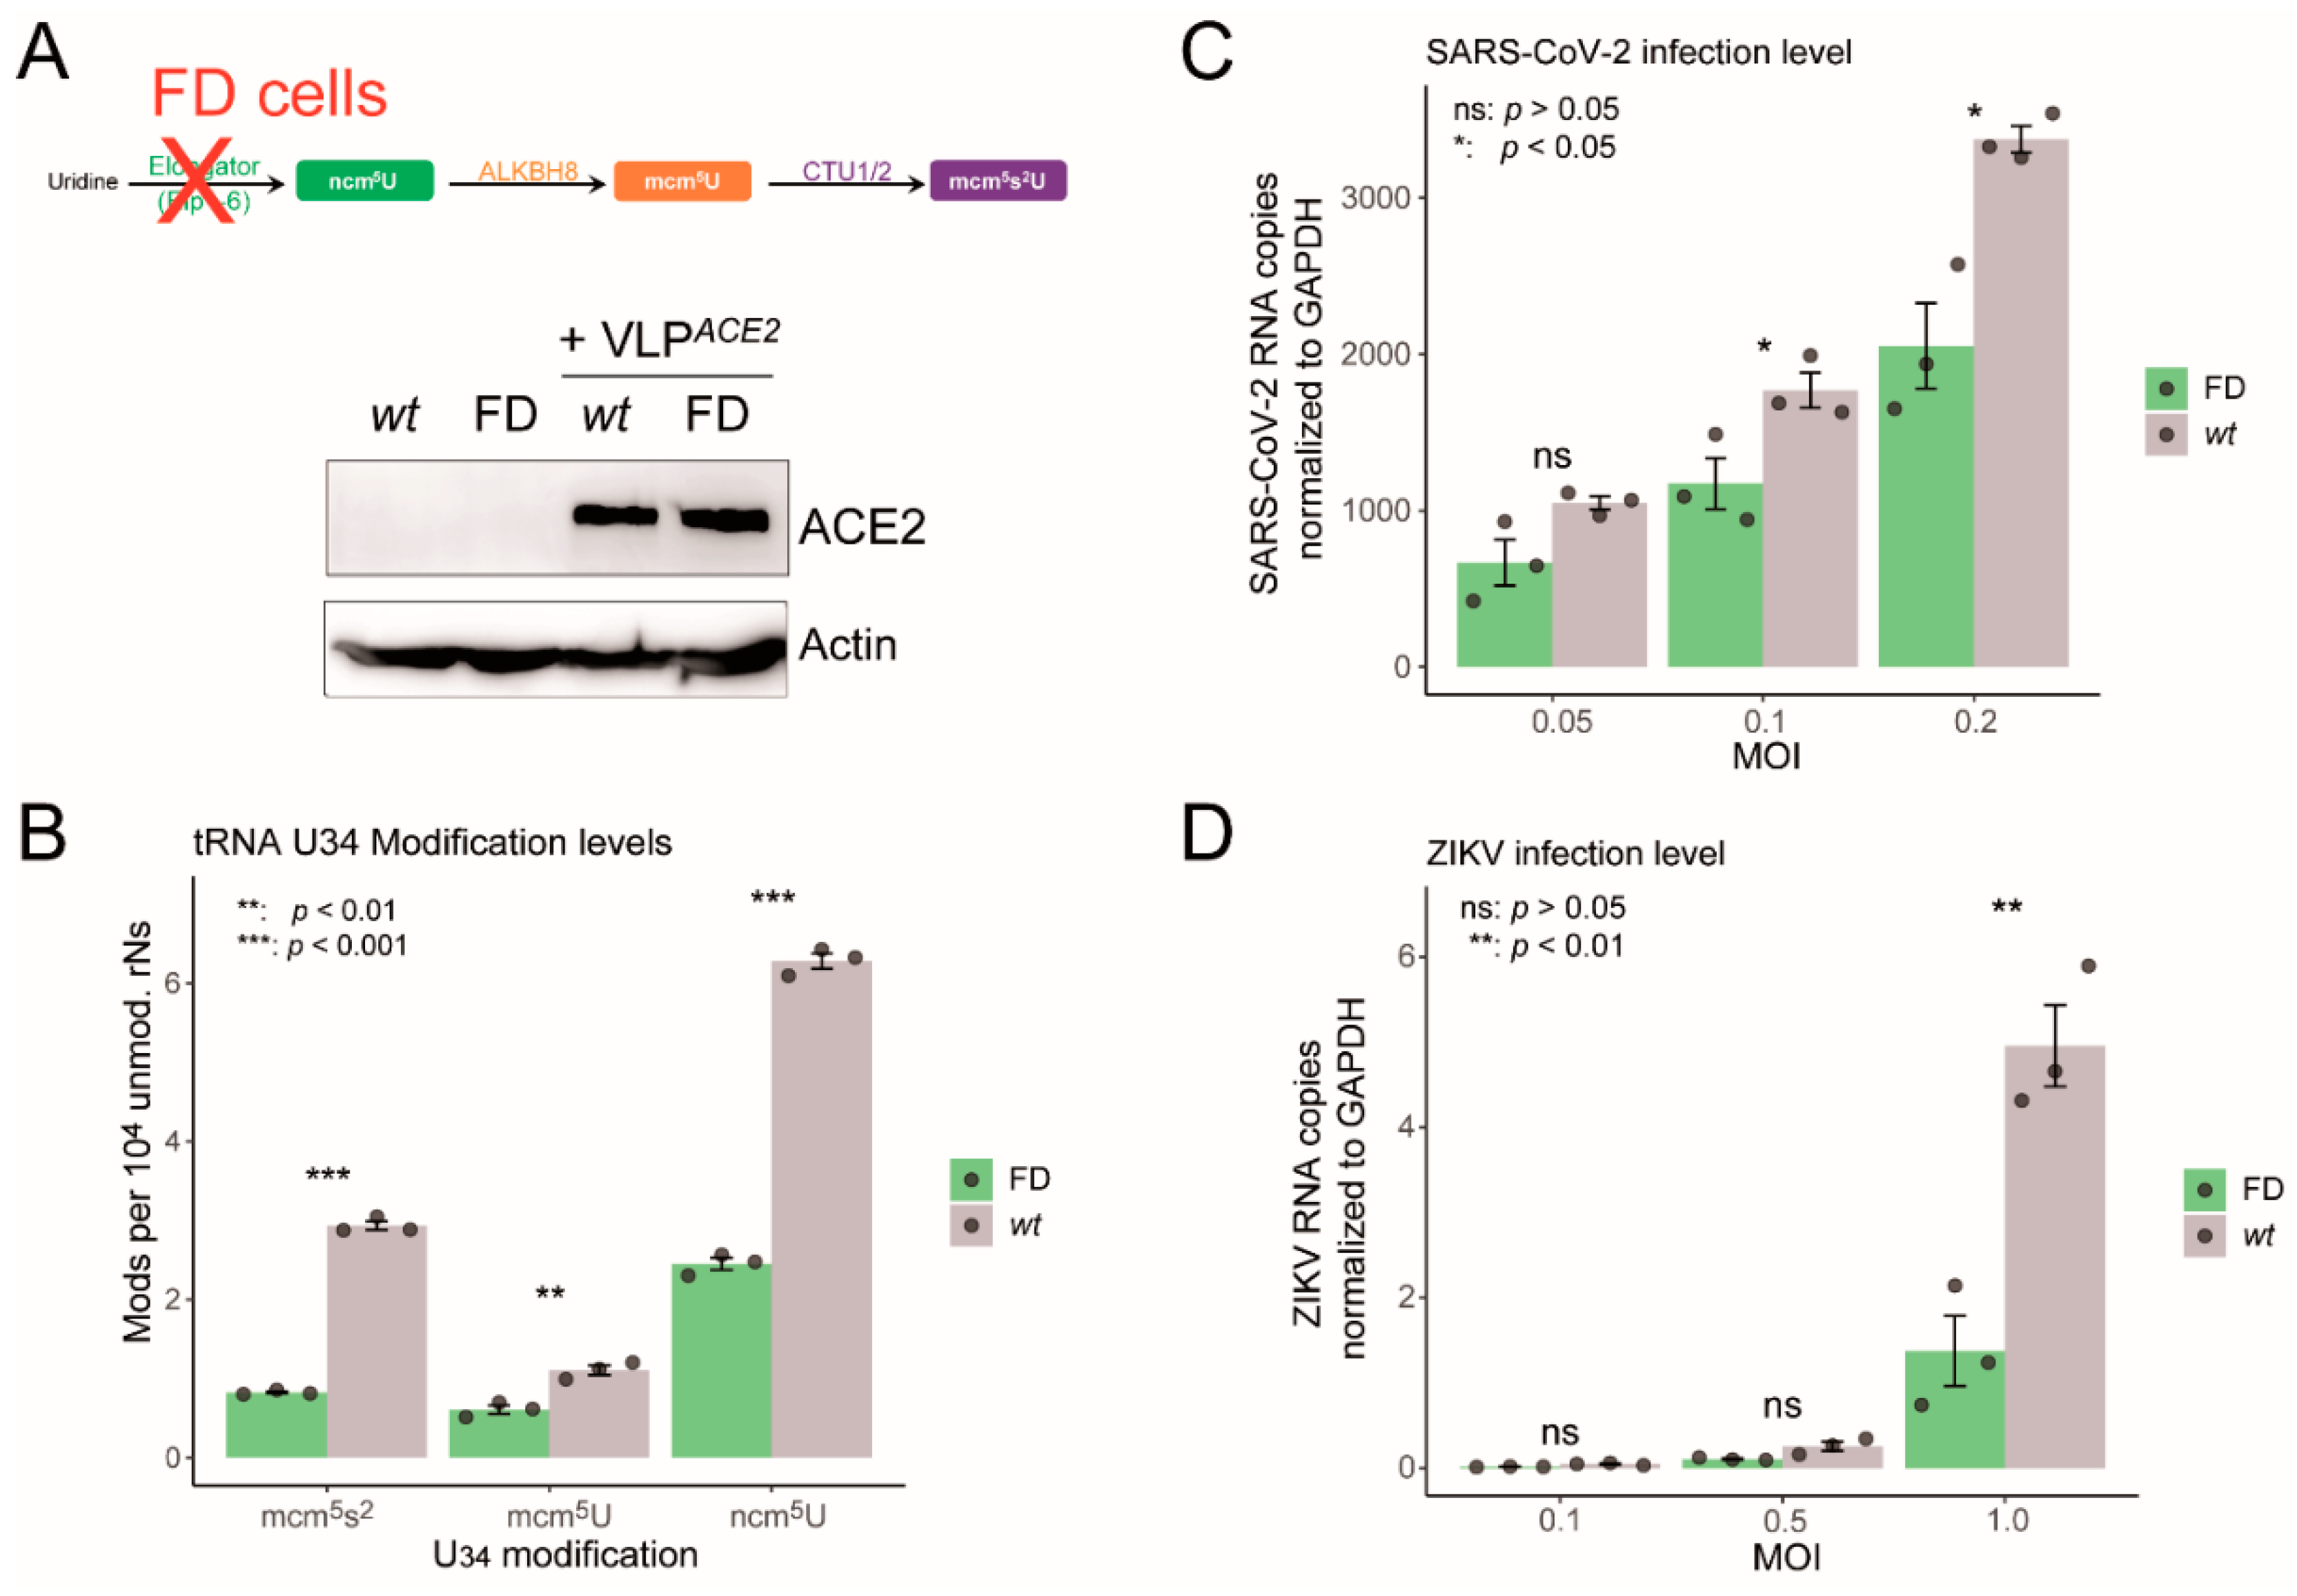
Figure 5.
ALKBH8 and CTU1 Knockdown Individually Impairs SARS-CoV-2 and ZIKV Infection. (A), schematic showing shRNA-mediated knockdown approach targeting U34 ALKBH8 and CTU1 components of U34 modification pathway. The western blot analysis of ACE2 expression in A549 cells with and without lentiviral vector expressing ACE2 (VLPACE2). (B), western blot validation of ALKBH8 and CTU1 knockdown efficiency with corresponding actin loading controls. Numbers indicate relative protein levels. (C) SARS-CoV-2 infection levels measured by RT-qPCR following knockdown of the indicated genes 24 hours post-infection. (D) ZIKV infection levels measured by RT-qPCR following knockdown of the indicated genes 48 hours post-infection.
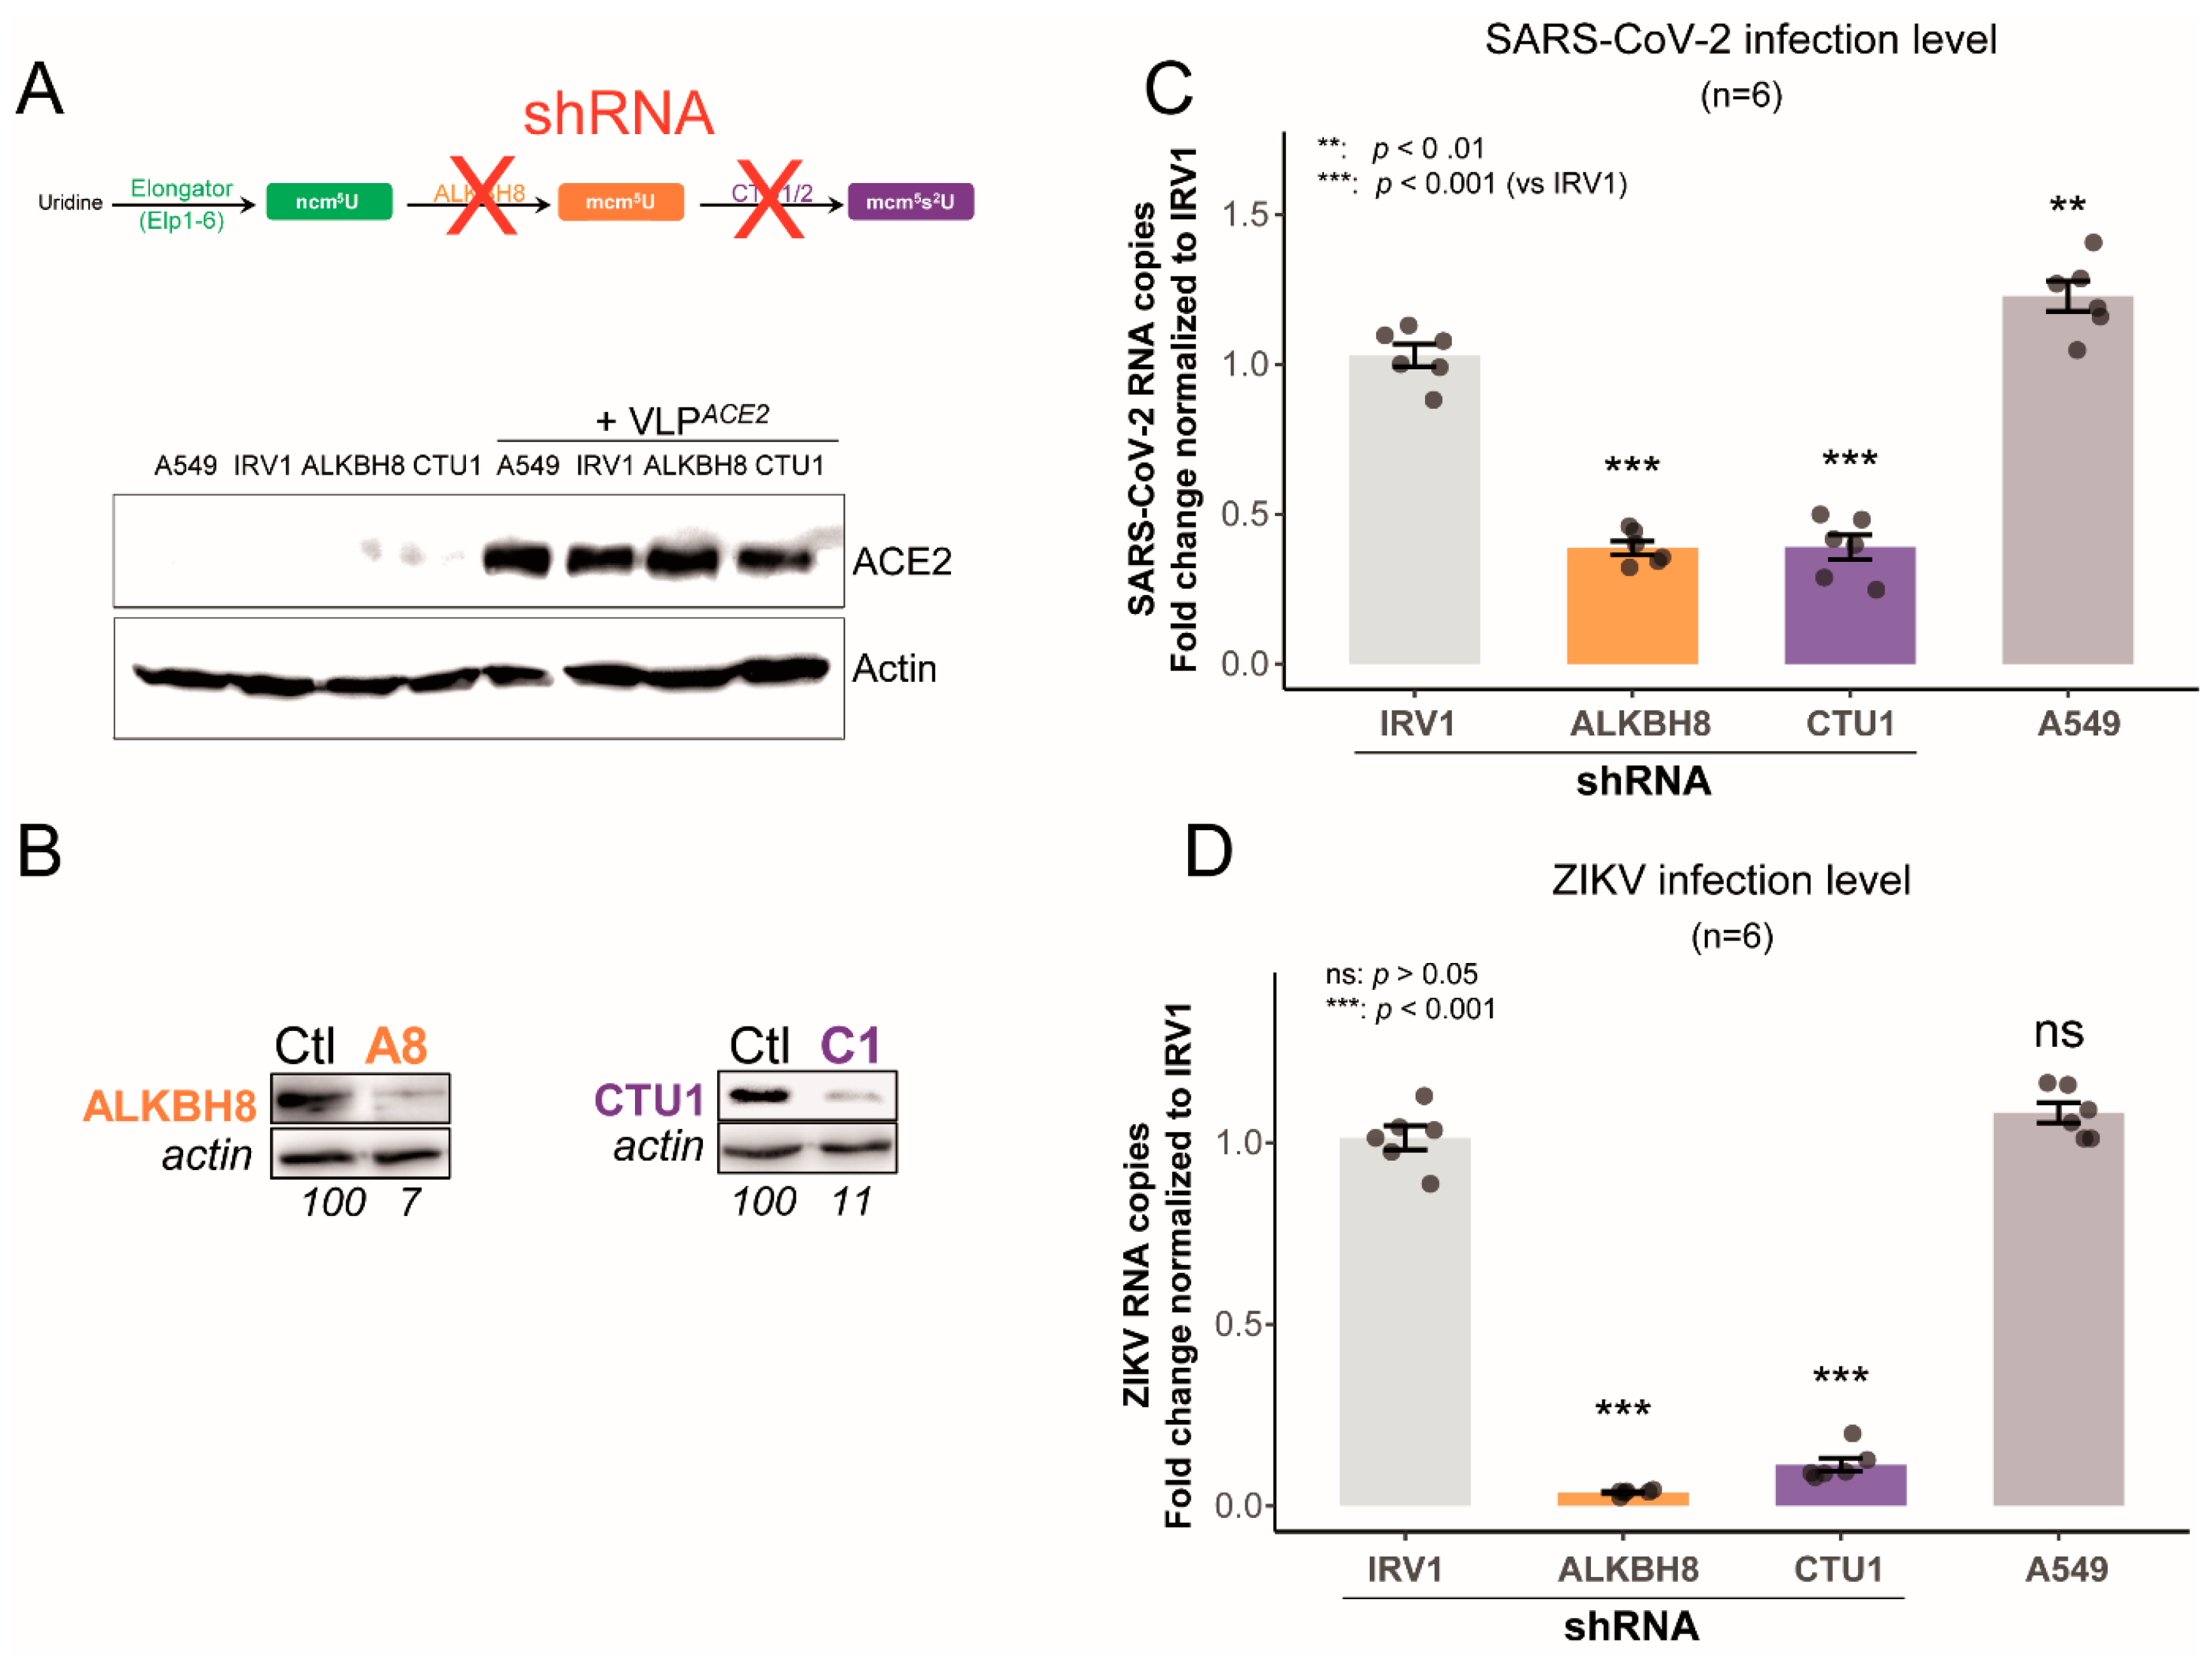
Figure 6.
ELP1 Knockout Limits ZIKV Infection and Translation. (A), schematic of U34 modification pathway in ELP1 knockout (Elp1-KO) cells. Schematic representation of ZIKV BeH8-mCherry 5’ genomic in which the mCherry coding region is followed by a “self-cleaving” 2A peptide and inserted between two tandem capsid (c) segments. (B), western blot analysis comparing ELP1 protein levels between HeLa (control) and Elp1-KO cells with actin loading control. Graph shows quantification of relative ELP1 levels. (C), ZIKV infection rates measured by flow cytometry in control (HeLa) versus Elp1-KO cells at different MOIs 24 hours post-infection. (D) Quantification of ZIKV viral translation in control versus ELP1-KO cells across different MOIs 24 hours post-infection. Statistical significance and percent changes are indicated where applicable. Error bars represent standard error of the mean.
Disclaimer/Publisher’s Note: The statements, opinions and data contained in all publications are solely those of the individual author(s) and contributor(s) and not of MDPI and/or the editor(s). MDPI and/or the editor(s) disclaim responsibility for any injury to people or property resulting from any ideas, methods, instructions or products referred to in the content. |
© 2025 by the authors. Licensee MDPI, Basel, Switzerland. This article is an open access article distributed under the terms and conditions of the Creative Commons Attribution (CC BY) license (http://creativecommons.org/licenses/by/4.0/).
Copyright: This open access article is published under a Creative Commons CC BY 4.0 license, which permit the free download, distribution, and reuse, provided that the author and preprint are cited in any reuse.


