Submitted:
19 June 2025
Posted:
20 June 2025
You are already at the latest version
Abstract
Background/Objectives: In recent years, research has highlighted the heterogeneity of corticotroph pituitary neuroendocrine tumors (CPitNETs), which are linked to Cushing’s disease. Purpose of the study is to determine stable postgenomic markers depending on maximum diameter on MRI (without visualization of the pituitary tumor on MRI/less than 6 mm (group 1a) and with visualization on MRI/more than 6 mm (group 1b). Methods: Immunohistochemically determined granulation pattern (group 2a densely granulated, 2b Crooke cell tumor) and proliferation levels based on Ki-67 with a threshold of 3% (group 3a high proliferation, 3b low proliferation), and biological behavior (group 4a indolent, 4b aggressive). Our study analyzed fresh tissue samples of CPitNETs from 34 patients with Cushing’s disease. Total RNA was extracted and sequenced using Cap Analysis Gene Expression (CAGE) on the Illumina HiSeq2500 platform, followed by bioinformatics analysis. Results: Differentially expressed genes were identified in group 1a tumors (EN1, EFS,) versus group1b (LCN1, BMP3). An inverse relationship was found between tumor volume and the expression of the RBM24 and ADGRD2 genes. A direct relationship was found between tumor volume and the expression of the PFN2 and CNTNAP5 genes. Identical gene signatures were found both in densely granulated and Crooke cell variants. Samples from group 3a, 4b and with bigger volume presented upregulated CT45A3, CT45A, CT45A1 genes. Samples from group 3b were enriched with PI3K/Akt pathway. Samples from group 4a showed expression of FXYD3, FGFR3 and FZD9 genes. Conclusions: Identified postgenomic markers in the studied subgroups of CPitNETs can potentially become biomarkers and allow to predict big volume and type of biological behavior at the early stages of diagnosis and treatment of patients with Cushing's disease.
Keywords:
corticotroph pituitary neuroendocrine tumours
; PitNETs
; Cushing's disease
; RNA
1. Introduction
Cushing’s disease (CD) is a severe multisystem disorder of hypothalamic-pituitary origin, the clinical manifestations of which are caused by hypersecretion of hormones of the adrenal cortex. The cause of the disease is most often an ACTH-secreting tumour of the anterior pituitary gland. However, heterogeneity in size, severity of clinical picture of hypercorticism, biological behavior and outcome after neurosurgical removal of corticotropinomas is observed among the same cell type of pituitary tumors (from corticotroph cells). It is known that microadenomas predominate among corticotropinomas (up to 70%), the remaining cases are represented by tumors larger than 10 mm. At the same time, among corticotropinomas there are very small tumors that may not be visualized by MRI of the brain and/or less than 6 mm (according to various data 36-63%) [1,2,3,4], which is a problem of differential diagnosis between forms of ACTH-dependent hypercorticism (neuroendocrine tumors of the pituitary gland and neuroendocrine tumors of non-pituitary localization). However, such small corticotropinomas are characterized by hypersecretion of ACTH and severe manifestations of endogenous hypercorticism. Microcorticotropinomas larger than 6 mm (but not larger than 10 mm) have similar clinical characteristics and usually do not cause problems with regard to differential diagnosis. Such patients achieve a high level of remission after neurosurgical treatment (up to 80%) [5,6,7], which is due to the radical removal of the neoplasm. A smaller proportion of patients with CD (about 30%) have large tumors over 10 mm, they have difficulties with radical tumor removal and persistence of hypercorticism symptoms, which causes a decrease in the remission rate to 60%. And a small proportion (up to 10%) of patients with an aggressive course, which are characterized by large tumors with invasive growth, resistant to various types of therapy [8]. Recently, such morphological and immunophenotypic characteristics of corticotroph tumours as cellular composition and subtypes, mitotic and proliferative activity, invasive growth have been studied in sufficient detail. However, specific morphological features have not yet been developed and biomarkers have not been determined for the prognosis of the biological behavior of the tumor, including in response to therapy. For a personalized approach to the treatment of such severe patients, it is necessary to conduct a complex multifactorial analysis of the clinical picture, laboratory, instrumental and morphological data.
In recent years, with the development of molecular biology, prospects have arisen for a more in-depth and detailed study of corticotroph tumours themselves, which may allow us to identify the molecular biological features of such inherently various variants of corticotropin. Data obtained as a result of studying the full exome (germinal and somatic mutations, chromosomal abnormalities, tumors developed as part of hereditary syndromes MEN 1, 2, 4, DICER1, Carney complex, etc., and isolated tumors, respectively) and transcriptome (specific expression profiles of genes hormonally active and inactive corticotropinomas, regulation of cell cycles and signaling pathways) are actively studied [9,10,11,12,13]. According to the Department of Fundamental Pathomorphology of the Endocrinology Research Centre, ACTH-secreting pituitary tumors account for up to 39.4% among pituitary neoplasms in adults. This allows using both formalin-free tumor tissue samples and paraffin blocks in combination with blood tests to perform molecular genetic testing.
The purpose of this study is to determine differential gene expression depending on the phenotype of corticotroph pituitary tumors to search for stable postgenomic markers:
- in samples of corticotroph tumors with visualization on MRI/more than 6 mm and without visualization of pituitary tumors on MRI/less than 6 mm for differential diagnosis of pituitary and ectopic localization of ACTH-secreting tumour.
- depending on the tumor volume (according to MRI data) to determine prognostic biomarkers.
- depending on the tumor cell subtype and proliferation level (according to immunohistochemical study) to determine the tumour prognosis.
- depending on the type of biological behavior of tumours - to identify indolent and aggressive corticotropinomas.
2. Materials and Methods
2.1. Patients and Samples
The study was conducted in the Department of Fundamental Pathomorphology, Laboratory of Genetics of Monogenic Endocrine Diseases, Endocrinology Research Center of the Russian Federation. Patients with Cushing’s disease were treated in the Departments of Neuroendocrinology, Osteoporosis and Osteopathy, and Neurosurgery, Endocrinology Research Center of the Russian Federation.
The study included patients with confirmed ACTH-dependent hypercorticism who underwent transnasal transsphenoidal pituitary adenomectomy.
Inclusion criteria: patients over 18 years of age, sporadic tumors, sufficient tissue for histological, immunohistochemical and molecular genetic studies. In case of multiple adenectomies, tissue samples were taken after the primary operation.
Exclusion criteria: absence of corticotroph tumour in histological examination.
The method of sample formation is continuous, in accordance with the inclusion criteria.
2.2. Description of Medical (Diagnostic) Intervention
We used fresh (not formalin-fixed) tissue samples of neuroendocrine corticotroph pituitary tumours (corticotropinomas) obtained after transnasal transsphenoidal pituitary adenomectomy in 34 patients with CD. The neurosurgery was performed in 2022-2023 y. The observation period for subsequent retrospective analysis ranged from 1 year to 2 years.
Part of the obtained tissue samples were transferred to the genetics laboratory for extraction of total RNA with subsequent sequencing, the rest was sent for pathomorphological examination in the Department of Fundamental Pathomorphology of the Endocrinology Research Center of the Russian Federation.
RNA extraction was carried out according to the following protocol. Tissue samples were placed in RNAlater solution, kept for 24 hours at +4◦C, and then transferred to a freezer. Before extraction, the tissue was minced with blades on a Petri dish, then placed in RLT lysis buffer with mercaptoethanol and thoroughly mixed by pipetting, if necessary, incubated at room temperature for 1-2 minutes. Then the samples were centrifuged, the supernatant was collected in new tubes and mixed with an equal volume of 96% alcohol, thoroughly mixed. The entire volume was transferred to the columns and centrifuged. This was followed by washing with RW1 and RPE buffers, RPE was added two to three times. Buffer RLT (lysis) contains guanidine isothiocyanate (GITC), diluted in a 1:1 ratio with 70% ethanol. Buffer RW1 (wash) includes 20% ethanol, 900 mM GITC, and 10 mM Tris-HCl, pH 7.5. Buffer RPE (to prevent ethanol contamination during RNA elution) consists of 80% ethanol, 100 mM NaCl, and 10 mM Tris-HCl, pH 7.5. For samples intended for CAGE RNA-seq, washing was carried out only with RPE buffer without using RW1 buffer. After washing, the columns were centrifuged without solutions for drying. Then 30 μl of purified nuclease-free water was added to elute RNA.
Quality control of the extracted RNA was performed using a spectrophotometric method to determine the concentration and content of contaminants, a fluorimetric method to accurately determine the concentration of RNA, and capillary electrophoresis to determine the integrity of RNA. We used Cap Analysis Gene Expression (CAGE) technology for gene expression profiling analysis with simultaneous determination of cell/tissue-specific transcriptional start site conditions and also prediction of promoter region [14,15]. Sequencing of tissue samples by CAGE technology was performed with an average depth of 30.3±3.8 M and 131±16.7 M to generate CAGE RNAseq libraries. Libraries were sequenced using the Illumina HiSeq2500 platform in high-throughput mode (single-end for CAGE and paired-end for RNA-seq). The quality of raw sequenced reads was assessed using FastQC version 0.11.5. Then, poor quality reads were filtered using fastx_trimmer (FASTX Toolkit 0.0.14) and removeN. In addition, reads corresponding to ribosomal DNA (U13369.1.fa) and adapter sequences were removed using RNAdust 1.06 and Trimmomatic-0.38, respectively. The selected reads were aligned to the Hg38 UCSC genome assembly using BWA 0.7.10-r789 and Hisat2 v2.1.0. Upon alignment, cells were processed with PromoterPipeline to obtain CAGE transcription start sites (CTSS) and CAGE peaks that were associated with nearby transcripts and Gencode v43 genes using the ChIPseeker v1.32.0 package for R. CAGE peaks located within known promoter regions (2 kbp) were used as a training set in TSSClassifier to predict whether the sequence composition of the remaining promoter peaks was similar. Cellular peaks located within known promoters or classified as promoter associated were used for gene expression analysis. For RNAseq libraries, we used HTSeq version 2.0.1 with Gencode transcript models version 43 to calculate expression levels. For transcriptome integration, TPM (tags per million) normalized cellular peak counts were summed for each gene and combined with RNAseq FPKM (fragments per kilobase per million) for the most abundant gene isoform. Pooled counts were log transformed and processed with limma v3.56.2 for R to remove batch effects. Further differential expression analysis and functional enrichment analysis were performed in edgeR v3.42.2 and clusterProfiler v4.8.1 for R, respectively.
2.3. Immunohistochemistry Imaging
The remaining tissue samples were fixed in 10% buffered formalin for 24 hours. Histological preparation of samples was performed according to standard protocol using a Leica robotic system (Leica Biosystems). Later the tissue samples were embedded in paraffin and paraffin blocks were formed. Sections of 3 µm thickness were made from the paraffin blocks. Tissue sections were further used for hematoxylin and eosin staining, as well as for immunohistochemistry (IHC). IHC was performed on samples pre-treated with a high pH unmasking solution, using primary monoclonal rabbit antibodies to detect ACTH, clone 02A3 (1:100, DAKO), monoclonal mouse antibodies to low molecular weight cytokeratin, clone CAM 5.2 (1:100; Cell Marque), Ki-67 clone MIB-1 (RTU, Leica). IHC was performed on a Leica Bond III immunostainer (Leica Biosystems) according to the standard protocol. In accordance with the 2022 World Health Organization classification of pituitary tumors, corticotroph pituitary tumors and their subtypes were diagnosed: densely granular and Crooke cell tumors. Densely granulated corticotroph tumors had basophilic cell cytoplasm on hematoxylin and eosin stained sections and pronounced ACTH expression on IHC. Crooke cell tumors were represented by cells with Crook’s hyaline change, ring-shaped expression of cytokeratin and staining of secretory granules with antibodies to ACTH, localized mainly at the periphery of the cell cytoplasm. Normal pituitary gland samples were used as a positive control for ACTH, CAM 5.2. Normal lymph node tissue samples were used as a positive control for Ki-67. The Ki-67 label index was calculated as the ratio of stained tumor cell nuclei x100% to unstained (a total of 500 cells at x400 magnification of a light microscope). The cutoff point of the Ki-67 label index was considered to be a proliferation level of 3%.
2.4. Statistical Analysis
Statistics for differential expression analysis were calculated by fitting a generalized linear model (GLM) and applying the likelihood ratio test for pairwise comparisons. Dimensionality reduction of normalized gene expression was performed using principal component analysis. In case of differential expression analysis within tumor volumes, linear, quadratic and cubic coefficients were estimated together for testing. Calculated p-values were adjusted using the Benjamini-Hochberg method. For all phenotypes, we found genes with statistically significant expression changes (false discovery rate (FDR) < 0.05 and absolute logFC > 2), ranging from 9 to 489.
The relationship of gene expression to tumor volume for major genes was identified using the Spearman correlation test and the two-tailed Pearson correlation test. The statistical software packages used are listed in the diagnostic intervention description section.
3. Results
3.1. Clinical and Morphological Characteristics of Patients
Women predominated among patients, 88.2% (n=30/34), the median age of patients was 39 years [32.25; 46.75]. The median ACTH level in the blood in the morning (8.00) was 63 pg/ml [64; 81]. The median ACTH level in the blood in the evening (23.00) was 46 pg/ml [33.25; 70.5]. The median cortisol level in the blood in the evening (23.00) was 632 nmol/l [565.5 nmol/l; 854 nmol/l]. The median daily urine cortisol level was 1222 nmol/day [623.75; 1800.25]. According to MRI data, there were only 27 microadenomas (less than 10 mm) and 7 macroadenomas (10 mm and more) among all patients. Four patients with macroadenomas had invasive growth into the cavernous sinuses. Tumor volume was calculated using the Di Chiro-Nelson formula, where V(mm3)=0.5x(vertical size)x(transverse size)x(sagittal size). Tumor volume ranged from 4.2 mm3 to 25241.3 mm3. The median tumor volume was 102.35 mm3 [55.8; 236.4]. A single transnasal transsphenoidal pituitary adenomectomy was performed in 26 patients, a double neurosurgical intervention was performed in 4 patients, a double neurosurgical intervention followed by radiotherapy was performed in 1 patient, proton therapy, unilateral adrenalectomy and 1 neurosurgical intervention were performed in 1 patient. Triple transsphenoidal pituitary adenomectomy was performed in 2 patients. Remission was observed in 17 patients, 10 of them with secondary adrenal insufficiency in the late postoperative period. Persistence of hypercorticism after the first pituitary adenomectomy was detected in 2 patients, with subsequent development of remission after repeated neurosurgical intervention. Persistence of hypercorticism and continued tumor growth were observed in 3 patients after several adenomectomies.
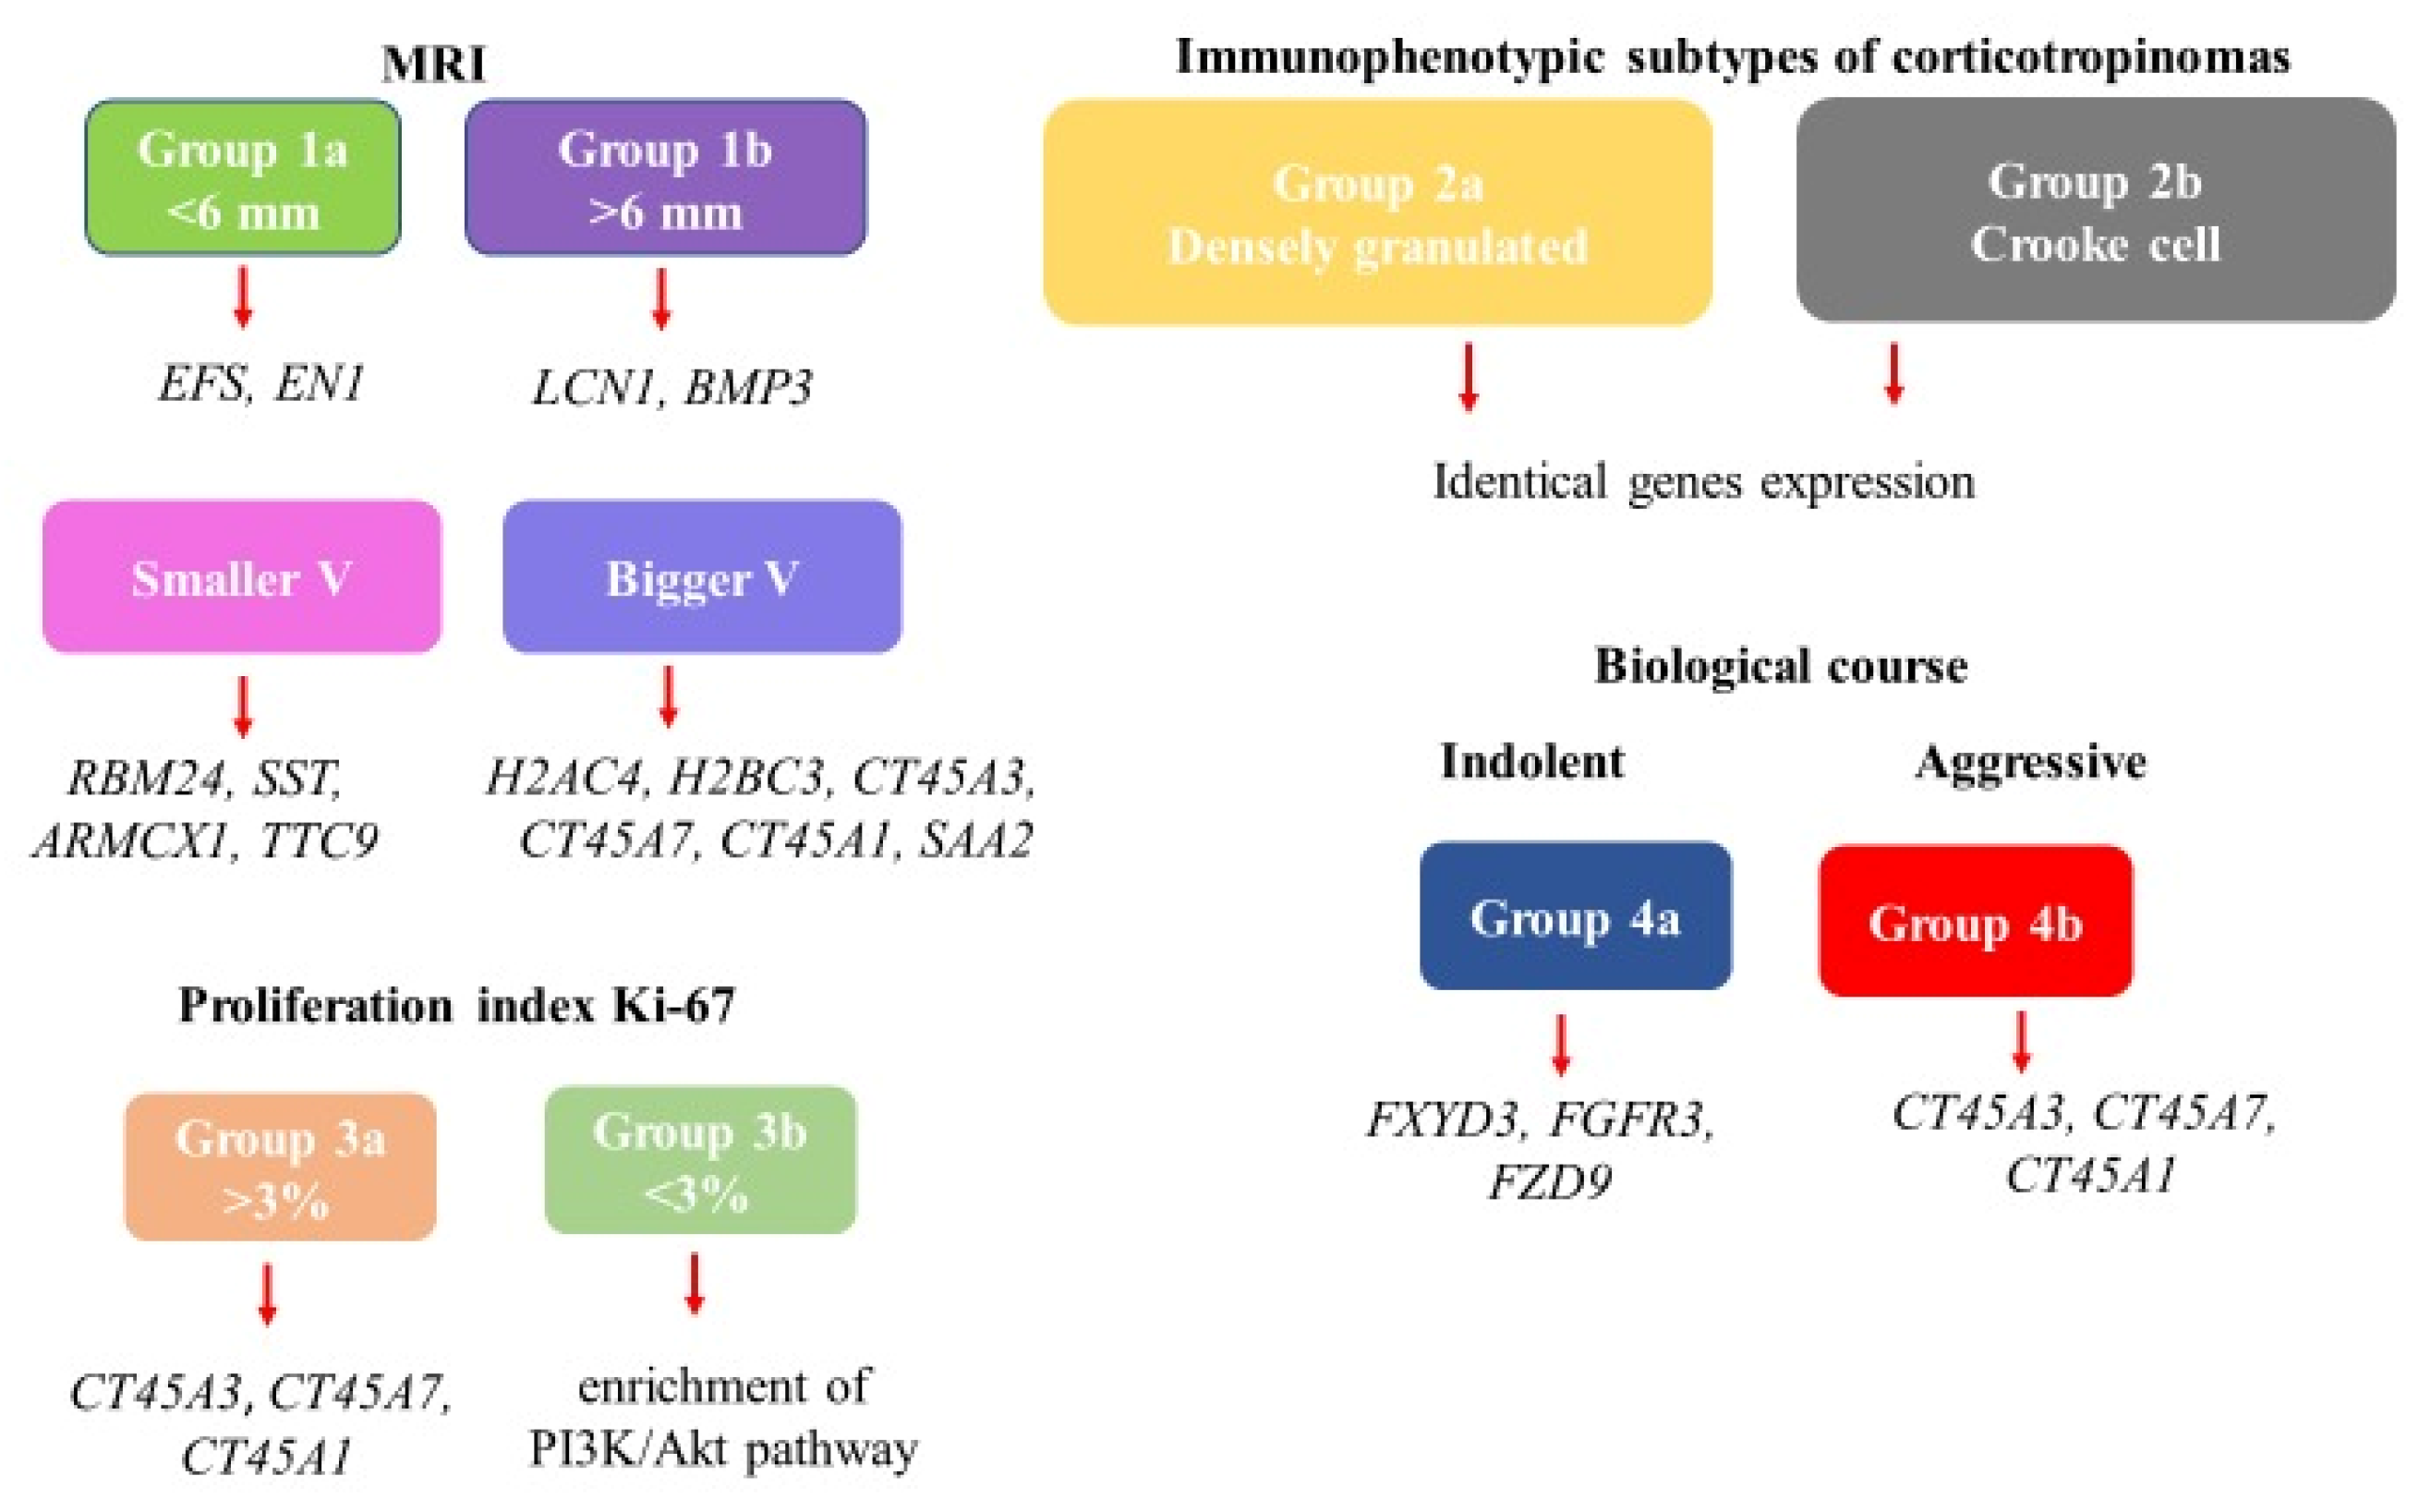
In accordance with the aim of the study, tissue samples of corticotroph tumors obtained after surgery were divided into groups:
Group 1a: without tumor imaging on MRI / or less than 6 mm, group 1b: positive tumour imaging on MRI/ or more than 6 mm
Group 2a: densely granulated, group 2b: Crooke cells tumors.
Group 3a: tumors with high proliferative activity (3% or more), group 3b: tumors with low proliferative activity (less than 3%)
Group 4a: indolent corticotropinomas, 4b: aggressive corticotropinomas.
Group 1a included 10 tumor samples (29.4%), group 1b - 24 samples (70.6%).
Group 2a contained 33 densely granulated corticotropinomas samples (97.0%), group 2b – 1 Crooke cell tumor sample (3.0%).
Group 3a included 9 (26.5%) tumor samples. The median Ki-67 proliferation index was 6.25% [4.0; 8.85]. In 4 cases of corticotropinomas with an aggressive course, Ki-67 proliferation index were 0%, 3.1%, 4.0% and 10.8%. Group 3b – 25 tumor samples (73.5%). The median Ki-67 proliferation index was 1.6% [1.0; 2.2].
Group 4a presented samples of 30 cases (88.2%), group 4b – 4 (11.8%). Four patients had tumors with an aggressive course (macroadenomas with invasive growth into the cavernous sinuses and multiple neurosurgical interventions). Figure 1 shows the distribution of samples by groups.
3.2. General Characteristics of Transcriptome Data
Using the CAGE method, which allows identification of transcription start sites (TSS) of RNA with a resolution of up to several nucleotides, we were able to identify 14,984 active TSS associated with the promoters of active genes and most of the CAGE peaks located within known promoter regions. This allowed reliable assessment of gene expression. The number of samples studied and their distribution by groups are shown in Figure 1.
The profiles of differentially expressed genes identified in the samples of group 1a and 1b are shown in Figure 2. Multidimensional scaling plots for CAGE libraries are shown, using principal component analysis, in accordance with the distribution of tissue samples (P-patient) among tumors without imaging on MRI/ less than 6 mm and positive tumors MRI imaging/ more than 6 mm (Figure 2.A).
Volcano plots presents top differentially expressed (DE) genes among samples from the indicated subgroups (numbers indicate counts of DE genes FDR < 0.05 and |logFC| > 2). In group 1a tissue samples are enriched for the following genes: EFS, ATP6V1B1, EN1, FTCD, ALAS2, CDHR5 (Figure 2.B), these genes were downregulated. The expression of genes such as LCN1, BMP3 was noted in tissue samples of subgroup 1b, these genes were upregulated.
Gene set enrichment analysis based on the gene expression determined fold changes between the selected sample subgroups. GeneRatio represents the proportion of differentially expressed genes tagged with the ontology tag compared to the background value (all genes). Count is the number of DE genes annotated with ontology tag compared to background (all genes). logPadj is an absolute value from log10 (p.adjusted), where p.adjusted is p.values corrected by Benjamini-Hochberg procedure. The GO (Gene Ontology), KEGG (Kyoto Encyclopedia of Genes and Genomes), and WikiPathways (Wikipedia pathways) databases were used (Figure 2.C) [16,17,18].
A higher level of expression of the HBA2 and HBA1 genes (4 out of 10) is noticeable in group 1a compared to the samples from group 2b (5 out of 24). The highest expression level of ENSG00000287902 and 4ENSG00000231754 is observed in single samples from group 1a (1 of 10), while in all samples of group 1b the expression level of these genes is low. Higher expression levels of the APCDD1LDT were detected in samples of group 1b (6 of 24), while in all samples of group 1a the expression level of this gene was lower. The highest level (14) expression of the MFAP4 gene was observed in samples from group 1a (4 of 10) and 1 of 24 samples of group 1b (Figure 2.D).
The profiles of differentially expressed genes detected in samples of different tumor volumes are shown in Figure 3. Multidimensional scaling plots for CAGE libraries are shown, using principal component analysis, in accordance with the distribution of tissue samples (P-patient) among tumors depending on the volume, converted to decimal logarithms log (mm3) 1-10, shown by the color gradient from light pink to purple (Figure 3.A)
Volcano plots showing top differentially expressed (DE) genes among samples from the indicated subgroups (numbers indicate counts of DE genes FDR < 0.05 and |logFC| > 2). DE gene among samples depending on the tumor volume, converted to decimal logarithms log (mm3) 1-10, pink color is for smaller volume, purple - for bigger volume, background gene expression is marked in gray (Figure 3.B). Expression of genes H2AC4, H2BC3, KRTAP20-4, CT45A3, CT45A7, CT45A1, NEB, GPM6A, SAA2 is upregulated in samples of tumors with bigger volume. Expression of genes MFAP4, CEL, FXYD3, CGA is downregulated in samples of tumors with smaller volume.
Gene set enrichment analysis based on the gene expression determined fold changes between the selected sample subgroups. The GO (Gene Ontology), KEGG (Kyoto Encyclopedia of Genes and Genomes), and WikiPathways (Wikipedia pathways) databases were used [16,17,18]. GeneRatio represents the proportion of differentially expressed genes tagged with the ontology tag compared to the background value (all genes). Count is the number of DE genes annotated with ontology tag compared to background (all genes). logPadj is an absolute value from log10 (p.adjusted), where p.adjusted is p.values corrected by Benjamini-Hochberg procedure (Figure 3.C)
It is noteworthy that in samples P29, P30, P10, P12 from tumors with the largest volume, a higher level of such genes expression as KRTAP20-4, CT45A3, CT45A5, CT45A1, etc. was observed. In these samples, the highest level of expression of the genes PDIA2, GPM6A, SAA2 was detected. At the same time, the level of GNAS gene expression was quite high in all samples with different volumes (Figure 3.D).
When analyzing the correlation between tumor volume and gene expression, a significant positive and negative relationship was revealed, shown in Figure 4.
An inverse relationship was found between tumor volume and the expression of the RBM24 and ADGRD2 genes (the smaller the tumor volume, the higher the expression of these genes). A direct relationship was found between tumor volume and the expression of the PFN2 and CNTNAP5 genes (the larger the tumor volume, the higher the expression of the studied genes), figures 4.A, 4B.
It was not possible to assess the differential expression of genes depending on the immunophenotypic subtype of corticotropinomas, since 33 of 34 samples were densely granulated tumors, 1 sample of 34 was Crooke cells corticotropinoma, which would be statistically incorrect.
Pronounced differential gene expression was observed among corticotropinomas samples with different proliferation levels according to the Ki-67 label index. The profiles of differentially expressed genes identified in groups 3a and 3b samples are shown in Figure 5.
Multidimensional scaling plots for CAGE libraries are shown, using principal component analysis, in accordance with the distribution of tissue samples (P-patient) among tumors with high and low proliferative activity (groups 3a and 3b) (Figure 5.A).
Volcano plots presents top DE genes among samples from the indicated subgroups (numbers indicate counts of DE genes FDR < 0.05 and |logFC| > 2). The expression of genes such as CT45A3, CT45A, CT45A1, LCN1 etс. was observed in subgroup 3a, which were upregulated. The expression of genes such as hormones of the adenohypophysis and chorionic gonadotropin (TSHB FSHB GNRHR, CSH1, CSH2, HP, GH2), TGFBR3L, DLK1 etc. was observed in subgroup 3b (Figure 5.B) and were downregulated.
GeneRatio represents the proportion of differentially expressed genes tagged with the ontology tag compared to the background value (all genes). Count is the number of DE genes annotated with ontology tag compared to background (all genes). logPadj is an absolute value from log10 (p.adjusted), where p.adjusted is p.values corrected by Benjamini-Hochberg procedure. The GO (Gene Ontology), KEGG (Kyoto Encyclopedia of Genes and Genomes), and WikiPathways (Wikipedia pathways) databases were used (Figure 5.C) [16,17,18]. It`s also worth noting, that samples from subgroup 3b demonstrated enrichment of PI3K/Akt pathway.
Among the samples of group 3b, attention is drawn to the high level of expression of the genes LINC01679 and ENSG00000261332 (in 12 of 25 samples), GPX3 (in 15 of 25 samples), CGA (in 11 of 25 samples), TGFBR3L, FSHB, CSH2, CSH1 (in 10 of 25 samples), whereas all samples tumors (group 3a) had significantly lower levels of expression of these genes (0 out of 9 samples). In 2 samples (P27 and P10) out of 9 from group with high Ki-67 proliferation and high expression of genes such as LINC02334, LINC02424, ENSG00000257165, ENSG00000260664, ENSG00000259048, RXFP2, ENSG00000266460, LINC01322, LINC01241. At the same time, all samples from the group with low proliferative activity had significantly lower expression of these genes (Figure 5.D).
The profiles of differentially expressed genes identified in the samples of groups 4a and 4b are shown in Figure 6. Multidimensional scaling plots for CAGE libraries are shown, using principal component analysis, in accordance with the distribution of tissue samples (P-patient) among tumors with indolent (group 4a) and aggressive (group 4b) biological behavior (Figure 6.A).
Volcano plots presents top differentially expressed (DE) genes among samples from the indicated subgroups (numbers indicate counts of DE genes FDR < 0.05 and |logFC| > 2). Tumors with an indolent course (4a) were characterized by the expression of FXYD3, FGFR3, FZD9 genes. Tumors with an aggressive course (4b) had the expression of CT45A3, CT45A7, CT45A1 (Figure 6.B).
GeneRatio represents the proportion of differentially expressed genes tagged with the ontology tag compared to the background value (all genes). Count is the number of DE genes annotated with ontology tag compared to background (all genes). logPadj is an absolute value from log10 (p.adjusted), where p.adjusted is p.values corrected by Benjamini-Hochberg procedure. The GO (Gene Ontology), KEGG (Kyoto Encyclopedia of Genes and Genomes), and WikiPathways (Wikipedia pathways) databases were used (Figure 6.C) [16,17,18].
A high level of ALPKA3 gene expression is observed in 19 out of 30 samples from group 4a, IQSEC1 is observed in all samples from group 4a, while the expression level of these genes is low in all samples from group 4b. A high level of UGCG gene expression was observed in all samples from group 4b, in contrast to all samples from group 4a. In 3 from 4 samples from group 4b, a high level of STXBP5L gene expression was detected, while the same gene was expressed in 6 from 7 samples from group 4a. In all 4 samples from group 4b, a high level of MARCHF1 gene expression was detected, unlike to 3 from 30 samples from group 4a (Figure 6.D).
4. Discussion
Thus, by studying the gene expression profiles in different subgroups of corticotroph tumors, we have obtained detailed information about the coding, regulation, synthesis of proteins and subsequent processes triggered by these genes. However, from the whole set we decided to select and discuss only those genes that are related to tumor processes (Figure 7). Of course, most of the gene expression we found has been described in tumors of various localizations. In pituitary tumors, stable postgenomic markers are less known. Nevertheless, they reflect important aspects of oncogenesis in particular in corticotroph tumors and require further study as biomarkers of various phenotypes of specified tumors. Thus, by studying the gene expression profiles in different subgroups of corticotroph tumors, we have obtained detailed information about the coding, regulation, synthesis of proteins and subsequent processes triggered by these genes.
In group 1a tissue samples are enriched for the following genes: EFS, ATP6V1B1, EN1, FTCD, ALAS2, CDHR5. EFS and EN1 gene expression is associated with tumor processes. The protein encoded by the EFS gene is a member of the CAS family of adaptor proteins, which typically serve as scaffolds for the assembly of larger signaling complexes. These complexes are formed on the cell surface, where integrin binding leads to subsequent phosphorylation of the CAS protein, which causes reorganization of the actin cytoskeleton. This gene plays an important role in integrin-mediated cell attachment, spreading, and migration, and plays a role in both normal and malignant cell transformation. Neumann LC et al. explored the role of the differentially methylated EFS promoter region CpG island in cultured melanocytes from uveal melanoma and hypothesize that there might be methylated and unmethylated precursor cells located in the uveal tract. The EFS methylation of a uveal melanoma may depend on which type of precursor cell the tumor originated from [19].
The EN1 gene encodes a protein that includes sequence-specific DNA binding and transcriptional repressor DNA activity specific to RNA polymerase II. Engrailed homeobox 1 (En1) is a homeobox gene expressed in normal and neoplastic eccrine gland cells. There is evidence of an association of this gene expression with a prognostic marker for such a malignancy as eccrine porocarcinoma [20].
Tissue samples in group 1b are enriched for the LCN1, BMP3 (Figure 2).
It is known that the LCN1 gene encodes the synthesis of lipocalin proteins, which are a family of transport proteins capable of binding and transferring small hydrophobic molecules, inorganic cations/anions and amino acids/oligopeptides, as well as the transport of vitamins, nucleosides and related molecules. It is mainly expressed in secretory glands and tissues, such as the lachrymal and lingual gland, and nasal, mammary, and tracheobronchial mucosae. Zhang X et al. analyzed the clinical data, clinicopathologic features of breast cancer patients, RNA sequencing and LCN1 expression data. This study determined the association between LCN1 expression and breast cancer, also validated LCN1 expression and survival analyses. Authors concluded that LCN1 expression may be an independent predictor of a poor prognosis in breast cancer patients [21].
BMP3 gene encodes a ligand of the TGF-beta (transforming growth factor-beta) superfamily of proteins, which plays an important role in development by stimulating early skeletal formation and reducing bone density and antagonizing the ability of certain osteogenic. Recently, data has emerged that they participate in the process of tumorigenesis and regulate tumor progression through various mechanisms [22]. Meng W et al. explored expression and clinical significance of BMPs/BMPRs in lung adenocarcinoma. It was verified four differentially expressed bone morphogenetic proteins (BMP2, BMP5, BMP6, and GDF10) and one bone morphogenetic proteins receptor (ACVRL1), all of them were downregulated in lung adenocarcinoma tissues. BMP5 was identified as an independent protective prognostic factor, and higher BMP5 expression indicated better clinical outcomes in lung adenocarcinoma [23].
In addition, long non-coding RNAs and pseudogenes (APCDD1L-DT, ENSG00000254620, ENSG00000231754, DEFA9P) were detected in groups of samples 1a and 1b.
Tumors with a smaller volume are characterized by expression of many genes. We also selected RBM24, SST, ARMCX1, TTC9 genes responsible for oncogenesis processes.
RBM24 protein products have been extensively studied and are considered RNA-binding proteins and are the most important post-transcriptional regulators of gene expression. They participate in a wide range of physiological and pathological processes, modulating virtually all aspects of RNA metabolism. Changes in their expression and function disrupt tissue homeostasis and lead to the development of various types of malignant tumors. Studies using various animal models show that it plays an important role in stimulating cellular differentiation during organogenesis and tissue regeneration. There is also accumulating evidence that its dysregulation is common in human cancers. In some tissues, RBM24 clearly functions as a tumor suppressor, consistent with its ability to suppress cell proliferation. However, increased levels of RBM24 in other cancers appear to promote tumor growth. There is a possibility that RBM24 has both antitumor and protumor activity, making it a potential biomarker for diagnosis and prognosis, as well as a therapeutic target for carcinoma treatment [24,25,26].
SST, which encodes the protein somatostatin. It inhibits the release of numerous hormones by binding to high-affinity G-protein-coupled somatostatin receptors. This protein is an important regulator of the endocrine system, interacting with pituitary growth hormone, thyroid-stimulating hormone, and most gastrointestinal hormones. Somatostatin also affects the speed of transmission of nerve impulses in the central nervous system and the proliferation of both normal and tumor cells. It is known that SSTR5 is characterized by high expression in corticotroph tumors, which is a substrate for the action of pasireotide [27].
ARMCX1 encodes a protein of the ALEX family, which may play an important role in tumor suppression. This gene is localized on the X chromosome and is associated with the development of gastric carcinoma, could play protective role in tumor immunology. Also it is potential prognostic biomarker, which has been proven in a number of studies [28,29].
TTC9 encodes a protein containing three tetratricopeptide repeats. This gene has been shown to be regulated by estrogen and gestagen in breast carcinoma cells and may play a role in tumor cell invasion and metastasis [30].
In tissue samples of corticotroph tumors with large volumes, expression of genes associated with the encoding and synthesis of histones (H2AC4, H2BC3) was observed. These are nuclear proteins responsible for the nucleosomal structure of chromosomal fibers and play a central role in the regulation of transcription, DNA repair and chromosome stability. There are indications in the literature of a connection between the expression of these genes and breast carcinoma. Hejer Dhahri proposes deeper exploration of histone variants, their influence on nucleosome structure, and the downstream pathways involved in dysregulating cancer-related genes, especially in cases lacking evident DNA mutations in well-established breast canceroncogenes [31].
DNA accessibility is regulated by a complex set of post-translational modifications of histones, also called the histone code, and nucleosome remodeling. Expression of genes (CT45A3, CT45A, CT45A1) involved in 3’-end processing of mRNA, which is part of a complex, was noted. Overexpression of CT45A1 in breast cancer cells markedly upregulated various oncogenic and metastatic genes, constitutively activated ERK and CREB signaling pathways, promoted epithelial–mesenchymal transition, and increased cell stemness, tumorigenesis, invasion, and metastasis, whereas silencing CT45A1 significantly reduced cancer cell migration and invasion [32].
In addition, expression of the SAA2 gene, which encodes the synthesis of serum amyloid, a family of apolipoproteins, was detected in tissue samples from large volumes of corticotropinomas. This protein is a major acute phase protein that is highly expressed in response to inflammation and tissue injury. High levels of this protein are associated with chronic inflammatory diseases, including atherosclerosis, rheumatoid arthritis, Alzheimer’s disease, and Crohn’s disease. A number of studies have indicated that this protein may also be a potential biomarker for some tumors, such as renal cell carcinoma, what has been proven in Cooley`s study. Authors described a series of systematic studies to characterize the molecular events occurring at various step of tumor progression in renal cell carcinoma, aimed at unraveling clinically relevant molecular signatures and biomarkers [33].
Long non-coding RNAs and pseudogenes (ENSG00000248921, ENSG00000289117, RNVU1-22, ENSG00000248646, TMEM246-AS1) were also detected in the groups of samples with high and low volumes, shown in Figure 3.2.
Samples of corticotroph tumors with high proliferation levels (group 3a) are characterized by the expression of CT45A3, CT45A, CT45A1 genes, same as for tumors with bigger volume, which may indicate similar processes in tumors with large sizes and high proliferative activity.
Samples of tumors with low proliferation levels of Ki67 (group 3b) demonstrated the involvement of the PI3K/Akt pathway. It`s known, that PI3K/AKT pathways play a pivotal role in the complex signaling network along with many interactions: it links growth factors, nutrients, and energy available to cell survival, growth, motility and proliferation. The biological role of the PI3K/AKT/mTOR signaling pathway described in the development of different malignant tumors (prostate, breast, skin, and head and neck cancers) [34,35]. There are known studies concerning this signaling pathway in pituitary tumors, in particular for corticotroph tumors (tissue samples, Western blot, primary cell culture) [36,37]. In some studies there was no significant correlation found between the level of mTOR activity and any of the pituitary tumors parameters: tumor volume, tumor largest dimension, Knosp’s grading, Ki-67%, and pErk activity [38]. The results of our study can be correlated with the indicated results. Of course, it`s needed to clarify the exact functions and the underlying mechanisms of these signaling pathways in the pathogenesis of corticotroph pituitary neuroendocrine tumors and its role in proliferative process, invasiveness and aggressive clinical outcomes.
Long non-coding RNAs and pseudogenes LINC02334, LINC02997, LINC01241, MTCYBP38 were detected in corticotropinomas samples from groups 3a and 3b.
Samples of corticotroph tumors with the indolent follow up (group 4a) showed the expression of following genes: FXYD3, FGFR3 and FZD9.
FXYD3 could be associated with encoding a cell membrane protein that can regulate the function of ion pumps and ion channels. It may also play a role as oncogene, which promotes the proliferation, migration, and invasion in various cancers including pancreatic cancer, cervical cancer, and colon cancer [39]. Yee KX et al. illustrated that FXYD3-related genes were significantly related to the epithelial-mesenchymal transition pathway and suggested that FXYD3 is a highly metastatic gene in the early stage of pancreatic cancer [40].
Of particular note is the expression of FGFR3 gene, which encodes the synthesis of proteins of the fibroblast growth factor receptor (FGFR) family, which trigger the mechanisms of mitogenesis and cell differentiation. Activation of these receptors can lead, in particular, to the activation of the RAS-MAPK and PI3K-AKT pathways, which have an oncogenic potential in various types of carcinomas. As mentioned above, activation of PI3K-AKT pathways has also been described in corticotropinomas and may be associated with the presence of USP8 mutation [37]. Targeted drugs ponatinib, dovitinib and pazopanib have shown efficacy in the treatment of overactive FGFR signaling, which prompted the use of diagnostic sequencing targeting FGFR [41].
FZD9 one of numerus genes, which takes part in the canonical beta-catenin signaling pathway, resulting in beta-catenin accumulation in nuclei and activation of Wnt target genes, may play a role in the viability of neural progenitor cells through the canonical beta-catenin signaling pathway by negatively regulating cell cycle arrest, resulting in inhibition of the process of neuronal apoptosis [42].
In samples of tumors with aggressive type of course (group 4b) we found expression of the same genes as in tumors with a large volume and high proliferative activity (CT45A3, CT45A, CT45A1). The function of these genes is described above.
Long non-coding RNAs LINC01659 were detected in the samples of corticotropinomas from group 4a, while these molecules were not expressed in the samples of group 4b (Figure 6).
In our work, limitations were identified associated with the uneven distribution of corticotropinomas by cellular composition and immunophenotype (Figure 1). It did not allow us to identify differences in gene expression. Among corticotropinomas, the densely granulated subtype (group 2a, n 33 of 34) prevailed, which is explained by the high frequency of occurrence of this tumor subtype (more than 70%) and the low frequency of occurrence of corticotropinomas from Crooke cells (about 5%) [43]. However, corticotropinomas from Crooke cells are associated with an aggressive course up to the development of metastases [44]. Such features of biological behavior should be taken into account and attempts should be made to study this rare this variant of corticotropinomas in relation to the search for specific biomarkers.
We would like to draw special attention to the expression of long non-coding RNAs (ncRNAs). As high-throughput RNA sequencing technologies became widely available, they showed that ~90% of the human genome transcribes non-coding RNAs [45]. Interestingly, only 1-2% of all transcripts originate from protein-coding genes and are translated into proteins. Previously, these non-coding transcripts were considered unwanted information or transcriptional “noise” [46]. However, it has now been confirmed that non-coding RNAs play an important role in cellular and RNA homeostasis. The ncRNA family is very diverse; they are classified by their position in the genome, mechanism of action, or size. Depending on their size, ncRNAs are divided into small (<200 ntl) and long (>200 ntl) ncRNAs. The size of long ncRNAs ranges from ~200 to tens of thousands of nucleotides, and they are highly conserved throughout evolution. Like mRNA, they are tissue-specific. Since long ncRNAs play an important role in many biological processes, such as transcription, splicing, translation, gene expression, cell cycle, imprinting, embryogenesis, development, and disruption of ncRNA regulation leads to the emergence of oncogenic or tumor-suppressing properties, this dictates the need for further study of these substances in pituitary tumors [47].
5. Conclusions
Thus, CAGE RNA sequencing revealed specific transcriptomic signatures for phenotypically various pituitary corticotroph tumors: negative visualization of pituitary tumor on MRI/<6 mm with positive visualization on MRI/>6 mm, as well as in tumors of larger and smaller volumes, with high and low levels of proliferation, indolent and aggressive types of biological behavior. The identified postgenomic markers in the studied corticotropinomas subgroups can potentially become biomarkers that will allow differential diagnostics of pituitary and ectopic ACTH-secreting tumors, will provide an opportunity to predict the increase in volume and type of biological behavior of corticotropin at the early stages of diagnosis and treatment of patients with Cushing’s disease.
Author Contributions
Conceptualization, A.L. and R.D.; methodology, R.D., A.N. and M.U.; investigation, A.L., A.K. and E.P.; data curation, R.M. and M.U.; writing—original draft preparation, A.L. and R.D.; writing—review and editing, N.P., A.N., E.P., Zh.B., A.G., S.P. and L.U.; visualization, A.L. and M.U.; supervision, O.G., G.M. and N.M. All authors have read and agreed to the published version of the manuscript.
Funding
The study was supported by the Ministry of Science and Higher Education of the Russian Federation (agreement no. 075-15-2022-310).
Institutional Review Board Statement
The study was conducted according to the guidelines of the Declaration of Helsinki, and approved by the Institutional Ethics Committee of Endocrinology Research Centre (protocol code 16, 11.09.2024).
Informed Consent Statement
Informed consent was obtained from all subjects involved in the study.
Data Availability Statement
The data presented in this study are available in this article.
Conflicts of Interest
The authors declare no conflict of interest.
Abbreviations
| CAGE | Cap Analysis Gene Expression |
| CD | Cushing’s disease |
| CPitNETs | corticotroph pituitary neuroendocrine tumors |
| DE | differentially expressed |
| FDR | false discovery rate |
| GLM | generalized linear model |
| GO | Gene Ontology |
| IHC | immunohistochemistry |
| KEGG | Kyoto Encyclopedia of Genes and Genomes |
| TSS | transcription start sites |
| WikiPathways | Wikipedia pathways |
References
- Chandler, W.F.; Barkan, A.L.; Hollon, T.; Sakharova, A.; Sack, J.; Brahma, B.; Schteingart, D.E. Outcome of transsphenoidal surgery for Cushing disease: a single-center experience over 32 years. Neurosurgery 2016, 78, 216–223. [Google Scholar] [CrossRef]
- Semple, P.L.; Vance, M.L.; Findling, J.; Laws, E.R., Jr. Transsphenoidal surgery for Cushing’s disease: outcome in patients with a normal magnetic resonance imaging scan. Neurosurgery 2000, 46, 553–559. [Google Scholar] [CrossRef]
- Sheehan, J.M.; Lopes, M.B.; Sheehan, J.P.; Ellegala, D.; Webb, K.M.; Laws, E.R., Jr. Results of transsphenoidal surgery for Cushing’s disease in patients with no histologically confirmed tumor. Neurosurgery 2000, 47, 33–39. [Google Scholar] [CrossRef]
- Grober, Y.; Grober, H.; Wintermark, M.; Jane, J.A.; Oldfield, E.H. Comparison of MRI techniques for detecting microadenomas in Cushing’s disease. J Neurosurg. 2018, 128, 1051–1057. [Google Scholar] [CrossRef] [PubMed]
- Stroud, A.; Dhaliwal, P.; Alvarado, R.; Winder, M.J.; Jonker, B.P.; Grayson, J.W.; Hamizan, A.; Harvey, R.J.; McCormack, A. Outcomes of pituitary surgery for Cushing’s disease: a systematic review and meta-analysis. Pituitary 2020, 23, 595–609. [Google Scholar] [CrossRef]
- Capatina, C.; Hinojosa-Amaya, J.M.; Poiana, C.; Fleseriu, M. Management of patients with persistent or recurrent Cushing’s disease after initial pituitary surgery. Expert Rev Endocrinol Metab 2020, 15, 321–339. [Google Scholar] [CrossRef]
- Fleseriu, M.; Auchus, R.; Bancos, I.; Ben-Shlomo, A.; Bertherat, J.; Biermasz, N.R.; Boguszewski, C.L.; Bronstein, M.D.; Buchfelder, M.; Carmichael, J.D.; et al. Consensus on Diagnosis and Management of Cushing’s Disease: A Guideline Update. Lancet Diabetes Endocrinol 2021, 9, 847–875. [Google Scholar] [CrossRef]
- Casar-Borota, O.; Boldt, H.B.; Engström, B.E.; Andersen, M.S.; Baussart, B.; Bengtsson, D.; Berinder, K.; Ekman, B.; Feldt-Rasmussen, U.; Höybye, C.; et al. Corticotroph Aggressive Pituitary Tumors and Carcinomas Frequently Harbor ATRX Mutations. J Clin Endocrinol Metab 2021, 106. 4, 1183–1194. [Google Scholar] [CrossRef] [PubMed]
- Trouillas, J.; Roy, P.; Sturm, N.; Dantony, E.; Cortet-Rudelli, C.; Viennet, G.; Bonneville, J.F.; Assaker, R.; Auger, C.; Brue, T.; Cornelius, A.; et al. A new prognostic clinicopathological classification of pituitary adenomas: a multicentric case–control study of 410 patients with 8 years post-operative follow-up. Acta Neuropathol 2013, 126, 123–135. [Google Scholar] [CrossRef]
- Simon, J.; Theodoropoulou, M. Genetics of Cushing’s disease. Journal of Neuroendocrinology 2022, 13148. [Google Scholar] [CrossRef] [PubMed]
- Peculis, R.; Niedra, H.; Rovite, V. Large scale molecular studies of pituitary neuroendocrine tumors: novel markers, mechanisms and translational perspectives. Cancers 2021, 13, 1395. [Google Scholar] [CrossRef]
- Neou, M.; Villa, C.; Armignacco, R.; Jouinot, A.; Raffin-Sanson, M.L.; Septier, A.; Letourneur, F.; Diry, S.; Diedisheim, M.; Izac, B.; et al. Pangenomic classification of pituitary neuroendocrine tumors. Cancer cell 2020. 37, 1, 123-134.e5. [CrossRef]
- Salomon, M.P.; Wang, X.; Marzese, D.M.; Hsu, S.C.; Nelson, N.; Zhang, X.; Matsuba, C.; Takasumi, Y.; Ballesteros-Merino, C.; Fox, B.A.; et al. The epigenomic landscape of pituitary adenomas reveals specific alterations and differentiates among acromegaly, Cushing’s disease and endocrine-inactive subtypes. Clinical Cancer Research 2018, 24, 17, 4126–4136. [Google Scholar] [CrossRef] [PubMed]
- Kawaji, H.; Lizio, M.; Itoh, M.; Kanamori-Katayama, M.; Kaiho, A.; Nishiyori-Sueki, H.; Shin, J.W.; Kojima-Ishiyama, M.; Kawano, M.; Murata, M.; et al. Comparison of CAGE and RNA-seq transcriptome profiling using clonally amplified and single-molecule next-generation sequencing. Genome Res. 2014, 24, 4, 708–717. [Google Scholar] [CrossRef] [PubMed]
- Murata, M.; Nishiyori-Sueki, H.; Kojima-Ishiyama, M.; Carninci, P.; Hayashizaki, Y.; Itoh, M. Detecting expressed genes using CAGE. Methods in molecular biology 2014, 1164, 67–85. [Google Scholar] [CrossRef]
- The Gene Ontology Resource. Available online: https://geneontology.org/ (accessed on 10 May 2024).
- Kyoto Encyclopedia of Genes and Genomes. Available online: https://www.genome.jp/kegg/ (accessed on 18 May 2024).
- WikiPathways 2024: next generation pathway database. Available online: https://www.wikipathways.org/ (accessed on 10 June 2024).
- Neumann, L.C.; Weinhäusel, A.; Thomas, S.; Horsthemke, B.; Lohmann, D.R.; Zeschnigk, M. EFS shows biallelic methylation in uveal melanoma with poor prognosis as well as tissue-specific methylation. BMC Cancer 2011, 11, 380. [Google Scholar] [CrossRef]
- Miura, K.; Akashi, T.; Namiki, T.; Hishima, T.; Bae, Y.; Sakurai, U.; Murano, K.; Shiraishi, J.; Warabi, M.; Tanizawa, T.; et al. Engrailed Homeobox 1 and Cytokeratin 19 are independent Diagnostic markers of eccrine porocarcinoma and distinguish it from squamous cell carcinoma. Am J Clin Pathol 2020. 154:499-509. [CrossRef]
- Zhang, X.; Cui, Y.; He, M. Lipocalin-1 expression as a prognosticator marker of survival in breast cancer patients. Breast Care 2020, 15, 272–280. [Google Scholar] [CrossRef]
- Davis, H.; Raja, E.; Miyazono, K.; Tsubakihara, Y.; Moustakas, A. Mechanisms of Action of Bone Morphogenetic Proteins in Cancer. Cytokine Growth Factor Rev 2016, 27, 81–92. [Google Scholar] [CrossRef]
- Meng, W.; Xiao, H.; Zhao, R.; Li, D.; Li, K.; Meng, Y.; Chen, J.; Wang, Y.; Liao, Y. The Prognostic Value of Bone Morphogenetic Proteins and Their Receptors in Lung Adenocarcinoma. Front. Oncol 2021, 11, 608239. [Google Scholar] [CrossRef]
- Shi, D.L. RBM24 in the post-transcriptional regulation of cancer progression: anti-tumor or pro-tumor activity? Cancers 2022, 14, 1843. [Google Scholar] [CrossRef]
- Qin, H.; Ni, H.; Liu, Y.; Yuan, Y.; Tao, X.; Li, X.; Zheng, L. RNA-binding proteins in tumor progression. J. Hematol. Oncol. 2020, 13, 90. [Google Scholar] [CrossRef]
- He, B.; Wu, C.; Sun, W.; Qiu, Y.; Li, J.; Liu, Z.; Jing, T.; Wang, H.; Liao, Y. Mir-383 increases the cisplatin sensitivity of lung adenocarcinoma cells through inhibition of the RBM24-mediated NF-kappaB signaling pathway. Int. J. Oncol. 2021, 59, 1–16. [Google Scholar] [CrossRef]
- Seltzer, J.; Ashton, C.E.; Scotton, T.C.; Pangal, D.; Carmichael, J.D.; Zada, G. Gene and protein expression in pituitary corticotroph adenomas: a systematic review of the literature. Neurosurg Focus 2015, 38, 2, E17. [Google Scholar] [CrossRef] [PubMed]
- Wang, T.A.; Zhong, H.G.; Qin, Y.Z.; Wei, W.; Li, Z.; Huang, M.; Luo, X. ARMCX family gene expression analysis and potential prognostic biomarkers for prediction of clinical outcome in patients with gastric carcinoma. BioMed Research International Volume 2020. [Google Scholar] [CrossRef] [PubMed]
- Lv, C.; Yang, D.; Zhang, D.; Shen, J.; Wang, Z.; He, S.; Meng, L.; Song, J.; Zhao, J. Expression of ARMCX1 in gastric cancer contributes to prognosis and influences chemotherapy. Journal of Immunology Research 2023, 262, 3317. [Google Scholar] [CrossRef] [PubMed]
- Shenglan, C.; Jayasree, K.I.V. Identification of tetratricopeptide repeat domain 9, a hormonally regulated protein. Biochemical and Biophysical Research Communications 2006, 345, 1, 310–317. [Google Scholar] [CrossRef]
- Dhahri, H.; Saintilnord, W.N.; Chandler, D.; Fondufe-Mittendorf, Y.N. Beyond the usual suspects: examining the role of understudied histone variants in breast cancer. Int. J. Mol. Sci. 2024, 25, 6788. [Google Scholar] [CrossRef]
- Shang, B.; Gao, A.; Pan, Y.; Zhang, G.; Tu, J.; Zhou, Y.; Yang, P.; Cao, Z.; Wei, Q.; Ding, Y.; et al. CT45A1 acts as a new proto-oncogene to trigger tumorigenesis and cancer metastasis. Cell Death and Disease 2014, 5, e1285. [Google Scholar] [CrossRef]
- Cooley, L.S.; Rudewicz, J.; Souleyreau, W.; Emanuelli, A.; Alvarez-Arenas, A.; Clarke, K.; Falciani, F.; Dufies, M.; Lambrechts, D.; Modave, E.; et al. Experimental and computational modeling for signature and biomarker discovery of renal cell carcinoma progression. Mol Cancer 2021, 20, 136. [Google Scholar] [CrossRef]
- Marquard, F.E.; Jücker, M. PI3K/AKT/mTOR Signaling as a Molecular Target in Head and Neck Cancer. Biochem. Pharm. 2020, 172, 113729. [Google Scholar] [CrossRef]
- Miricescu, D.; Totan, A.; Stanescu-Spinu, I.I.; Badoiu, S.C.; Stefani, C.; Greabu, M. PI3K/AKT/mTOR signaling pathway in breast cancer: from molecular landscape to clinical aspects. Int. J. Mol. Sci. 2020, 22, 173. [Google Scholar] [CrossRef]
- Derwich, A.; Sykutera, M.; Bromińska, B.; Rubiś, B.; Ruchała, M.; Sawicka-Gutaj, N. The role of activation of PI3K/AKT/mTOR and RAF/MEK/ERK pathways in aggressive pituitary adenomas—new potential therapeutic approach—a systematic review. Int. J. Mol. Sci. 2023, 24, 10952. [Google Scholar] [CrossRef]
- Treppiedi, D.; Barbieri, A.M.; Di Muro, G.; Marra, G.; Mangili, F.; Catalano, R.; Esposito, E.; Ferrante, E.; Serban, A.L.; Locatelli, M.; et al. Genetic profiling of a cohort of italian patients with ACTH-secreting pituitary tumors and characterization of a novel Usp8 gene variant. Cancers 2021, 13, 4022. [Google Scholar]
- Sajjad, E.A.; Zieliński, G.; Maksymowicz, M.; Hutnik, L.; Bednarczuk, T.; Włodarski, P. mTOR is frequently active in GH-secreting pituitary adenomas without influencing their morphopathological features. Endocr. Pathol. 2013, 24, 11–19. [Google Scholar] [CrossRef] [PubMed]
- Jin, M.; Zhang, H.; Yang, J.; Zheng, Z.; Liu, K. Expression mode and prognostic value of FXYD family members in colon cancer. Aging 2021, 13, 18404–18422. [Google Scholar] [CrossRef]
- Yee, K.X.; Lee, Y.C.; Nguyen, H.D. Uncovering the role of FXYD3 as a potential oncogene and early biomarker in pancreatic cancer. Am J Cancer Res 2024, 14, 9, 4353. [Google Scholar] [CrossRef] [PubMed]
- Sbiera, S.; Perez-Rivas, L.G.; Taranets, L.; Weigand, I.; Flitsch, J.; Graf, E.; Monoranu, C.M.; Saeger, W.; Hagel, C.; Honegger, J.; Assie, G.; Hermus, A.R.; Stalla, G.K.; et al. Driver mutations in USP8 wild-type Cushing’s disease. Neuro Oncology 2019, 21, 10, 1273–1283. [Google Scholar] [CrossRef] [PubMed]
- Wang, W.; Ma, L.; Zhao, Y.; Liu, M.; Ye, W.; Li, X. Research progress on the role of the Wnt signaling pathway in pituitary adenoma. Front. Endocrinol. 2023, 14, 1216817. [Google Scholar] [CrossRef]
- Zhu, D.; Wang, Z.; Tian, T.; Wu, X.; He, D.; Zhu, Y.; Liu, D.; Wang, H. Prevalence and clinical characteristics of Crooke’s cell adenomas in 101 patients with T-PIT-positive pituitary adenomas: case series and literature review. Front Endocrinol 2022, 13, 947085. [Google Scholar] [CrossRef]
- Garbicz, F.; Mehlich, D.; Rak, B. Increased expression of the microRNA 106b~25 cluster and its host gene MCM7 in corticotroph pituitary adenomas is associated with tumor invasion and Crooke’s cell morphology. Pituitary 2017, 20, 450–463. [Google Scholar] [CrossRef]
- Rinn, J.L.; Chang, H.Y. Genome Regulation by Long Noncoding RNAs. Annu Rev Biochem 2012, 81, 145–166. [Google Scholar] [CrossRef]
- Adelman, K.; Egan, E. Non-Coding RNA: More Uses for Genomic Junk. Nature 2017, 543, 183–185. [Google Scholar] [CrossRef]
- Butz, H. Circulating Noncoding RNAs in Pituitary Neuroendocrine Tumors-Two Sides of the Same Coin. Int J Mol Sci 2022, 23, 5122. [Google Scholar] [CrossRef]
Figure 1.
Distribution of the studied samples by groups.

Figure 2.
Identification of RNA biomarkers among corticotroph tumors without imaging on MRI/ or less than 6 mm (group 1a) and positive tumor imaging on MRI/ or more than 6 mm (group 1b). (a) Distribution of tissue samples (P-patient) among 1a and 1b subgroups. (b) Top differentially expressed (DE) genes among samples from the indicated subgroups. Background gene expression marked in gray. (c) Gene set enrichment analysis. (d) Heat map of the DE gene expression profiles.
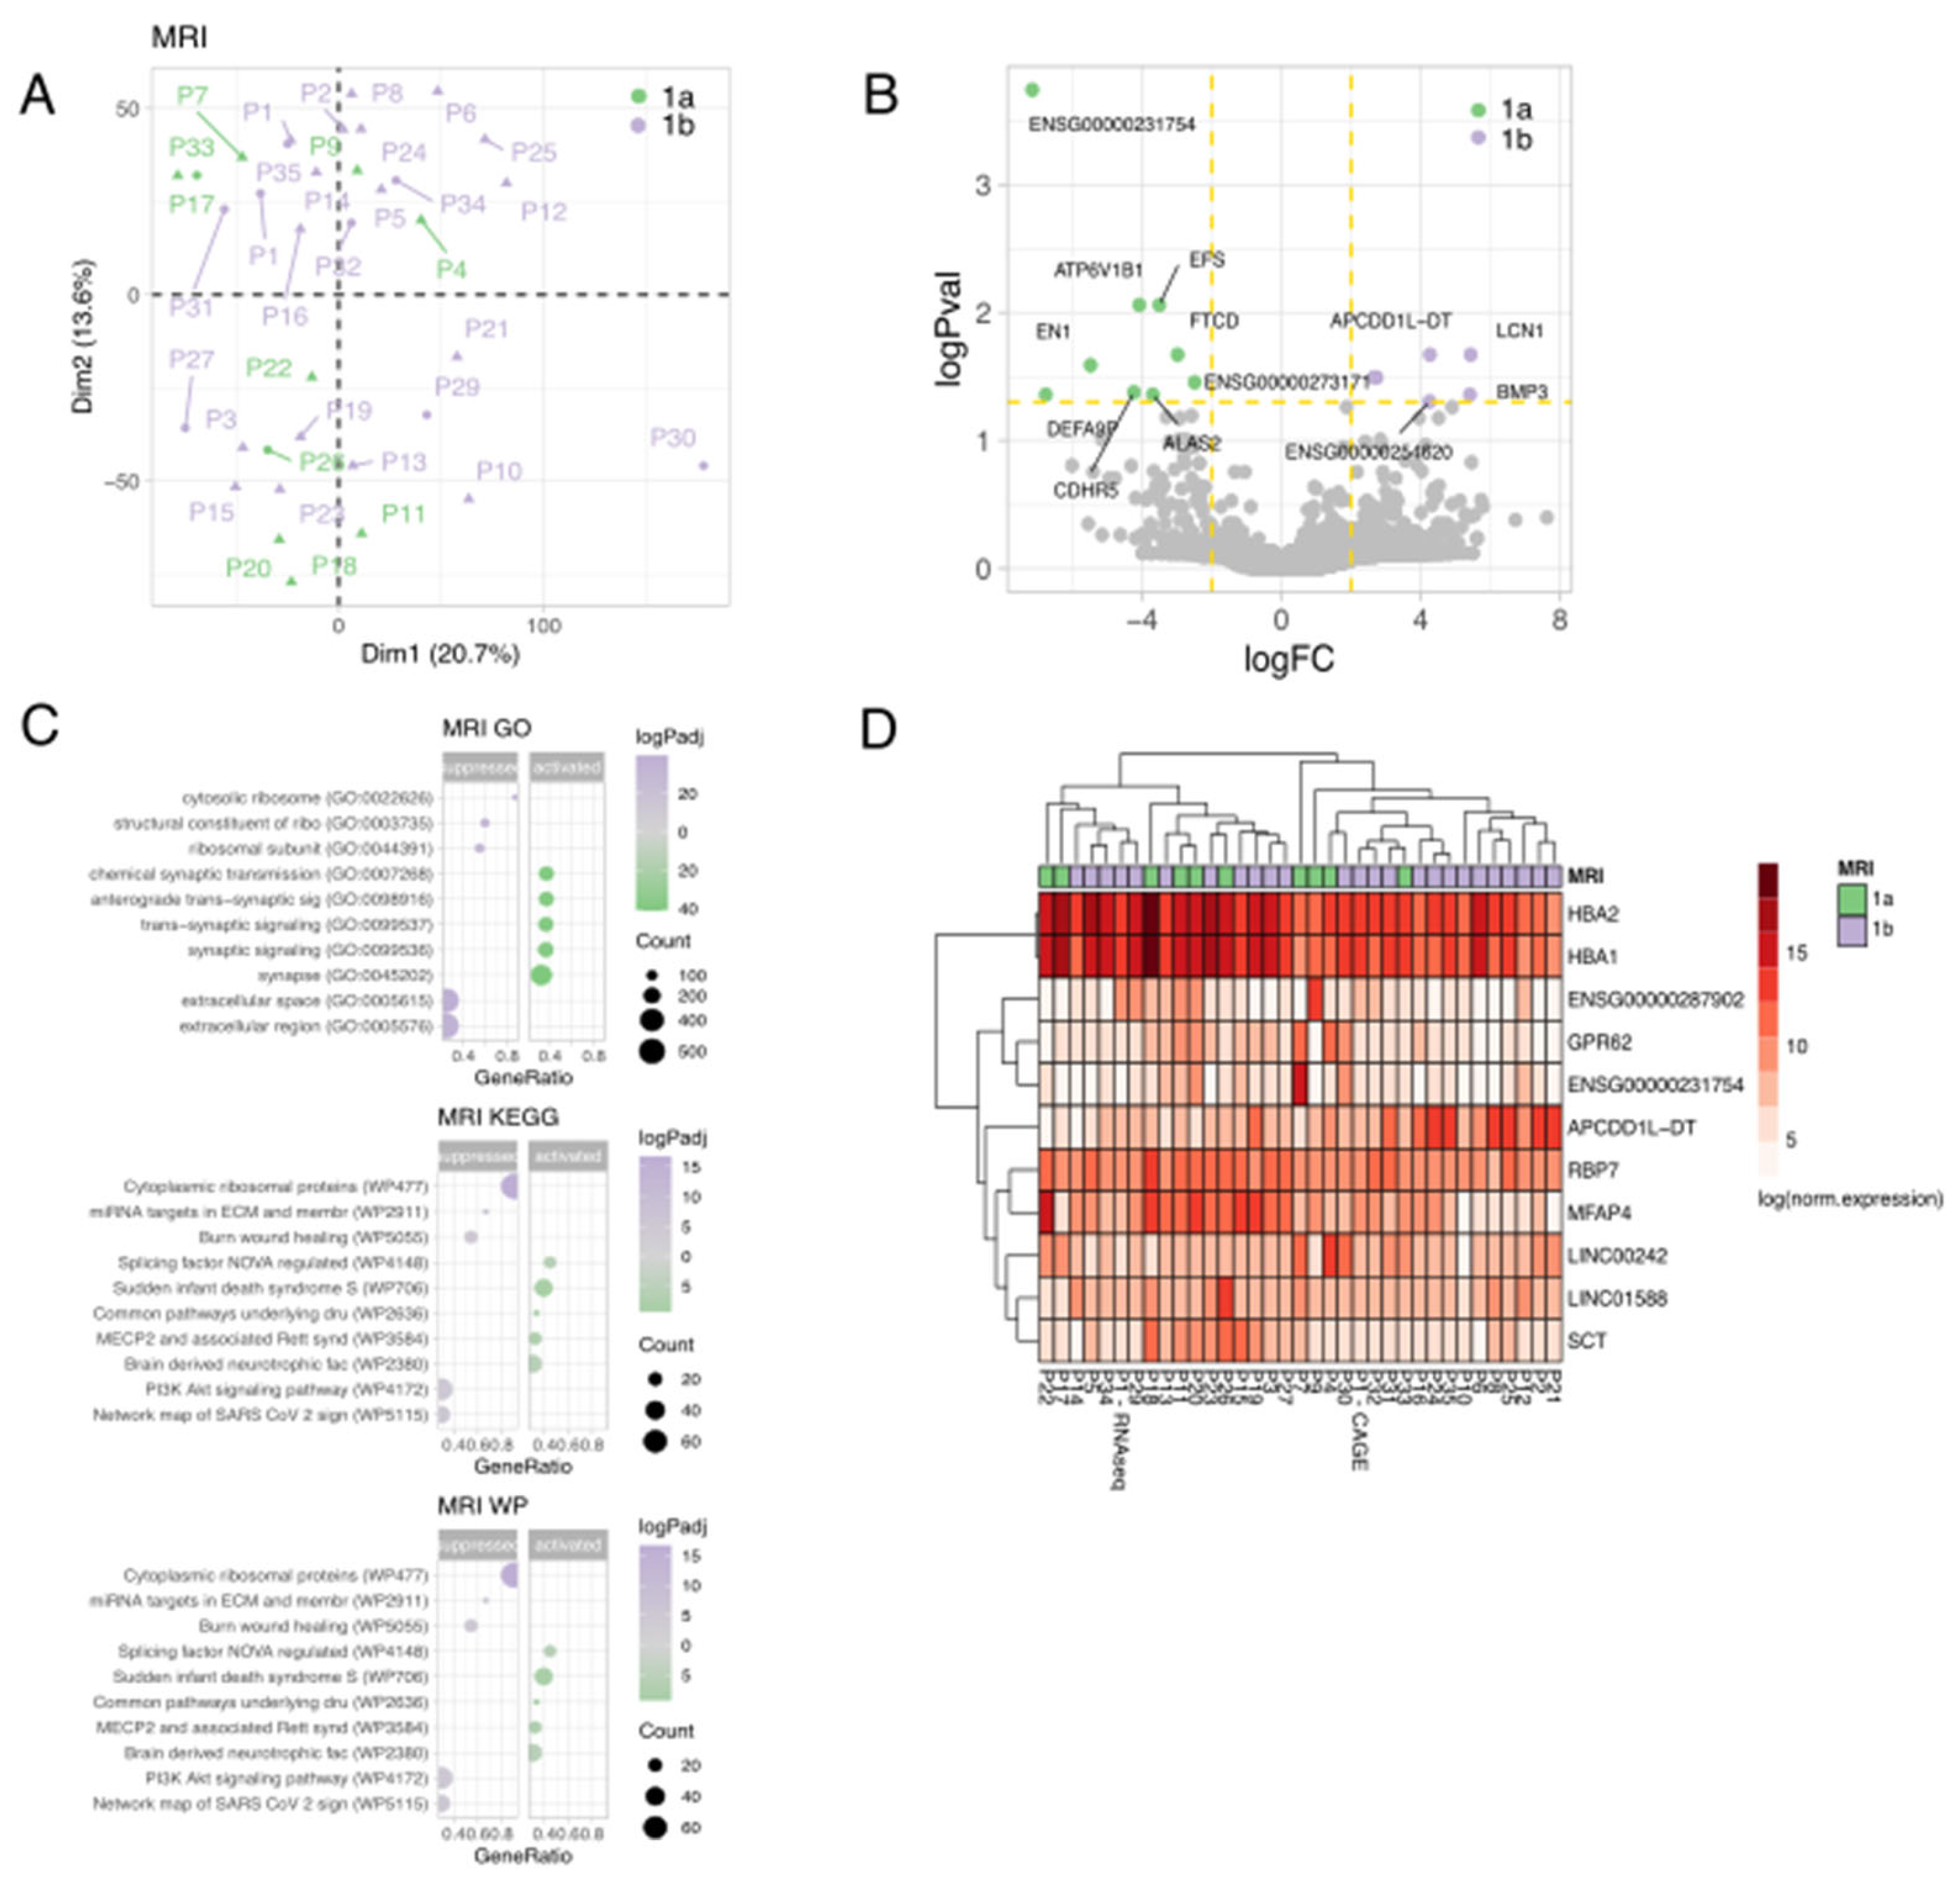
Figure 3.
Identification of RNA biomarkers among corticotroph tumors samples depending on the tumor volume according to MRI. (a) Distribution of tissue samples (P-patient) depending on the volume (pink color is smaller volume, purple is bigger volume). (b) Top differentially expressed (DE) genes among samples from the indicated subgroups. (c) Gene set enrichment analysis. (d) Heat map of the DE gene expression profiles.
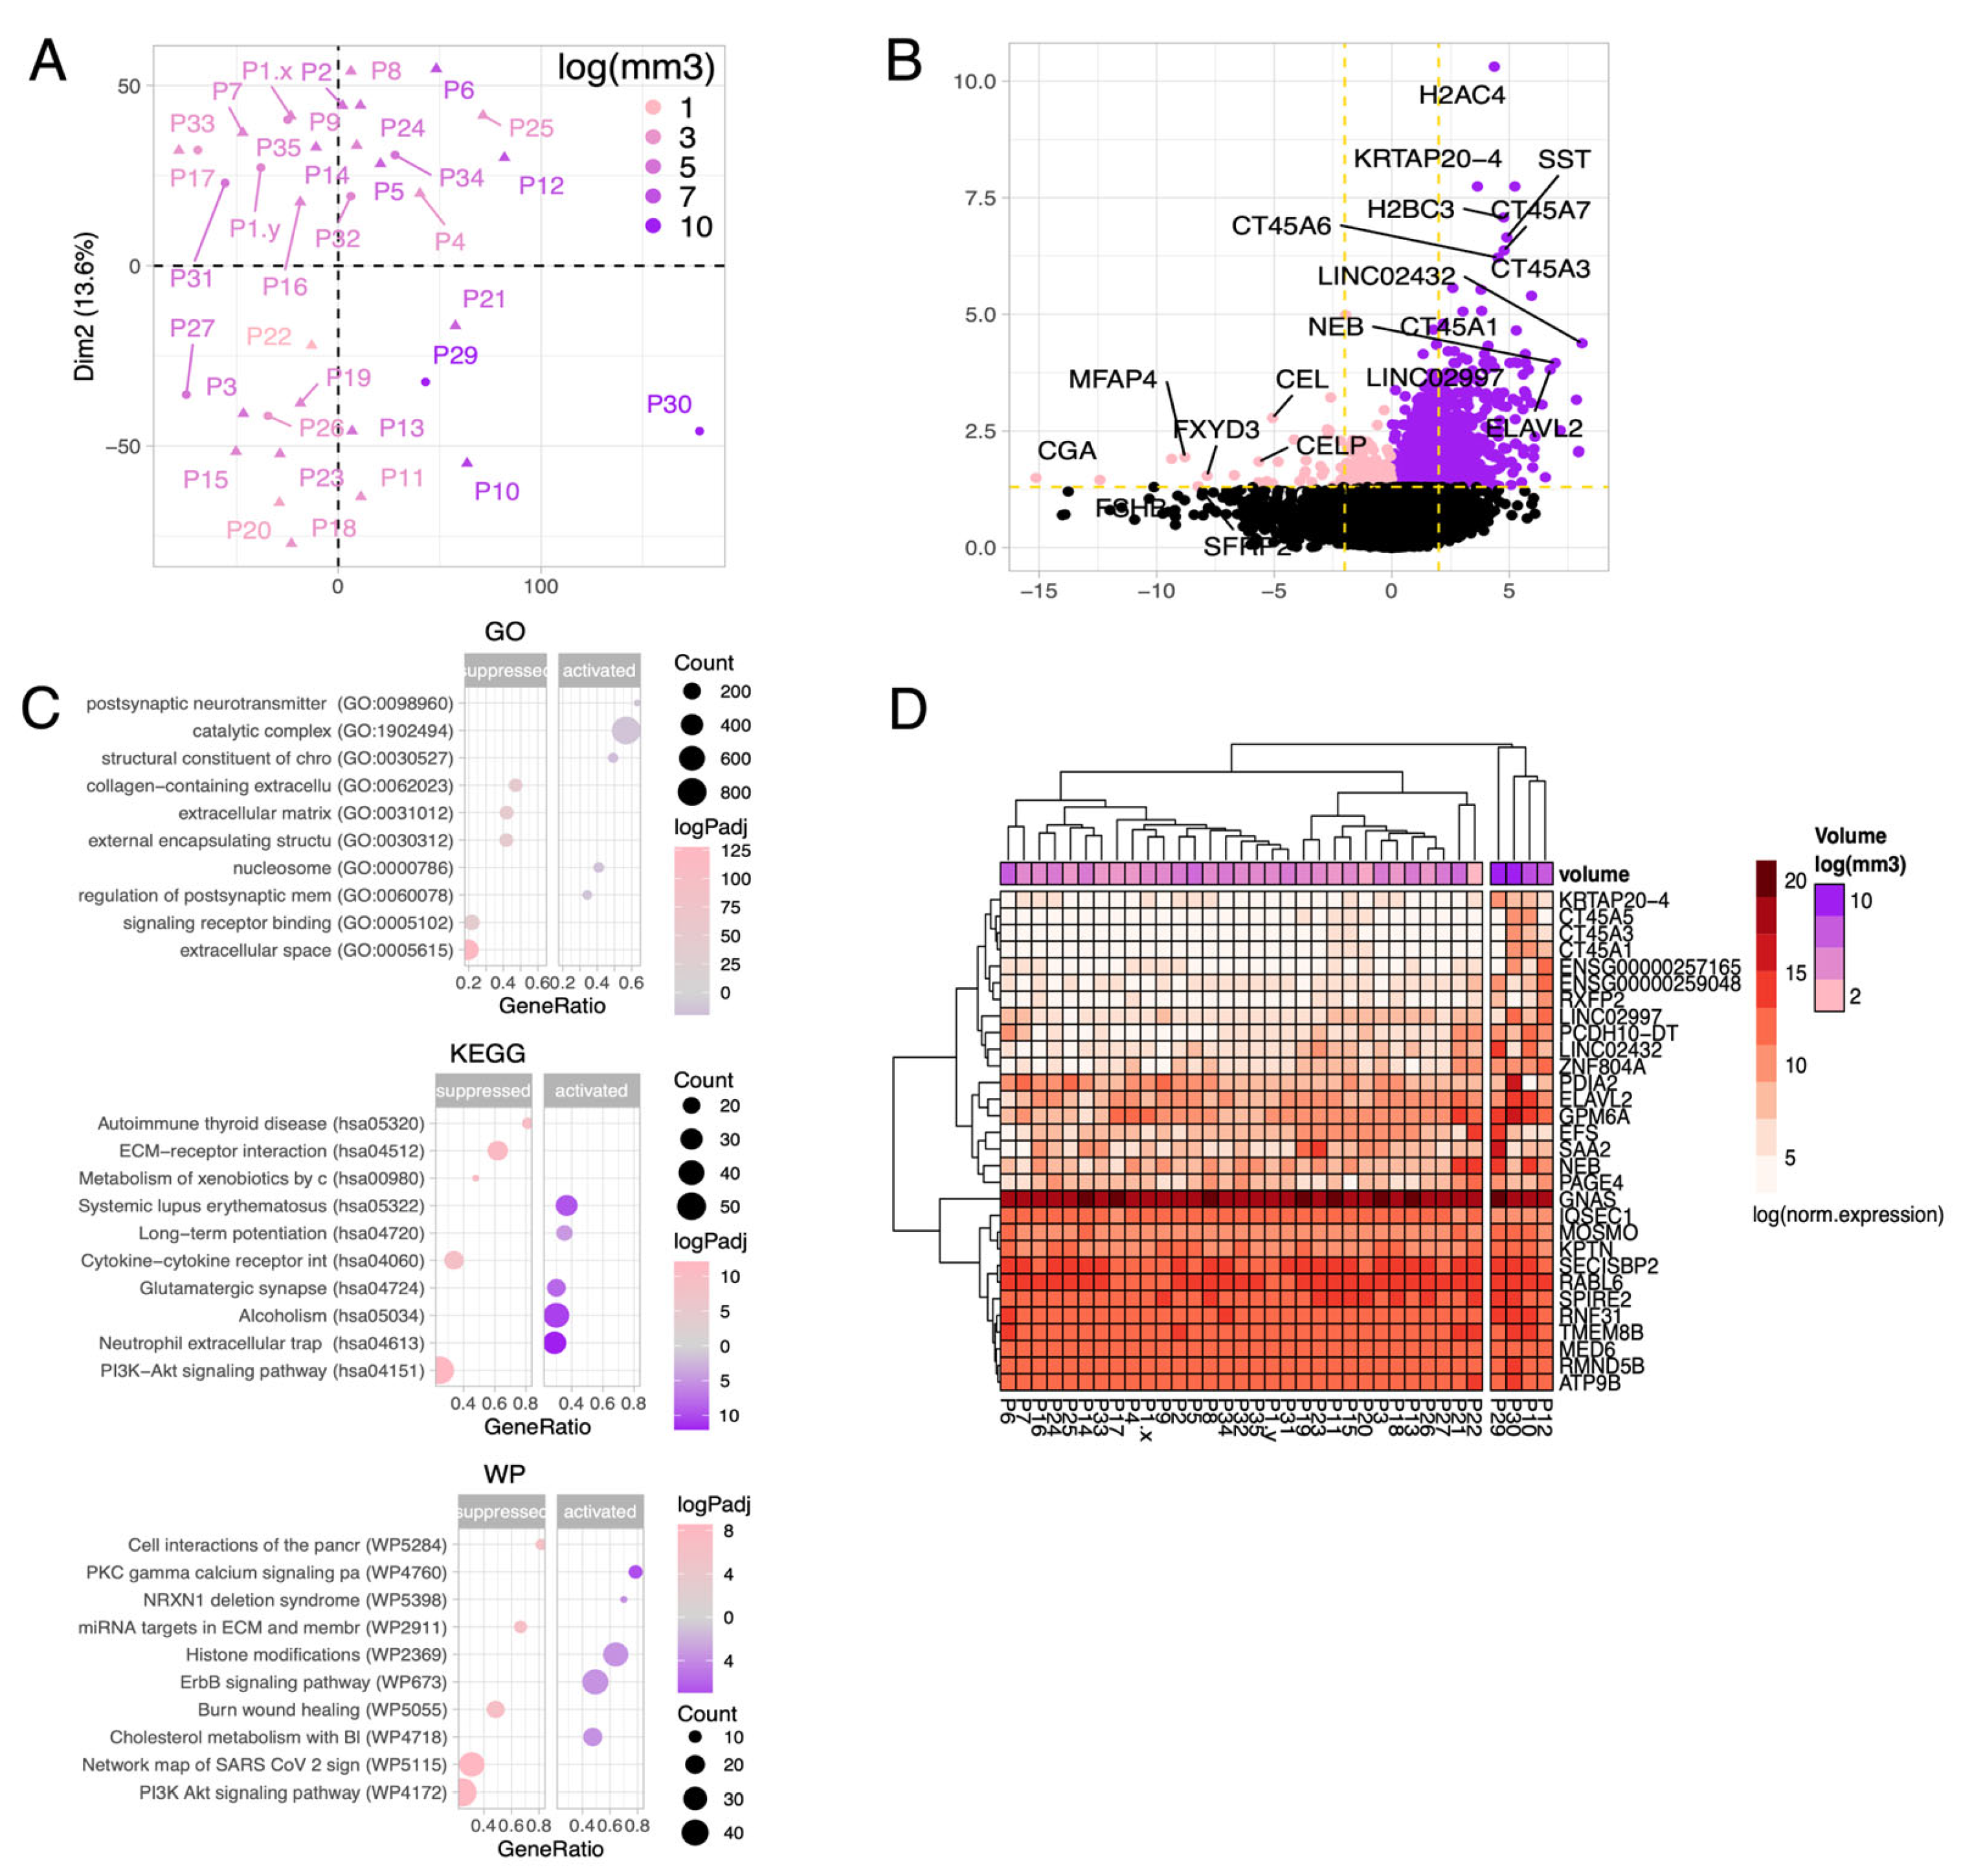
Figure 4.
Identification of RNA biomarkers among corticotropin samples depending on tumor volume. (a) Best examples of genes with a significant correlation of gene expression and tumor volume. Purple color shows a positive correlation, pink color - a negative correlation. (b) Dependence of tumor volume and expression of the main genes.
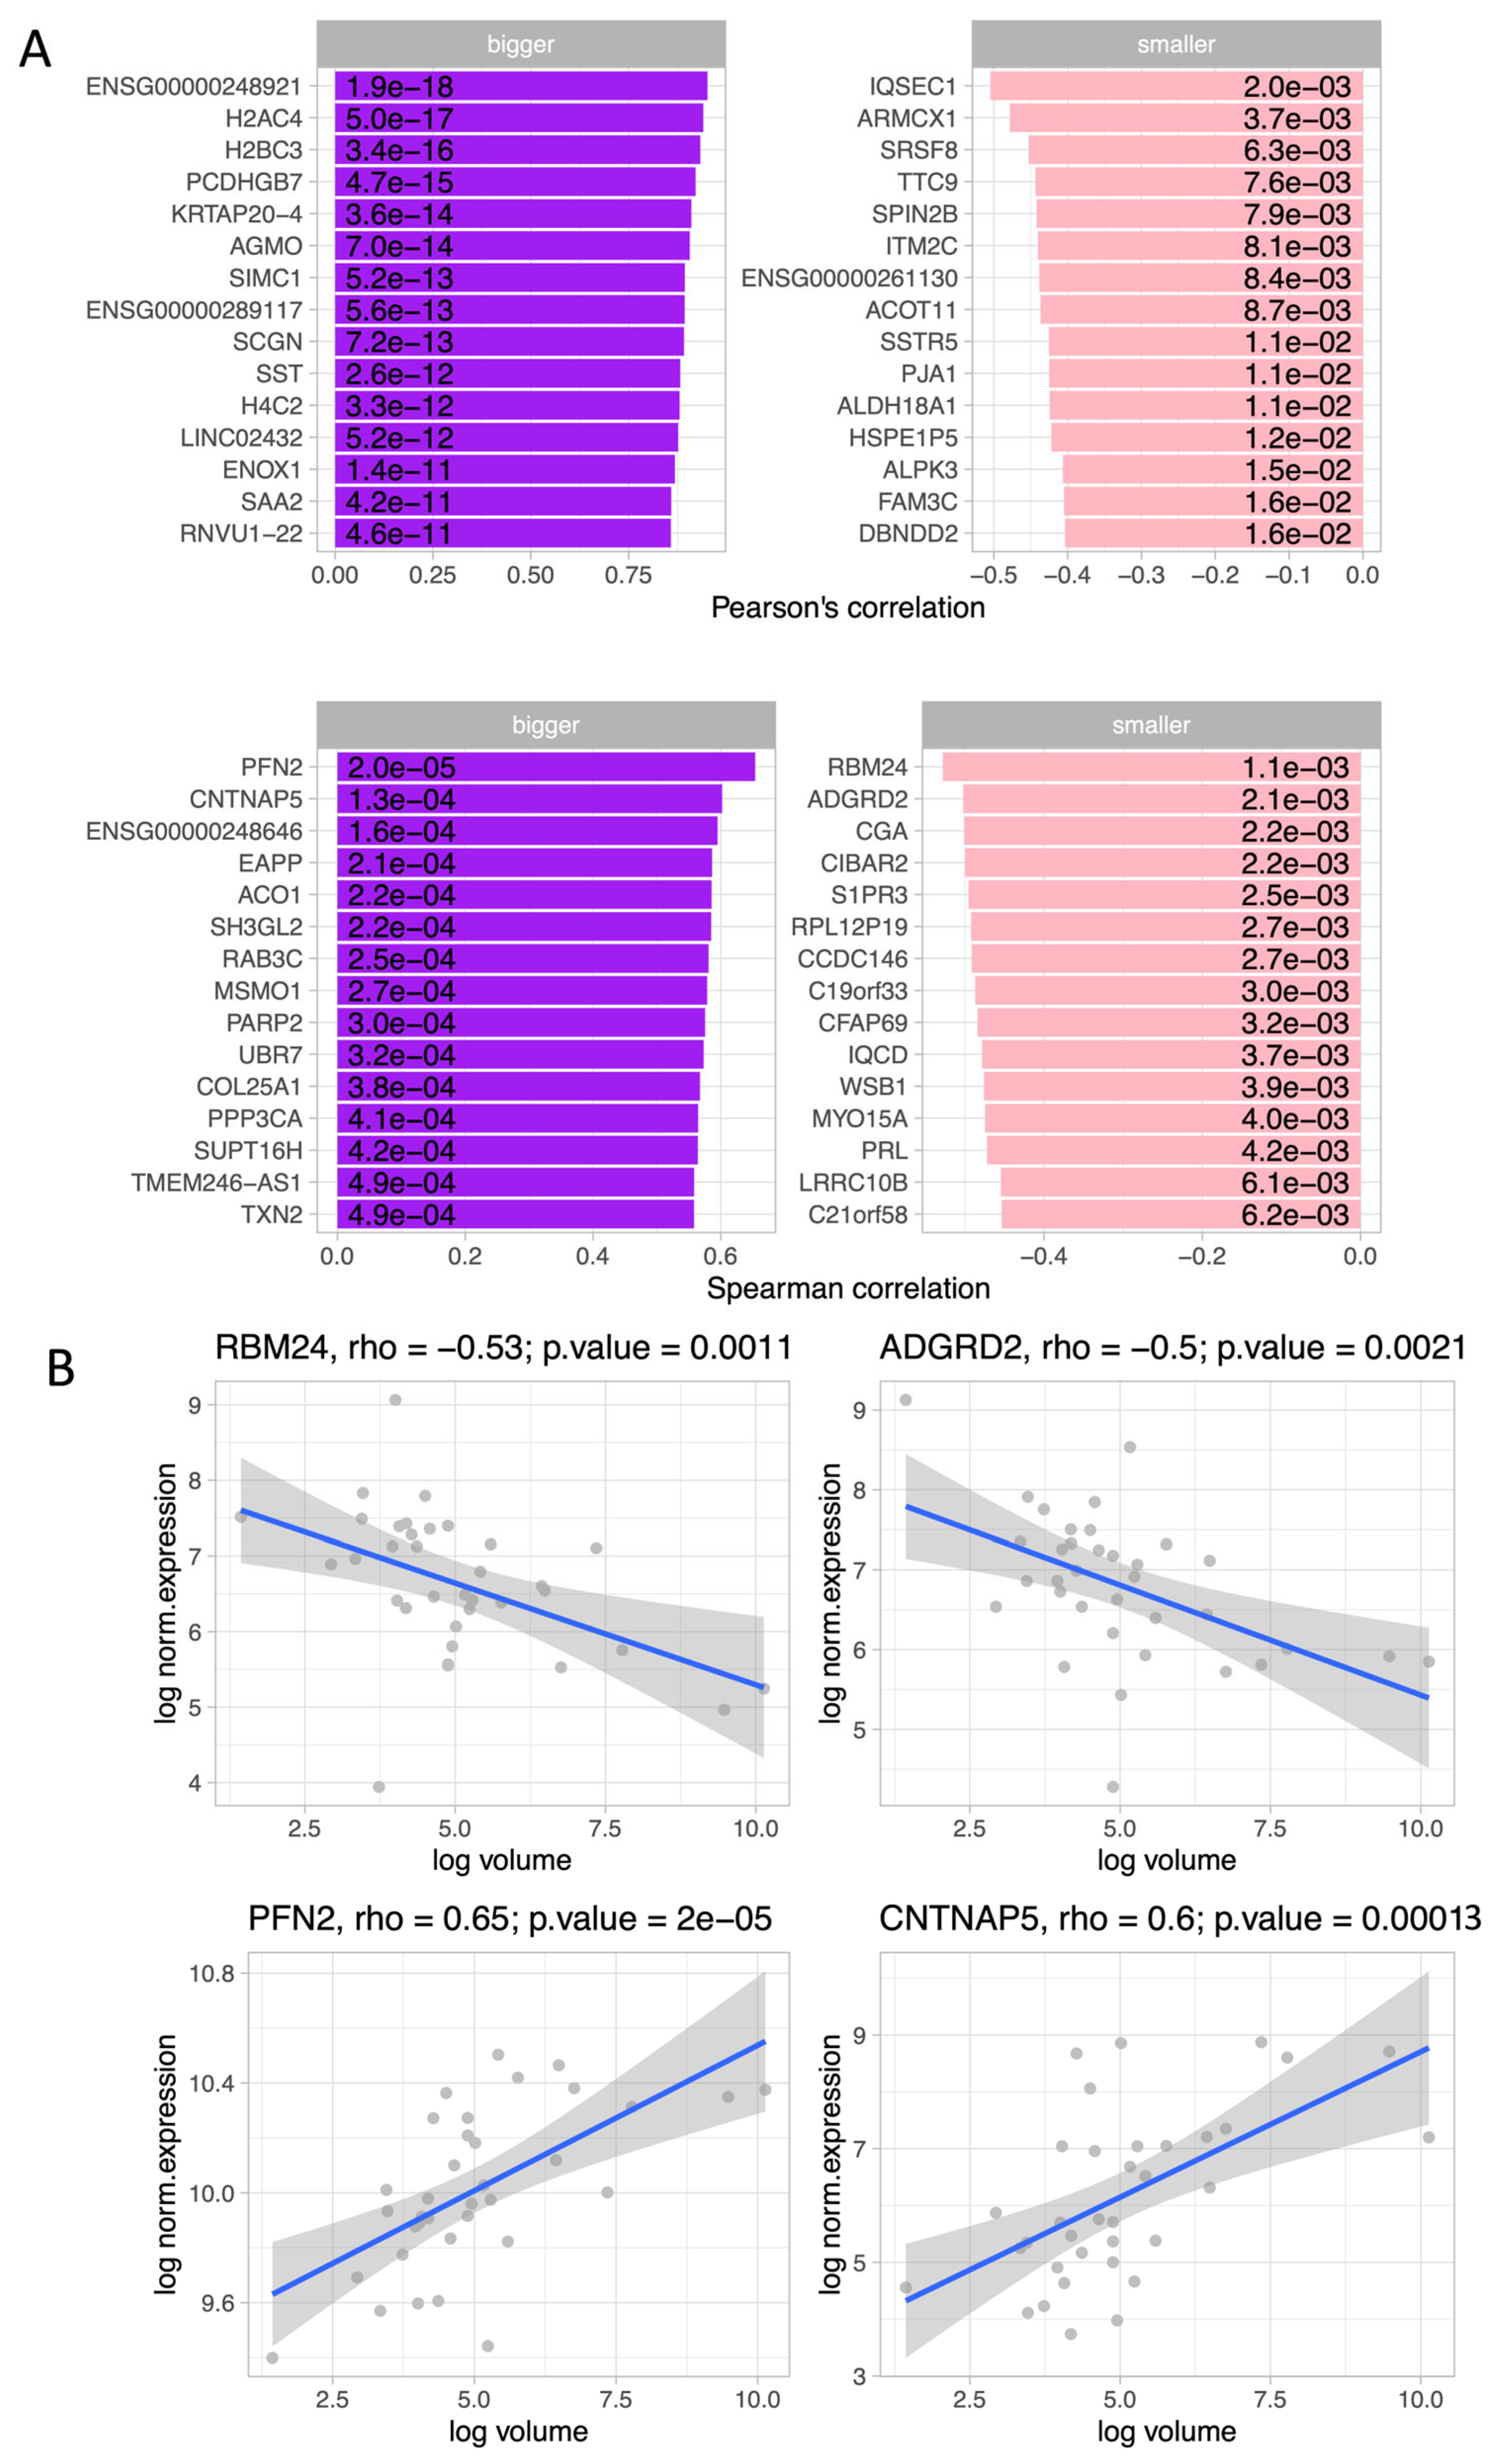
Figure 5.
Identification of RNA biomarkers among corticotropinomas samples with high (group 3a) and low proliferative activity (group 3b). (a) Distribution of tissue samples (P-patient) among 3a and 3b subgroups. (b) Top differentially expressed (DE) genes among samples from the indicated subgroups. Background gene expression marked in black. (c) Gene set enrichment analysis. (d) Heat map of the DE gene expression profiles.
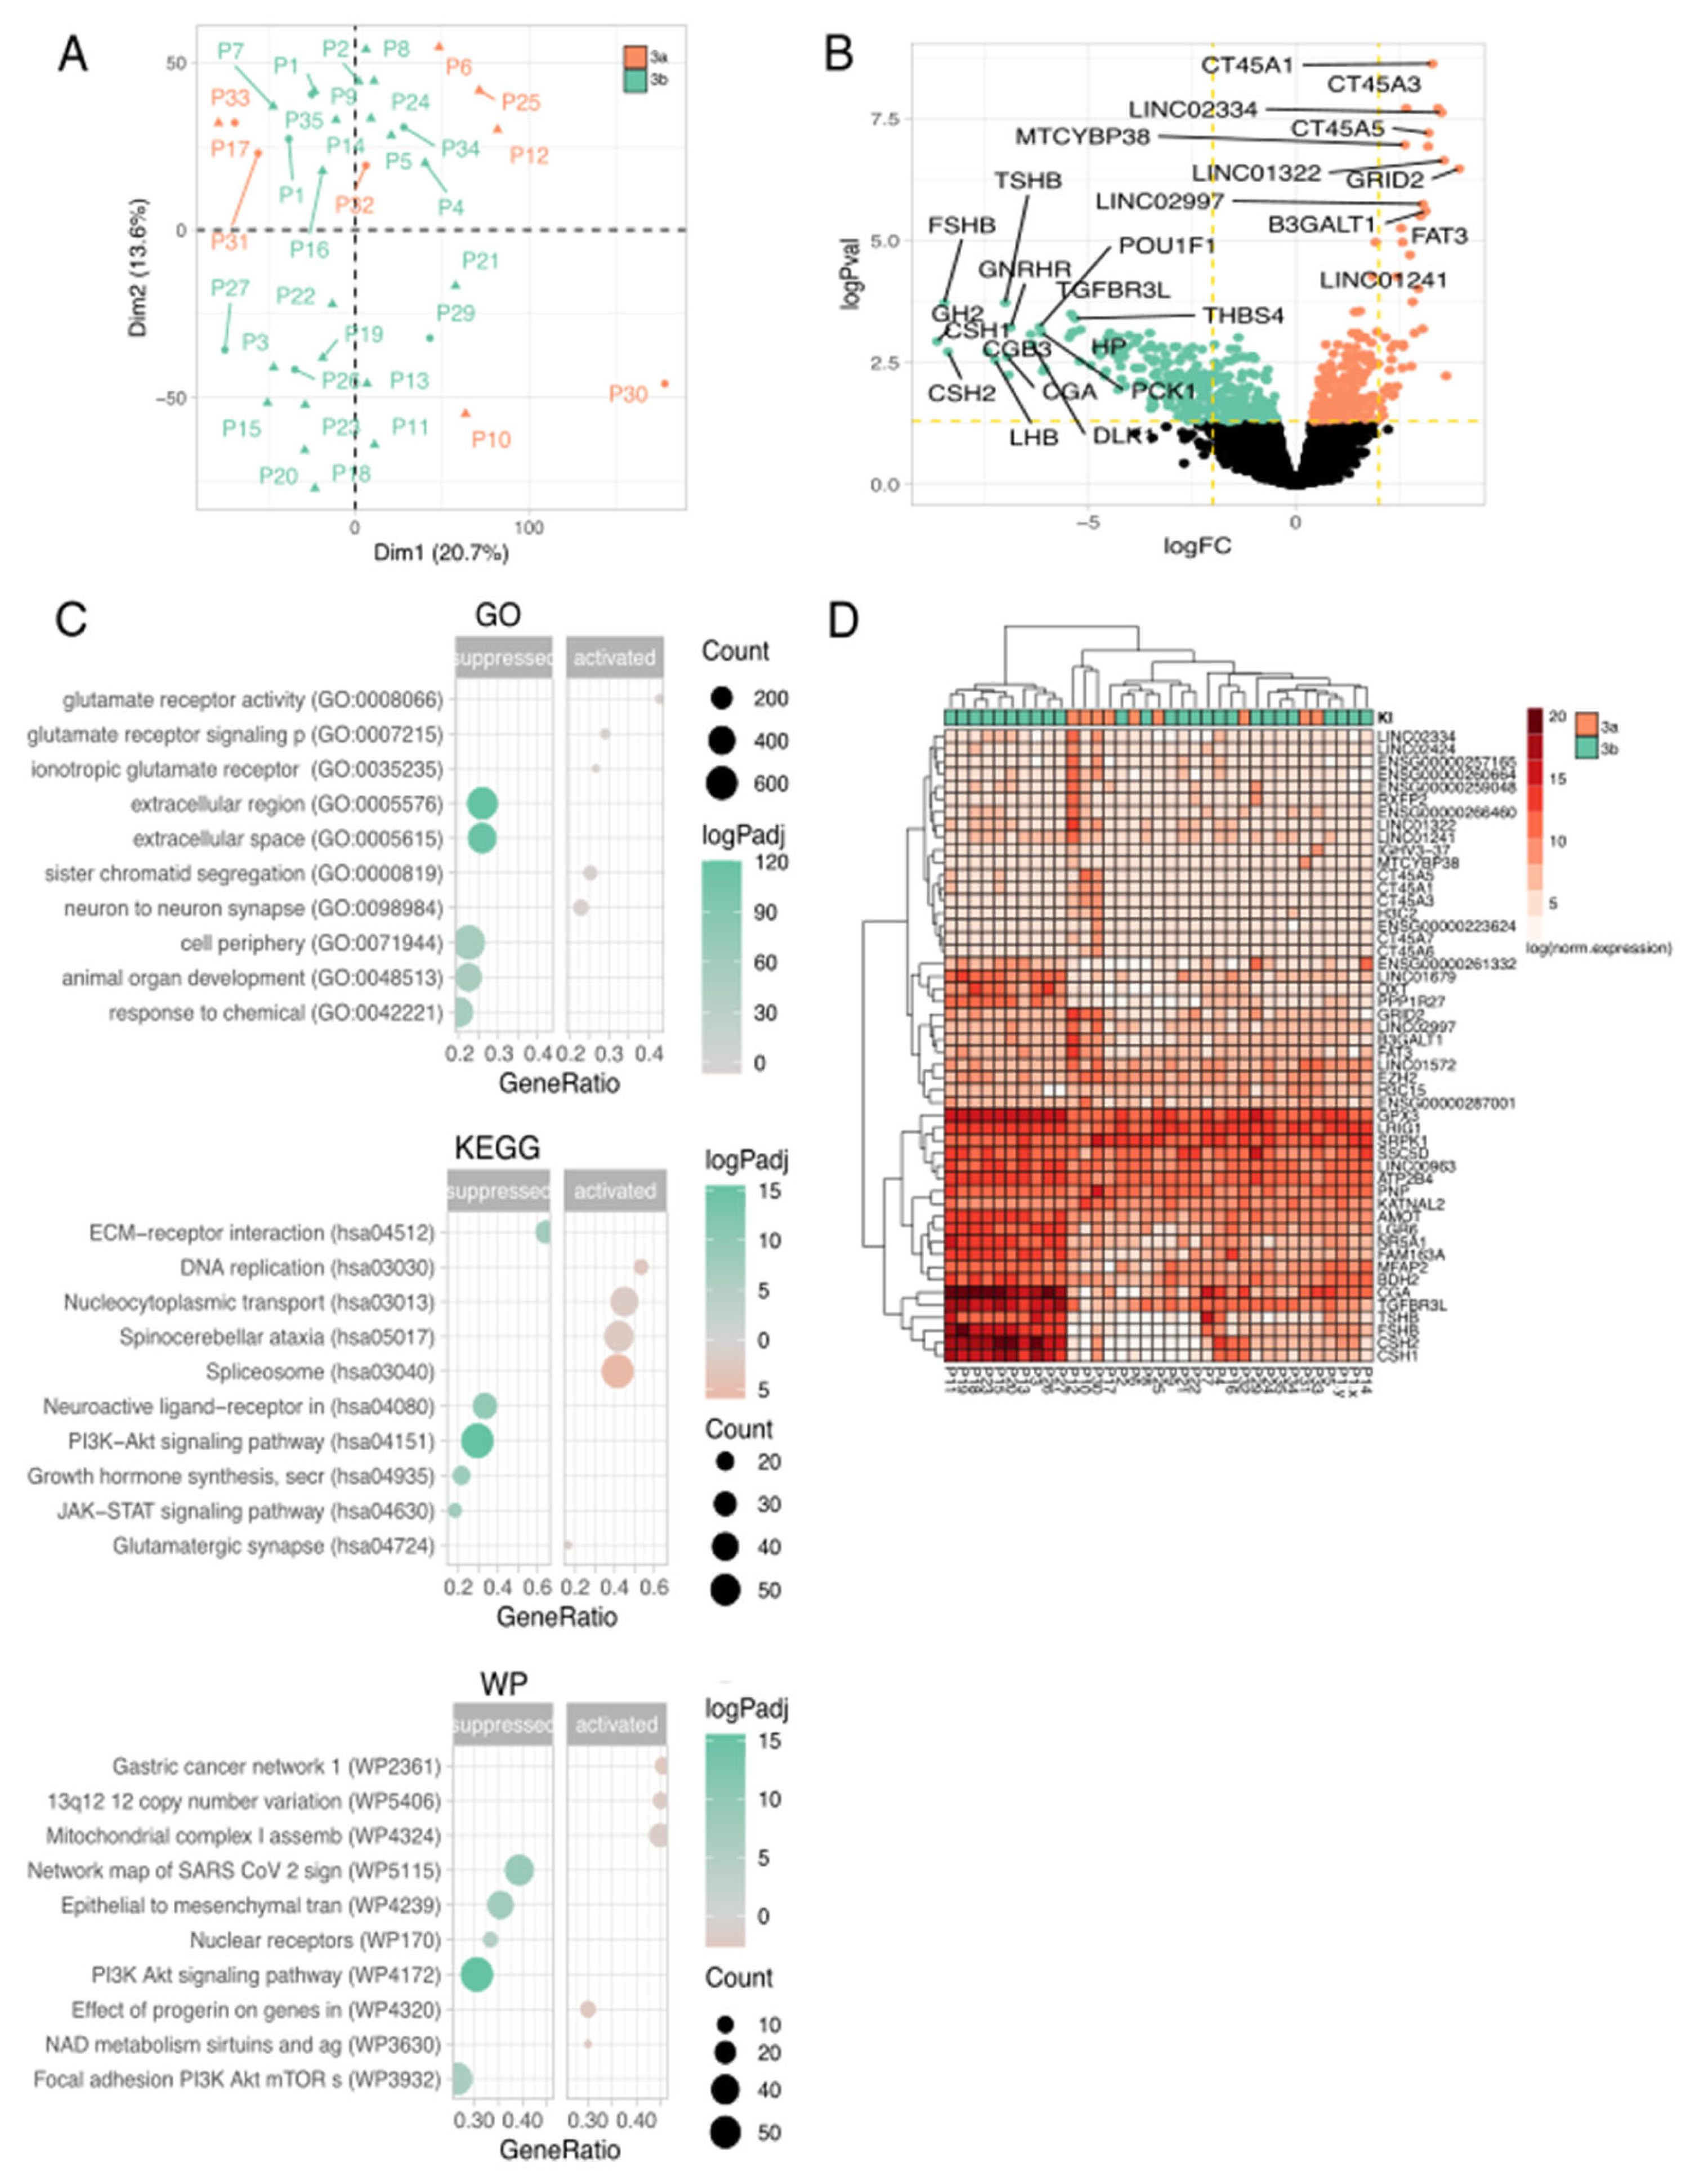
Figure 6.
Identification of RNA biomarkers among corticotropinomas samples with indolent (group 4a) and aggressive (group 4b) biological behavior. (a) Distribution of tissue samples (P-patient) among 4a and 4b subgroups. (b) Top differentially expressed (DE) genes among samples from the indicated subgroups. Background gene expression marked in black. (c) Gene set enrichment analysis. (d) Heat map of the DE gene expression profiles.
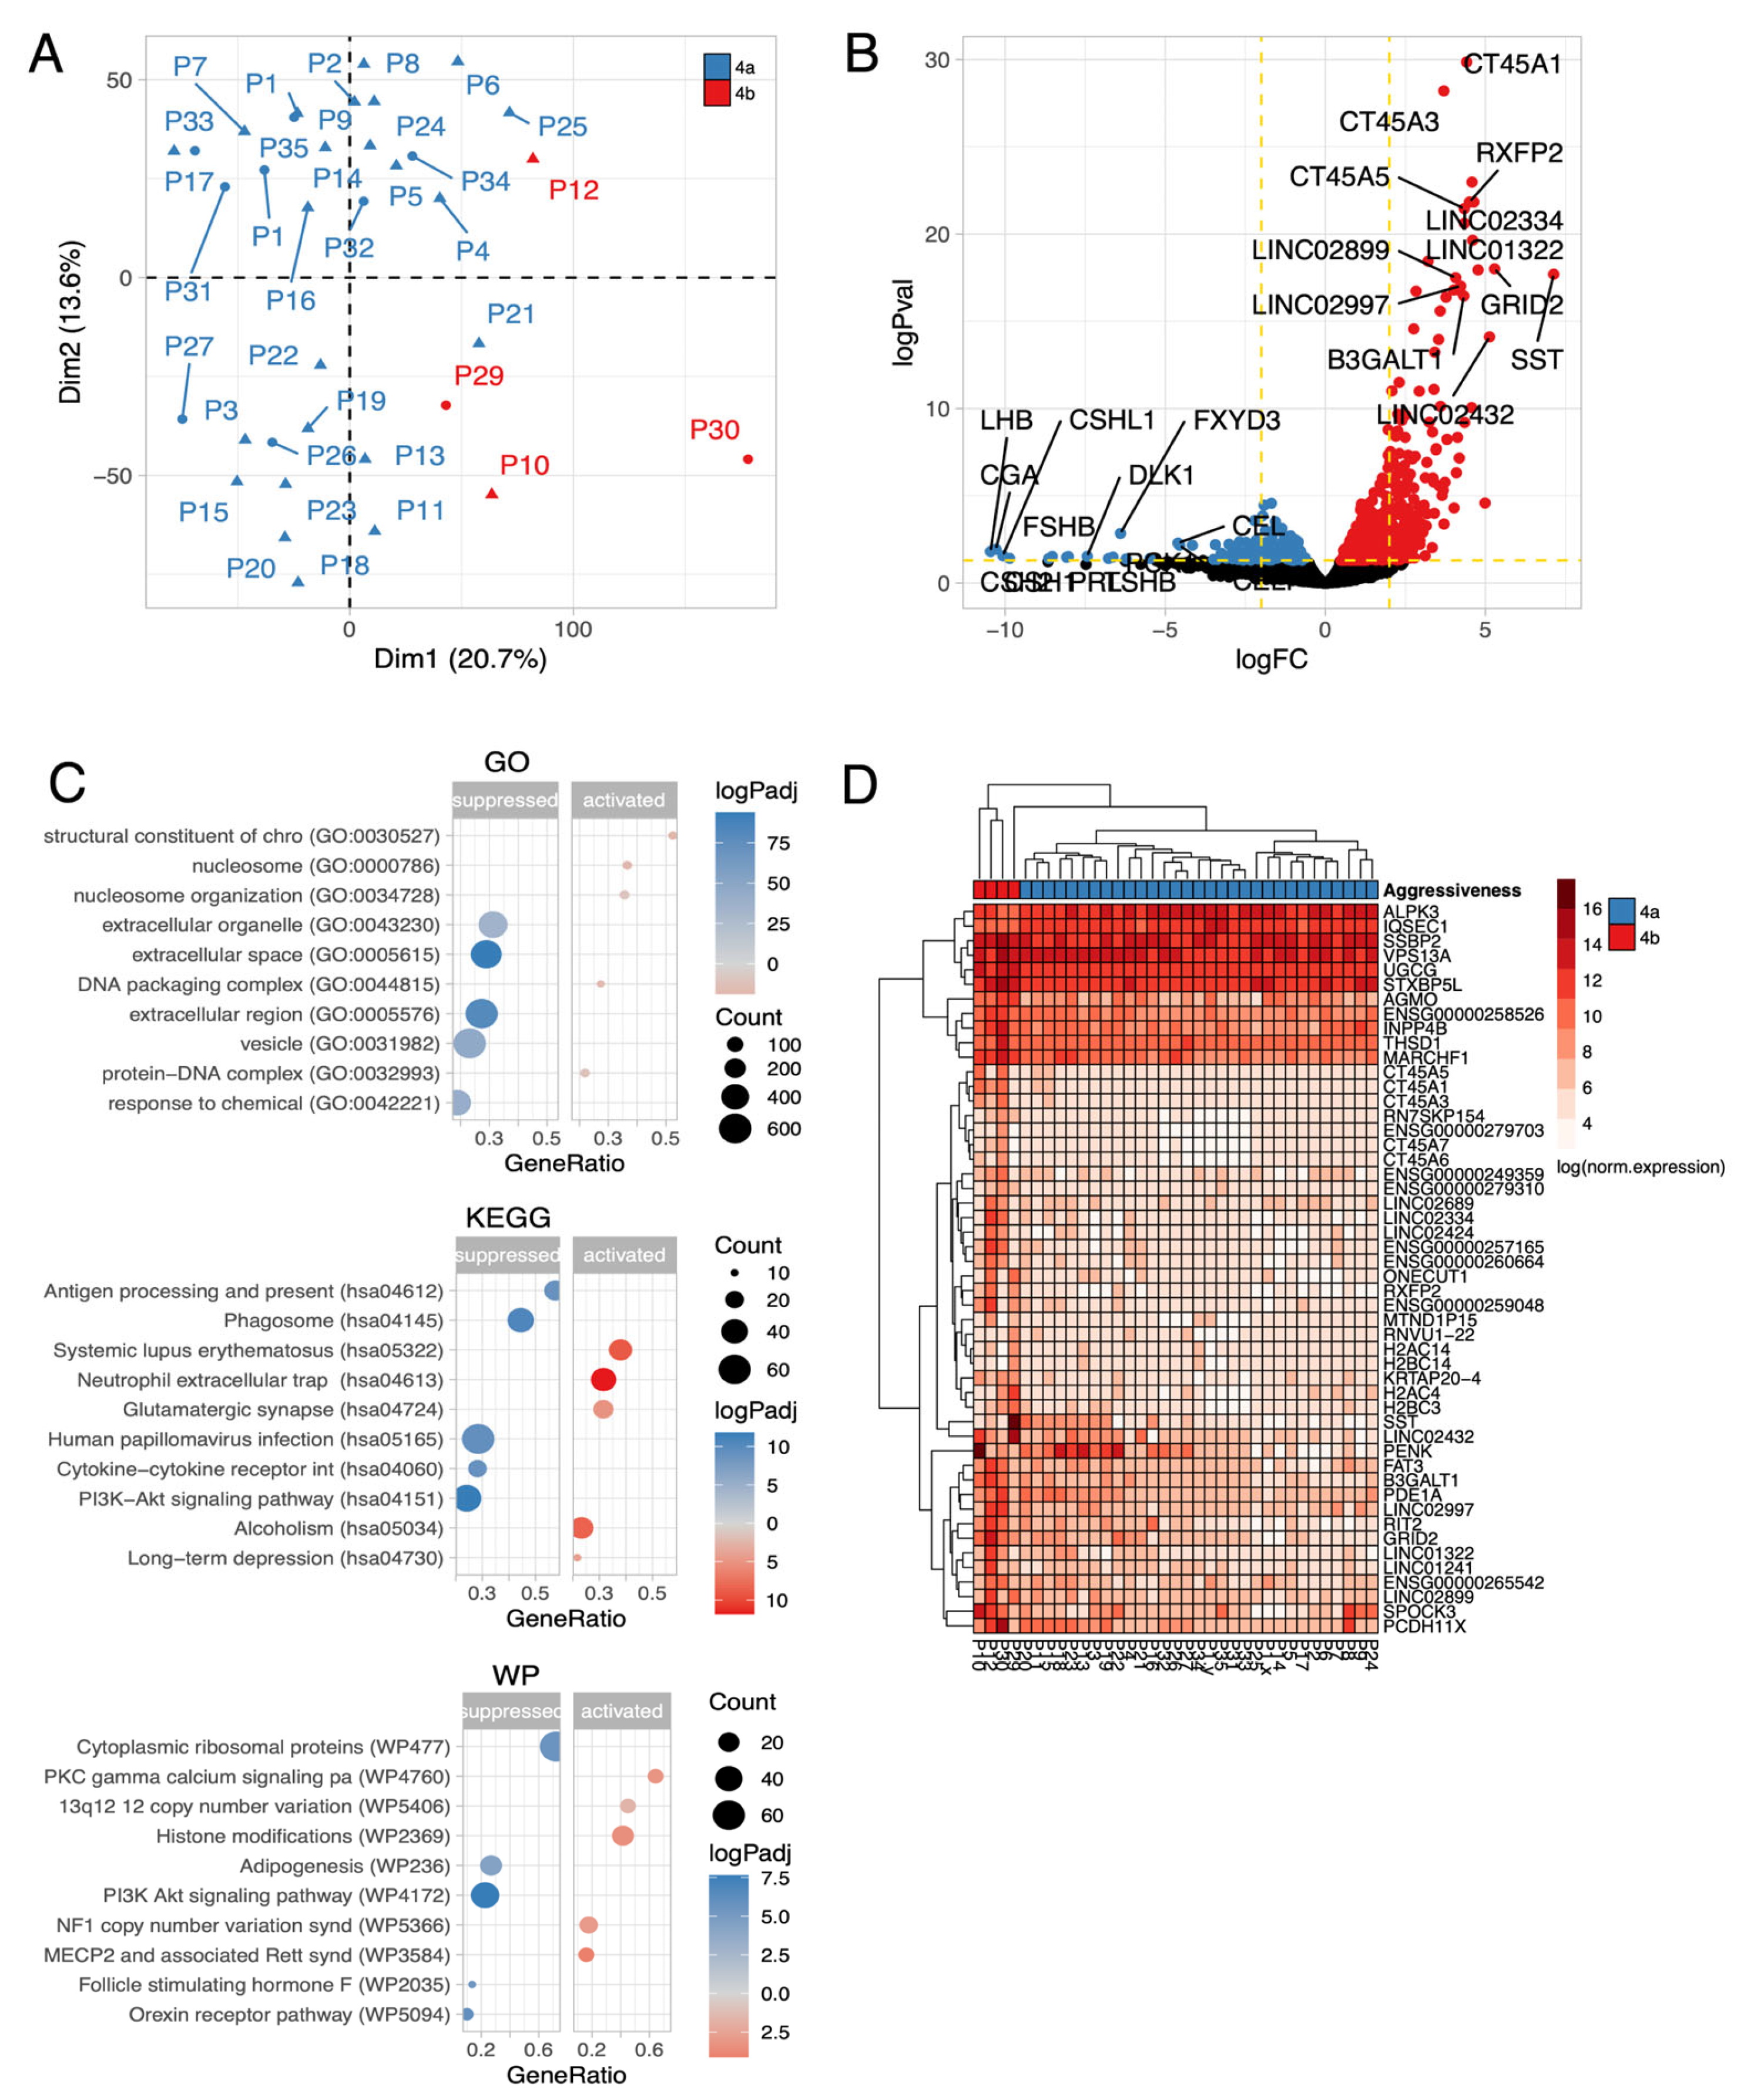
Figure 7.
Gene/oncogene expression profiles in subgroups of corticotroph PitNETs.
Disclaimer/Publisher’s Note: The statements, opinions and data contained in all publications are solely those of the individual author(s) and contributor(s) and not of MDPI and/or the editor(s). MDPI and/or the editor(s) disclaim responsibility for any injury to people or property resulting from any ideas, methods, instructions or products referred to in the content. |
© 2025 by the authors. Licensee MDPI, Basel, Switzerland. This article is an open access article distributed under the terms and conditions of the Creative Commons Attribution (CC BY) license (http://creativecommons.org/licenses/by/4.0/).
Copyright: This open access article is published under a Creative Commons CC BY 4.0 license, which permit the free download, distribution, and reuse, provided that the author and preprint are cited in any reuse.


