
Submitted:
17 June 2025
Posted:
19 June 2025
You are already at the latest version
Abstract
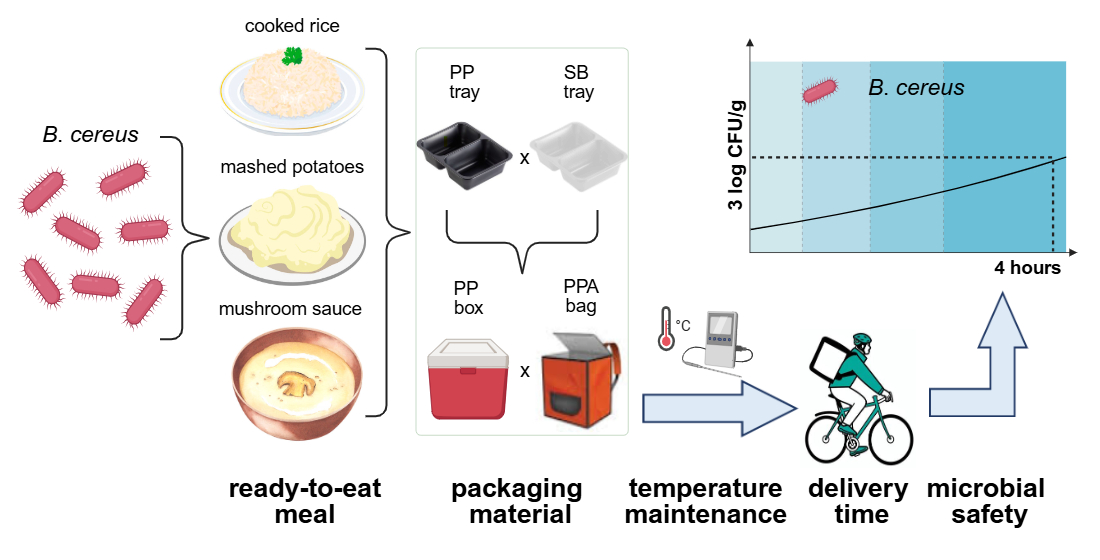
With increasing popularity of food delivery services, the microbial safety of transported meals should be ensured. An effect of the type of a meal (cooked rice; mashed potatoes; mushroom sauce), inner primary packaging (sugarcane bagasse [SB] tray; polypropylene [PP] tray), secondary container (polyester/polyethylene foam/aluminum foil [PPA] bag; PP box) on the time interval of the internal hot ready-to-eat (RTE) meal temperature decrease to the value critical for Bacillus cereus growth (40 °C) was tested during a simulated delivery; in aliquot samples of the same meals, B. cereus growth was quantified presuming a natural contamination of the meals. Type of a meal had no effect on the tested time interval (p > 0.05). Packaging a meal in the PP tray as compared to the SB tray and inserting primary trays into the PP box instead of PPA bag delayed (p < 0.05) the internal meal temperature decrease by 50 and 15 minutes, respectively. Average B. cereus counts in the naturally contaminated meals after the four-hour culturing at 40 °C was 2.99 log CFU/g. It was concluded that a hot RTE meal delivered up to four hours under the tested conditions is not likely to facilitate B. cereus growth above unacceptable levels.
Keywords:
food safety
; pathogenic bacteria
; cooked rice
; sugarcane bagasse
; polypropylene
1. Introduction
In recent years, popularity of food delivery services has grown significantly. Online food delivery platforms (Uber Eats, USA; Foodora, European Union; Meituan, China) have adopted market strategies to maximally reduce customer waiting times by informing restaurants about the food order and sending couriers to pick up the food from the restaurants and deliver it to the customers [1]. The delivery time is mostly not precisely specified, but the food should reach the consumer as soon as possible [2].
This draws increasing attention not only to the quality of the meals themselves but also to the conditions under which they are transported. One of the key factors influencing customer satisfaction is the temperature of the food upon delivery. This is not only a matter of sensory quality but also of microbiological safety [3]. While delivery speed plays an important role, the thermal performance of the packaging material is equally critical. Different types of packaging – ranging from plastic and aluminum to paper-based and biodegradable alternatives – exhibit varying insulation properties that can significantly affect the retention of food temperature [4,5,6].
Maintaining hot food at temperatures above 60 °C is essential to prevent it from entering the so-called “danger zone” (4 °C to 60 °C), where microbial growth occurs most rapidly [3]. Therefore, the ability of packaging to preserve thermal conditions for as long as possible is of paramount importance. Selecting appropriate packaging thus involves a trade-off between thermal efficiency, environmental impact, and chemical safety. For instance, certain plastic containers may leach endocrine-disrupting compounds such as bisphenol A (BPA) or phthalates when exposed to heat [4], while more sustainable materials often lack sufficient insulation, leading to faster cooling and potential quality degradation [7].
The present study focuses on analyzing the impact of packaging materials on the thermal stability of the hot ready-to-eat (RTE) meals during a prolonged (up to 4 hours) delivery and evaluates how packaging choices can influence a microbial safety during transport. Counts of Bacillus cereus in the meal were chosen as a safety marker.
B. cereus sensu lato is a Gramm-positive, facultative anaerobic, motile, spore-forming, rod-shaped bacteria [8]; it is an opportunistic human pathogen causing gastrointestinal illnesses due to the ability of producing emetic (cereulide) and/or diarrheal toxins [9]. Emetic and diarrheal strains are able to grow at the pH range of 4.5 – 9.5, temperature range of 4 – 48 °C, minimal water activity of 0.93 and NaCl concentration up to 7 %. Under the unfavourable conditions, B. cereus forms the heat resistant endospores [8]. As far as the toxins are concerned, diarrheal enterotoxins are heat-labile (inactivated by heating at 55 °C for 5 minutes), but cereulide, pre-formed in a food, remains stable at 121 °C for 2 hours and can persist during food processing, including roasting and frying [10].
B. cereus infective dose, meaning a minimal concentration inducing a cereulide production is ambiguous, but the most frequently reported value is > 105 CFU · g-1 of food [11]. Guidelines regarding B. cereus counts usually mention levels < 103 CFU · g-1 as satisfactory, 103 – 105 CFU · g-1 as acceptable and > 105 CFU · g-1 as unsafe [12]. For a comparison, Juneja et al. [13] reported B. cereus counts in cooked rice stored 24 hours at 45 °C to reach values of 106 – 108 CFU · g-1.
Due to the ability to form spores, it is practically impossible to prevent B. cereus contamination of foods [14]. B. cereus is ubiquitous and widespread in soil and water and consequently in roots and tubers of starch-rich plants; after the harvest, the spores are entering a food-processing equipment. Foods can be contaminated also via dust or insects [15]. However, according to Messelhäuser et al. [16], although B. cereus is widespread in an environment, the nature niches and the ways of entry into the food production and processing are largely unknown.
B. cereus is considered second most common etiologic agent of foodborne outbreaks in France and the third in the European Union [17]. Cereal products, rice, seeds dairy products, poultry, vegetables, herbs, spices and seafood are usually listed as the risky products [15], including RTE foods [18], soups and sauces [9]. Rice is mentioned as the most frequently contaminated food [19]. Fifty-eight % to 81 % of rice samples in farms in Korea and 53 % of rice samples sold in retail stores in the USA were contaminated by endospores of B. cereus, respectively [17].
The objective of the present study was to test following hypotheses. Regarding packaging materials for the hot RTE meal delivery, the tested null hypothesis presumed that type of a meal, packaging material (primary wrapping, secondary container, their arrangement) and external temperature during the delivery has no effect on the time interval of the meal internal temperature decrease to the risky value of 40 °C. As far as B. cereus is concerned, the following null hypotheses were considered: counts of B. cereus in naturally contaminated tested hot RTE meals do not exceed risky levels of 104 colony forming units (CFU)/g after four hours at the temperature of 40 °C; type of the hot RTE meal has no effect on B. cereus counts under these conditions.
2. Materials and Methods
2.1. Preparation of the Dishes
Three meals considered risky from the viewpoint of a microbiological safety (especially regarding sporogenic bacteria) were tested: cooked rice (composition: long-grain rice, onion); mashed potatoes (fresh potatoes, milk); mushroom sauce (dried mushrooms, beef broth, milk, cream, flour). All three meals were prepared according to respective recipes by Runštuk et al. [20]. Cooking temperature at least 90 °C was applied during meals production in order to substantiate their categorization as the hot ready-to-eat (RTE) meals. Testo 104-IR thermometer (Testo, Prague, Czech Republic) was used for verifying of the temperature.
The original portion of each of the prepared meal was then divided into two aliquots. Effect of selected conditions on the maintenance of the internal hot RTE meal temperature during a simulated delivery was evaluated using one part of each meal. Growth of B. cereus in the second aliquot of the same meal was quantified in the laboratory (so, not directly during the simulated meal delivery, but under the corresponding temperature conditions).
2.2. Design of a Simulated hot RTE Meal Delivery
A 150 g portion of each meal was put into each of the two tested primary wrappings (Figure 1): a polypropylene (PP) tray (100% polypropylene; Bittner Packaging Sp.j., Ożarów Mazowiecki, Poland) and a sugarcane bagasse (SB) tray (produced from the waste after industrial processing of sugarcane; Ecoware Solutions Private Limited, New Delhi, India), respectively. The trays were immediately heat-sealed (without any change of the atmosphere) with an overlying heat-sealing foil (polyethylene/polypropylene, 185 mm, thickness 52 μm; Maso-profit Ltd., Prague, Czech Republic), using a heat-sealing apparatus T-190 (MetalPack, Maso-profit, Ltd., Prague, Czech Republic) at the heat-sealing temperature of 180 °C.
Immediately after the heat-sealing with the overlying foil, the trays with the meals were inserted into each of the two types of the secondary containers (Figure 1). In order to simulate different conditions during the meal delivery, two types of secondary containers with different thermo-insulating properties were used: a three-layered bag consisting of a polyester external layer and two inner layers, polyethylene foam and aluminum foil (PPA bag; overall thickness of 17 mm; Guangzhou A.C.T. Products Co., Ltd, Guangzhou, China); a polypropylene thermobox (PP box; extruded polypropylene; thickness of 30 mm; Polibox Srl, Arluno, Italy).
The heat-sealed bowls were inserted into the secondary containers in one layer (altogether 2 trays), three layers (6 trays) and six layers (12 trays), respectively. A sensor of a datalogger (Extech SDL200; Teledyne FLIR, France) was stuck into each layer of trays (Figure 1e) and the internal temperature on each layer was recorded during a time interval from inserting the meals into the secondary container (time 0 min) to 420 min. A closed secondary container was exposed to the temperature conditions of a surrounding environment and the external temperature was recorded using a customary external thermometer. The simulation of the meal delivery proceeded during all seasons of the year in the range of external temperatures from –2 °C to +33 °C.
2.3. Microbiological Analysis
Microbiological safety of the hot RTE meals was assessed using aliquots of the same meals, in which B. cereus growth was measured in laboratory conditions using a protocol by [21]. In the quoted experiment, the authors monitored growth of B. cereus after inoculation of the meals with spores of an emetic and diarrheic strain, respectively. In the present study, a natural contamination of the meals with B. cereus sensu lato (irrespective of a strain) was evaluated.
Six 150 g portions of each meal prepared as mentioned above were inserted into the PP trays (sugarcane bagasse trays were not used in this part of the experiment, only PP trays). The trays were immediately heat-sealed as mentioned above and then two trays of each meal were incubated (INCU-Line; VWR, Radnor, USA)) for 0, 0.5, 1.0, 1.5, 2.0, 2.5, 3.0, 3.5 and 4.0 h at 40 °C, 50 °C and 60 °C, respectively. Subsequently, 25 g of each sample was weighed into sterile homogenization bags and samples were diluted 1:9 with buffered peptone water and homogenized in a stomacher (Star Blender LB 400; VWR, Radnor, PA, USA) for 90 s. The homogenate was inoculated on Mannitol Yolk Polymyxin (MYP) agar (Oxoid, Thermo Fisher Scientific, Brno, Czech Republic) and cultivated for 24 h at 30 °C.
Suspected colonies of B. cereus were reinoculated onto blood agar (OXOID) and isolates showing a complete hemolysis were identified by Matrix-Assisted-Laser-Desorption-Ionization-Time-of-Flight mass spectroscopy (MALDI-TOF MS). Individual colonies of suspected B. cereus isolates were spread in duplicate on a MALDI plate, overlaid with 1 μL of HCCA matrix (a saturated solution of α-cyano-4-hydroxycinnamic acid in 50% acetonitrile, 47.5% water and 2.5% trifluoroacetic acid; Merck KGaA, Darmstadt, Germany) and then overlaid with 1 μL of 70% formic acid. The matrix with the colonies was let dry and after drying were isolates analyzed by MALDI-TOF MS (UltraFleXtreme instrument, Bruker Daltonik, Bremen, Germany; FlefControl 3.4 software; BioTyper 3.0 software, Bruker Daltonik; BioTyper database entries, version 10.0). Identification at the species level was considered reliable at the BioTyper log(score) > 2.0.
2.4. Statistical Evaluation
Normality of the data distribution was evaluated by Kolmogorov-Smirnov test. The data regarding effects of selected external factors (type of a dish; material of a primary wrapping; type of a secondary container; number of layers of the primary bowls stored in the secondary container; external temperature) on the time interval of the internal dish temperature decrease during a simulated delivery were assessed by factorial ANOVA. The time interval of the dish internal temperature decrease to 40 °C (risky value for the B. cereus growth) was used as a dependent variable (irrespective of the fact that the dish temperature was recorded until the time of 240 minutes). As far as external temperature is concerned, for the purpose of factorial ANOVA, not a numerical sequence, but five temperature spans (very low: <0 °C; low: 0 – 10 °C; intermediate: 10 – 20 °C; high: 20 – 30 °C; very high: >30 °C) were used as a one of the independent variables.
Differences in the time intervals of the internal dish temperature decrease between the dishes, between the primary wrappings, between the secondary containers and between the numbers of layers, respectively, were evaluated by one-way ANOVA with post-hoc Tukey’s test.
Regression analysis was used for evaluating a dependence of the time interval of the internal dish temperature decrease on the external temperature during the simulated delivery, and for evaluating a dependence of B. cereus counts on the time interval of the internal dish temperature decrease; in this case, an uninterrupted sequence of all measured numerical temperature values was applied.
Distribution of the microbiological data was not normal based on Kolmogorov-Smirnov test. So, the differences between counts of B. cereus strains (including control representing inadvertent contamination of a dish) growing at three tested temperatures (60 °C; 50 °C; 40 °C) and in the three different dishes (cooked rice; mashed potatoes; mushroom sauce), respectively, were evaluated by a nonparametric Kruskal-Wallis test with post-hoc Nemenyi test.
Statistica 14 software (TIBCO Software Inc., Santa Clara, CA, USA) was used for all statistical evaluations.
3. Results
Effects of the selected variability factors (type of a dish; material of a primary wrapping; type of a secondary container; number of layers of the primary bowls stored in the secondary container) on the time interval of the internal dish temperature decrease from the original temperature (an instant of inserting the tray with the tested meal to the secondary container) to 40 °C during a simulated delivery are shown in Table 1. Type of a dish had no significant effect on the tested time interval (p > 0.05). Material of a primary tray and of a secondary container altogether accounted for 20 % (12 + 8) of explained variability (p < 0.001). External temperature during the meal delivery and number of the tray layers in a secondary container were the most important factors determining the time interval of the internal dish temperature decrease to the critical value of 40 °C: 47 % and 21 % of explained variability, respectively (p < 0.001).
The data shown in Figure 2 fully correspond to the results presented in Table 1. No differences in the tested time interval between dishes (p > 0.05) were found out. The data presented in Figure 2 for a given independent variable were calculated (summed up) irrespective of all other independent factors. So, in the case of a dish, the time of the temperature decrease to 40 °C ranged between 100 and 110 minutes (p>0.05), calculated irrespective of primary wrapping, secondary container and number of layers.
On the other hand, significant differences (p < 0.05) between primary tray materials and between types of a secondary container, respectively, were established. Inserting a meal into a polypropylene tray instead of a sugarcane bagasse tray prolonged a temperature decrease to 40 °C by nearly 50 minutes (Figure 2) and putting the primary trays into polypropylene box prolonged the temperature decrease by approximately 15 minutes as compared to the polyester/polyethylene foam/aluminum foil bag.
Most importantly, the time of the internal dish temperature decrease to 40 °C (calculated irrespective of the type of a dish, type of a primary tray or material of a secondary container) was approximately 45 minutes when only one layer of trays was put into a secondary container, but 100 minutes when three layers were applied, and 140 minutes in the case of six layers (p < 0.05; Figure 2).
The time of the internal dish temperature decline to 40 °C decreased linearly with decreasing external temperature during the simulated hot dish delivery (Figure 3). The dependence was highly significant (p < 0.001; due to a high number of measurements, n = 250), but at the same time coefficient of determination of the relationship was very low (R2 = 0.12; high variability of the measured data).
In the microbiological part of the present experiment, the time of the internal dish temperature decline to 40 °C, which was used as a dependent variable in Figure 3, was employed as an independent variable for an evaluation of the dependence of B. cereus growth on the time of the hot ready-to-eat meal delivery (as already mentioned in the Materials and Methods section, B. cereus counts were not measured directly in the meals tested during the simulated delivery, but at the laboratory conditions in the aliquot parts of the same three meals).
The results are shown in Figure 4. The dependence was significantly better (p<0.01) described by an exponential regression than by a linear one. The time axis in Figure 4 is expressed in hours, because the linear and quadratic term of the regression equation would be very low (y = 1.43 – 0.003x + 0.00004x2) when calculated in minutes (as in Figure 3). Moreover, the number of points shown in Figure 4 is low as compared to the total number of measurements due to the overlapping of many nearly identical values. As it is apparent from Figure 4, counts of B. cereus in naturally contaminated meals after the four-hour culturing at 40 °C reached an average value of 3 log CFU · g-1 of meal (evaluated according to the regression that was calculated irrespective of the tested meal). However, the B. cereus counts reached nearly 4 log CFU · g-1 in some cases, which also confirms the data shown in Figure 5.
As follows from Figure 5, the culturing temperature was able to affect B. cereus counts. However, the counts at 40 °C were significantly higher (p<0.05) in comparison with both 60 °C and 50 °C only in mashed potatoes. Only tendency (p = 0.09) was found out in cooked rice, and B. cereus counts were practically the same in mushroom sauce cultured in the all three temperatures (p>0.05). As far as the comparison of the meals is concerned, no differences in B. cereus counts between mashed potatoes, cooked rice and mushroom sauce cultured at 60 °C were established (p>0.05). The same was true regarding the temperature of 50 °C (p>0.05). On the other hand, as far as the temperature of 40 °C is concerned, B. cereus counts in mashed potatoes was higher (p<0.05) as compared to mushroom sauce and tended to be higher (p = 0.06) in comparison with cooked rice. Similarly, only tendency (p>0.05) to higher B. cereus counts in cooked rice in comparison with mushroom sauce was established (Figure 5).
4. Discussion
The negligible effect of a meal on the time interval of the internal meal temperature decrease (p > 0.05; Figure 2) is explained by the high-water content in all three dishes, and water has one of the highest specific heat capacities (approximately 4186 J∙kg-1∙K-1). The mushroom sauce tended to reach higher time interval, as it contains more water, approximately 90 g per 100 g of dish, which is mainly due to the content of the main ingredients (beef broth, milk, cream). As reported by [22] and [23], the specific heat capacity of mashed potatoes and cooked rice is similar, reaching values of 3400 and 2700 J∙kg-1∙K-1, respectively.
Two materials were used for primary food packaging in our study: conventional PP and an advanced material made from sugarcane waste, known also as sugarcane bagasse (Figure 1c,d). Bagasse properties can be found out in several studies [24,25], including its thermal properties [5] and its use in packaging materials [26]. According to these studies, bagasse consists of approximately 40-50 % cellulose, 25-35 % hemicellulose, 15-20 % lignin and a low percentage of ash. According to [27], the thermal conductivity of bagasse is around 0.05 W∙m-1∙K-1 (dry) and 0.11 W∙m-1∙K-1 (wet), which values are likely to increase at temperatures of 40 °C – 90 °C (the study of [27] deals with sweet sorghum bagasse, but it is assumed that the thermal properties of sugarcane bagasse used in the present study are very similar).
Nevertheless, the thermal conductivity of bagasse is still lower in comparison with PP (0.2 W∙m-1∙K-1), which implies better thermal insulation properties of bagasse. This is contrary to the results of our study, where the internal temperature of the meal wrapped in the sugarcane bagasse tray and the PP tray decreased to 40 °C within an average time interval of 60 minutes and 110 minutes, respectively (Figure 2). Although these results could be partially biased by the unequal numbers of both types of the primary packaging used in the present study (24 and 225 trays of sugarcane bagasse and PP, respectively), our findings do not confirm superior thermal properties of bagasse [27].
This result, on the other hand, does not question environmental benefits of bagasse, including compostability. When considering a choice of a proper packaging material for the hot RTE meal delivery, their toxicological attributes should also be taken into account (though we did not consider them in the present study): PP may release chemical substances such as bisphenol A at elevated temperatures [7]. Regarding thermal conductivity of PP, Zemanová [4] reported its ability to maintain its temperature above 40 °C for 30 – 45 minutes.
As far as secondary containers are concerned, the two types of packaging usually employed by food delivery companies were used in the present study (Figure 1a,b), and significant difference between their abilities to maintain internal temperature of the transported meal above 40 °C was demonstrated (p < 0.05; Figure 2). Polypropylene thermobox prolonged the temperature decrease by 15 minutes compared to secondary container consisting of polyester/polyethylene foam/aluminium foil. However, it should be noted that the PP box has a wall thickness of 35 mm, while the PPA bag, though three-layered, was only 17 mm thick. With comparable material thicknesses, the layered packaging would be more suitable, as the thermal conductivity of its sandwich wall is 4-6 times lower (0.035-0.05 W∙m-1∙K-1) than that of pure PP (0.2 W∙m-1∙K-1; [28,29]).
As far as the filling of the space of a secondary container is concerned (see Figure 1e), the significant differences in the time interval of the internal meal temperature decrease to 40 °C between numbers of layers of the primary bowls stacked in secondary container (p < 0.05; Figure 2) should be expected: total heat (Q) is directly proportional to the total mass of the substance m (in this case mass of the meal), specific heat capacity (c) and the temperature difference (∆T) according to the equation Q = m ∙ c ∙ ∆T [30]. The more food is there in the secondary container, the higher is the specific heat capacity of the entire internal system, because the specific heat capacity of the meal is always higher than that of air (1000 J∙kg-1∙K-1).
As far as the health risk presented by the growth of B. cereus is concerned, three independent variables were considered in the present study: culturing temperature (40 °C), maximum time of the simulated hot RTE meal delivery (four hours) and a type of the RTE meal, respectively. Consequently, two hypotheses were tested: B. cereus counts in naturally contaminated RTE meals do not exceed unacceptable levels after the 4-hour culturing (and relatedly during the 4-hour simulated delivery) at the temperature of 40 °C; type of the RTE meal has no effect on B. cereus counts under these conditions (4-hour/40 °C culturing).
Three naturally contaminated model RTE meals were used in the present study, which is different in comparison with other similar experiments, where the tested foods were usually inoculated with the heat-shocked B. cereus spores [13,21,31,32].
A threshold, below which the inner temperature of the hot RTE meals should not decrease, was fixed to 40 °C in the present study (and the pertinent time interval to this point was measured; Figure 4). In this context, a value of 30 – 40 °C is often mentioned as an optimum for B. cereus growth [13,31], maximum growth temperature being 55 °C [13]. On the other hand, according to [33], a sufficient temperature, where B. cereus spores are not able to germinate and vegetative forms cannot multiply, is ≥ 60 °C. Similarly, based on the current legislation [2], finished food should be kept at a temperature of at least 60 °C after cooking.
The above-mentioned value of 60 °C is usually based on the often-reported threshold value for B. cereus counts of 5 log CFU/g of food [15]. However, the most important threat for human health as far as B. cereus is concerned are not its counts as such, but a production of the emetic toxin cereulide [9]. We did not measure B. cereus toxins in the present study, but, when discussing a critical temperature, it should be mentioned that cereulide production seems to be restricted to the temperature range of 12 °C to 40 °C [34,35]). Based on the current scientific knowledge, cereulide production stops at 40 °C [9]. Krenzler et al. [36]) detected no cereulide at this temperature. Finlay et al. [35] reported a drastic decrease of cereulide production when temperature exceeded 40 °C despite the fact that B. cereus still grew at a fast rate. It follows from the study of [37] that the cell numbers do not reliably correspond with cereulide toxin production and are therefore not a suitable indicator for risk assessment regarding B. cereus.
So, it could be concluded that the temperature of 40 °C can be considered a satisfactory lower limit for handling the hot RTE meals as far as B. cereus is concerned.
Another factor tested in the present study was the time interval of the decrease of the original internal hot RTE meal temperature to the above-discussed value of 40 °C during the simulated meal delivery. Current legislative concerning meal delivery does not explicitly specify the time, only stipulates that the meals should reach the consumer as quickly as possible [2]. In the present study, the maximum time of 4 h was chosen as an independent variable concerning the hygienic risk of the presence of B. cereus in a meal.
It is worthy to mention that there could be an opposite problem during the meal delivery at the low ambient temperatures, when the internal dish temperature could decrease to the critical value of 40 °C within the time interval as short as one hour (Figure 3). However, B. cereus counts in the tested model dishes in the present study did not exceed 1.5 log CFU · g-1 as far as this time interval is concerned, but reached 3 log CFU · g-1 after 4 hours (based on the pertinent regression equation; Figure 4).
As far as B. cereus counts in the RTE foods are concerned, 103 – 105 CFU · g-1 or ml are considered acceptable, the value exceeding 105 already unsafe [12]. Other studies [38] report values > 104 CFU/g or ml as unsafe regarding bulk RTE foods containing rice (one of the meals used in the present study). Soares et al. [39], when classified microbiological quality of university canteens (in northern Portugal), reported counts of B. cereus < 2 log CFU · g-1 as satisfactory, ≥ 2 ≤ 3 log CFU · g-1 as acceptable, > 3 < 5 log CFU · g-1 as unsatisfactory and ≥ 5 CFU · g-1 as unacceptable.
Comparison of our results regarding B. cereus counts after the 4-h culturing (relatedly during the 4-hour simulated delivery; Figure 2, Figure 3 and Figure 4) with the literature data is difficult, because only a few studies explicitly mention delivery of RTE cooked foods [40]. Mass catering [41], restaurants, cafés, catering and takeaway food premises [42] or university canteens [39] are evaluated instead. In comparison with the schedule used in the present study (the time limit for the meal delivery of four hours, the lower temperature limit of 40 °C), the authors apply lower target temperatures (24 °C, [32]; 18 °C, [43]), but often longer culturing intervals (up to 24 hours, [44]) or use heat-shocked B. cereus spores [13] instead of natural contamination of meals (the present study).
Based on the type of a meal, inner primary wrapping, outer secondary container and number of layers of the primary trays in the secondary container tested in the present study, the time of the internal RTE meal temperature decrease to 40 °C was in the range of 60 to 140 minutes (Figure 2), with corresponding B. cereus counts of 1.40 log CFU · g-1 to 1.80 log CFU · g-1 (Figure 4).
When taking into account the above-mentioned caveats, at least rough comparison of our results with the literature data can be inferred. In an experiment of [31], B. cereus counts in rice (one of the dishes tested also in the present study) inoculated by the spore cocktail increased from 2.15 log CFU · g-1 to 2.41 log CFU · g-1 after 6 hours of exponential cooling from the initial temperature of 54.5 °C; a cooling time of approximately 3 hours from 54.5 °C to ca. 40 °C can be extrapolated from the data of [31]. Juneja et al. [13]), reported B. cereus counts in cooked rice to be 4 log CFU · g-1 after 4 hours of storing at 40 °C. This value is by 2 log CFU · g-1 higher in comparison with our data as far as cooked rice is concerned (Figure 5), probably due to the fact that the quoted authors inoculated the tested dish with the heat-shocked spores (natural contamination was evaluated in the present study).
According to [32], the lag phase of the B. cereus growth in cooked rice stored at 24 °C was 2 – 3 hours and the storage time required to multiply B. cereus to the critical levels of 3 log CFU · g-1 was 5 hours and 4.7 hours regarding white and brown rice, respectively. Ankolekar and Labbé [45]) reported B. cereus counts in rice stored for 4 hours at 20 °C to be 2.24 log CFU · g-1. The data are only seemingly similar to our results regarding rice (Figure 5), because both temperature differences (20 °C vs. 40 °C in our study) and the fact that the quoted authors tested the spore-inoculated samples should be taken into account.
Apart from cooked rice, the literature data regarding other two meals tested in the present study (mashed potatoes, mushroom sauce) are rather scanty as far as B. cereus growth is concerned. From the viewpoint of comparable time/temperature values, no useful data are available regarding hot RTE mushroom sauce delivery. As far as thermally treated potato puree is concerned, it is possible to extrapolate from the results of [46] an increase of B. cereus counts from 3.5 log CFU · g-1 to 4.0 CFU · g-1 in the spore-inoculated samples stored at 20 °C for 4 hours. This is similar to the B. cereus counts in mashed potatoes cultured at 40 °C in the present study (Figure 5).
5. Conclusions
The null hypothesis presuming a negligible effect of a type of the tested hot RTE meal on the time interval of the dish internal temperature decrease to the value risky from the viewpoint of B. cereus growth (40 °C) was confirmed: no differences between mashed potatoes, cooked rice and mushroom sauce was found out from this viewpoint. On the other hand, both inner primary packaging and outer secondary container significantly affected the time of keeping the temperature above the threshold value. Contrary to the expectation, the presumed better thermal properties of the sugarcane bagasse as compared to polypropylene (PP) was not confirmed in the present study (Figure 2).
The lower time interval for the maintenance of the inner meal temperature when the dishes were put into the secondary container composed of polyester/polyethylene foam/aluminum foil (PPA) in comparison with the PP box was likely only a consequence of the lower wall thickness of the PPA bag, because the thermal conductivity of this sandwiched wall is several times lower than that of the PP box.
As far as B. cereus is concerned, the null hypothesis that counts of this pathogen in naturally contaminated hot RTE meals do not exceed unacceptable levels (104 CFU · g-1) after the 4-hour culturing (and relatedly during the 4-hour simulated delivery) at the temperature of 40 °C was confirmed: based on the regression equation presented in Figure 4, the 4-hour time interval corresponds to B. cereus counts of 2.99 log CFU · g-1. On the other hand, the hypothesis that the type of the hot RTE meal has no effect on B. cereus counts under these conditions (4-hour/40 °C culturing) was not corroborated: B. cereus counts were higher in mashed potatoes in comparison with mushroom sauce.
It could be concluded that a hot RTE meal delivered up to four hours under the conditions tested in the present study is not likely to facilitate B. cereus growth above the unacceptable levels and so endanger a consumer.
Author Contributions
Conceptualization, O.C., G.F., T.K.; Methodology, O.C., G.F., T.K., V.K., J.K; Software, O.P., P.K.; Validation, T.K.; G.F., J.K; Formal Analysis, V.K., O.C., G.F., P.K., J.K., M.D., A.Z.; Investigation, T.K., V.K., O.C., G.F.; Resources, O.C., G.F.; Data Curation, P.K.; Writing – Original Draft Preparation, T.K.; Writing – Review & Editing, T.K.; Visualization, O.P.; Supervision, O.C., J.K.; Project Administration, O.C., G.F.; Funding Acquisition, O.C., J.K., G.F.
Funding
This research was funded by the Ministry of Agriculture of the Czech Republic, grant number QK23020061
Conflicts of Interest
The authors declare no conflict of interest
References
- Li, J.; Yang, S.; Pan, W.; Xu, Z.; Wei, B. Meal delivery routing optimization with order allocation strategy based on transfer stations for instant logistics services. IET Intell. Transp. Syst. 2022, 16, 1108-1126. [CrossRef]
- Decree No. 121/2023 Coll., On requirements for food. Ministry of Agriculture of the Czech Republic. Collection of Laws 2023, 63, 1763-1768.
- Ricci, A.; Martelli, F.; Razzano, R.; Cassi, D.; Lazzi, C. et al. Service temperature preservation approach for food safety: Microbiological evaluation of ready meals. Food Control 2020, 115, 107297. [CrossRef]
- Zemanová, J. Obsah toxických látok v obalových materiáloch a ich možná migrácia do potravín. SciCell magazín 2020, 3, 1-12 (in Czech).
- Athira, G.; Bahurudeen, A.; Appari, S. Thermochemical conversion of sugarcane bagasse: Composition, reaction kinetics, and characterisation of by-Products. Sugar Tech. 2021, 23, 433–452. [CrossRef]
- Saha, N.C.; Ghosh, A.K.; Garg, M.; Sadhu, S.D. Food Packaging. Singapore: Springer Nature Singapore, 2022. ISBN 978-981-16-4232-6. [CrossRef]
- Rantuch, P. The Thermal Degradation of Polymer Materials. Ignition of Polymers. Cham: Springer International Publishing, 2022, 1-43. ISBN 978-3-031-13081-6. [CrossRef]
- Woh, P.Y.; Ng., C. Bacillus cereus in rice: A review on food poisoning, antimicrobial resistance, and control measures. Trop Biomed 2024, 41, 298-309. [CrossRef]
- Rouzeau-Szynalski, K.; Stollewerk, K.; Messelhäusser, U.; Ehling-Schulz, M. Why be serious about emetic Bacillus cereus: Cereulide production and industrial challenges. Food Microbiol 2020, 85, 103279. [CrossRef]
- Yang, S.; Wang, Y.; Ren, F.; Wang, X.; Zhang, W.; Pei, X.; Dong, Q. The sources of Bacillus cereus contamination and their association with cereulide production in dairy and cooked rice processing lines. Food Quality and Safety, 2023, 7, 1-14. [CrossRef]
- Schoeni, J.L.; Kee Wong, A.C. Bacillus cereus food poisoning and its toxins. J. Food Protect. 2005, 68, 636-648. [CrossRef]
- Public Health England. Guidelines for Assessing the Microbiological Safety of Ready-to-Eat Foods Placed on the Market. Health Protection Agency: London, UK, 2009.
- Juneja, V.K.; Golden, C.E.; Mishra, A.; Harrison, M.A.; Mohr, T.; Silverman, M. Predictive model for growth of Bacillus cereus during cooling of cooked rice. Int. J. Food Microbiol. 2019, 290, 49-59. [CrossRef]
- Rahmana, H.; Azari, R.; Yousefi, M.H.; Berizi, E.; Mazloomi, S.M.; Hosseinzadeh, S.; Derakhshan, Z.; Ferrante, M.; Conti, G.O. A systematic review and meta-analysis of the prevalence of Bacillus cereus in foods. Food Control 2023, 143, 109250. [CrossRef]
- Yang, S.; Wang, Y.; Liu, Y.; Jia, K.; Zhang, Z.; Dong, Q. Cereulide and emetic Bacillus cereus: Characterizations, impacts and public precautions. Foods 2023, 12, 833. [CrossRef]
- Messelhäuser, U.; Frenzel, E.; Blöchinger, C.; Zucker, R.; Kämpf, P.; Ehling-Schulz, M. Emetic Bacillus cereus are more volatile than thought: Recent foodborne outbreaks and prevalence studies in Bavaria (2007-2013). Biomed. Res. Int. 2014, 2014, 465603. [CrossRef]
- Cayemitte, P.E.; Raymond, P.; Aider, M. Bacillus cereus as an underestimated foodborne pathogen and new perspectives on its prevalence and methods of control: Critical and practical review. ACS Food Sci. Technol. 2022, 2, 1196-1212. [CrossRef]
- Samapundo, S.; Heyndrickx, M.; Xhaferi, R.; Devlieghere, F. Incidence, diversity and toxin gene characteristics of Bacillus cereus group strains isolated from food products marketed in Belgium. Int. J. Food Microbiol. 2011, 150, 34-41. [CrossRef]
- Kim, B.; Bang, J.; Kim, H.; Kim, Y.; Kim, B.-S.; Beuchat, L.R.; Ryu, J.-H. Bacillus cereus and Bacillus thuringiensis speres in Korean rice: Prevalence and toxin production as affected by production area and degree of milling. Food Microbiol. 2014, 42, 89-94. [CrossRef]
- Runštuk J., Syrový F., Rusnaková S. Receptury Teplých Pokrmů®. 7th ed. Radek Runštuk-R Plus; Divec, Czech Republic 2015. 580 p. (In Czech).
- Kameník, J.; Dušková, M.; Zouharová, A.; Čutová, M.; Dorotíková, K.; Králová, M.; Macharáčková, B.; Hulánková, R. The germination and growth of two strains of Bacillus cereus in selected hot dishes after cooking. Foods, 2025, 14, 194. [CrossRef]
- Yamada, T. Specific-Heat of Rice. J. Agric. Chem. Soc. Japan 1984, 58, 31-33. [CrossRef]
- Chen, J.; Pitchai, K.; Birla, S.; Gonzalez, R.; Jones, D.; Subbiah, J. Temperature-dependent dielectric and thermal properties of whey protein gel and mashed potato. Transactions of the ASABE 2013, 56, 1457-1467. [CrossRef]
- Loh, Y.R.; Sujan, D.; Rahman M.E.; Das, C.A. Sugarcane bagasse—the future composite material: A literature review. Resources, Conservation and Recycling, 2013, 75, 14-22. [CrossRef]
- Mahmud, M.A., Anannya F.R. Sugarcane bagasse - A source of cellulosic fiber for diverse applications. Heliyon 2021, 7, e07771. [CrossRef]
- Ghaderi M.; Mousavi, M.; Yousefi H.; Labbafi, M. All-cellulose nanocomposite film made from bagasse cellulose nanofibers for food packaging application. Carbohydr. Polym. 2014, 104, 59-65. [CrossRef]
- Mahapatra, A.K.; Ekefre, D.E.; Pattaniak, N.K., Jena, U.; Williams, A.L.; Latimore, M. Thermal properties of sweet sorghum bagasse as a function of moisture content. CIGR J. 2017, 19, 108-113. cigrjournal.org/index.php/Ejounral/article/view/3837.
- Jing, X., Li, Y., Zhu, J. et al. Improving thermal conductivity of polyethylene/polypropylene by styrene-ethylene-propylene-styrene wrapping hexagonal boron nitride at the phase interface. Adv. Compos. Hybrid Mater. 2022, 5, 1090–1099. [CrossRef]
- Yin, H., Liu, C., Wang, B. et al. Comparison of thermal conductivities of polypropylene fibers and fibrils. Heat Mass Transfer 2024, 60, 677–684. [CrossRef]
- Teggar, M.; Atia, A.; Rocha, T.T.M.; Laouer, A. Long and short-term storage of food and agriculture products: Prospects of latent heat thermal energy storage. Thermal Sci. Eng. Prog. 2025, 59, 103324. [CrossRef]
- Juneja, V.K.; Mohr, T.B.; Silverman, M.; Snyder, O.P. Influence of cooling rate on growth of Bacillus cereus from spore inocula in cooked rice, beans, pasta, and combination products containing meat or poultry. J. Food Prot. 2018, 81, 430-436. [CrossRef]
- Bursová, Š.; Haruštiaková, D.; Necidová, L.; Krobotová, E.; Mlejnková, Z.; Tkáč, M.; Stojanová, K.; Golian, J. Evaluation of Bacillus cereus growth in cooked rice. J. Microbiol. Biotech. Food Sci. 2024, 14, e10985. [CrossRef]
- Farber, J.M.; Hughes, A. General guidelines for the safe handling of foods. Dairy Food Environ. Sanit. 1995, 15, 70-78.
- Apetroaie-Constantin, C.; Shaeen, R.; Andrup, L.; Smidt, L.; Rita, H.; Salkinoja-Salonen, M. Environment driven cereulide production by emetic strains of Bacillus cereus. Int. J. Food Microbiol. 2008, 127, 60-67. [CrossRef]
- Finlay, W.J.J.; Logan, N.A.; Sutherland, A.D. Bacillus cereus produces most emetic toxin at lower temperatures. Lett. Appl. Microbiol. 2000, 31, 385-389. [CrossRef]
- Kranzler, M.; Stollewerk, K.; Rouzeau-Szynalski, K.; Blayo, L.; Sulyok, M.; Ehling-Schulz, M. Temperature exerts control of Bacillus cereus emetic toxin production on post-transcriptional levels. Front. Microbiol. 2016, 7, 1640. [CrossRef]
- Dommel, M.K.; Lücking, G.; Scherer, S.; Ehling-Schulz, M. Transcriptional kinetic analyses of cereulide synthetase genes with respect to growth, sporulation and emetic toxin production in Bacillus cereus. Food Microbiol. 2011, 28, 284-290. [CrossRef]
- GB31607-2021. National Food Safety Standard – Limits of Pathogenic Bacteria in Bulk Ready-to-Eat Foods. Issue on: 7 September 2021; German Federal Institute for Risk Assessment. Berlin, Germany, 7 September 2021.
- Soares, K.; Moura, A.T.; García-Díez, J.; Oliveira, I.; Esteves, A.; Saraive, C. Evaluation of hygienic quality of food served in universities canteens of Northem Portugal. Indian J. Microbiol. 2020, 60, 107-114. [CrossRef]
- Tessi, M.A.; Aríngoli, E.E.; Pirovani, M.E.; Vincenzini, A.Z.; Sabbag, N.G.; Costa, S.C.; García, C.C.; Zannier, M.S.; Silva, E.R.; Moguilevsky, M.A. Microbiological quality and safety of ready-to-eat cooked foods from a centralized school kitchen in Argentina. J. Food. Prot. 2002, 65, 636-642. [CrossRef]
- Osimani, A.; Aquilanti, L.; Clementi, F. Bacillus cereus foodborne outbreaks in mass catering. Int. J. Hosp. Manag. 2018, 72, 145-153. [CrossRef]
- Foxcroft, N.; Masaka, E.; Oosthuizen, J. Prevalence trends of foodborne pathogens Bacillus cereus, non-STEC Escherichia coli and Staphylococcus aureus in ready-to-eat foods sourced from restaurants, cafés, catering and takeaway food premises. Int. J. Environ. Res. Public Health 2024, 21, 1426. [CrossRef]
- Fang, T.J.; Wei, Q.-K.; Liao, C.-W.; Hung, M.-J.; Wang, T.-H. Microbiological quality of 18 °C ready-to-eat food products sold in Taiwan. Int. J. Food Microbiol. 2003, 80, 241-250. [CrossRef]
- Agata, N.; Ohta, M.; Yokoyama, M. Production of Bacillus cereus emetic toxin (cereulide) in various foods. Int. J. Food Microbiol. 2002, 73, 23-27. [CrossRef]
- Ankolekar, C.; Labbé, R.G. Survival during cooking and growth from spores of diarrheal and emetic types of Bacillus cereus in rice. J. Food Prot. 2009, 72, 2386-2389. [CrossRef]
- Rajkovic, A.; Uyttendaele, M.; Ombregt, S.-A.; Jaaskelainen, E.; Salkinoja-Salonen, M.; Debevere, J. Influence of type of food on the kinetics and overall production of Bacillus cereus emetic toxin. J. Food Prot. 2006, 69, 847-852. [CrossRef]
Figure 1.
Types of secondary containers and primary wrappings used in a simulated dish delivery; a: polyester/polyethylene foam/aluminum foil bag (thickness of 17 mm; Guangzhou A.C.T. Products Co., Ltd, Guangzhou, China); b: polypropylene thermobox (extruded polypropylene, thickness of 30 mm; Polibox Srl, Arluno, Italy); c: polypropylene tray (Bittner Packaging Sp.j., Ożarów Mazowiecki, Poland); d: sugarcane bagasse tray (Ecoware Solutions Private Limited, New Delhi, India); e: internal temperature measurement using a puncturing sensor of a datalogger (Extech SDL200, Teledyne FLIR, France).
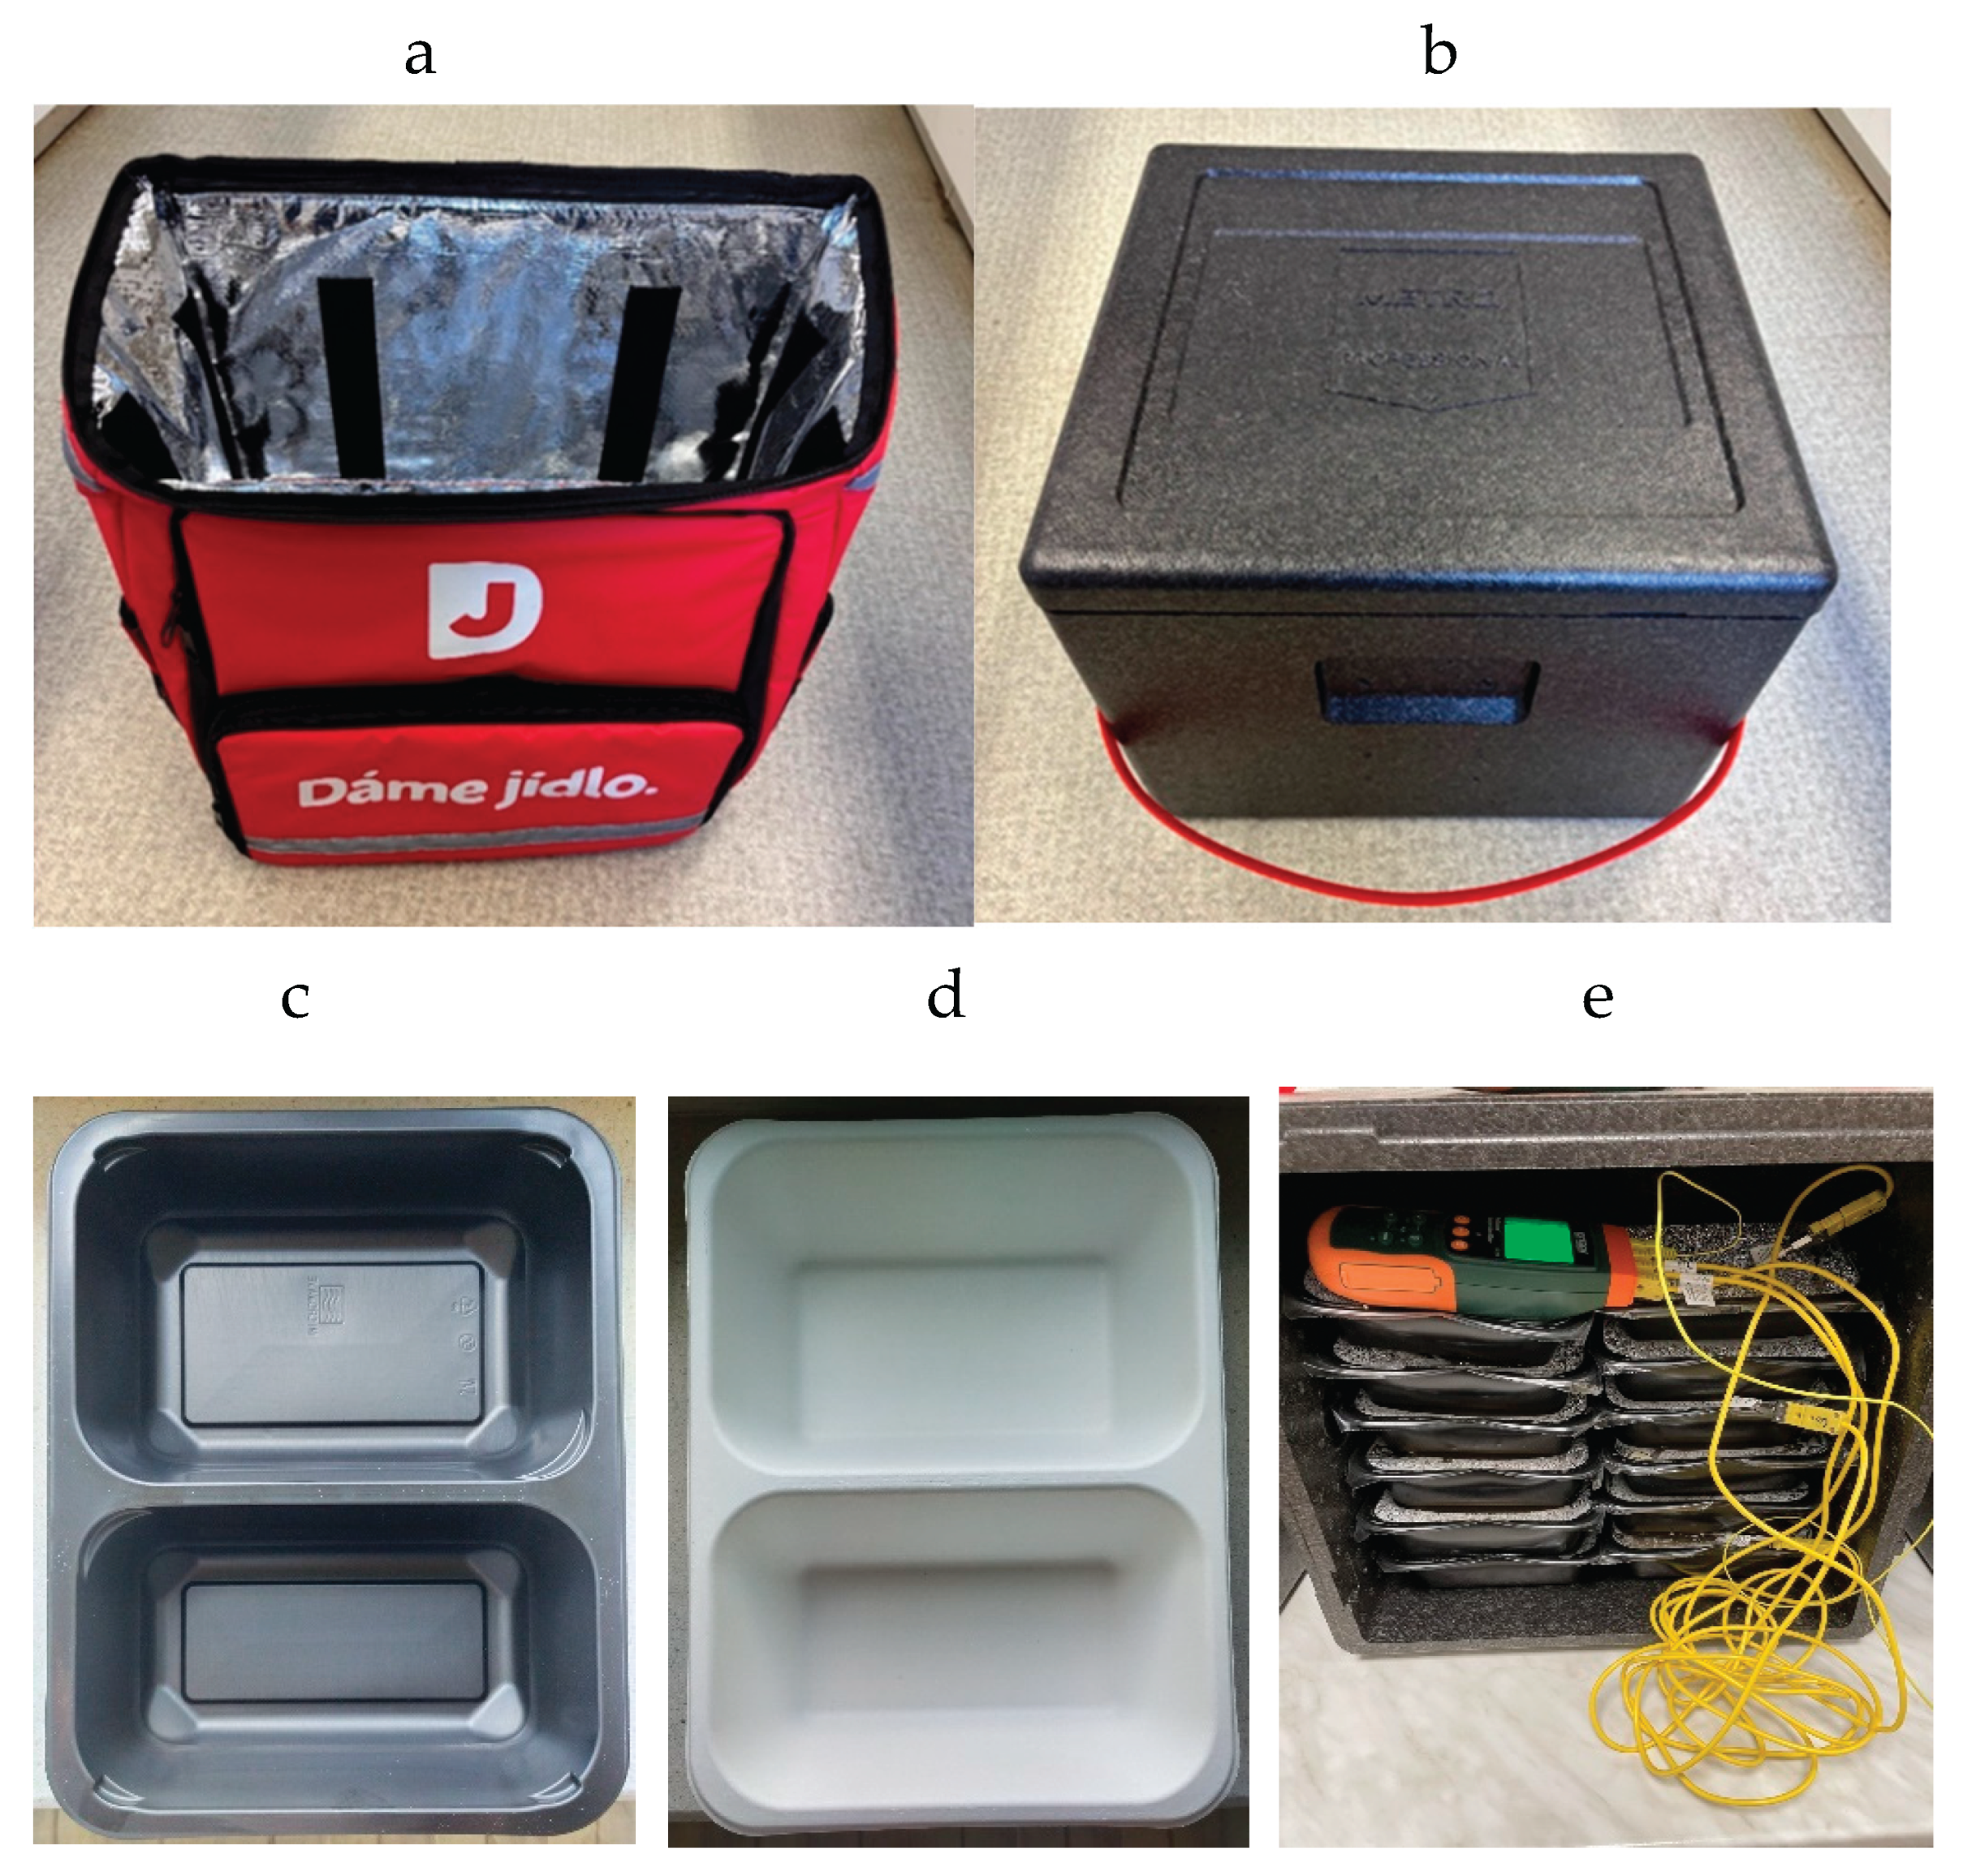
Figure 2.
Effect of a dish (mashed potatoes, MP, n= 119; cooked rice, CR, n = 67; mushroom sauce, MS, n = 63); inner primary wrapping (sugarcane bagasse [SB] tray, n = 24; polypropylene [PP] tray, n = 225); outer secondary container (polyester/polyethylene foam/aluminum foil [PPA] bag, n = 75; polypropylene [PP] box, n = 174); and number of layers of the primary trays in the secondary container (one layer, n = 61; three layers, n = 92; six layers, n = 96) on the time interval of the internal dish temperature decrease to 40 °C; the data regarding a given independent variable were calculated irrespective of other independent variables; A – C: means with different superscripts within a given independent variable differ at p < 0.05 (one-way ANOVA with post-hoc Tukey’s test).
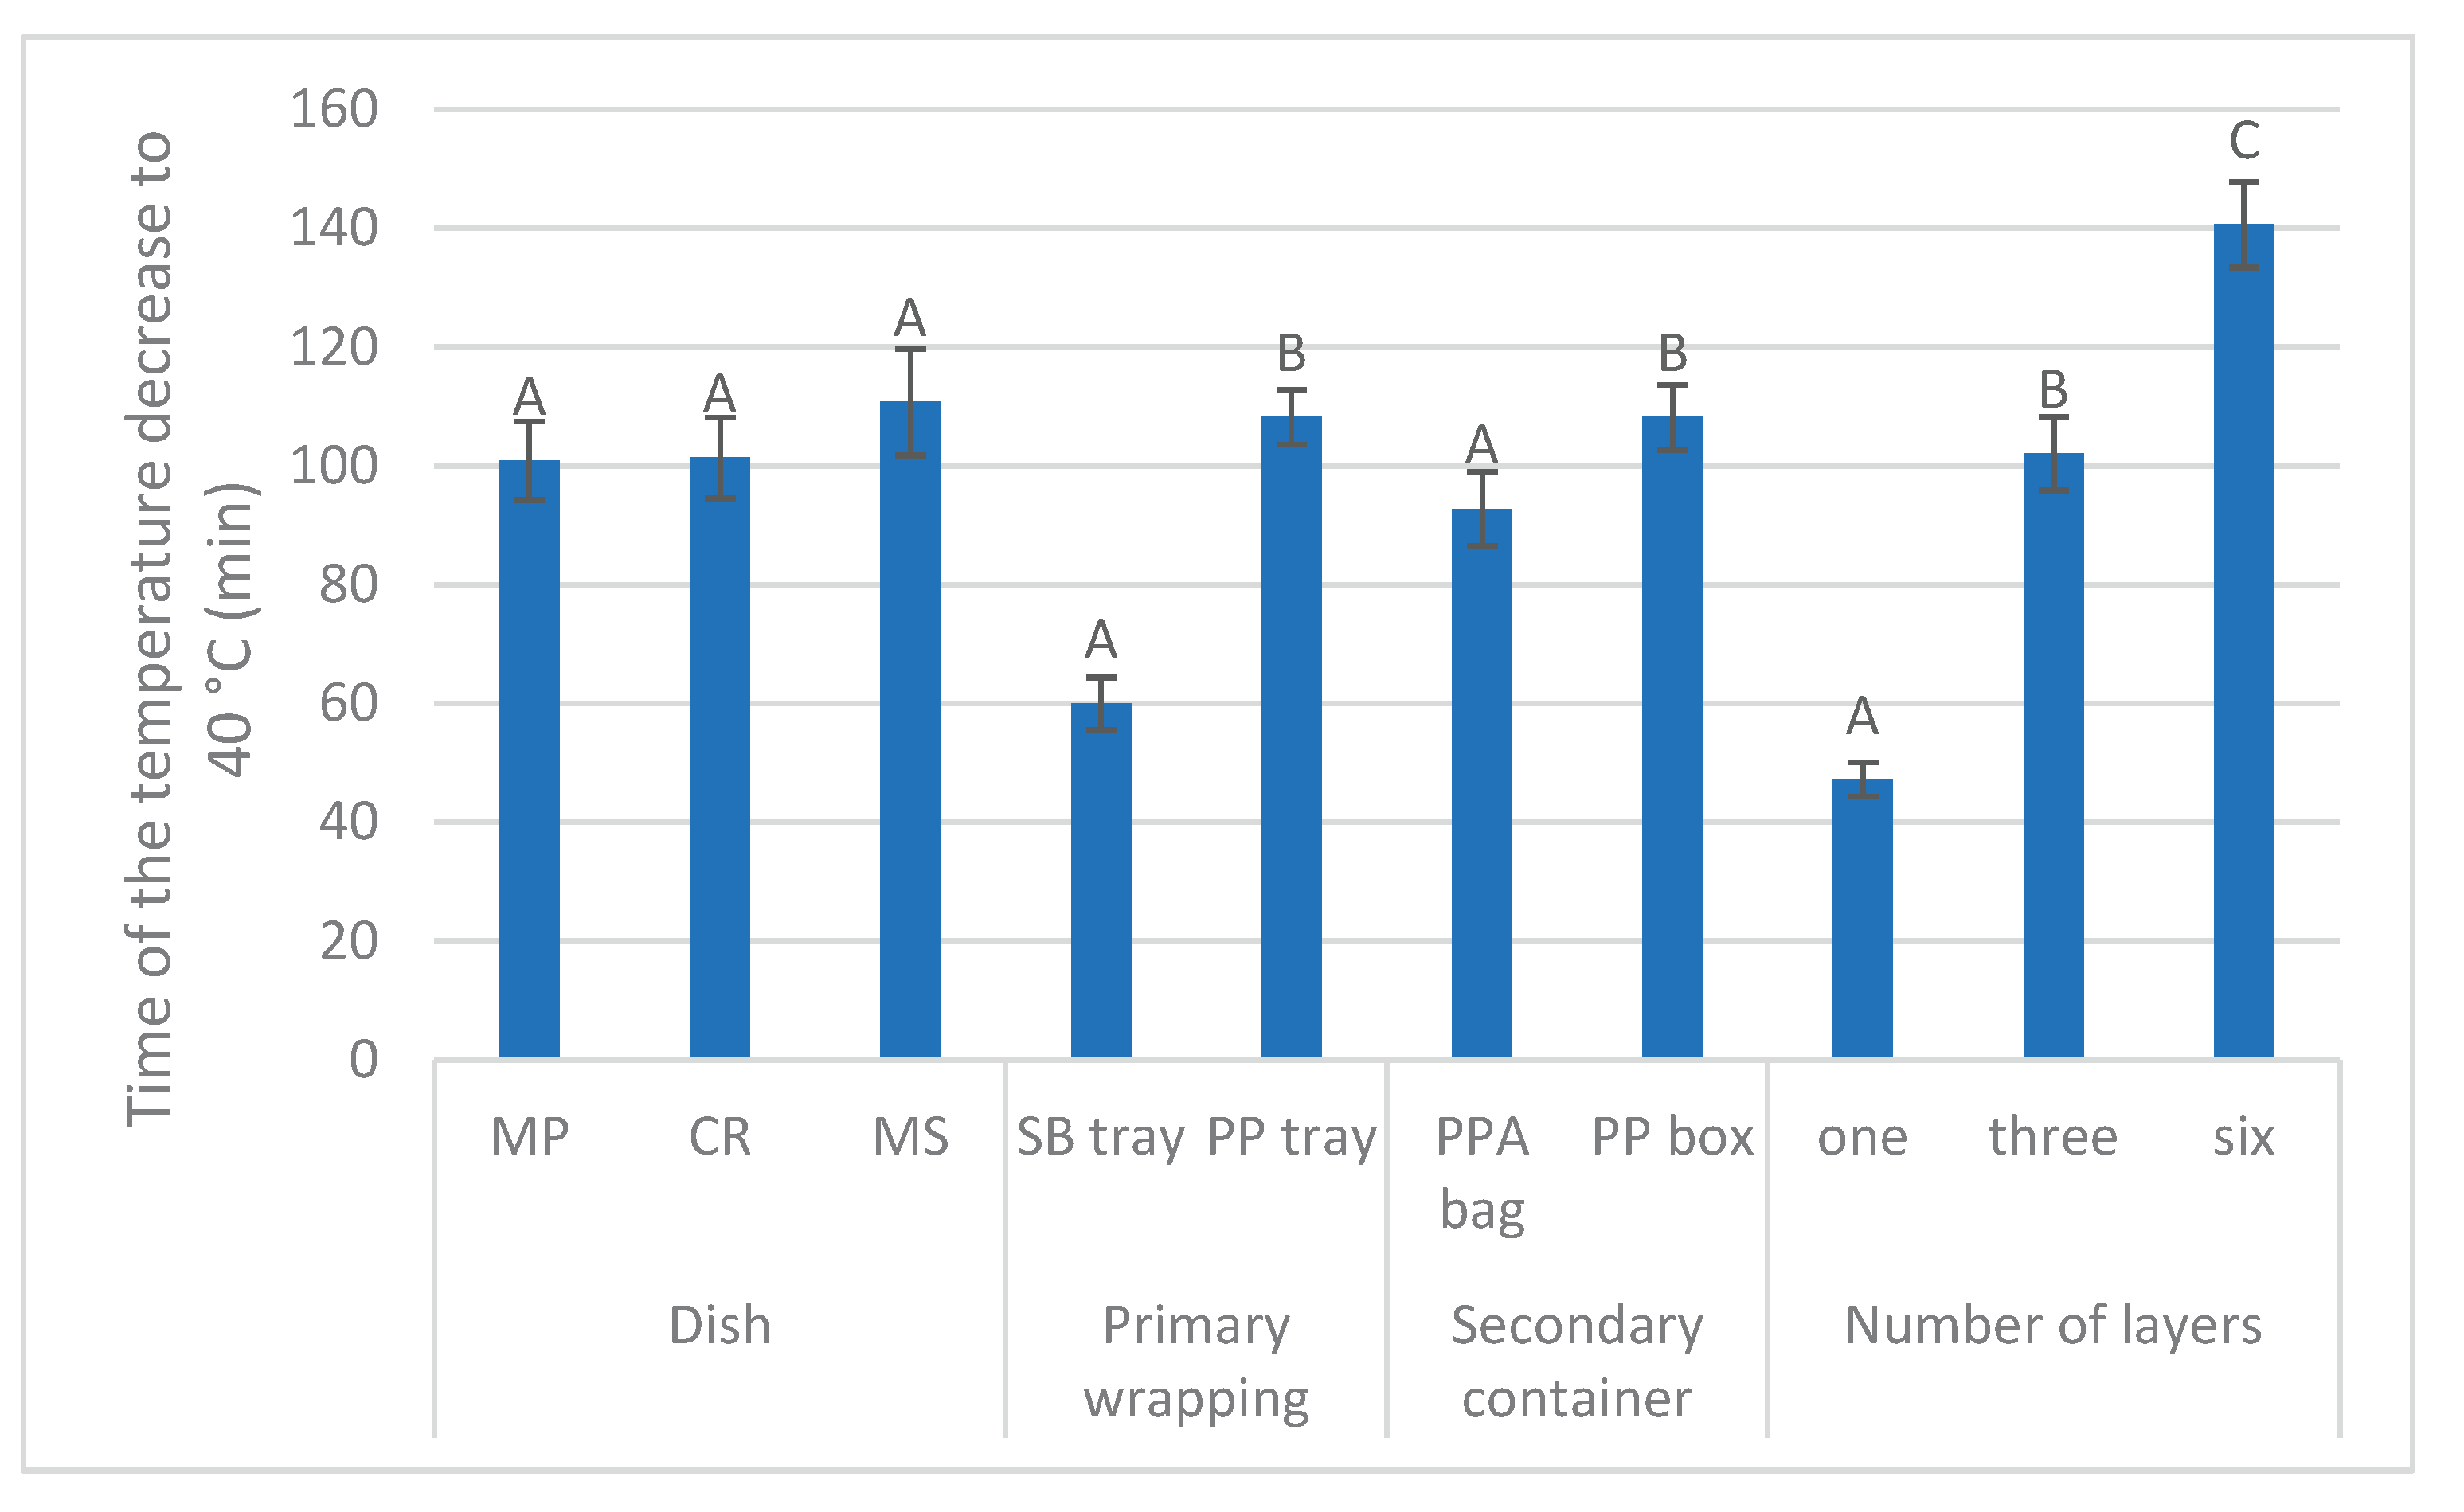
Figure 3.
Dependence of the time interval of the internal dish temperature decrease from the original temperature (an instant of inserting the tray with the tested meal to the secondary container) to 40 °C on the external temperature during a simulated ready-to-eat dish delivery; the regression was calculated irrespective of a dish, inner primary wrapping, secondary container and number of layers of the primary trays in the secondary container, respectively.
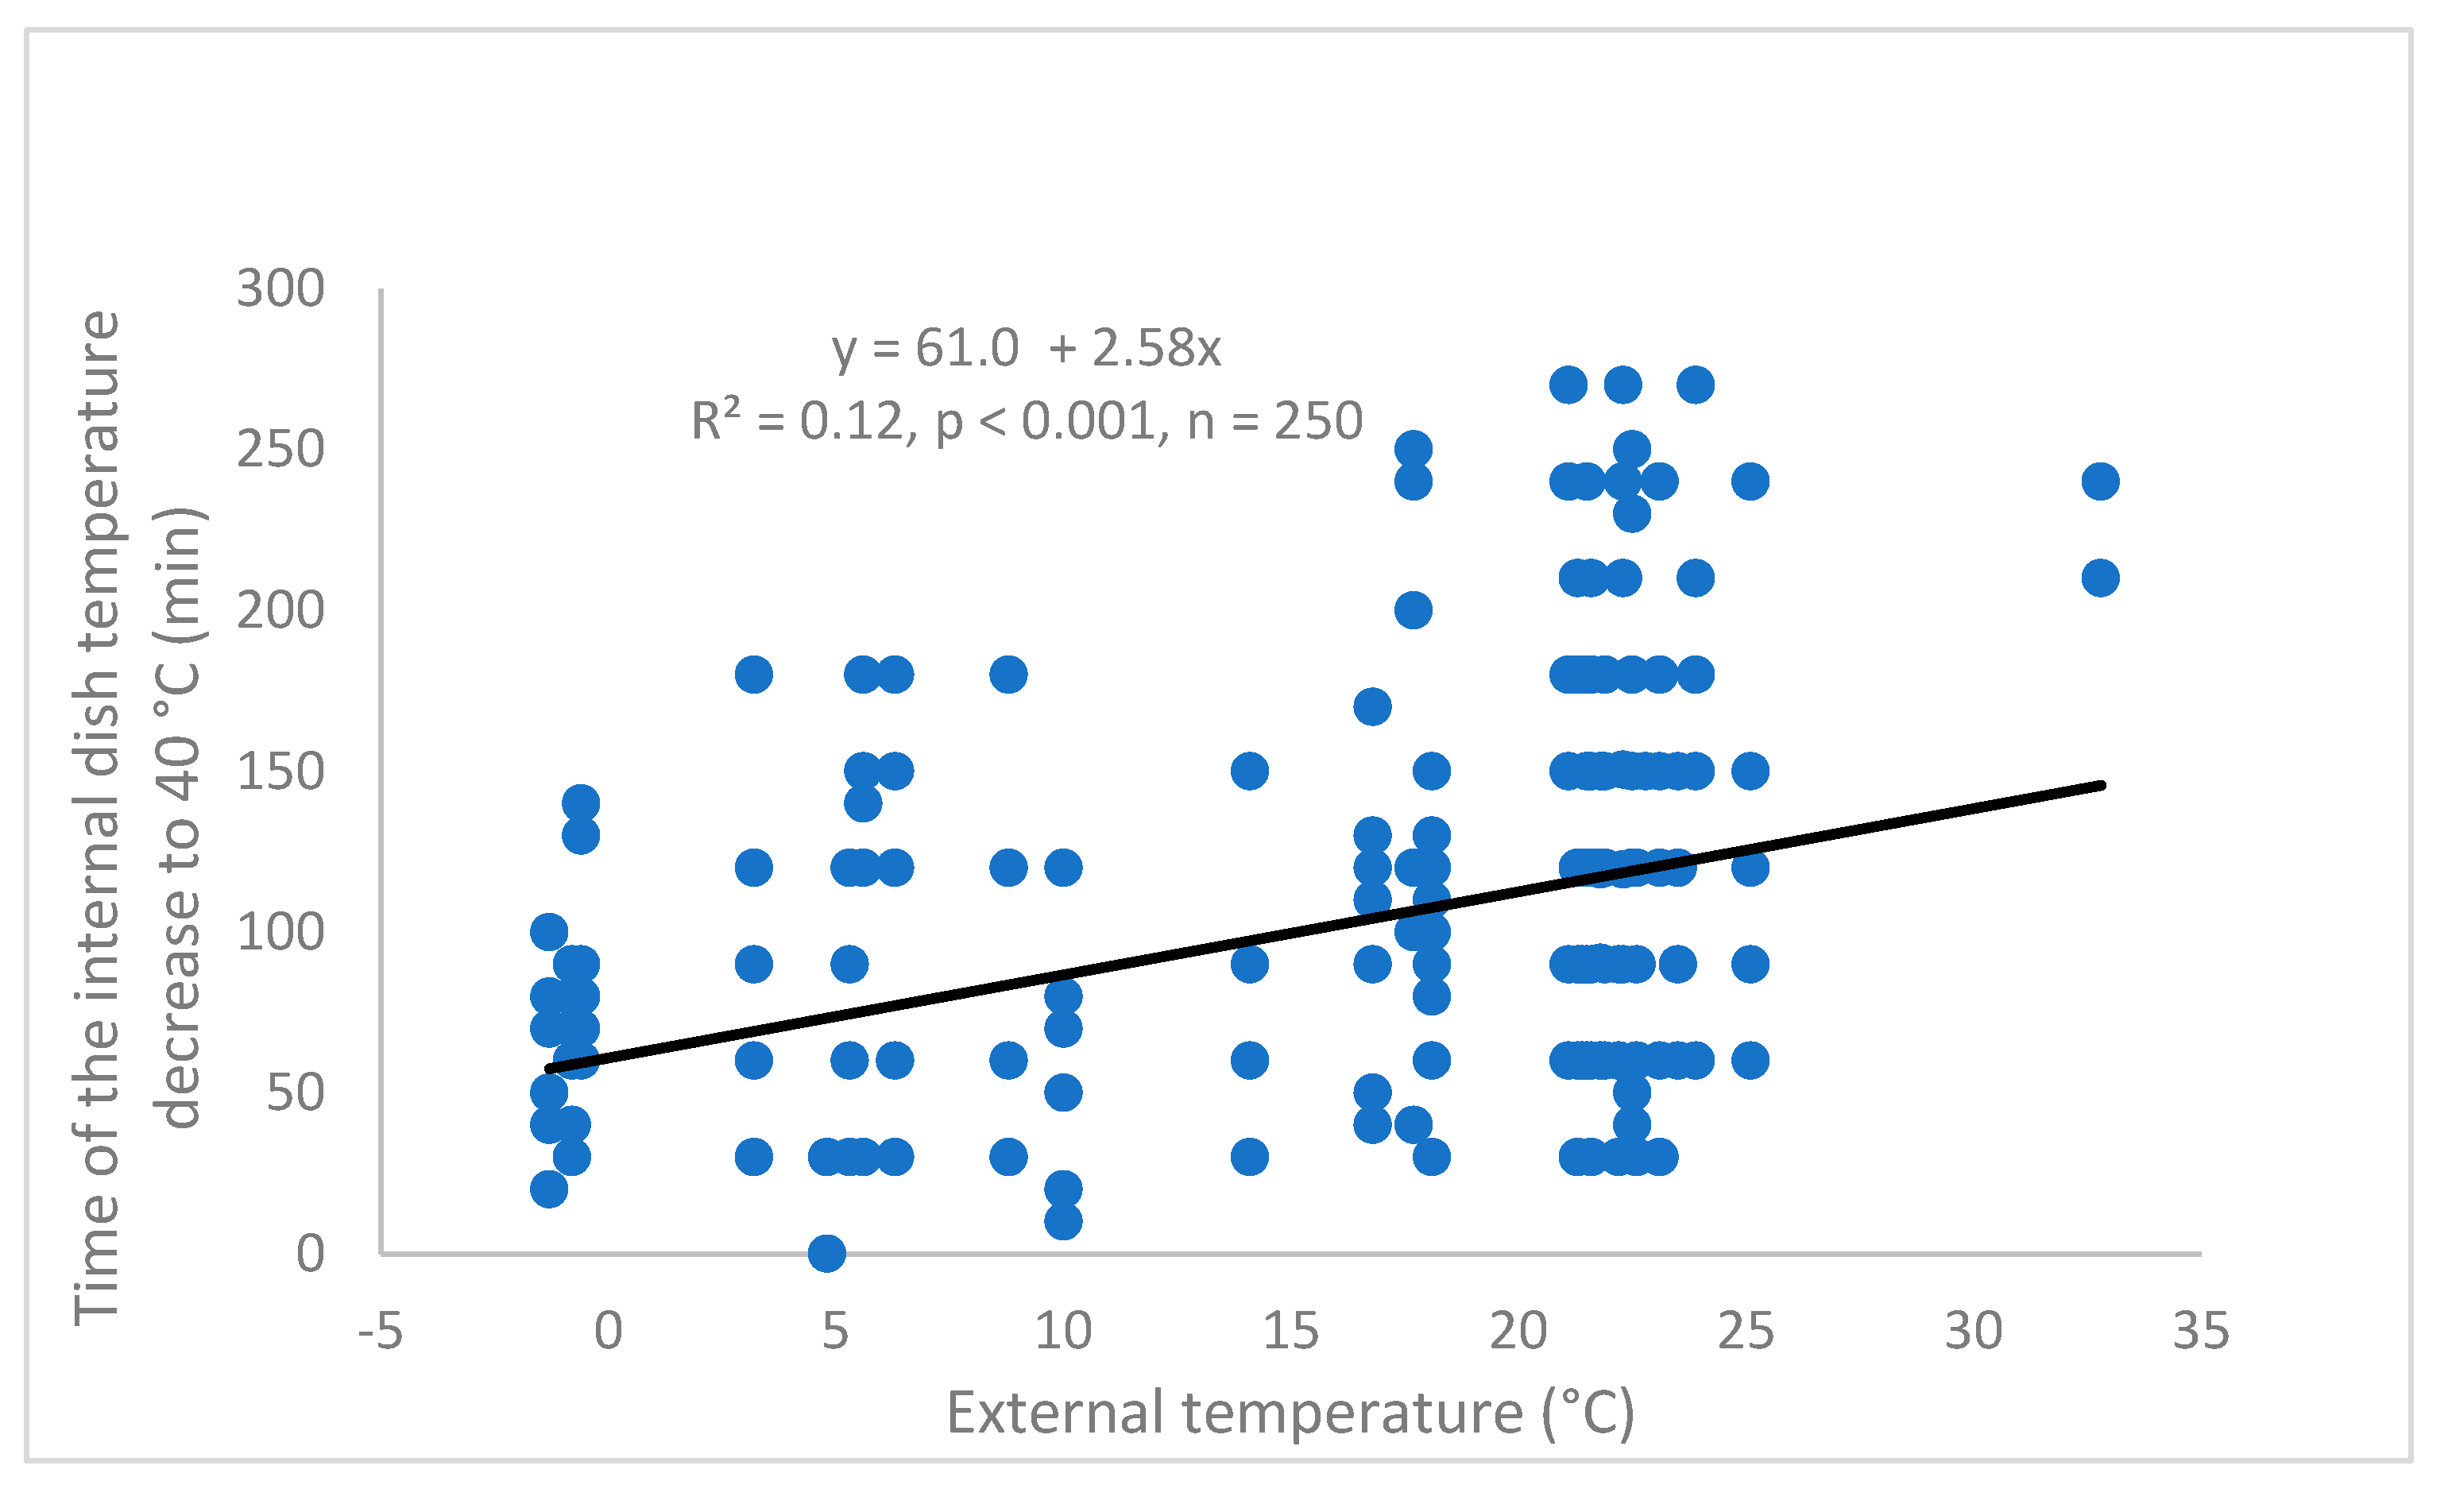
Figure 4.
Dependence of Bacillus cereus counts in the three naturally contaminated model meals (cooked rice, mashed potatoes, mushroom sauce) on the time interval of the internal meal temperature decrease from the original temperature (an instant of inserting the tray with the tested meal to the secondary container) to 40 °C; the values of the independent variable were calculated irrespective of a meal, inner primary wrapping, secondary container and number of layers of the primary trays in the secondary container; the values of the dependent variable were calculated irrespective of the meal, n = 172.
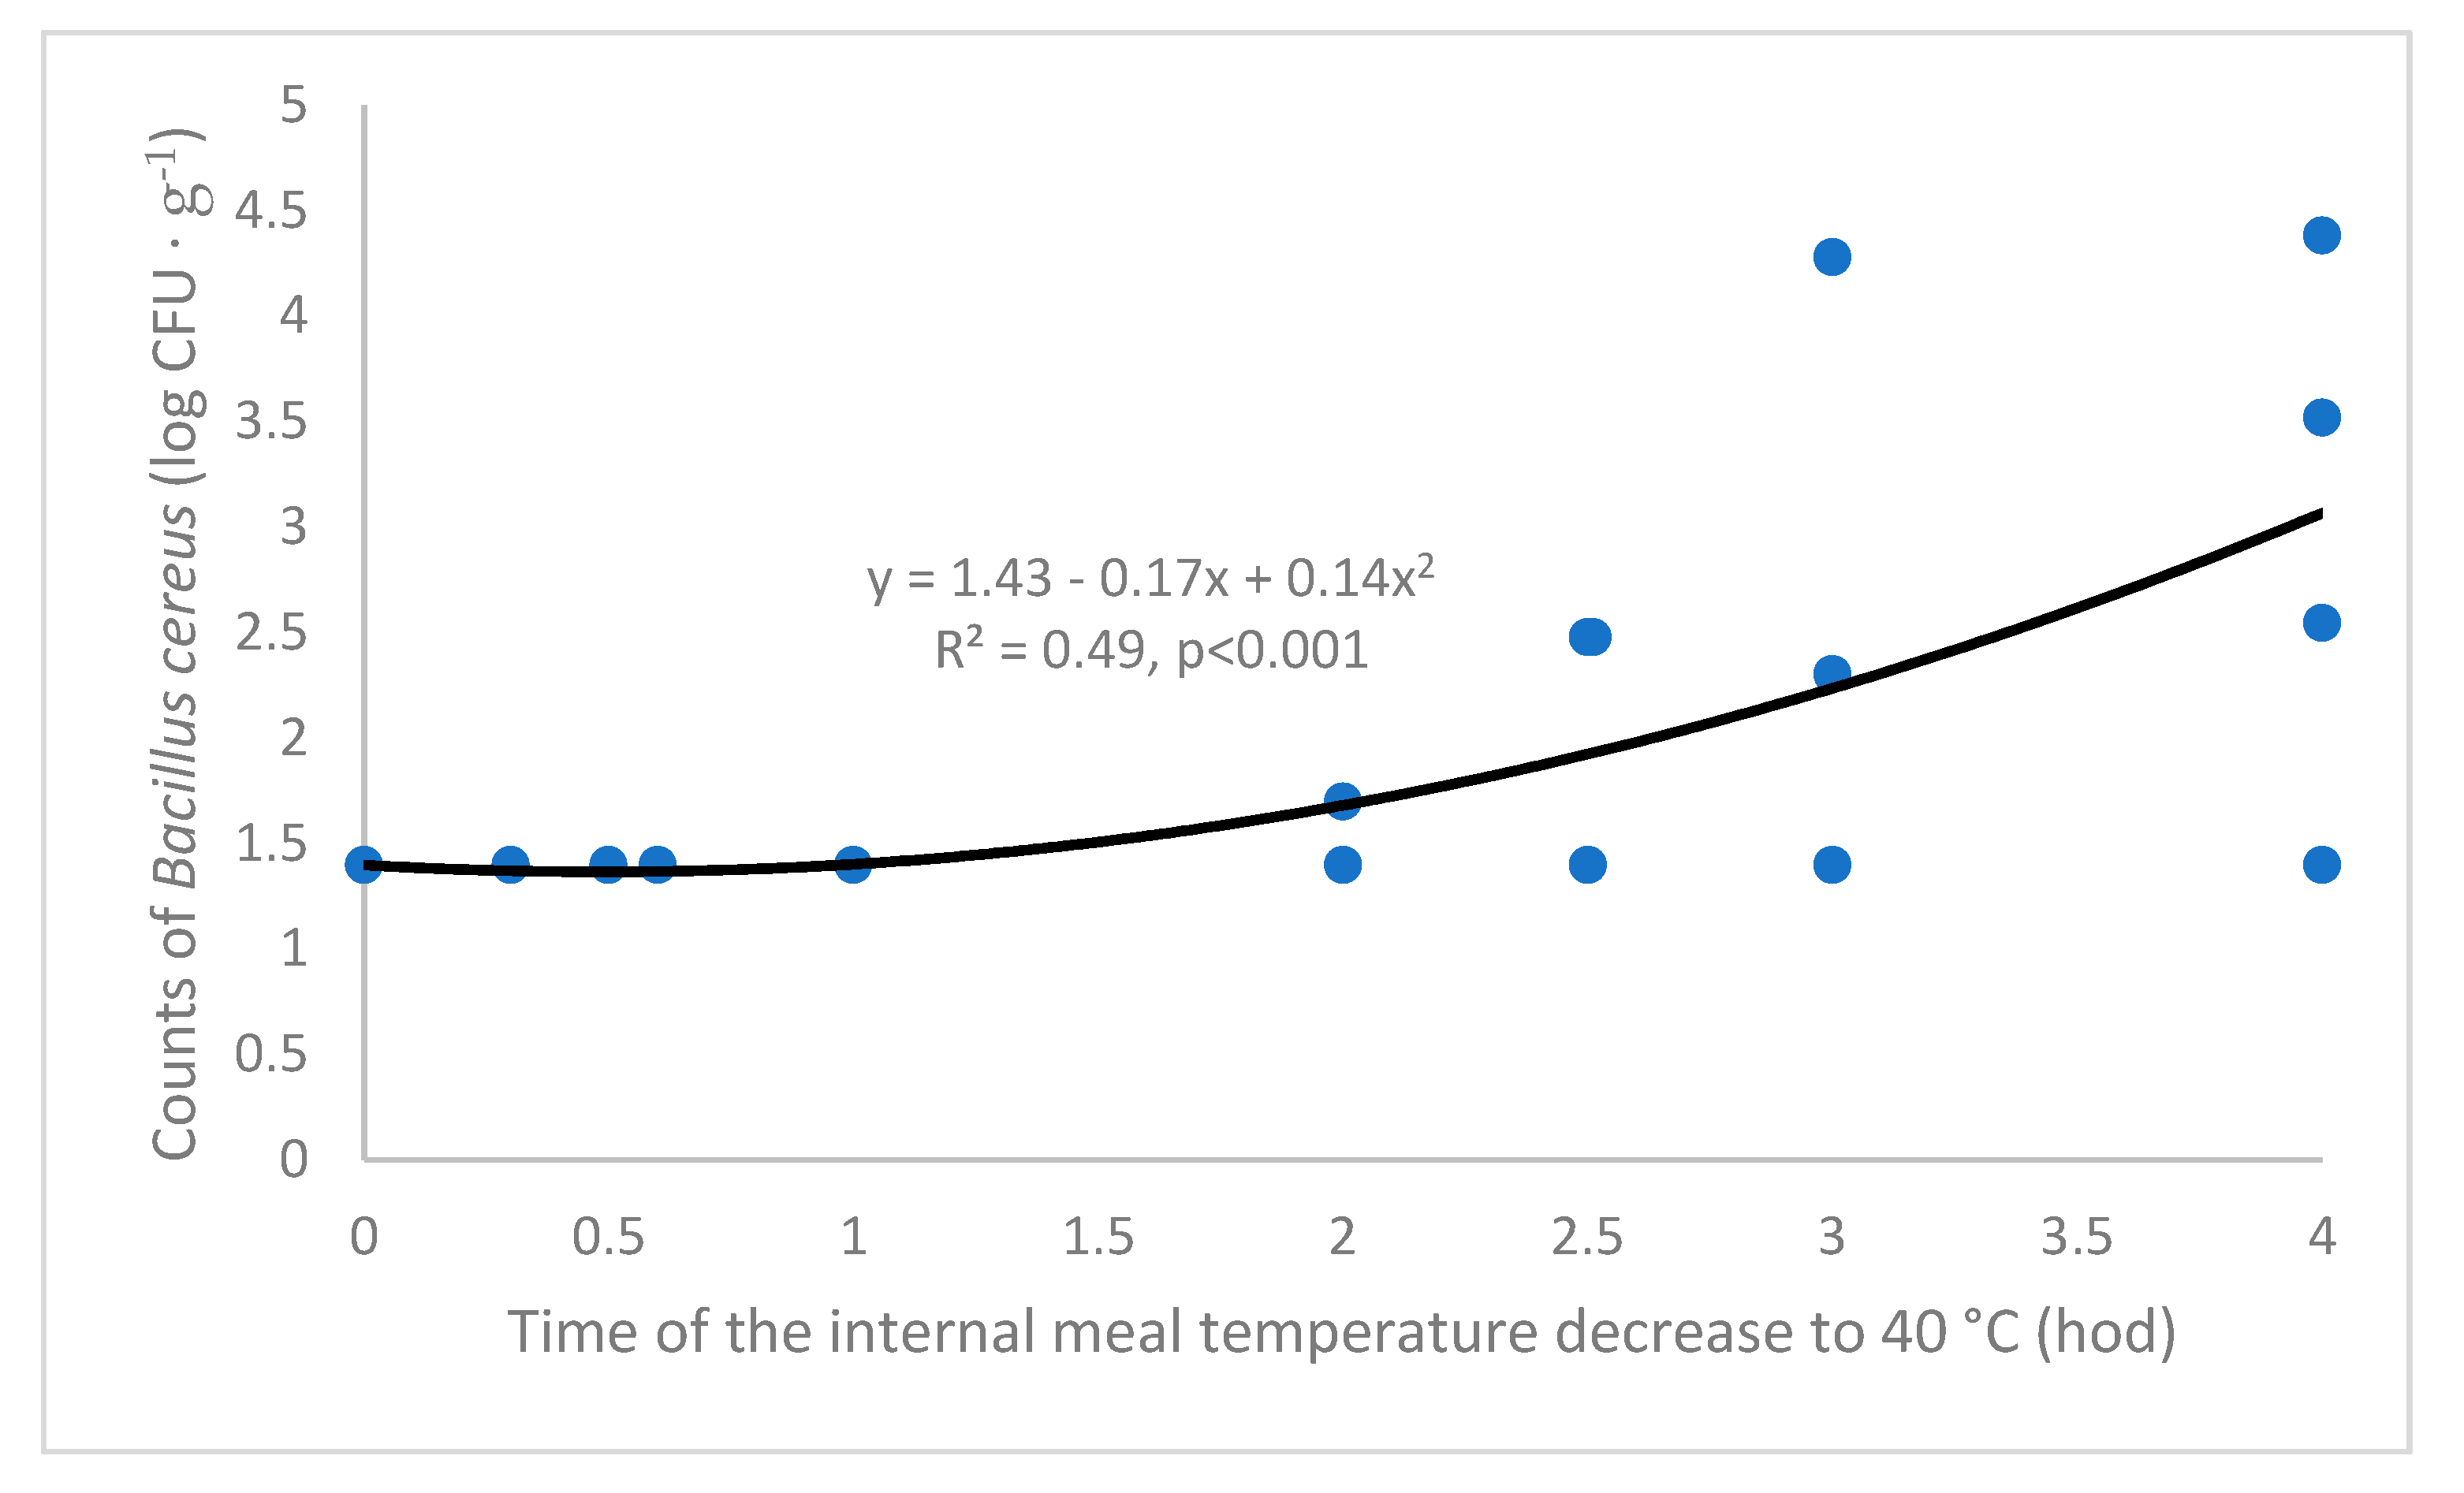
Figure 5.
Counts of Bacillus cereus in the naturally contaminated tested meals after the 4-hour culturing at three different temperatures; A,B – means with different superscripts within a given meal differ at p<0.05; a,b – means with different superscripts within a given culturing temperature differ at p<0.05; Kruskal-Wallis test with post-hoc Nemenyi test (n = 2).
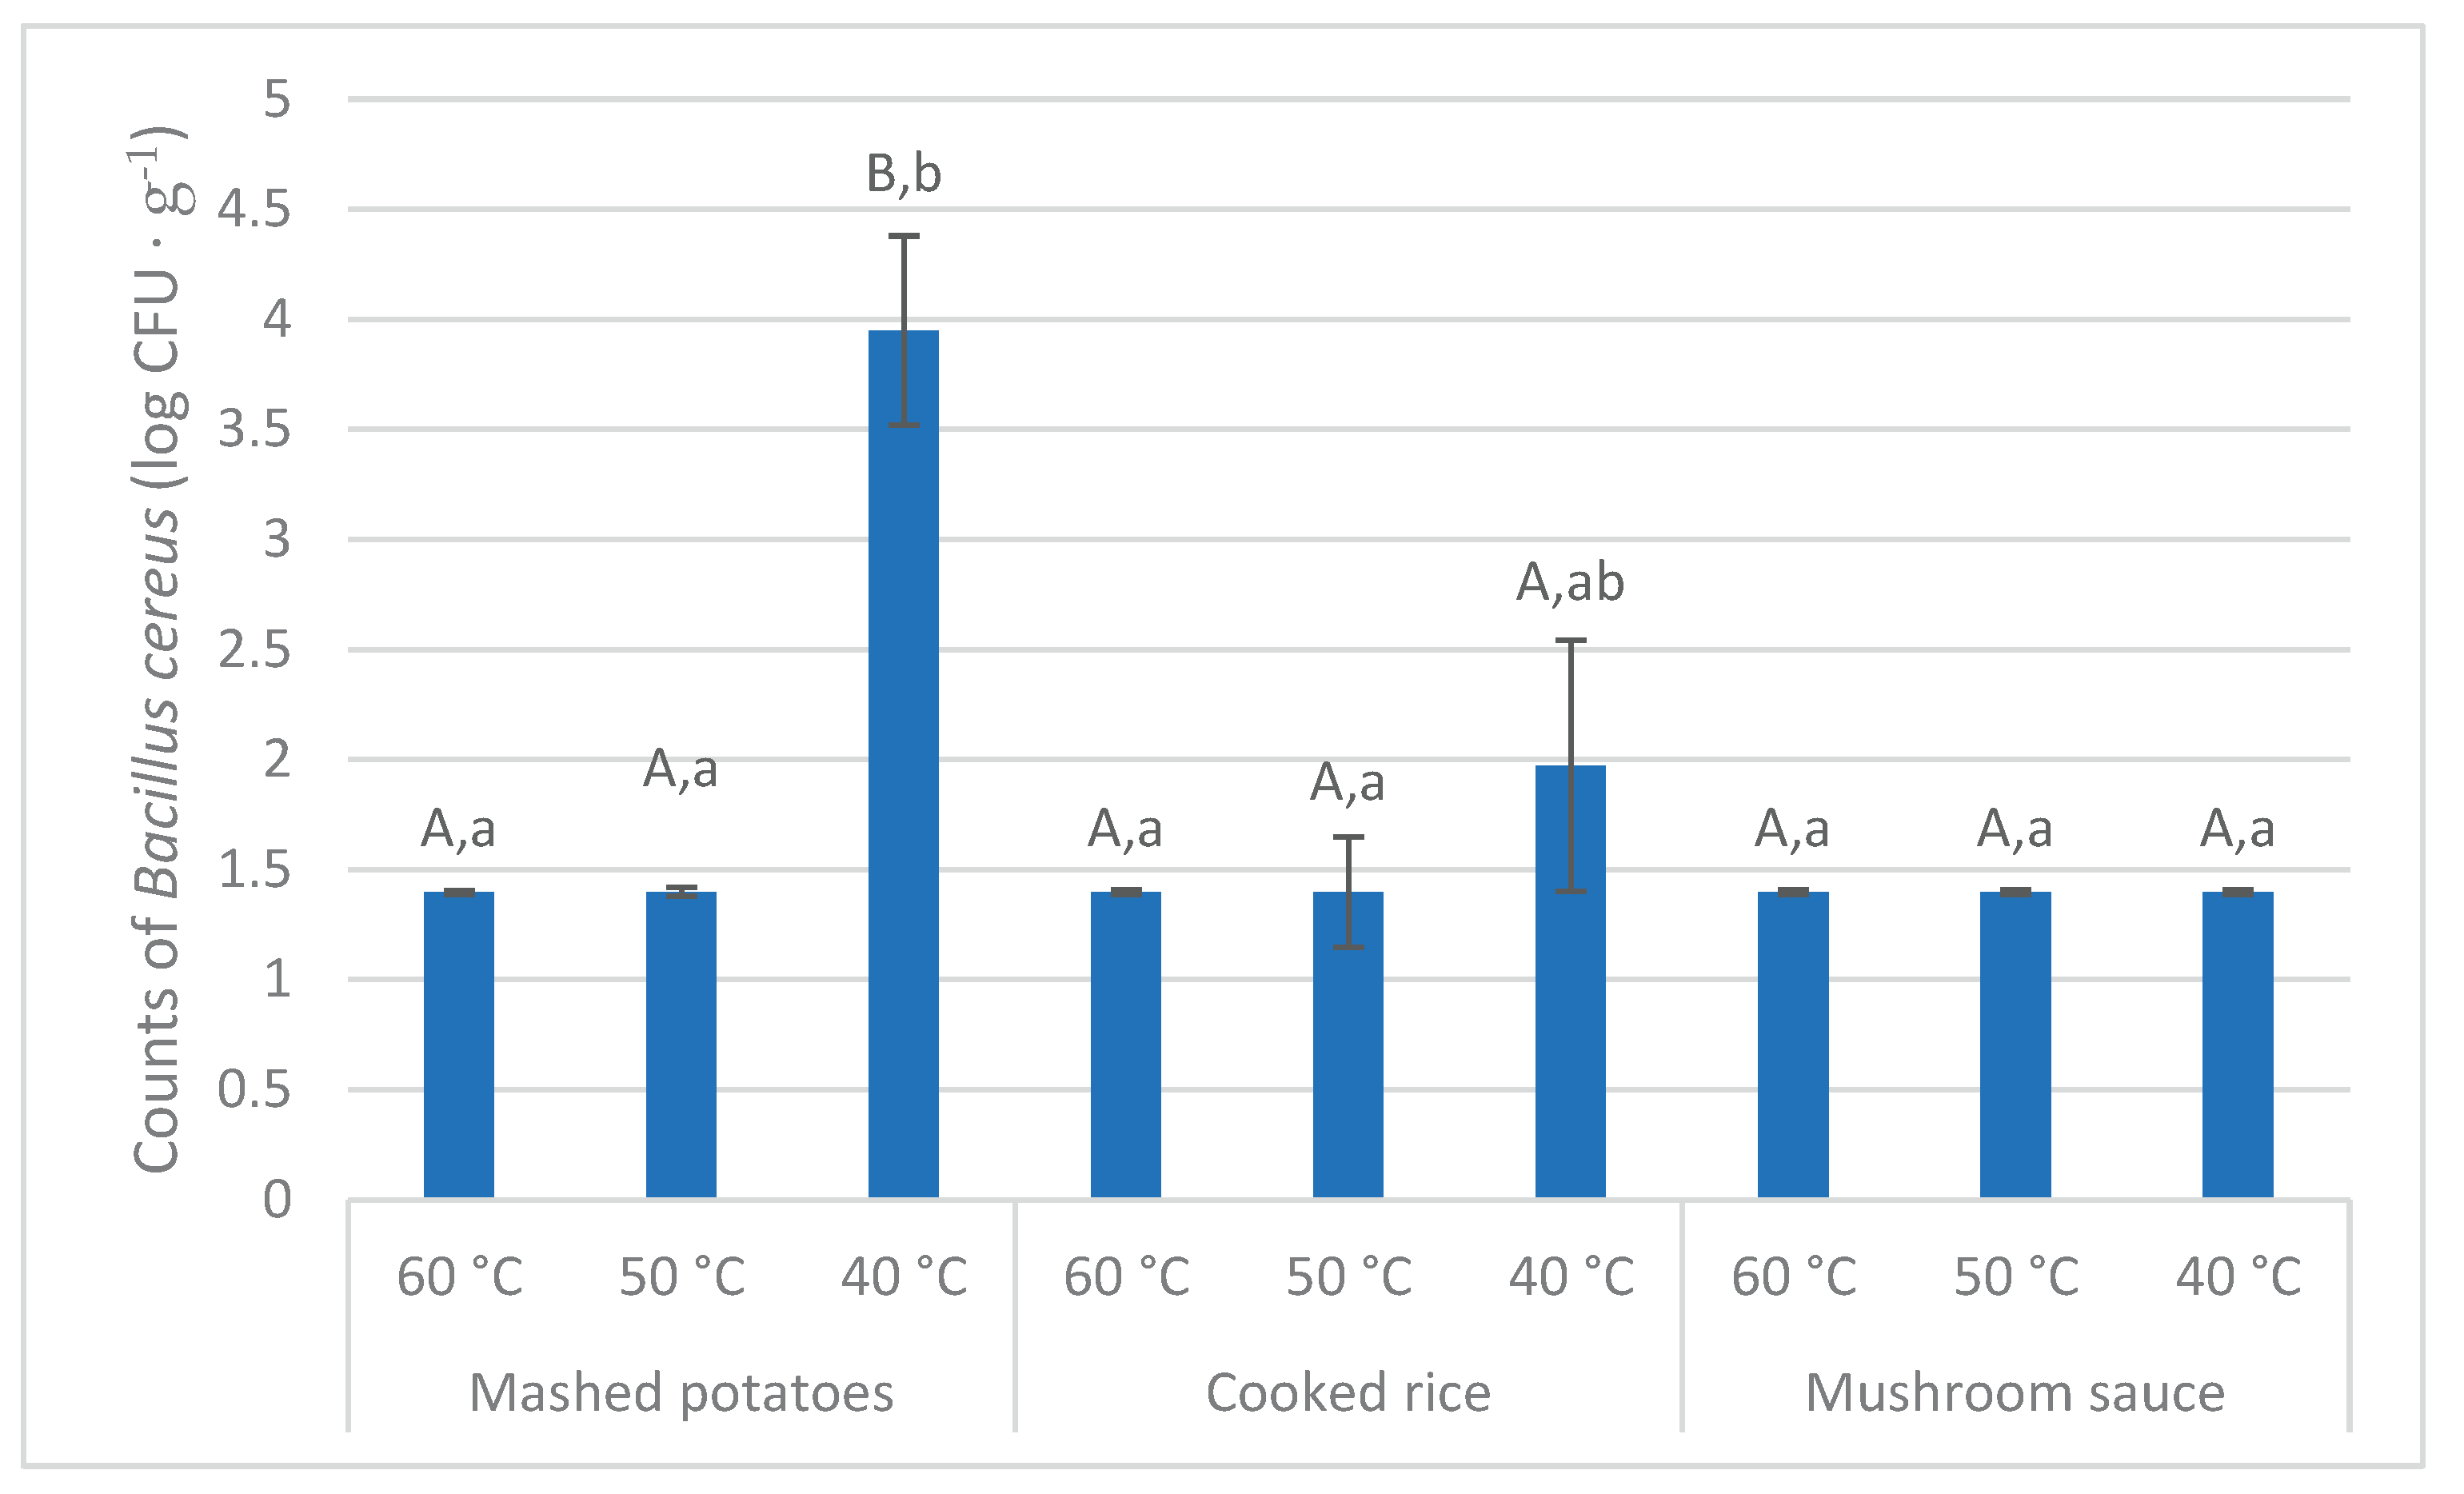

Table 1.
Effect of the tested variability factors on the time interval of the internal dish temperature decrease from an instant when the tray with the tested meal was inserted to the secondary container to the critical value of 40 °C; factorial ANOVA, n = 180 (three dishes [mashed potatoes, cooked rice, mushroom sauce] x five temperature spans [very low: <0 °C; low: 0 – 10 °C; intermediate: 10 – 20 °C; high: 20 – 30 °C; very high: >30 °C] x two primary wrappings [polypropylene tray; sugarcane bagasse tray] x two secondary containers [polyester/polyethylene foam/aluminum foil bag; polypropylene thermobox] x three variants of the number of layers [one layer; three layers; six layers]).
| Effect | Variability (%) | ||
| Total | Explained | p | |
| Dish | 2 | 6 | 0.07 |
| External temperature | 18 | 47 | <0.001 |
| Primary wrapping | 5 | 12 | < 0.001 |
| Secondary container | 3 | 8 | <0.01 |
| Number of layers | 8 | 21 | <0.001 |
| Dish x Secondary container1) | 2 | 6 | 0.03 |
| Residual | 62 | ||
1)the only significant interaction.
Disclaimer/Publisher’s Note: The statements, opinions and data contained in all publications are solely those of the individual author(s) and contributor(s) and not of MDPI and/or the editor(s). MDPI and/or the editor(s) disclaim responsibility for any injury to people or property resulting from any ideas, methods, instructions or products referred to in the content. |
© 2025 by the authors. Licensee MDPI, Basel, Switzerland. This article is an open access article distributed under the terms and conditions of the Creative Commons Attribution (CC BY) license (http://creativecommons.org/licenses/by/4.0/).
Copyright: This open access article is published under a Creative Commons CC BY 4.0 license, which permit the free download, distribution, and reuse, provided that the author and preprint are cited in any reuse.


