Submitted:
16 June 2025
Posted:
18 June 2025
You are already at the latest version
Abstract
This paper examines the relationship between risk management practices and financial performance in the life and non-life insurance companies in South Africa from 2018 to 2024. Data computed from the annual balance sheet statement were constructed in a Panel form using Excel, with the multivariate regression model estimated. The cross-sectional and time-varying nature was analyzed using descriptive and regression analyses to envisage the best linear unbiased estimators. The OLS model yields the best results after checking for residual diagnostics. Findings show that CR is positive and shows a significant relationship with the ROA of the LI and NLI firms in SA. It suggests that directors and managers in this industry are implementing effective CR management strategies to optimize revenue and asset growth. I recommend that, as the LI and the NLI companies continue their operation by issuing a policy to cover risks, policymakers should strengthen the MR management strategies because of their negative effects on ROE.
Keywords:
G32 risk management
; financial risk
; financial performance
; G22 insurance
; C32 panel data model
1. Introduction
Over the years, insurance coverage has been a crucial tool in managing risks within organizations and promoting socio-economic growth, particularly during financial crises, economic hardship, and political tumult worldwide. Both Life Insurance (LI) and Non-Life Insurance (NLI) policies help to mitigate loss, provide financial stability, ensure property safety, and peace of mind during turbulent events. For example, Apergis and Poufinas (2020) state that insurance protection provides multifaceted benefits such as income, mortgage coverage, health benefits, property protection, and other damages. However, Kiptoo et al. (2021) review the global insurance industry performance and conclude that despite some improvement in growth in the US and Europe, the industry is witnessing declining premiums, high underwriting losses, and negative net income, which requires an expeditious Risk management analysis (RM). Recently, Odunaiya et al. (2024) documented the impact of climate change on both the USA and African insurance companies. They identify the specific challenges in both regions. In the USA, insurance companies are faced with extreme Hurricanes, wildfires, and floods, while Africa faces extreme weather events, such as droughts and storms, impacting both agriculture and infrastructure. Recognizing the application of technology, data analytics, and collaboration with climate scientists in mitigating the crises of climate change in the USA economy, the challenges in Africa have not been fully addressed. In this study, I seek to investigate the relationship between RM and FP in the LI and NLI in South Africa (SA), with a particular interest in recommending strategies for improvement.
In 2002, although the SA insurance industry experienced a strong recovery, as indicated by the South African Insurance Industry Survey (SAIS), future contemporary challenges, including emerging risks, populate the insurance industry. The financial statements as of December(s) for the NLI firms indicate that NLI witnessed a -13 million South African Rand (ZAR) Net Profit Before Tax and Dividend (EBTD) with an increase in Net Claim Paid (NCP) of 185,523 million ZAR from 15,590 million in 2021. The LI witnessed a decline in Net Premium (NP) from 165,733 million ZAR to 140,239 million ZAR in 2022. These statistics have continued to increase in 2024, as indicated in the financial statements of NLI experienced a dramatic increase in the NCP of 19,125 million ZAR from 17,559 million ZAR, revealing a growth rate of -8.2 percent. The continuous presence of emerging risk factors, such as climate change, high inflation, and cyber threats, requires a continuous investigation of RM practices in both LI and NLI firms in the world. Therefore, it is evident to investigate the relationship between Risk Management RM and the Financial Performance FP in both the LI and NLI firms in the South African economy. Findings would eventually guide authorities in targeting the Solvency Capital Requirement (SCR) in these firms. Risks are an inevitable element in the insurance business; therefore, RM plays a vital role in insurance companies because the firm’s business model should carefully determine the risk appetite or tolerance level. Hence, an effective Risk Management Framework (RMF) is essential in the SA insurance companies’ guide in identifying, assessing, monitoring, managing, and reporting risk to the Prudent Authority for evaluating their solvency capital requirement targets.
This research expands and brings in the following contributions to RM literature. First, the study adopts the Kiptoo et al. (2021) methodology but varies in how the various risk elements, such as credit risk (CR), operational risk (OP), Liquidity risk (LR), and market risk (MR), are measured. The balance sheet reports provide a high-level overview of insurers’ financial and risk information, which is compiled by aggregating data submitted by registered LI and NLI to the prudential authority. Conversely to previous literature, which investigates risk management practices by risk identification, risk analysis, and supervision. Second, the study examines how these various risks affect the Financial Performance (FP) of both LI and NLI industries. To the best of my knowledge, no study has been carried out that examines how risks affect the LI and NLI companies in Africa. Moreover, limited studies have investigated the relationship between RM and the FP of LI and NLI companies worldwide; hence, it is a critical issue in the global market. Third, the complexity of the South African business landscape amplifies the diverse array of risk factors, which include drunk driving, climate change, flooding, inflation, and regulatory risk. These pose considerable challenges to the LI and NLI firms in South Africa (Wyk et al., 2004). Therefore, addressing this issue might reveal valuable information on how the regulatory authorities can optimize risk-adjusted return and sustainable capital requirements in insurance companies. This study will benefit policymakers in determining how risks are affecting the LI and NLI firms in SA. It would enable them to implement effective risk mitigation strategies.
Fourth, Wyk et al. (2004) also recognize SA as an emerging economy, meaning the country is exposed to a diverse range of challenges in its political, economic, and financial sectors, which can negatively affect shareholders’ investment in LI and NLI companies. Therefore, it is critical to investigate the impact of RM on FP in both LI and NLI firms. To best score the effect and help the authorities in determining the optimal Solvency Capital requirement (SCR) in the industry.
Lastly, in SA, the LI and NLI companies serve as liability protection to firms in other industries against potential losses, hazards, and harm that have the potential impact of wiping out the firm’s operations. Hence, investigating the relationship between RM and FP in the LI and NLI would reveal insightful information, which could yield global investors’ confidence and attractiveness of the SA economy outlook to the world. Nevertheless, this paper seeks to investigate the relationship between RM and FP of LI and NLI firms in SA from 2018 to 2024.
I plan to organize the paper into seven sessions, which include the Introduction, Theoretical Foundation and Empirical literature, (4) Risk Management Framework; (5) Methodology and Data Analysis; (6) Interpretation and Conclusion; (7) Limitations and suggestions for further inquiry.
1.1. Life and Non-Life Insurance Sector in South Africa
Generally, SA is well recognized for having some of Africa’s largest and most competitive insurance sectors (IMF, 2022). After Apartheid, the government of SA embarked on more liberal economic policies, which led to the high penetration of insurance products. Its insurance sector has potentially increased and contributed over 18 percent of its financial sector (IMF,2022). Mordor Intelligence (MI) indicates that SA’s NLI has a market capitalization of USD 5.1 million. Wyk et al. (2004) classify SA as among the top 10 leading emerging markets with an advanced business environment. There is a well-advanced infrastructure, regulatory framework, and financial sector. Yet, risk still prevails in the SA business environment (Wyk et al., 2004). Although the country has witnessed an unprecedented political and economic transformation, its major NLI companies, such as Santam Ltd., Hollard Insurance Company Ltd., Zurich Insurance Company South Africa Ltd., Old Mutual Insure Ltd., and Bryte Insurance Company Ltd., are exposed to the sophisticated nature of risks (MI, 2023). Therefore, it is paramount to investigate the risk-return profile of the LI and NLI companies. In this study, the RM framework and financial matrices are analyzed to determine the influence of RM practices on the profitability of LI and NLI companies in SA. RM is a complex process. It involves risk identification, assessment, management, and monitoring both internal and external opportunities, and also threat factors in the organization (Wyk et al., 2004). Despite the huge body of literature on the relationship between RM and the insurer’s profitability, not much has been done in the LI and NLI firms, especially in SA.
In early 2024, the LI and NLI markets in SA experienced rapid growth due to key factors, including increased urbanization, expansion of the middle class, and the SA Prudential Authority’s (PA) strategic improvement in risk awareness. The insurance industry plays an inevitable role in the economy by providing coverage for damaged properties and income protection for death, burial planning. For example, Old Mutual, Sanlam, and Liberty are the giant companies dominating the market. These companies provide coverage for burial insurance, education plans, and retirement annuities, which help with financial stability and alleviate poverty to meet the rising consumer demand. According to the report of the South African Life and Non-Life Insurance Market Overview, this tremendous expansion of the LI and NLI market cannot be guaranteed in an environment poisoned with a high crime rate, poor socioeconomic conditions, and other risk-related factors.
1.2. Insurance Regulatory Authorities
The constant rise of fraudulent activities, cybercrime, political tensions, and a sudden surge of deadly diseases prompts the formation and persistence evaluation of regulatory policies in the insurance industry. For instance, in the USA, the National Association of Insurance Commissioners (NAIC), while in Europe, the European Insurance and Occupational Pension Authority (EIOPA) was introduced to supervise and regulate insurance industry rules. In SA, the Prudential Authority (PA) and Financial Sector Conduct Authority (FA) set standards and regulate the insurance industry
2. Theoretical Foundation
Like Kiptoo et al. (2021), I deploy credit risk theory, modern portfolio theory, Keynesian liquidity theory, and resource-based theory as concepts related to RM in organizational structures.
In this study, I describe Merton’s (1974) model as relevant in credit risk measurement. This model reveals the likelihood of a doctor’s inability to respect the debt obligations. It measures the value of the company’s assets relative to its debt values. A firm might default on its debt obligation if its asset value cannot cover the total debt value. In this study, credit risk is proxied as mortgage and loans divided by total assets because it captures the financial obligation of the LI and the NLI firms over the value of the invested assets of the firms. If the value is high, it indicates that many of the company’s assets are tight up in lending, thus, high exposure to credit risk.
The Modern Portfolio Theory (MPT): In 1950, the MPT was introduced by the Economist
Harry Markowitz and William Sharp. This concept reveals that the expected return of all assets in a portfolio is associated with a certain level of risk. This theory, commonly known as the Capital Asset Pricing Model (CAPM), enhances the fiduciary obligation of investment advisors in portfolio construction. The exposure of the portfolio has been greatly affected by market risk, which effects can be mitigated through a diversified portfolio. Kippoo et al.’s (2021) study indicates how insurance firms can manage their portfolio for a given level of market risk.
The Keynesian Liquidity Theory. In 1929, following the great depression, John Maynard Keynes introduced the Liquidity Theory. A concept rooted in the reasons for holding money. According to Keynes, there are three motives for holding liquid assets in a firm due to precautionary, transactional, and speculative. Liquid as a precautionary motive helps the firm address short-term and long-term uncertainties in its environment. Liquid in the speculative form is geared toward future investment opportunities, whereas transitionary is for the day-to-day operational activities of the firm.
Resource-Based Theory: This ideology suggests that a firm’s competitive advantage is fueled by its internal resources and effective asset management. It guides managers in implementing strategic resource management. Tangible and intangible resources are unique treasures in a firm’s capability and should be strategically managed to gain a high comparative advantage in the industry. In this study, I investigated the effect of operational costs on the firm’s performance.
3. Literature Review and Risk Management Framework
The top-cited empirical RM literature and financial performance in insurance industries in the developed and developing world have revealed the importance of efficient RM practices in insurance companies. In the USA, Hoyt and Liebenberg (2008) find that an effective RMF has a positive impact on the value of insurance firms. Moreover, Liedberg and Seifert (2015) document that the introduction of Solvency Capital II by the European Union (EU) to support the ongoing process of risk-based capital requirements in insurance companies was not necessary in the USA because the NAIC has instituted a strong risk-based solvency level in insurance firms. Eckles et al. (2014) establish a strong correlation between RMF and operating profit (ROA) in insurance companies.
In Europe, studies have revealed the usefulness of RM in insurance companies. For example, Noja et al. (2021) use the ROA and ROE to evaluate how RM and Solvency II can affect the insurance firms’ performance in European Mediterranean Countries. Findings reveal that though RM has a significant impact on FP of insurance firms, the introduction of Solvency II Led to a decline of both ROA and ROE, which signifies an inadequate use of investor funds.
Jurdi and Alghaimat (2021) conclude that the effective RMF increases the premium level of insurance firms in European countries. Contrarily, Gonzalez et al. (2020) determine that RM has no positive relationship with the FP of Spanish-listed Insurance companies. The authors measure FP using ROA, ROE, and Tobin Q, and apply a Regression Analysis Technique (RAT) to determine the relationship between RM and FP. In Asian countries, studies divulge the high need for effective RM practices in the insurance industry. Wani and Dar (2015) determine that the RM variables, such as capital management risk, solvency risk, liquidity risk, and volume of capital, are the most significant factors in the FP of LI companies in India. The ROA is statistically insignificant with the underwriting risks. Zainudin et al. (2018) find that volume of capital, the size of the firm, and the underwriting risk are critical components affecting the profitability of life insurance in China, Hong Kong, Taiwan, Singapore, Japan, South Korea, Thailand, and Malaysia from 2008 to 2014. Additionally, examining the financial health of LI and NLI companies in Asian with the use of different financial performance metrics, Chen and Wong (2004) determine that liquidity risk, market risks (investment performance), and firm size are affecting the firm’s financial health proportionately in the NLI companies in Asian countries. It reveals that insurance firms in different regions are affected differently by the same risk companies. In the context of Africa, very few studies have examined RM and FP in LI and NLI companies. In SA, Governor and Hassan-Bootha (2022) adopt a regression technique to investigate the relationship between RM and ethical standards in insurance firms because of the perspective that good corporate governance is associated with high firm values. Findings reveal that the level of ethical standards in insurance companies is not in compliance with the optimal ethical standard of the regulatory framework. Similarly, Fondem and Luo’s (2022) assertion about how weak corporate governance practices will result in poor ethical standards in firms and organizations. Saka and Abere (2022) examine the adoption and implementation of RM in ten listed insurance companies within the Nigerian Stock Exchange Market (SEM) and find that RM has no significant financial impact on the Nigerian-listed insurance companies. According to these authors, the failure of RM stems from poor accountability and monitoring systems. Sake and Abere (2022) find no relationship between RM and the earnings per share, ROA, and ROE in Nigerian insurance companies.
In Kenya, a study determines a significant positive relationship between RM and FP in 51 insurance companies (Kiptoo et al., 2021). The credit risk is negatively and significantly associated with FP in Kenya’s insurance industry.
However, this study will eventually contribute to the large body of literature by determining the relationship between ERM and profitability in the LI and NLI companies in South Africa.
3.1. Hypotheses
- H0: There is no significant positive relationship between RM and ROA of the LI and NLI firms in SA.
- H0 There is no significant positive relationship between RM and ROE of the LI and NLI firms in SA.
- H0: There is no significant positive relationship between RM and Loss Ratio of LI and NLI firms in SA.
3.2. Variables Expectation
- ❖
- Credit risk is expected to have a significantly negative relationship with financial performance because the likelihood of high credit risk is associated with high financial loss due to poor credit management and the debtor’s inability to pay the loan. For instance, Kiptoo et al. (2021) determine a negative association of credit risk with FP on insurance firms in Kenya. Hence, appropriate debt and asset management practices are relevant factors in determining the optimal SCR in insurance companies. In this study, credit risk is proxied as mortgage and loan to total assets because high values indicate that a great portion of the company’s assets are tied to credit risks.
- ❖
- Operational risk is expected to positively and significantly affect the FP of LI and NLI companies in South Africa. It signifies that effective management of the firm’s operational activities is associated with high value creation due to optimal cost management strategies, such as low underwriting risk premiums.
- ❖
- Liquidity risk is expected to positively and significantly affect the FP of the LI and NLI insurance companies because theoretical models indicate that proper liquidity management means a high proportion of current assets to liabilities, which is a recipe for a firm’s financial performance.
- ❖
- Market risk is expected to positively and significantly affect the FP of LI and NLI insurance companies in SA. Theoretically, good investment allocation will result in high investment income and high financial performance.
3.3. Risk Management Framework
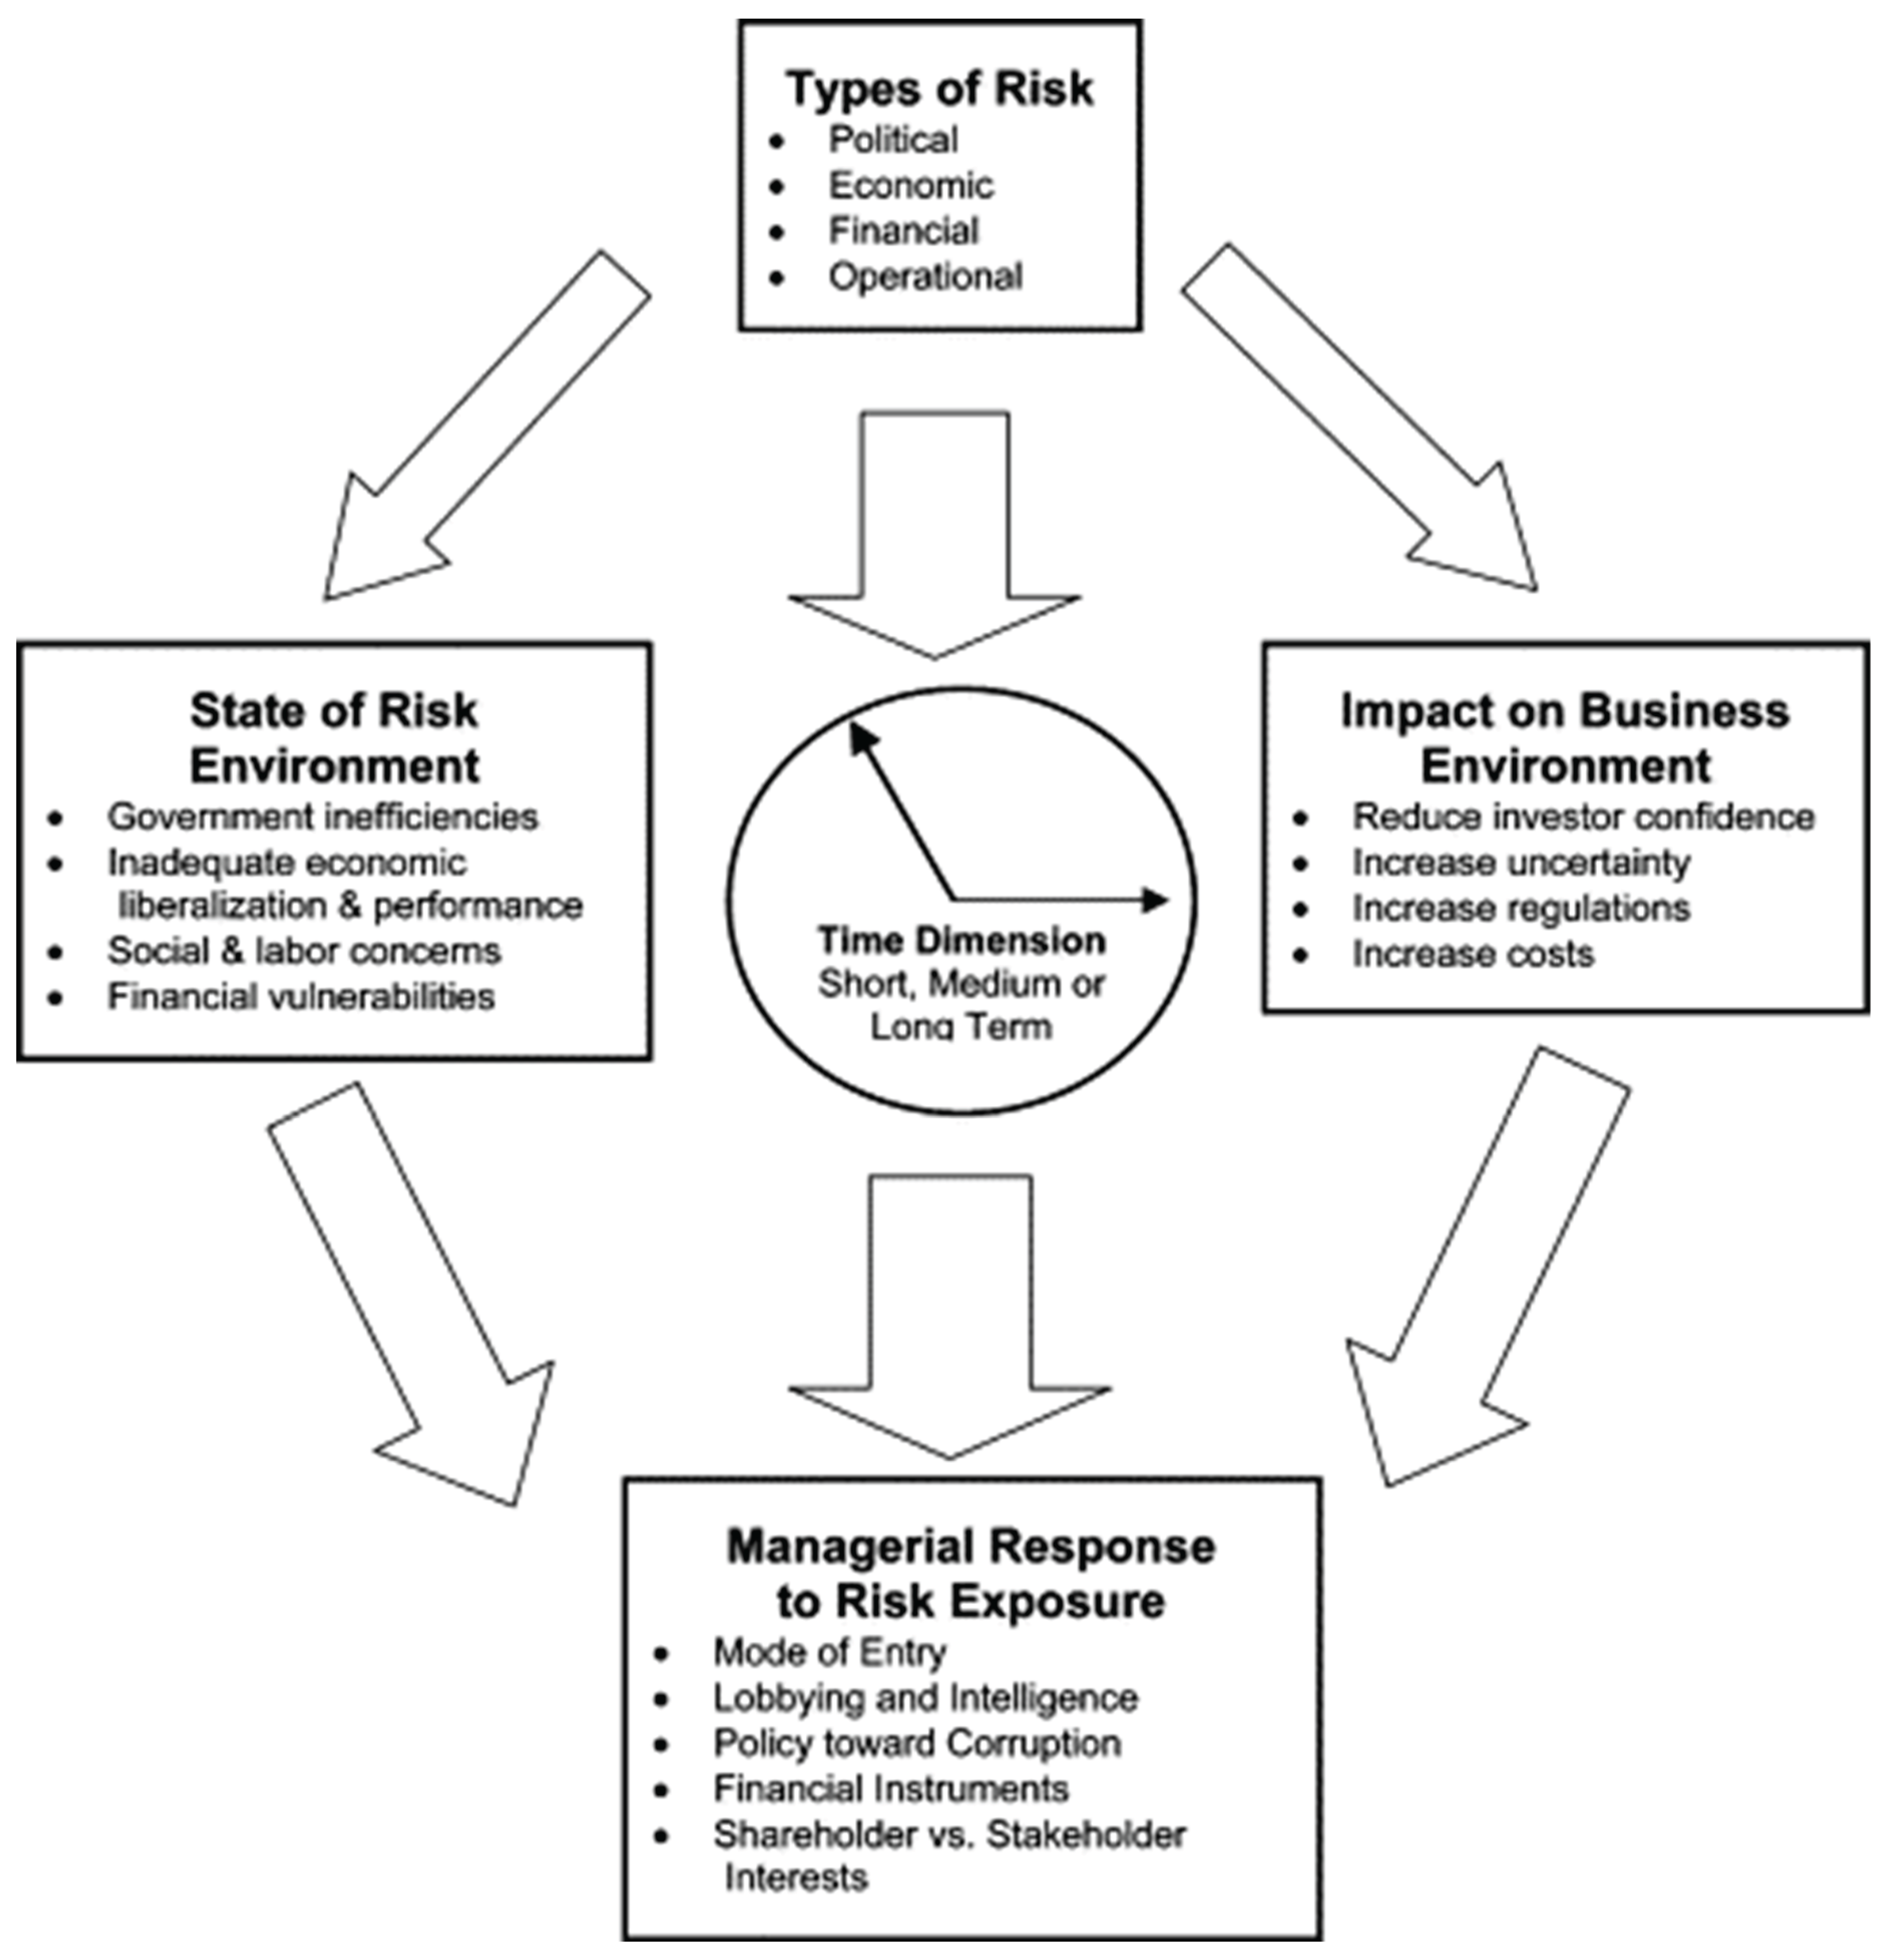
These authors classify risk factors into four different frameworks, which include political, economic, financial, and operational. From the above model, Wyk et al. (2004) define the frameworks as follows.
- Political risks refer to government policies and societal instabilities such as conflicts, social tension, and wars that adversely affect the general business environment.
- Economic risks refer to the general condition and structure of a country’s macro-economy, such as inflation, COVID-19, and seasonal fluctuation.
- Financial risks refer to interest rate risk and foreign exchange risk, and an underdeveloped financial market in a country’s government and central bank. It is reflected in the value of a country’s currency.
- Operational risks such as employee issues, credit uncertainties, and supply chain distortions are among the firm-specific risk factors affecting the goals and objectives of the firms.
Wyk et al. (2004) theoretically support the need for an effective ERM strategy in the SA business environment. They assert that Porter’s five forces framework—encompassing competitive rivalry, supplier power, buyer power, the threat of substitution, and the threat of new entry—falls short in comprehensively envisioning all pertinent firm-specific risk factors. These authors argue that the model predominantly concentrates on systematic risk factors. Likewise, the PESTEL model, which encompasses risk factors in political, economic, social, technological, environmental, and legal domains, primarily addresses systematic risk rather than nonsystematic risk. Thus, it will be problematic for firms or organizations to use these models for their effective cost-management strategy.
Figure.
Source: Wyk, et al. (2004).
4. Methodology and Data Analysis
To achieve the research objective, the positive research design approach will be deployed. RM components include liquidity risk, credit risk, market risk, and operational risk, which are computed from the financial statements of the LI and NLI firms. The study applies to the Multivariate Regression Model (MRM) because the ROA and ROE are the dependent variables. It assumes the linear relationship of variables in the specific econometric model.
4.1. The Econometric Framework of the Multivariate Regression Model
dependent variables such as ROA of LI and NLI, which are denoted as firm (i) over time t
dependent variables such as ROE of LI and NLI, which are denoted as firm (i) over time t
dependent variables such as LOSSR of LI and NLI, which are denoted as firm (i) over time
The vectors of the metric of risk factors, such as liquidity risk, market risk, operational risk, and credit risk of the LI and NLI firms
It is the vector coefficient of metric that indicates the estimate of parameters in the model.
Specifically, the following multivariate linear regression model is constructed to investigate the relationship between RM and FP of the LI and NLI firms in SA from 2018 to 2024. A similar model has been constructed by Soladoye et al. (2024) when investigating how RM influences an Insurance Company’s profitability in Nigeria.
Where? Financial performance metrics are.
4.2. Definition of Variables in Models
- ROA is the return on assets, which is computed as EBTD divided by the total assets of both the LI and NLI firms. This variable is less aggressive in measuring financial performance because the percentage contribution of assets in the profitability indicators is without the deduction of tax and dividends.
- ROE is the return on Equity, which is computed as EBTD divided by the shareholders’ equity (Basic own funds). I deduct the shareholder equity from the financial statements by calculating Total assets minus total liabilities in the LI and NLI statements.
- LR is a liquidity risk, which is proxied as the ratio of cash deposited to gross technical provision of both the LI and NLI firms in SA. If the ratios are high, it indicates a low liquidity risk. If the ratios are low, it indicates a high liquidity risk. The gross technical provision is the portion of money the LI and NLI firms allocate to address future financial obligations to policyholders. Understanding the effect of LR on FP in the LI and NLI firms would help regulatory authorities to determine the minimum liquidity standards to ensure they hold sufficient funds to meet their obligations.
- CR is credit risk, which is measured as mortgages and loans to total assets of the LI and NLI firms. According to the European Central Bank report, this indicator can measure the credit risk of both banking and insurance firms. Using the mortgage and loans to total assets indicates that a high ratio reveals a high percentage of the firm’s assets are allocated to credit risk. It would inform the managers in the insurance firms that there is inefficient management of the firm’s assets. Similarly, Altman and Saunders (1997) use individual loans, a portfolio of loans, and factors affecting mortality risk in evaluating the level of credit risk in a firm. In assessing the risk and return of the loan portfolio, the firm can determine the level of credit risk embedded in the portfolio.
- OP is operational risk, which is proxied as the ratio of NP to total assets because the magnitude of premiums the firm collects to the total assets is an effective indicator of the size of its operations. Therefore, this variable could indicate the LI and NLI industries’ exposure to operational risks. According to the International Association of Insurance Supervisors (IAIS), this indicator is important in measuring operational risk.
- MR is the market risk variable, which is proxied as total investment to investment income. Although it might not directly capture all the systemic risk in the insurance markets, this variable is reliable to measure the exposure of the LI and NLI firm investment portfolio to the global market risks. Therefore, in a Bull Market condition, the portfolio return will increase, whereas in a Bear market condition, the portfolio value will fall.
- is the stochastic error term
4.3. Data
I obtained the financial statements from the SA Reserve Bank database from 2018 to 2024. The period captures significant risk factors in the insurance industry in both developing and developed economies. The data was constructed into a long panel data framework in which the following regression model techniques, including descriptive statistics, correlations, and regression analyses, were performed. As such, the results will provide insightful information to policymakers in the ongoing effort for regulatory policies for the SA P&C insurance companies. Precisely, the ERM is proxied as the size of the liquidity risk (LR), credit risk (CR), financial risk, age of the firm AG, and Operational risk (OR). The financial performance metrics are ROA, ROE,
To develop the multiple regression model, I adopt a similar model developed by
To examine the correlation between ERM and the performance of the LI and NLI insurers in South Africa, I designate the dependent variables as ROA and ROE, while the independent variables are LR, OPR, CRS, and MR
5. Mathematical Framework of Risk Management in an Insurance Firm
This study investigates the relationship between RM and FP of LI and NLI firms in an emerging market. Adopting a mathematical and statistical approach, it becomes clear for organizations to quantify and evaluate risks based on their ongoing business objectives. Firstly, RMF starts with identification, assessment, management, evaluation, monitoring, and reporting of both internal and external risk factors exposed to the firm. In the LI and NLI companies,
Risk-Adjusted Return on Capital (RAROC)
In the late 1970s, Banker Trust formulated the first ever modern risk management model, commonly known as the Risk-Adjusted Return on Capital (RAROC). It accounts for any potential losses and cash generated by the total capital invested in the firm. RAROC is a quantitative model that measures the investment return of a business relative to the total risk taken. This quantitative framework was adopted to mathematically illustrate the effect of credit risk, market risk, operational risk, and liquidity risk on the ROA and ROE of the LI and NLI firms in SA.
RAROC= Risk-Adjusted Return
Economic Capital
Risk-Adjusted Return = Net Profit before tax and Dividend- (Credit risk, operational risk, market risk, and liquidity risk)
The economic Capital requirement consists of the shareholder capital and the regulatory capital requirement of the SA Prudent Authority regulatory board, which includes the Solvency Capital level and minimum capital requirement considered capable of mitigating risk factors in the industry.
6. Empirical Results: Interpretation and Conclusion
Table 1 shows the descriptive statistics of the multivariate regression equations. The dependent variables are ROE and ROA, while the independent variables are OP, MR, LR, and CR. The data was collected from the South African Reserve Bank database (SARB), and variables are measured in millions of the SA Rand (ZAR). The total number of observations is 14. Looking at the FP variables, ROE and ROA have a mean score of 0.045 and 0.0117, indicating low financial performance. Specifically, OP and CR have a mean score of 0.085, 0.017, respectively, and indicate low operational risk and credit risk. It signified that management is implementing stringent RM strategies in both LI and NLI companies in SA. However, the MR and LR mean scores of 27.84 and 0.23 are relatively high, showing that the LI and NLI are more exposed to MR and LR.
Table 2 indicates the Pearson correlation table, which illustrates the relationship between the dependent and the independent variables in the models. This study seeks to provide answers to the following hypotheses:
- H0: There is no significant positive relationship between RM and ROA of the LI and NLI firms in SA.
- H0 There is no significant positive relationship between RM and ROE of the LI and NLI firms in SA.
Although the Pearson correlation test is the preliminary test for the relationship among variables in a Panel data, it serves as an important indication of the likelihood of a relationship among existing variables. From Table 2, there exists a negative relationship between OP and ROE, MR and ROE, and LR and ROE. Conversely, CR has a positive relationship with ROE. Concerning ROA, OP, MR, and LR are all positive with ROA. However, CR has a negative relationship with ROA. Nevertheless, because of the heterogeneity that could be present among the different cross-sections (LI and NLI), I conduct the Pool ordinary Least Squares (OLS) and Fixed effect model, and Generalized Linear regression (GLR) to investigate the relationship between FP and RM in the SA insurance industry. The GLR Random effects estimation requires that the number of cross-sections be greater than the number of estimated coefficients in the model.
Table 3: Pooled OLS Model. The assumption in the pooled OLS is that there is no heterogeneity or individual effect within the cross-section. There is a fixed intercept and constant slope between the LI and NLI firms. The Pooled OLS results show that CR, measured as mortgage and loans to total assets, typically represent the LI and the NLI companies’ total assets investment in debt instruments. The CR has a significant positive relationship with the ROA at a p-value of 5%. The results are similar to the findings of Madugu et al. (2020), who show a positive and significant effect of CR on profitability in the banking sector in Ghana. It reveals that from 2018 to 2024, there is effective CR management by the LI and NLI companies in SA. Both the R-squared and adjusted R-squared values of 74% and 59% indicate a substantial explanatory power of the independent variables on the dependent variable.
The other independent variables, such as OP, LR, and MR, have a positive but insignificant relationship with ROA. However, the Pooled OLS results can be efficient and the best linear unbiased estimator if there is no endogeneity in the model. The Durbin-Watson test statistic of 2 lies between the acceptable range of 1.5 and 2, indicating no autocorrelation in the model. Therefore, I conduct the Breusch-Pagan test to check if there is a cross-sectional effect or time-varying effect.

Table 4.
Brusch-Pegan Test Results. H0: No effects; H1: Two-sided (Breusch-Pagan) and one-sided; (all others) alternatives.
Table 4.
Brusch-Pegan Test Results. H0: No effects; H1: Two-sided (Breusch-Pagan) and one-sided; (all others) alternatives.
| Test Hypothesis | Both | ||
| Cross-section Time | |||
| Breusch-Pagan | 1.165388 | 0.485425 | 1.650813 |
| (0.2804) | (0.4860) | (0.1988) | |
| Honda | -1.079531 | -0.696725 | -1.256003 |
| (0.8598) | (0.7570) | (0.8954) | |
| King-Wu | -1.079531 | -0.696725 | -1.262789 |
| (0.8598) | (0.7570) | (0.8967) | |
| Standardized Honda | -0.800241 | -0.915151 | -4.830455 |
| (0.7882) | (0.8199) | (1.0000) | |
| Standardized King-Wu | -0.800241 | -0.915151 | -6.499994 |
| (0.7882) | (0.8199) | (1.0000) | |
| Gourieroux, et al. | -- | -- | 0.000000 (1.0000) |
Output test Data regression panel Brusch-Pegan with Eviews. P-value in parentheses *P<0.05, **P<0.01, and ***P<0.001.
The results of the Breusch-Pagan test statistics indicate that for both cross-section and time, there is no significant effect. It means both fixed effects and random effects are not necessary because there is no cross-sectional effect and time-varying effect in the model. Hence, the Pooled OLS is the appropriate model. To confirm the robustness of the Pooled OLS results, the fixed effect model is estimated. The fixed effect results are identical to the Pooled OLS. This is because there is no variation across the groups (LI and NLI). Therefore, the fixed effect model, which focuses on the panel variation, yields similar results to the pooled OLS, which mainly analyzes the entire variation in the data.
Table 5 shows the results of the fixed-effect model, which is closely similar to the Pooled OLS, confirming the robustness of the Pooled OLS results. However, CR has a positive but weak, significant relationship with ROA.
Table 6 shows the result of the Pooled OLS for ROE. This study examines the impact of MR, OP, LR, and CR on FP (ROE) on the LI and NLI companies in SA. Results displayed in Table 6 show that MR, OP, LR, and CR do not have a significant relationship with ROE. Based on these results, it is recommended that the LI and NLI companies in SA should continue with the RM strategies and pay close attention to MR because it has a negative relationship with ROE, even though it is not significant. Following the rule of thumb, the accepted Durbin-Watson test statistic should be between 1.5 to 2.0. From the results, there is no evidence of autocorrelation in the model.
The R-squared is 34.74%, indicating that the MR, OP, LR, and CR contributed 34.74% of ROE in the LI and NLI companies.
Table 7.
Brusch-Pegan Test Results. H0: No effects; H1: Two-sided (Breusch-Pagan) and one-sided; (all others) alternatives.
Table 7.
Brusch-Pegan Test Results. H0: No effects; H1: Two-sided (Breusch-Pagan) and one-sided; (all others) alternatives.
| Test Hypothesis | Both | ||
| Cross-section Time | |||
| Breusch-Pagan | 1.154038 | 0.884438 | 2.038476 |
| (0.2827) | (0.3470) | (0.1534) | |
| Honda | -1.074262 | -0.940446 | -1.424613 |
| (0.8586) | (0.8265) | (0.9229) | |
| King-Wu | -1.074262 | -0.940446 | -1.350028 |
| (0.8586) | (0.8265) | (0.9115) | |
| Standardized Honda | -0.542901 | -1.169727 | -5.079855 |
| (0.7064) | (0.8789) | (1.0000) | |
| Standardized King-Wu | -0.542901 | -1.169727 | -6.741672 |
| (0.7064) | (0.8789) | (1.0000) | |
| Gourieroux, et al. | -- | -- | 0.000000 (1.0000) |
Output test Data regression panel Brusch-Pegan with Eviews. P-value in parentheses *P<0.05, **P<0.01, and ***P<0.00.
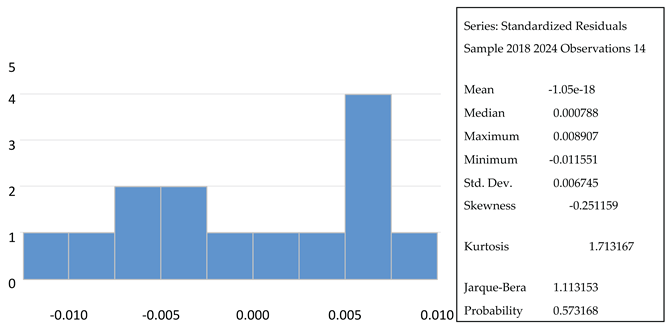
Both Table 8 and Figure 1 provide useful information on the reliability of the regression analyses. Based on the P-value of 5% level of significance, the results indicate that the null hypothesis of normality of the residual error terms cannot be rejected in both the Breusch-Pagan and Histogram normality tests in the regression model with dependent variables ROA and ROE. Therefore, I confirm the normality of the error term at a 5% significance level. Although the sample size is from 2018 to 2024, the results obtained suggest that during this period, the SCL adopted in the LI and NLI companies in SA is adequate in their RM strategies.
Table 8.
Residual Diagnostic Test. that the reliability and validity of the methodology ap. Residual Cross-Section Dependence Test. Null hypothesis: No cross-section dependence (correlation) in residuals. observations: 14.
Table 8.
Residual Diagnostic Test. that the reliability and validity of the methodology ap. Residual Cross-Section Dependence Test. Null hypothesis: No cross-section dependence (correlation) in residuals. observations: 14.
| Test | Statistic | d.f. | Prob. |
| Breusch-Pagan LM | 0.489246 | 1 | 0.4843 |
| Pesaran scaled LM | -0.361157 | 0.7180 | |
| Pesaran CD | -0.699461 | 0.4843 |
7. Conclusions and Remarks
This study explores the relationship between RM and FP of LI and NLI companies in SA from 2018 to 2024. I examine the relationship of CR, MR, LR, and OP on ROA and ROE of both LI and NLI companies in SA. The multivariate models were estimated using EViews version 12. The data was analyzed, and diagnostic tests were performed, and the model of best fit was accepted. The findings reveal that CR is positive and significantly affects ROA in LI and NLI in SA. It suggests that both LI and NLI companies are implementing effective leverage management strategies to generate high cash inflows for their companies. This means that the managers are effectively factoring the CR variables in their risk-adjusted strategy. The results support the ongoing RM and SCR effort by the SA Insurance Authorities. The other RM variables, such as OP, LR, CR, and MR, have an insignificant relationship with ROE. This study demonstrates that though the ongoing effort by policymakers and regulatory authorities in effective RM strategies and implementation is yielding positive results, the managers and directors should pay closer attention to MR because of its negative effects on ROE. This study adds to the RM literature by providing an empirical analysis of the relationship of the various RM strategies implemented by LI and NLI firms in SA and provides suggestions that policymakers can review and adopt. The study also assesses the RM strategies implemented by LI and NLI firms in SA and reveals policymakers and regulators’ areas to pay attention to in applying appropriate RM strategies.
References
- Altman, I, E., & Saunders, A. (1997). Credit Risk Measurement. Journal of Banking and Finance, 21(12), 1721-1742. [CrossRef]
- Chen, R., & Wong, A. K. (2004). The determinants of financial health of Asian insurance Companies. Journal of Risk and Insurance, 71(3), 469-499. [CrossRef]
- Apergis, N. and Poufinas, T. (2020). The role of insurance growth in economic growth: Fresh evidence from a panel of OECD countries. The North American Journal of Economics and Finance, 53, (C). [CrossRef]
- Dungey, M., Tchatoka, D. F., Wells, G., & Yanotti, B. M. (2015). Mortgage choice determinants, the role of risk, and bank regulation, The Economic Society of Austria, 91(295), 417-437. [CrossRef]
- Eckles, L. D., Hoye, E. R., & Miller. M. S. (2014). The impact of enterprise risk management on the marginal cost of reducing risk. Journal of Banking & Finance, 49, 409-423 . [CrossRef]
- Fondem, D. B., & Luo, Y. (2022). Corporate social responsibility, corporate governance, and banking performance in the CEMAC region. International Journal of Business Ethics in Developing Economies, 11(2), 01-11.
- Fondem, B. D., & Luo, Y. (2023). Export-Led Policy, Agricultural, Industrial, and Financial Sectors Growth in Cameroon. Business and Economic Research,13 (4), 2162-4860. [CrossRef]
- Gonzalez, O. L., & Santomil, D. P., & Herrera, T. A. (2020). The effect of enterprise risk management on the risk and the performance of Spanish-listed companies. European Research on Management and Business Economics, 26(3), 111-120, 10.1016/j.iedeen.2020.08.002.
- Govender, K. k., & Hassan-Bootha, R. (2022). Enterprise risk management and company ethics. Insurance Markets and Companies, 13(1), 1-10. [CrossRef]
- Hayes, A. (2024). Enterprise risk management (ERM): What is it and how it work? Retrieved: https://www.investopedia.com/terms/e/enterprise-risk-management.asp#:~:text=The%20COSO%20framework%20for%20ERM,drive%20a%20company,s%20ERM%20practices.
- Hoyt, E. R., Moore, L. D., & Liebenberg, P. A. (2008). The Value of Enterprise Risk Management. Retrieved: https://citeseerx.ist.psu.edu/document?repid=rep1&type=pdf&doi=30f7d37399d5810ca3b6fdb221f177b659596f12.
- IMF (2022). South Africa. Retrieved: https://www.imf.org/en/Publications/CR/Issues/2022/06/16/South-Africa-Financial-Sector-Assessment-Program-Technical-Note-on-Insurance-Sector-519728#:~:text=IMF%20Staff%20Country%20Reports&text=Summary%3A,fin.
- Jurdi, J. D., & Alghaimat, M. S. (2021). The effects of ERM adoption on European Insurance firms’ performance and risks. Risk and Financial Management, 14(11), 554; [CrossRef]
- Keynes, J. M. (1936). The general theory of employment, interest, and money. Harcourt Brace and World. Inc.
- Kiptoo, I. K; Kariuki, S. N.; & Ocharo, K. N. (2021). Risk management and financial performance of insurance firms in Kenya. Cogent Business & Management, 8(1), 1-17. [CrossRef]
- Kokobe SA, Gemechu D (2016) Risk Management Techniques and Financial Performance of Insurance Companies. Int J Account Res 4: 127.
- Lundqvist, S. A., & Vilhelmsson, A. (2018). Enterprise risk management and default risk. Journal of Risk and Insurance, 85(1), 127-157. https://lusem.lu.se/media/kwc/working-papers/2016/kwcwp2016-2.pdf.
- Madugu, H. A., Ibrahim, M., & Amoah, O. J. (2020). Differential effects of credit risk and capital adequacy ratio on profitability of the domestic banking sector in Ghana. Transnational Corporations Review, 12(1), 37-52. [CrossRef]
- Merton, R. C. (1974). On the pricing of corporate debt: The risk structure of interest rates. The Journal of Finance, 29(2), 449–470. https://www.jstor.org/stable/2978814.
- MI (2023) South African Casualty and Property Insurance. Retrieved: https://www.mordorintelligence.com/industry-reports/property-casualty-insurance-market-in-south-africa/companies.
- Noja, G. G., Thalassino, E., Cristea, M., GreCu. M. I. (2021). The interplay between board characteristics, financial performance, and risk management. The Journal of Risk and Financial Management, 14(2), 79; [CrossRef]
- Odunaiya, G. O., Okoye, C. C., & Nwankwo, E. E. (2024). Climate risk assessment in insurance: A USA and Africa Review. International Journal of Science and Research Archive, 11(01), 2072–2081. [CrossRef]
- Oscar Akotey, J. and Abor, J. (2013), "Risk management in the Ghanaian insurance industry", Qualitative Research in Financial Markets, Vol. 5 No. 1, pp. 26-42. [CrossRef]
- Saka, S. T., & Abere, J. O. (2022). Enterprise risk management in the Nigerian Insurance Industry. BOHR International Journal of Advances in Management Research,1(1), 106-112. [CrossRef]
- Soladoye, A., Dominic, O. I., Gambo, N., & Abubakar, L. H. (2024). Effect of enterprise risk management on the profitability of insurance companies in Nigeria.
- Wani, AA, & Dar, SA (2015). Relationship between financial risk and financial performance. International Journal of Science and Research (IJSR), 4(11), 2319-7064.
- Wyk, V.J., Dahmer, W., & Custy, C.M. (2004). Risk management and the business environment in South Africa. Elsevier, 37(3), 259-276. [CrossRef]
Table 1.
Descriptive Statistics.
| Statistics | ROE | ROA | OP | MR | LR | CR |
| Mean | 0.045867 | 0.011713 | 0.085000 | 27.84672 | 0.236430 | 0.017648 |
| Median | 0.055862 | 0.005782 | 0.075685 | 28.27835 | 0.193745 | 0.018695 |
| Maximum | 0.084422 | 0.041885 | 0.146380 | 62.39140 | 0.449710 | 0.026950 |
| Minimum | -0.000225 | -7.00E-05 | 0.037950 | -36.12325 | 0.055730 | 0.006260 |
| Std. Dev. | 0.027888 | 0.013408 | 0.045461 | 23.06972 | 0.178984 | 0.008424 |
| Skewness | -0.517627 | 1.199786 | 0.123165 | -1.309173 | 0.082839 | -0.134578 |
| Kurtosis | 1.890266 | 3.012274 | 1.171584 | 5.465388 | 1.095248 | 1.258644 |
| Jarque-Bera | 1.343569 | 3.358890 | 1.985541 | 7.544761 | 2.132391 | 1.811112 |
| Probability | 0.510796 | 0.186477 | 0.370549 | 0.022997 | 0.344316 | 0.404317 |
| Sum | 0.642140 | 0.163982 | 1.190000 | 389.8541 | 3.310024 | 0.247070 |
| Sum Sq. Dev. | 0.010111 | 0.002337 | 0.026867 | 6918.753 | 0.416461 | 0.000923 |
| Observations | 14 | 14 | 14 | 14 | 14 | 14 |
Table 2.
Pearson Correlation Results.

Table 3.
Pooled OLS Results. Dependent Variable: ROA. Total panel (balanced) observations: 14.
| Variable | Coefficient | Std. Error | t-Statistic | Prob. |
| OP | 0.255004 | 0.297122 | 0.858245 | 0.4130 |
| MR | 3.08E-05 | 0.000119 | 0.260200 | 0.8006 |
| LR | 0.105935 | 0.082616 | 1.282254 | 0.2318 |
| CR | 2.773373 | 0.886558 | 3.128249 | 0.0122* |
| C | -0.084811 | 0.027663 | -3.065844 | 0.0134 |
| R-squared | 0.746907 Mean dependent var | 0.011713 | ||
| Adjusted R-squared | 0.634421 S.D. dependent var | 0.013408 | ||
| S.E. of regression | 0.008107 Akaike info criterion | -6.519730 | ||
| Sum squared resid | 0.000592 Schwarz criterion | -6.291495 | ||
| Log likelihood | 50.63811 Hannan-Quinn criterion. | -6.540857 | ||
| F-statistic | 6.640010 Durbin-Watson stat | 2.105871 | ||
| Prob(F-statistic) | 0.009002** | |||
Output test Data regression panel Pooled OLS with Eviews. P-value, *P<0.05, **P<0.01, and ***P<0.001.
Table 5.
Fixed Effect Results (Robustness Test). Dependent Variable: ROA. Total panel (balanced) observations: 14.
Table 5.
Fixed Effect Results (Robustness Test). Dependent Variable: ROA. Total panel (balanced) observations: 14.
| Variable | Coefficient | Std. Error | t-Statistic | Prob. | |
| C | -0.085212 | 0.029373 | -2.901086 | 0.0199 | |
| CR | 2.639715 | 1.206186 | 2.188481 | 0.0601 | |
| MR | 2.62E-05 | 0.000128 | 0.204809 | 0.8428 | |
| LR | 0.112533 | 0.095121 | 1.183054 | 0.2708 | |
| OP | 0.270625 | 0.326762 | 0.828201 | 0.4316 | |
| Effects Specification | |||||
| Cross-section fixed (dummy variables) | |||||
| R-squared | 0.747888 Mean dependent var | 0.011713 | |||
| Adjusted R-squared | 0.590317 S.D. dependent var | 0.013408 | |||
| S.E. of regression | 0.008582 Akaike info criterion | -6.380755 | |||
| Sum squared resid | 0.000589 Schwarz criterion | -6.106873 | |||
| Log likelihood | 50.66528 Hannan-Quinn criterion. | -6.406108 | |||
| F-statistic | 4.746376 Durbin-Watson stat | 2.051036 | |||
| Prob(F-statistic) | 0.026028 | ||||
Output test Data regression panel fixed effect with Eviews. P-value, *P<0.05, **P<0.01, and ***P<0.001.
Table 6.
The Pooled OLS Results. Dependent Variable: ROE. Total panel (balanced) observations: 14.
| Variable | Coefficient | Std. Error | t-Statistic | Prob. |
| C | -0.110699 | 0.092392 | -1.198144 | 0.2615 |
| OP | 0.561064 | 0.992349 | 0.565390 | 0.5856 |
| MR | -9.05E-05 | 0.000396 | -0.228615 | 0.8243 |
| LR | 0.080067 | 0.275926 | 0.290177 | 0.7783 |
| CR | 5.239442 | 2.960983 | 1.769494 | 0.1106 |
| R-squared | 0.347407 Mean dependent var | 0.045867 | ||
| Adjusted R-squared | 0.057366 S.D. dependent var | 0.027888 | ||
| S.E. of regression | 0.027076 Akaike info criterion | -4.107869 | ||
| Sum squared resid | 0.006598 Schwarz criterion | -3.879635 | ||
| Log likelihood | 33.75509 Hannan-Quinn criterion. | -4.128997 | ||
| F-statistic | 1.197784 Durbin-Watson stat | 1.593776 | ||
| Prob(F-statistic) | 0.375574 | |||
Output test Data regression panel Pooled OLS with Eviews. P-value, *P<0.05, **P<0.01, and ***P<0.001.
Disclaimer/Publisher’s Note: The statements, opinions and data contained in all publications are solely those of the individual author(s) and contributor(s) and not of MDPI and/or the editor(s). MDPI and/or the editor(s) disclaim responsibility for any injury to people or property resulting from any ideas, methods, instructions or products referred to in the content. |
© 2025 by the authors. Licensee MDPI, Basel, Switzerland. This article is an open access article distributed under the terms and conditions of the Creative Commons Attribution (CC BY) license (http://creativecommons.org/licenses/by/4.0/).
Copyright: This open access article is published under a Creative Commons CC BY 4.0 license, which permit the free download, distribution, and reuse, provided that the author and preprint are cited in any reuse.


