Submitted:
16 June 2025
Posted:
17 June 2025
You are already at the latest version
Abstract
Sperm membrane potential (Em) hyperpolarization during capacitation is a functional hallmark of fertilizing ability and has been proposed as a predictive biomarker for conventional in vitro fertilization (IVF) success. However, it is unclear whether Em remains stable across ejaculates over time and can reliably guide assisted reproductive treatment (ART) decisions in advance. Thus, we aimed to evaluate the temporal consistency of human sperm Em within individuals and assess its utility as a prognostic marker when measured days or weeks prior to IVF procedures. Em was assessed in capacitated and non-capacitated sperm from normospermic donors at three time points over 28 days, using a fluorometric assay. Capacitated values were compared to a −48.6 mV threshold previously associated with successful fertilization. Intra-donor Em variability and coefficients of variation (CV) were analyzed statistically. Our results showed that Em values exhibited significant intra-donor variability over time (p=0.007), with approximately half of the donors crossing the −48.6 mV functional threshold across sessions. Capacitated sperm samples showed significantly greater variability than non-capacitated ones, with several donors exceeding a 30% CV cutoff. No consistent correlation was found between CV and mean Em values. While Em remains a promising functional marker when assessed on the day of IVF, its temporal variability undermines its reliability as a predictive tool for ART decisions made in advance. These findings underscore the importance of timing in functional sperm assessments and call for further studies to identify the physiological factors influencing Em stability.
Keywords:
membrane potential
; sperm capacitation
; human fertility
1. Introduction
Infertility is a widespread global health issue affecting approximately 1 in 7 couples, or roughly 80 million people worldwide [1,2]. The causes of infertility are diverse, with male factors now recognized as equally important as female factors, accounting for at least 50% of cases [3]. Couples struggling with infertility often turn to assisted reproductive technologies (ART) to conceive, which include intra-uterine insemination (IUI), in vitro fertilization (IVF), and intra-cytoplasmic sperm injection (ICSI). While these treatments have made significant advancements, they are costly, invasive, and carry inherent risks. The decision on which ART to pursue is often based on general sperm parameters, measured in their basal, non-capacitated state. However, these basal measurements do not necessarily predict treatment success. Therefore, a deeper understanding of sperm behavior, particularly the physiological and molecular processes that contribute to fertilizing ability, is essential for the development of more accurate diagnostic tools and improved ART decision-making [4,5].
During fertilization, sperm fuses with the oocyte to deliver its genetic contents. However, mammalian sperm must first undergo a series of physiological and morphological changes, known as ‘capacitation’, to acquire fertilizing ability. Capacitation involves a complex sequence of events that typically occurs within the female reproductive tract but can be mimicked in vitro in defined media. This process promotes changes in motility (referred to as hyperactivation) and primes the sperm to undergo the acrosome reaction in response to appropriate stimuli [6,7].
At the molecular level, sperm capacitation is associated with an increase in membrane fluidity, changes in intracellular ion concentrations [8], hyperpolarization of the sperm plasma membrane potential (Em) [9,10,11,12], increased protein kinase A activity [13,14], increase in intracellular Ca2+ concentrations [15], and pH alkalinization [16]. These events collectively contribute to the acquisition of fertilizing ability. Among them, the change in Em, mediated by K+ channel SLO1 in human sperm [17], has been shown to be central to the process of capacitation. Male mice devoid of Slo3, the K+ channel responsible for hyperpolarization in this species are infertile [18]. The essence of membrane hyperpolarization lies in the difference between the ionic concentration of the intracellular and extracellular environments. Prior to capacitation, the balance between ion fluxes, gradients and permeabilities results in an electric potential known as resting Em [8,16]. As mammalian sperm traverse the female reproductive tract, they encounter environments with markedly different extracellular compositions and must adapt by regulating their Em. This regulation is important, as ion channels and transporters, like the sperm-specific Ca2+ channel CatSper and the voltage-gated proton channel Hv1, are affected by the membrane potential [19,20].
Capacitation-associated Em changes have been thoroughly studied in mouse sperm, where it is both necessary and sufficient to promote the acrosome reaction [21]. In human sperm, several studies report a resting Em of around −40 mV, whereas capacitated sperm show an Em around −58 mV [22,23]. Previous studies from our lab and others established a correlation between hyperpolarization and IVF success, with an Em of at least −48.6 mV or −46 mV identified as necessary for successful in vitro fertilization in two independent studies [24,25]. These findings suggested that Em measurements could be used as predictors of assisted reproductive treatment through a simple fluorometric assay [26], aiding the decision between different ART methods (such as IVF or ICSI). Worth noticing, these evaluations have been performed on the same sperm samples used for ART. Thus, by the time of the result, it might be too late to choose the best ART method.
Here, we aimed to analyze whether Em measurements performed prior to the treatment day could assist in the decision-making process. We measured membrane potential in 108 conditions of 54 sperm samples from 18 normospermic donors over the span of 28 days and evaluated the variation over time. Our results reveal substantial temporal variability in sperm membrane potential upon capacitation among the same donors. Therefore, caution should be taken when considering using Em-based prediction on ART success.
2. Materials and Methods
2.1. Ethics Approval
Volunteer donors were provided with written information about the study prior to giving informed consent. The study protocol was approved by the Bioethics Committee of the Facultad de Ciencias Bioquímicas y Farmacéuticas, Universidad Nacional de Rosario, protocol #564/2018. The studies are in compliance with the Declaration of Helsinki principles.
2.2. Sperm Culture Media
HEPES-buffered human tubal fluid (HTF, NaCl 90.7 mM, KCl 4.7 mM, CaCl2 1.6 mM KH2PO4 0.3 mM, MgSO4 1.2 mM, HEPES 23.8 mM, D-Glucose 2.8 mM, sodium pyruvate 3.4 mM, sodium lactate 21.4 mM, pH 7.4) was used as “non-capacitating media” (NC). HTF supplemented with NaHCO3 15 mM and BSA 0.5% w/v was used as “capacitating media” (CAP).
2.3. Human Sperm Preparation
Semen samples were obtained by masturbation from healthy donors after 2-5 days of abstinence. All donors were under 40 years of age, reported only occasional alcohol consumption, no drug use, had no history of varicocele, and were not taking any hormone-related medication. Samples that fulfilled semen parameters according to WHO recommendations (total fluid volume, sperm concentration, motility, and morphology) [27] were allowed to liquify for 1 h at 37 °C in a water bath. Then, spermatozoa were separated by two-layer density gradient centrifugation (PureSperm 40/80, Nidacon, Sweden) and washed with HTF.
2.4. Em Determination by Fluorometric Population Assay
Conditions were prepared in 400 µL of either NC or CAP medium at a sperm concentration of 4 x 10⁶ cells/mL. After incubation, cells were loaded with DiSC3(5) 1 µM (Molecular Probes) in a final volume of 1.7 mL HTF and transferred to a gently stirred quartz cuvette at 37 °C. Fluorescence was monitored with a Varian Cary Eclipse fluorescence spectrophotometer at 620/670 nm excitation/emission wavelengths. Recordings were initiated when steady state fluorescence was reached (approximately after 10 min). Calibration was performed by adding 1 µM valinomycin and sequential additions of KCl as previously described [26,28]. Finally, sperm membrane potentials were obtained by linearly interpolating the theoretical Em values against arbitrary fluorescence units of each trace. The theoretical Em values were obtained using Nernst equation, considering 120 mM as the internal K+ concentration in sperm. This internal calibration curve for each determination compensates for variables that influence the absolute fluorescence values.
2.5. Statistical Analysis
Data are expressed as mean of Em ± standard error of the mean (SEM), for each measurement per donor, as indicated in each figure. Differences were considered significant when p < 0.05. Statistical analyses were performed using the GraphPad Prism 9 software (La Jolla, CA, USA) and graphed with Python scipy, matplotlib and seaborn libraries.
3. Results
Previous studies have shown that sperm samples that hyperpolarized exhibited better success rates in conventional IVF, in cases where the analyzed sample was a fraction of the same one used for ART [24,25]. Thus, it has been suggested that sperm membrane potential (Em) can serve as an indicator of IVF success [25,28]. However, the relevance of sperm membrane potential measured in advance of IVF treatment remains unclear. To address this, we aimed to test whether sperm membrane potential measurements taken sequentially over one month could serve as reliable predictors of IVF success.
Em values were measured in sperm samples from 18 different donors. Measurements were done on basal non capacitated state sperm (NC, i.e., incubated in the absence of bicarbonate and albumin) and after 5 h in capacitating conditions (CAP, i.e., in the presence of bicarbonate and albumin). We performed these measurements for each donor at day 0, day 14 and day 28 (Figure 1). The threshold for membrane hyperpolarization was set at −48.6 mV for EmCAP, as identified by Baro Graf, et al. (2020) [25], since a depolarized cell membrane was associated with IVF failure in idiopathic subfertile patients. Donors with at least one measurement failing to hyperpolarize beyond this threshold are indicated with asterisks.
Results indicate that a subset of donors (Donors 3, 5, 7, 8, 9, 10, 12, 13, 14 and 15) exhibited at least one depolarized sample upon capacitation, with Em values above −48.6 mV. In contrast, donors such as 1, 2, 4, and 17 consistently displayed membrane potentials well below the threshold during the whole period. Notably, some donors that failed to hyperpolarize past the threshold in at least one time point exhibited highly hyperpolarized membranes on different days, emphasizing the variability of sperm membrane potential. Overall, low hyperpolarization events were more frequently observed in donors with higher variability, as indicated by the larger dispersion associated with these individuals.
While some samples exhibited a hyperpolarized membrane potential upon capacitation, this was not consistent, accounting for the variability previously seen in human samples. In addition, when comparing membrane potential across donors, we observed significant inter-donor variability. Consistency within donors was observed in samples exhibiting hyperpolarized values (1, 2, 4, 6, 11, 16, 17, 18). However, in other donors, Em values varied substantially between samples, and no consistent depolarization pattern was observed across timepoints. To statistically evaluate the variation in Em values, we performed an ANOVA analysis of repeated measures. The analysis revealed a statistically significant effect of time over Em (p = 0.0076, η2G = 0.107), indicating that Em does not remain stable over the 28-day period. The largest difference was found between day 0 and day 28 (pcorr = 0.028, Bonferroni post-hoc comparison).
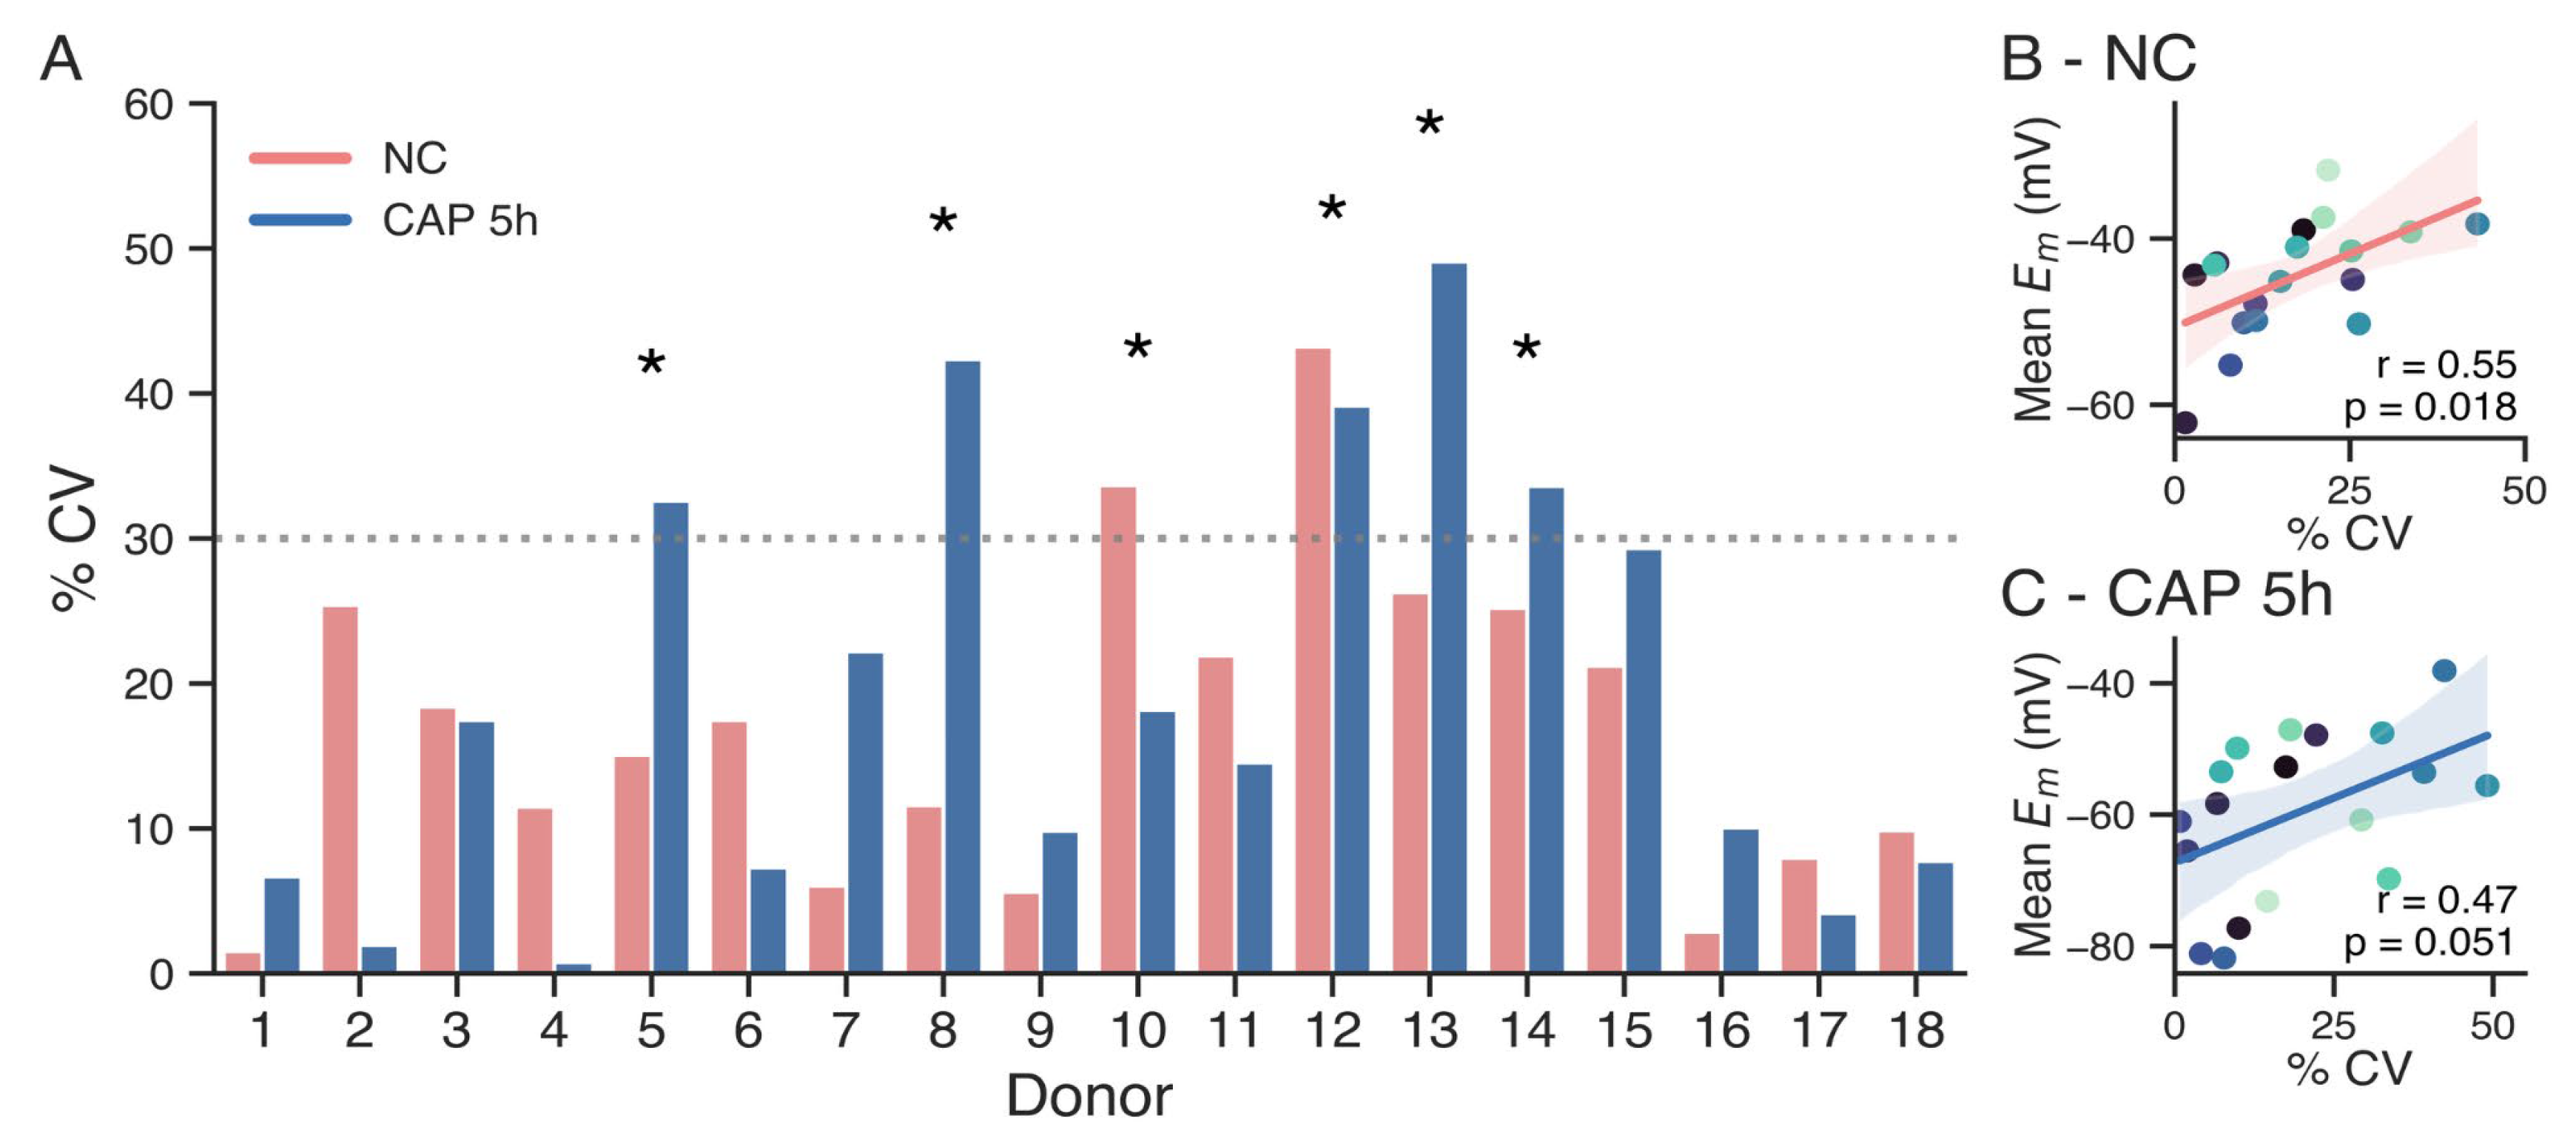
In light of these results, we aimed to assess the relative variability using the coefficient of variation (CV) as a statistical method. CV, defined as the ratio of the standard deviation to the mean of a dataset, allows for comparison of the degree of variation from one donor dataset to another, even when the means are drastically different. The CV was calculated for each donor in both non-capacitated (NC) and capacitated (CAP) subsets of sperm samples (Figure 2A). As a threshold for high variability, a cutoff of 30% CV was established (dotted line). Donors exceeding this threshold in at least one condition indicated with asterisks, indicating high variability in Em results along measurements. These results suggest that the outcome of an Em measurement on a given day may not reliably predict the potential success of an IVF attempt performed two weeks later with a new sperm sample.
Overall, capacitated sperm exhibited higher CVs compared to non-capacitated sperm, with several donors (e.g., 5, 8, 12, 13, and 14) showing substantial variability after 5 h of capacitation. In contrast, non-capacitated samples generally displayed more stable measurements, with a few exceptions of high variability (e.g., donors 10 and 12). Notably, some donors with high CVs in the capacitated condition also failed to hyperpolarize beyond the −48.6 mV threshold (e.g., donors 8, 12, and 13), suggesting a potential link between hyperpolarization and variability. However, Pearson regression tests only showed statistical correlation between high CV and higher mean membrane potential for the non-capacitates samples, and not for capacitated samples (Figure 2B-C, p = 0.018 for non-capacitated sperm, p = 0.51 for capacitated sperm).
Together, these findings highlight significant inter-donor variability in sperm Em among samples taken along 2 weeks interval time. Capacitated sperm generally exhibited a greater variability than those from non-capacitated sperm. These results suggest that caution should be taken when using sperm membrane potential measurements in advance of an IVF treatment as a predictor of sperm fertilizing capacity. Further validation is needed to determine their reliability to predict success rate in IVF procedures not performed on the same day.
4. Discussion
A total of 108 conditions were analyzed in 54 normospermic sperm samples from 18 donors to determine whether membrane potential (Em) remains stable over three different time points taken over 28 days. We found that Em varied significantly within individuals over time. In fact, around 50% of the donors exhibited changes in Em large enough to cross a previously proposed functional cut-off of 30% CV, which would result in inconsistent sample classification [25].
This finding is particularly relevant considering previous work demonstrating that capacitation-associated hyperpolarization is linked to the acquisition of fertilizing capacity in human sperm [24,25]. Those studies reached similar conclusions independently using different experimental approaches. Baro Graf, et al. [25] used a population fluorimetry to show that capacitated samples showing Em below −48.6 mV had increased success rates. On the other hand, Puga-Molina, et al. [24] used flow cytometry to also show that samples exhibiting Em values below −46 mV had increased success rates. In addition, the degree of Em hyperpolarization after capacitation correlated strongly with acrosomal responsiveness [24,25]. Altogether, these results strongly suggested that Em could be applied as a predictive functional biomarker. However, our results reveal that Em cannot be considered a fixed trait within individuals, at least when measured in different ejaculates collected weeks apart under standardized conditions.
The reasons behind this variability in Em remain to be elucidated. It is possible that inter-ejaculate differences in semen composition for the same individual, hormonal levels [29,30], or testicular environment (factors known to fluctuate over time even within healthy individuals) could influence the capacitation response and, consequently, Em. Moreover, although capacitation protocols were identical across all time points, the biological response to those conditions may vary depending on the physiological state of the sperm at the time of collection. These subtle biological fluctuations, while insufficient to alter conventional semen parameters, may be enough to impact functional outputs like membrane potential.
This temporal variability highlights an important limitation for the implementation of Em as a standalone predictive marker in assisted reproduction. While Em remains a strong correlate of fertilizing competence when measured immediately before IVF [24,25], our data suggest that measurements taken weeks in advance may not reliably represent the fertilizing potential of future ejaculates from the same donor. In this context, it becomes crucial to define the optimal time window for functional sperm assessments intended to guide clinical decisions.
Altogether, our findings provide novel insight into the temporal dynamics of human sperm membrane potential and raise important questions regarding the physiological factors influencing functional sperm parameters over time. Further studies will be necessary to determine the underlying causes of Em variability and to assess whether specific patterns of Em fluctuation are associated with fertility outcomes.
5. Conclusions
Our study reveals that human sperm membrane potential (Em) is not stable over time, even when measured under standardized capacitation conditions. Across three time points spanning 28 days, Em varied significantly within individuals, with approximately half of the donors exhibiting intra-individual variability exceeding a 30 % coefficient of variation threshold. These fluctuations were sufficient to alter sample classification relative to a previously proposed functional Em cut-off, raising concerns about the reliability of Em as a long-term predictive biomarker.
These findings underscore a critical limitation in using Em measurements taken days or weeks before assisted reproduction procedures to assess sperm fertilizing potential. While Em remains a robust correlate of sperm function when measured immediately prior to IVF, our data suggest that its predictive value diminishes over time due to underlying biological variability. Further research is warranted to elucidate the physiological drivers of Em fluctuation and to determine whether specific Em dynamics are linked to fertility outcomes.
Author Contributions
Conceptualization, CBG, AN, MGB, DK.; methodology, TJS and CB.; validation, TJS and CBG; formal analysis, TJS, CBG, AN and DK.; resources, DK; data curation, TJS and CBG; writing—original draft preparation, TJS and CBG; writing—review and editing, TJS, CBG, AN, MGB and DK; visualization, TJS; supervision, MGB and DK; project administration, MGB and DK; funding acquisition, DK. All authors have read and agreed to the published version of the manuscript.
Funding
This research was funded by Foncyt PICT 2019-1779 and 2021-0102 awarded to DK. .
Institutional Review Board Statement
The study was conducted in accordance with the Declaration of Helsinki, and approved by the Institutional Review Board of the Facultad de Ciencias Bioquímicas y Farmacéuticas, UNR (protocol code 564/2018).
Informed Consent Statement
Informed consent was obtained from all subjects involved in the study.
Data Availability Statement
Data will be made available upon request.
Acknowledgments
We thank Silvana Sut for excellent laboratory assistance. TJS and AN are fellows at CONICET. MGB and DK are Staff members of CONICET.
Conflicts of Interest
DK and MGB are shareholders of Fecundis The remaining authors declare no conflicts of interest.
Abbreviations
The following abbreviations are used in this manuscript:
| ART | Assisted reproductive treatments |
| Em | Membrane potential |
| IVF | in vitro fertilization |
| NC | non-capacitating media |
| CAP | capacitating media |
References
- Slama, R.; Hansen, O.K.H.; Ducot, B.; Bohet, A.; Sorensen, D.; Giorgis Allemand, L.; Eijkemans, M.J.C.; Rosetta, L.; Thalabard, J.C.; Keiding, N.; et al. Estimation of the Frequency of Involuntary Infertility on a Nation-Wide Basis. Hum. Reprod. 2012, 27, 1489–1498. [Google Scholar] [CrossRef] [PubMed]
- Datta, J.; Palmer, M.J.; Tanton, C.; Gibson, L.J.; Jones, K.G.; Macdowall, W.; Glasier, A.; Sonnenberg, P.; Field, N.; Mercer, C.H.; et al. Prevalence of Infertility and Help Seeking among 15 000 Women and Men. Hum. Reprod. 2016, 31, 2108–2118. [Google Scholar] [CrossRef] [PubMed]
- Human Fertilisation and Embryology Authority Fertility Treatment in 2013: Trends and Figures; Human Fertilisation and Embryology Authority: London, 2014.
- Barratt, C.L.R.; Björndahl, L.; De Jonge, C.J.; Lamb, D.J.; Osorio Martini, F.; McLachlan, R.; Oates, R.D.; Van Der Poel, S.; St John, B.; Sigman, M.; et al. The Diagnosis of Male Infertility: An Analysis of the Evidence to Support the Development of Global WHO Guidance—Challenges and Future Research Opportunities. Hum. Reprod. Update 2017, 23, 660–680. [Google Scholar] [CrossRef] [PubMed]
- Barratt, C.L.R.; De Jonge, C.J.; Sharpe, R.M. ‘Man Up’: The Importance and Strategy for Placing Male Reproductive Health Centre Stage in the Political and Research Agenda. Hum. Reprod. 2018, 33, 541–545. [Google Scholar] [CrossRef]
- Austin, C.R. The ‘Capacitation’ of the Mammalian Sperm. Nature 1952, 170, 326–326. [Google Scholar] [CrossRef]
- Chang, M.C. Fertilizing Capacity of Spermatozoa Deposited into the Fallopian Tubes. Nature 1951, 168, 697–698. [Google Scholar] [CrossRef]
- Visconti, P.E.; Krapf, D.; de la Vega-Beltrán, J.L.; Acevedo, J.J.; Darszon, A. Ion Channels, Phosphorylation and Mammalian Sperm Capacitation. Asian J. Androl. 2011, 13, 395–405. [Google Scholar] [CrossRef]
- Hernández-González, E.O.; Sosnik, J.; Edwards, J.; Acevedo, J.J.; Mendoza-Lujambio, I.; López-González, I.; Demarco, I.; Wertheimer, E.; Darszon, A.; Visconti, P.E. Sodium and Epithelial Sodium Channels Participate in the Regulation of the Capacitation-Associated Hyperpolarization in Mouse Sperm. J. Biol. Chem. 2006, 281, 5623–5633. [Google Scholar] [CrossRef]
- Zeng, Y.; Clark, E.N.; Florman, H.M. Sperm Membrane Potential: Hyperpolarization during Capacitation Regulates Zona Pellucida-Dependent Acrosomal Secretion. Dev. Biol. 1995, 171, 554–563. [Google Scholar] [CrossRef]
- Krapf, D.; Arcelay, E.; Wertheimer, E.V.; Sanjay, A.; Pilder, S.H.; Salicioni, A.M.; Visconti, P.E. Inhibition of Ser/Thr Phosphatases Induces Capacitation-Associated Signaling in the Presence of Src Kinase Inhibitors. J. Biol. Chem. 2010, 285, 7977–7985. [Google Scholar] [CrossRef]
- Ren, D.; Navarro, B.; Perez, G.; Jackson, A.C.; Hsu, S.; Shi, Q.; Tilly, J.L.; Clapham, D.E. A Sperm Ion Channel Required for Sperm Motility and Male Fertility. Nature 2001, 413, 603–609. [Google Scholar] [CrossRef] [PubMed]
- Stival, C.; Puga Molina, L.D.C.; Paudel, B.; Buffone, M.G.; Visconti, P.E.; Krapf, D. Sperm Capacitation and Acrosome Reaction in Mammalian Sperm. In Sperm Acrosome Biogenesis and Function During Fertilization; Buffone, M.G., Ed.; Advances in Anatomy, Embryology and Cell Biology; Springer International Publishing: Cham, 2016; Volume 220, pp. 93–106. ISBN 978-3-319-30565-3. [Google Scholar]
- Santi, C.M.; Martínez-López, P.; de la Vega-Beltrán, J.L.; Butler, A.; Alisio, A.; Darszon, A.; Salkoff, L. The SLO3 Sperm-Specific Potassium Channel Plays a Vital Role in Male Fertility. FEBS Lett. 2010, 584, 1041–1046. [Google Scholar] [CrossRef] [PubMed]
- Darszon, A.; Nishigaki, T.; Beltran, C.; Treviño, C.L. Calcium Channels in the Development, Maturation, and Function of Spermatozoa. Physiol. Rev. 2011, 91, 1305–1355. [Google Scholar] [CrossRef] [PubMed]
- Lishko, P.V.; Kirichok, Y.; Ren, D.; Navarro, B.; Chung, J.-J.; Clapham, D.E. The Control of Male Fertility by Spermatozoan Ion Channels. Annu. Rev. Physiol. 2012, 74, 453–475. [Google Scholar] [CrossRef]
- De La Vega-Beltran, J.L.; Sánchez-Cárdenas, C.; Krapf, D.; Hernandez-González, E.O.; Wertheimer, E.; Treviño, C.L.; Visconti, P.E.; Darszon, A. Mouse Sperm Membrane Potential Hyperpolarization Is Necessary and Sufficient to Prepare Sperm for the Acrosome Reaction. J. Biol. Chem. 2012, 287, 44384. [Google Scholar] [CrossRef]
- Arnoult, C.; Kazam, I.G.; Visconti, P.E.; Kopf, G.S.; Villaz, M.; Florman, H.M. Control of the Low Voltage-Activated Calcium Channel of Mouse Sperm by Egg ZP3 and by Membrane Hyperpolarization during Capacitation. Proc. Natl. Acad. Sci. 1999, 96, 6757–6762. [Google Scholar] [CrossRef]
- Ritagliati, C.; Baro Graf, C.; Stival, C.; Krapf, D. Regulation Mechanisms and Implications of Sperm Membrane Hyperpolarization. Mech. Dev. 2018, 154, 33–43. [Google Scholar] [CrossRef]
- Stival, C.; La Spina, F.A.; Baró Graf, C.; Arcelay, E.; Arranz, S.E.; Ferreira, J.J.; Le Grand, S.; Dzikunu, V.A.; Santi, C.M.; Visconti, P.E.; et al. Src Kinase Is the Connecting Player between Protein Kinase A (PKA) Activation and Hyperpolarization through SLO3 Potassium Channel Regulation in Mouse Sperm. J. Biol. Chem. 2015, 290, 18855–18864. [Google Scholar] [CrossRef]
- Linares-Hernández, L.; Guzmán-Grenfell, A.M.; Hicks-Gomez, J.J.; González-Martı́nez, M.T. Voltage-Dependent Calcium Influx in Human Sperm Assessed by Simultaneous Optical Detection of Intracellular Calcium and Membrane Potential. Biochim. Biophys. Acta BBA - Biomembr. 1998, 1372, 1–12. [Google Scholar] [CrossRef]
- Patrat, C.; Serres, C.; Jouannet, P. Progesterone Induces Hyperpolarization after a Transient Depolarization Phase in Human Spermatozoa1. Biol. Reprod. 2002, 66, 1775–1780. [Google Scholar] [CrossRef]
- Baro Graf, C.; Ritagliati, C.; Torres-Monserrat, V.; Stival, C.; Carizza, C.; Buffone, M.G.; Krapf, D. Membrane Potential Assessment by Fluorimetry as a Predictor Tool of Human Sperm Fertilizing Capacity. Front. Cell Dev. Biol. 2020, 7. [Google Scholar] [CrossRef] [PubMed]
- Molina, L.C.P.; Gunderson, S.; Riley, J.; Lybaert, P.; Borrego-Alvarez, A.; Jungheim, E.S.; Santi, C.M. Membrane Potential Determined by Flow Cytometry Predicts Fertilizing Ability of Human Sperm. Front. Cell Dev. Biol. 2020, 7, 387. [Google Scholar] [CrossRef] [PubMed]
- Baro Graf, C.; Ritagliati, C.; Stival, C.; Balestrini, P.A.; Buffone, M.G.; Krapf, D. Determination of a Robust Assay for Human Sperm Membrane Potential Analysis. Front. Cell Dev. Biol. 2019, 7. [Google Scholar] [CrossRef] [PubMed]
- WHO Laboratory Manual for the Examination and Processing of Human Semen. 6th ed, World Health Organization: Geneva, 2010; ISBN 978-92-4-003078-7.
- Baker, H.W.G.; Burger, H.G.; de Kretser, D.M.; Lording, D.W.; McGowan, P.; Rennie, G.G. Factors Affecting the Variability of Semen Analysis Results in Infertile Men. Int. J. Androl. 1981, 4, 609–622. [Google Scholar] [CrossRef]
- Osadchuk, L.V.; Kleshchev, M.A.; Osadchuk, A.V. Steroid Hormones in Seminal Plasma: The Relationship with Sperm Quality. Bull. Exp. Biol. Med. 2023, 174. [Google Scholar] [CrossRef]
Figure 1.
Membrane potential of sperm cells after 5 h of capacitation, grouped by donor. The −48.6 mV threshold is shown with the dotted line. Donors with at least one measurement over −48.6 mV are indicated with asterisks. Mean ± SEM in grey.
Figure 1.
Membrane potential of sperm cells after 5 h of capacitation, grouped by donor. The −48.6 mV threshold is shown with the dotted line. Donors with at least one measurement over −48.6 mV are indicated with asterisks. Mean ± SEM in grey.
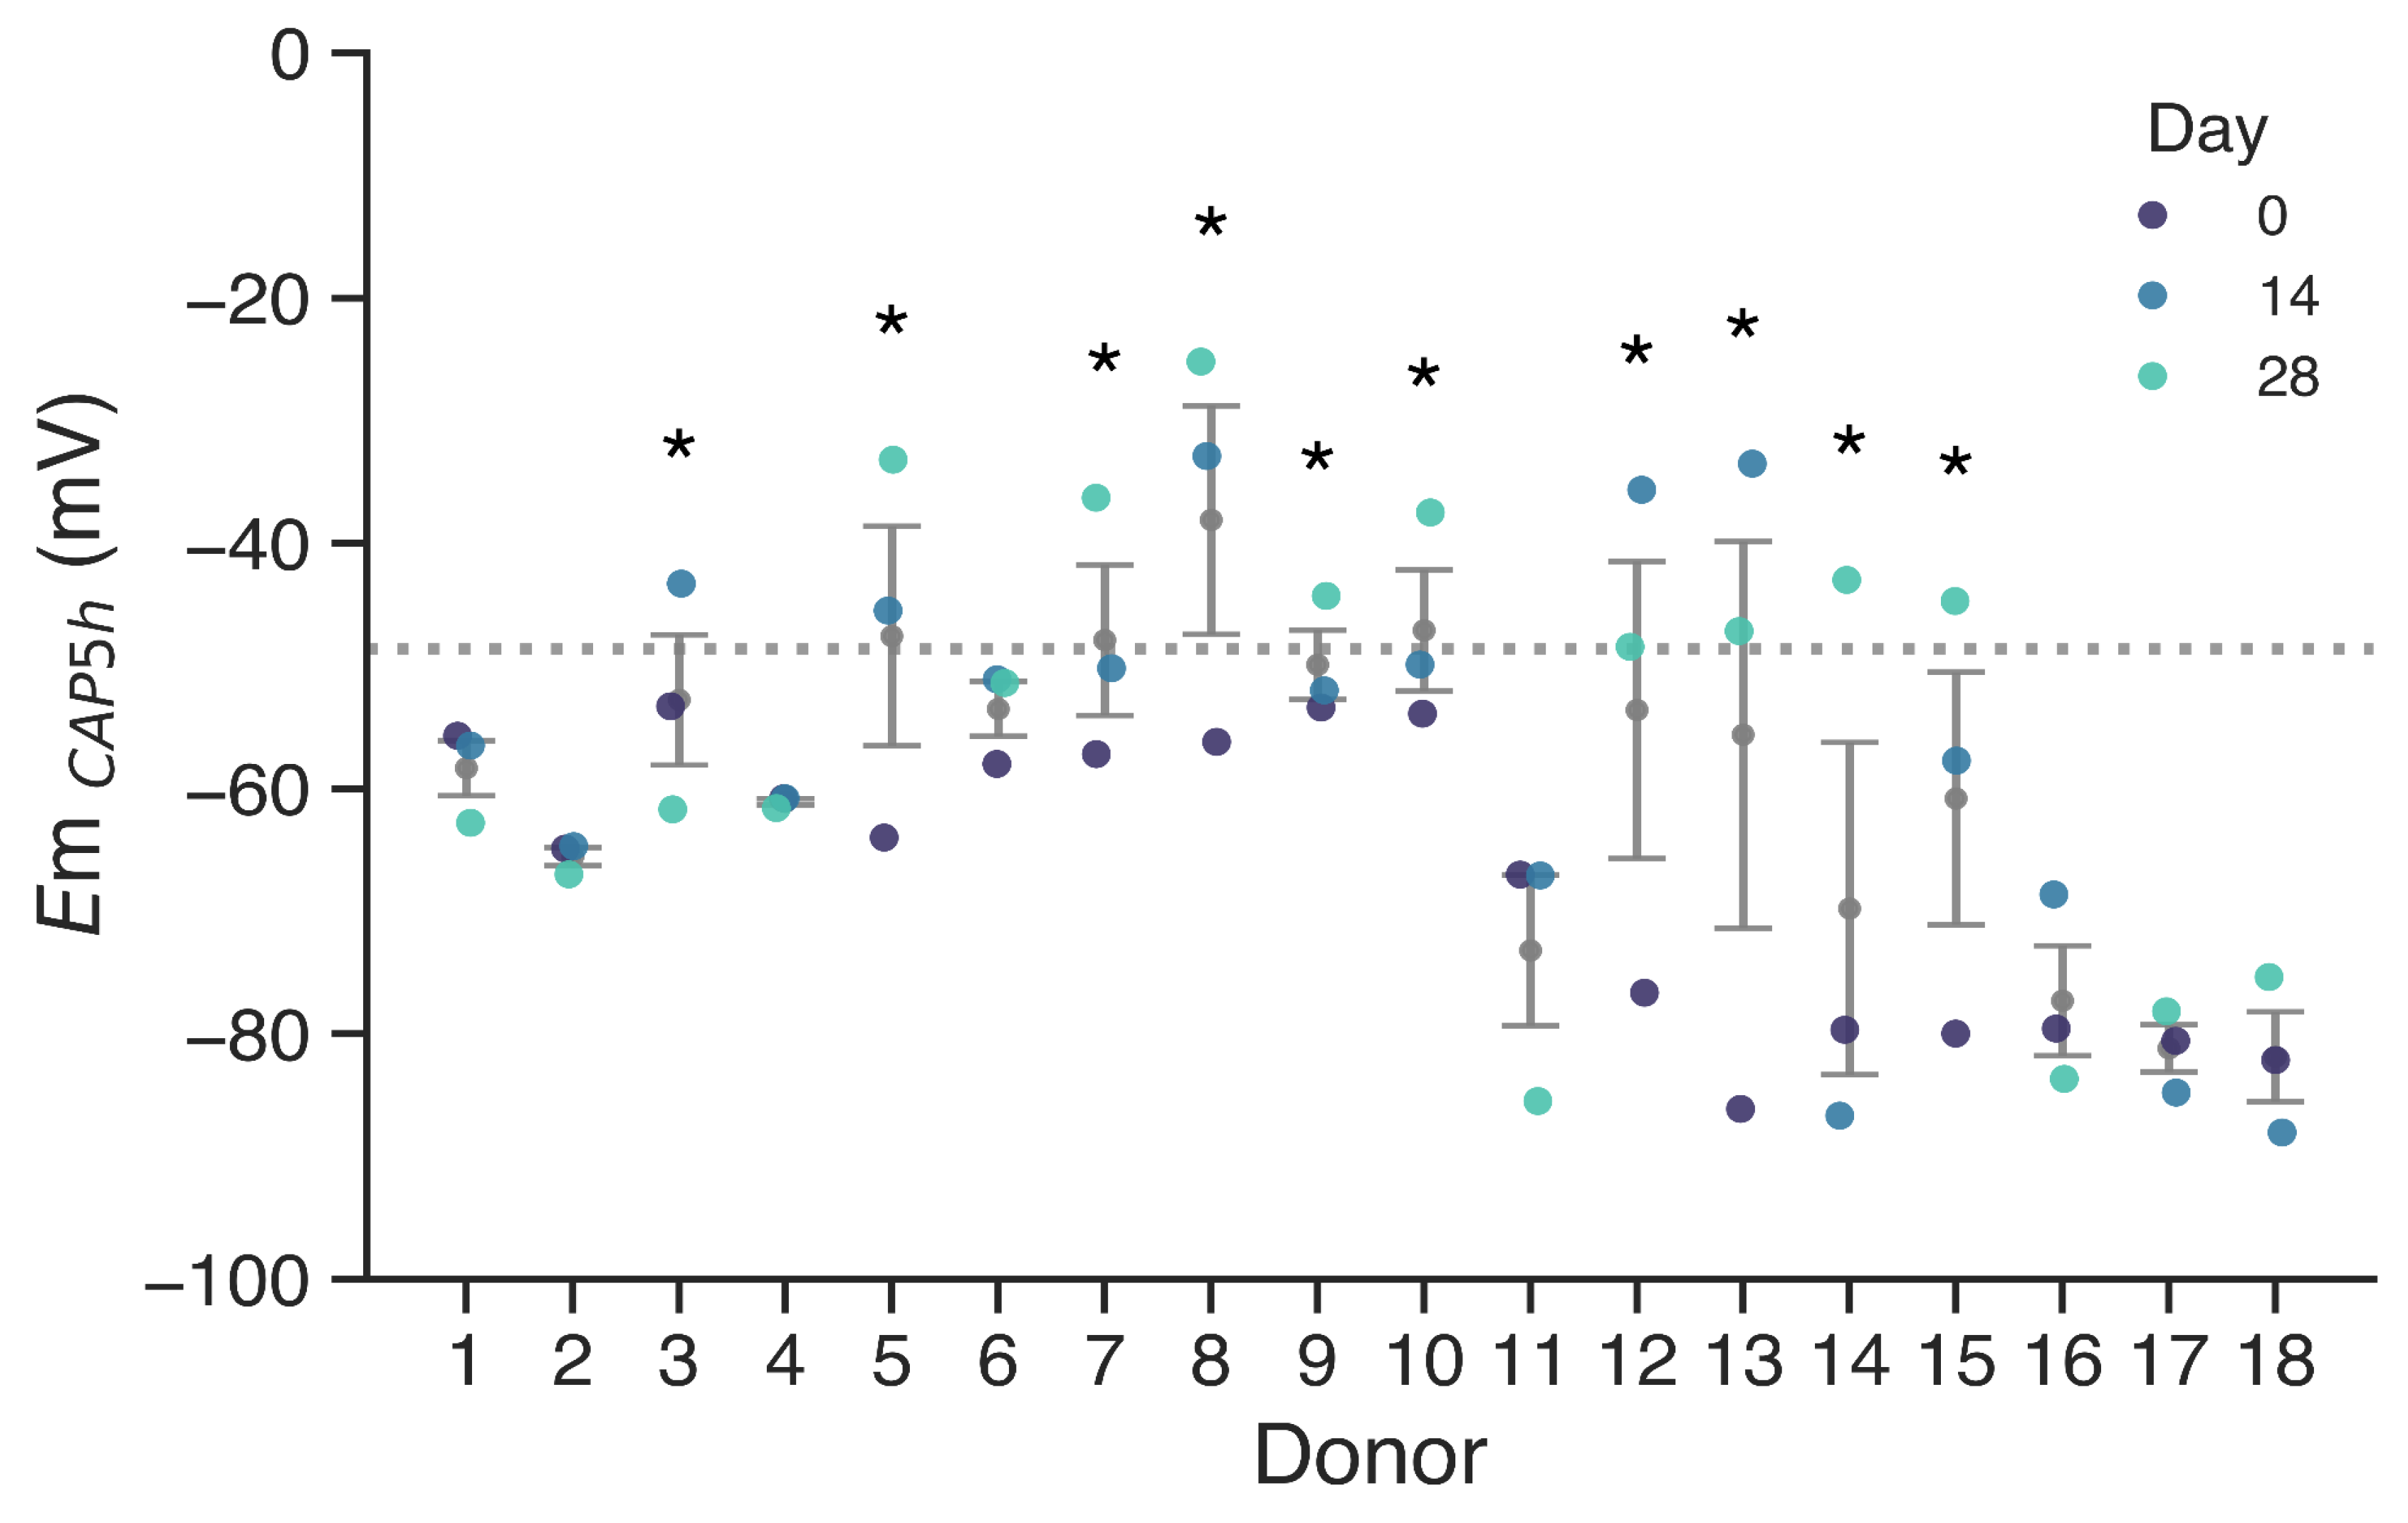
Figure 2.
A. Coefficient of variation between repeated measurements of non-capacitated sperm (pink), and after 5 h of capacitation (blue). The 30% CV threshold is shown with the dotted line. Donors with higher than 30% CV in at least one condition are indicated with asterisks. B. Correlation between coefficient of variation and mean membrane potential of non-capacitated sperm. Pearson test, r = 0.55, p = 0.018. C. Correlation between coefficient of variation and mean membrane potential of capacitated sperm. Pearson test, r = 0.47, p = 0.051.
Disclaimer/Publisher’s Note: The statements, opinions and data contained in all publications are solely those of the individual author(s) and contributor(s) and not of MDPI and/or the editor(s). MDPI and/or the editor(s) disclaim responsibility for any injury to people or property resulting from any ideas, methods, instructions or products referred to in the content. |
© 2025 by the authors. Licensee MDPI, Basel, Switzerland. This article is an open access article distributed under the terms and conditions of the Creative Commons Attribution (CC BY) license (http://creativecommons.org/licenses/by/4.0/).
Copyright: This open access article is published under a Creative Commons CC BY 4.0 license, which permit the free download, distribution, and reuse, provided that the author and preprint are cited in any reuse.


