
Submitted:
13 June 2025
Posted:
16 June 2025
You are already at the latest version
Abstract
Farmers face increasing pressure to maintain vital populations of the critically endangered field hamster (Cricetus cricetus) while simultaneously managing crop damage caused by overlapping habitats of field mice. This challenge is closely linked to the United Nations Sustainable Development Goals (SDGs) 2 and 15, focusing on food security and mitigating biodiversity loss in terrestrial ecosystems. Consequently, hamster activity within agricultural fields needs to be reliably detected. In this study, we investigate the potential of drone-based Light Detection and Ranging (LiDAR) data for identifying field hamster burrow entrances in agricultural landscapes. We present a geostatistical method for identifying local elevation minima as indicators of burrow openings. Our analysis is based on four datasets captured at varying flight altitudes and spatial resolutions, supplemented by high-resolution reference mapping data. The method successfully detected up to 20 out of 23 known burrow entrances and provided additional insights into burrow structure and size. Detection accuracy increased and misclassification rates decreased at lower flight altitudes. These findings demonstrate the potential of UAV-based laser scanning technology to support species monitoring and habitat management in agricultural systems, thereby contributing to the achievement of two critical Sustainable Development Goals.
Keywords:
Cricetus cricetus
; species monitoring
; precision agriculture
; LiDAR
; UAV
; habitat detection
; biodiversity conservation
1. Introduction
The European hamster (Cricetus cricetus) is a fossorial rodent species native to Central and Eastern Europe that has experienced a dramatic decline in population over recent decades. Once widespread across agricultural landscapes, it is now classified as critically endangered throughout its entire range [1]. The species’ decline is closely linked to the intensification of agricultural practices—particularly the expansion of monocultures, increased mechanization, and extensive use of agrochemicals—which have resulted in widespread habitat degradation and the loss of fallow land or edge structures critical for burrowing and foraging [2].
A major ecological and political challenge arises from the overlap of European hamster habitats with those of the common vole (Microtus arvalis), a species known to cause significant crop damage. In regions where both species co-occur, rodent control strategies—especially the application of second-generation anticoagulant rodenticides—pose a severe threat to non-target organisms [3]. Also the European hamster may potentially be affected by rodenticides [4]. This situation exemplifies the broader conflict between food production goals and biodiversity conservation, and directly relates to the United Nations Sustainable Development Goals (SDGs): Goal 2 ("Zero Hunger") and Goal 15 ("Life on Land").
To resolve this conflict, reliable and scalable monitoring of European hamster populations is urgently needed. However, traditional survey methods such as expert-based field mapping are labor-intensive and time-consuming [5]. In large-scale agricultural landscapes, a manual survey is often economically unfeasible, making long-term monitoring efforts challenging to sustain. As a result, the integration of non-invasive remote sensing technologies into conservation practices is gaining momentum.
Among the available technologies, Light Detection and Ranging (LiDAR) has proven particularly promising due to its ability to generate high-resolution 3D data on terrain structure and vegetation cover. LiDAR enables the characterization of vertical and horizontal surface complexity, offering significant potential for habitat mapping and species monitoring [6]. Previous studies have successfully used LiDAR to delineate nesting habitats for birds, quantify vegetation complexity for arboreal mammals such as squirrels, or model habitat suitability for various taxa including insects and amphibians [6,7]. One study, for example, combined aerial LiDAR and multispectral imagery to identify favorable burrow habitats for the desert tortoise (Gopherus agassizii) based on topographic and vegetation characteristics [8]. Another study used topographic features and local elevations to identify areas with high potential for burrowing of Kangaroo rats [9]. However, these studies focused on predictive modelling of burrow suitability and not on direct detection. Most efforts to locate animal burrows have relied on image-based approaches—for example, using hyperspectral UAV sensors to detect spectral anomalies associated with rodent burrows in desert steppes [5] or employing high-resolution RGB imagery to identify burrow entrances and measure their dimensions [10]. A key limitation of these methods is their reduced effectiveness in densely vegetated areas, where burrow entrances are often obscured from view. Unlike image-based methods, LiDAR offers strong potential for detecting burrows even in such environments, as it can penetrate the canopy to capture ground-level features. Yet, studies specifically using LiDAR for burrow detections were not found. However, the above-mentioned studies highlight the potential of remote sensing in burrow ecology, but also underscore a crucial gap in the current literature: the absence of a method capable of directly detecting burrow entrances based solely on 3D topographic data.
This study seeks to address that gap by developing and validating a geostatistical method for the direct detection of hamster burrow entrances using UAV-based LiDAR data. In addition to its canopy-penetrating capabilities, LiDAR datasets can also reveal subtle topographic depressions within the point cloud—an approach particularly effective in agricultural landscapes with minimal vertical vegetation structure. This makes LiDAR well suited for detecting hamster burrows within agricultural fields.
The detection algorithm is based on a two-step process: (1) identification of local elevation minima through quantile filtering, and (2) geometric filtering of candidate depressions using convex hull analysis and shape descriptors. Given the limited availability of validated methods for direct burrow detection and the high conservation urgency for the European hamster, this study contributes both methodologically and practically to the fields of conservation technology and precision agriculture. More specifically, the study aims to bridges the gap between ecological monitoring and remote sensing innovation.
The following research questions guide this investigation:
- Is it feasible to detect hamster burrow entrances using high-resolution airborne LiDAR data?
- What data quality requirements are necessary to ensure accurate detection of hamster burrows?
To answer these questions, we applied the proposed algorithm to UAV-derived LiDAR datasets acquired at varying altitudes and validated the outputs using high-precision reference data from differential GPS field surveys and image-based classification.
2. Materials and Methods
2.1. Study Area
For this study, four UAV-based LiDAR datasets were collected over a 0.6-hectare test site near Prosigk, Saxony-Anhalt, Germany (Figure 1). The study site was selected based on recent records of active European hamster burrows and its overall suitability as a hamster habitat. Factors include a combination of favorable abiotic conditions, such as deep, heavy soils suitable for burrowing, and key habitat features, such as the presence of croplands that provide a consistent availability of plant-based food sources [1].
The selected field was cultivated with winter wheat (Triticum aestivum) and was managed using no-till or direct seeding techniques, resulting in minimal soil disturbance and favorable surface visibility. The local soil was classified as Chernozem on loess substrate, a fertile, humus-rich black earth known for its high agricultural productivity and high water retention capacity.
2.2. Collection of Reference Data
For the validation of the LiDAR-based detection algorithm, manual field mapping of hamster burrows took place on April 24, 2023, shortly before the second round of data collection by drone. Field conditions were dry and soil visibility was high. The fine-scale ground survey was carried out by trained staff. A differential GNSS system (Trimble R10, Trimble Inc., Westminster, USA) was used to record the precise geolocation and the depth of the burrow entrances, while the diameter was measured with a digital caliper. Further, the width of the feeding circle was measured using a folding ruler, and the burrow type—classified as either vertical (drop-hole) or slanting (slip-hole) [11]—was recorded.
In addition to the manual field survey, RGB images taken by the drone were visually inspected by experts for hamster burrows that had been overlooked in the field.
2.3. Collection of LiDAR Data
The data acquisition was carried out using two different sensor-platform combinations under similar environmental conditions in August 2022 and May 2023 to enable a comparative performance evaluation across varying flight altitudes and point cloud densities. Criteria were stable atmospheric conditions (dry, cloudless weather, early morning hours) to minimize the effects of wind, temperature gradients, and solar radiation on sensor stability, and low vegetation cover to maximize the ground surface detectability.
The Mapper+ Dataset (2022) was acquired on 31 August 2022 using a YellowScan Mapper+ sensor mounted on a DJI Matrice 600 (M600) UAV platform. The Mapper+ scanner had a precision of 2.5 cm, an accuracy of 3 cm, and supported up to three echoes per pulse. The flight was conducted at an altitude of 30 m, yielding a point density of 6,360 pts/m².
The Voyager Datasets (2023) were acquired on 5 May 2023 using the YellowScan Voyager sensor, mounted on an Acecore NOA UAV platform. The Voyager sensor had a precision of 0.5 cm, an accuracy of 1 cm, and the ability to record up to 15 echoes per laser pulse. Flights were conducted at 20 m, 30 m, and 120 m altitudes, producing respective point densities of 22,583 pts/m², 14,587 pts/m², and 2,972 pts/m².
All point clouds were recorded in LAS 1.4 format and georeferenced using post-processed kinematic (PPK) corrections from a Trimble R10 base station, operating in the ETRS89 / UTM Zone 32N coordinate system. No initial ground filtering or classification was applied to preserve all surface features relevant for burrow entrance detection.
Each flight followed a cross-flight (lawnmower) pattern with parallel flight lines and systematic turns at the end of each pass to ensure comprehensive and evenly distributed coverage. This configuration minimized scan shadows and ensured a high point density across the field. The flight speed was kept consistent at 4 m/s across all altitudes. The overall survey setup—including start and end points, orientation of flight lines, and extent of the study area—is illustrated in Figure 2.
Table 1 provides a summary of the key acquisition parameters, sensor characteristics, and resulting point cloud metrics for each dataset included in the study.
2.4. Burrow Entrance Detection Algorithm
2.4.1. Concept
The detection method developed in this study aims to automatically identify hamster burrow entrances in agricultural landscapes using high-resolution UAV-based LiDAR data. It combines localized depth analysis and geometric filtering techniques to derive candidate burrow entrance features directly from the 3D point cloud, avoiding the loss of precision typically introduced by raster-based surface models.
The primary objective of the developed method was the automatic identification of burrow entrances of the European hamster based on elevation anomalies in high-resolution LiDAR point clouds. Hamster burrow entrances typically manifest as small, round surface depressions with distinctive geometric characteristics that are otherwise difficult to capture using conventional raster-based methods. To illustrate the overall logic of the detection method, a flowchart is provided in Figure 3. It outlines the sequential steps, from data import and quantile filtering to convex hull construction, polygon merging, attribute calculation, and final classification.
2.4.2. Data Preprocessing
To preserve the full vertical and spatial fidelity of the terrain structure, the analysis was conducted directly on the 3D point cloud, rather than through derived raster products such as digital terrain models.
To manage the extremely large volume of raw LiDAR data—often exceeding several billion points per dataset—the LAS files were converted into a PostgreSQL (v14.8) spatial database using the open-source Point Data Abstraction Library (PDAL v2.5.0) [12]. This database structure enabled query-based access and scalable integration with R-based preprocessing.
Each dataset was then subdivided into regular, non-overlapping 1 × 1 meter tiles (hereafter referred to as "patches") using the filters.splitter function. This tiling enabled localized analysis of elevation patterns and allowed consistent referencing across datasets collected at different flight altitudes and point densities. The patch size was selected to balance resolution and processing efficiency, as smaller patches might fragment burrow entrance structures and larger patches might dilute terrain signals due to slope variation.
2.4.3. Detection of Local Depth Minima
In order to detect local depth minima, statistically significant surface depressions within the point cloud were identified by applying a quantile-based threshold to the elevation values of each spatial unit. The approach is conceptually adapted from methods for identifying local maxima in canopy height models, particularly those used to delineate individual tree crowns [13], but is here inverted to detect negative relief features such as burrow entrances.
Within each patch, the vertical distribution of all elevation points was statistically analyzed, and only the lowest subset of points were extracted. Specifically, a low quantile threshold was defined for each dataset to isolate micro-depressions in the terrain surface by removing higher-elevation noise, thereby enhancing the contrast of fine-scale topographic anomalies. The selection of the quantile value was iteratively optimized to reflect the point cloud density of each flight altitude. Higher point densities increase the likelihood of a laser pulse to penetrate directly into burrow depressions, allowing a more reliable capture of low-elevation signals. Conversely, lower-resolution datasets require less selective thresholds to avoid missing relevant features. Accordingly, the following quantile thresholds were applied for the respective flight altitudes of the Voyager sensor: 0.1 % quantile (20 m flight altitude), 0.2 % quantile (30 m flight altitude) and 1.0 % quantile (120 m flight altitude). These thresholds reflect a trade-off between minimizing false positives and maintaining sensitivity to shallow surface features across varying data qualities. The principle of this filtering process is illustrated in Figure 4, which visualizes a representative 1 × 1 m patch with its lowest 0.1 % of elevation points highlighted. These selected points serve as the foundation for subsequent convex hull construction and geometric classification steps.
2.4.4. Convex Hull Generation
After isolating candidate low-elevation points through quantile filtering, the next step involves the spatial delineation of potential burrow structures based on their local clustering and geometric cohesion. This is accomplished through the construction of convex hulls. To ensure robust coverage of the surface and reduce the risk of missing depressions located at tile boundaries, a dual-grid (fishnet) approach was applied to each 1 × 1 meter patch. The primary grid divided each patch into uniform square search windows. The secondary grid was offset by 50% of the search window size in both horizontal and vertical directions to capture features that straddle the edges of the primary grid cells.
Within each search window of both grids, a convex hull was generated around the quantile-filtered points—if a minimum number of points (empirically set to 10) was present to form a valid polygon. Convex hulls generated within the same grid were examined for spatial proximity. Polygons separated by less than a defined neighborhood distance (typically 15 cm) were merged to form continuous objects. This step addressed the fragmentation of a single burrow depression into multiple sub-polygons. Further, the resulting hulls from both grids were then merged by overlay comparison. If two polygons overlapped, the one with the higher roundness was retained, assuming it better represented a cohesive, circular burrow entrance. Non-overlapping polygons from either grid were retained in full.
2.4.5. Geometric Feature Classification and Filtering
Once candidate depressions were isolated, they were evaluated using a set of vector-based shape descriptors including roundness, surface area, vertical range, and local contrast to the surrounding terrain. This classification of the geometric features draws upon techniques from digital geomorphometry, such as those employed in the automated detection and morphological analysis of sink-holes and dolines [14].
In the final stage of the detection process, the geometric descriptors were used to filter the candidate polygons and identify those that most likely represent hamster burrow entrances. The filtering process applied empirically derived threshold values (Table 2), which were optimized through exploratory analysis of both true positive and false-positive detections and subsequently validated against the reference dataset.
Polygons that did not fulfill all of these criteria were excluded from further analysis. This conservative approach maximized precision by favoring clear, morphologically consistent features over ambiguous signals. The final set of filtered polygons—comprising all geometries satisfying the above criteria—constitutes the output of the detection algorithm. These potential burrow entrance locations are further assessed through spatial validation against the compiled reference dataset.
3. Results
3.1. Confirmed Hamster Burrows
A total of 16 distinct burrow entrances were identified and recorded during the ground survey in April 2023. In addition to the hamster burrows detected during manual mapping, seven further burrow entrances were visually confirmed to be actual hamster burrows by experts based on RGB images. The spatial distribution can be obtained from Figure 5 and the burrow characteristics from Table 3.
3.2. LiDAR Dataset Quality
A representative example of a retained polygon that satisfies all threshold criteria is shown in Figure 6. The figure illustrates both the geometric footprint and the vertical profile of the detected depression, thereby demonstrating the typical morphology of a hamster burrow entrance.
In general, the data from lower flight altitudes was able to depict the burrow entrances more accurately than from 120 m altitude. The difference in detail between the 120 m altitude dataset with a spatial distribution of around 3000 pts/m² and the 21,000 pts/m² obtained from the 20 m dataset can be seen in Figure 7. While in the point clouds from 20 and 30 m the burrow entrance is clearly visible and extends as a vertical hole to a certain depth, the 120 m dataset shows only a slight depression that cannot be clearly identified as a hole.
Looking at a larger section of the LiDAR point cloud, the 20 m dataset enabled the direct visual identification of hamster burrow entrances. These features appeared as compact depressions that were distinguishable from natural terrain undulations and validated against ground-truth GNSS locations. A representative subset of the 20 m data, showing five confirmed burrow structures, is presented in Figure 8.
3.3. Burrow Entrance Detection Accuracy
The detection algorithm's performance varied significantly across the tested Li-DAR datasets (Voyager 20 m, 30 m, 120 m), largely reflecting differences in spatial resolution and temporal alignment with reference data. Figure 9 summarizes the number of mapped reference locations, and the number of true and false positive detections. Across all datasets, the 30 m Voyager flight produced the best results, detecting 20 out of 23 reference burrow entrances with five unmatched detections. The 20 m dataset yielded identical detection accuracy but produced six false positives. In contrast, the 120 m dataset demonstrated substantially reduced performance, detecting 14 of 23 burrow entrances and yielding nine false positives. In the Mapper+ dataset (collected in 2022), a total of seven detected depressions were found, of which five were identified as likely burrow entrances through visual inspection, while two were categorized as false positives.
The 30 m Voyager and 20 m datasets achieved the highest F1-scores, reflecting a strong balance between detection accuracy and false positive rate. In contrast, the 120 m dataset showed a lower recall due to a higher number of missed detections. The Mapper+ dataset exhibited lower precision due to a greater proportion of false positives. A detailed summary of recall, precision, and F1-scores for all datasets is provided in Table 4.
3.4. Evaluation of the Burrow Entrance Detection Algorithm
Among the five filter criteria, the nPoints attribute—representing the number of quantile-selected points inside each candidate—proved particularly valuable for distinguishing true burrow entrances from noise. As shown in Figure 10, almost all reference-confirmed burrows are associated with polygons exceeding 10 points, while polygons with lower values rarely matched known locations. This justified the adoption of a minimum nPoints threshold of 10 in the final filter logic.
4. Discussion
4.1. Limitations and Uncertainty of Reference Data
Despite the overall successful detection of burrow entrances, several limitations must be acknowledged when interpreting detection performance. The manual field mapping and the LiDAR data collection were conducted approximately ten days apart. During this period, new burrows may have been created or existing ones may have collapsed or been obscured by soil or rainfall effects. Besides, even under ideal field conditions, it is unlikely that all burrows were detected in the manual survey or through inspection of RGB images. Burrow entrances located at the edge of visibility, hidden beneath crop residue, or exhibiting a degraded appearance could have been overlooked. Thus, a minor risk of misclassification remains. Nonetheless, a considerable number of burrow entrances were correctly identified by the detection approach.
Another limitation of the remote sensing approach is that the reference dataset indicates the presence of burrow entrances but does not confirm whether a hamster actively used it at the time of LiDAR acquisition. Besides, the field was managed using minimal intervention agriculture, so that some burrows may originate from the previous season, without being actively used in the current season. In contrast, on traditionally cultivated fields with higher soil disturbance, it is unlikely that unused burrow entrances would persist for long periods. Therefore, in such intensively managed areas, the presence of visible burrows would be a stronger indication of active use by hamsters.
Lastly, it must be acknowledged that burrow entrances may sometimes be confused with those of other digging species, particularly in agricultural landscapes where several small mammals may coexist. One potential approach to reduce this uncertainty could involve analyzing burrow entrance characteristics such as size and shape, which are usually related to the body dimensions of the animal and can support species-level differentiation.
4.2. Differentiation Between Hamster and Vole Burrows
Particularly during vole outbreaks in agricultural areas during rodenticide applications, or in the context of building permission procedures, it is essential to reliably demonstrate the absence of hamsters. This helps prevent unintended harm to the species and avoid potential legal consequences. Therefore, surveys based on remote-sensing approaches must ensure that no hamster burrows are overlooked. At the same time, it is equally important to avoid misclassifying burrows of other species as hamster burrows, as this could unnecessarily hinder crop production or building projects.
As the diameter of circular burrow entrances correlates with an animal’s body size [10], one potential approach for distinguishing between hamster and vole burrows could be based on the entrance diameter. Adult hamsters are much larger than voles, typically weighing between 150 and 650 g and having a body length between 17 and 30 cm [16]. In contrast, adult voles typically weigh only 28 g, but their weight can range up to over 60 g [17]. Although the size difference between adult hamsters and voles is considerable, juvenile hamsters that have recently left their natal burrow are much smaller, typically weighing only between 80 and 100 g [18]. Thus, distinguishing a vole burrow from that of a juvenile hamster based solely on the hole diameter may be challenging. Vole burrow entrances are reported to have a diameter ranging between 2.5 and 7.5 cm [19], while hamster burrow openings typically range from 6 to 10 cm for adults [20,21], but can be as small as 4 cm for young hamsters [22]. Therefore, a detection algorithm for entrances of hamster burrows should not only identify location of the entrances, but also measure the diameter. In cases where the diameter falls within the overlap range between hamster and vole burrow entrances, further inspection will be necessary for accurate identification.
Assessing the diameter of burrow entrances has been successfully performed using high-resolution RGB images [10]: The method involved using RGB-DN histograms to differentiate burrow openings from the sediment based on reflectance values and the diameter was measured by identifying the two furthest points on the perimeter and drawing a circle around them. This method turned out to be very accurate with a correlation coefficient of 0.94 between the calculated and actually measured diameters for a flight altitude of 6 m and a ground sampling distance of < 0.8 mm. Similarly, LiDAR has been successfully applied to measure the diameters of objects, particularly trees, either in combination with RGB image analysis [23] or as a standalone method [24,25,26].
4.3. Technological Innovations and Future Potential
While the geostatistical detection method demonstrated high sensitivity and specificity when applied to high-resolution datasets such as from 20 m and 30 m flight altitudes, it is highly recommended to include the burrow entrance diameter into the assessment. As lower spatial resolution caused a decrease in the algorithm performance, a low point density of < 3000 pts/m² as used in the Voyager 120m dataset, is not considered suitable for a reliable detection of hamster burrow entrances. The fact that the Mapper+ dataset identified only five burrow entrances correctly may have also been related to the relatively low point density, though it is not known how many burrows were actually present on the field during the data collection.
At the same time, the results show that a very high point density can lead to an increased number of false positive detections, as small depressions within the topography may mistakenly be interpreted as burrow entrances. Therefore, a medium-dense point cloud at flight altitudes at which hamster burrows would be visible also on RGB images may provide the best balance. At this medium-high level of detail, it should also be possible to estimate burrow entrance diameter, which is important for distinguishing between species.
Other technologies used in burrow detection, particularly where a thick layer of vegetation covers the burrow entrance, include ground-penetrating radar (GPR). GPR has been used in levee assessments to identify subsurface animal burrows, which can compromise the structural integrity of the levee during floods [27]. Though drones can be equipped with GPR sensors, the detection of animal burrows may require the sensor to be in close proximity to the ground. For screening a large area such as agricultural fields, a very low flight altitude would sharply increases dataset size and processing time, potentially reducing efficiency.
An alternative approach includes the combination of traditional sensors such as RGB or LiDAR, with machine learning algorithms, which makes processing large datasets more efficient [28,29]. Techniques such as supervised classification, thermal anomaly detection, and convolutional neural networks (CNNs) show strong potential for automatically distinguishing hamster burrows from other ground features: In a methodologically related study, it was shown that analyzing RGB images through machine learning algorithms is generally suitable for the detection of hamster burrows [30]. This method could be especially powerful when incorporating additional indicators, such as feeding traces commonly found around active burrows [31], allowing for a more comprehensive and precise analysis based on the full range of collected data, while LiDAR would be effective in areas with lower ground visibility..
However, before fully automating hamster surveys, a visual inspection of the output is always advisable. Particularly when the diameters of the burrow entrances fall in the overlapping dimension between hamster and vole burrows, a visual check of RGB images for indicators such as feeding circles or even manual visits in the field may be needed.
Overall, LiDAR data can be highly effective as an initial screening tool, helping to select areas for more detailed assessments and reducing the need for large-scale ground surveys. Especially the integration of various remote sensing technologies has a high potential to improve species monitoring and a wide range of ecological applications. A drone-based multi-sensor approach offers a non-intrusive, cost-effective, and accurate method of collecting comprehensive ecological data, thereby supporting targeted conservation efforts and sustainable ecosystem management.
5. Conclusions
This study demonstrated that UAV-based LiDAR data combined with a geostatistical detection algorithm could reliably identify hamster burrow entrances in agricultural landscapes. High detection performances of above 80 % were achieved at low flight altitudes (20 m and 30 m), confirming the critical role of point cloud density for successful detection. The results showed that variations in flight altitude and spatial resolution significantly affect detection accuracy, underlining the need for carefully adapted acquisition parameters and algorithm settings. The method offers a promising and efficient tool for species monitoring and conservation management, supporting efforts to protect the critically endangered European hamster.
Author Contributions
Conceptualization, F.T.; methodology, F.T.; software, F.T. and J.R.; validation, F.T. and M.M.; formal analysis, F.T.; investigation, F.T.; resources, F.T.; data curation, F.T. and P.A.; writing—original draft preparation, F.T. and M.M..; writing—review and editing, F.T. and M.M.; visualization, F.T., M.M. and J.R.; supervision, F.T. and J.R.; project administration, F.T.; funding acquisition, F.T. All authors have read and agreed to the published version of the manuscript.
Funding
This research was funded by the European Agricultural Fund for Rural Development (EAFRD) within the framework of the European Innovation Partnership for Agricultural Productivity and Sustainability (EIP-AGRI), supported by the Ministry for the Environment, Agriculture and Energy of Saxony-Anhalt and the European Commission.
Data Availability Statement
Data can be made available on reasonable request.
Conflicts of Interest
The authors declare no conflicts of interest.
References
- IUCN SSC Small Mammal Specialist Group Cricetus Cricetus – The IUCN Red List of Threatened Species 2020.
- Bundesamt für Naturschutz Rote Liste der Tiere, Pflanzen und Pilze Deutschlands - Säugetiere; Landwirtschaftsverlag GmbH: DE, 2020; ISBN 978-3-7843-3772-2.
- Brakes, C.R.; Smith, R.H. Exposure of Non-target Small Mammals to Rodenticides: Short-term Effects, Recovery and Implications for Secondary Poisoning. Journal of Applied Ecology 2005, 42, 118–128. [Google Scholar] [CrossRef]
- Surov, A.; Banaszek, A.; Bogomolov, P.; Feoktistova, N.; Monecke, S. Dramatic Global Decrease in the Range and Reproduction Rate of the European Hamster Cricetus Cricetus. Endangered species research 2016, 31, 119–145. [Google Scholar] [CrossRef]
- Gao, X.; Bi, Y.; Du, J. Identification of Ratholes in Desert Steppe Based on UAV Hyperspectral Remote Sensing. Applied Sciences 2023, 13, 7057. [Google Scholar] [CrossRef]
- Davies, A.B.; Asner, G.P. Advances in Animal Ecology from 3D-LiDAR Ecosystem Mapping. Trends in Ecology & Evolution 2014, 29, 681–691. [Google Scholar] [CrossRef]
- De Vries, J.P.R.; Koma, Z.; WallisDeVries, M.F.; Kissling, W.D. Identifying Fine-scale Habitat Preferences of Threatened Butterflies Using Airborne Laser Scanning. Diversity and Distributions 2021, 27, 1251–1264. [Google Scholar] [CrossRef]
- Young, M.; Andrews, J.; Caldwell, T.; Saylam, K. Airborne LiDAR and Aerial Imagery to Assess Potential Burrow Locations for the Desert Tortoise (Gopherus Agassizii). Remote Sensing 2017, 9, 458. [Google Scholar] [CrossRef]
- Stuhler, J.D.; Portillo-Quintero, C.; Goetze, J.R.; Stevens, R.D. Efficacy of Remote Sensing Technologies for Burrow Count Estimates of a Rare Kangaroo Rat. Wildlife Society Bulletin 2024, 48, e1510. [Google Scholar] [CrossRef]
- Ha, S.-B.; Jang, Y.; Seo, J.; Kim, K.; Koo, B.J.; Ryu, J.-H.; Lee, S.-K. Burrow Opening Measurements of Intertidal Macroinvertebrates from Optical Drone Images. Remote Sensing 2024, 16, 1941. [Google Scholar] [CrossRef]
- Nechay, G. Status of Hamsters, Cricetus Cricetus, Cricetus Migratorius, Mesocricetus Newtoni and Other Hamster Species in Europe; Nature and environment; Council of Europe Publ: Strasbourg, 2000; ISBN 978-92-871-4330-3. [Google Scholar]
- PDAL Contributors PDAL Point Data Abstraction Library 2023.
- Tiede, D.; Hochleitner, G.; Blaschke, T. A Full GIS-Based Workflow for Tree Identification and Tree Crown Delineation Using Laser Scanning. In Proceedings of the ISPRS Workshop CMRT; ISPRS Baton Rouge, LA, USA, 2005; Vol. 5, p. 2005.
- Kim, Y.J.; Nam, B.H.; Youn, H. Sinkhole Detection and Characterization Using LiDAR-Derived DEM with Logistic Regression. Remote Sensing 2019, 11, 1592. [Google Scholar] [CrossRef]
- Montero, R.S.; Bribiesca, E. State of the Art of Compactness and Circularity Measures. In Proceedings of the International mathematical forum; 2009; Vol. 4, pp. 1305–1335.
- Petrová, I.; Petriláková, M.; Losík, J.; Gouveia, A.; Damugi, I.E.D.; Tkadlec, E. Density-Related Pattern of Variation in Body Growth, Body Size and Annual Productivity in the Common Hamster. Mammalian Biology 2018, 91, 34–40. [Google Scholar] [CrossRef]
- Olea, P.P.; De Diego, N.; García, J.T.; Viñuela, J. Habitat Type Modulates Sharp Body Mass Oscillations in Cyclic Common Vole Populations. Sci Rep 2024, 14, 12013. [Google Scholar] [CrossRef] [PubMed]
- Kirn, N. Ontogenese Des Europäischen Feldhamsters (Cricetus Cricetus) Unter Dem Einfluss Verschiedener Prä-Und Postnataler Photoperioden. PhD Thesis, Hannover, Tierärztl. Hochsch., Diss., 2004, 2004.
- Ezzy, H.; Charter, M.; Bonfante, A.; Brook, A. How the Small Object Detection via Machine Learning and UAS-Based Remote-Sensing Imagery Can Support the Achievement of SDG2: A Case Study of Vole Burrows. Remote Sensing 2021, 13, 3191. [Google Scholar] [CrossRef]
- Katzman, E.A.; Zaytseva, E.A.; A. N. Severtsov Institute of Ecology and Evolution, Russian Academy of Sciences; Feoktistova, N.Yu.; A. N. Severtsov Institute of Ecology and Evolution, Russian Academy of Sciences; Tovpinetz, N.N.; A. N. Severtsov Institute of Ecology and Evolution, Russian Academy of Sciences; Bogomolov, P.L.; A. N. Severtsov Institute of Ecology and Evolution, Russian Academy of Sciences; Potashnikova, E.V.; et al. Seasonal Changes in Burrowing of the Common Hamster (Cricetus Cricetus L., 1758) (Rodentia: Cricetidae) in the City. PJE 2018, 17, 251–258. [CrossRef]
- Kryštufek, B.; Hoffmann, I.E.; Nedyalkov, N.; Pozdnyakov, A.; Vohralík, V. Cricetus Cricetus (Rodentia: Cricetidae). Mammalian Species 2020, 52, 10–26. [Google Scholar] [CrossRef]
- Karaseva, E.; Shilayeva, L. The Structure of Hamster Burrows in Relation to Its Age and the Season. Byulletin’Moskovskogo obschestva ispytatelei prirody. Otdel Biologicheskii 1965, 70, 30–39. [Google Scholar]
- Popescu, S.C.; Wynne, R.H.; Nelson, R.F. Measuring Individual Tree Crown Diameter with Lidar and Assessing Its Influence on Estimating Forest Volume and Biomass. Canadian journal of remote sensing 2003, 29, 564–577. [Google Scholar] [CrossRef]
- Rudge, M.L.M.; Levick, S.R.; Bartolo, R.E.; Erskine, P.D. Modelling the Diameter Distribution of Savanna Trees with Drone-Based LiDAR. Remote Sensing 2021, 13, 1266. [Google Scholar] [CrossRef]
- Unger, D.R.; Hung, I.-K.; Brooks, R.; Williams, H. Estimating Number of Trees, Tree Height and Crown Width Using Lidar Data. GIScience & Remote Sensing 2014, 51, 227–238. [Google Scholar] [CrossRef]
- Falkowski, M.J.; Smith, A.M.S.; Hudak, A.T.; Gessler, P.E.; Vierling, L.A.; Crookston, N.L. Automated Estimation of Individual Conifer Tree Height and Crown Diameter via Two-Dimensional Spatial Wavelet Analysis of Lidar Data. Canadian Journal of Remote Sensing 2006, 32, 153–161. [Google Scholar] [CrossRef]
- Chlaib, H.K.; Mahdi, H.; Al-Shukri, H.; Su, M.M.; Catakli, A.; Abd, N. Using Ground Penetrating Radar in Levee Assessment to Detect Small Scale Animal Burrows. Journal of Applied Geophysics 2014, 103, 121–131. [Google Scholar] [CrossRef]
- Talha, S.A.; Manasreh, D.; Nazzal, M.D. The Use of Lidar and Artificial Intelligence Algorithms for Detection and Size Estimation of Potholes. Buildings 2024, 14, 1078. [Google Scholar] [CrossRef]
- Rodrigues, W.G.; Vieira, G.S.; Cabacinha, C.D.; Bulcão-Neto, R.F.; Soares, F. Applications of Artificial Intelligence and LiDAR in Forest Inventories: A Systematic Literature Review. Computers and Electrical Engineering 2024, 120, 109793. [Google Scholar] [CrossRef]
- Thürkow, F.; Lorenz, C.; Ramstetter, J.; Hoppe, I.; Haase, M. KI-basierte Detektion von Feldhamsterbauen auf landwirtschaftlichen Nutzflächen mittels multi-sensoraler UAS-Daten. 2023. [Google Scholar] [CrossRef]
- Mammen, U.; Kayser, A.; Mammen, K.; Raddatz, D.; Weinhold, U. Die Berücksichtigung Des Feldhamsters (Cricetus Cricetus) Im Rahmen von Eingriffsvorhaben. Natur und Landschaft 2014, 8. [Google Scholar] [CrossRef]
Figure 1.
Location of the study area, Prosigk, Saxony-Anhalt, Germany.
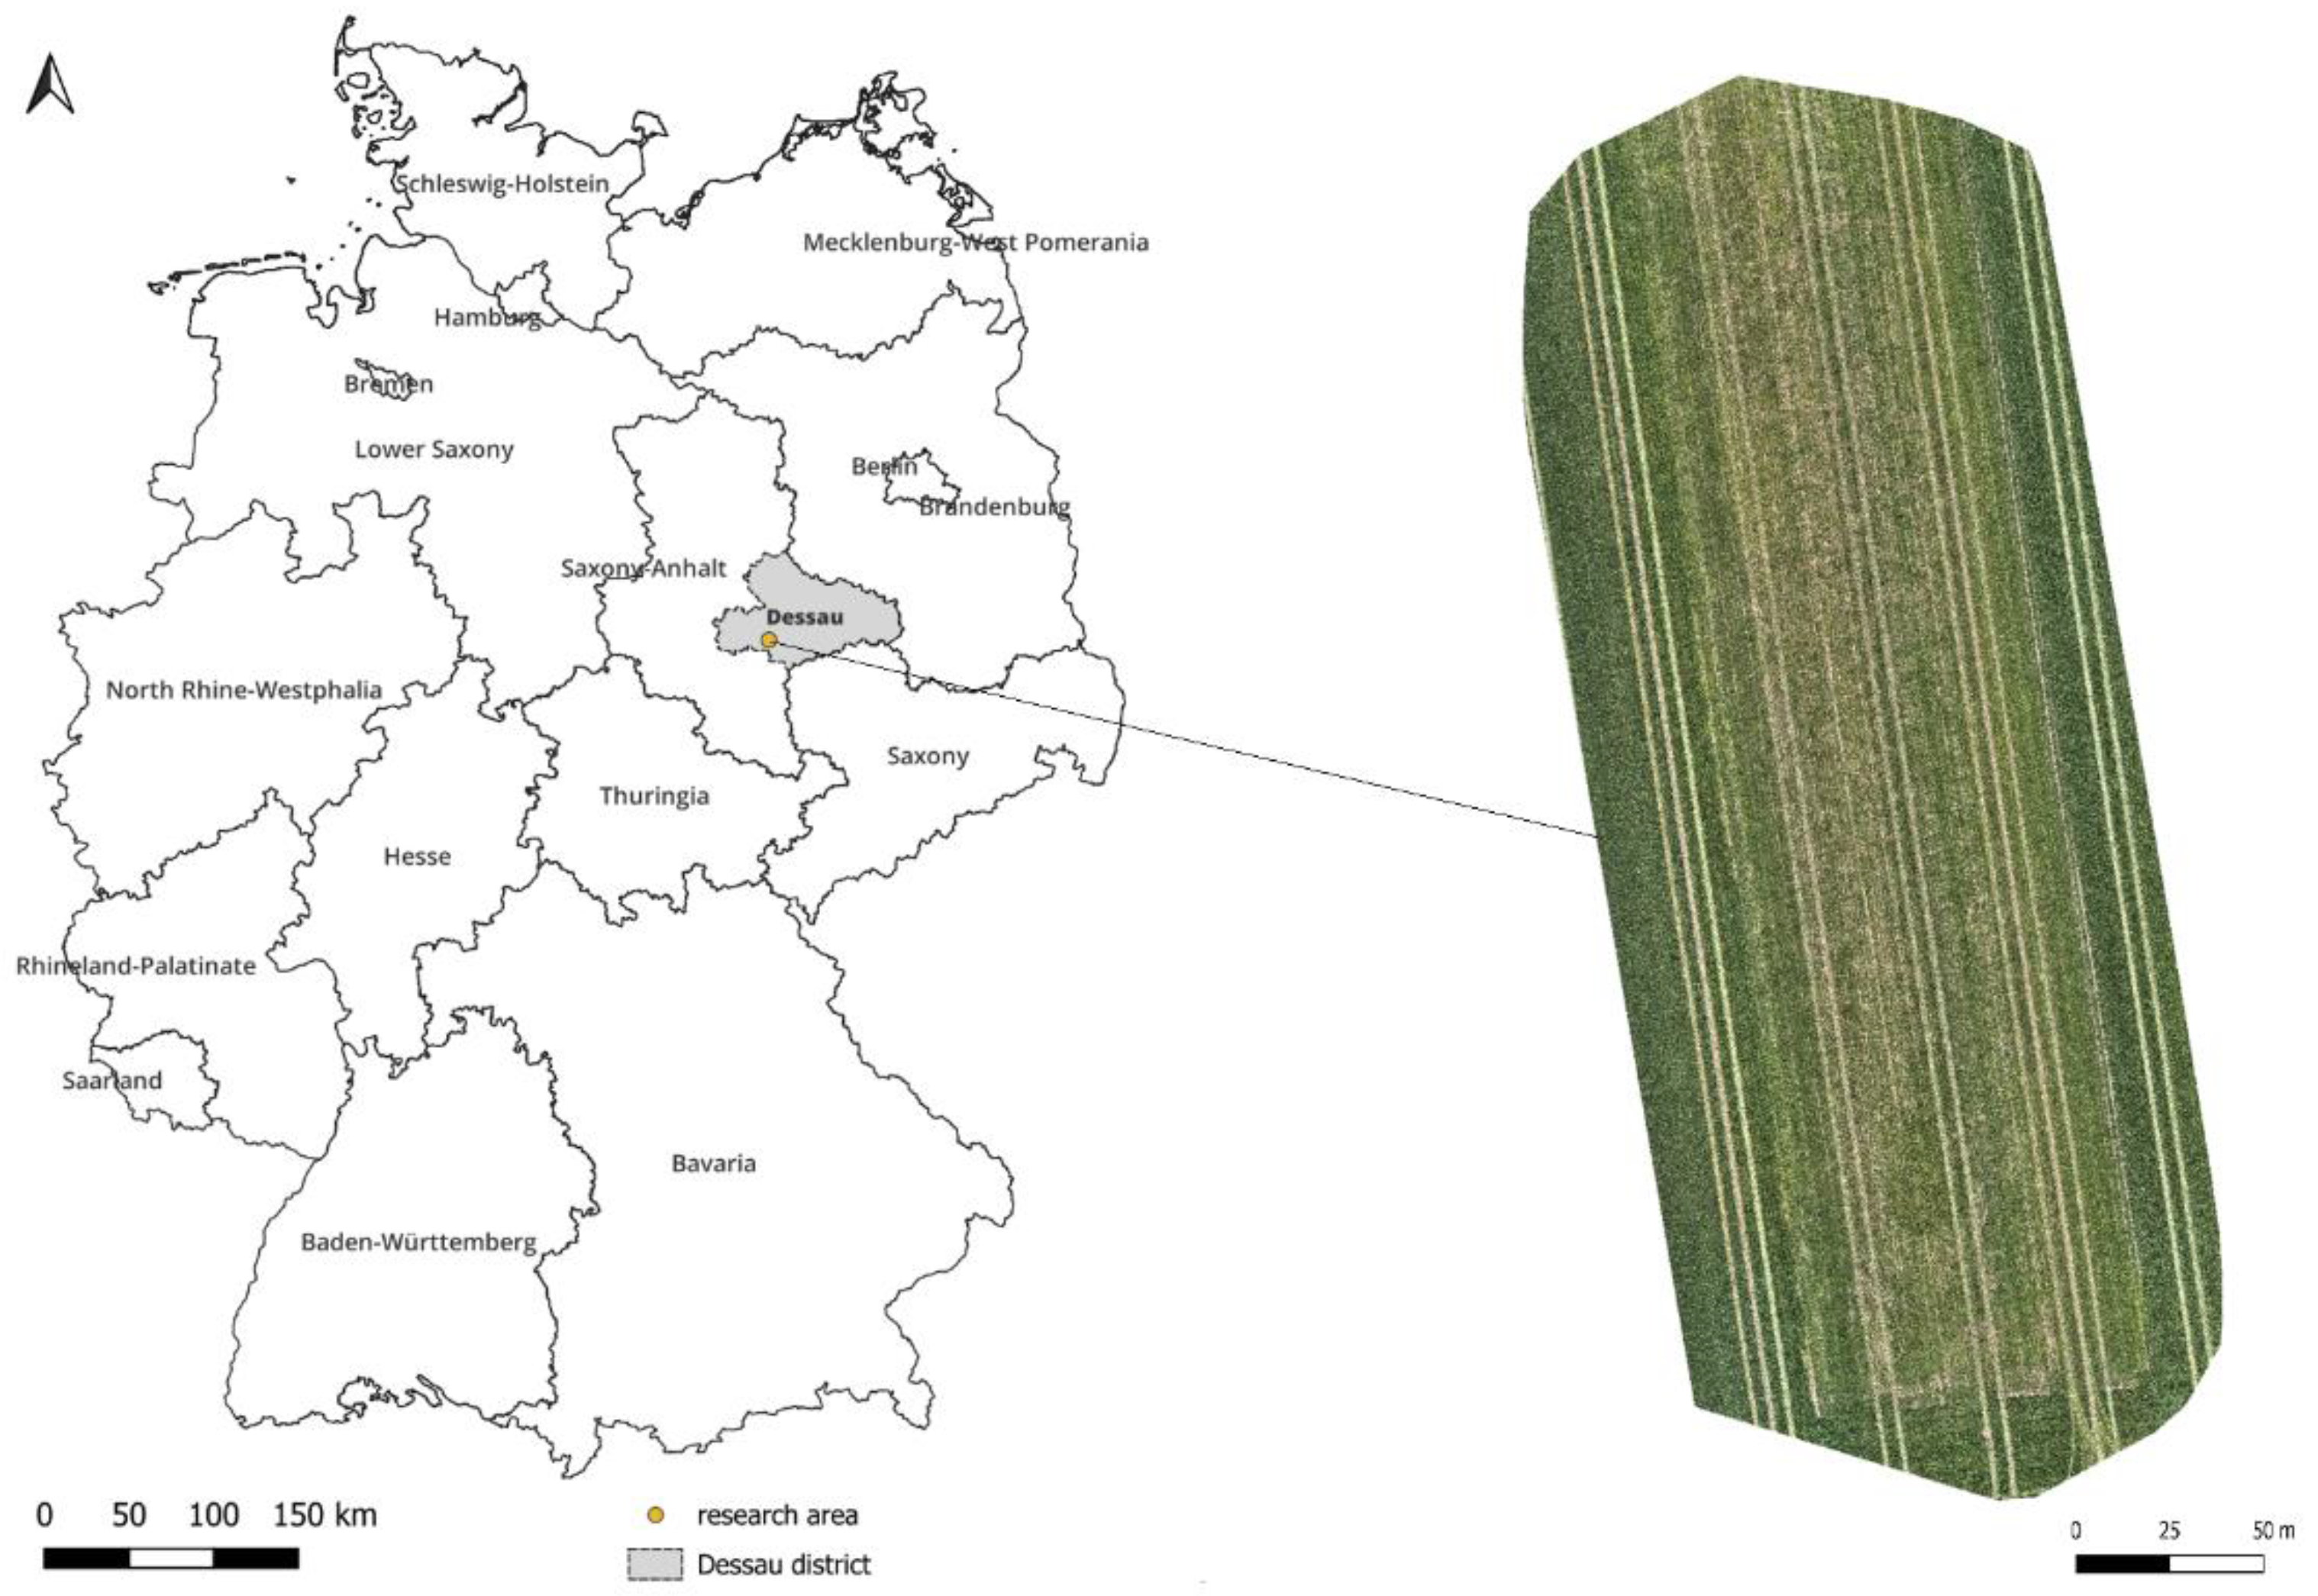
Figure 2.
Flight pattern, start point, end point and area of fine mapping.
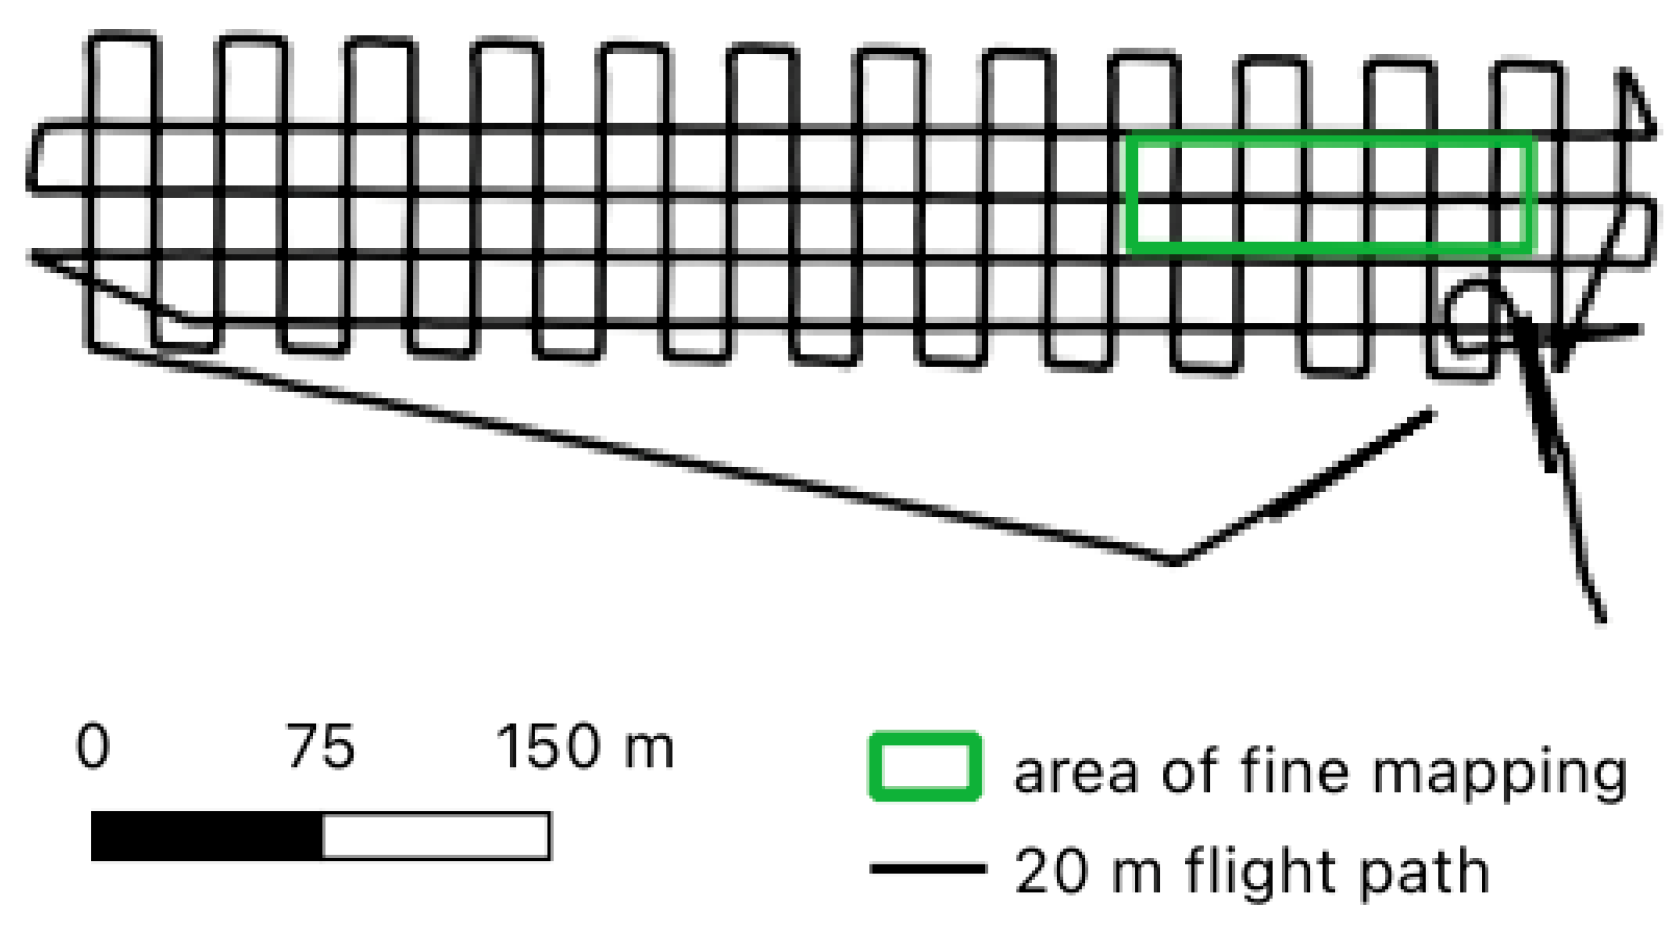
Figure 3.
Workflow of the burrow entrance detection algorithm, showing all core processing steps from LAS import to polygon classification.
Figure 3.
Workflow of the burrow entrance detection algorithm, showing all core processing steps from LAS import to polygon classification.
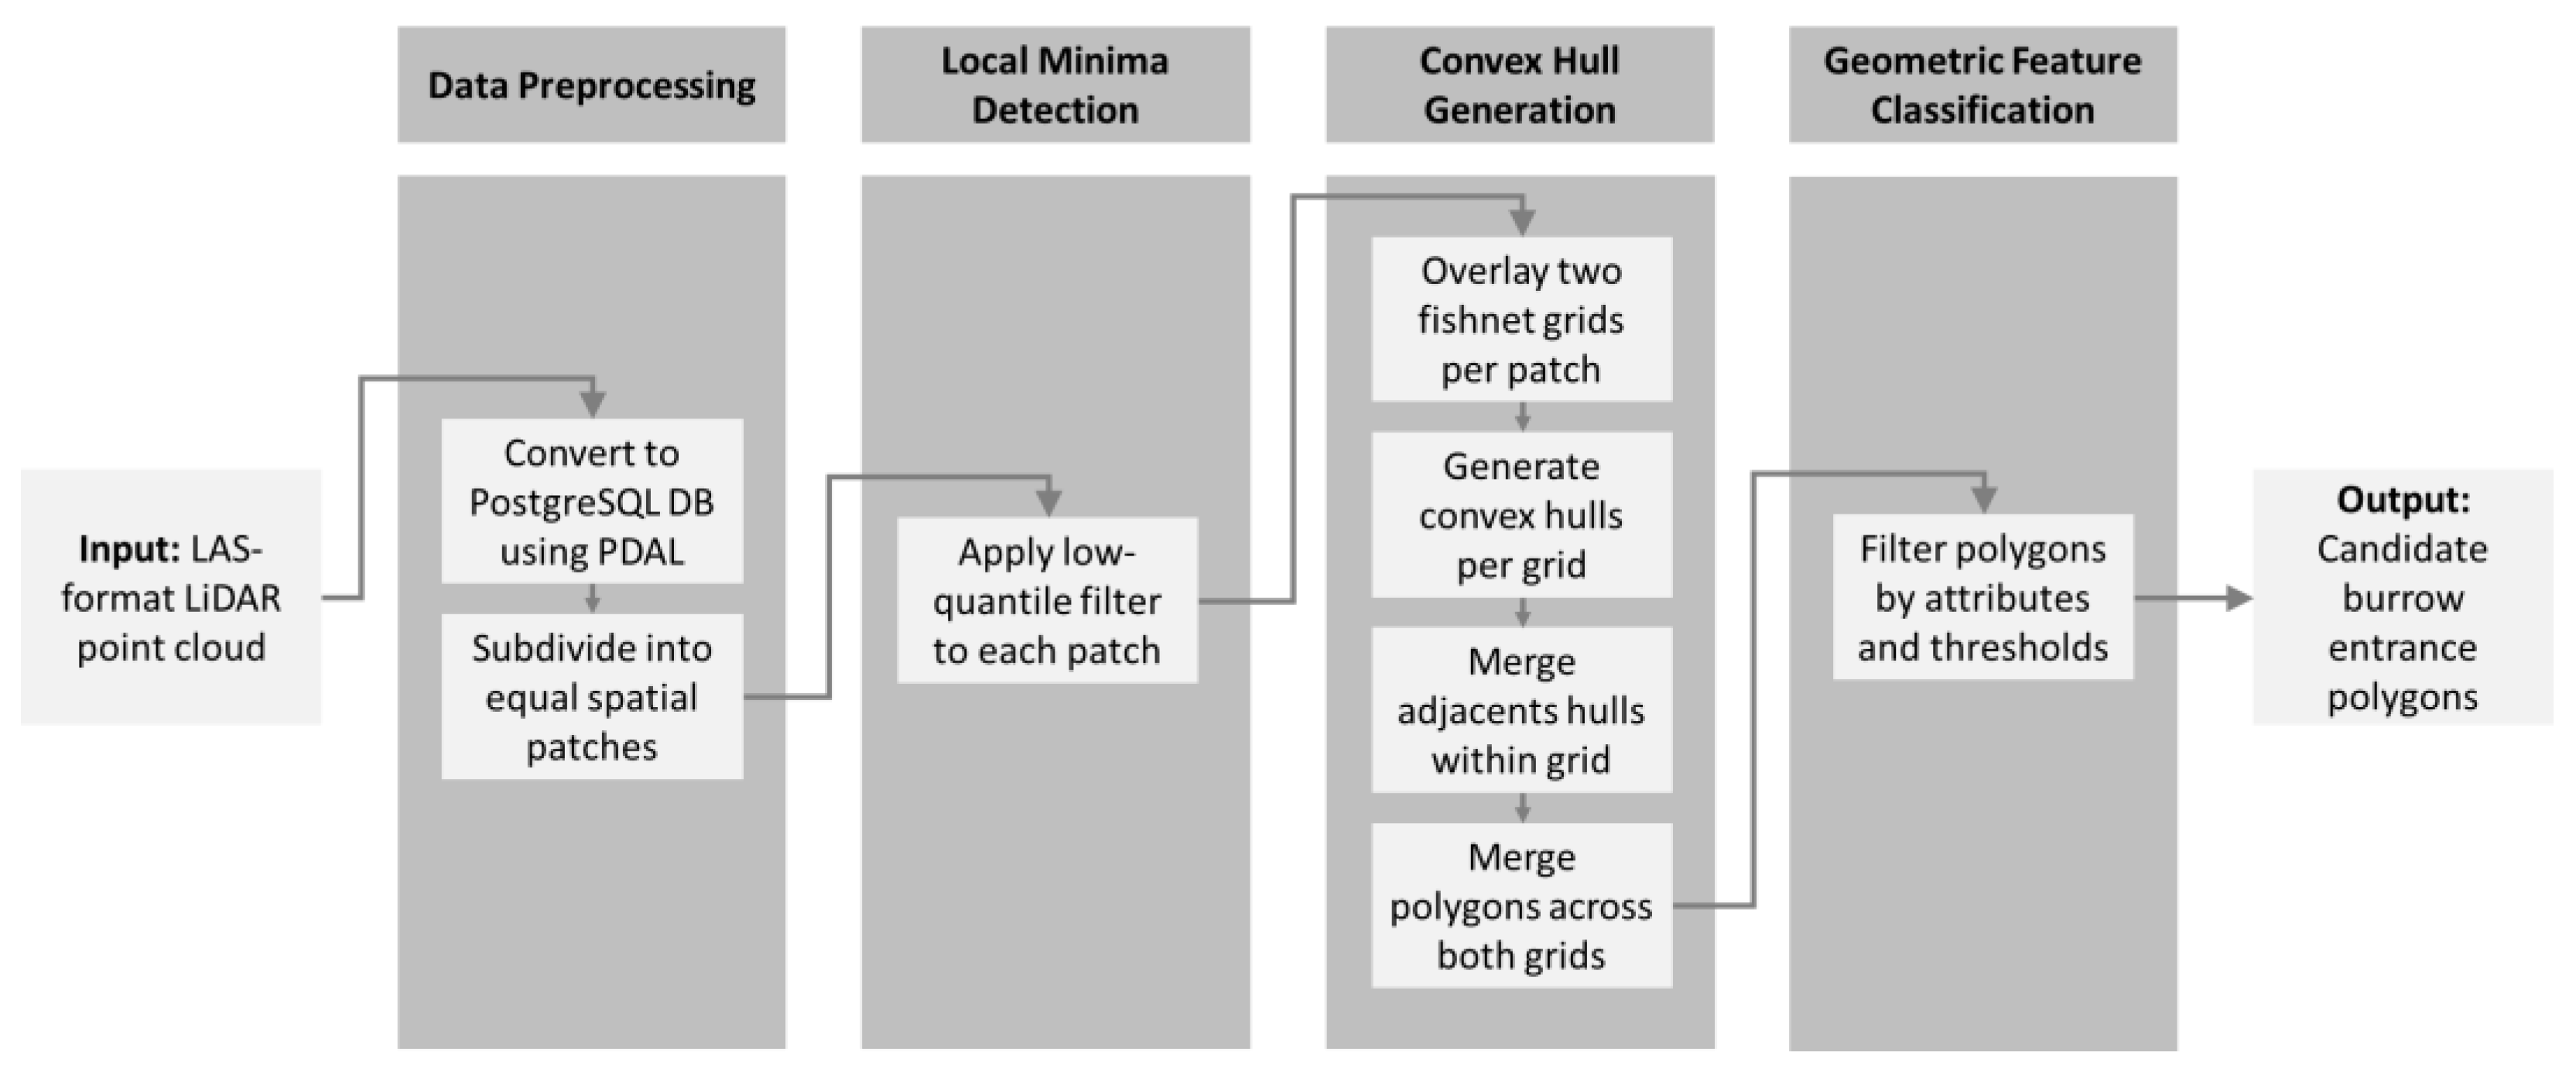
Figure 4.
Visualization of a 1 × 1 m patch with LiDAR point cloud classified by height. Points in the 0.1 % quantile (lowest elevation) are highlighted in magenta, representing candidate local depressions.
Figure 4.
Visualization of a 1 × 1 m patch with LiDAR point cloud classified by height. Points in the 0.1 % quantile (lowest elevation) are highlighted in magenta, representing candidate local depressions.
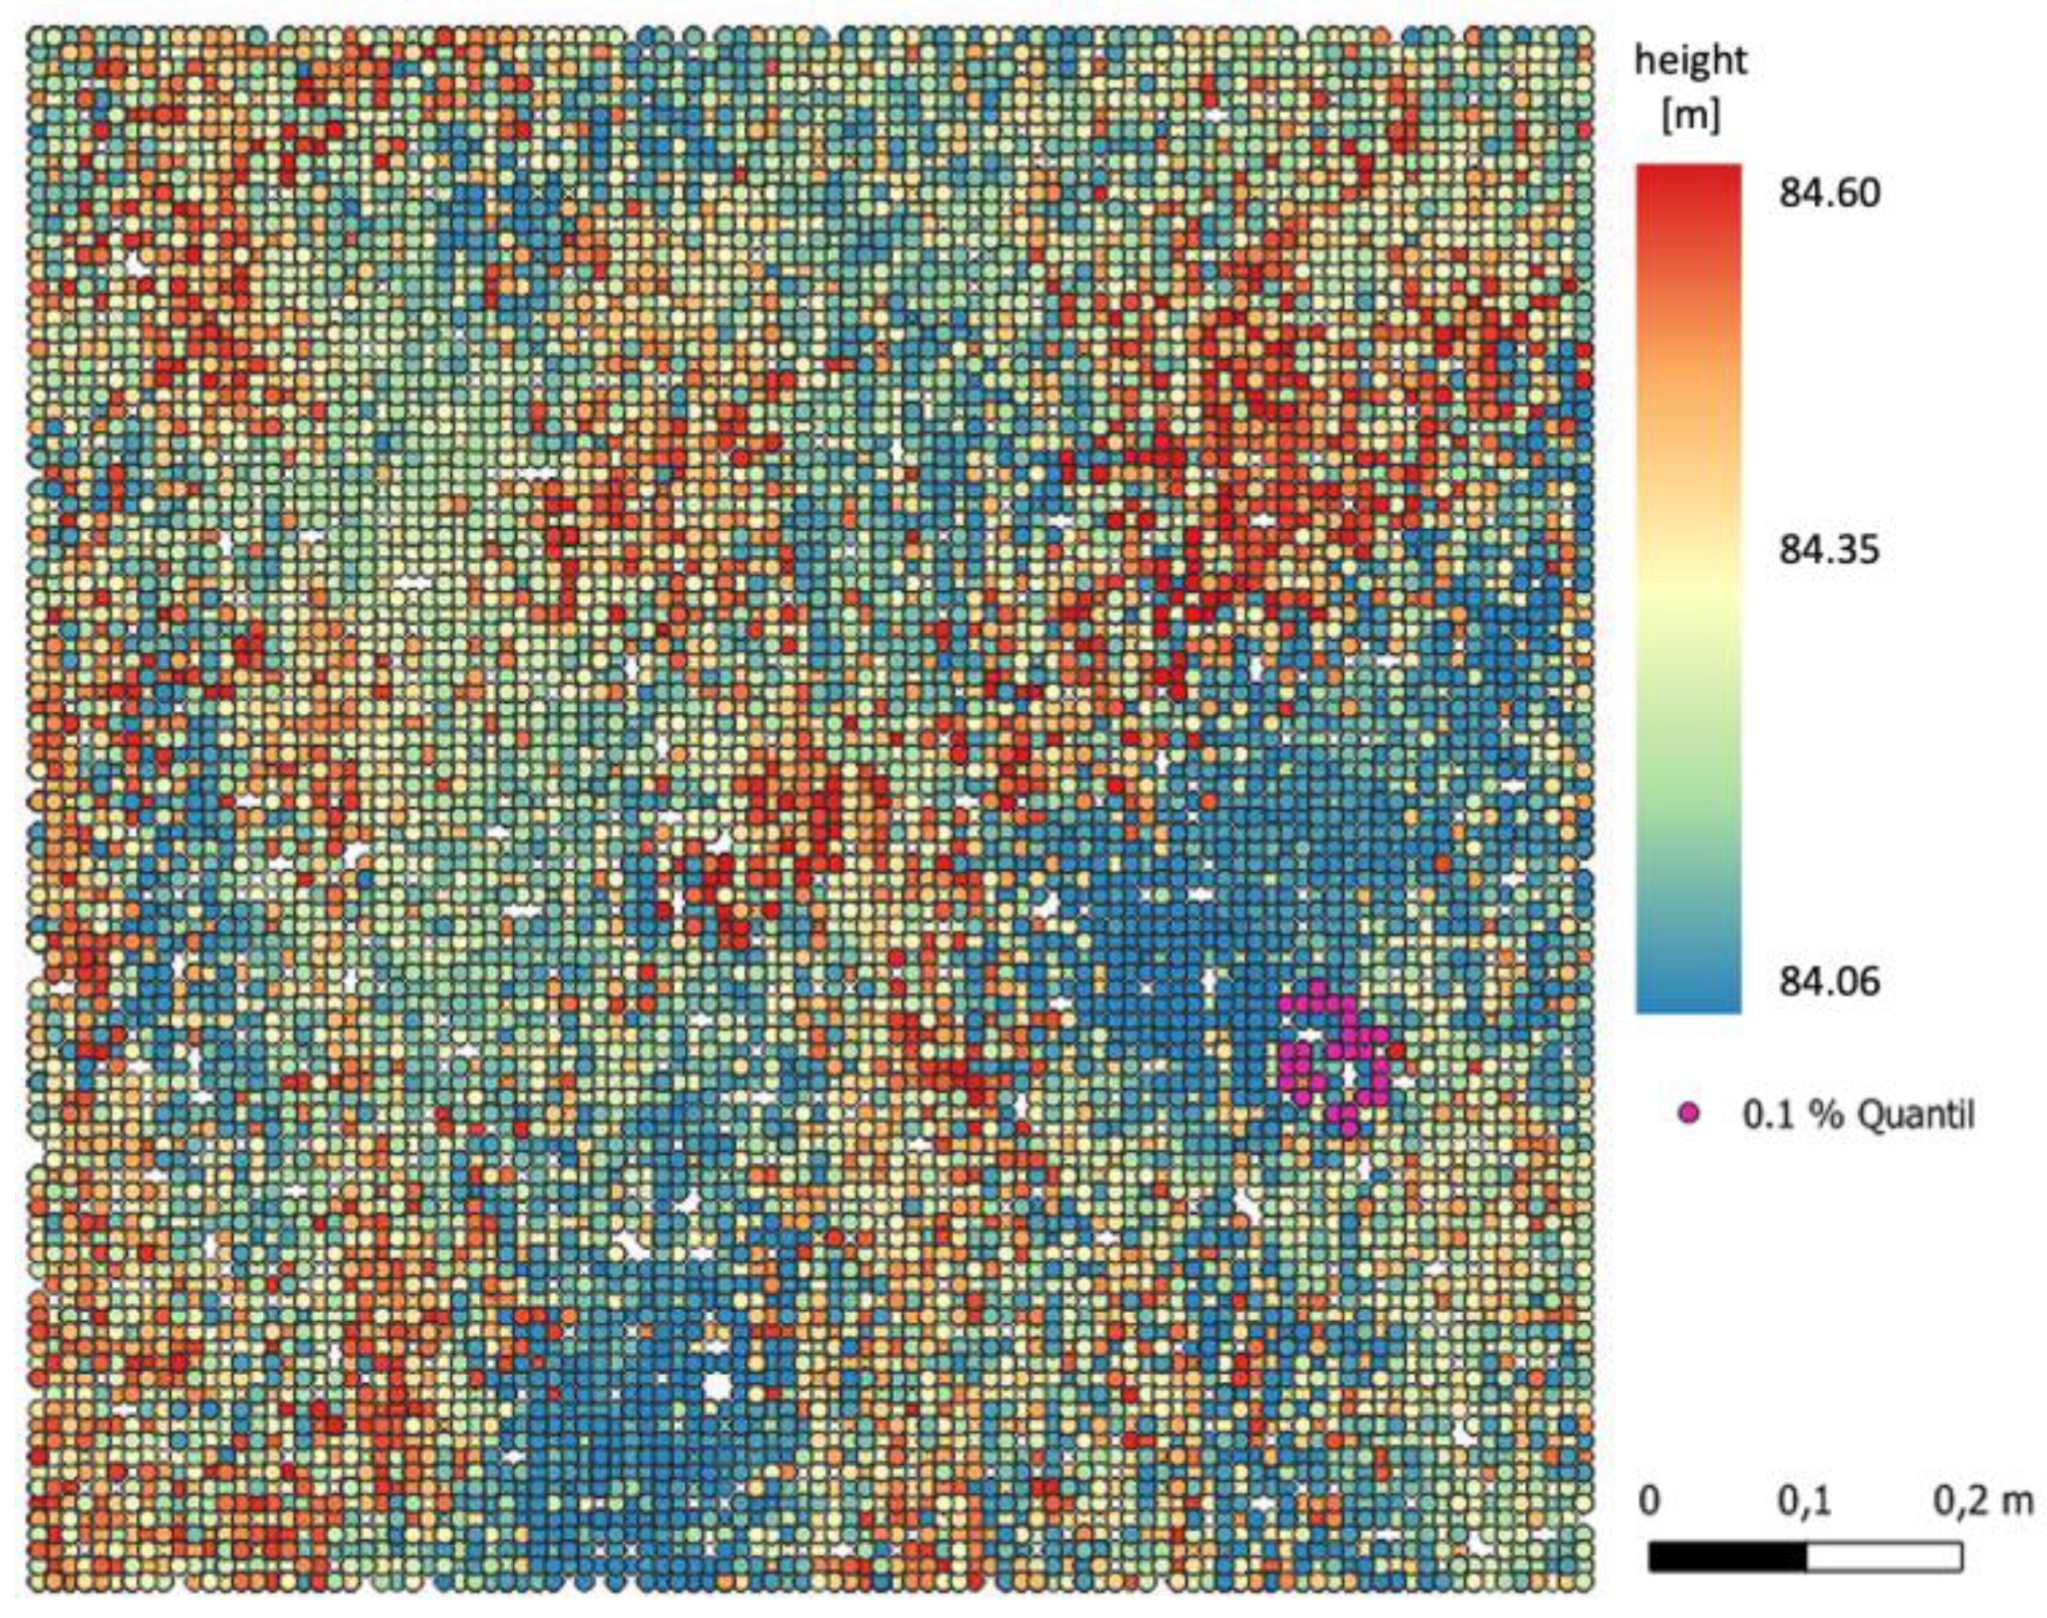
Figure 5.
Confirmed hamster burrow entrances from manual field mapping (white) and additionally identified burrows on RGB images (black) within the fine mapping area (red outline).
Figure 5.
Confirmed hamster burrow entrances from manual field mapping (white) and additionally identified burrows on RGB images (black) within the fine mapping area (red outline).

Figure 6.
Example of a filtered candidate burrow polygon showing: (a) convex hull within a 1 × 1 m patch, (b) attribute summary of a hamster burrow, (c) vertical profile along the x-axis, and (d) vertical profile along the y-axis.
Figure 6.
Example of a filtered candidate burrow polygon showing: (a) convex hull within a 1 × 1 m patch, (b) attribute summary of a hamster burrow, (c) vertical profile along the x-axis, and (d) vertical profile along the y-axis.
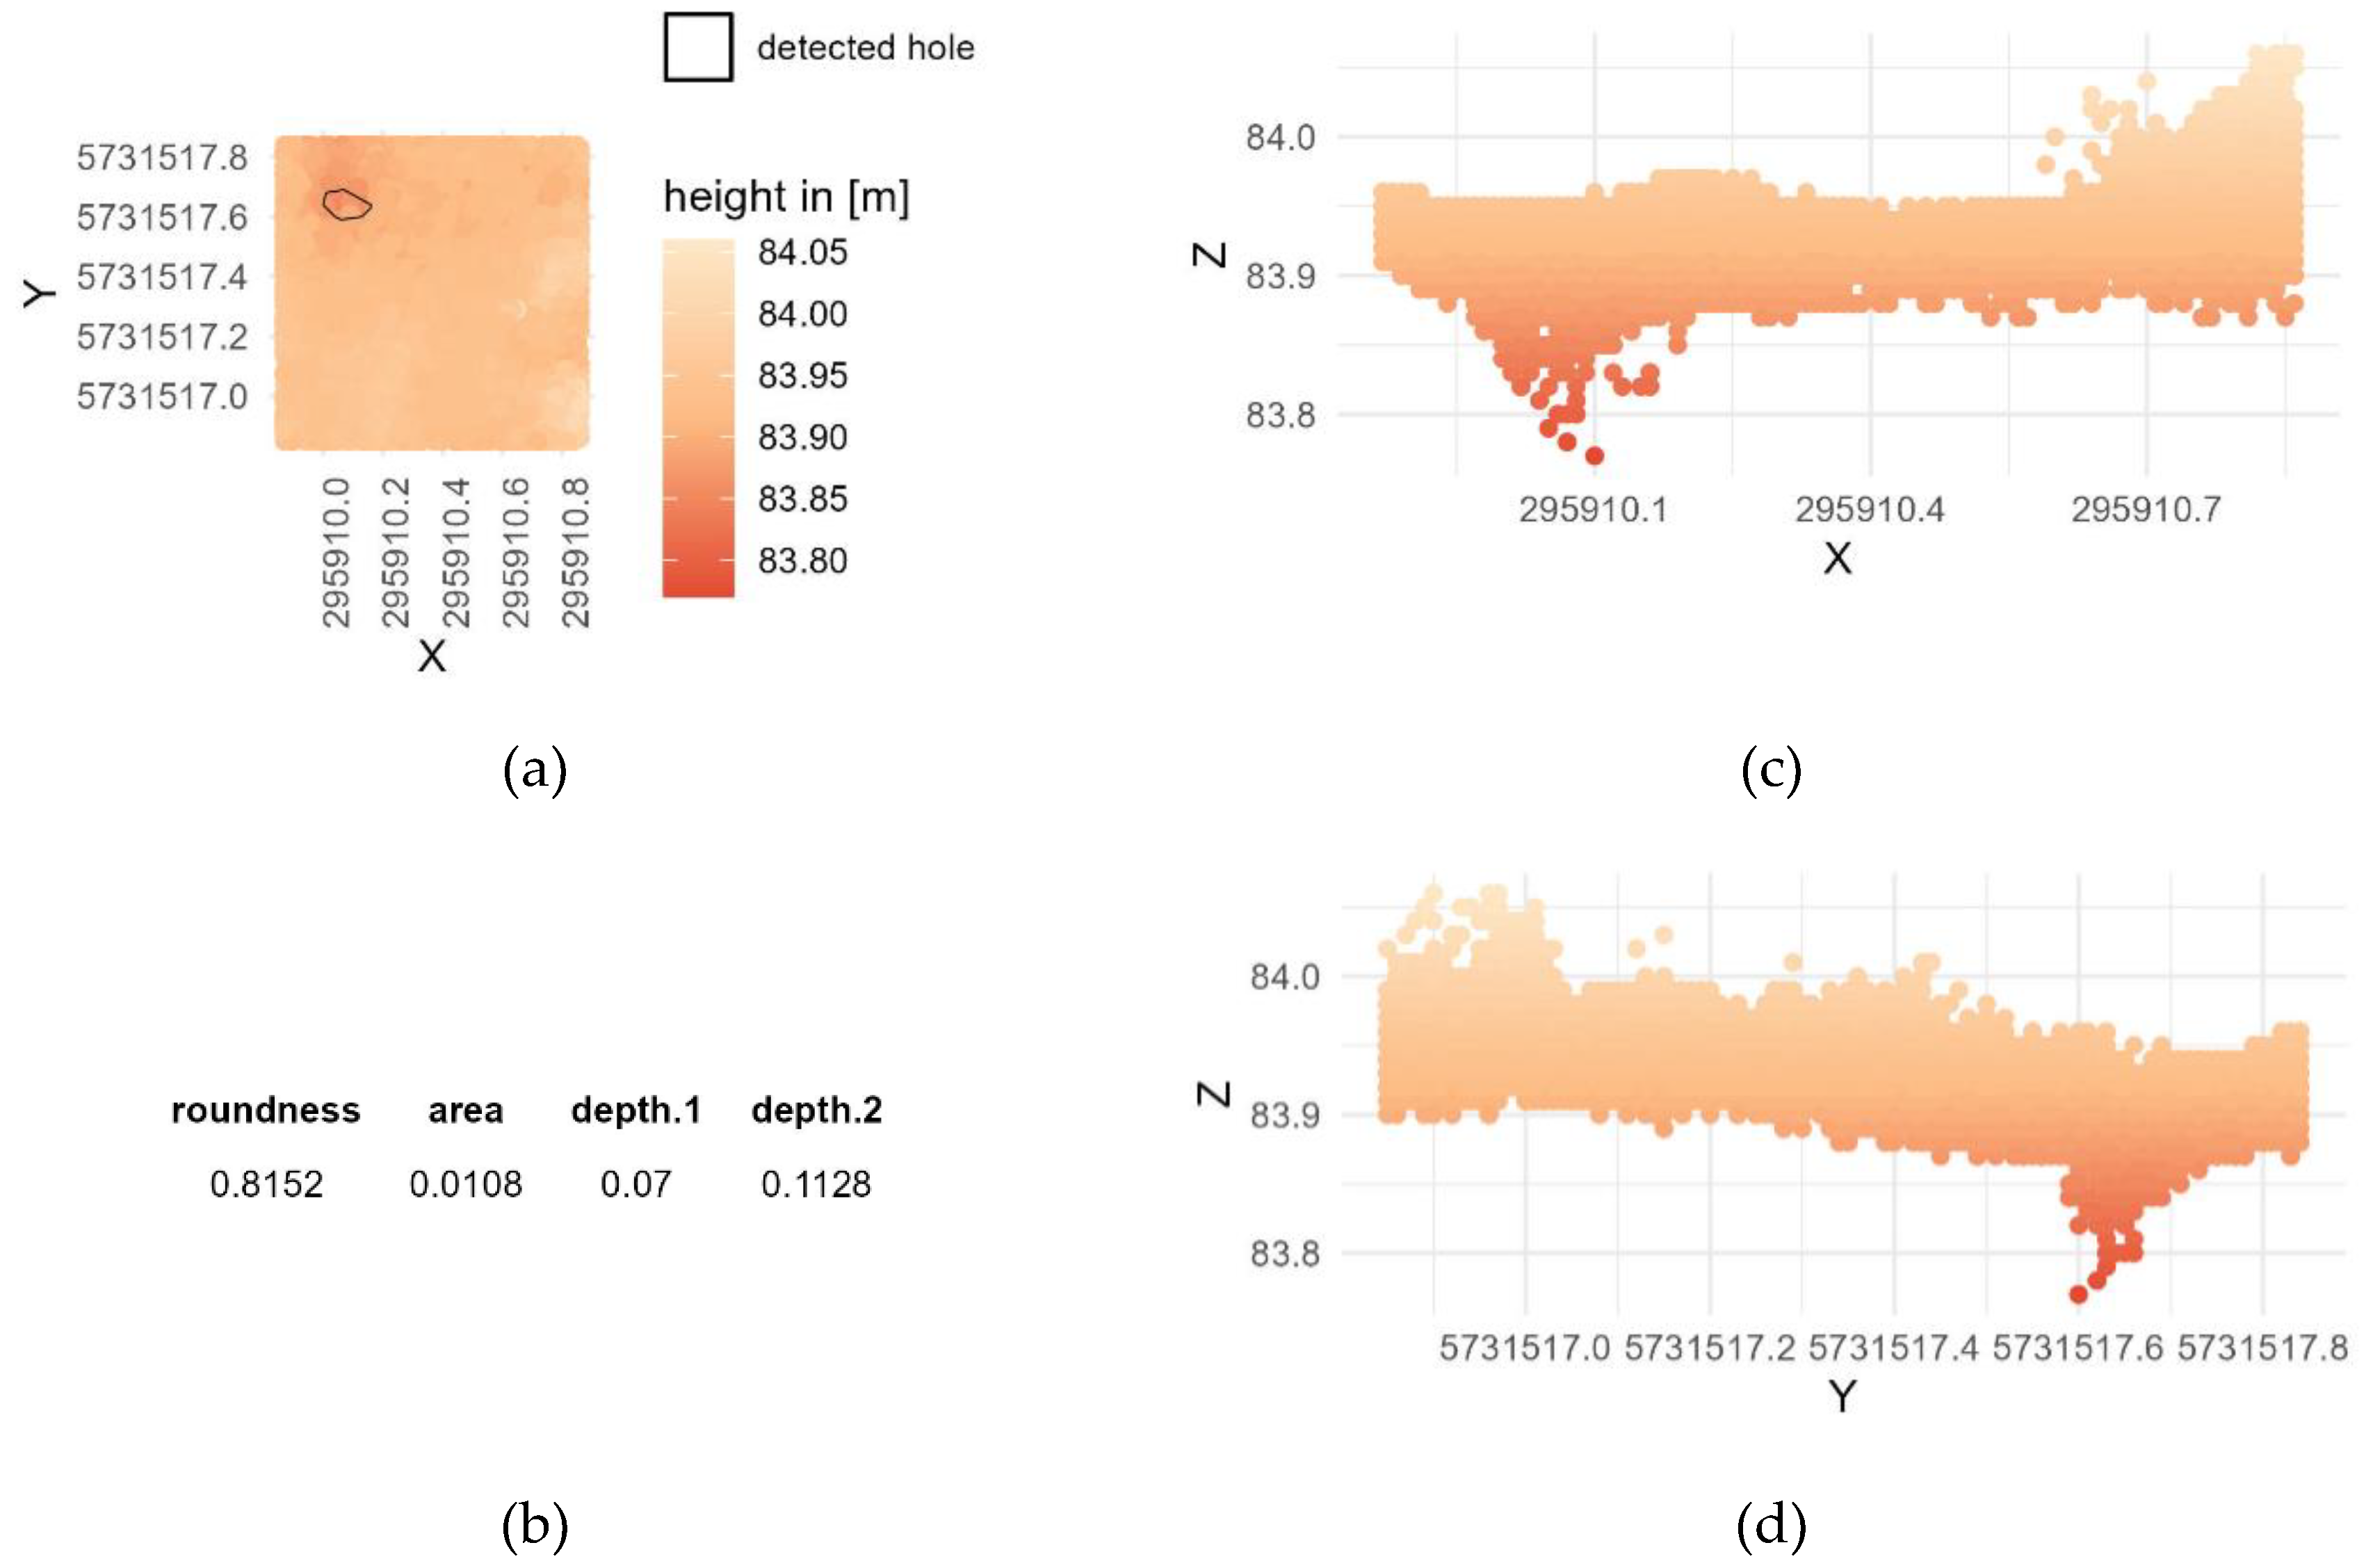
Figure 7.
Laser scan of a specific hamster burrow entrances displayed as a point clouds from three different datasets, (a) Voyager 20m, (b) Voyager 30m, and (c) Voyager 120m.
Figure 7.
Laser scan of a specific hamster burrow entrances displayed as a point clouds from three different datasets, (a) Voyager 20m, (b) Voyager 30m, and (c) Voyager 120m.
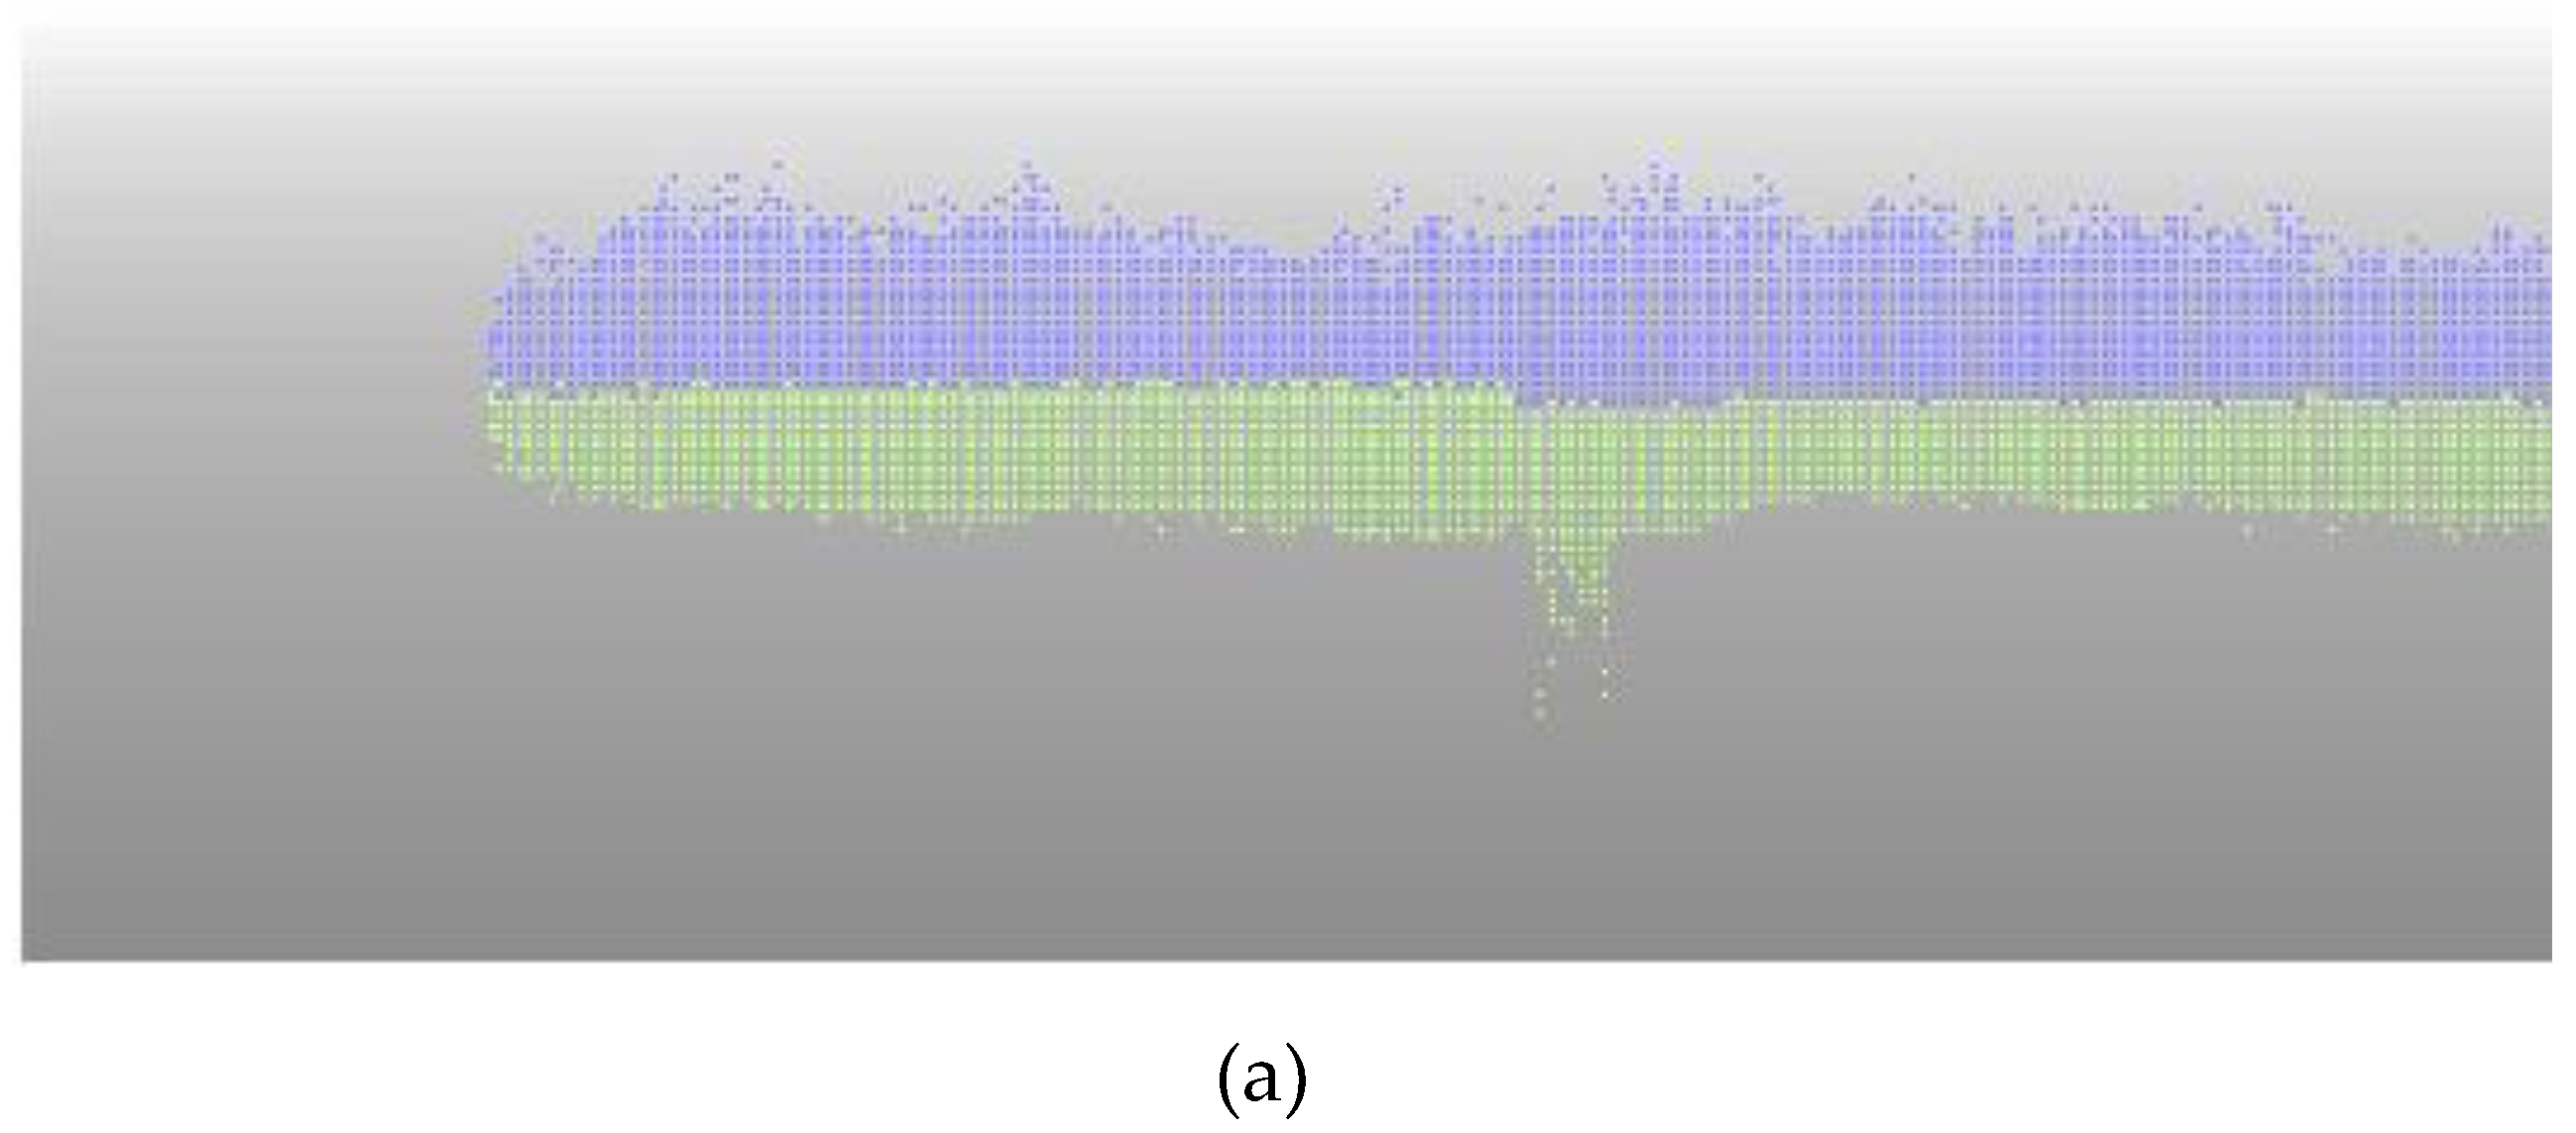
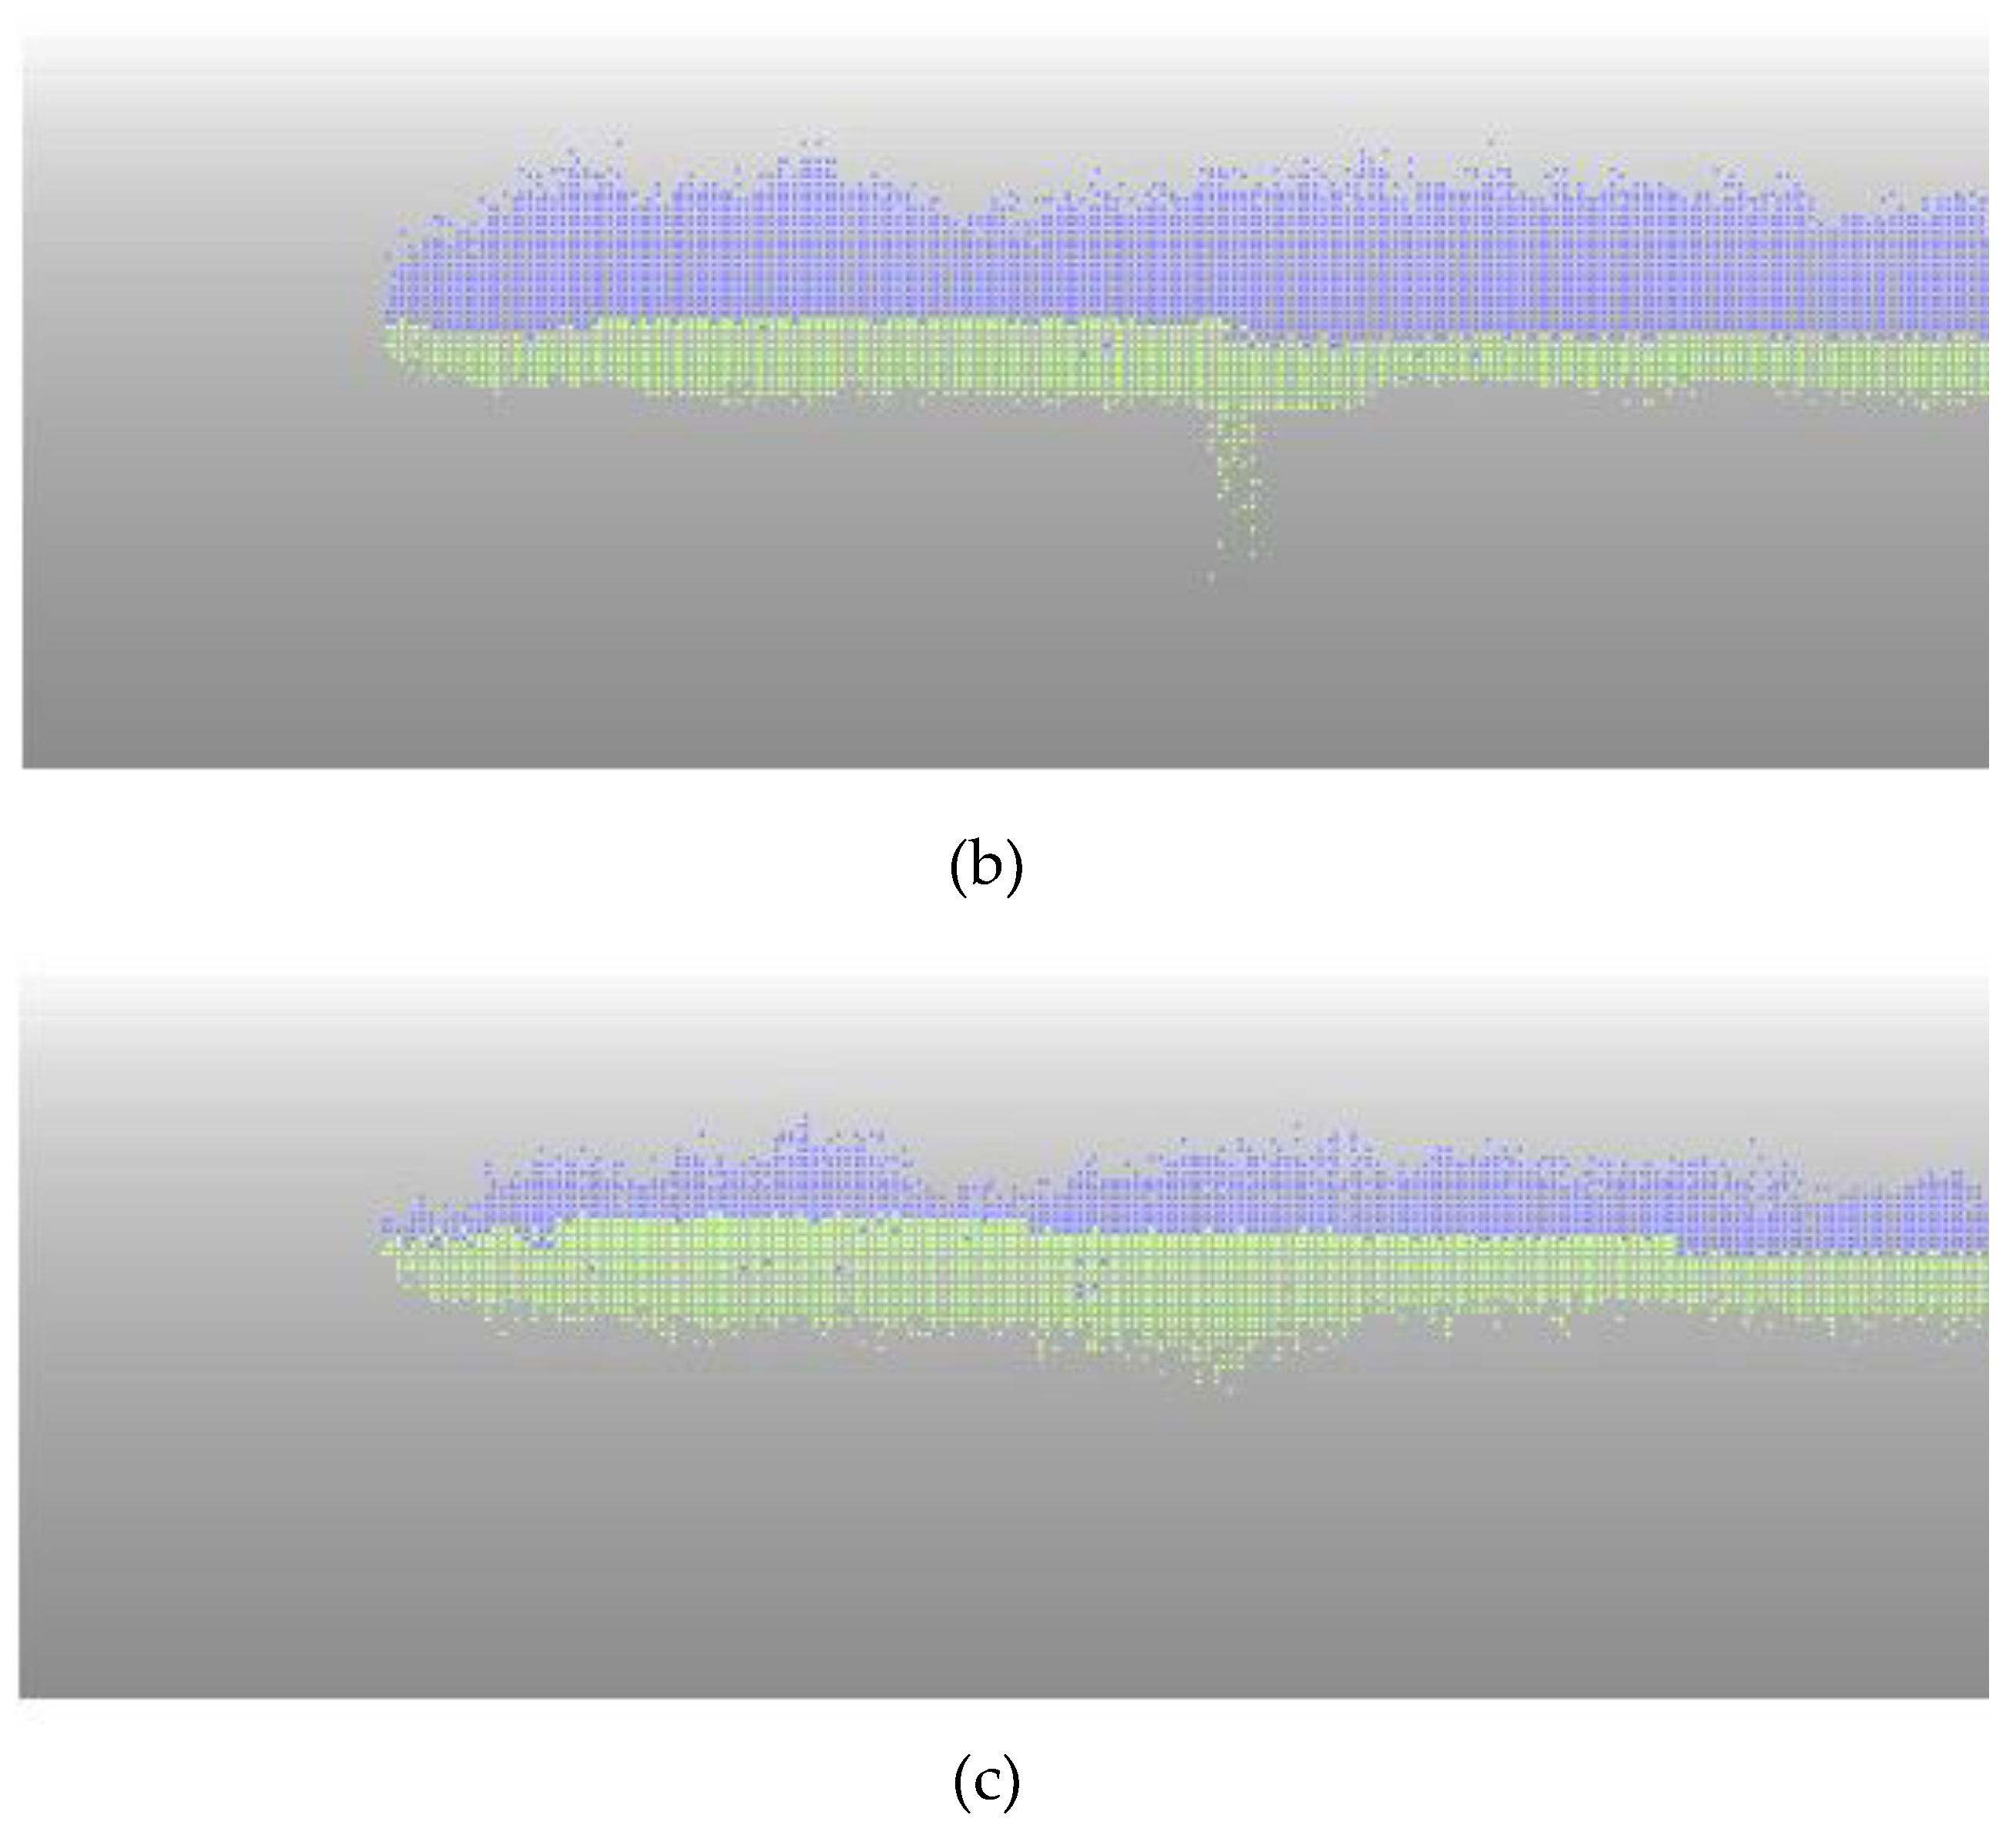
Figure 8.
View of the 20 m LAS File with outlined hamster burrow entrances.
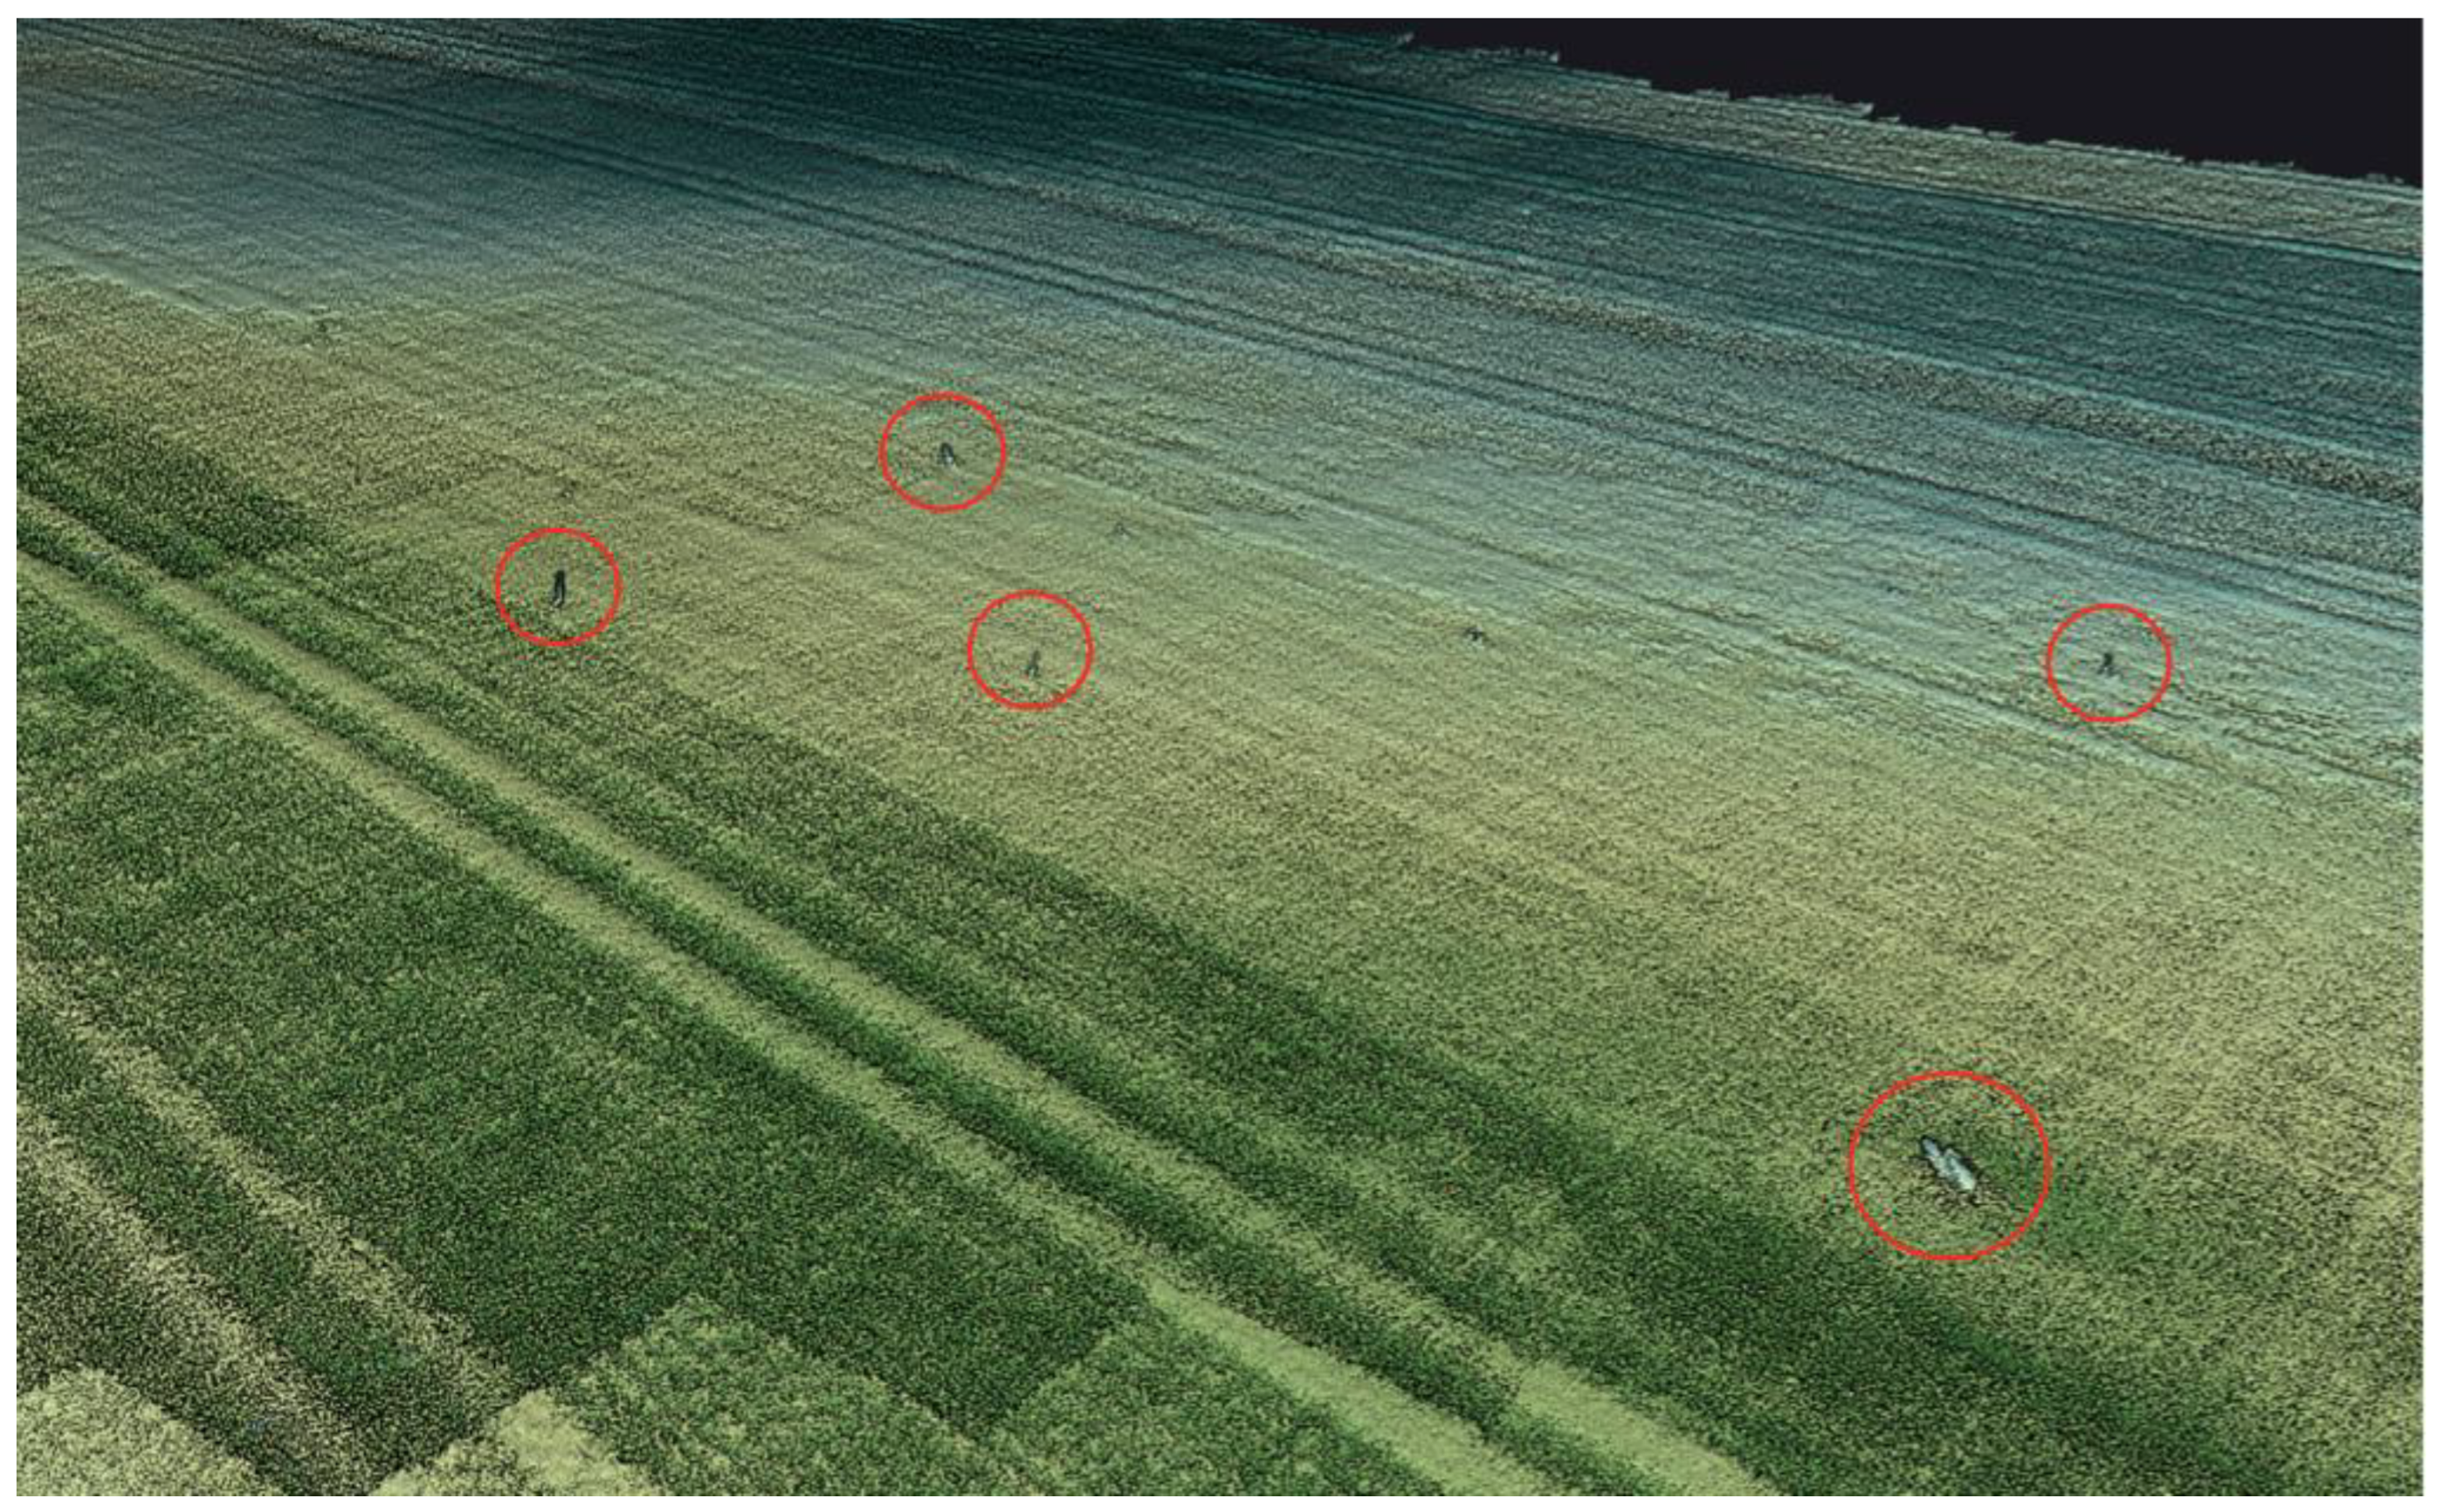
Figure 9.
Detection outcomes across all LiDAR datasets.
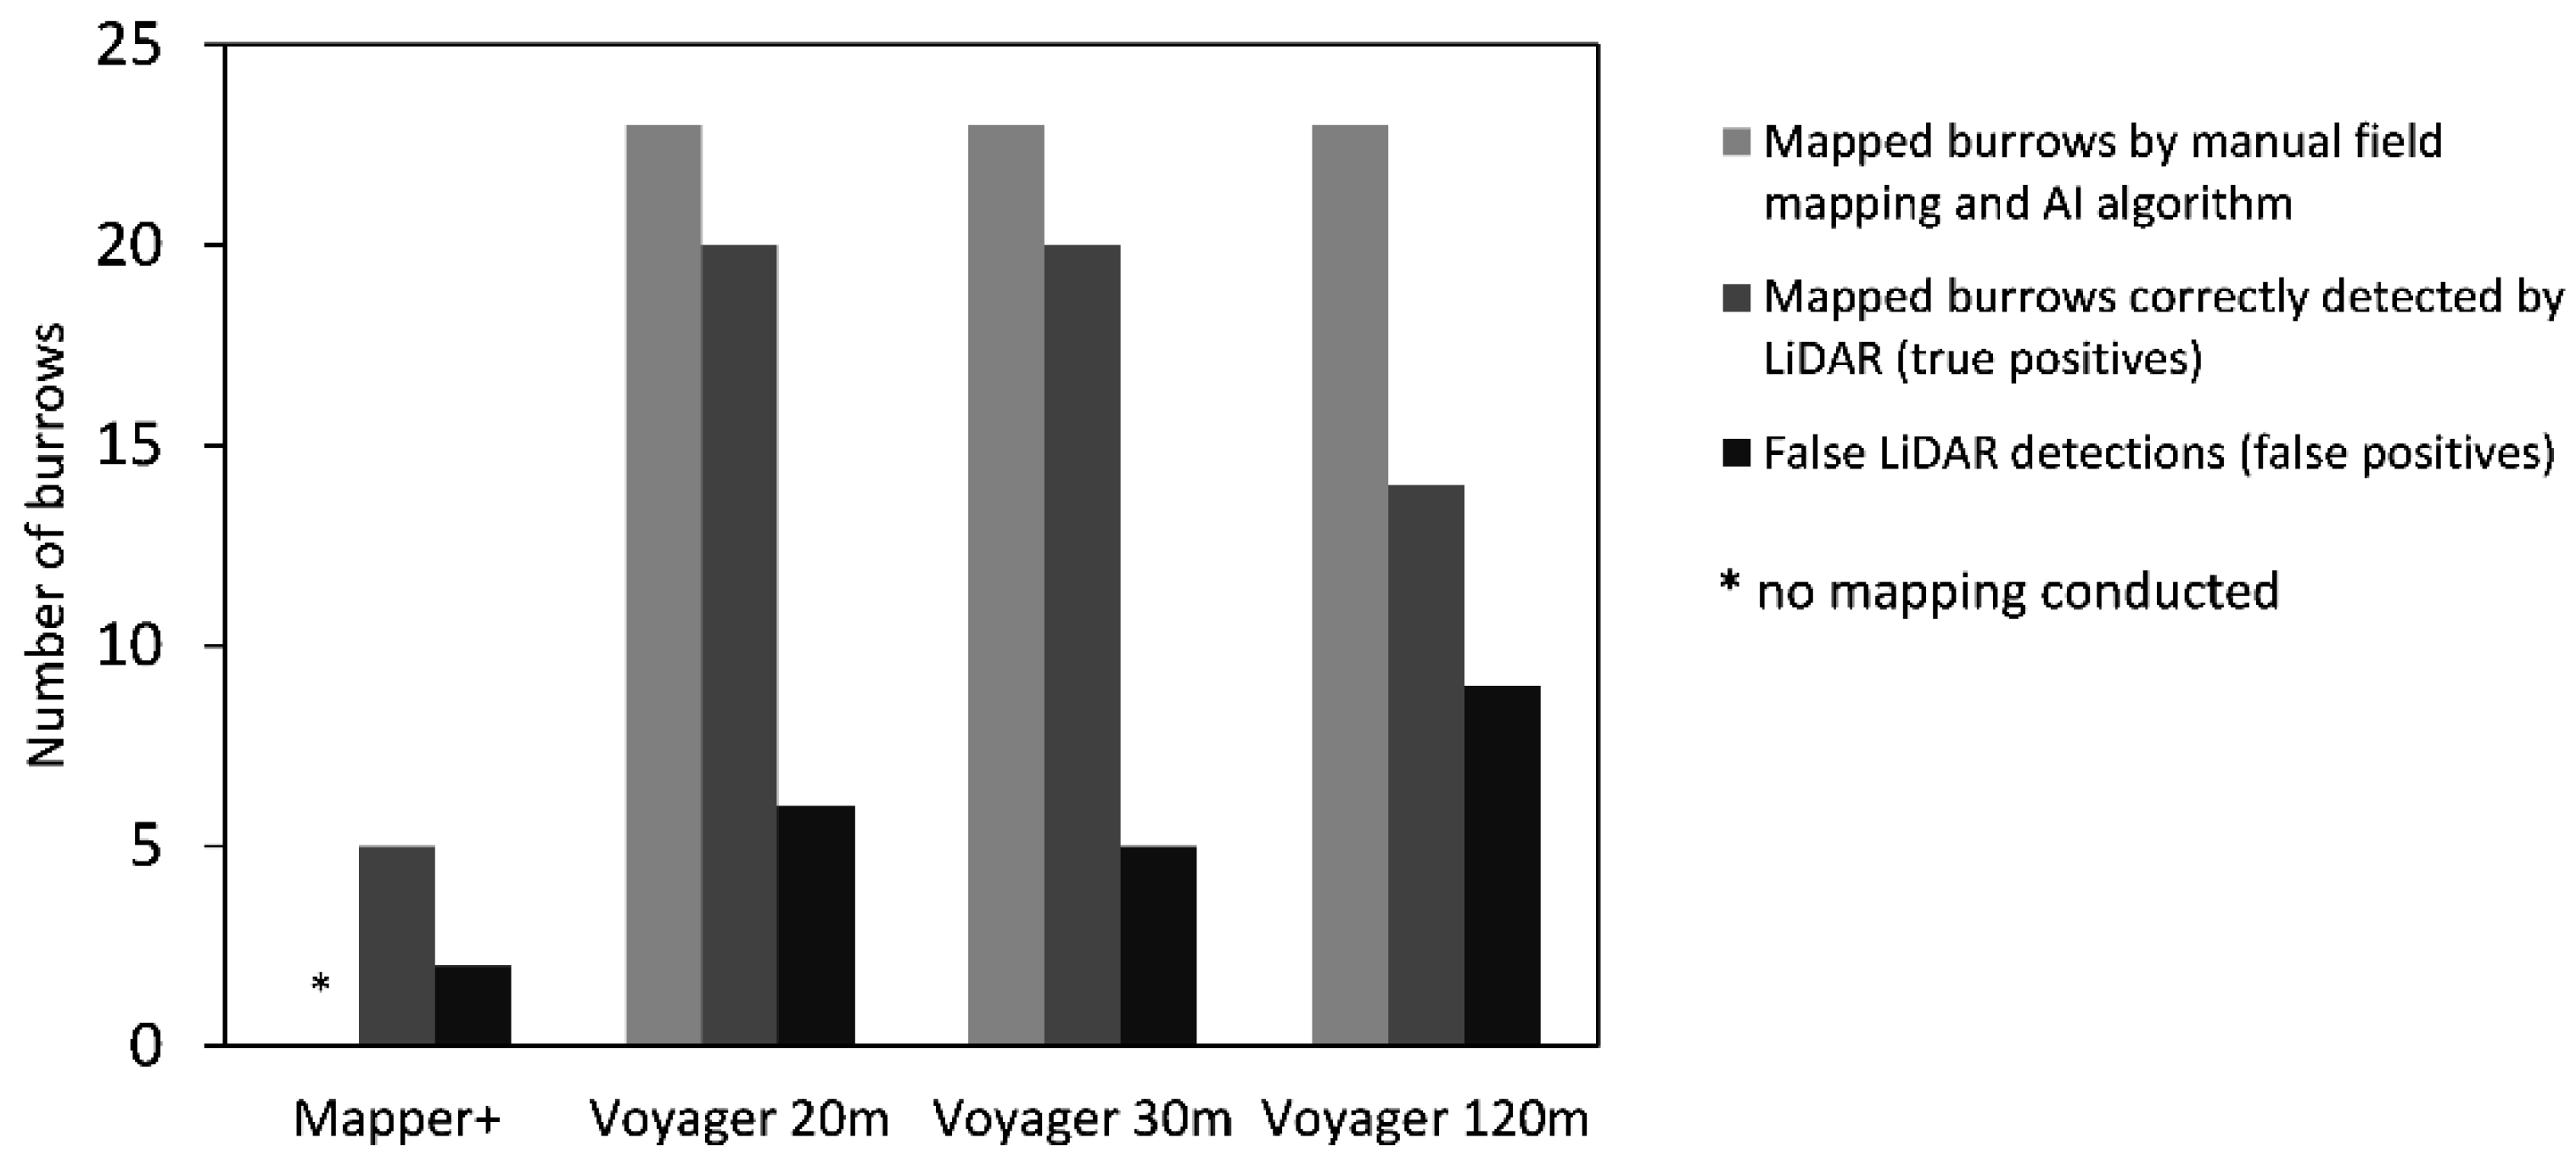
Figure 10.
Scatterplot of the nPoints attribute for all candidate polygons in the 20 m dataset. Red points indicate points within confirmed burrow entrances, while black points represent all polygons detected by the algorithm. The lower density of confirmed detections below 10 points supports the selected threshold.
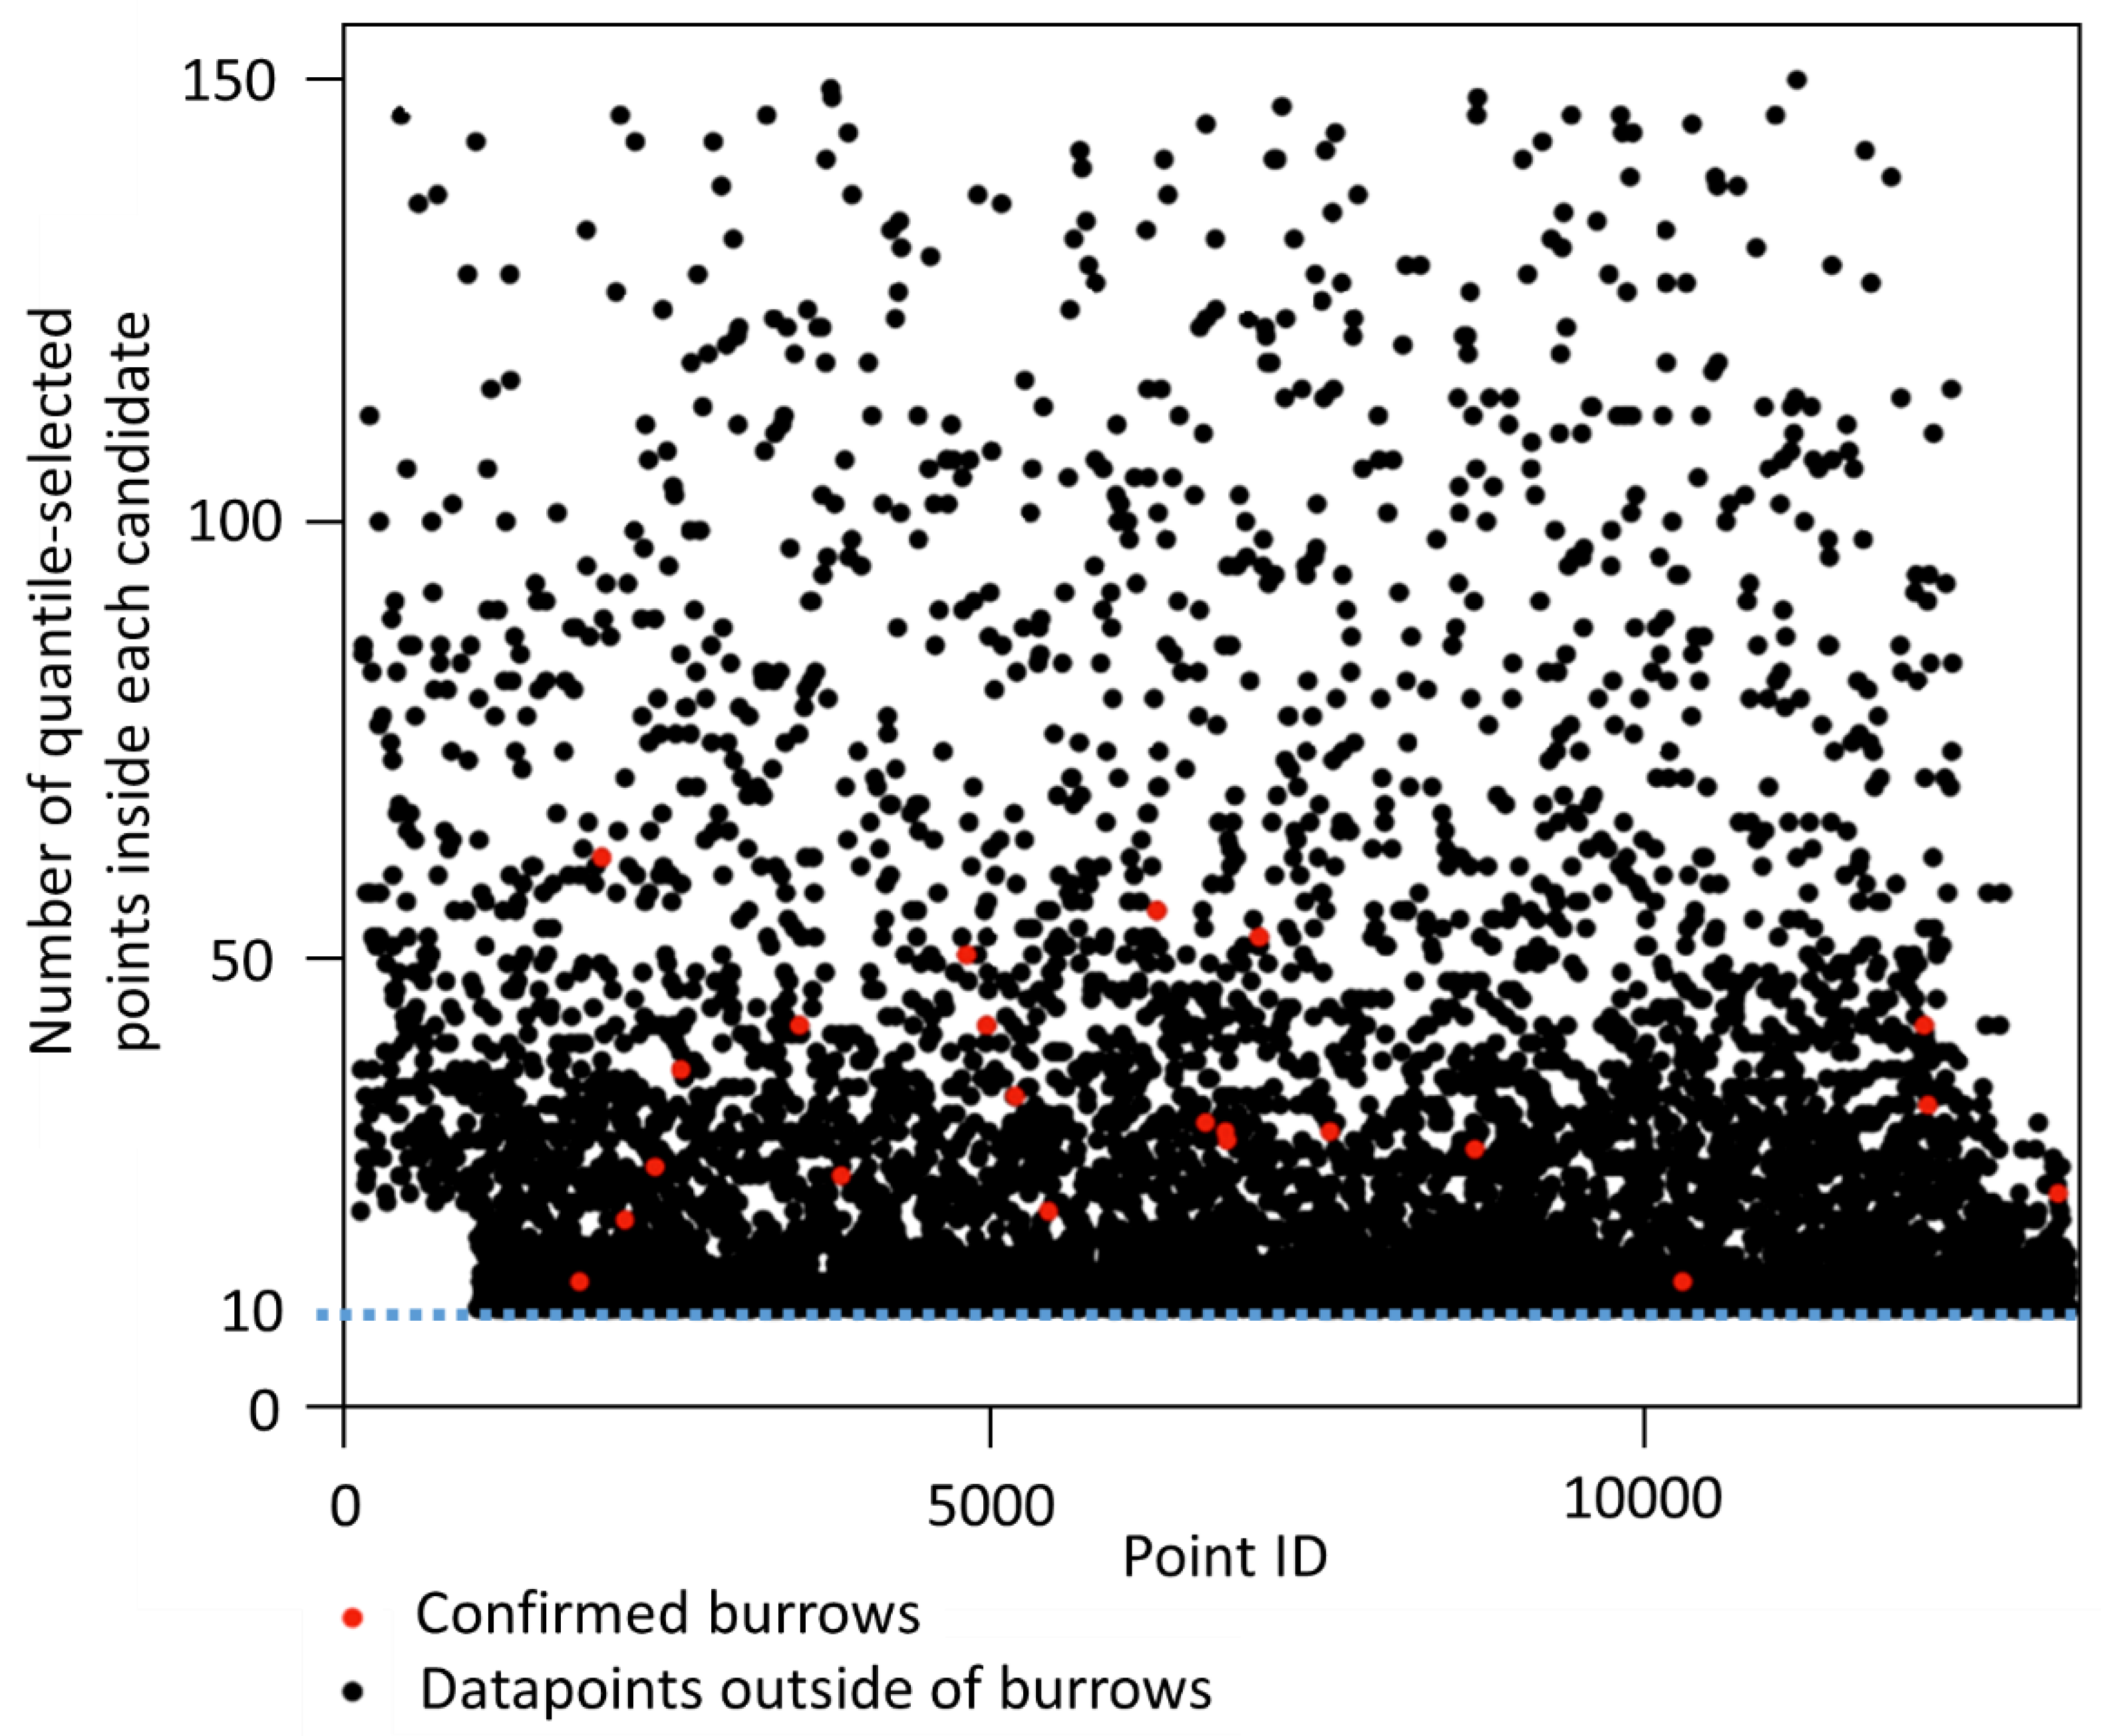

Table 1.
Overview of UAV-based LiDAR datasets used in the study, including sensor specifications, platform types, flight altitudes, acquisition dates, and resulting point cloud densities.
Table 1.
Overview of UAV-based LiDAR datasets used in the study, including sensor specifications, platform types, flight altitudes, acquisition dates, and resulting point cloud densities.
| Dataset name | Mapper+ | Voyager 20m | Voyager 30m | Voyager 120m |
| Sensor | YellowScan Mapper+ | YellowScan Voyager | YellowScan Voyager | YellowScan Voyager |
| UAV platform | DJI M600 | Acecore NOA | Acecore NOA | Acecore NOA |
| Flight date | 31. Aug 22 | 5 May 2023 | 5 May 2023 | 5 May 2023 |
| Altitude [m] | 30 | 20 | 30 | 120 |
| Precision [cm] | 2.5 | 0.5 | 0.5 | 0.5 |
| Accuracy [cm] | 3 | 1 | 1 | 1 |
| Maximum echoes | 3 | 15 | 15 | 15 |
| Point density [pts/m²] | 6360 | 22583 | 14587 | 2972 |
| Used in accuracy evaluation | No* | Yes | Yes | Yes |
| * Due to the significant temporal gap between the Mapper+ dataset and the 2023 reference mapping, it was excluded from the main detection accuracy analysis. | ||||
Table 2.
Overview of geometric features and thresholds applied to filter potential burrow entrances.
Table 2.
Overview of geometric features and thresholds applied to filter potential burrow entrances.
| Attribute | Description or calculation | Filter threshold | Justification |
| Roundness | Calculated using the common circularity index , where values close to 1 indicate a near-perfect circle and values near 0 indicate elongation or irregularity [15]. |
≥ 0.54 | Excludes elongated or fragmented shapes not consistent with burrow entrance morphology. |
| Area | The surface area enclosed by the convex hull. | ≤ 0.05 m² | Based on maximum observed burrow footprint in field measurements. |
| Depth 1 | The vertical range within the convex hull, i.e., the difference between its highest and lowest point. | ≥ 0.07 m | Ensures sufficient vertical depression within the polygon. |
| Depth 2 | The difference between the average elevation in a 10 cm radius surrounding the polygon and its lowest point, providing a measure of its contrast to the immediate neighborhood. | ≥ 0.15 m | Captures the relative depression compared to the local terrain. |
| nPoints | The number of quantile-selected points forming the polygon. | ≥ 10 | Guarantees a minimal structural density and prevents noise-driven detections. |
Table 3.
Morphometric properties of manually mapped European hamster burrow entrances from the field survey.
Table 3.
Morphometric properties of manually mapped European hamster burrow entrances from the field survey.
| Type of hole | Number | Burrow depth [cm] | Burrow entrance diameter [cm] | Feeding circle diameter [cm] | ||||||
| Minimum | Maximum | Mean | Minimum | Maximum | Mean | Minimum | Maximum | Mean | ||
| Drop-hole | 14 | 23.0 | 119.0 | 61.7 | 4.5 | 8.5 | 6.7 | 20.0 | 40.0 | 28.6 |
| Slip-hole | 2 | 28.0 | 50.0 | 39.0 | 6.0 | 7.0 | 6.5 | 40.0 | 60.0 | 50.0 |
Table 4.
Detection performance metrics for the four datasets.
| Metric | Mapper+ | Voyager 20m | Voyager 30m | Voyager 120m |
| Precision | 0.71 | 0.77 | 0.80 | 0.61 |
| Recall | - | 0.87 | 0.87 | 0.61 |
| F1-score | - | 0.82 | 0.83 | 0.61 |
Disclaimer/Publisher’s Note: The statements, opinions and data contained in all publications are solely those of the individual author(s) and contributor(s) and not of MDPI and/or the editor(s). MDPI and/or the editor(s) disclaim responsibility for any injury to people or property resulting from any ideas, methods, instructions or products referred to in the content. |
© 2025 by the authors. Licensee MDPI, Basel, Switzerland. This article is an open access article distributed under the terms and conditions of the Creative Commons Attribution (CC BY) license (http://creativecommons.org/licenses/by/4.0/).
Copyright: This open access article is published under a Creative Commons CC BY 4.0 license, which permit the free download, distribution, and reuse, provided that the author and preprint are cited in any reuse.


