
Submitted:
14 June 2025
Posted:
17 June 2025
You are already at the latest version
Abstract
The Potential Payback Period (PPP) offers a mathematically rigorous and economically interpretable alternative to conventional equity valuation tools such as the Price-to-Earnings (P/E) and PEG ratios. This article demonstrates, through multiple analytic methods, why PPP remains well-defined, stable, and conceptually superior under conditions where traditional models collapse. Using L’Hôpital’s Rule, Taylor expansions, direct limit analysis, and economic reasoning, we show that PPP is uniquely equipped to handle edge cases such as g = r, negative or near-zero earnings, and fast-growing firms with delayed profitability. The analysis culminates in positioning PPP not merely as a replacement for the P/E ratio, but as a unifying valuation metric across equity and fixed-income instruments.
Keywords:
Potential Payback Period (PPP)
; Equity Valuation
; P/E Ratio
; PEG Ratio
; L’Hôpital’s Rule
; Taylor Expansion
1. Introduction
Traditional valuation ratios such as the Price-to-Earnings (P/E) and Price/Earnings-to-Growth (PEG) ratios are commonly used due to their simplicity and intuitive appeal. However, these ratios often fail to deliver accurate insights when applied to firms with high earnings growth, volatile reinvestment strategies, or significant discount rate sensitivity. In such dynamic environments, valuation models must account for time, compounding, and risk.
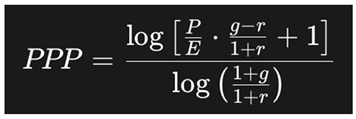
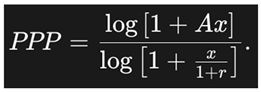
The Potential Payback Period (PPP) addresses these needs directly. It estimates the time required for an investor to recover the price paid for a stock through the company’s future earnings, while factoring in both growth and discounting. Mathematically, PPP is expressed as:
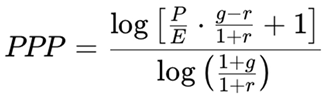 where:
- P/E is the price-to-earnings ratio
- g is the expected earnings growth rate
- r is the discount rate (reflecting risk or cost of capital)
This formula offers a dynamic, time-based reinterpretation of valuation that collapses to the traditional P/E ratio only under static, unrealistic assumptions (i.e., when g = r = 0 ). Importantly, the PPP remains mathematically valid and economically interpretable even when g = r — a point where the P/E ratio becomes undefined.
In this article, we explore multiple methods of proving the robustness and versatility of the PPP, beginning with classic tools like L'Hôpital’s Rule and Taylor expansion, then extending to first-principles analysis, higher-order sensitivity models, and real-world interpretability across a wide range of valuation scenarios.
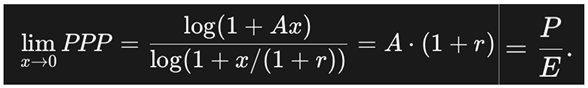
2. Using L'Hôpital's Rule
In mathematical analysis, L’Hôpital’s Rule is a classical tool for resolving indeterminate forms such as 0/0 or ∞/∞. The Potential Payback Period (PPP) formula becomes indeterminate when the earnings growth rate g equals the discount rate r, because both the numerator and denominator in the PPP expression approach zero:
To evaluate the behavior of PPP at this critical point, we define:
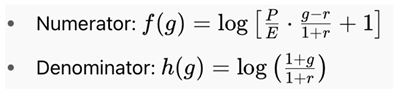
As g → r both f(g) → 0 and h(g) → 0, producing the indeterminate form 0/0. According to L’Hôpital’s Rule, we compute the derivatives of the numerator and denominator and take the limit of their ratio:
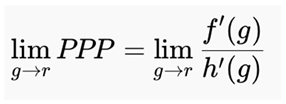
The derivatives are:
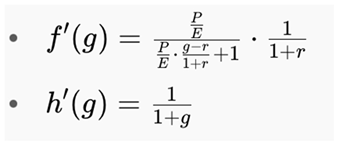
Substituting into the limit expression and evaluating as g → r:
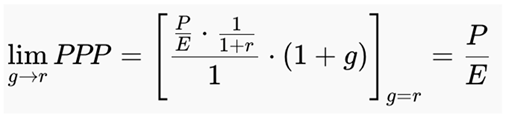
Conclusion:
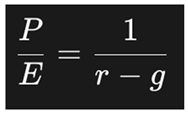
L’Hôpital’s Rule confirms that the Potential Payback Period (PPP) converges smoothly when the earnings growth rate g approaches the discount rate r, avoiding the asymptotic explosion found in the traditional P/E formula derived from the Gordon Growth Model (GGM):
This continuity reinforces PPP’s robustness in edge cases where other models fail.
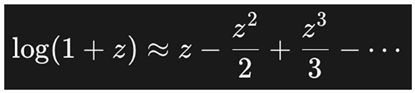
3. Using Taylor Expansion
Taylor expansion provides not only a proof of continuity for PPP as g → r, but also insight into the nature of the convergence—highlighting that it is not only mathematically valid but also economically proportional and interpretable.
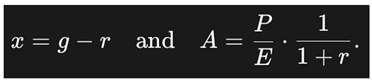
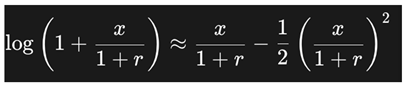
Let x = g − r, so that x → 0 when g → r. We rewrite the PPP formula as:
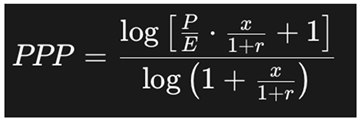
We apply the Taylor expansion for logarithmic expressions near zero:
- First-order expansion:

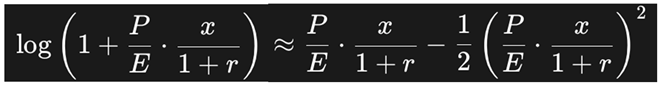
Step-by-step Approximation
Numerator:
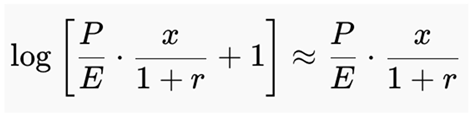
Denominator:
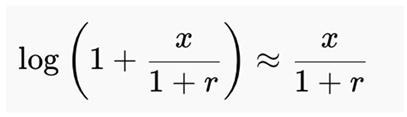
Therefore:

Interpretation
Unlike the P/E ratio, which becomes undefined when g = r, the PPP smoothly reduces to P/E in the limit. Taylor expansion reveals the exact mechanism by which this convergence occurs and confirms that:
- The functional form of PPP is stable and interpretable at the point where P/E fails.
- The convergence is not abrupt or chaotic, but proportional and linear near the point of indeterminacy.
- The first-order approximation reveals that small differences between growth and discounting do not destabilize the valuation, a major advantage over legacy metrics.
4. Limit Analysis from First Principles
An elegant way to demonstrate the continuity of the PPP function is to evaluate the limit directly using first principles of logarithmic functions, without invoking formal tools such as L’Hôpital’s Rule or Taylor expansion. This approach relies on a known limit identity from calculus:
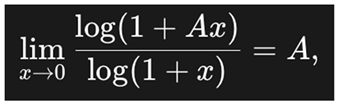 which holds for any constant A. In the case of the PPP formula, let us define:
 Substituting into the PPP expression:
As x → 0, both numerator and denominator tend toward zero. Applying the identity yields:
Conclusion:
This limit analysis demonstrates that the PPP function converges to the P/E ratio directly and intuitively. The method avoids differentiation and offers an elegant, algebraic perspective on the smooth behavior of PPP under critical conditions such as g = r.
5. Higher-Order Taylor Series for Sensitivity
While the first-order Taylor expansion confirms the smooth convergence of PPP to the P/E ratio when g → r, a higher-order Taylor series enables deeper sensitivity analysis. By expanding both the numerator and denominator of the PPP formula to second or third order in x = g - r, we gain insight into the rate of divergence from the limiting case and assess PPP's stability in the presence of small perturbations.
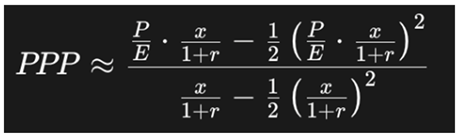
Second-Order Expansion:
Recall the general Taylor expansion for the natural logarithm:
Apply this to the numerator and denominator of the PPP formula:
- Numerator:
- Denominator:
Thus:

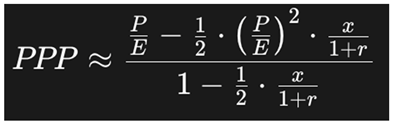
Practical Implication
This expression shows that the PPP remains close to P/E even when x is small but non-zero, and that the deviation is second-order — i.e., it grows proportionally to x. This reinforces PPP’s local stability and explains why it is effective even when small fluctuations in growth or discount rate occur.
In volatile markets where estimates of g and r are uncertain or subject to revision, the second-order behavior confirms that PPP does not oscillate wildly or become erratic. This robustness underlies its value as a tool for sensitivity analysis, scenario planning, and stress testing in equity valuation.
6. Graphical Analysis and Derivatives
Beyond symbolic and numerical analysis, graphical exploration of the Potential Payback Period (PPP) provides compelling visual confirmation of its robustness.
When PPP is plotted as a function of the earnings growth rate g for various fixed discount rates r, or vice versa, the resulting curves demonstrate several key characteristics:
- Smoothness: PPP curves exhibit continuous, differentiable shapes with no kinks, jumps, or breaks—even around the critical point where g = r.
- Bounded behavior: Unlike the traditional P/E formula, which diverges as g → r, the PPP curve gently transitions through this region without asymptotic spikes.
- Well-defined slope: The first derivative of the PPP function with respect to g is finite and bounded across the domain, indicating that the function responds proportionally to changes in growth assumptions.
These visual properties confirm that PPP can be modeled reliably in quantitative systems, making it well-suited for:
- Numerical simulations
- Sensitivity analyses
- FinTech implementation (e.g., algorithmic valuation tools)
Conclusion:
The graphical behavior of PPP under varying economic conditions confirms its mathematical well-posedness and computational tractability—traits that traditional ratios like P/E and PEG often lack.
7. Conceptual and Economic Interpretations
While the mathematical analyses establish the PPP’s internal consistency, its practical power lies in its conceptual versatility. Unlike the P/E ratio, which is static and backward-looking, the PPP integrates time, growth, and discounting—making it more aligned with real-world valuation needs. Below, we explore several domains where this advantage becomes most evident.
7.1. Time-Domain Realism
Traditional valuation metrics like the P/E ratio implicitly assume a perpetual stream of constant earnings—an assumption that breaks down for firms in early-stage or high-growth phases.
By contrast, the PPP explicitly measures how long it takes to recover the investor’s capital through future earnings, accounting for compounding and risk. This reflects real-world capital recovery scenarios in:
- Startup and high-growth companies, where earnings ramp up gradually.
- Reinvestment-intensive models, where early profits are deferred.
- Cyclic or transitional businesses, where steady-state assumptions are invalid.
Implication: PPP aligns naturally with capital budgeting intuition (payback period), but in a financially rigorous, discounted, and growth-adjusted form.
7.2. Behavior in Edge and Extreme Cases
PPP remains defined and economically meaningful in a variety of problematic cases for P/E and PEG:
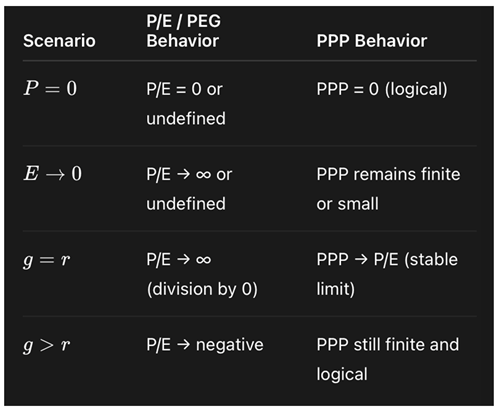 Implication: PPP accommodates real market conditions—such as rising interest rates, compressed earnings, or temporarily unprofitable but fast-growing firms—with grace and interpretability.
7.3. Cross-Asset Comparability
A less obvious but powerful advantage of the PPP is its structural resemblance to metrics in other asset classes. Because PPP measures time-adjusted recovery and return, it is analogous to:
- Bond duration and Yield to Maturity (YTM)
- Project discounted payback period in corporate finance
- Internal Rate of Return (IRR) in private equity and real estate
Derived metrics like SIRR (Stock Internal Rate of Return) and SIRRIPA (SIRR Including Price Appreciation) make it possible to compare:
- A tech stock with a bond
- A biotech startup with a growth ETF
- An equity investment with a fixed-income security
Implication: PPP is not just an equity tool—it is a unifying valuation framework that enables rational asset allocation across instruments and time horizons.
8. Conclusion
The Potential Payback Period (PPP) emerges from this analysis not just as a refinement of existing valuation metrics, but as a structurally superior framework. Unlike the P/E ratio, which collapses under conditions of high growth or when the discount rate equals the growth rate, the PPP remains finite, interpretable, and grounded in economic reality. Its time-sensitive nature and mathematical continuity offer a reliable lens through which to evaluate firms across the entire growth spectrum.
Through multiple independent approaches—L’Hôpital’s Rule, Taylor expansion, first-principles limit analysis, graphical modeling, and higher-order sensitivity—we have shown that PPP consistently reduces to the P/E ratio in static conditions, but expands its utility in dynamic ones. Conceptually, PPP accommodates the investor’s core question: how long will it take to recover my capital, adjusted for growth and risk?
More than just a metric, PPP is a valuation paradigm that bridges accounting simplicity and financial precision. Its interpretability across edge cases, compatibility with discounted cash flow logic, and comparability with fixed-income instruments make it a versatile tool for equity analysts, financial modelers, and cross-asset investors alike.
As capital markets increasingly reward companies with nonlinear growth trajectories and delayed monetization, valuation methodologies must evolve accordingly. The PPP is not merely a theoretical advancement—it is the practical response to a modern investing landscape that demands time-adjusted, risk-aware, and growth-integrated valuation.
Final insight
Where the P/E ratio fails, the PPP begins to work.
References
- Sam, Rainsy (2025). Extending the P/E and PEG Ratios: The Role of the Potential Payback Period (PPP) in Modern Equity Valuation. Preprints. [CrossRef]
- Sam, Rainsy (2025). How to Adjust the P/E Ratio for Earnings Growth in Equity Valuation: PEG or PPP? SSRN. https://papers.ssrn.com/sol3/papers.cfm?abstract_id=5241650.
- Sam, Rainsy (2025). Revealing the Rationality Behind Apparently Irrational P/E Ratios: The Case of Palantir Technologies Through the Lens of SIRRIPA. SSRN. https://ssrn.com/abstract=5284469.
- Sam, Rainsy (2025). Why SIRRIPA is Set to Replace the P/E Ratio in Modern Equity Valuation. Preprints. https://www.preprints.org/manuscript/202504.1213/v1.
- Sam, Rainsy (2025). SIRRIPA: The Stock-Tailored Yield to Maturity (YTM) and the Emergence of a Cross-Asset Valuation Metric. Preprints. [CrossRef]
- Sam, Rainsy (2025). A Quantitative Revelation in Equity Valuation: The P/E Ratio is a Degenerate Case of the Potential Payback Period (PPP). SSRN. https://papers.ssrn.com/sol3/papers.cfm?abstract_id=5268285.
- Sam, Rainsy (2025). Proving that the P/E Ratio is Just a Limiting Case of the Potential Payback Period (PPP) When Earnings Growth and Interest Rate are Ignored. Preprints. [CrossRef]
- Sam, Rainsy (2025). Generalizing the P/E Ratio Through the Potential Payback Period (PPP): A Dynamic Approach to Stock Valuation. SSRN. https://papers.ssrn.com/sol3/papers.cfm?abstract_id=5261816.
- Damodaran, A. (2012). Investment Valuation: Tools and Techniques for Determining the Value of Any Asset (3rd ed.). Wiley Finance.
- Penman, S. H. (2012). Financial Statement Analysis and Security Valuation (5th ed.). McGraw-Hill Education.
- Brealey, R. A., Myers, S. C., & Allen, F. (2022). Principles of Corporate Finance (14th ed.). McGraw-Hill Education.
- Graham, B., & Dodd, D. L. (2009). Security Analysis: Sixth Edition. McGraw-Hill Education.
- Ross, S. A., Westerfield, R. W., & Jaffe, J. (2021). Corporate Finance (13th ed.). McGraw-Hill Education.
- L’Hôpital, G. F. A. de (1696). Analyse des Infiniment Petits pour l’Intelligence des Lignes Courbes. Paris.
- Bodie, Z., Kane, A., & Marcus, A. J. (2021). Investments (12th ed.). McGraw-Hill Education.
Disclaimer/Publisher’s Note: The statements, opinions and data contained in all publications are solely those of the individual author(s) and contributor(s) and not of MDPI and/or the editor(s). MDPI and/or the editor(s) disclaim responsibility for any injury to people or property resulting from any ideas, methods, instructions or products referred to in the content. |
© 2025 by the authors. Licensee MDPI, Basel, Switzerland. This article is an open access article distributed under the terms and conditions of the Creative Commons Attribution (CC BY) license (http://creativecommons.org/licenses/by/4.0/).
Copyright: This open access article is published under a Creative Commons CC BY 4.0 license, which permit the free download, distribution, and reuse, provided that the author and preprint are cited in any reuse.


