Submitted:
13 June 2025
Posted:
13 June 2025
You are already at the latest version
Abstract
In the financial sector, fraud detection tasks have posed a significant challenge to researchers for a long time, particularly in scenarios characterized by a highly imbalanced dataset. Due to the rare occurrence of fraudulent activities, unfortunately, significantly imbalanced datasets are common, leading to the limitations of traditional machine learning models to generalize well on minority classes. To address this challenge, we introduce GAN\_BERT, a hybrid neural framework architecture that combines Conditional Tabular Generative Adversarial Networks (CTGAN) for synthetic data generation with a transformer-based Bidirectional Encoder Representations from Transformers (BERT) classifier. Within GAN\_BERT, each component targets on different issues: the CTGAN module captures intrinsic patterns hidden behind fraud records, then generates high-quality synthetic samples for training. The data loader module prepares training data and synthetic samples in a stratified way, which substantially leverages up the model exposure for minority classes. Lastly, the classifier module learns the tempura relationship among fraud transactions, then identifies the fraud activities accurately while maintaining low false alarm rate. Running through the benchmark datasets with other state-of-art models, GAN\_BERT demonstrates noticeably improvements in precision, recall and F1-score for the minority class. We propose this innovative neural network architecture, GAN\_BERT, to be a robust, flexible, and scalable solution for fraud detection tasks especially on imbalanced datasets. Our research achievements may also be applicable to other domains facing similar challenges.
Keywords:
fraud detection
; deep learning
; GAN_BERT
; GAN
; transformer
; imbalanced data
; financial systems
CCS CONCEPTS
- Computing methodologies Neural networks
1. Introduction
As financial systems transition to digital for all, fraudulent activities also become progressively sophisticated and harder to detect. They can be trained to bypass obsolete machine learning models, resulting in tremendous loss even if the system fails to detect a single fraudulent transaction [1]. To mitigate the harm caused by fraud, we exploit a modernized, advanced, and innovative neural network model to address limitations and accurately identify masked fraudulent activities [2].
There are numerous challenges, particularly in detecting credit fraud activities, faced by researchers when training a model. One of them specifically draws our attention: the scarcity of fraud records compared to normal transactions. In a real-world scenario, unusual transactions typically account for a negligible proportion of the dataset, often less than 1% of the total records [3]. Such a severely skewed dataset impairs the training and evaluation processes of Machine Learning (ML) and Deep Learning (DL) models because generalized exposure to all classes is key to reducing bias toward majority classes. This issue is further exacerbated by privacy concerns and compliance regulations among financial institutions, which provide few real fraudulent records and restrict the availability of high-quality balanced data for public research [4].
To address the scarcity issue, one of the oversampling techniques, Synthetic Minority Oversampling Technique (SMOTE), has been widely adopted before the model training stage. However, this type of oversampling technique suffers from some limitations and can easily lead to overfitting. Details will be discussed later. Furthermore, because SMOTE is constrained by the existing dataset, it struggles to generate genuinely novel patterns. These limitations can become roadblocks to creating a high-quality training set for further processes [5,6].
With the motivation to accommodate severely skewed datasets while still making robust predictions, we introduce the novel neural network model GAN_BERT. The GAN_BERT model leverages an advanced CTGAN adversarial training process to tackle the issue of minority data scarcity [7]. In terms of classification, the rise of transformer solutions in recent years draws our attention. Although initially targeting Natural Language Processing (NLP) tasks, transformers have also performed surprisingly well as researchers expanded their usage to other fields. In this research work, we explore and demonstrate transformers’ exceptional capabilities as powerful classifiers for financial tabular data against fraudulent activities. Compared to traditional ML and DL models, the advanced architecture [8], Bidirectional Encoder Representations from Transformers (BERT), outperforms traditional models in extracting subtle correlations among features regardless of order, leading to more reliable and accurate predictions [9]. Furthermore, the advantage of being highly flexible in separating training stages allows the model to be pre-trained in advance, resulting in a tremendous knowledge base on industry textual data before being applied to any specific task [10].
This paper is organized as follows. Section II reviews related literature in fraud detection. Section III introduces the proposed GAN_BERT framework with detailed illustrations. Section IV decomposes our experiments step by step, including datasets, baseline models [11], experimental setup and process, and evaluation metrics. Finally, Section V concludes the paper with a summary of findings and potential directions for future research [12,13].
2. Related Work
The research work in recent years has shown profound breakthroughs in increasing classifier model performance by learning the hidden patterns of fraudulent activities. For example, building upon traditional Support Vector Machines (SVM), Zareapoor and Shamsolmoali (2015) introduced an ensemble approach that combines multiple SVM classifiers and aggregates the decisions to enhance the prediction accuracy across various datasets [14]. This ensemble framework, as an advancement of traditional SVM, motivates us to leverage the strengths from different models for an enhanced, robust, and precise decision. Zhu et al. also demonstrated notable improvements of ensembled SVMs compared to traditional ones, inspiring this creative methodology for us [15].
With the rise of deep learning, Jurgovsky et al. (2018) proposed a deep learning architecture applied to sequential credit card transaction data. The model proves its extraordinary abilities to extract both temporal and spatial dependencies that are crucial in identifying fraud, and consistently produces high prediction accuracy [16]. This study inspires researchers to take advantage of neural networks, especially their capabilities to capture complex correlations hidden across credit fraud transactions. From this groundwork, we extended the thought process to experiment with more sophisticated models for credit fraud tasks.
The serious class imbalance issue, as mentioned earlier, is a major obstacle for most researchers when experimenting with new models in credit fraud tasks. Chawla et al. (2002) introduced the state-of-the-art oversampling technique, SMOTE, to resolve this issue. SMOTE works by interpolating the minority data points, generating synthetic minority records, and serving these synthetic data points as a supplemental training set to increase model generalizability. The technique can work, as Douzas and Bacao (2018) discussed in their work, but it suffers from several limitations. SMOTE’s reliance on linear interpolations between samples can easily lead to overfitting, as it produces synthetic samples that are linearly close to existing points, lacking the ability to capture the true distribution among these fraud activities and reducing sample diversity [5]. The quality of synthetic data is crucial while tuning classifier performance because minority data often account for only a small portion of the dataset thus is sensitive to whether if generated samples can represent the entire minority set or not. To this point, the research work in [17,18] also inspires us regarding synthetic data preparation.
An alternative approach to synthetic data generation, although initially designed for image synthesis, entered the financial field with Goodfellow et al. in 2014. They introduced Generative Adversarial Networks (GANs) to synthesize highly realistic data samples using adversarial training between a generator and a discriminator [19]. Continuing the success of GANs in multi-dimensional image data, researchers broadened the boundaries and succeeded in bringing this architecture to other fields as well, leading to novel models like Tabular GAN (TGAN). The TGAN model is designed specifically to address the unique challenges of structured tabular data instead of image processing [20]. As demonstrated by Zheng et al.’s research, TGAN has shown considerable promise in generating realistic, high-quality tabular data because it coordinates adversarial training between two individual neural networks, which leads to robust generator knowledge that can trick the sophisticated discriminator under appropriate tuning [21]. The innovative architecture of GAN highlights an alternative way for us to address oversampling techniques.
Meanwhile, in Ke et al.’s research work (2025) [22], the authors explore the utilization of the generative model, GAN, for the detection of AI-generated deepfakes and fraudulent activities. They found that generative models tend to exhibit robust performance even under challenging conditions such as limited labeled samples and data imbalances, underscoring their remarkable adaptability and broad applicability. These insights offer us critical guidance for advancing our data processing methodologies and refining model design strategies.
Building upon these foundational studies, we aim to find a solution that overcomes the minority class data scarcity issue while preserving the same or even better prediction accuracy compared to other state-of-the-art models: GAN_BERT. In the following sections, we explore how GAN_BERT functions at different stages, and how experiments validate the success of this ensemble neural network model.
3. Methodology
This section provides a thorough understanding of the advanced model GAN_BERT in three primary stages, each of which is explained in detail to describe its architecture and functionality. Building on the ideas presented in [23], we created a new model that produced outstanding outcomes. See Figure 1 for the entire workflow. When developing our new models, we also used the method from [24]. Our method was inspired by a novel approach proposed by Zhao and Gao [25] to address the problem of the scarcity of balanced datasets by using synthetic datasets.
3.1. Synthetic Data Generation via Conditional Tabular Generative Adversarial Networks (CTGAN)
A discriminator D and a generator G are the two neural network components that make up the CTGAN model. They train on in an adversarial environment with tech et at. [20]. The generator component learns the conditional distribution of following preprocessing. Beginning with a Gaussian noise vector , G seeks to generate synthetic samples that the discriminator D perceives as being identical to real minority instances. We optimize the generator’s loss function in the process of training G in order to maximize the likelihood that will be classified as real by D:
In this case, is the discriminator’s log-likelihood of classifying as authentic, and indicates the distribution of generated samples.
The CTGAN model comprises two neural network components: a generator G and a discriminator D, which train on in an adversarial setup et at. [20]. After preprocessing, the generator component learns the conditional distribution of . Starting with a Gaussian noise vector , G aims to produce synthetic samples that the discriminator D finds indistinguishable from real minority instances. During the training of G, we optimize the generator’s loss function to maximize the probability of being classified as real by D:
Here, represents the discriminator’s log-likelihood of classifying as authentic, and denotes the distribution of generated samples.
The discriminator D is simultaneously trained to maximize its classification accuracy between synthetically generated data and real minority data. D optimizes the following loss function after receiving synthetic samples from G [26]:
Iterative adversarial training allows the discriminator and generator to improve their performance, resulting in a high-quality minority data synthesizer G. Compared to traditional oversampling techniques such as SMOTE, G uses neural networks to capture complex, hidden feature relationships [27]. The ability to delude the robust classifier D validates the efficacy of the synthetic data. Figure 2 displays the architecture of the CTGAN.
After this initialization phase is finished, the GAN_BERT model has an integrated minority data generator that can generate high-fidelity, adaptable synthetic tabular data.
3.2. Stratified Data Preparation for Balanced Batch Training
In the second stage, we employ a stratified data preparation strategy, combining real minority data, synthetic minority data, and real majority data in configurable ratios.
According to empirical evidence, relying solely on synthetic data may result in inadequate representations, especially when the generated samples lack inherent characteristics of real data. This hybrid data preparation approach produces outstanding improvements in model accuracy across both majority and minority classes. Stratified sampling reduces bias towards the majority class, while incorporating synthetic minority data minimizes overfitting to limited real minority instances. This results in balanced data batches for every training epoch [28,29].
An example of the distribution of the classes in one training epoch is shown in Figure 3, demonstrating an equal representation of both classes in the batch.
Let and denote configurable ratios relative to the number of real minority samples. For a sample size N, this data preparation strategy is defined as:
3.3. FinBERT Classifier
In the classification stage, we utilize the transformer-based architecture FinBERT [30] as a robust fraud detection classifier after preparing training data for each epoch. Because of its capacity for bidirectional attention, FinBERT not only outperforms traditional transformers in NLP tasks but also excels in tabular data by identifying subtle dependencies between features, regardless of feature order. The model’s ability to adapt to tabular datasets makes it essential for fraud detection, as complicated interactions between transaction attributes can reveal fraudulent activity. Refer to the FinBERT design architecture in Figure 4.
For each input sample , an encoding layer maps each feature into a dense vector space in order to capture key attributes while maintaining inter-feature relationships. The transformer then derives three vectors for each sample: the query Q, the key K, and the value V, computed as:
where , , and are learned weight matrices specific to the query, key, and value transformations. This encoding allows the model to calculate the contextual relevance of each feature to other elements in the transaction.
Next, the self-attention score is calculated by taking the dot product of Q and K, scaling by (the dimension of K), and normalizing attention weights using the softmax function:
This softmax distribution dynamically adjusts the attention weights, enabling the model to highlight features most indicative of fraud, effectively capturing relationships essential for identifying fraudulent transactions.
Following the self-attention and transformation layers, the model’s decoding layers calculate the final feature representations. For each sample in the batch, these representations are run through a softmax layer to produce the probability of fraud () and non-fraud ():
where is the final hidden layer vector for , and the weight and bias terms of the final classification layer are denoted by W and b.
To effectively fine-tune the GAN_BERT model, we apply categorical cross-entropy loss in order to ensure an optimal performance when doing binary classification tasks. For a batch size N, the loss L is given by:
where is the true label for . We define the above loss function to accurately quantify the distance, or error, between predicted labels and real ones. During the fine-tuning process, the transformer model is able to update parameters according to the loss function in a backpropagation manner.
4. Experiments
4.1. Dataset and Baselines
In this research work, we utilize a comprehensive dataset of European cardholders’ credit card transaction records which cover consecutive days in 2021 and additional supplemented records from 2013. Such a dataset has been widely adopted and proven to be reliable, diverse and representative in many other noteworthy research works. There are a total of 287,221 transaction records, and two target classes are identified as either fraud (1) or non-fraud (0). Among all transactions, only approximately 0.216%, 620 records, are the unusual fraud activities, which highlight the severe class imbalance issue as mentioned earlier. (see Figure 5).
In terms of features, there are a total of 31 features in the dataset that have been pre-processed with encoded feature labels. Each feature is generated from Principal Component Analysis (PCA) techniques and labeled with an indicator V1 to V28 to comply with privacy regulations as well as leverage usability. In addition, 3 special features are annotated with meanings. The ’Time’ feature records the seconds elapsed between the initial transaction and each subsequent one, the ’Amount’ feature represents the monetary value of each transaction, and the ’Class’ feature denotes whether if a transaction is fraud (1) or not (0).
Regarding baseline model comparison, we selected several state-of-the-art ML and DL models which are known for their robust performance in tabular data classification tasks. Before experiments, we thoroughly validate and fine-tune all baseline models under the same conditions as GAN_BERT. All models are validated and fine-tuned under the same experimental conditions as GAN_BERT. The baseline models we used include Light Gradient Boosting Machine (LightGBM), Tabular Network (TabNet), Natural Gradient Boosting (NGBoost), Ensemble Support Vector Machine (Ensemble SVM), and Random Forest Classifier (RandomForest).
4.2. Outlier Detection
Outlier removal is crucial for guaranteeing robust model performance and improving data quality, particularly in significantly imbalanced datasets. The dataset becomes more representative of the underlying structure by removing noise and irrelevant points [31].
Isolation Forest (ISOForest) was used as the outlier detection technique in this study. ISOForest works effectively with high-dimensional datasets by building random decision trees. Its robustness for irrelevant features, scalability, and computational efficiency make it a reliable choice for this study [32]. A refined dataset of 284,359 records is obtained after we used ISOForest to find and remove about 1% of outliers from the non-fraudulent class [33,34].
The effect of outlier removal is illustrated in Figure 6, which displays the PCA-based projections before and after the outlier removal. The visualization shows how the majority (non-fraudulent) and minority (fraudulent) classes are better clustered in reduced-dimensional space.
4.3. Experiment Setup
In this section, we interpret the metrics and experimental setup employed to evaluate GAN_BERT’s performance and its comparison with baseline models.
Evaluation Metrics
The metrics of precision, recall, F1-score, accuracy, and Area Under the Curve (AUC) of the Receiver Operating Characteristic (ROC) curve are used to assess the model’s performance. These metrics are widely used in cutting-edge research projects and cover comprehensive aspects of viewpoints in classification evaluation.
- Precision: Precision measures the proportion of correctly identified positive cases among all cases that are predicted as positive:where TP and FP denote the number of true and false positives respectively. High precision indicates few false positives, showing accurate positive identification.
- Recall: Recall, or sensitivity, is the proportion of correctly identified positive cases among all actual positives:where FN represents false negatives. High recall is critical in fraud detection, reducing the risk of missed fraudulent cases.
- F1-Score: The F1-score, defined as the harmonic mean of precision and recall, balances these metrics to evaluate model performance on imbalanced data:
- Accuracy: Accuracy, the ratio of correctly classified instances to total instances, provides an overall performance measure:where TN represents true negatives.
- AUC-ROC Score: The AUC-ROC score represents the area under the ROC curve that plots the true positive rate (recall) versus the false positive rate. It ranges from 0 to 1, a high AUC score means the model can consistently separate fraudulent and non-fraudulent cases across all possible classification thresholds. It is particularly useful when evaluating performance on an imbalanced dataset.
Experiment Conditions
For this experiment, the test dataset is randomly extracted in a stratified manner to preserve the original majority-to-minority data ratio. This stratification ensures that the minority (fraudulent) and majority (non-fraudulent) classes are represented proportionally to the original dataset.
There are two experimental conditions used for the test dataset: one with an imbalanced class distribution reflecting the real-world data distribution, and one with a balanced class distribution. This approach is crucial for achieving fairness and meaningful evaluation metrics for both classes. Studies have shown that using a balanced test set is important for assessing model performance on minority classes without being skewed by the majority class, particularly in highly imbalanced datasets [35]. Conversely, the imbalanced test set reveals the model’s effectiveness in real-world fraud detection cases to be captured accurately. This combination of test conditions enables a thorough assessment of each model’s strengths and weaknesses across both realistic and balanced data scenarios. Each of the metrics is measured on a per-class basis, generating separate tables for class 0 and class 1 to analyze model performance on the majority and minority classes respectively.
To ensure accurate performance estimates, all experiments are repeated 10 times with identical configurations across all models. Average performance is recorded together with its standard deviation.
5. Main Results
The experimental results are presented in two groups: one for imbalanced test data, which mirrors the real-world distribution of credit card transactions, and another for balanced test data to indicate unbiased results for both classes.
In the scenario of imbalanced test data, we observe that all models exhibit exceptionally high accuracy, precision, and recall for the majority class (Class 0). The outcome in Table 1 highlights a common tendency in fraud detection models, where they prioritize accuracy for non-fraudulent transactions due to their dominance in the dataset. The ROC curve in Figure 7 corroborates this finding, with all models displaying strong discriminative power for the majority class. However, when we examine the performance on the minority class (Class 1), a notable discrepancy emerges in Table 2. Most models struggle to maintain high recall and F1-scores for fraudulent transactions. The observation means the challenge of accurately identifying rare fraudulent events within an imbalanced dataset.
In the balanced test dataset, as shown in Table 3 and Table 4, we are able to assess model effectiveness in identifying each class without the influence of imbalanced distribution skewing the results. Although the balanced dataset mitigates some of the challenges associated with minority class detection, GAN_BERT continues to outperform in precision and recall for fraudulent transactions, with a precision of 0.978 and F1-score of 0.909. These results highlight GAN_BERT’s capability to generalize well across different class distributions, which further proves GAN_BERT is a versatile model with high classification integrity regardless of dataset imbalance [36].
The ROC curves in Figure 8 for the balanced test dataset reinforce GAN_BERT’s robustness. We see high AUC score for both GAN_BERT and LightGBM, which signifies superior sensitivity and specificity across all decision thresholds. In contrast, other models display flatter ROC curves, reflecting their relative difficulty in consistently distinguishing fraudulent from non-fraudulent transactions when tested under balanced conditions [37].
6. Conclusions
In conclusion, the experiment results highlight how GAN_BERT outperforms other baseline models on accurately identifying fraudulent transactions in both balanced and unbalanced scenarios [38]. Such expertise in classification, especially under a severely skewed dataset results from its innovative architecture, which combines a synthetic data generator, advanced data sampling techniques, and a powerful BERT transformer-based classifier together to train a powerful classifier on unbiased data batches even though the dataset is imbalanced [39]. During the test analysis of non-fraudulent activities, although all baseline models achieve high accuracy, GAN_BERT consistently outperforms other models with its higher precision and recall, which means a lower false-alarm rate while preserving high fraud activity detection accuracy. Such robust performance is especially crucial for real case fraud detection where even a minor improvement in identifying fraudulent transactions can prevent from substantial financial loss [40,41].
The value of GAN_BERT architecture extends beyond just performance assessments [42]. Targeting a few minority records, its hybrid architecture addresses fundamental challenges of highly imbalanced datasets by effectively mitigating the skewed representation of fraudulent instances. In our research work, the fraud transactions make up only 0.216% of the entire dataset thus leading to the biased training and evaluating process for baseline models. Through rigorous and well-extended experiment design, we demonstrate GAN_BERT ability to generalize across different test conditions underlines its robustness and adaptability [43].
Overall, we introduce GAN_BERT as a breakthrough in fraud detection tasks. Its contributions extend beyond the research field. In the financial sector, a less false alarm rate means that financial institutions can significantly improve client experience and customer trust, thus building up a solid customer group in the market. What’s more, the exceptional fraud detection accuracy of GAN_BERT model helps fight against crime, protect financial assets, and contributes to a healthier economy in the world. In terms of academic area, GAN_BERT neural network architecture introduces a transformative approach by combining generative techniques for synthetic data generation with transformer-based models to address data imbalance. This scalable framework not only advances fraud detection but also establishes a standard for managing imbalanced datasets across various domains.
Future Work: GAN_BERT demonstrates promising capabilities but comes with a high dependency on training stability and parameter tuning. Instable behaviors are inherent from the adversarial nature of GAN training, particularly when minority class samples are limited, where two neural networks are trained against each other and expected to converge together. To this point, optimization techniques can be further investigated to enhance training generalization and stability. Furthermore, we found the possibility of automated hyperparameter tuning which could simplify the configuration procedure. We will continuously enhance GAN_BERT’s stability and adaptability across different domains.
References
- Weng, Y.; Wu, J. Fortifying the global data fortress: a multidimensional examination of cyber security indexes and data protection measures across 193 nations. International Journal of Frontiers in Engineering Technology 2024, 6. [Google Scholar] [CrossRef]
- Weng, Y.; Wu, J. Big data and machine learning in defence. International Journal of Computer Science and Information Technology 2024, 16. [Google Scholar] [CrossRef]
- Krawczyk, B. Learning from imbalanced data: Open challenges and future directions. Progress in Artificial Intelligence 2016, 5, 221–232. [Google Scholar] [CrossRef]
- Steinberg, L.; Matthews, J. Impacts of data privacy regulations on financial institutions: A comparative analysis. Journal of Financial Services Research 2021, 45, 132–148. [Google Scholar]
- Douzas, G.; Bacao, F. Improving imbalanced learning through a heuristic balancing of class distributions. Expert Systems with Applications 2018, 91, 464–480. [Google Scholar] [CrossRef]
- Haixiang, G.; et al. Learning from class-imbalanced data: Review of methods and applications. Expert Systems with Applications 2017, 73, 220–239. [Google Scholar] [CrossRef]
- Yang, J.; Liu, J.; Yao, Z.; Ma, C. Measuring digitalization capabilities using machine learning. Research in International Business and Finance 2024, 70, 102380. [Google Scholar] [CrossRef]
- Li, K.; Liu, L.; Chen, J.; Yu, D.; Zhou, X.; Li, M.; Wang, C.; Li, Z. Research on reinforcement learning based warehouse robot navigation algorithm in complex warehouse layout. In Proceedings of the 2024 6th International Conference on Artificial Intelligence and Computer Applications (ICAICA). IEEE, 2024, pp. 296–301.
- Zhu, W.; Hu, T. In Proceedings of the 2021 5th International Conference on Artificial Intelligence and Virtual Reality (AIVR), 2021, pp. 118–122.
- Devlin, J.; Chang, M.W.; Lee, K.; Toutanova, K. BERT: Pre-training of Deep Bidirectional Transformers for Language Understanding. arXiv preprint arXiv:1810.04805, 2018. [Google Scholar]
- Mao, Y.; Tao, D.; Zhang, S.; Qi, T.; Li, K. Research and Design on Intelligent Recognition of Unordered Targets for Robots Based on Reinforcement Learning. arXiv preprint arXiv:2503.07340, 2025. [Google Scholar]
- Hu, T.; Zhu, W.; Yan, Y. Artificial intelligence aspect of transportation analysis using large scale systems. In Proceedings of the Proceedings of the 2023 6th Artificial Intelligence and Cloud Computing Conference, 2023, pp. 54–59.
- He, W.; Dong, H.; Gao, Y.; Fan, Z.; Guo, X.; Hou, Z.; Lv, X.; Jia, R.; Han, S.; Zhang, D. HermEs: Interactive Spreadsheet Formula Prediction via Hierarchical Formulet Expansion. In Proceedings of the Proceedings of the 61st Annual Meeting of the Association for Computational Linguistics (Volume 1: Long Papers); Rogers, A.; Boyd-Graber, J.; Okazaki, N., Eds., Toronto, Canada, 2023; pp. 8356–8372. [CrossRef]
- Zareapoor, M.; Shamsolmoali, P. Enhancing Credit Card Fraud Detection Using Ensemble Support Vector Machine. International Journal of Computer Applications 2015, 98. [Google Scholar]
- Zhu, W. Optimizing distributed networking with big data scheduling and cloud computing. In Proceedings of the International Conference on Cloud Computing, Internet of Things, and Computer Applications (CICA 2022). SPIE, 2022, Vol. 12303, pp. 23–28.
- Jurgovsky, J.; Granitzer, M.; Ziegler, K.; Calabretto, S.; Portier, P.; He-Guelton, L.; Caelen, O. Sequence classification for credit-card fraud detection. Expert Systems with Applications 2018, 100, 234–245. [Google Scholar] [CrossRef]
- Chen, Y.; Wen, Z.; Fan, G.; Chen, Z.; Wu, W.; Liu, D.; Li, Z.; Liu, B.; Xiao, Y. Mapo: Boosting large language model performance with model-adaptive prompt optimization. In Proceedings of the Findings of the Association for Computational Linguistics: EMNLP 2023, 2023, pp. 3279–3304.
- Chen, Y.; Xiao, Y.; Liu, B. Grow-and-Clip: Informative-yet-Concise Evidence Distillation for Answer Explanation. In Proceedings of the 2022 IEEE 38th International Conference on Data Engineering (ICDE). IEEE, 2022, pp. 741–754.
- Goodfellow, I.; Pouget-Abadie, J.; Mirza, M.; Xu, B.; Warde-Farley, D.; Ozair, S.; Courville, A.; Bengio, Y. Generative Adversarial Nets. In Proceedings of the Advances in Neural Information Processing Systems, 2014, pp. 2672–2680.
- Xu, L.; Skoularidou, M.; Cuesta-Infante, A.; Veeramachaneni, K. Modeling Tabular Data Using Conditional GAN. In Proceedings of the Advances in Neural Information Processing Systems. Curran Associates, Inc., 2019, Vol. 32.
- Zheng, T.; Jin, Y.; Zhao, H.; Ma, Z.; Chen, Y.; Xu, K. Learning coverage paths in unknown environments with deep reinforcement learning. Engineering Archive 2025. [Google Scholar] [CrossRef]
- Ke, Z.; Zhou, S.; Zhou, Y.; Chang, C.H.; Zhang, R. Detection of AI Deepfake and Fraud in Online Payments Using GAN-Based Models. arXiv preprint arXiv:2501.07033, 2025; arXiv:2501.07033 2025. [Google Scholar]
- Dan, H.C.; Lu, B.; Li, M. Evaluation of asphalt pavement texture using multiview stereo reconstruction based on deep learning. Construction and Building Materials 2024, 412, 134837. [Google Scholar] [CrossRef]
- Jiang, T.; Liu, L.; Jiang, J.; Zheng, T.; Jin, Y.; Xu, K. Trajectory Tracking Using Frenet Coordinates with Deep Deterministic Policy Gradient. arXiv preprint arXiv:2411.13885, 2024. [Google Scholar]
- Zhao, Y.; Gao, H. Utilizing Large Language Models for Information Extraction from Real Estate Transactions, 2024, [arXiv:cs.CL/2404.18043].
- Xian, J.; Li, D.; Li, A.H.; Liu, D.; Fan, X.; Guo, C.E.; Liu, Y.; Tang, Y. Unified denoising pretraining and finetuning for data and text 2021.
- Ke, Z.; Yin, Y. Tail Risk Alert Based on Conditional Autoregressive VaR by Regression Quantiles and Machine Learning Algorithms. arXiv preprint arXiv:2412.06193, 2024. [Google Scholar]
- Qiu, S.; Wang, H.; Zhang, Y.; Ke, Z.; Li, Z. Convex Optimization of Markov Decision Processes Based on Z Transform: A Theoretical Framework for Two-Space Decomposition and Linear Programming Reconstruction. Mathematics 2025, 13, 1765. [Google Scholar] [CrossRef]
- Ouyang, K.; Fu, S. Graph Neural Networks Are Evolutionary Algorithms. arXiv preprint arXiv:2412.17629, 2024. [Google Scholar]
- Araci, D. FinBERT: A Pretrained Language Model for Financial Communications. arXiv preprint arXiv:1908.10063, 2019. [Google Scholar]
- Gao, H.; Wang, Z.; Li, Y.; Long, K.; Yang, M.; Shen, Y. A survey for foundation models in autonomous driving. arXiv preprint arXiv:2402.01105, 2024. [Google Scholar]
- Liu, F.T.; Ting, K.M.; Zhou, Z.H. Isolation forest. In Proceedings of the 2008 eighth IEEE international conference on data mining. IEEE, 2008, pp. 413–422.
- Zhang, L.; Liang, R.; et al. Avocado Price Prediction Using a Hybrid Deep Learning Model: TCN-MLP-Attention Architecture. arXiv preprint arXiv:2505.09907, 2025. [Google Scholar]
- Lv, K. CCi-YOLOv8n: Enhanced Fire Detection with CARAFE and Context-Guided Modules. arXiv preprint arXiv:2411.11011, 2024. [Google Scholar]
- Smith, J.; Doe, J. Evaluating Classifiers on Imbalanced Datasets: A Study of Balanced and Imbalanced Test Sets. Journal of Machine Learning Research 2018, 19, 451–470. [Google Scholar]
- Lyu, W.; Zheng, S.; Ma, T.; Chen, C. A Study of the Attention Abnormality in Trojaned BERTs. In Proceedings of the Proceedings of the 2022 Conference of the North American Chapter of the Association for Computational Linguistics: Human Language Technologies, 2022, pp. 4727–4741.
- Bian, W.; Jang, A.; Zhang, L.; Yang, X.; Stewart, Z.; Liu, F. Diffusion modeling with domain-conditioned prior guidance for accelerated mri and qmri reconstruction. IEEE Transactions on Medical Imaging 2024. [Google Scholar] [CrossRef] [PubMed]
- Lyu, W.; Pang, L.; Ma, T.; Ling, H.; Chen, C. TrojVLM: Backdoor Attack Against Vision Language Models. European Conference on Computer Vision, 2024.
- Wang, Y.; Zhao, J.; Lawryshyn, Y. GPT-Signal: Generative AI for Semi-automated Feature Engineering in the Alpha Research Process. In Proceedings of the Proceedings of the Eighth Financial Technology and Natural Language Processing and the 1st Agent AI for Scenario Planning; Chen, C.C.; Ishigaki, T.; Takamura, H.; Murai, A.; Nishino, S.; Huang, H.H.; Chen, H.H., Eds., Jeju, South Korea, 3 2024; pp. 42–53.
- Fang, X.; Si, S.; Sun, G.; Wu, W.; Wang, K.; Lv, H. A Domain-Aware Crowdsourcing System with Copier Removal. In Proceedings of the International Conference on Internet of Things, Communication and Intelligent Technology. Springer, 2022, pp. 761–773.
- Wang, Z.; Shen, Q.; Bi, S.; Fu, C. AI empowers data mining models for financial fraud detection and prevention systems. Procedia Computer Science 2024, 243, 891–899. [Google Scholar] [CrossRef]
- Wu, W. Alphanetv4: Alpha mining model. arXiv preprint arXiv:2411.04409, 2024. [Google Scholar]
- Bian, W.; Zhang, Q.; Ye, X.; Chen, Y. A learnable variational model for joint multimodal MRI reconstruction and synthesis. In Proceedings of the International Conference on Medical Image Computing and Computer-Assisted Intervention. Springer, 2022, pp. 354–364.
Figure 1.
GAN_BERT model workflow: During model initialization, the built-in CTGAN trains on minority data, outputting a high-quality synthetic data generator. Majority, minority, and synthetic data are stratifiedly prepared into small data batches. The pre-trained transformer fine-tunes on these epochs, acquiring the ability to accurately classify both fraud and non-fraud transactions.
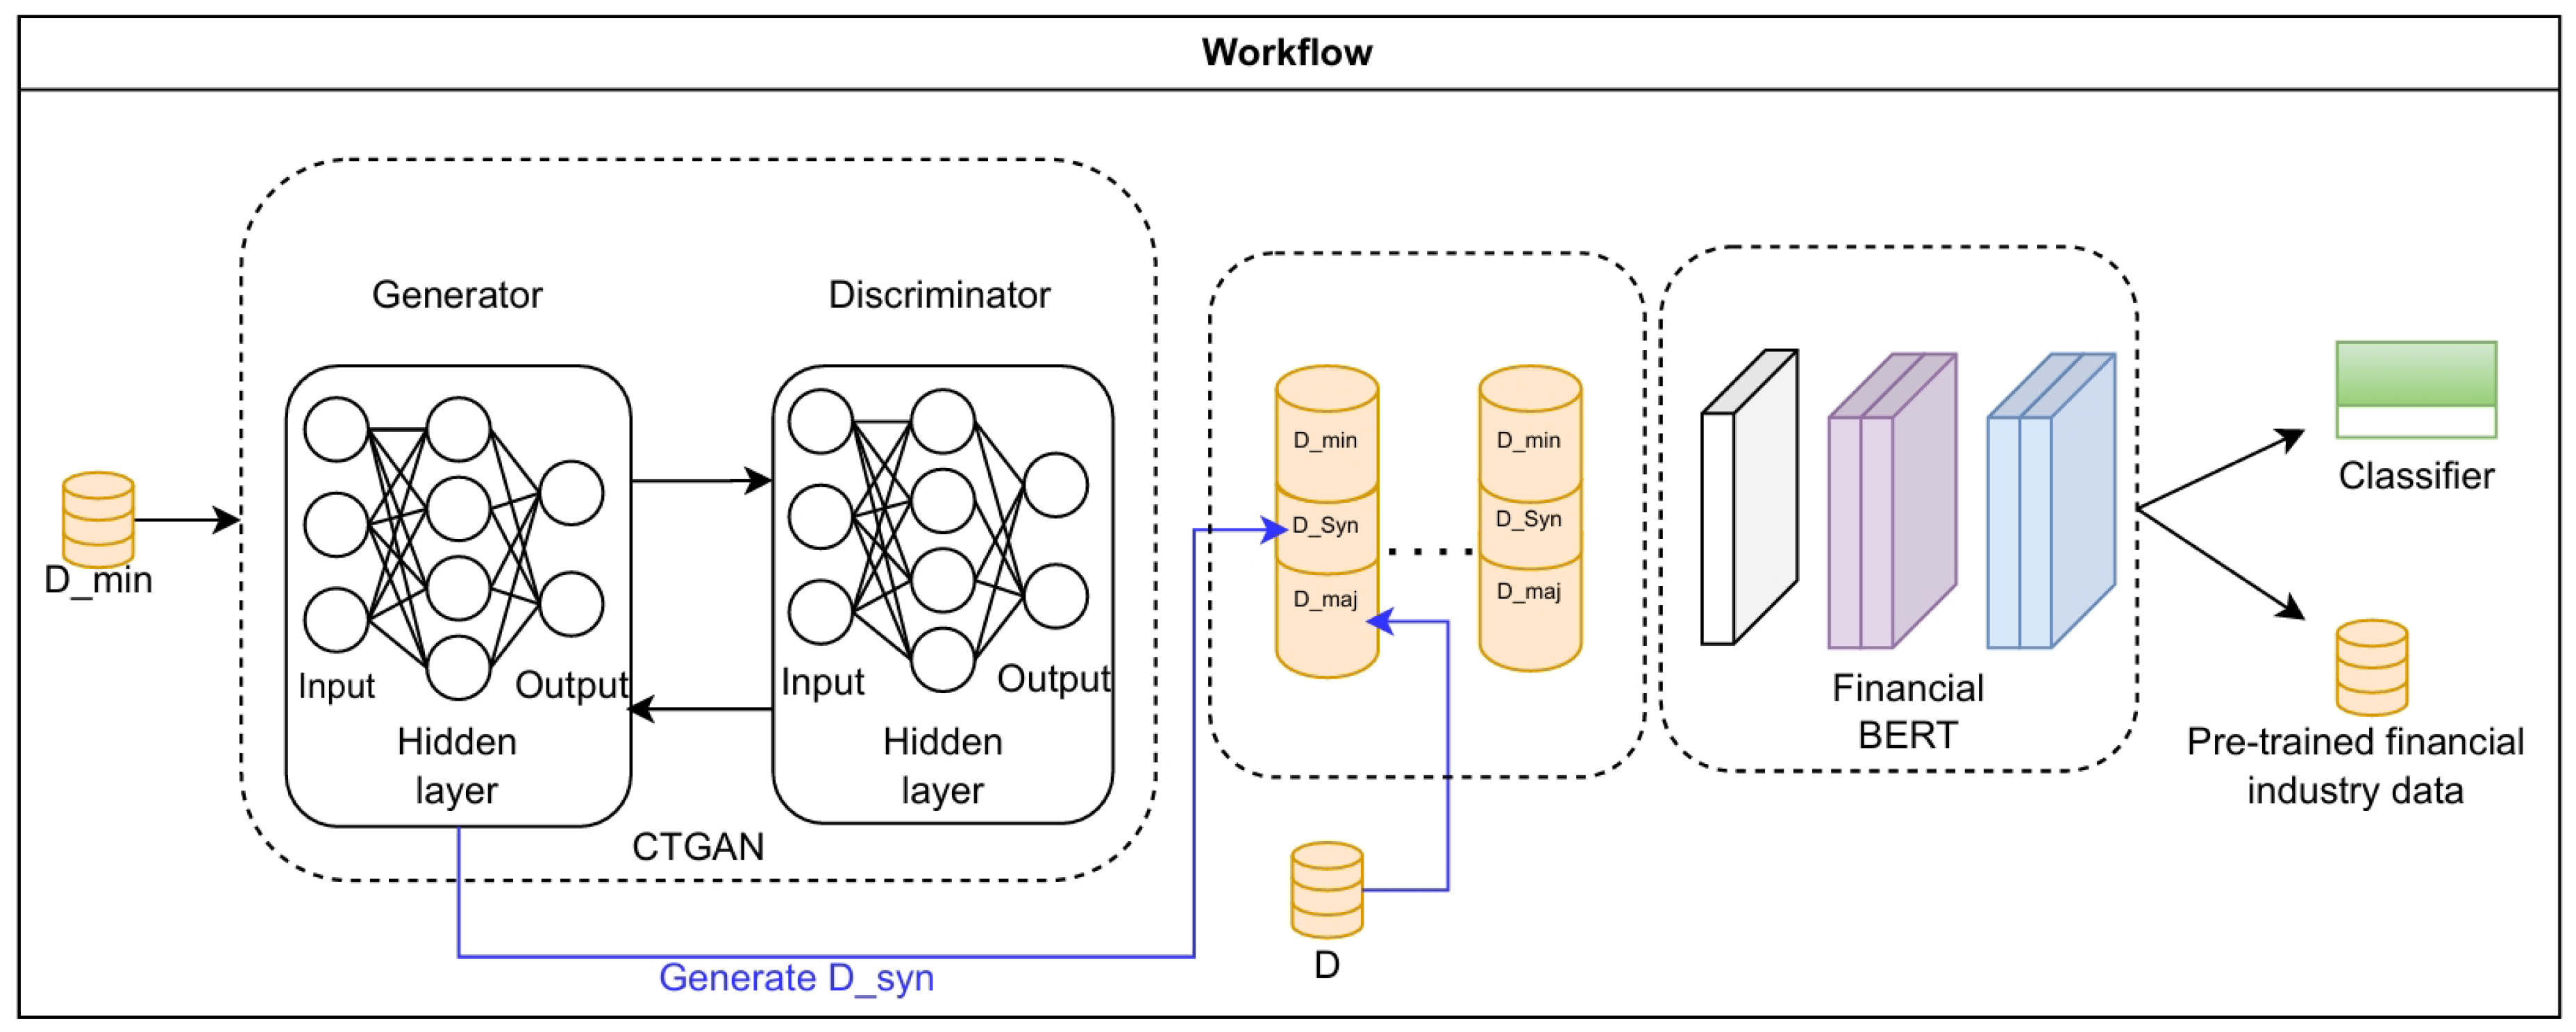
Figure 2.
Dataset passes through an embedding layer which encodes non-numeric features commonly found in tabular data and applies conditional filters. The generator component trains to generate high-quality records similar to the dataset. The discriminator component learns to accurately identify if the record is synthetic or not. An adversarial architecture is used to train both components concurrently, improving the performance of each.
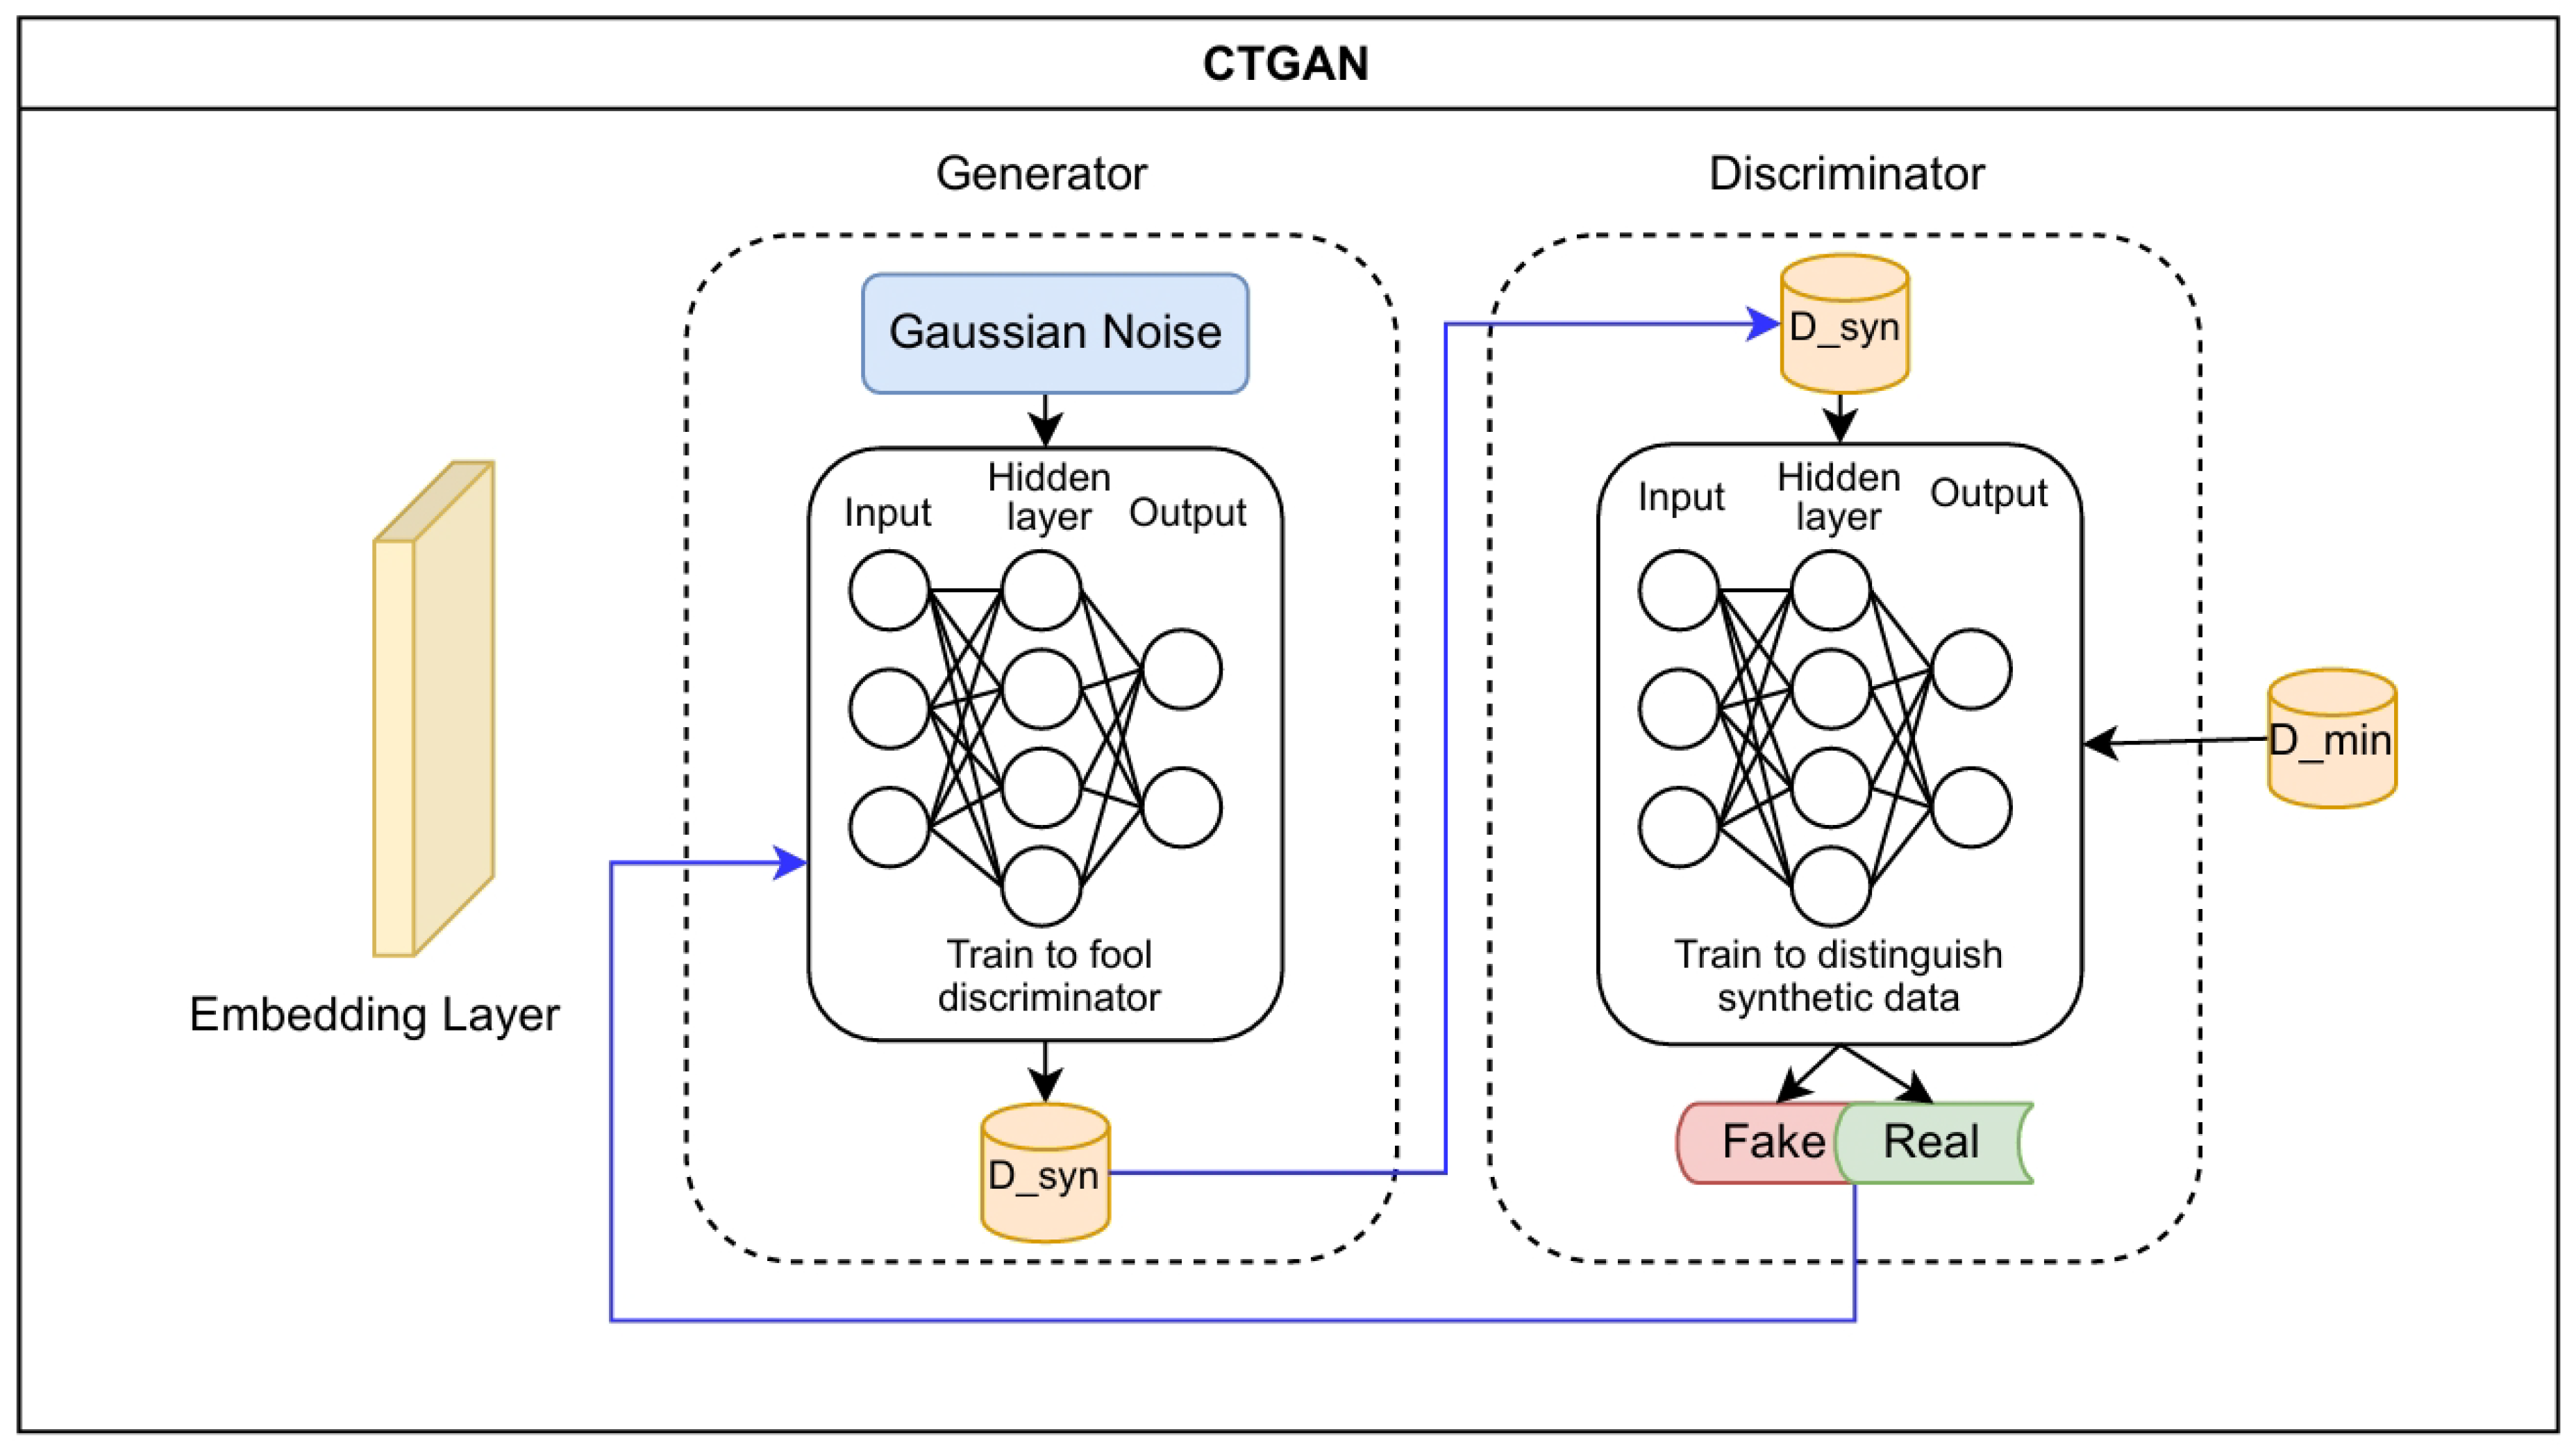
Figure 3.
Class distribution in one data batch with and , preparing a balanced dataset across both classes.
Figure 3.
Class distribution in one data batch with and , preparing a balanced dataset across both classes.
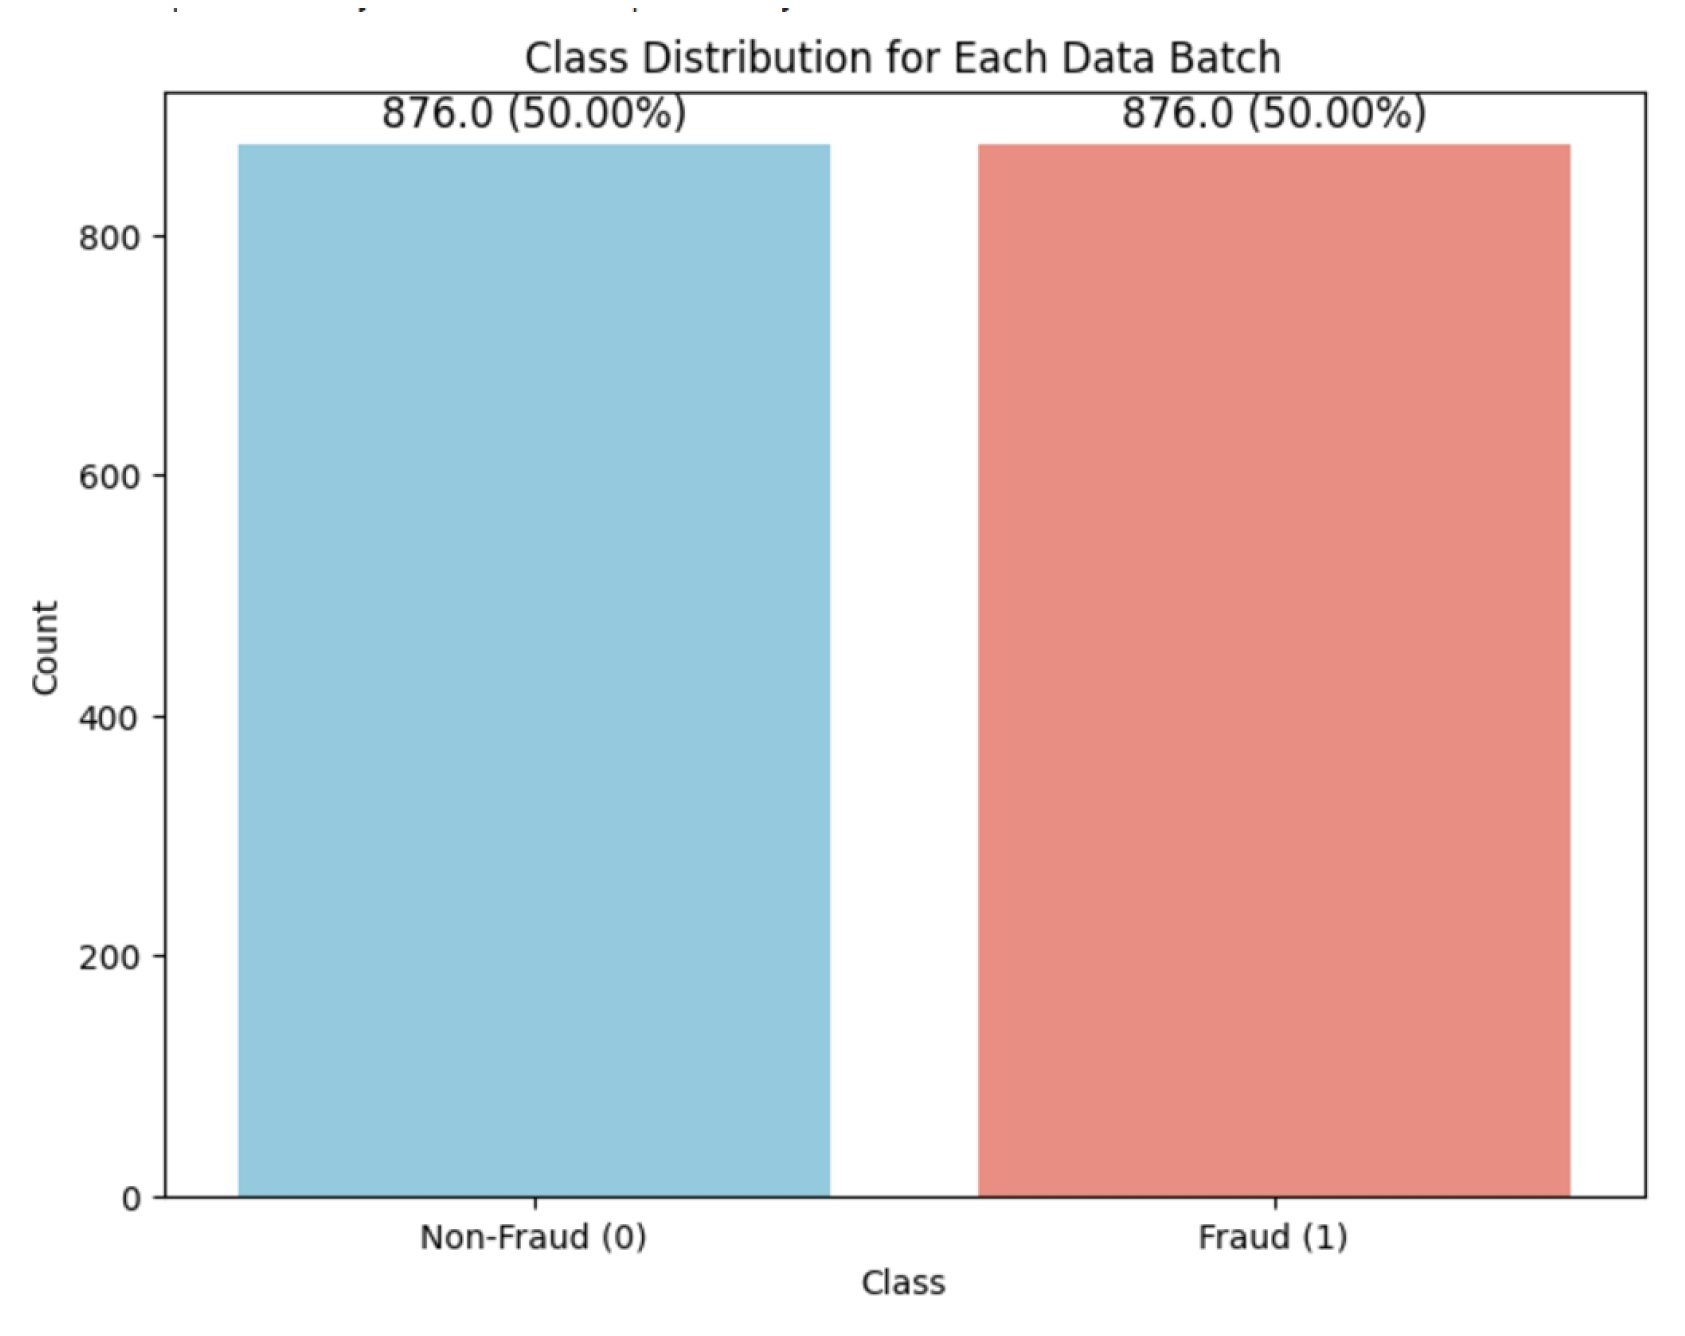
Figure 4.
Each data sample goes through an embedding layer, then is derived into the query Q, the key K, and the value V. The transformer calculates a self-attention score for the encoded Q, K, and V. The neural network layers learn intrinsic relationships and temporal factors by adjusting weights. The output passes through the decoder layer to convert into class 0 (non-fraud) or class 1 (fraud).
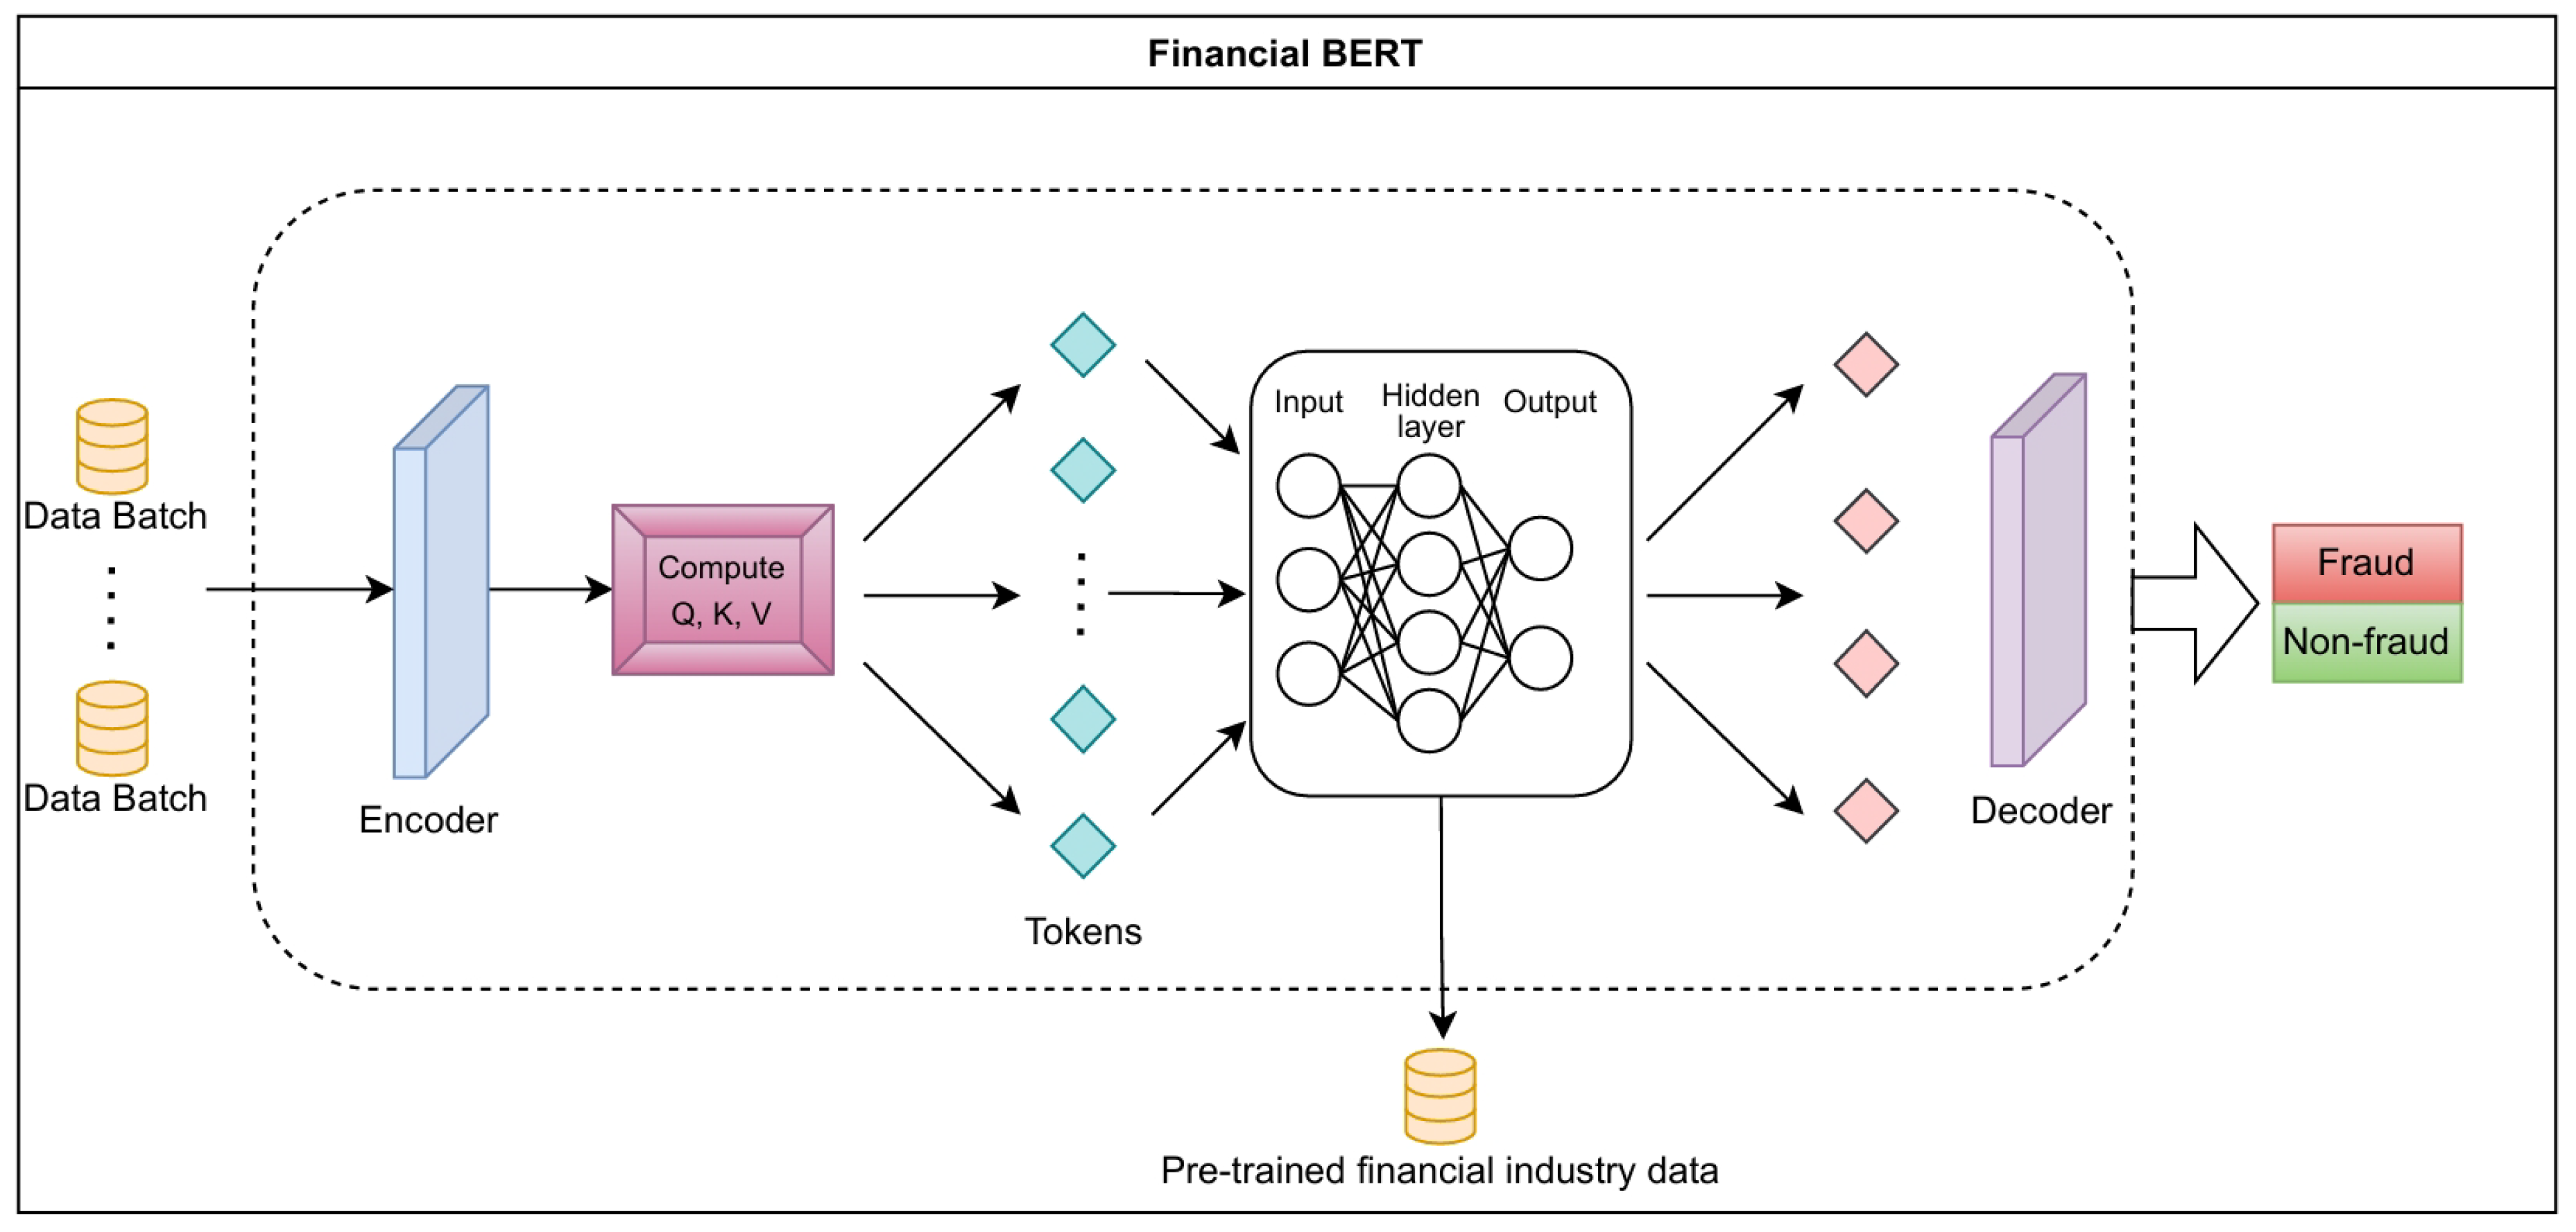
Figure 5.
Class distribution in the dataset, showing a significant imbalance between non-fraudulent (99.78%) and fraudulent (0.22%) transactions.
Figure 5.
Class distribution in the dataset, showing a significant imbalance between non-fraudulent (99.78%) and fraudulent (0.22%) transactions.
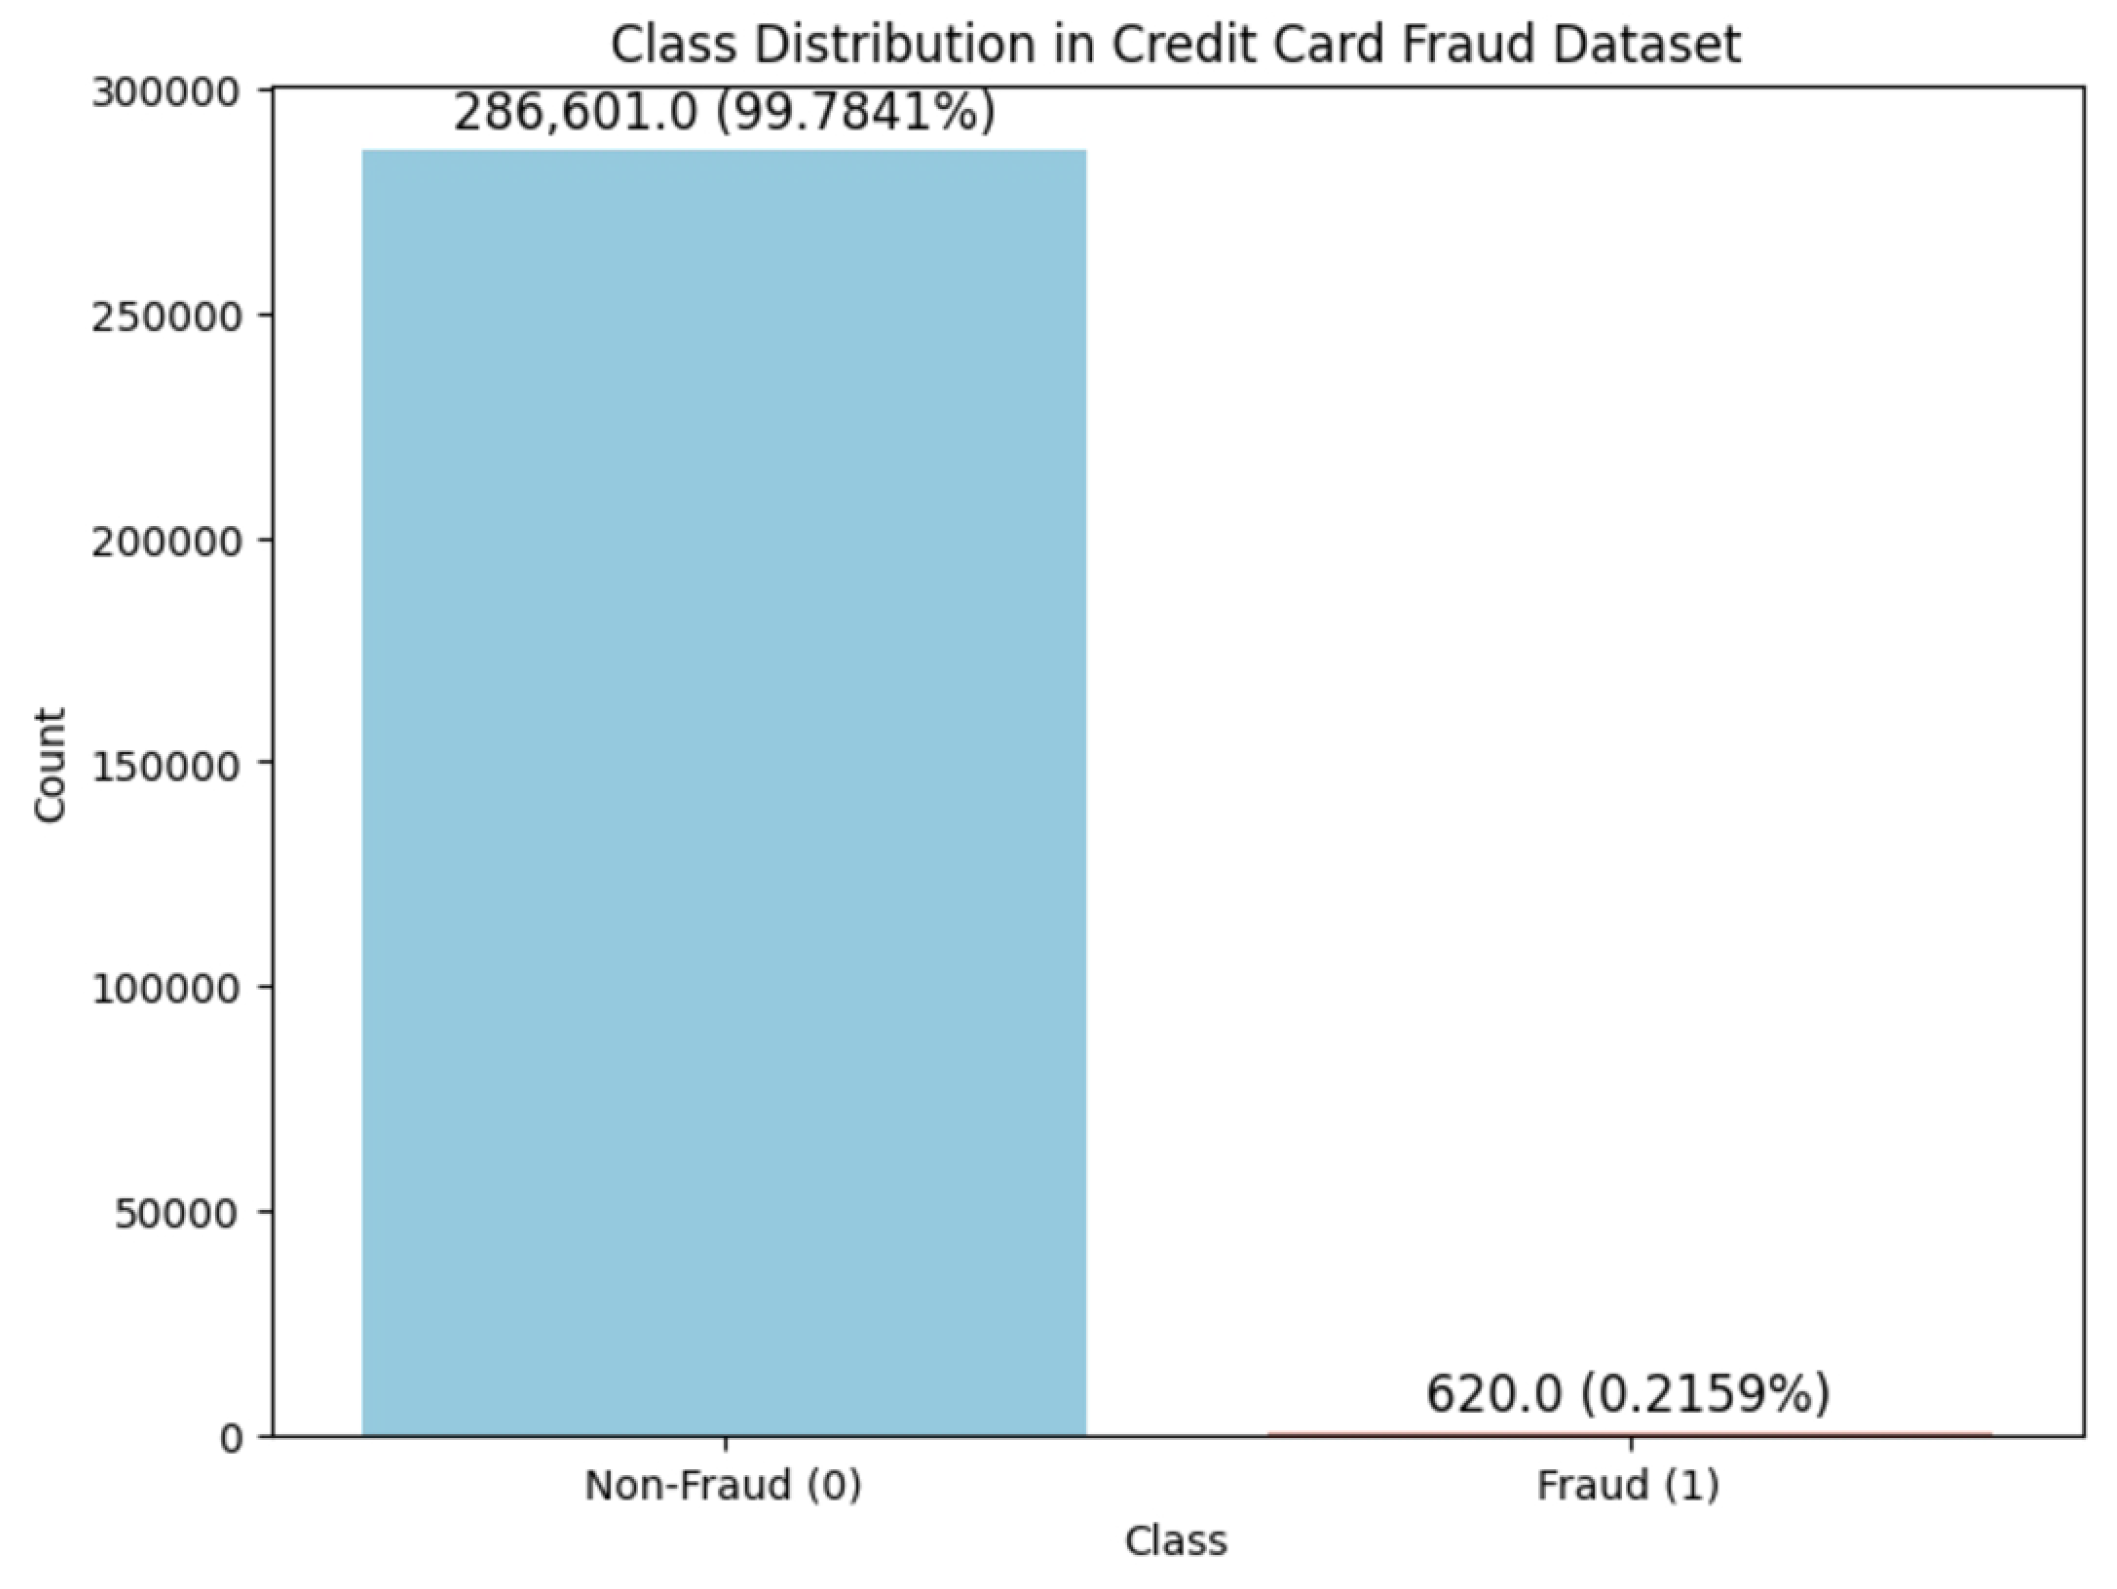
Figure 6.
PCA-based visualization of the dataset before (top) and after (bottom) outlier removal. The two principal components illustrate how data points are distributed in reduced-dimensional space.
Figure 6.
PCA-based visualization of the dataset before (top) and after (bottom) outlier removal. The two principal components illustrate how data points are distributed in reduced-dimensional space.
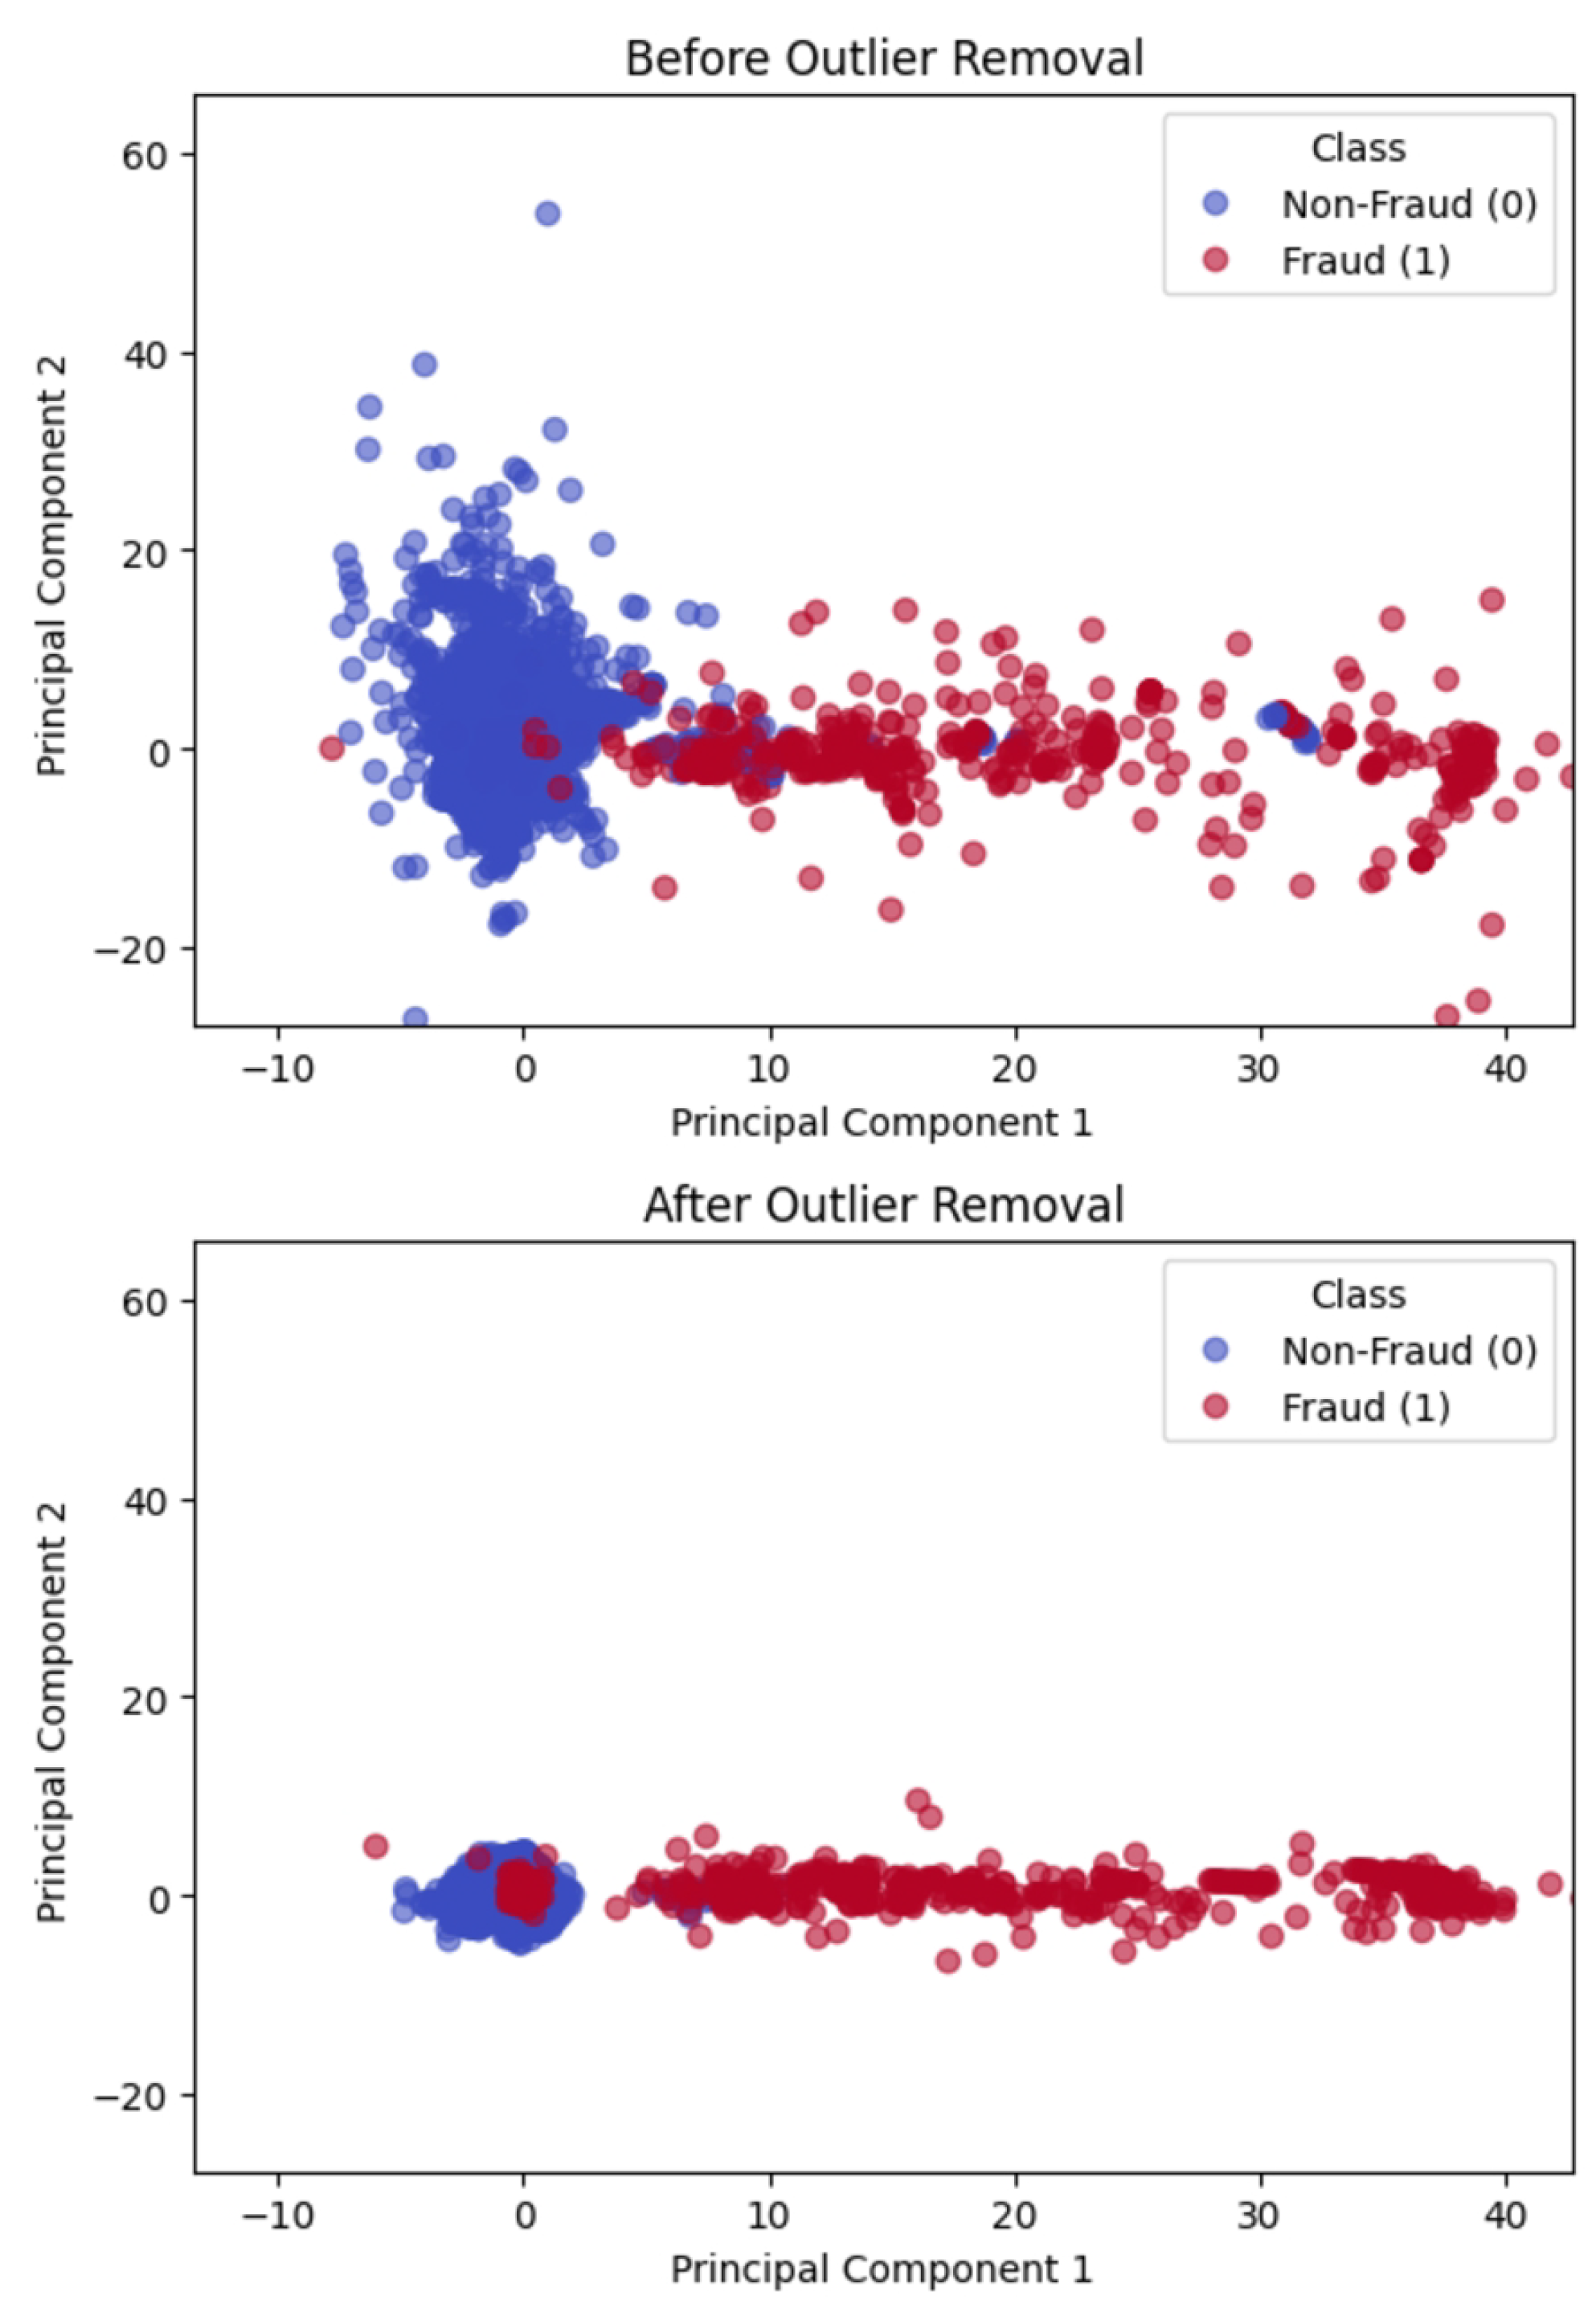
Figure 7.
ROC curves for all models in imbalanced test data. Ensemble SVM not plotted due to package unsupportability but AUC score is attached below the graph.
Figure 7.
ROC curves for all models in imbalanced test data. Ensemble SVM not plotted due to package unsupportability but AUC score is attached below the graph.
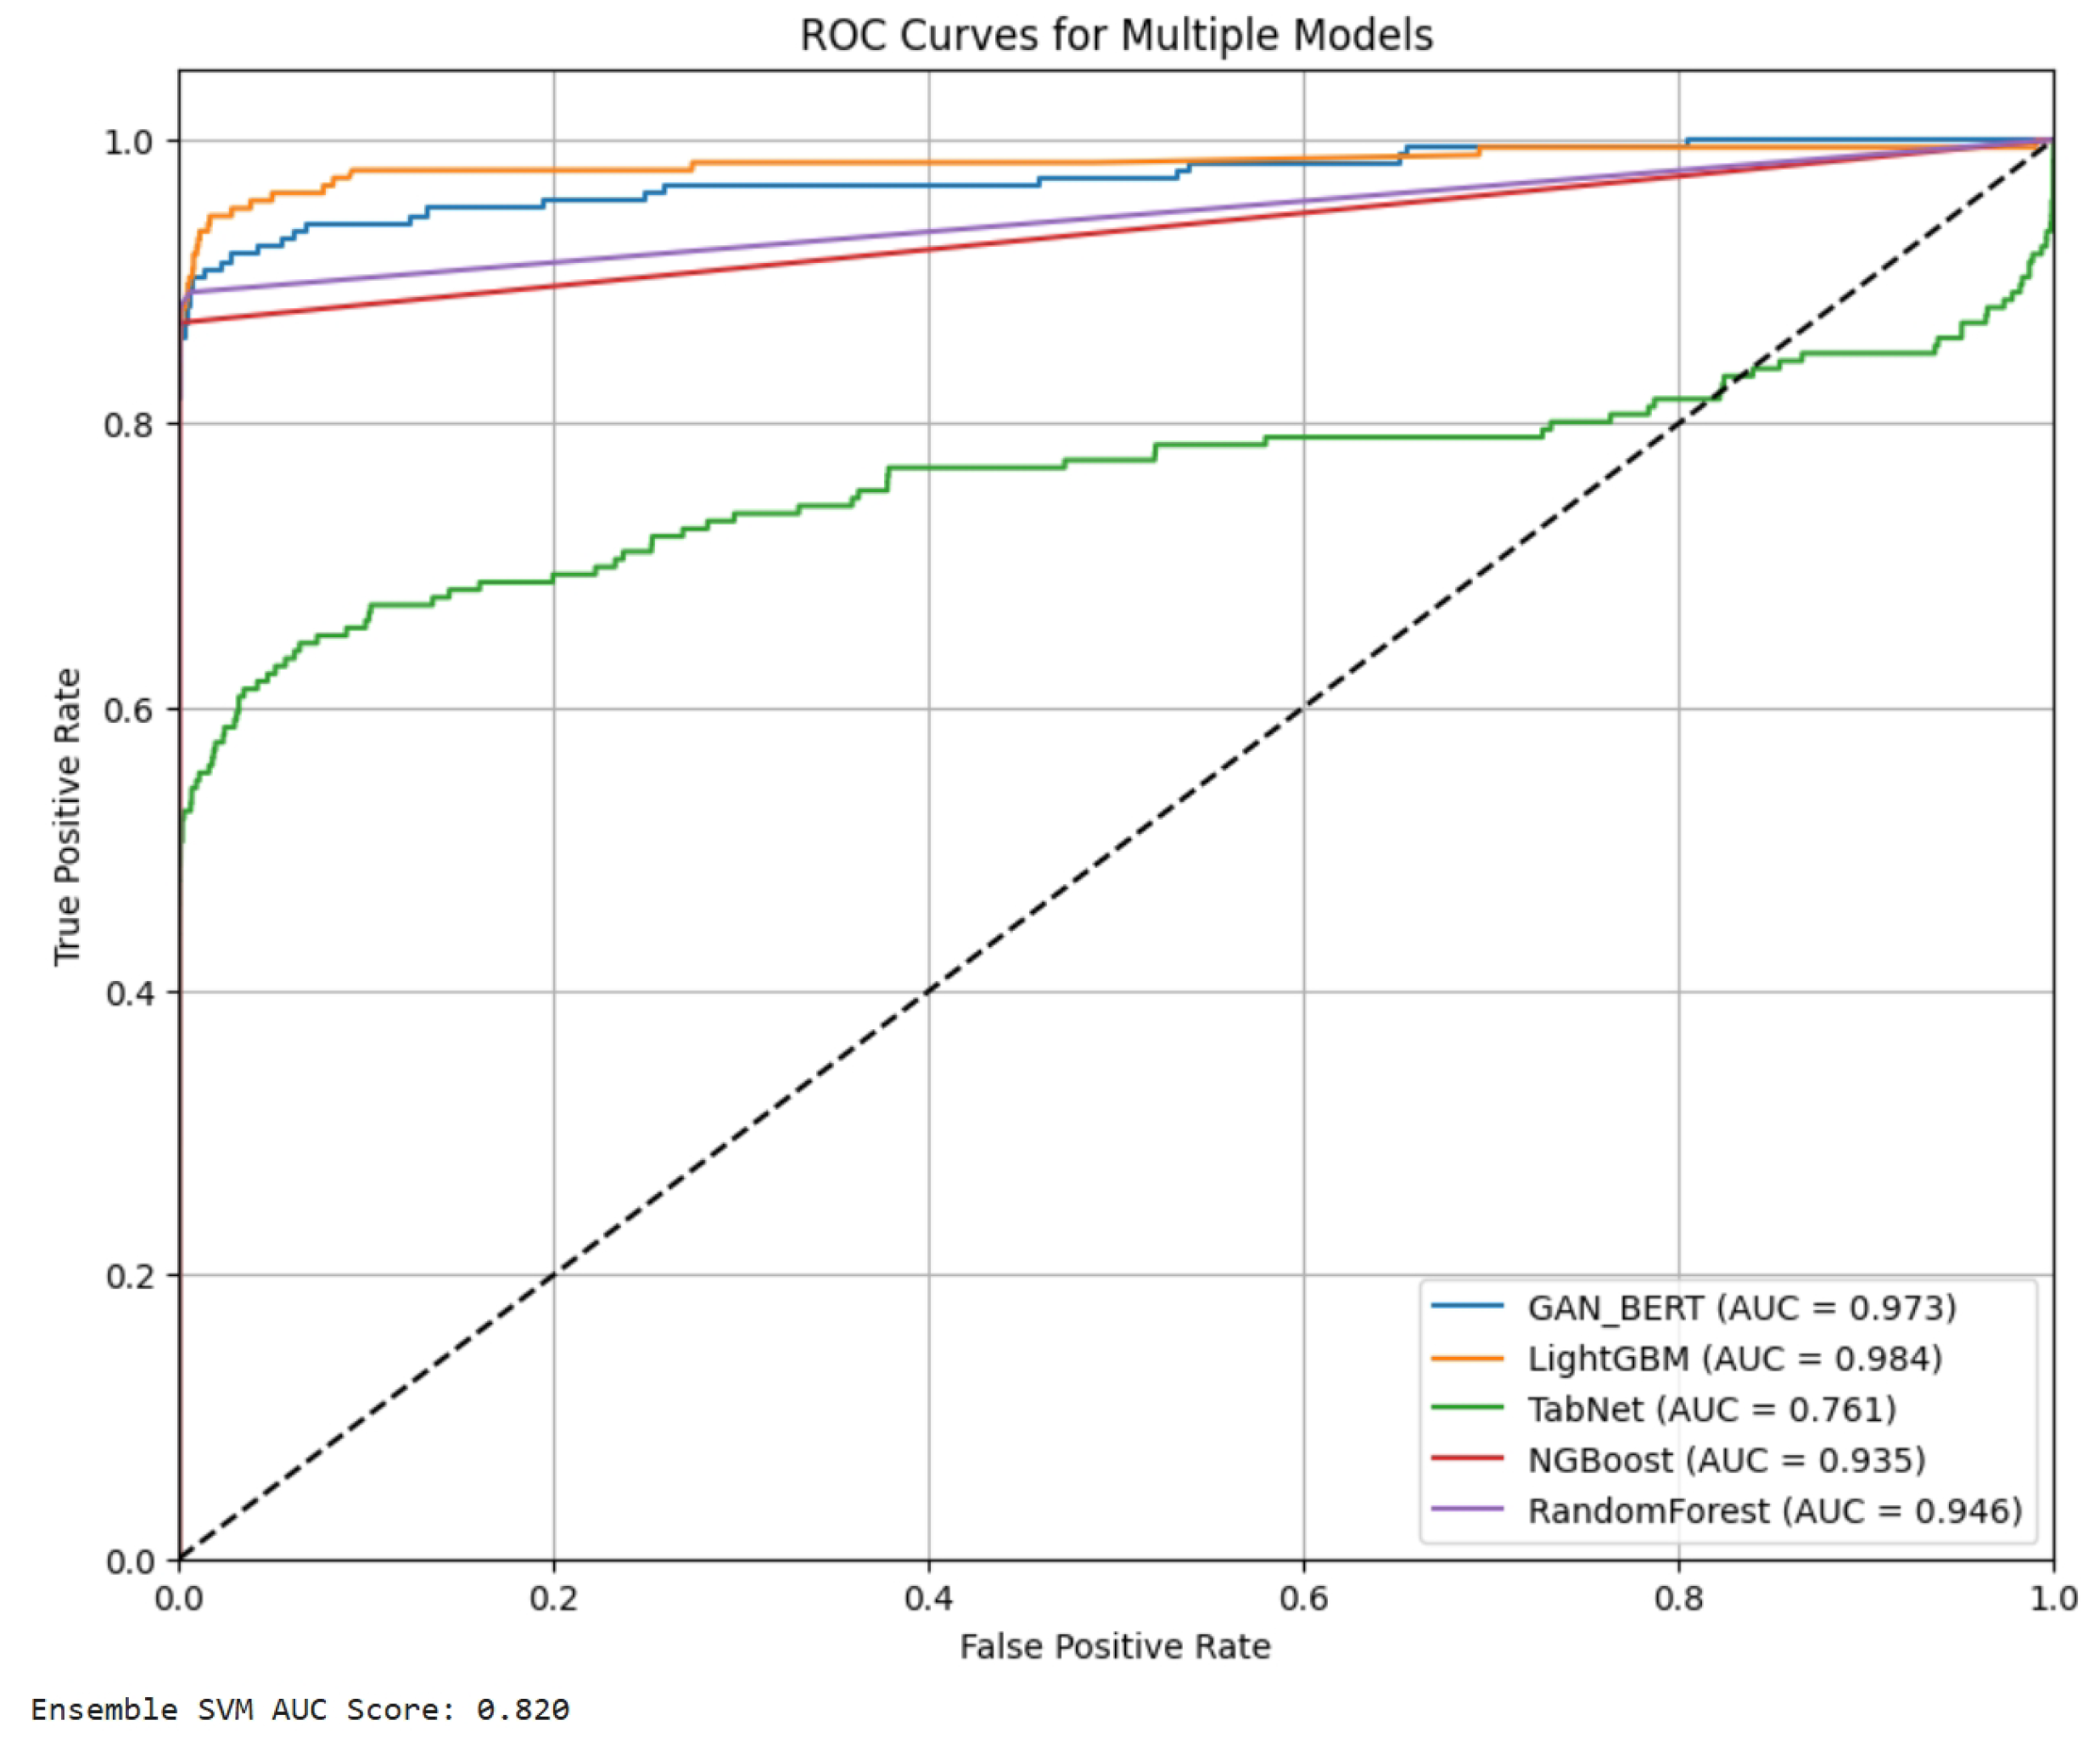
Figure 8.
ROC curves for all models in balanced test data. Ensemble SVM is not plotted due to package unsupportability but AUC score is attached below the graph.
Figure 8.
ROC curves for all models in balanced test data. Ensemble SVM is not plotted due to package unsupportability but AUC score is attached below the graph.
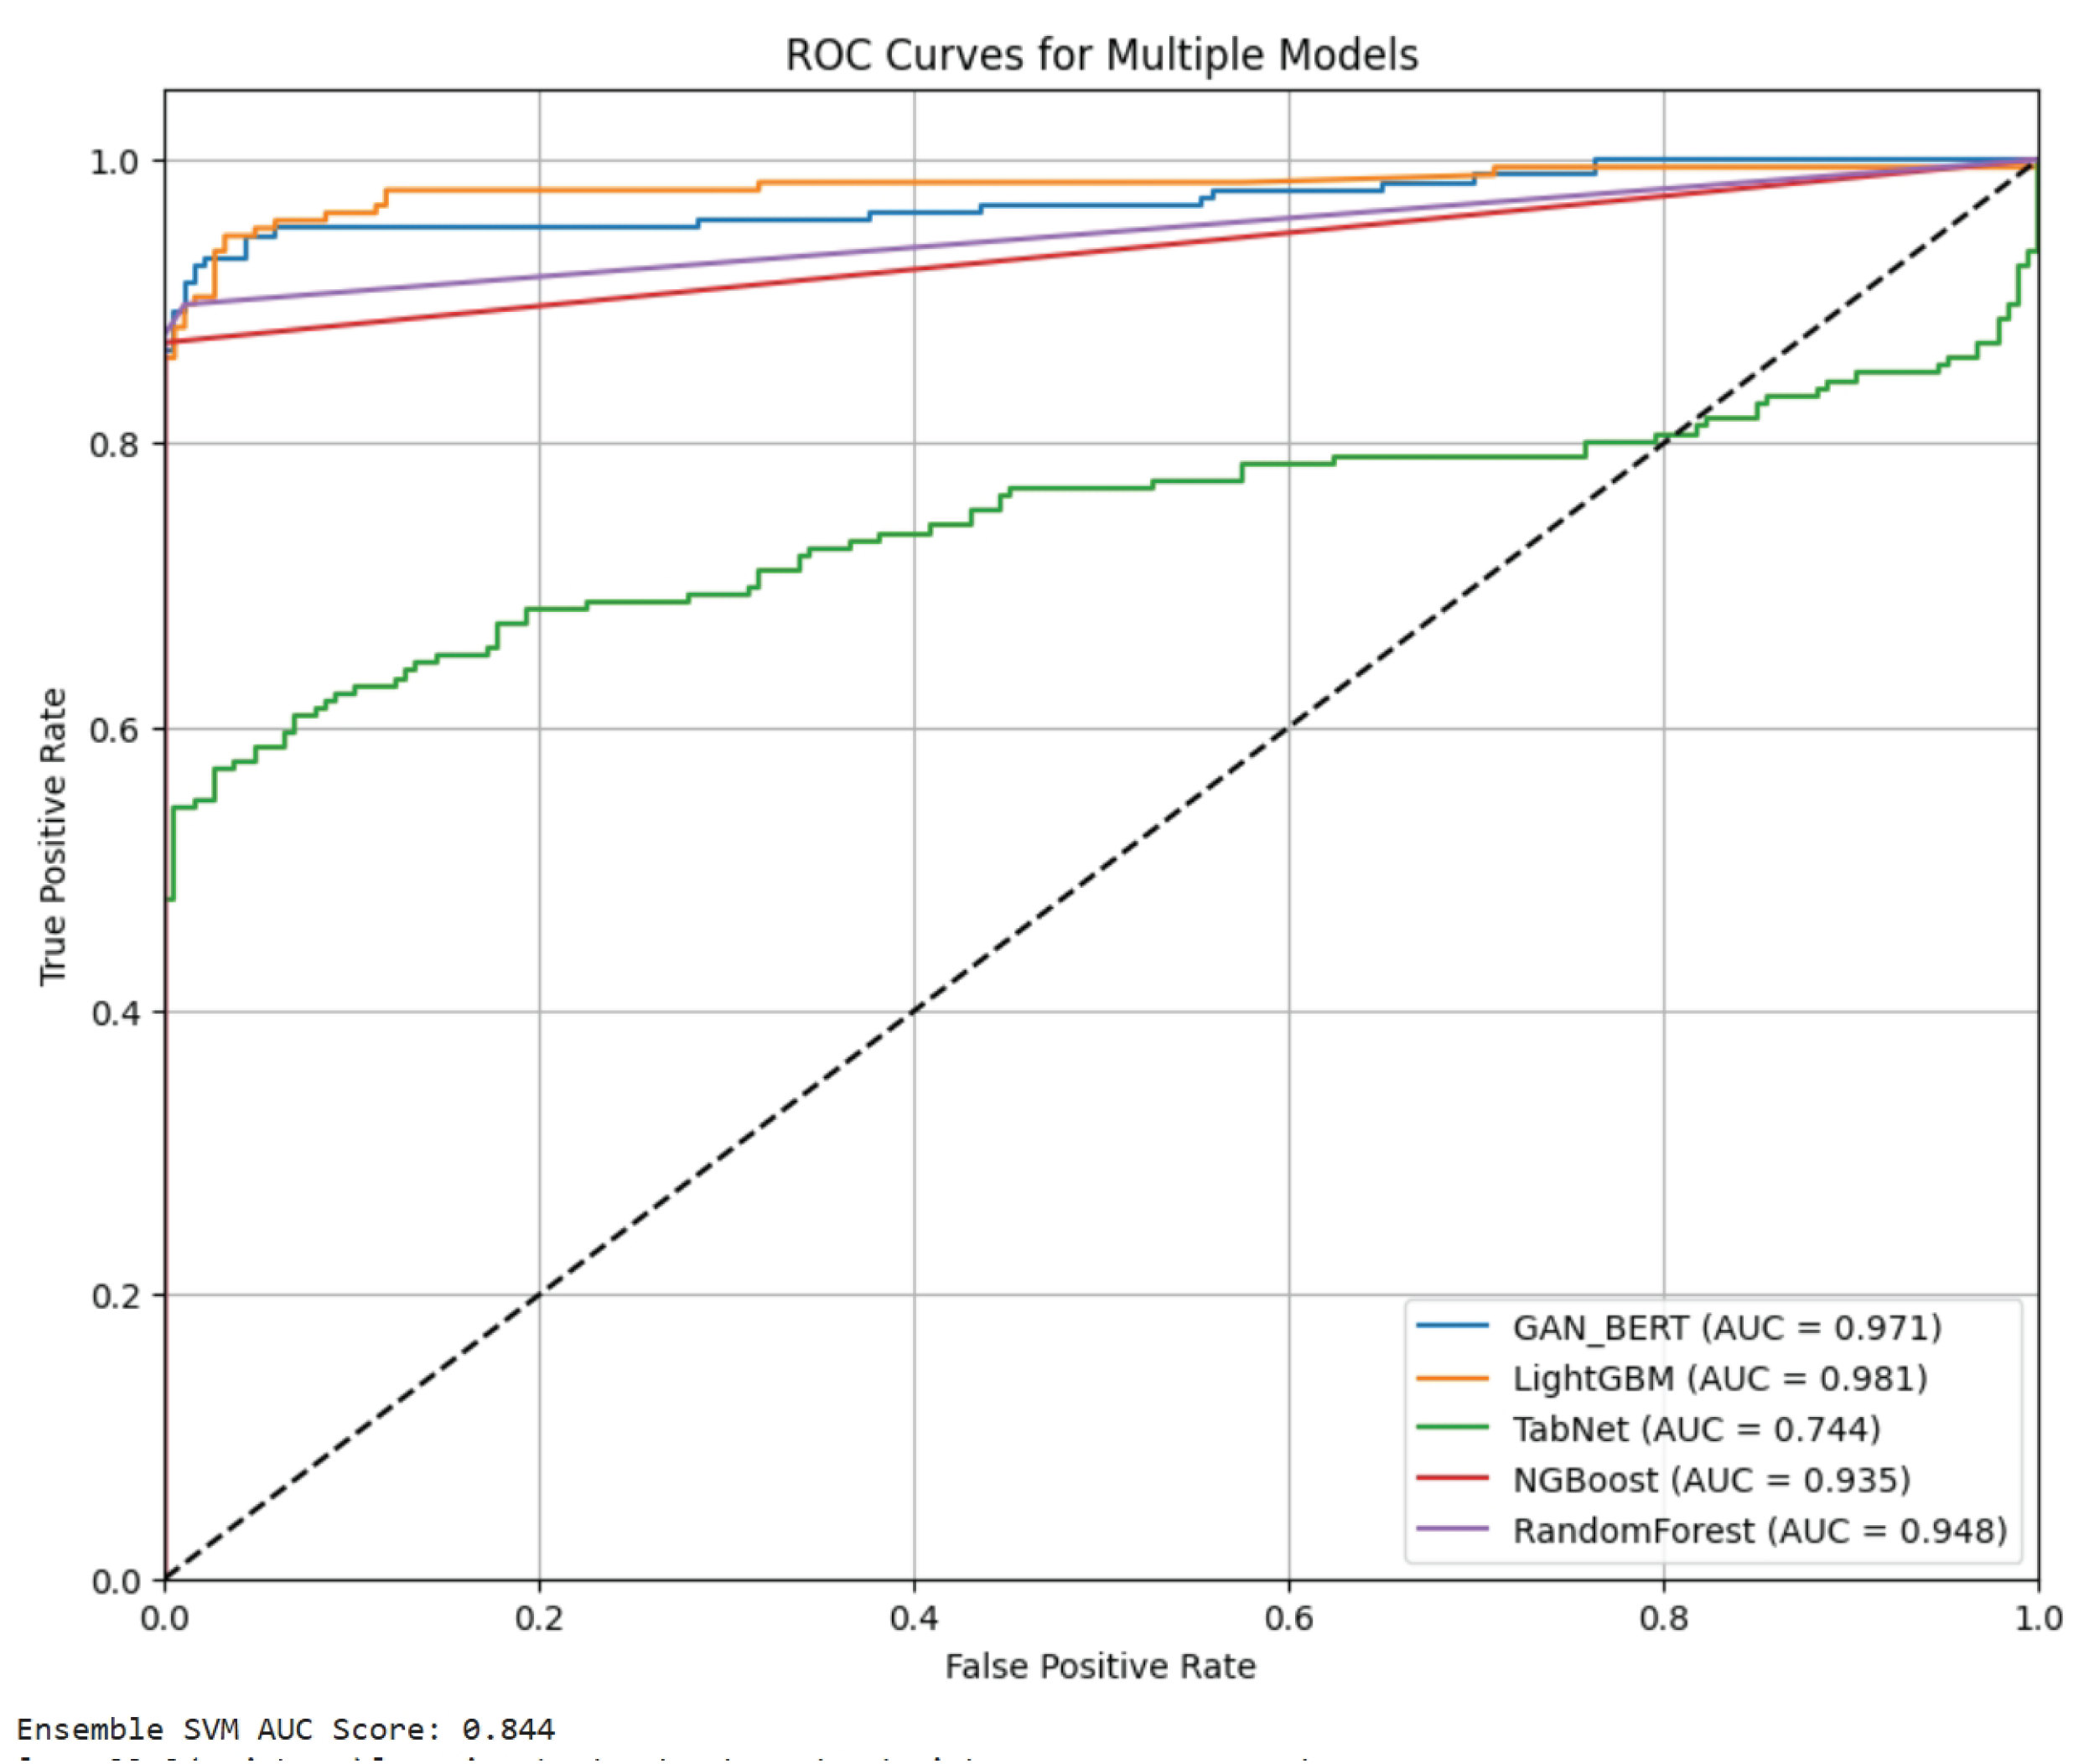

Table 1.
Performance Metrics for Class 0 (Imbalanced).
| Model | Precision | Recall | F1-Score | Accuracy |
| GAN_BERT | 0.998 ± 0.001 | 0.999 ± 0.001 | 0.999 ± 0.001 | 0.997 ± 0.001 |
| LightGBM | 0.999 ± 0.001 | 0.996 ± 0.001 | 0.997 ± 0.001 | 0.995 ± 0.001 |
| TabNet | 0.994 ± 0.001 | 0.999 ± 0.001 | 0.997 ± 0.001 | 0.994 ± 0.001 |
| NGBoost | 0.997 ± 0.001 | 0.999 ± 0.001 | 0.998 ± 0.001 | 0.995 ± 0.001 |
| EnsembleSVM | 0.997 ± 0.001 | 0.999 ± 0.001 | 0.998 ± 0.001 | 0.997 ± 0.001 |
| RandomForest | 0.998 ± 0.001 | 0.999 ± 0.001 | 0.999 ± 0.001 | 0.998 ± 0.001 |
Table 2.
Performance Metrics for Class 1 (Imbalanced).
| Model | Precision | Recall | F1-Score | Accuracy |
| GAN_BERT | 0.901 ± 0.057 | 0.838 ± 0.027 | 0.862 ± 0.009 | 0.997 ± 0.001 |
| LightGBM | 0.672 ± 0.001 | 0.893 ± 0.001 | 0.767 ± 0.001 | 0.995 ± 0.001 |
| TabNet | 0.999 ± 0.001 | 0.387 ± 0.001 | 0.558 ± 0.001 | 0.994 ± 0.001 |
| NGBoost | 0.997 ± 0.001 | 0.683 ± 0.001 | 0.812 ± 0.001 | 0.995 ± 0.001 |
| EnsembleSVM | 0.999 ± 0.001 | 0.681 ± 0.006 | 0.809 ± 0.006 | 0.997 ± 0.001 |
| RandomForest | 0.999 ± 0.001 | 0.759 ± 0.001 | 0.873 ± 0.001 | 0.998 ± 0.001 |
Table 3.
Performance Metrics for Class 0 (Balanced).
| Model | Precision | Recall | F1-Score | Accuracy |
| GAN_BERT | 0.860 ± 0.019 | 0.998 ± 0.002 | 0.929 ± 0.011 | 0.917 ± 0.014 |
| LightGBM | 0.896 ± 0.008 | 0.983 ± 0.008 | 0.938 ± 0.007 | 0.931 ± 0.001 |
| TabNet | 0.620 ± 0.001 | 0.999 ± 0.001 | 0.765 ± 0.001 | 0.694 ± 0.001 |
| NGBoost | 0.759 ± 0.001 | 0.999 ± 0.001 | 0.863 ± 0.001 | 0.841 ± 0.001 |
| EnsembleSVM | 0.750 ± 0.027 | 0.999 ± 0.001 | 0.854 ± 0.022 | 0.832 ± 0.024 |
| RandomForest | 0.818 ± 0.008 | 0.999 ± 0.001 | 0.900 ± 0.004 | 0.891 ± 0.006 |
Table 4.
Performance Metrics for Class 1 (Balanced).
| Model | Precision | Recall | F1-Score | Accuracy |
| GAN_BERT | 0.978 ± 0.036 | 0.837 ± 0.027 | 0.909 ± 0.021 | 0.917 ± 0.014 |
| LightGBM | 0.887 ± 0.102 | 0.868 ± 0.016 | 0.878 ± 0.018 | 0.931 ± 0.001 |
| TabNet | 0.999 ± 0.001 | 0.387 ± 0.001 | 0.558 ± 0.001 | 0.694 ± 0.001 |
| NGBoost | 0.999 ± 0.001 | 0.683 ± 0.001 | 0.812 ± 0.001 | 0.841 ± 0.001 |
| EnsembleSVM | 0.999 ± 0.001 | 0.682 ± 0.023 | 0.798 ± 0.031 | 0.832 ± 0.024 |
| RandomForest | 0.999 ± 0.001 | 0.764 ± 0.014 | 0.874 ± 0.009 | 0.891 ± 0.006 |
Disclaimer/Publisher’s Note: The statements, opinions and data contained in all publications are solely those of the individual author(s) and contributor(s) and not of MDPI and/or the editor(s). MDPI and/or the editor(s) disclaim responsibility for any injury to people or property resulting from any ideas, methods, instructions or products referred to in the content. |
© 2025 by the authors. Licensee MDPI, Basel, Switzerland. This article is an open access article distributed under the terms and conditions of the Creative Commons Attribution (CC BY) license (http://creativecommons.org/licenses/by/4.0/).
Copyright: This open access article is published under a Creative Commons CC BY 4.0 license, which permit the free download, distribution, and reuse, provided that the author and preprint are cited in any reuse.


