
Submitted:
11 June 2025
Posted:
12 June 2025
You are already at the latest version
Abstract
PURPOSE: To evaluate whether myocardial extracellular volume (ECV) could be measured from whole-body CT examinations without electrocardiographic gating in cancer patients before and after the chemotherapy, with the goal to detect early-stage myocardial alterations heralding chemotherapy-induced cardiotoxicity. MATERIAL AND METHODS: Consecutive patients receiving chemotherapy with a high (High-risk group) or low (Low-risk group) risk of cardiotoxicity were retrospectively enrolled. Patients underwent a whole-body CT examination for cancer staging before (CT-I) and after the first chemotherapy cycle (CT-II). Precontrast, arterial phase, and late post-contrast CT-I and CT-II images were analysed using in-house software. Myocardial ECV maps were generated from the combined analysis of precontrast and late post-contrast images, whereas the increase of myocardial and blood densities in arterial phase from basal values were compared to calculate arterial myocardial λ (arterial increase of myocardial density/increase of blood density).RESULTS: The population included 89 patients (mean age 63±14 years): 58 High-Risk and 31 Low-Risk. High-risk patients showed a significant increase of ECV of the interventricular septum, from 32% (31-35%) to 37% (35-39%) (p = 0.0002) and lateral wall, from 30% (27-31) to 32% (29-34) (p = 0.028). In contrast, Low-risk patients showed no significant variation of septal (p = 0.16) and LV lateral wall ECV (p = 0.93). Arterial myocardial λ at CT-II was reduced compared to CT-I in 31% of High-risk patients vs 10% of Low-risk patients (p=0.036).CONCLUSION: This preliminary study demonstrated that myocardial ECV can be effectively measured in ECG-ungated whole-body CT examinations for cancer staging in patients undergoing chemotherapy. Potentially cardiotoxic chemotherapy can be associated with alterations of ECV and arterial myocardial λ.
Keywords:
myocardial extracellular volume
; computed tomography
; cardiotoxicity
1. Introduction
Over the last three decades, global cancer incidence rates have steadily increased in most industrialized countries [1]. Simultaneously, new therapeutic strategies have improved the survival rates for many types of tumors. Alongside the rise in cancer survival, the significance of adverse effects from cancer therapies, particularly cardiotoxicity, has become increasingly relevant [2].
Cancer therapy-related cardiovascular toxicity (CTR-CVT) encompasses a broad spectrum of cardiovascular complications that may arise during or after cancer therapy (chemotherapy or radiotherapy). These complications include direct effects on the heart muscle (e.g., cancer therapy-related cardiac dysfunction), vascular complications, and arrhythmias [3]. The ultimate outcome of cardiotoxicity is often an irreversible impairment of cardiac function, leading to the development of heart failure. However, in the early stages, most patients are asymptomatic, and cardiotoxicity is typically diagnosed through imaging. Biomarkers such as troponin and NT-pro-BNP may also play a role in evaluating cardiotoxicity, but their utility requires serial assessment. Additionally, these biomarkers generally show increased levels only after irreversible left ventricular impairment has occurred [4,5].
Echocardiography is the first-line imaging technique, providing an assessment of left and right ventricular ejection fractions, diastolic function, and longitudinal strain analysis [6]. However, echocardiography falls short of the ideal goal of detecting cardiotoxic damage at early preclinical stages, prior to the onset of systolic dysfunction [7].
Cardiac magnetic resonance (CMR) is considered the gold standard for evaluating cardiac function and detecting early myocardial tissue abnormalities without functional impairment [8]. CMR with pre- and post-contrast T1 mapping enables the measurement of extracellular volume (ECV) in the myocardium, which increases in the presence of diffuse myocardial fibrosis due to cardiotoxicity [9,10,11,12]. Several studies have demonstrated that ECV increases following anthracycline therapy in both animal models [13,14] and human patients [15,16]. However, the main limitations of CMR include limited availability, high costs, and the need for dedicated examinations, which restrict its routine use for screening oncological patients.
Cardiac computed tomography (CT) has recently emerged as a potential alternative to CMR for measuring myocardial ECV. This is due to the similar intravascular and interstitial distribution of gadolinium- and iodine-based contrast agents [18,19,20]. Moreover, contrast-enhanced whole-body CT scans are routinely performed for staging and follow-up in patients with various types of cancer. Despite differences in CT image acquisition protocols—primarily the absence of electrocardiographic (ECG) gating—these scans could allow myocardial ECV quantification based on variations in myocardial iodine content, reflecting the biodistribution of contrast material at different time points.
Our purpose was to evaluate whether myocardial ECV could be measured from whole-body CT examinations without electrocardiographic gating in cancer patients before and after the chemotherapy. The goal was to detect early-stage myocardial alterations heralding chemotherapy-induced cardiotoxicity. To this purpose, we developed a novel method for generating ECV maps from whole-body CT images performed for pre- and post-chemotherapy monitoring.
2. Methods
2.1. Patient Enrollment
Multislice CT datasets of 100 patients with malignant tumours undergoing chemotherapy were retrospectively evaluated. Patients were selected based on the following inclusion criteria: a) having undergone at least one whole-body CT examination for cancer staging prior to the beginning of chemotherapy (CT-I), and at least one whole-body follow-up CT examination after the first cycle of chemotherapy (CT-II), no later than 6 months after its completion; b) whole-body CT examinations should include precontrast and postcontrast arterial and late phase images spanning the heart as part of the scan volume; c) hematocrit sampling should not have been performed more than 21 days apart from each CT scan. Exclusion criteria were the following: a) no available information regarding the chemotherapy regimen used, b) CT images with artefacts hindering the evaluation of the heart region, c) known pre-existing cardiac disease (including ischemic heart disease, cardiomyopathies, inflammatory myocarditis, and pericarditis), d) family history of genetically transmitted cardiomyopathies, e) patients with a risk of ischemic heart disease higher than 10% (the risk of ischemic heart disease was calculated using the Systematic Coronary Risk Evaluation 2, SCORE2, or SCORE2-OP in patients aged >70 years); f) previous or ongoing thoracic or mediastinal radiation therapy, g) history of multiple malignancies previously treated with chemotherapy.
After the initial selection, 11 patients were excluded for the following reasons: thoracic radiotherapy in 3, family history of cardiac disease in 5, reported previous pericarditis in 1, myocardial anomalies found at CT-I (fat metaplasia) in 2 patients.
2.2. CT Image Acquisition Protocol
All CT examinations were conducted based on clinical indications for primary staging and follow-up after chemotherapy. Images were acquired using a 64-row CT scanner (CT Revolution Evo™, General Electric, Milwaukee, WI) using the following parameters: detector configuration 64✕0.625mm, slice thickness 2.5mm, reconstruction interval 2.5mm, tube voltage 120kV, automated tube current modulation (noise index 20), Standard reconstruction kernel, iterative reconstruction (ASIR-V™, depth 40%). ECG-gating was not performed due to the whole-body cancer staging purpose of CT examinations at the time of scanning.
Following a precontrast scan, in all CT examinations multiphase post-contrast images were acquired, including an arterial phase (obtained 35-40 seconds after the beginning of contrast medium injection), a portal venous phase (75-80 seconds post-contrast injection), and a late phase (3 minutes post-contrast injection). An iodine dose of 1.3-1.5mL/kg of nonionic contrast material (iodine concentration 370-400mgI/mL) was administered at 3-3.5mL/s flow rate via a power injector (Medrad™, Bayer Healthcare, Leverkusen, Germany), followed by 40mL saline flush injected at the same flow rate.
2.3. Image Processing
A simplified method to generate ECV maps was used. Briefly, maps were generated by voxelwise measurement of ECV considering the density of each voxel of late phase post contrast images (expressed in Hounsfield units, HU) and the average density measured in regions of interest (ROI) placed in blood pool and interventricular septum in pre-contrast images and in the blood pool of post-contrast image, as follows. In all patients, precontrast and postcontrast late phase thoracic images of CT-I and CT-II examinations were analysed using home-made software developed at our institution (ECV-tool). Analysis was performed by 2 radiologists with >20 years of experience in cardiac imaging placed a manually traced region of interest (ROI) inside the left ventricular cavity (blood pool) in the precontrast and postcontrast late phase CT images at the same scan levels, taking care to keep ROI contours at a distance of at least 2mm from intraventricular structures (e.g., papillary muscles) and the endocardial surface. Another manually traced ROI was placed by the same radiologist inside the interventricular septal myocardium on precontrast images.
Average CT attenuation values in HU inside precontrast myocardial ROI, precontrast blood pool ROI, and postcontrast late-phase blood-pool ROI were used to calculate ECV for each image voxel, based on the following formula:
Where: Hct is the haematocrit estimated using the synthetic haematocrit method (as described in the following section); LPMyoVoxel was the HU of the respective voxel in the postcontrast late-phase image; PCMyoROI was the average HU in ROI in the interventricular septum in pre-contrast image; LPBloodROI was the average HU of the blood-pool ROI in late phase images; PCBloodROI was the average HU of blood-pool ROI in pre-contrast image.
Colour-scale ECV maps were generated to highlight clinically significant ECV thresholds. The following five thresholds were: a) lower than 15%, b) between 15% and 34.9%, c) between 35% and 44.9%, d) between 45% and 59.9%, and e) equal to or higher than 60% (Figure 1). ECV was measured in the interventricular septum and in lateral wall of left ventricle.
The arterial-phase myocardial λ is the arterial phase enhancement of myocardium relative to the enhancement of the blood pool. The arterial-phase myocardial λ maps were generated, in a similar manner of ECV, by measuring the density in HU of each voxel in the arterial-phase post-contrast image, and the average density of the ROIs placed respectively in blood-pool of the arterial-phase post-contrast image, in the interventricular septum and in the blood-pool of pre-contrast image. Arterial-phase myocardial λ was measured for each voxel of arterial-phase images using the following formula [21]:
Where: APMyoVoxel was the HU of the respective voxel in the post-contrast arterial-phase image; PCMyoROI was the average HU in ROI in the interventricular septum in pre-contrast image; APBloodROI was the average HU of the blood-pool ROI in arterial phase images; PCBloodROI was the average HU of blood-pool ROI in pre-contrast image.
Colour-scale Arterial-phase λ maps were generated to highlight clinically significant thresholds as for ECV maps.
2.4. Estimation of Synthetic Haematocrit
As shown by Equation 1, ECV depends on haematocrit among other factors. However, obtaining haematocrit from a blood sample taken the same day of the CT examination can be challenging in real world practice. Moreover, in our retrospective study there was a variable gap (median 8 days, range 18 days) between the times of blood sampling and CT imaging, which could have influenced ECV estimation. To address this issue, we used the so-called ‘synthetic haematocrit’ based on the following linear equation [22]:
To adjust for deviations of CT numbers due to differences in local CT equipment and image acquisition protocols, we calibred the linear model for synthetic haematocrit using data from our institution. To this purpose, we measured blood-pool CT attenuation in another cohort of 100 randomly-selected patients with recent haematocrit values (from a blood sample taken no more than 3 days prior), and obtained the following linear regression equation:
Compared to Equation 2, Equation 3 provided a closer estimation of the true haematocrit (mean difference 2.3 ± 0.3% vs 3.3 ± 0.3% p = 0.003), and was then used to estimate the synthetic haematocrit in both High-risk and Low-risk groups.
2.5. Statistical Analysis
Categorical variables were expressed as values and percentages. For continuous variables, a preliminary analysis for normality was conducted using the Kolmogorov-Smirnov test. Variables with a normal distribution were expressed as mean ± standard deviation (SD), whereas variables with a non-normal distribution were expressed as median (25th-75th percentile). Chi-square or Fisher’s test (when appropriate) were performed to compare categorical variables, whereas ANOVA with Bonferroni correction for normally distributed variables was performed to compare continuous variables between High-risk and Low-risk groups. The Kruskal-Wallis test was employed for variables with a non-normal distribution.
To assess the association between CT attenuation parameters, ECV, myocardial λ (defined as the ratio between the increase in myocardial density during the arterial phase compared to the baseline, and the respective increase of blood density), and High-risk condition, a univariate logistic regression analysis was carried out to seek significantly different parameters between High- and Low-risk groups at ANOVA or Kruskal-Wallis tests. To identify independent predictors of High-risk condition, a multivariate stepwise logistic regression analysis was performed by including parameters with statistically significant associations on univariate analysis.
To assess interobserver agreement, ECV measurements were repeated on a subset of 58 patients by two blinded investigators. The intraclass correlation coefficient (ICC) was calculated, and Bland-Altman plots were generated.
3. Results
The final population included 89 patients (72% females) with a mean age of 63±14 years. Based on the type of chemotherapy regimen, the population was divided into 2 groups: 1) patients undergoing chemotherapy with drugs associated with known cardiotoxicity risk (High-risk group); 2) patients undergoing chemotherapy with drugs for which no significant cardiotoxicity risk has been demonstrated (Low-risk group). Table 1 shows the main characteristics of the population, including cardiovascular risk factors. Overall, 51 patients underwent potentially cardiotoxic chemotherapy (High-Risk group). Of them, 41 had breast cancer, 9 had non-Hodgkin lymphoma, and 1 had Hodgkin lymphoma. The remaining 38 patients were treated with drugs with a demonstrated absent or lower cardiotoxic effect (Low-Risk group). Patients in this group were treated with carboplatin or oxaliplatin (lung, colon, rectal, gastric, ovarian and pancreatic) and/or taxane based agents ( anal, ovarian, lung, aesophageal and vulvar cancer) and/or gemcitabine based (pancreatic, ovarian, lung, urothelial cancer).
As shown in Table 2, the High-Risk group were more frequently females (88% vs 50%, p = 0.0001) and showed significantly younger mean age (51±13 vs. 67±12, p < 0.001), probably because tumour types predominantly represented in the High-risk group (breast cancer and lymphomas) have an incidence peak at a younger age compared to those included in the Low-Risk group. All patients underwent a whole-body CT examination with intravenous administration of iodinated contrast material before the start of chemotherapy (CT-I) and the first follow-up exam after the cycle (CT-II). Although the time interval between CT-I and CT-II examinations varied widely in the population (median 317 days, range 185-524 days), the temporal gap between CT-I and CT-II was not significantly different between the High-Risk and Low-Risk groups (p = 0.32).
3.1. ECV at CT-I and CT-II
As shown in Table 3, at CT-I myocardial ECV measured in the interventricular septum and in the LV lateral wall was not significantly between High-risk and Low-risk groups, despite age and gender differences between them. Similarly, ECV of both the septum and LV lateral wall was not significantly different between the groups at CT-II. Examples of ECV maps are shown in Figure 1, Figure 2 and Figure 3.
High-risk patients showed a significant increase of both septal ECV [going from 32% (31-35%) at CT-I to 37% (35-39%) at CT-II (p = 0.0002)] and of lateral wall ECV [from 30% (27-31) to 32% (29-34) (p = 0.028)]. In contrast, the ECV change was not significant in the Low-risk group [septal ECV: from 35% (32-38) to 35% (32-39) (p = 0.16); lateral wall ECV: from 32% (29-35) to 32% (30-34) (p = 0.93)] (Figure 4). Overall, ECV increased by at least 1 percentile in 35 out of 51 (69%) High-risk patients. Among them, 15 (43%) had a diffuse myocardial increase of ECV and 20 (67%) a focal increase of ECV within the interventricular septum and/or the lateral wall.
3.2. Arterial Phase Analysis
Arterial-phase myocardial λ measured at CT-II was lower compared to the CT-I in 31% of High-Risk patients, whereas it decreased in only 10% of Low-Risk patients (p = 0.036) (Table 3, and examples in Figure 5). A significant difference in the change of arterial phase myocardial λ measured in the interventricular septum between the two groups was observed, with ∆ arterial phase myocardial λ of septum being -1 (-8, - 3) in the High-risk group vs 2 (-1, - 8) in the Low-risk group (p = 0.022).
3.3. Predictors of Potential Cardiotoxicity Risk
Univariate logistic analysis was performed to identify parameters significantly associated with the High-Risk group (Table 4). This analysis included all parameters showing a significant difference between the two patient groups in Table 3. Only the following two parameters showed a significant association with High-Risk: ∆septal ECV (OR 6.4, 95% CI 1.6-25.4, p = 0.008) and ∆arterial phase myocardial λ of septum (OR 0.02, 95% CI 0.005-0.82, p = 0.039).
The aforementioned two variables were included in the multivariate logistic regression analysis, which revealed that ∆septal ECV was the only independent predictor of High-Risk group (OR 5.8, 95% CI 1.43-23.4, p = 0.013)..
3.4. Reproducibility Assessment
Inter-observer reproducibility analysis was conducted by repeating the analysis and measurement of myocardial ECV. Myocardial ECV was calculated in 58 cases by both observers. The intraclass correlation coefficient (ICC) was 0.94 (95% CI 0.91-0.97), as confirmed by the Bland-Altman plot illustrated in Figure 6, showed excellent inter-observer reproducibility achieved with the help of automatically generated ECV maps.
4. Discussion
The main findings of the study can be summarized as follows:
a) In cancer patients treated with potentially cardiotoxic drugs (High-Risk group), the ECV value of the left ventricular myocardium was significantly increased in CT-II compared to CT-I. In contrast, no significant myocardial ECV changes were observed in the Low-Risk group.
b) At CT-II, High-Risk patients more frequently exhibited a decrease in post-contrast myocardial enhancement during the arterial phase (measured as arterial phase myocardial λ) in the interventricular septum compared to CT-I.
c) Multivariate analysis identified the change in ECV between CT-I and CT-II (∆ECV) in the interventricular septum as the only independent predictor of High-Risk status.
ECV represents the percentage of myocardial volume occupied by interstitial space and vessels, with interstitial space typically constituting 20–25% of the myocardium. An increase in ECV can occur due to interstitial expansion caused by cardiomyocyte necrosis and replacement with collagen fibers, leading to fibrous tissue formation. Other conditions, such as interstitial edema or proteinaceous material accumulation, as in cardiac amyloidosis [23], myocarditis [24], or myocardial toxic damage from cardiotoxic chemotherapy or substance abuse [25,26], may also enlarge interstitial spaces.
One possible mechanism of chemotherapy-induced myocardial damage involves impaired perfusion of small myocardial vessels. Measuring myocardial λ during the arterial phase enables indexing of myocardial density changes relative to blood density during this phase. In our study, arterial phase myocardial λ of the septum and lateral wall decreased in the High-Risk group following chemotherapy. This finding supports the hypothesis that chemotherapeutic agents influence myocardial perfusion, even subclinically, and suggests that CT can detect these changes early. The observed reduction in arterial phase enhancement in High-Risk patients indicates that ECV increase may reflect interstitial expansion rather than transient hyperemia or vascular congestion, suggesting actual myocardial damage.
One of the possible mechanisms of chemotherapy-induced myocardial damage involves alterations in myocardial perfusion related to impairment of small vessels. The measurement of myocardial λ during the arterial phase allows indexing of the increase in myocardial density during this phase in relation to blood density. In our study, the arterial phase myocardial λ of the septum and lateral wall decreased in the High-Risk group after chemotherapy. This finding seems to confirm that chemotherapeutic agents can influence myocardial perfusion even subclinically and suggests that this phenomenon can be assessed early using CT. The observation of a reduction in arterial phase enhancement in High-Risk patients suggests that the increase in ECV may not reflect transient hyperemia or vascular congestion, but rather an increase in interstitial volume, more readily correlated with actual myocardial damage.
Our findings align with cardiac CT-based studies reporting increased myocardial ECV following chemotherapy, particularly in breast cancer patients receiving anthracycline-based regimens [27]. For instance, Zhou et al. demonstrated doxorubicin-induced interstitial myocardial fibrosis in beagle models, as measured by ECV on CMR [28]. Cardiac CT-derived ECV correlates strongly with CMR, histology, and serum fibrosis indices, highlighting CT’s potential for myocardial tissue characterization [19]. To our knowledge, this is the first study comparing myocardial ECV derived from ungated whole-body CT scans in cancer patients undergoing chemotherapy regimens with high versus low cardiotoxicity risks.
Our proposed approach does not require ECG gating or advanced cardiac imaging expertise from the technologist or radiologist. CT imaging offers significant advantages, including faster scan times, fewer risks (e.g., claustrophobia), and broader availability compared to CMR. In this study, all CT scans were conducted using 64-row equipment, which is widely available in radiology departments.
For ECV assessment using CMR (the current gold standard), pre- and post-contrast T1 mapping is required to create ECV maps, followed by careful co-registration of these maps. This process is susceptible to errors caused by artifacts (e.g., ECG triggering, respiratory motion, extrasystoles, magnetic susceptibility) and differences in signal/time curve algorithms or image registration. CMR also demands specific expertise in cardiac imaging to mitigate these challenges. In contrast, CT simplifies ECV calculation by relying on straightforward pre- and post-contrast myocardial attenuation values.
Despite these advantages, CT has limitations, such as exposure to ionizing radiation, which may reduce its suitability for exclusive cardiotoxicity assessment. Additionally, CT images acquired without ECG gating may capture the heart in different cardiac cycle phases, potentially affecting ECV estimation. For example, interstitial spaces and vessels may appear collapsed during end-systole, leading to lower ECV measurements compared to end-diastole. Motion artifacts due to cardiac movement, particularly in patients with elevated heart rates, can also occur with 64-row CT scanners. Such issues can be mitigated with advanced CT equipment, such as 256-detector-row or dual-source CT scanners with higher temporal resolution.
Envisioning potential future implementations of artificial intelligence (AI), machine learning and deep learning could facilitate the automatic recognition of myocardial walls and the generation of ECV color maps. Automated ECV map generation could simplify myocardial damage detection, even for radiologists with limited expertise in cardiac imaging. Given the high prevalence of cardiovascular diseases in industrialized countries, such AI applications could significantly impact clinical practice.
5. Limitations
Limitations of our study include its retrospective nature, variable timing of CT scans, and diverse chemotherapy protocols. Additionally, the population size was relatively small and heterogeneous. This study did not include long-term cardiovascular prognosis assessment or information on potential cardiovascular manifestations of cardiotoxicity. Future studies are needed to explore the predictive role of ECV increase in actual cardiotoxicity and to investigate the implementation of artificial intelligence (particularly deep learning), for automated myocardial wall recognition and ECV map generation.
Another limitation of the present study is that ECV was calculated using CT images without ECG gating. In the absence of ECG gating, the images are acquired in random phases of the cardiac cycle and carry a higher risk of motion artifacts. However, the ability to calculate ECV even without ECG gating is one strength of our study, as it allows for the screening of potential left ventricular myocardial lesions even on body CT scans without ECG gating.
Finally, we proposed a simplified method to estimate ECV from non-gated CT but future study are necessary to validate this novel approach with CMR that remains the gold-standard for ECV measurement.
Despite the limitations, CT emerges as an appealing alternative to CMR, offering advantages such as broader availability, quicker scan times, and potentially lower risk. Nonetheless, CT’s ionising radiation warrants careful consideration, and further research is needed to establish its role in myocardial assessment. The study emphasises the significance of accurate hematocrit measurement for ECV calculation and highlights the potential for synthetic hematocrit approaches.
6. Conclusions
Quantifying myocardial ECV from contrast-enhanced, ungated whole-body CT scans performed for cancer staging before and after chemotherapy is feasible and reproducible. This approach may help identify early myocardial abnormalities in patients undergoing potentially cardiotoxic treatments. Prospective studies are needed to validate its diagnostic and prognostic roles in clinical practice.
Author Contributions
All authors contributed to the study conception and design. Material preparation, data collection and analysis were performed by Giovanni Donato Aquaro, Simone Guidi, Roberto Francischello. The first draft of the manuscript was written by Giovanni Donato Aquaro and Lorenzo Faggioni and all authors commented on previous versions of the manuscript. All authors read and approved the final manuscript.
Funding
The authors declare that no funds, grants, or other support were received during the preparation of this manuscript
Ethical Approval and Consent
This retrospective research was performed on fully anonymized data. All data were collected as part of routine diagnosis and treatment according to national guidelines and in agreement with the Declaration of Helsinki. Informed consent was taken from all patients.
Competing Interests
The authors have no relevant financial or non-financial interests to disclose
References
- Global Burden of Disease Cancer Collaboration; Fitzmaurice C, Dicker D, Pain A, Hamavid H, Moradi-Lakeh M, MacIntyre MF, Allen C, Hansen G, Woodbrook R, Wolfe C, Hamadeh RR, Moore A, Werdecker A, Gessner BD, Te Ao B, McMahon B, Karimkhani C, Yu C, Cooke GS, Schwebel DC, Carpenter DO, Pereira DM, Nash D, Kazi DS, De Leo D, Plass D, Ukwaja KN, Thurston GD, Yun Jin K, Simard EP, Mills E, Park EK, Catalá-López F, deVeber G, Gotay C, Khan G, Hosgood HD 3rd, Santos IS, Leasher JL, Singh J, Leigh J, Jonas JB, Sanabria J, Beardsley J, Jacobsen KH, Takahashi K, Franklin RC, Ronfani L, Montico M, Naldi L, Tonelli M, Geleijnse J, Petzold M, Shrime MG, Younis M, Yonemoto N, Breitborde N, Yip P, Pourmalek F, Lotufo PA, Esteghamati A, Hankey GJ, Ali R, Lunevicius R, Malekzadeh R, Dellavalle R, Weintraub R, Lucas R, Hay R, Rojas-Rueda D, Westerman R, Sepanlou SG, Nolte S, Patten S, Weichenthal S, Abera SF, Fereshtehnejad SM, Shiue I, Driscoll T, Vasankari T, Alsharif U, Rahimi-Movaghar V, Vlassov V2 V,Marcenes WS, Mekonnen W, Melaku YA, Yano Y, Artaman A, Campos I, MacLachlan J, Mueller U, Kim D, Trillini M, Eshrati B, Williams HC, Shibuya K, Dandona R, Murthy K, Cowie B, Amare AT, Antonio CA, Castañeda-Orjuela C, van Gool CH, Violante F, Oh IH, Deribe K, Soreide K, Knibbs L, Kereselidze M, Green M, Cardenas R, Roy N, Tillmann T, Li Y, Krueger H, Monasta L, Dey S, Sheikhbahaei S, Hafezi-Nejad N, Kumar GA, Sreeramareddy CT, Dandona L, Wang H, Vollset SE, Mokdad A, Salomon JA, Lozano R, Vos T, Forouzanfar M, Lopez A, Murray C, Naghavi M. The Global Burden of Cancer 2013. JAMA Oncol. 2015 Jul;1(4):505-27. [CrossRef]
- Herrmann J. Adverse cardiac effects of cancer therapies: cardiotoxicity and arrhythmia. Nat Rev Cardiol. 2020 Aug;17(8):474-502. [CrossRef]
- Lyon AR, López-Fernández T, Couch LS, Asteggiano R, Aznar MC, Bergler-Klein J, Boriani G, Cardinale D, Cordoba R, Cosyns B, Cutter DJ, de Azambuja E, de Boer RA, Dent SF, Farmakis D, Gevaert SA, Gorog DA, Herrmann J, Lenihan D, Moslehi J, Moura B, Salinger SS, Stephens R, Suter TM, Szmit S, Tamargo J, Thavendiranathan P, Tocchetti CG, van der Meer P, van der Pal HJH; ESC Scientific Document Group. 2022 ESC Guidelines on cardio-oncology developed in collaboration with the European Hematology Association (EHA), the European Society for Therapeutic Radiology and Oncology (ESTRO) and the International Cardio-Oncology Society (IC-OS). Eur Heart J Cardiovasc Imaging. 2022;23(10):e333-e465. [CrossRef]
- Lang RM, Badano LP, Mor-Avi V, Afilalo J, Armstrong A, Ernande L, Flachskampf FA, Foster E, Goldstein SA, Kuznetsova T, Lancellotti P, Muraru D, Picard MH, Rietzschel ER, Rudski L, Spencer KT, Tsang W, Voigt JU. Recommendations for cardiac chamber quantification by echocardiography in adults: an update from the American Society of Echocardiography and the European Association of Cardiovascular Imaging. Eur Heart J Cardiovasc Imaging. 2015 Mar;16(3):233-70. [CrossRef]
- Cardinale D, Sandri MT, Martinoni A, Borghini E, Civelli M, Lamantia G, Cinieri S, Martinelli G, Fiorentini C, Cipolla CM. Myocardial injury revealed by plasma troponin I in breast cancer treated with high-dose chemotherapy. Ann Oncol. 2002;13:710–715. Crossref. PubMed. [CrossRef]
- Cardinale D, Colombo A, Torrisi R, Sandri MT, Civelli M, Salvatici M, Lamantia G, Colombo N, Cortinovis S, Dessanai MA, Nolè F, Veglia F, Cipolla CM. Trastuzumab-induced cardiotoxicity: clinical and prognostic implications of troponin I evaluation. J Clin Oncol. 2010;28:3910–3916. [CrossRef]
- Sawaya H, Sebag IA, Plana JC, Januzzi JL, Ky B, Tan TC, Cohen V, Banchs J, Carver JR, Wiegers SE, Martin RP, Picard MH, Gerszten RE, Halpern EF, Passeri J, Kuter I, Scherrer-Crosbie M. Assessment of echocardiography and biomarkers for the extended prediction of cardiotoxicity in patients treated with anthracyclines, taxanes, and trastuzumab. Circ Cardiovasc Imaging. 2012 Sep 1;5(5):596-603. [CrossRef]
- Thavendiranathan P, Wintersperger BJ, Flamm SD, Marwick TH. Cardiac MRI in the assessment of cardiac injury and toxicity from cancer chemotherapy: a systematic review. Circ Cardiovasc Imaging. 2013 Nov;6(6):1080-91. [CrossRef]
- Neilan TG, Coelho-Filho OR, Shah RV et al. (2013) Myocardial extracellular volume by cardiac magnetic resonance imaging in patients treated with anthracycline-based chemotherapy. Am J Cardiol 111:717–722. [CrossRef]
- Tham EB, Haykowsky MJ, Chow K et al. (2013) Difuse myocardial fbrosis by T1-mapping in children with subclinical anthracycline cardiotoxicity: relationship to exercise capacity, cumulative dose and remodeling. J Cardiovasc Magn Reson 15:48. [CrossRef]
- Haaf P, Garg P, Messroghli DR, Broadbent DA, Greenwood JP, Plein S (2016) Cardiac T1 mapping and extracellular volume (ECV) in clinical practice: acomprehensive review. J Cardiovasc Magn Reson 18:89. [CrossRef]
- Galán-Arriola, C.; Lobo, M.; Vílchez-Tschischke, J.P.; López, G.J.; de Molina-Iracheta, A.; Pérez-Martínez, C.; Agüero, J.; FernándezJiménez, R.; Martín-García, A.; Oliver, E.; et al. Serial magnetic resonance imaging to identify early stages of anthracycline-induced cardiotoxicity. J. Am. Coll. Cardiol. 2019, 73, 779–791. [CrossRef]
- Farhad, H.; Staziaki, P.V.; Addison, D.; Coelho-Filho, O.R.; Shah, R.V.; Mitchell, R.N.; Szilveszter, B.; Abbasi, S.A.; Kwong, R.Y.; Scherrer-Crosbie, M.; et al. Characterization of the changes in cardiac structure and function in mice treated with anthracyclines using serial cardiac magnetic resonance imaging. Circ. Cardiovasc. Imaging 2016, 9, e003584. [CrossRef]
- Neilan, T.G.; Coelho-Filho, O.R.; Shah, R.V.; Feng, J.H.; Pena-Herrera, D.; Mandry, D.; Pierre-Mongeon, F.; Heydari, B.; Francis, S.A.; Moslehi, J.; et al. Myocardial extracellular volume by cardiac magnetic resonance imaging in patients treated with anthracycline-based chemotherapy. Am. J. Cardiol. 2013, 111, 717–722. [CrossRef]. [CrossRef]
- Jordan, J.H.; Vasu, S.; Morgan, T.M.; D’Agostino, R.B., Jr.; Meléndez, G.C.; Hamilton, C.A.; Arai, A.E.; Liu, S.; Liu, C.Y.; Lima, J.A.; et al. Anthracycline-associated t1 mapping characteristics are elevated independent of the presence of cardiovascular comorbidities in cancer survivors. Circ. Cardiovasc. Imaging 2016, 9, e004325. [CrossRef]
- Meléndez, G.C.; Jordan, J.H.; D’Agostino, R.B., Jr.; Vasu, S.; Hamilton, C.A.; Hundley, W.G. Progressive 3-month increase in lv myocardial ecv after anthracycline-based chemotherapy. JACC Cardiovasc. Imaging 2017, 10, 708–709. [CrossRef]
- Nacif MS, Kawel N, Lee JJ et al. (2012) Interstitial myocardial fbrosis assessed as extracellular volume fraction with low-radiation-dose cardiac CT. Radiology 264:876–883. [CrossRef]
- Bandula S, White SK, Flett AS et al. (2013) Measurement of myocardial extracellular volume fraction by using equilibrium contrast-enhanced CT: validation against histologic findings. Radiology 269:396–403. [CrossRef]
- Cundari G, Galea N, Mergen V, Alkadhi H, Eberhard M. Myocardial extracellular volume quantification with computed tomography-current status and future outlook. Insights Imaging. 2023;14:156. [CrossRef]
- Scully PR, Bastarrika G, Moon JC, Treibel TA. Myocardial Extracellular Volume Quantification by Cardiovascular Magnetic Resonance and Computed Tomography. Curr Cardiol Rep. 2018;20:15. [CrossRef]
- Dubourg B, Dacher JN, Durand E, Caudron J, Bauer F, Bubenheim M, Eltchaninoff H, Serfaty JM. Single-source dual energy CT to assess myocardial extracellular volume fraction in aortic stenosis before transcatheter aortic valve implantation (TAVI). Diagn Interv Imaging. 2021;102:561-570. [CrossRef]
- Treibel TA, Fontana M, Steeden JA, Nasis A, Yeung J, White SK, Sivarajan S, Punwani S, Pugliese F, Taylor SA, Moon JC, Bandula S. Automatic quantification of the myocardial extracellular volume by cardiac computed tomography: Synthetic ECV by CCT. J Cardiovasc Comput Tomogr. 2017;11:221-226. [CrossRef]
- Gama F, Rosmini S, Bandula S, Patel KP, Massa P, Tobon-Gomez C, Ecke K, Stroud T, Condron M, Thornton GD, Bennett JB, Wechelakar A, Gillmore JD, Whelan C, Lachmann H, Taylor SA, Pugliese F, Fontana M, Moon JC, Hawkins PN, Treibel TA. Extracellular Volume Fraction by Computed Tomography Predicts Long-Term Prognosis Among Patients With Cardiac Amyloidosis. JACC Cardiovasc Imaging. 2022:2082-2094. [CrossRef]
- Brendel JM, Klingel K, Kübler J, Müller KAL, Hagen F, Gawaz M, Nikolaou K, Greulich S, Krumm P. Comprehensive Cardiac Magnetic Resonance to Detect Subacute Myocarditis. J Clin Med. 2022;11:5113. [CrossRef]
- Aquaro GD, Del Franco A, Meini M, Gabutti A, Barison A, Chiappino D, Passino C, Emdin M. Cocaine assumption and transient myocardial edema in asymptomatic cocaine heavy-users. Int J Cardiol. 2014;173:614-615. [CrossRef]
- Yu C, Pathan S, Jeyaprakash P, Kritharides L, Pathan F, Negishi K. Cardiac magnetic relaxometry versus ejection fraction in anthracycline-related cardiac changes: a systematic review and meta-analysis. Open Heart. 2023;10:e002344. [CrossRef]
- Egashira K, Sueta D, Kidoh M, Tomiguchi M, Oda S, Usuku H, Hidaka K, Goto-Yamaguchi L, Sueta A, Komorita T, Oike F, Fujisue K, Yamamoto E, Hanatani S, Takashio S, Araki S, Matsushita K, Yamamoto Y, Hirai T, Tsujita K. Cardiac computed tomography-derived myocardial tissue characterization after anthracycline treatment. ESC Heart Fail. 2022;9:1792-1800. [CrossRef]
- Zhou Z, Xu L, Wang R, Varga-Szemes A, Durden JA, Joseph Schoepf U, Sun Z, Fan Z. Quantification of doxorubicin-induced interstitial myocardial fibrosis in a beagle model using equilibrium contrast-enhanced computed tomography: A comparative study with cardiac magnetic resonance T1-mapping. Int J Cardiol. 2019;281:150-155. [CrossRef]
- Roy C, Slimani A, de Meester C, Amzulescu M, Pasquet A, Vancraeynest D, Vanoverschelde JL, Pouleur AC, Gerber BL. Age and sex corrected normal reference values of T1, T2 T2* and ECV in healthy subjects at 3T CMR. J Cardiovasc Magn Reson. 2017;19:72. [CrossRef]
Figure 1.
Image analysis in a breast cancer patient treated with doxorubicin. Images of CT-I are shown in upper panels, whereas images of CT-II are shown in lower panels. Left-hand panels include the pre-contrast image, middle panels the late postcontrast image, and the right-hand panels the relative ECV map, respectively. As evident by the comparison of maps, a diffuse increase of ECV was found by the analysis of CT-II.
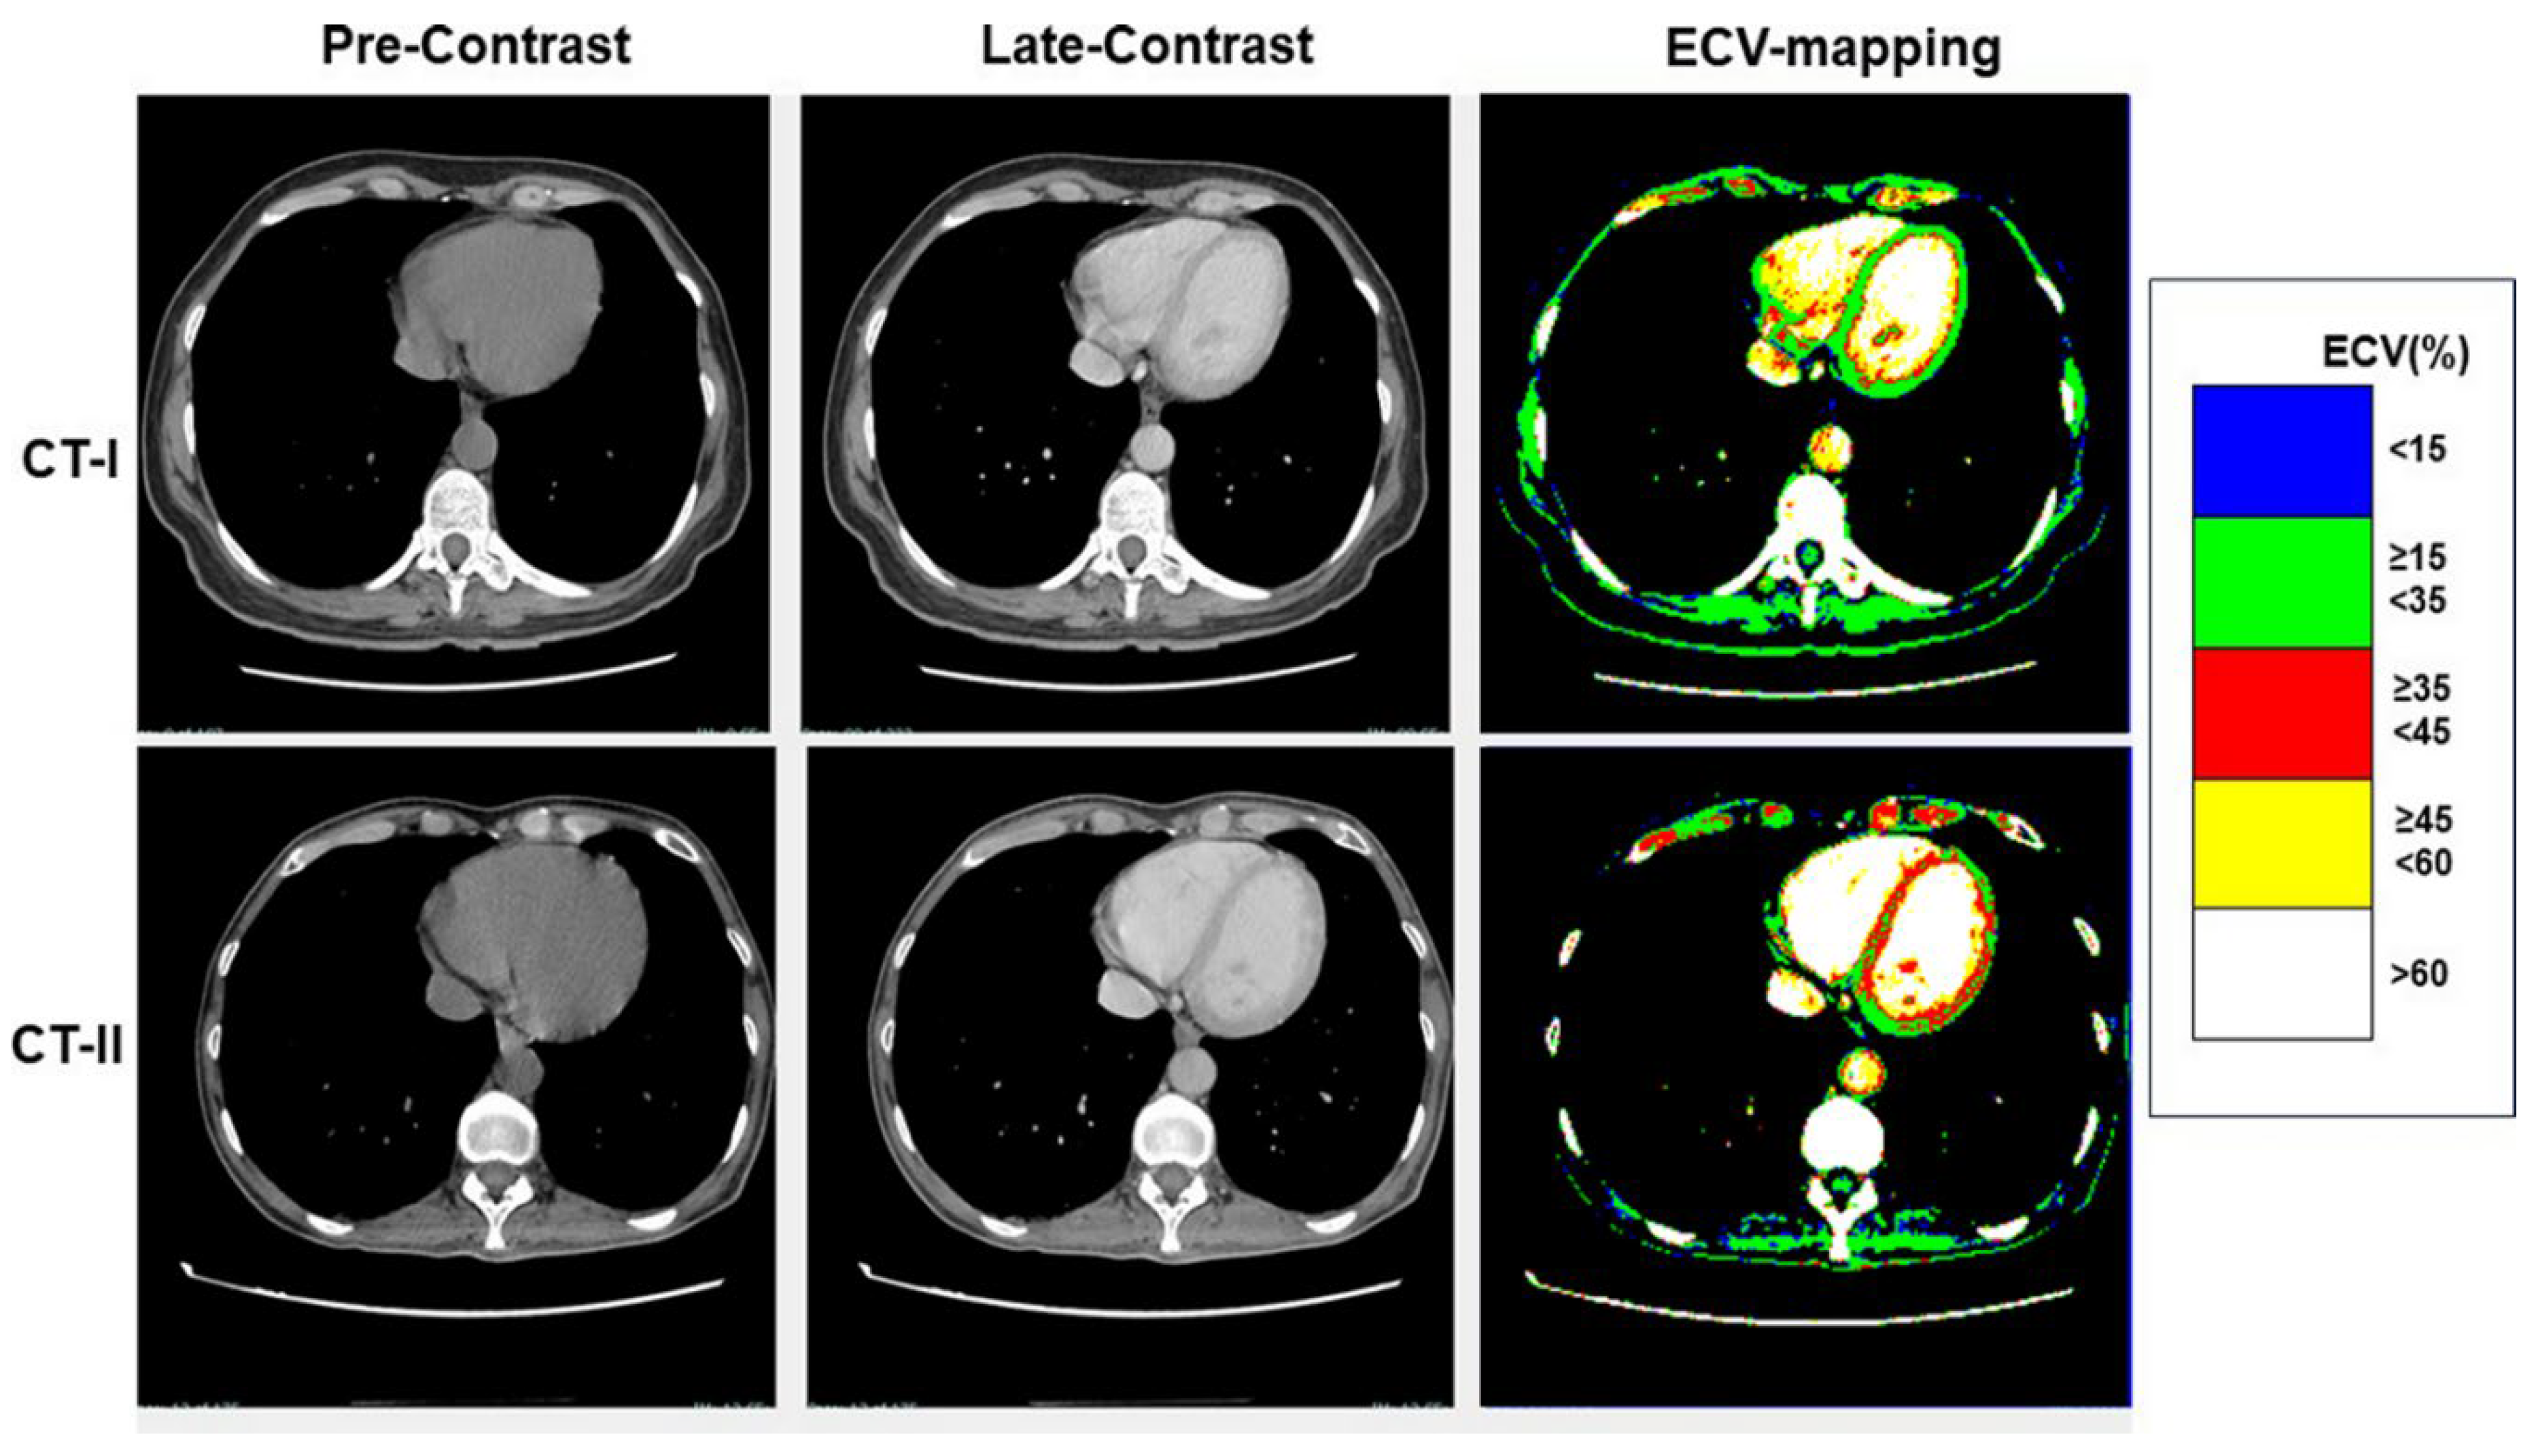
Figure 2.
ECV mapping in a patient undergoing a Low-risk chemotherapy protocol. ECV maps of CT-I (right upper panel) and CT-II (right lower panel) are comparable.
Figure 2.
ECV mapping in a patient undergoing a Low-risk chemotherapy protocol. ECV maps of CT-I (right upper panel) and CT-II (right lower panel) are comparable.
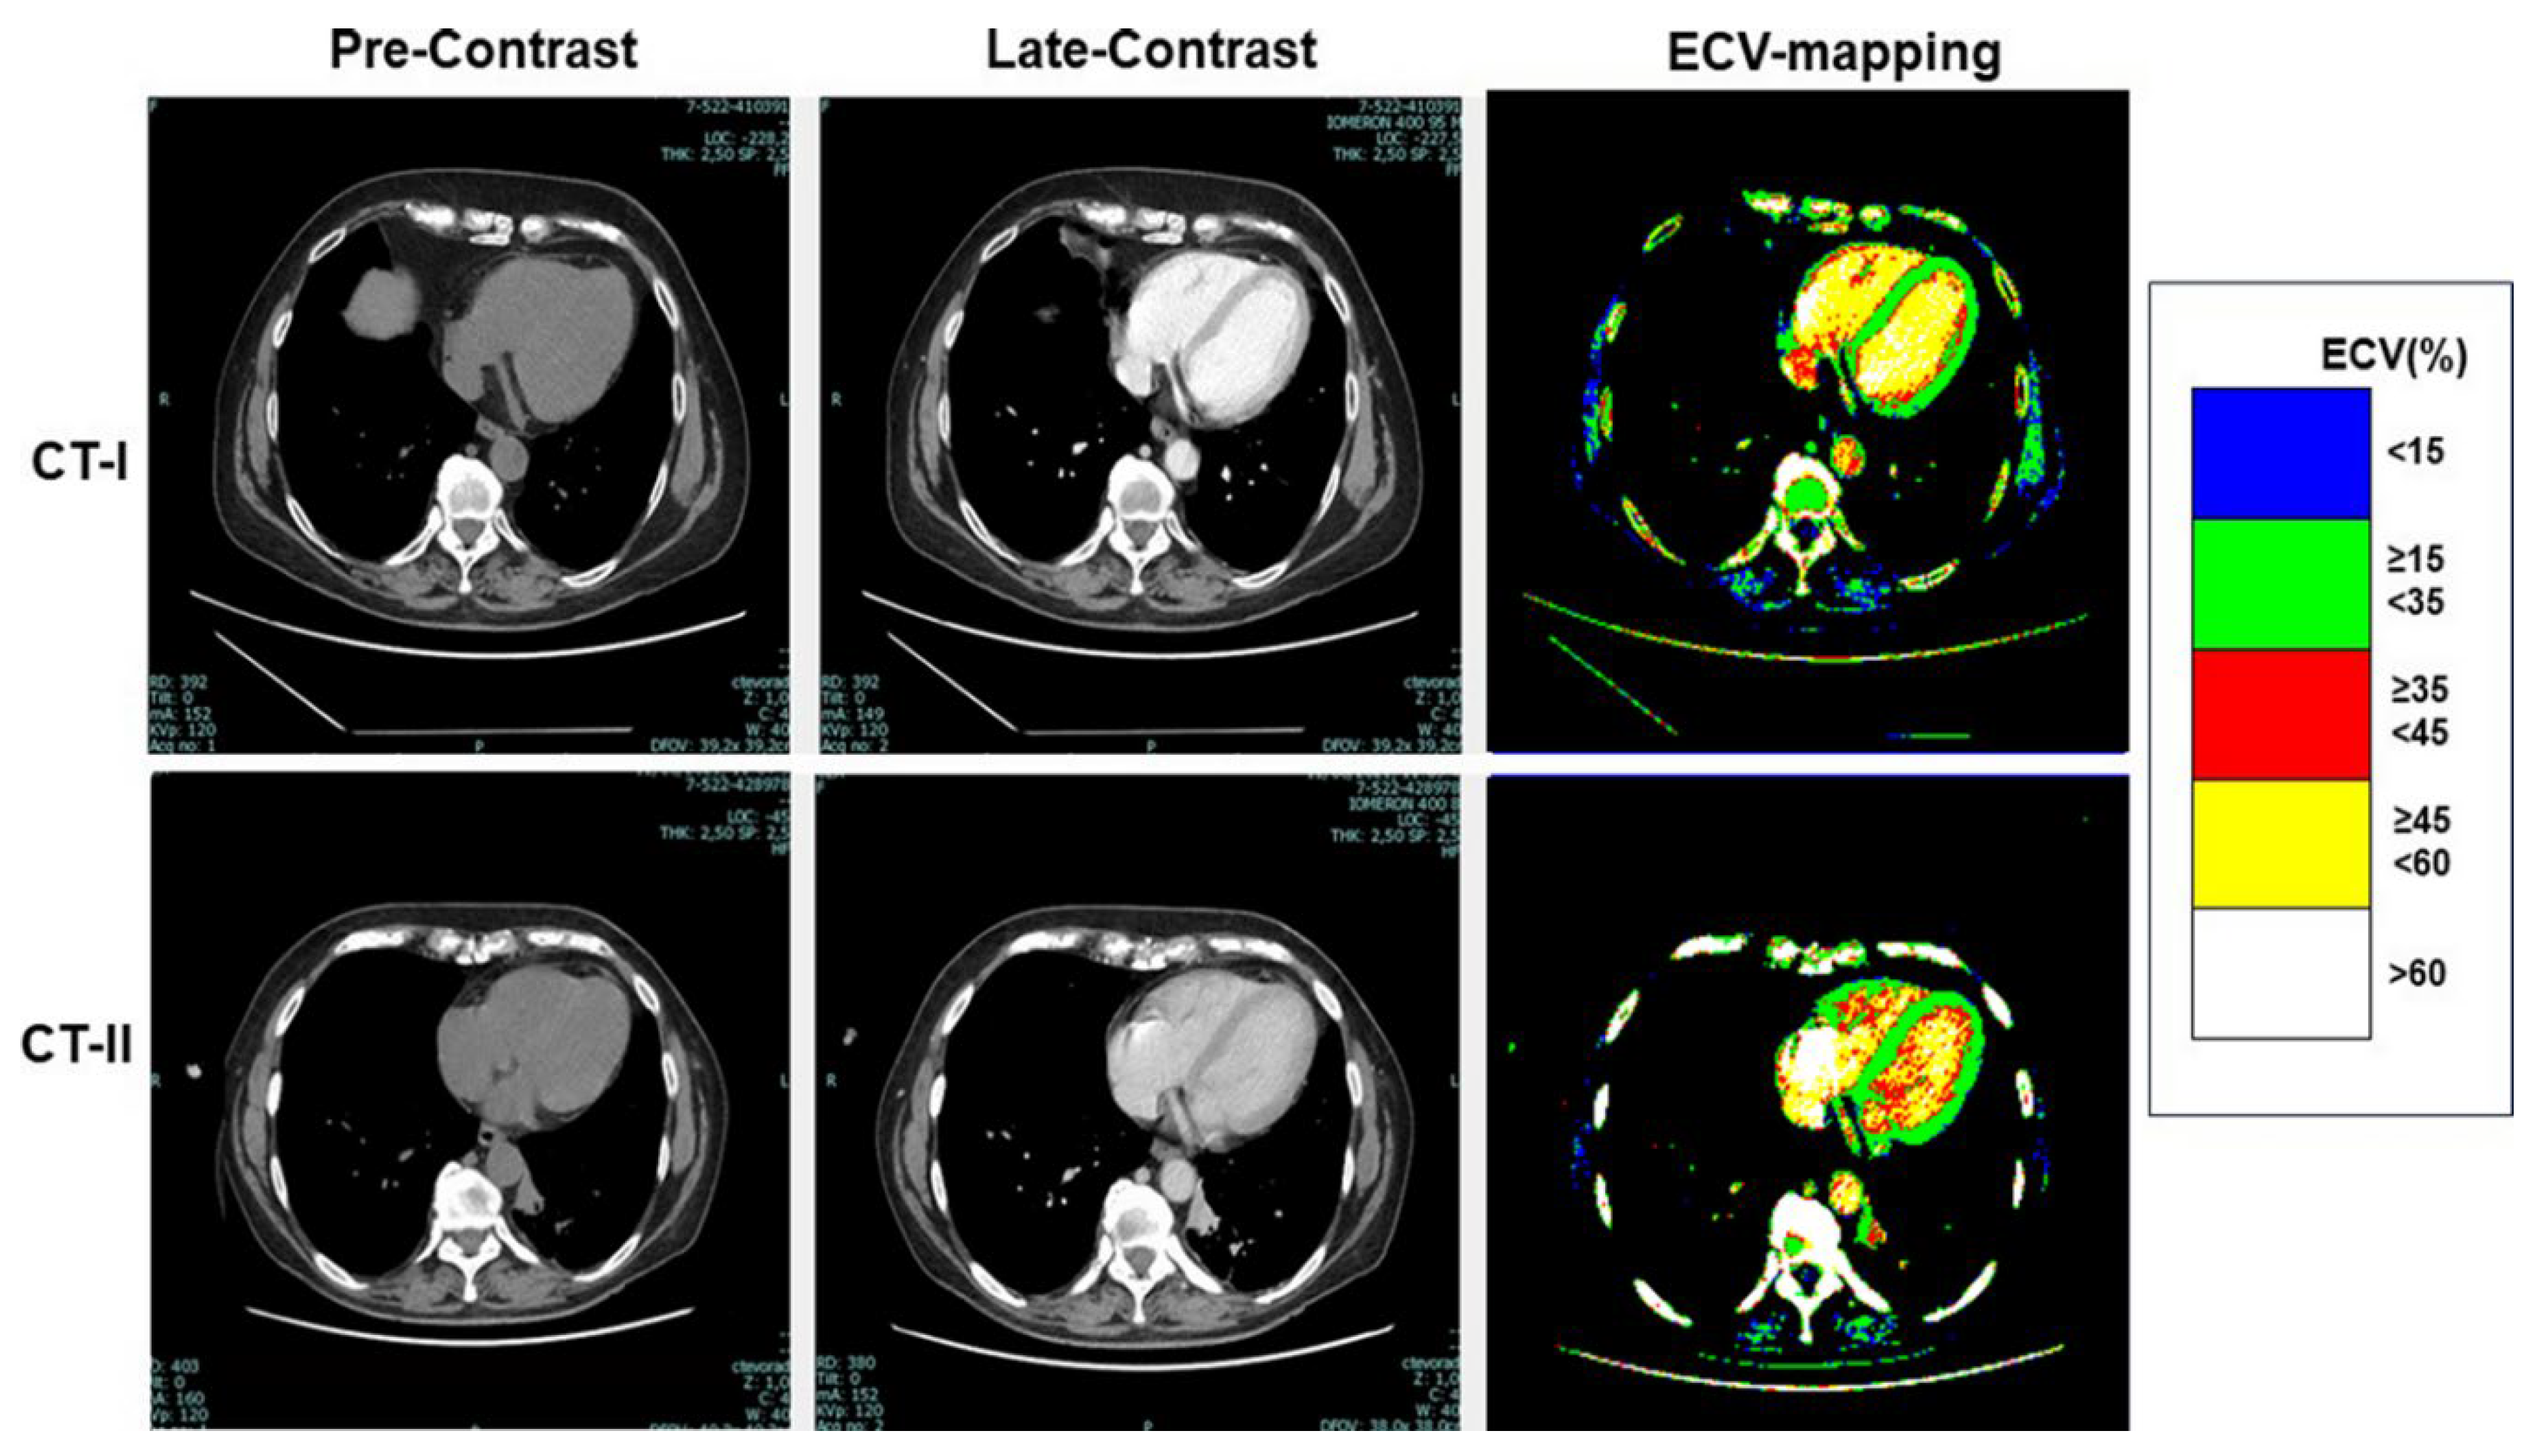
Figure 3.
ECV mapping in a patient undergoing a High-risk chemotherapy protocol. A diffuse increase of ECV can be seen at CT-II (right upper panel) compared to CT-I (right lower panel).
Figure 3.
ECV mapping in a patient undergoing a High-risk chemotherapy protocol. A diffuse increase of ECV can be seen at CT-II (right upper panel) compared to CT-I (right lower panel).
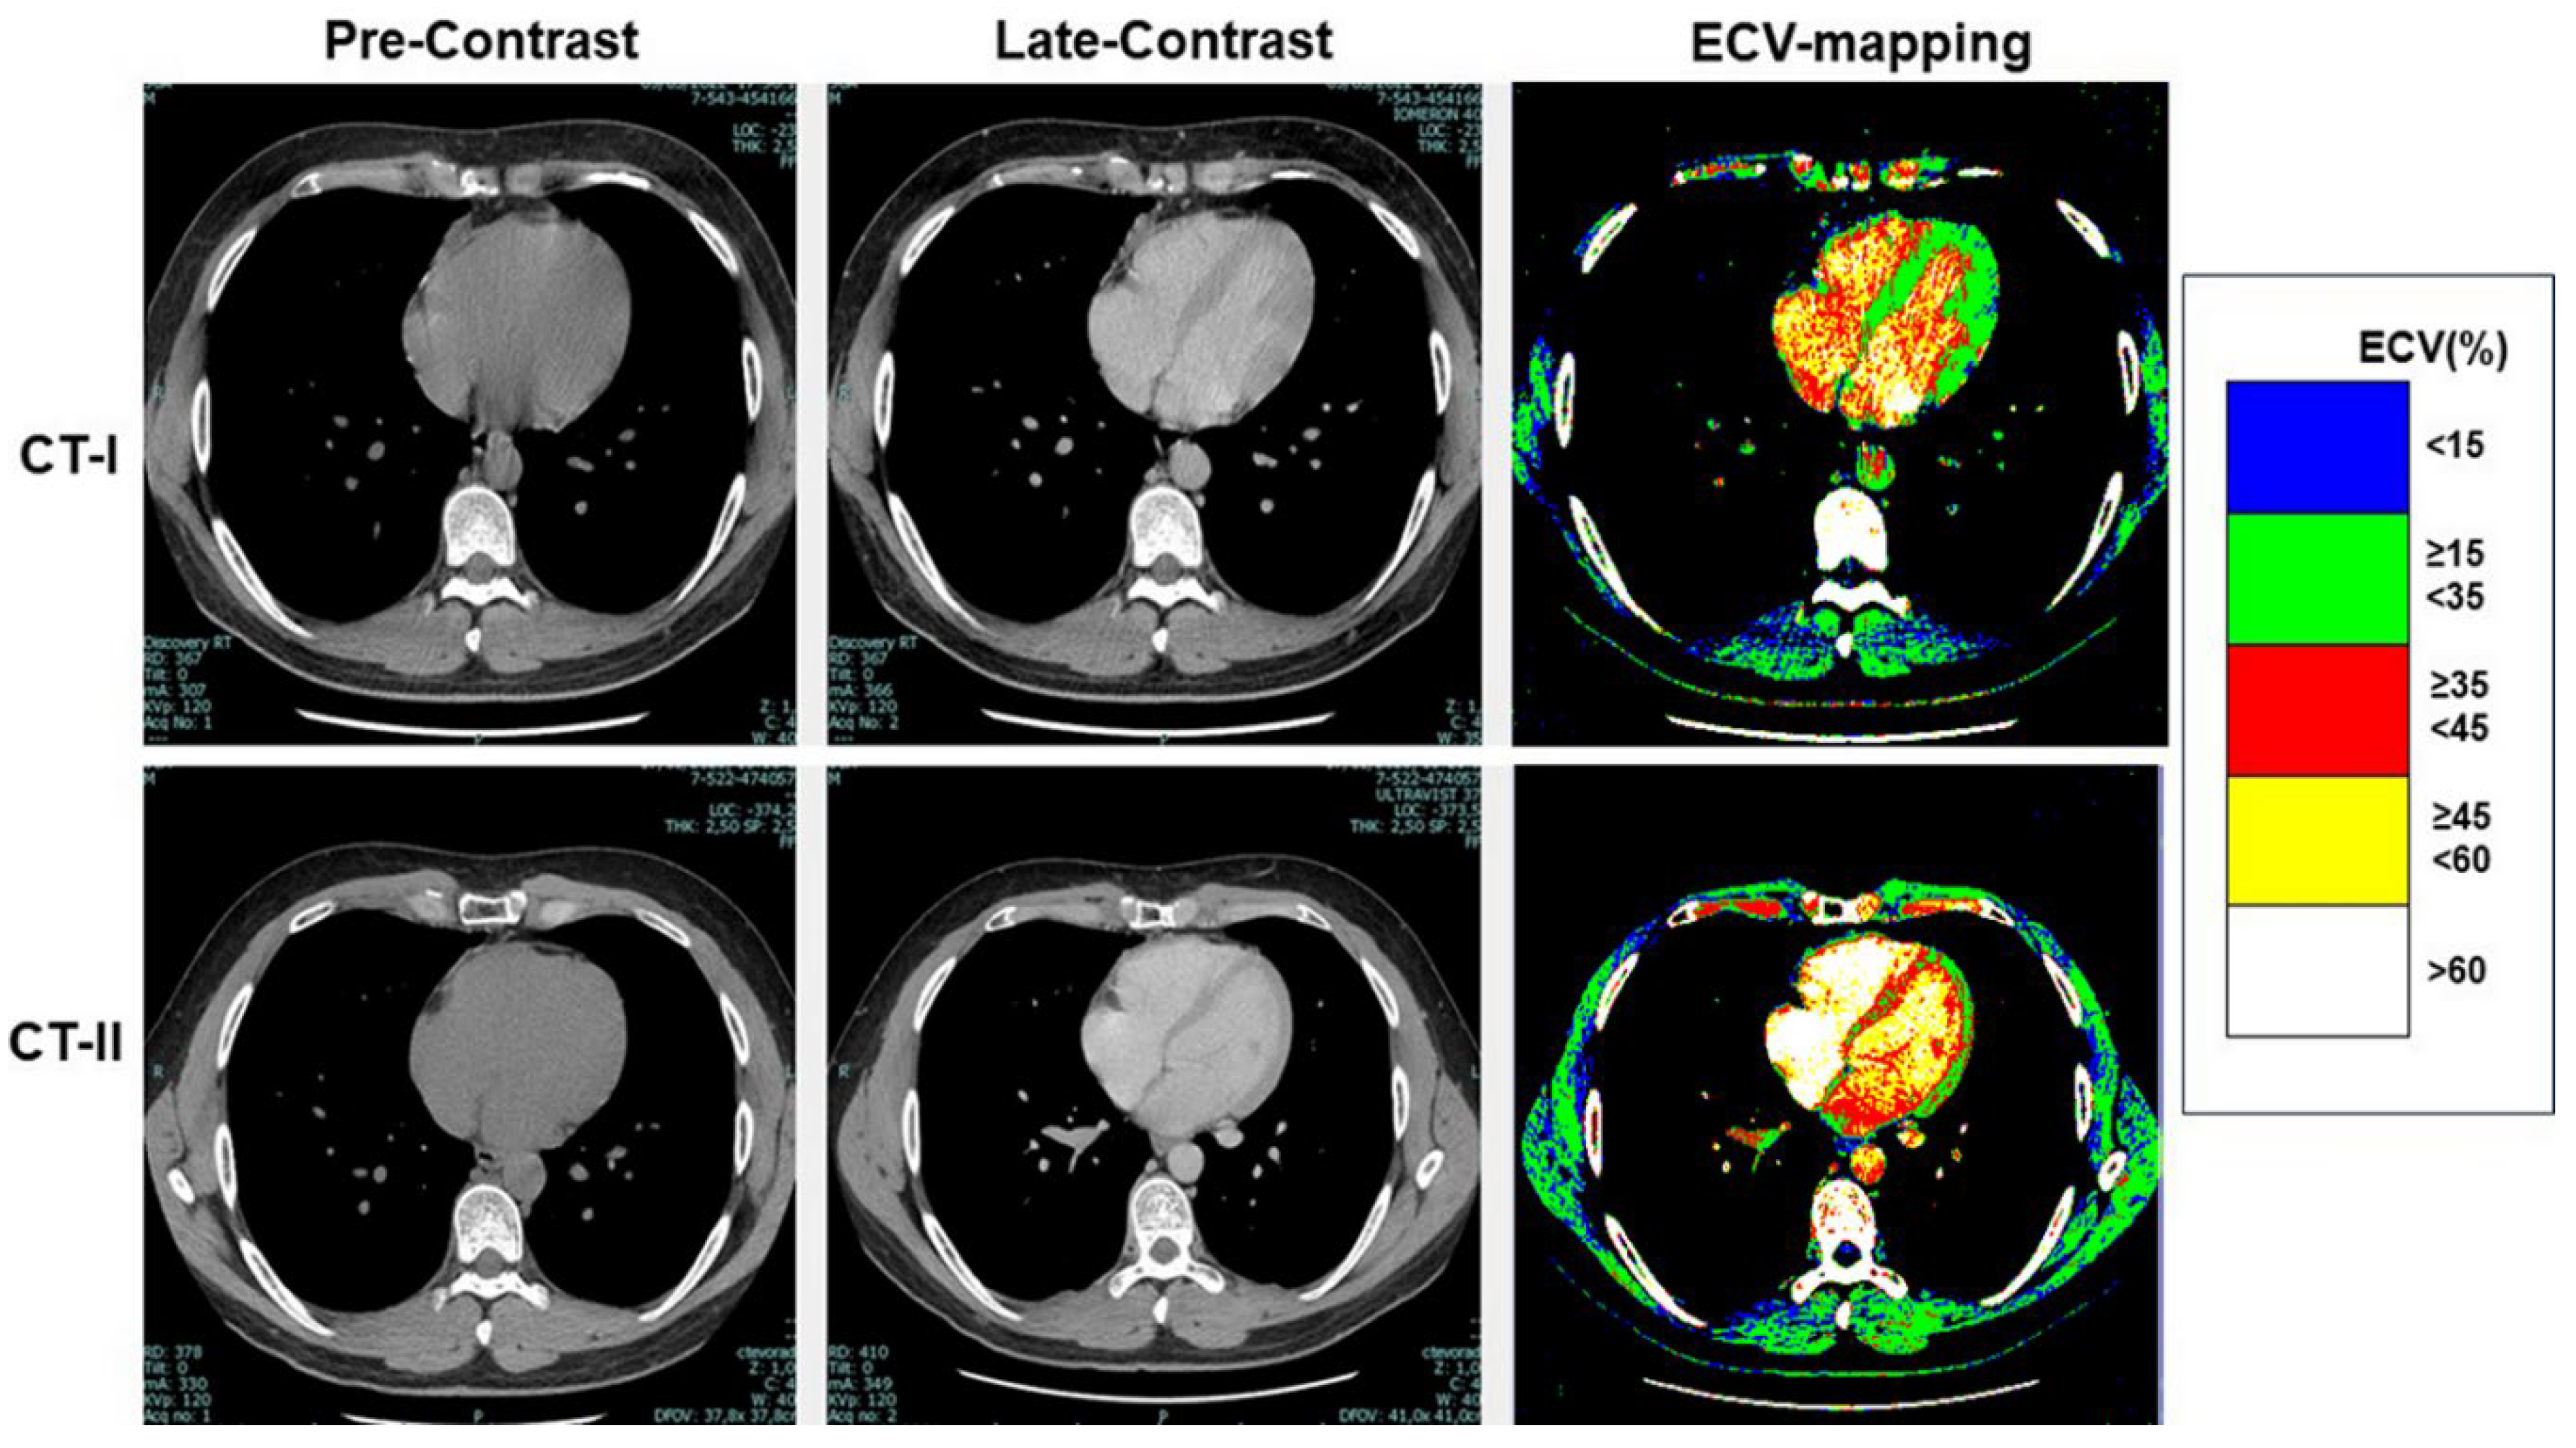
Figure 4.
Variation of ECV of septal wall and LV lateral wall from CT-I to CT-II in High-Risk (upper panels) and Low-Risk (lower panels) patients. ECV of both interventricular septum and lateral wall increased significantly in High-risk patients and remained unchanged in Low-Risk patients.
Figure 4.
Variation of ECV of septal wall and LV lateral wall from CT-I to CT-II in High-Risk (upper panels) and Low-Risk (lower panels) patients. ECV of both interventricular septum and lateral wall increased significantly in High-risk patients and remained unchanged in Low-Risk patients.
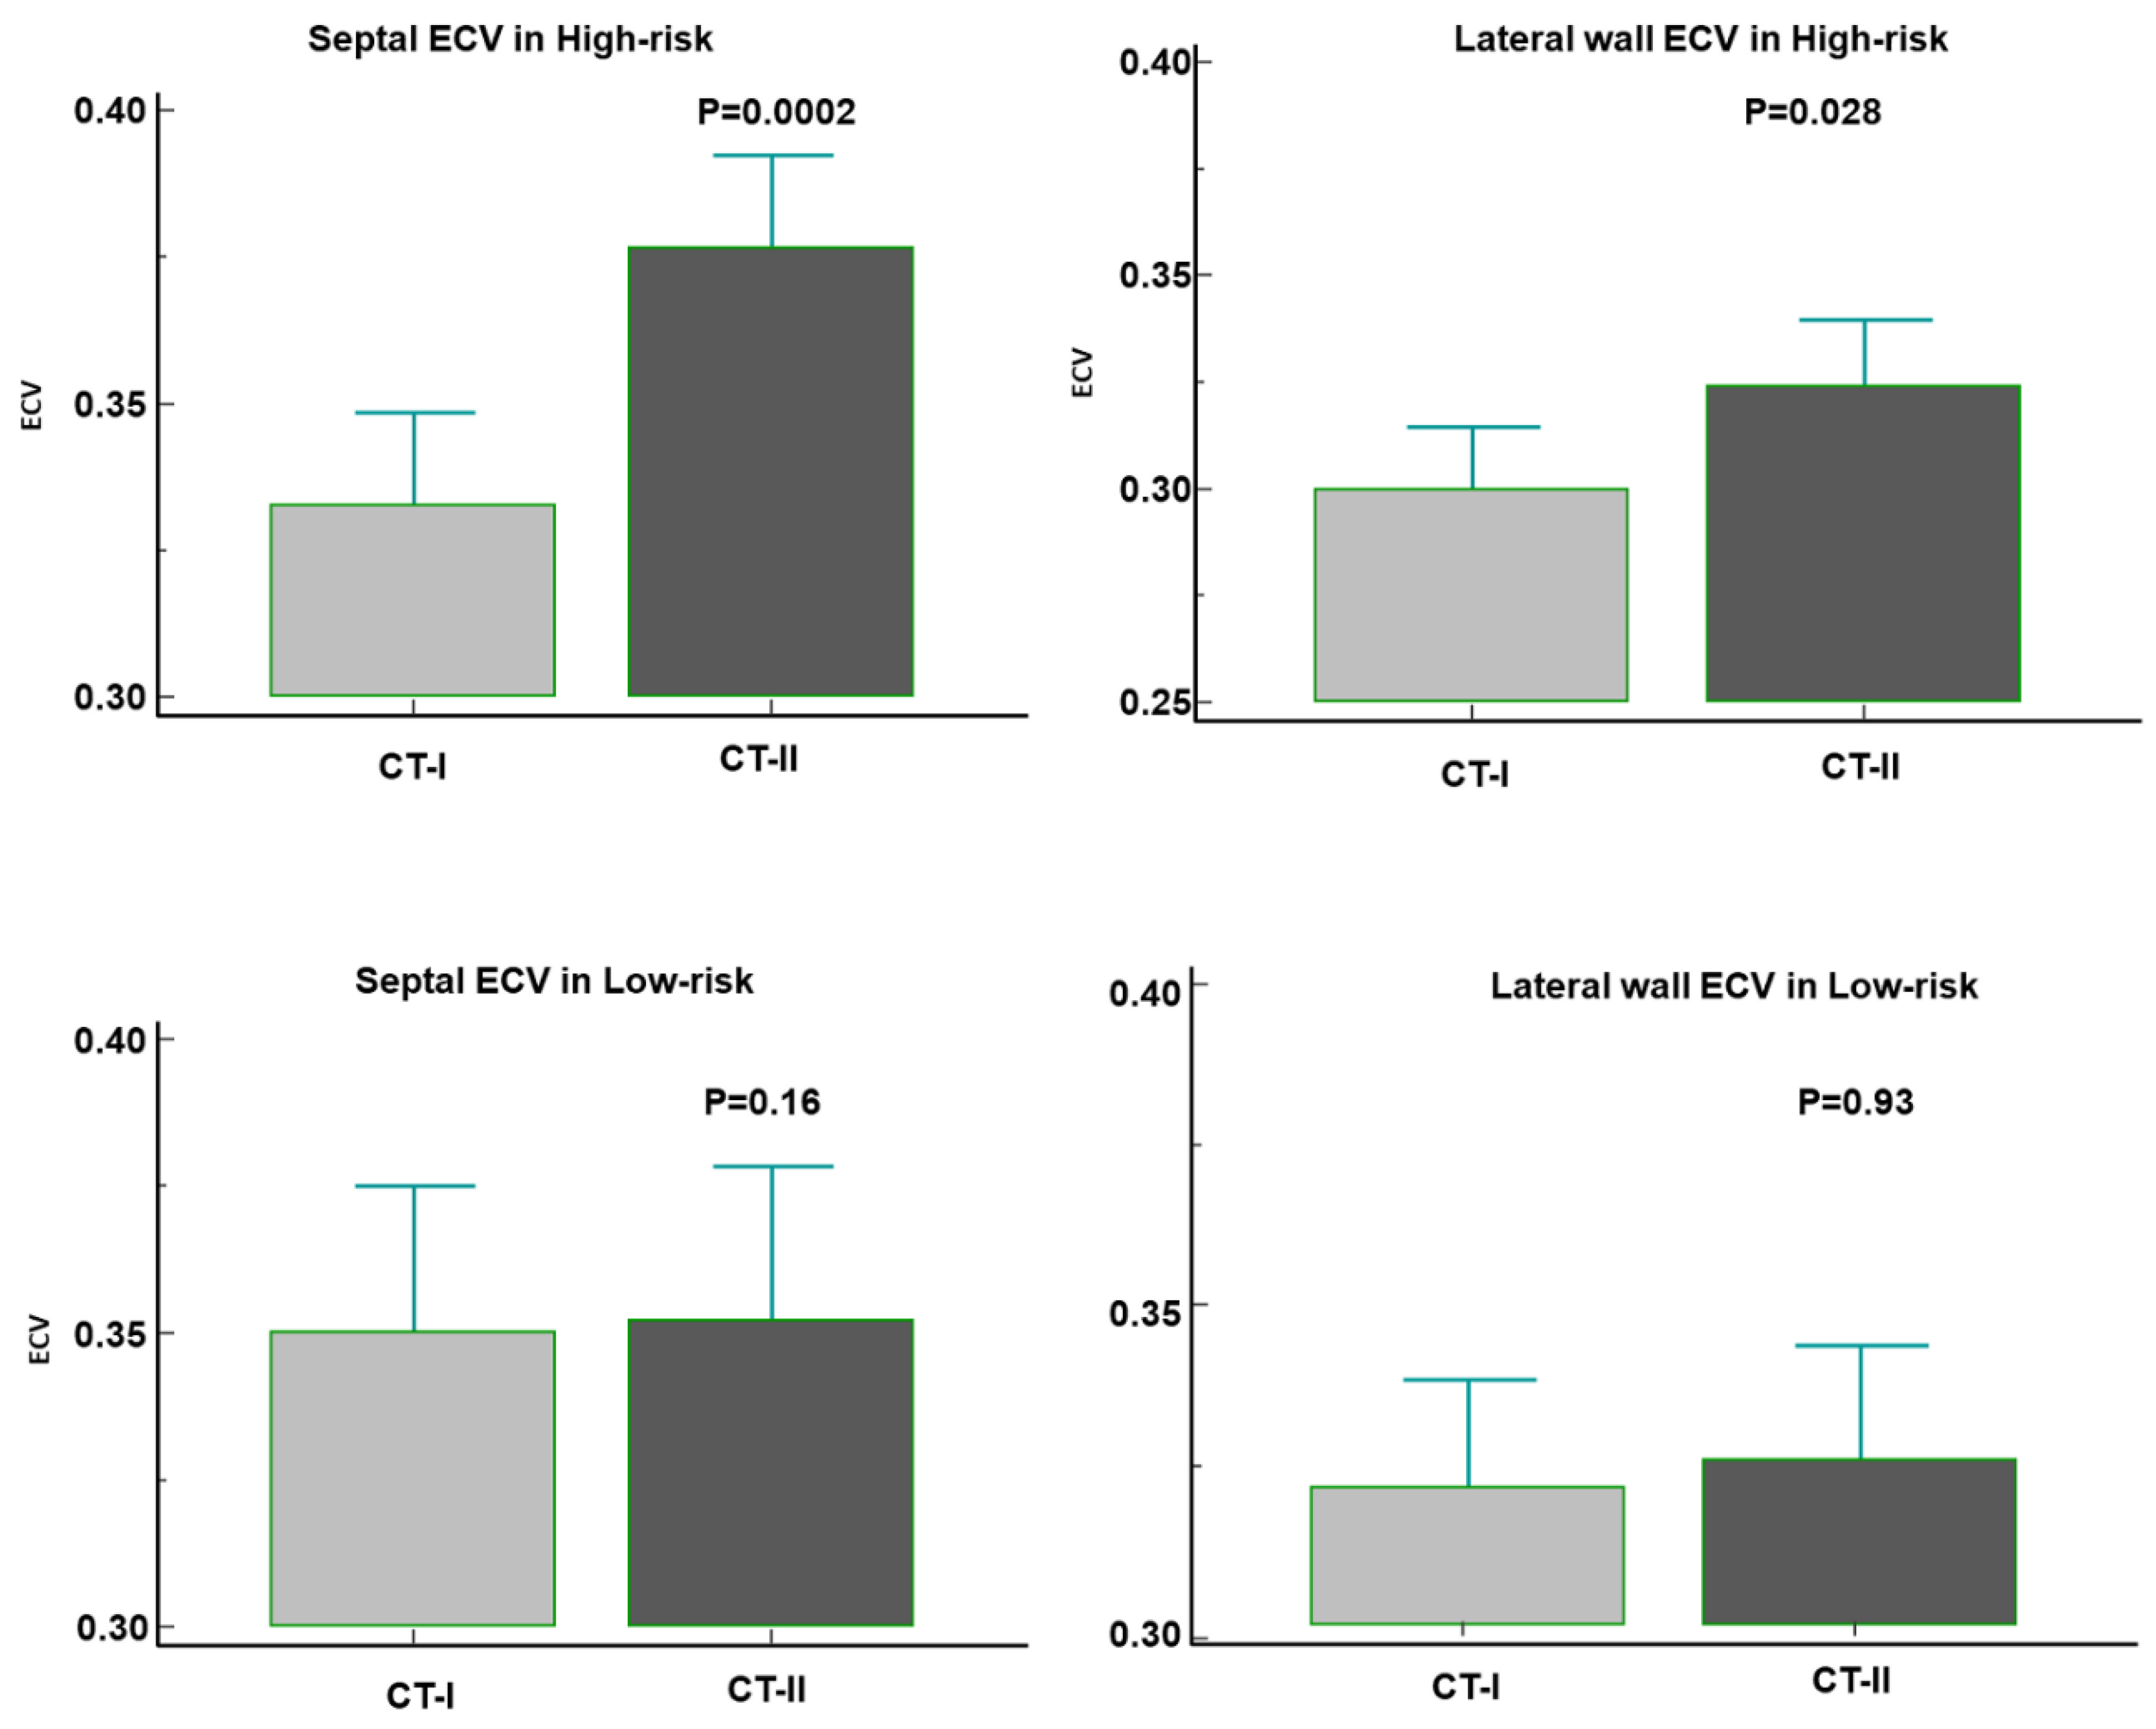
Figure 5.
Example of Arterial phase λ-maps. The upper panels show to a patients treated with low-risk chemotherapy agents, whereas in the lower panels images are from a patents with high-risk treatment. In this latter case, a decrease of myocardial λ (blue colour in map) was seen in lateral wall and focally in the interventricular septum.
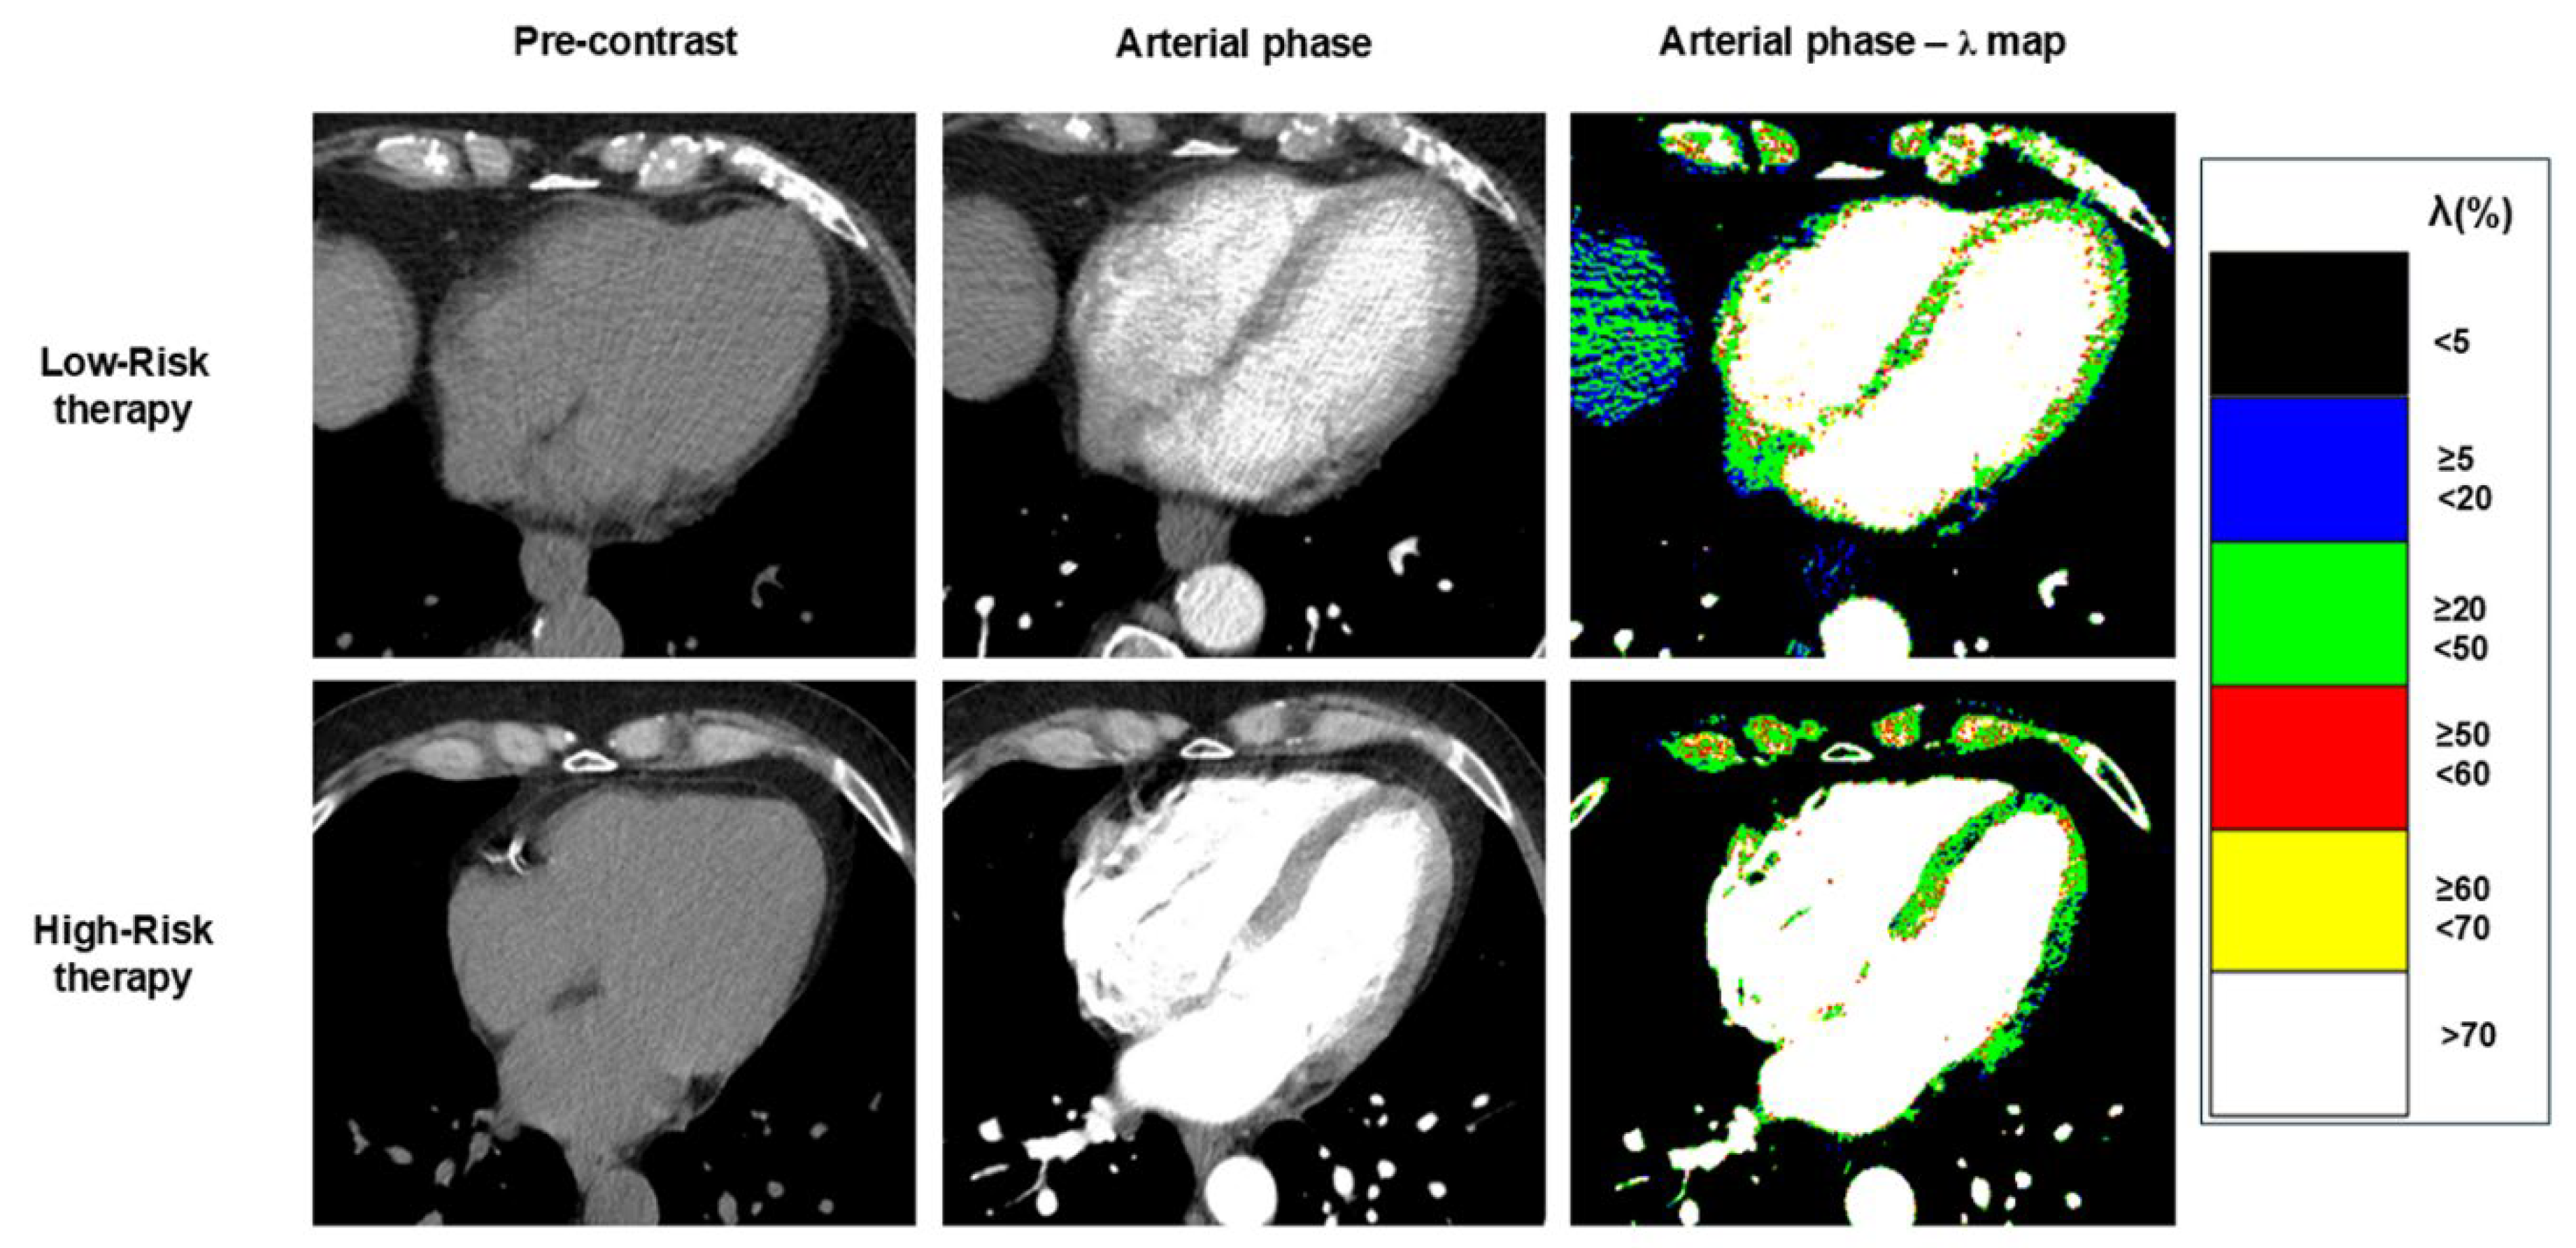
Figure 6.
Bland-Altman plot of reproducibility for ECV measurements.
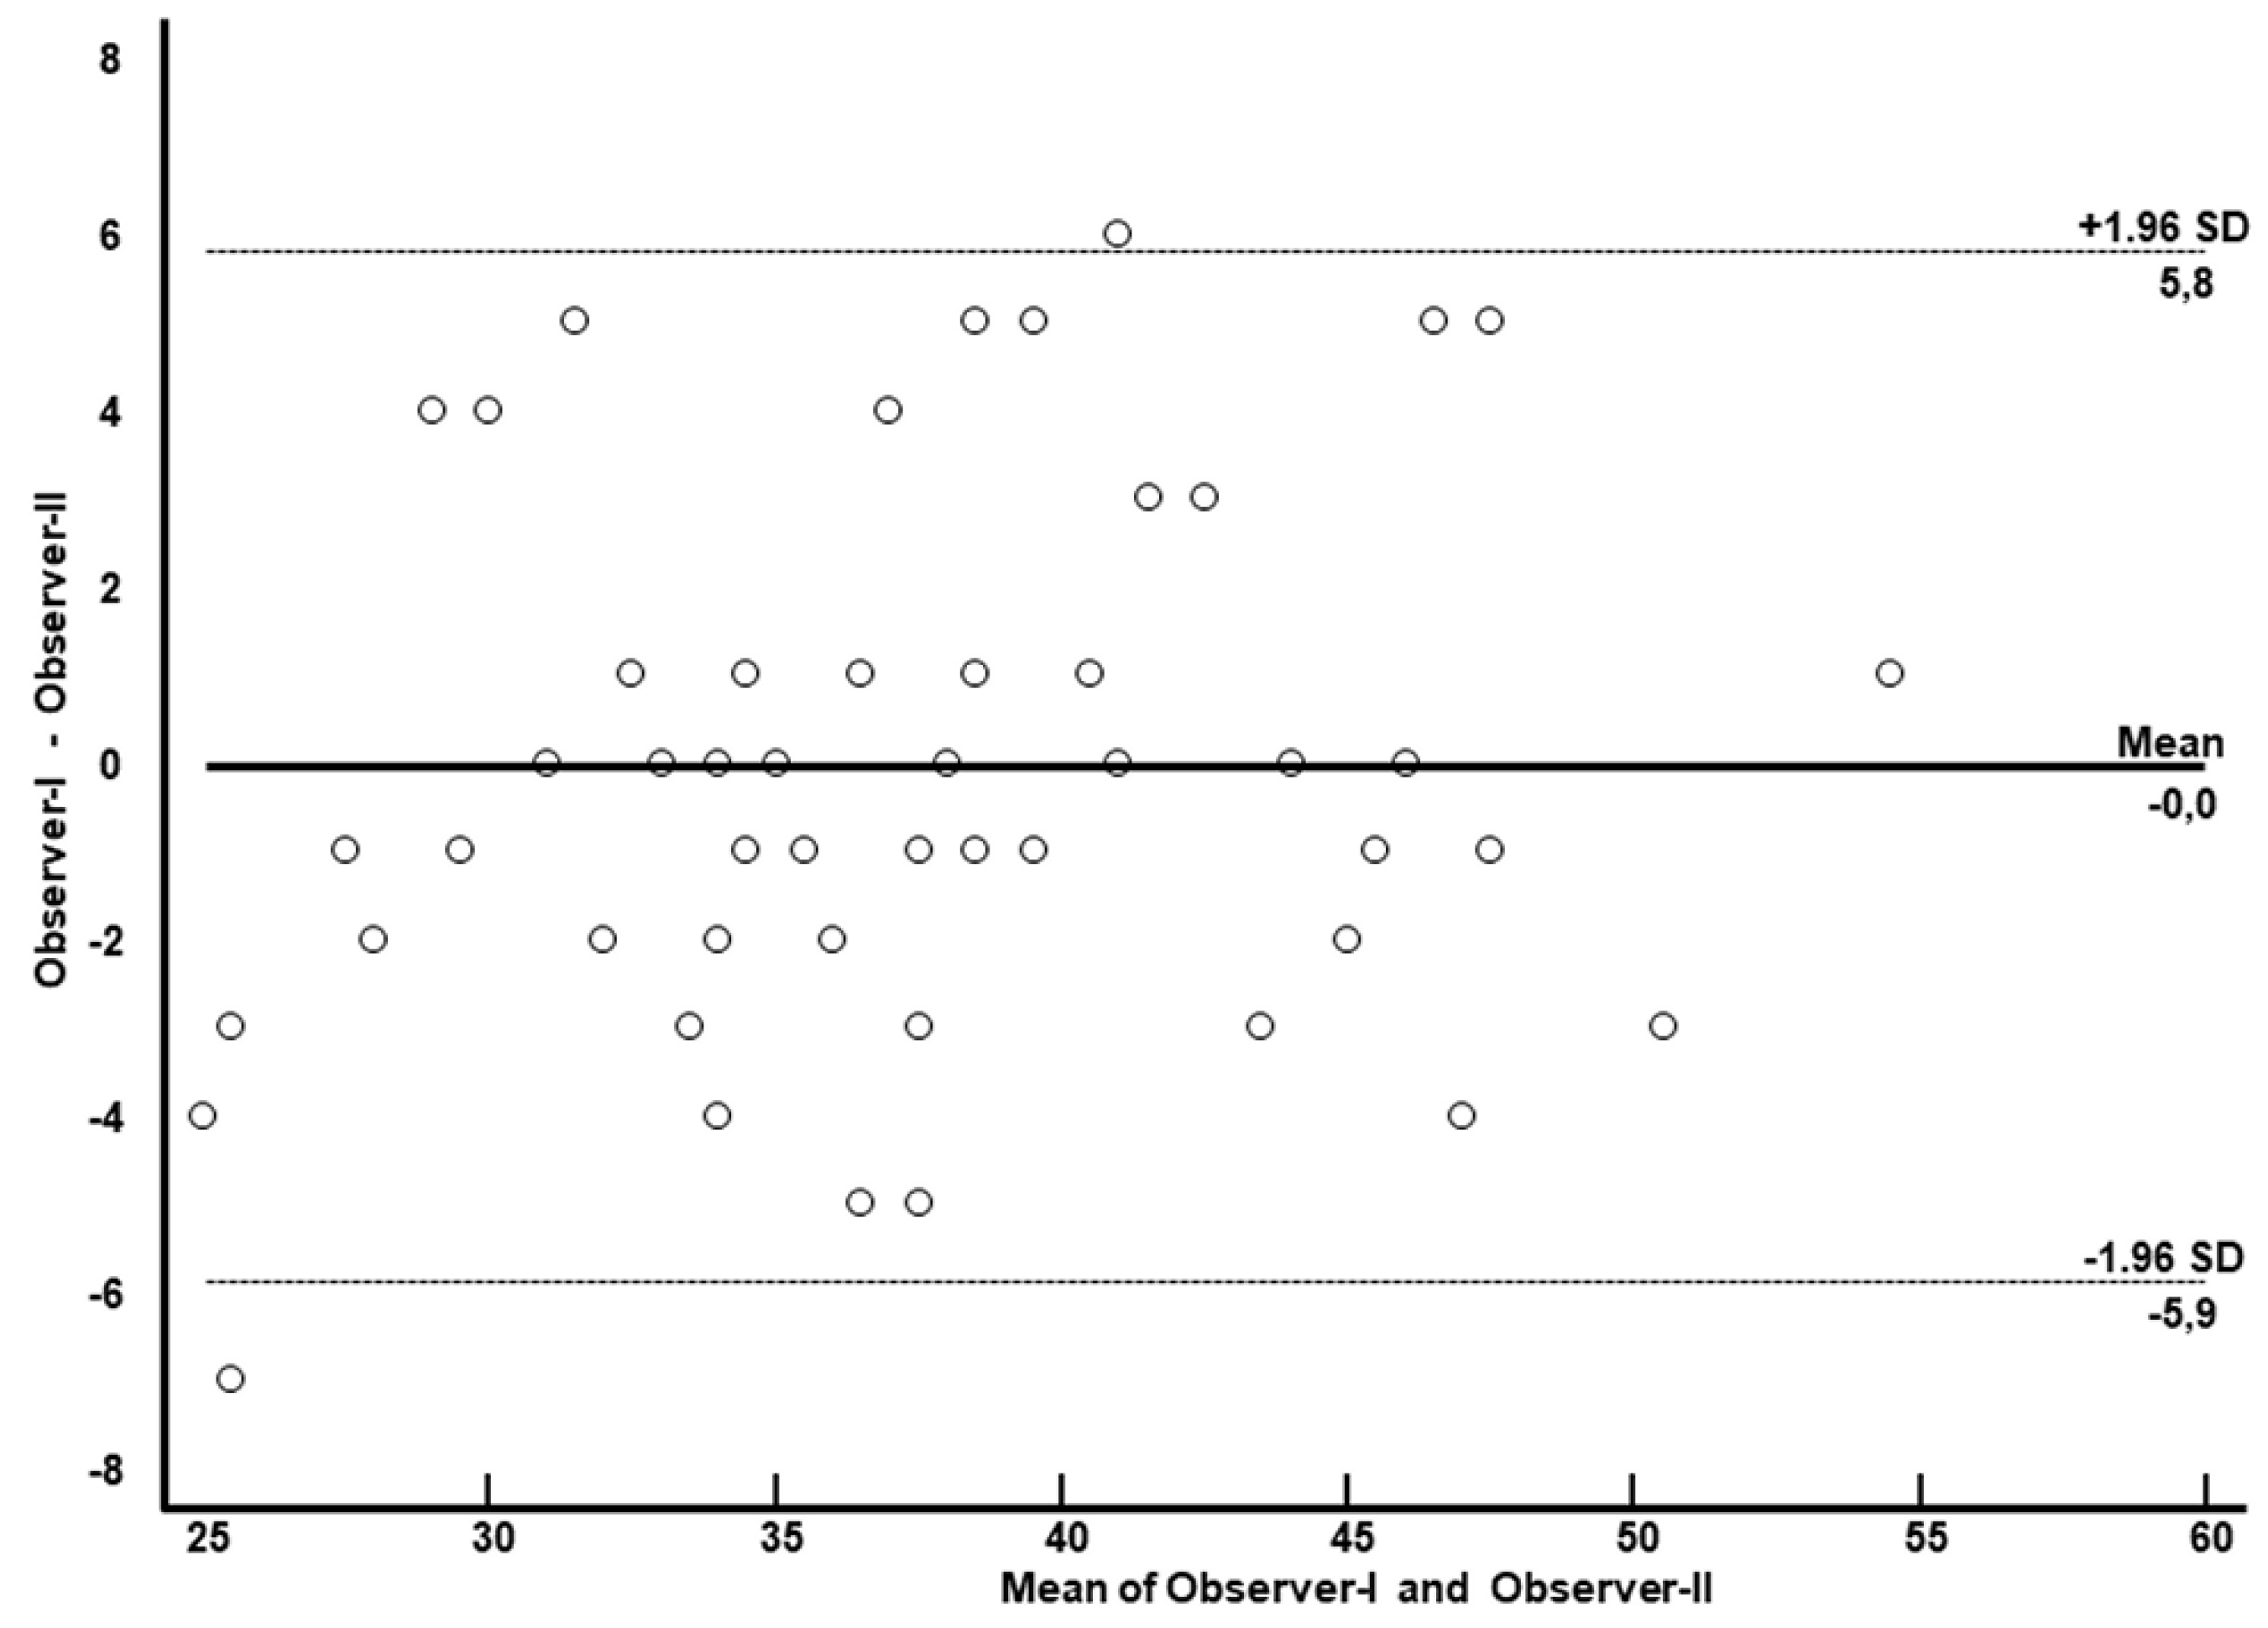

Table 1.
characteristics of population.
| Variable | Value | |
|---|---|---|
| Number of patients | 89 | |
| Female | n(%) | 64(72) |
| Age | Mean±SD | 63±14 |
| Systemic Hypertension | n(%) | 31(35) |
| Dislipidemia | n(%) | 22(25) |
| Diabete Mellitus | n(%) | 7(8) |
| Smoke | n(%) | 13(15) |
| Family history of CAD | n(%) | 9(10) |
| Family history of CMP | n(%) | 0 |
| Breast Cancer: | ||
|
n(%) | 50(56) |
|
n(%) | 41(46) |
| Trastuzumab | n | 15 |
| Anthracyclines (Doxorubicin) | n | 25 |
|
n(%) | 9(10) |
| Anastrozole | n | 2 |
| Palbociclib-Letrozole | n | 2 |
| Aromasin LHRHa | n | 1 |
| Exemestane | n | 1 |
| Abemaciclib | n | 1 |
| Letrozole | n | 1 |
| fulvestrant abemaciclib | n | 1 |
| Non Hodgkin Lymphoma: | ||
|
n(%) | 12 |
|
n(%) | 9(10) |
| R-MACOP-B | n | 2 |
| R-CHOP | n | 4 |
| Brentuximab-CHP | n | 1 |
| R-PVMYBEC | n | 1 |
| R-Endoxan | n | 1 |
|
n(%) | 2(2) |
| R-Bendamustine | n | 1 |
| Obinutuzimab-Bendamustine | n | 1 |
| Hodgkin Lymphoma: | ||
|
n(%) | 1(1) |
|
n(%) | 1(1) |
| Bv-AVD | n | 1 |
| Other tumours (low risk treatement): | ||
|
n(%) | 27(30) |
|
Chronic Lymphatic Leucemy Bendamustine Rituximab |
n(%) | 3(3) |
|
Waldenstrom disease Bendamustine, Rituximab |
n(%) | 1(1) |
| Anal cancer | n(%) | 1(1) |
| Colon cancer | n(%) | 3(2) |
| Esophagous cancer | n(%) | 1(1) |
| Stomach cancer | n(%) | 2(2) |
| Ovarian cancer | n(%) | 2(2) |
| Pancreatic cancer | n(%) | 2(2) |
| Lung cancer | n(%) | 8(9) |
| Rectal cancer | n(%) | 2(2) |
| Urethelial cancer | n(%) | 1(1) |
| Vulvar cancer | n(%) | 1(1) |
|
n(%) | 27(30) |
Table 2.
Characteristics of High-Risk and Low-Risk of cardiotoxicity.
| High-Risk of Cardiotoxicity | Low-Risk of cardiotoxicity | P. value | |
|---|---|---|---|
| n | 51 (57%) | 38 (43%) | |
| Age (years) | 51±13 | 67±12 | <0.001 |
| Females | 45 (88%) | 19 (50%) | 0.0001 |
| Systemic Hypertension | 16(31%) | 15(39%) | 0.50 |
| Dislipidemia | 11(225) | 11(29%) | 0.46 |
| Diabete Mellitus | 4(8%) | 3(8%) | 0.99 |
| Smoke | 8(16%) | 5(13%) | 0.17 |
| Family history of CAD | 7(14%) | 2(5%) | 0.29 |
| Family history of CMP | 0 | 0 | |
| GFR | 76±20 | 69±18 | 0.09 |
| Hematocrit CT-I | 37±3 | 38±4 | 0.28 |
| Hematocrit CT-II | 36±2 | 35±5 | 0.07 |
| Synthetic Hematocrit CT-I | 37±1 | 38±1 | 0.45 |
| Synthetic Hematocrit CT-II | 36±4 | 36±1 | 0.89 |
GFR, glomerular filtration rate; CT, computed tomography.
Table 3.
Extracellular volume (ECV) and arterial phase λ at CT-I and -II.
| High-Risk of Cardiotoxicity | Low-Risk Cardiotoxicity | P value | |
|---|---|---|---|
| n | 51 (57%) | 38 (43%) | |
| CT-I: | |||
| Septal ECV at CT-I | 32(31-35) | 35(32-38) | 0.23 |
| Lateral wall ECV at CT-I | 30(27-31) | 32(29-35) | 0.08 |
| Arterial phase septal λ at CT-I | 30±12 | 27±11 | 0.16 |
| Arterial phase lateral wall λ at CT-I | 26±15 | 24±12 | 0.36 |
| CT-II: | |||
| Septal ECV at CT-II | 37(35-39) | 35(32-39) | 0.10 |
| Lateral wall ECV at CT-II | 32(29-34) | 32(30-34) | 0.89 |
| Arterial phase septal λ at CT-II | 28±9 | 27±11 | 0.63 |
| Arterial phase lateral wall λ at CT-II | 26±10 | 24±11 | 0.37 |
| Variation from CT-I to CT-II: | |||
| Δ Septal ECV | 3(1-7) | 2(-1-4) | 0.028 |
| Δ Lateral Wall ECV | 2(0-7) | 1(-3-4) | 0.047 |
| Δ Arterial phase septal λ | -1(-2-4) | 2(0-8) | 0.022 |
| Δ Arterial phase lateral wall λ | -4(-9-7) | 0(-9-9) | 0.38 |
CT, computed tomography; ECV, extracellular volume; λ, see methods; Δ, difference of values between CT-II and CT-I (positive value means increase in CT-II).
Table 4.
Univariate and Multivariable logistic analysis for predicting High-risk of cardiotoxicity.
| Variables | Univariate | Multivariable | ||||
|---|---|---|---|---|---|---|
| OR | 95% C.I | P. value | OR | 95% C.I | P. value | |
| Δ Septal ECV | 6.4 | 1.6-25.4 | 0.008 | 5.8 | 1.43-23.4 | 0.04 |
| Δ lateral wall ECV | 2.4 | 0.62-9.3 | 0.20 | |||
| Δ arterial-phase septal λ | 0.02 | 0.005-0.82 | 0.039 | 0.05 | 0.001-2.3 | 0.015 |
ECV, extracellular volume; λ, see methods; Δ, difference of values between CT-II and CT-I.
Disclaimer/Publisher’s Note: The statements, opinions and data contained in all publications are solely those of the individual author(s) and contributor(s) and not of MDPI and/or the editor(s). MDPI and/or the editor(s) disclaim responsibility for any injury to people or property resulting from any ideas, methods, instructions or products referred to in the content. |
© 2025 by the authors. Licensee MDPI, Basel, Switzerland. This article is an open access article distributed under the terms and conditions of the Creative Commons Attribution (CC BY) license (http://creativecommons.org/licenses/by/4.0/).
Copyright: This open access article is published under a Creative Commons CC BY 4.0 license, which permit the free download, distribution, and reuse, provided that the author and preprint are cited in any reuse.


