
Submitted:
11 June 2025
Posted:
12 June 2025
You are already at the latest version
Abstract
Translation initiation site (TIS) prediction in mRNA sequences constitutes an essential component of transcriptome annotation, playing a crucial role in deciphering gene expression and regulation mechanisms. Numerous computational methods have been proposed and achieved acceptable prediction accuracy. In our previous work, we developed NeuroTIS, a novel method for TIS prediction based on a hybrid dependency network combined with a deep learning framework that explicitly models label dependencies both within coding sequences (CDS), and between CDS and TIS. However, this method has limitations in fully exploiting structural information within mRNA sequences. First, it only captures label dependency within three neighboring codon labels. Second, it neglects the heterogeneity of negative TIS originating from different reading frames, which exhibit distinct coding features in their vicinity. In this paper, under the framework of NeuroTIS, we propose its enhanced version, NeuroTIS+, which allows for more sophisticated codon label dependency modeling via temporal convolution and homogenous feature building through an adaptive grouping strategy. Tests on transcriptome-wide human and mouse datasets demonstrate that the proposed method yields an excellent prediction performance, significantly surpassing existing state-of-the-art methods.
Keywords:
deep learning
; bioinformatics
; translation initiation site prediction
; adaptive grouping
; label dependency
1. Introduction
Translation initiation is a pivotal process in the regulation of gene expression, determining where protein synthesis begins on messenger RNA (mRNA). The dysregulation of this initiation process can cause various human diseases, including cancers and metabolic disorders [1,2,3]. Translation initiation site (TIS) prediction is an essential step in transcriptome annotation that aims to elucidate the biological relevance [4]. Accurate prediction of TIS is not only important for profiling the protein coding fraction of the transcriptome, but also for accurate identification of untranslated regions (UTRs) which is known as important regulators in translation process [4]. Thus, TIS prediction holds significant importance for studying disease mechanisms of occurrence and development.
The identification of TIS in uncharacterized mRNA sequence presents an inherently challenging task due to several key factors, including: 1) Weak sequence conservation. In many organisms, translation initiation is guided by specific sequence motifs such as the Kozak sequence [5] in eukaryotes and the Shine-Dalgarno sequence [6] in prokaryotes. However, these motifs are not universally conserved or sufficiently distinctive across all species, also TIS is surrounded by relatively poorly conserved sequences [7]; 2) Complexity in translation initiation mechanism. In many mRNAs, there can be multiple potential translation initiation sites that may produce alternative protein isoforms or regulatory proteins. For example, many mRNAs contain multiple open reading frames (ORFs), including upstream open reading frames (uORFs) that typically repress translation of the main ORF [8,9,10]. These alternative initiation sites necessitate sophisticated computational techniques to resolve ambiguities. In this paper, we focus on the prediction of TIS in eukaryotes with tri-nucleotide AUG of the main ORF.
Over the past decades, numerous computational methods have been proposed for TIS prediction, primarily categorized by their classifiers, including artificial neural networks (ANN) [3,11,12,13], support vector machine (SVM) [14,15,16], linear discriminant analysis (LDA) [17] and Gaussian models [18]. In one of the works, the study [17] proposed a method called AUGpr for TIS identification using LDA, which utilizes six effective features around AUG such as position triplet weight matrix and ORF hexanucleotide features. The improved version of AUGpr, called AUGpr_sim, was proposed by [19], which exploit both statistical information and similarity to other known proteins to achieve higher prediction performance in cDNA sequences. [14] explored SVMs with different kernel functions for TIS prediction. They claimed that careful design of kernel functions helps to improve the prediction accuracy. [20] proposed a novel method for eukaryotic gene structures prediction based on a modular neural network system. The prediction task was performed by detecting different signals and contents based on different neural network. In [21], a multi-step ensemble approach for TIS prediction was proposed by combining a consensus neural network sensitive to conserved motifs and a coding neural network sensitive to the coding/non-coding potential around the start codon. In [22], a modular approach for TIS prediction, called MANTIS, was proposed, which mainly consists of three models: consensus, coding region classification, and AUG positioning. These three models are implemented by three classifiers respectively, and the prediction scores are fused into the decision classifier in the final stage of MANTIS. An improved version of this method, called StackTIS, adopts a different learning procedure and training strategy, was reported in [23]. Recently, deep learning has been effectively applied to TIS prediction. [13] developed a method called TISRover that uses a convolutional neural network (CNN) to learn biological knowledge (e.g., the presence of Kozak consensus sequence [5], reading frame features, and donor splice site patterns) directly from DNA sequence. [3,13,24,25,26,27,28]. Later, in view of the shortcoming that it cannot fully capture coding features from raw sequence, we proposed a method, called NeuroTIS [29], for TIS prediction in mRNA sequence based on a hybrid dependency network and deep learning framework which explicitly model label dependencies among coding sequence (CDS), between CDS and TIS. NeuroTIS explicitly exploit coding features and achieve considerable improvement over other methods in predictive results.
Despite its effectiveness, NeuroTIS has two key limitations in mRNA structural information utilization. First, it incompletely models codon labels consistency in a neighboring region. While its skip-connected bidirectional RNN (skipBRNN) aggregates the two most informative neighboring positions into current position, however, as shown in Figure 1, CDS is a continuous region where codon labels are consistent with a multiply of three, hence, all the neighboring positions can provide more or less information for current position. Technically speaking, it is difficult for skipBRNN to aggregate more informative neighboring positions to current position for the fact that the network is sequentially connected. Furthermore, the network is also low-scaled and hence has too limited expressive power to model complex non-linear relationships between inputs and outputs. Second, the coding features around different negative TISs are heterogeneous, as shown in Figure 1, for positive TISs, coding features around is homogeneous, but for negative TISs, such as and , they are located in different reading frames and hence the coding features around them are heterogeneous, during the process of TIS prediction, it is difficult for CNN to map these heterogeneous features to the same label. This is because that the weights of CNN is global and shared by all the data, they must reconcile to fit all the heterogenous features when they are updated by backpropagation algorithm [30].
In this study, we address the aforementioned limitations through the development of NeuroTIS+, an enhanced method for TIS prediction leveraging structural information in mRNA sequence. NeuroTIS+ models codon label consistency by using Temporal Convolutional Network (TCN) [31], which allows for more expressive power to model coding probability outputs and more flexible codon labels information aggregation than NeuroTIS. Moreover, NeuroTIS+ consider the heterogeneity of negative samples and train three frame-specific CNNs for translation initiation site prediction. Evaluated on human and mouse transcriptome-wide mRNA sequences, our method yields an excellent prediction performance, which significantly outperform existing state-of-the-art methods. There are three key innovations contribute to the enhanced performance of our proposed framework:
- The proposed method, NeuroTIS+, is an improved version of NeuroTIS, which preserve the basic framework of NeuroTIS, and hence, it inherits the merits of explicitly modeling statistic dependencies among variables and automatical feature learning. Meanwhile, it assumes stronger dependency relationship among codon labels and integrates novel frame information for TIS inference.
- We consider the structural information that CDS is continuous and models codon labels consistency by using a TCN which can easily and naturally implement the process of multiple codon labels information aggregation by convolutional layers. Moreover, a position embedding and a fast codon usage generating strategy for a sequence are also proposed to improve the prediction of coding sequence in mRNA sequence.
- We consider the heterogeneity of negative TIS and develop an adaptive grouping strategy for homogenous feature building, which effectively improve the prediction accuracy of TIS. Moreover, the adaptive grouping strategy stablizes the learning process of CNN.
The source code and the dataset used in the paper are publicly available at: https://github.com/hgcwei/NeuroTIS2.0.
2. Related Works
2.1. Codon Labels Consistency
The idea of exploiting label consistency information for promoting model performance is widely used in image and video analysis. For example, when identifying human actions in videos, since the actions in adjacent video frames are often consistent, this constraint can be exploited to improve the accuracy of action recognition [31]. Similarly, in multi-label image classification tasks [32], objects of different categories in the image may have label dependencies, and considering this dependency information often improves the classification accuracy. All the aforementioned applications give us an intuition that we can also benefit from considering codon labels dependencies in coding sequence prediction of an mRNA sequence. Based on this idea, our previous work proposed a skipBRNN for CDS prediction, which models codon label consistency by integrating the three most informative neighboring positions. However, it cannot fully model dependencies among multiple codon labels. In this paper, we employ TCN for CDS prediction for the first time. TCN is a common approach for modeling time sequences. It can effectively aggregate local information of time sequences by virtue of temporal convolution. Hence, it is suitable for problems where there exists local label dependency, such as human action recognition [33], named entity recognition [34], etc.In addition, TCN also exhibits a powerful capability of automatic feature learning, and hence most of aforementioned applications often directly perform TCN on their raw data, which saves the efforts of handcrafted features. In contrast, we incorporate codon usage statistics into the TCN, which not only obtains more meaningful results, but also needs less data and is easier to train.
2.2. Non-Homogeneous Negative TIS
The problem of data heterogeneity is common in federated learning [35], e.g., data have different feature distributions but with the same label (domain shift [36]).Data heterogeneity induces the "catastrophic forgetting" problem for classification models; the global parameters might not be optimal simultaneously on data with different distributions.The model gradually "forgets" the knowledge learned from previous tasks during the continuous learning process[30]. Indeed, the data heterogeneity problem also occurs in TIS prediction. Negative TISs are often located in different regions in an mRNA sequence, and the contextual information of these TISs is very different. To our best knowledge, only a few works have paid attention to the non-homogeneous property of negative TISs in genomic sequences. TriTISA [37] is a method for detecting TISs in microbial genomes, which classifies all candidate TISs into three categories based on evolutionary properties, e.g., positive TISs, negative TISs upstream of positive TISs, and negative TISs downstream of positive TISs. Then, TriTISA characterizes them using Markov models. The work [38] extended TriTISA to genome sequences. This method divides all TISs into different groups, e.g., intron, UTRs, and exons. Then, different classifiers are trained for each group, and the trained classifiers are combined for final TIS prediction.
Our work differs from the aforementioned works in two aspects. First, these methods divide candidate TISs according to regions where they are located. However, this kind of division strategy is rough, e.g., the negative TISs in the same CDS may be located in different reading frames. In contrast, our proposed method divides the candidate TISs according to the predicted reading frame where they are located. Second, these methods divide the candidate TISs by using labeled data. However, in the test process, the labeled information of test data is lacking. These methods must combine the prediction results of all the local classifiers, which inevitably induces prediction noise from different classifiers, whereas in our proposed method, a local classifier is assigned to each sample in an adaptive manner according to predicted frame information.
3. The Proposed Method
In this section, the preliminaries, the dependency network representation of NeuroTIS and NeuroTIS+, the pipeline of NeuroTIS+ are introduced. The graphical illustration of NeuroTIS+ is shown in Figure 3.
3.1. Preliminaries
In what follows, is an mRNA sequence and is the label sequence of , where and , and denotes the output probability of a computational model. The TIS prediction is equivalent to solve the following maximum a posteriori (MAP) estimation problem:
where denotes the position of k-th tri-nucleotides AUG in the sequence , and denotes whether the position in is a positive TIS or not .
3.2. NeuroTIS
NeuroTIS considers the label dependencies among codon labels, and between codon labels and TIS, it receives the input of mRNA sequence and outputs the probability of a codon and translation initiation site, hence the problem of Eq. 1 can be reduced to solve the following MAP estimation problem:
where is the codon labels of and denotes whether the position i in is the first nucleotide of a codon () or not ().
NeuroTIS introduces a dependency network to represent and simplify the dependency relationships among variables. As shown in Figure 2, it is assumed that there exists weak interdependency among codon labels, TIS is dependent on codon labels and mRNA sequence, then according to the chain rule of probability [39], Eq.2 can be reduced to the problem as follows:
Despite the above reduction, Eq.3 is still a NP-hard problem, NeuroTIS adopts a greedy inference and decomposes the TIS prediction problem into two following subproblems:
where NeuroTIS efficiently infer variables in two stages: one stage to predict CDS , and the second stage to combine predicted coding scores at the first stage with TIS sequence to jointly infer the TIS . Note that NeuroTIS assumes that there exists weak interdependency among codon labels and models the codon labels consistency among three positions with a step interval v to avoid the information redundancy among neighboring positions. In practice, NeuroTIS employs a skipBRNN to estimate conditional probability distributions . With regard to conditional probability distribution , NeuroTIS employs a CNN for the fact that it can effectively capture local patterns and model non-linearity in data.
3.3. NeuroTIS+
3.3.1. Dependency Network Representation
In this paper, apart from label dependency between CDS and TIS, we also consider the heterogeneity of negative TISs, and introduce a frame information which have an influence on the final TIS prediction for the first time. To be specific, we can reformulate Eq.2 as follows:
where variable denotes which frame that the CDS of a mRNA sequence is located in. NeuroTIS+ also build a dependency network to represent and simplify dependency relationships among multiple variables. As shown in Figure 2, NeuroTIS+ assumes denser and stronger codon label dependencies compared with NeuroTIS, that is, each codon label is interdependent on all the left codon labels of the mRNA sequence . Moreover, frame variable f is dependent on codon labels, and TIS variable is dependent on mRNA sequence , codon variables and frame information. According to chain rule of probability, the problem of jointly infer TIS and coding region can be finally reduced to solve a type of MAP problem:
where denotes all the index of a mRNA sequence except i. Note that Eq.6 is NP-hard and exact inference is intractable. Hence, we make a simple and efficient greedy inference to approximate the problem as follows:
Figure 3.
The pipelines of NeuroTIS+. It mainly include two stages: CDS prediction and TIS prediction. In stage 1, TCN is used to predict CDS from the three frames of a mRNA sequence, then in stage 2, a candidate TIS is grouped according to predicted frame information of CDS and its features are fed into the specified CNN for TIS prediction.
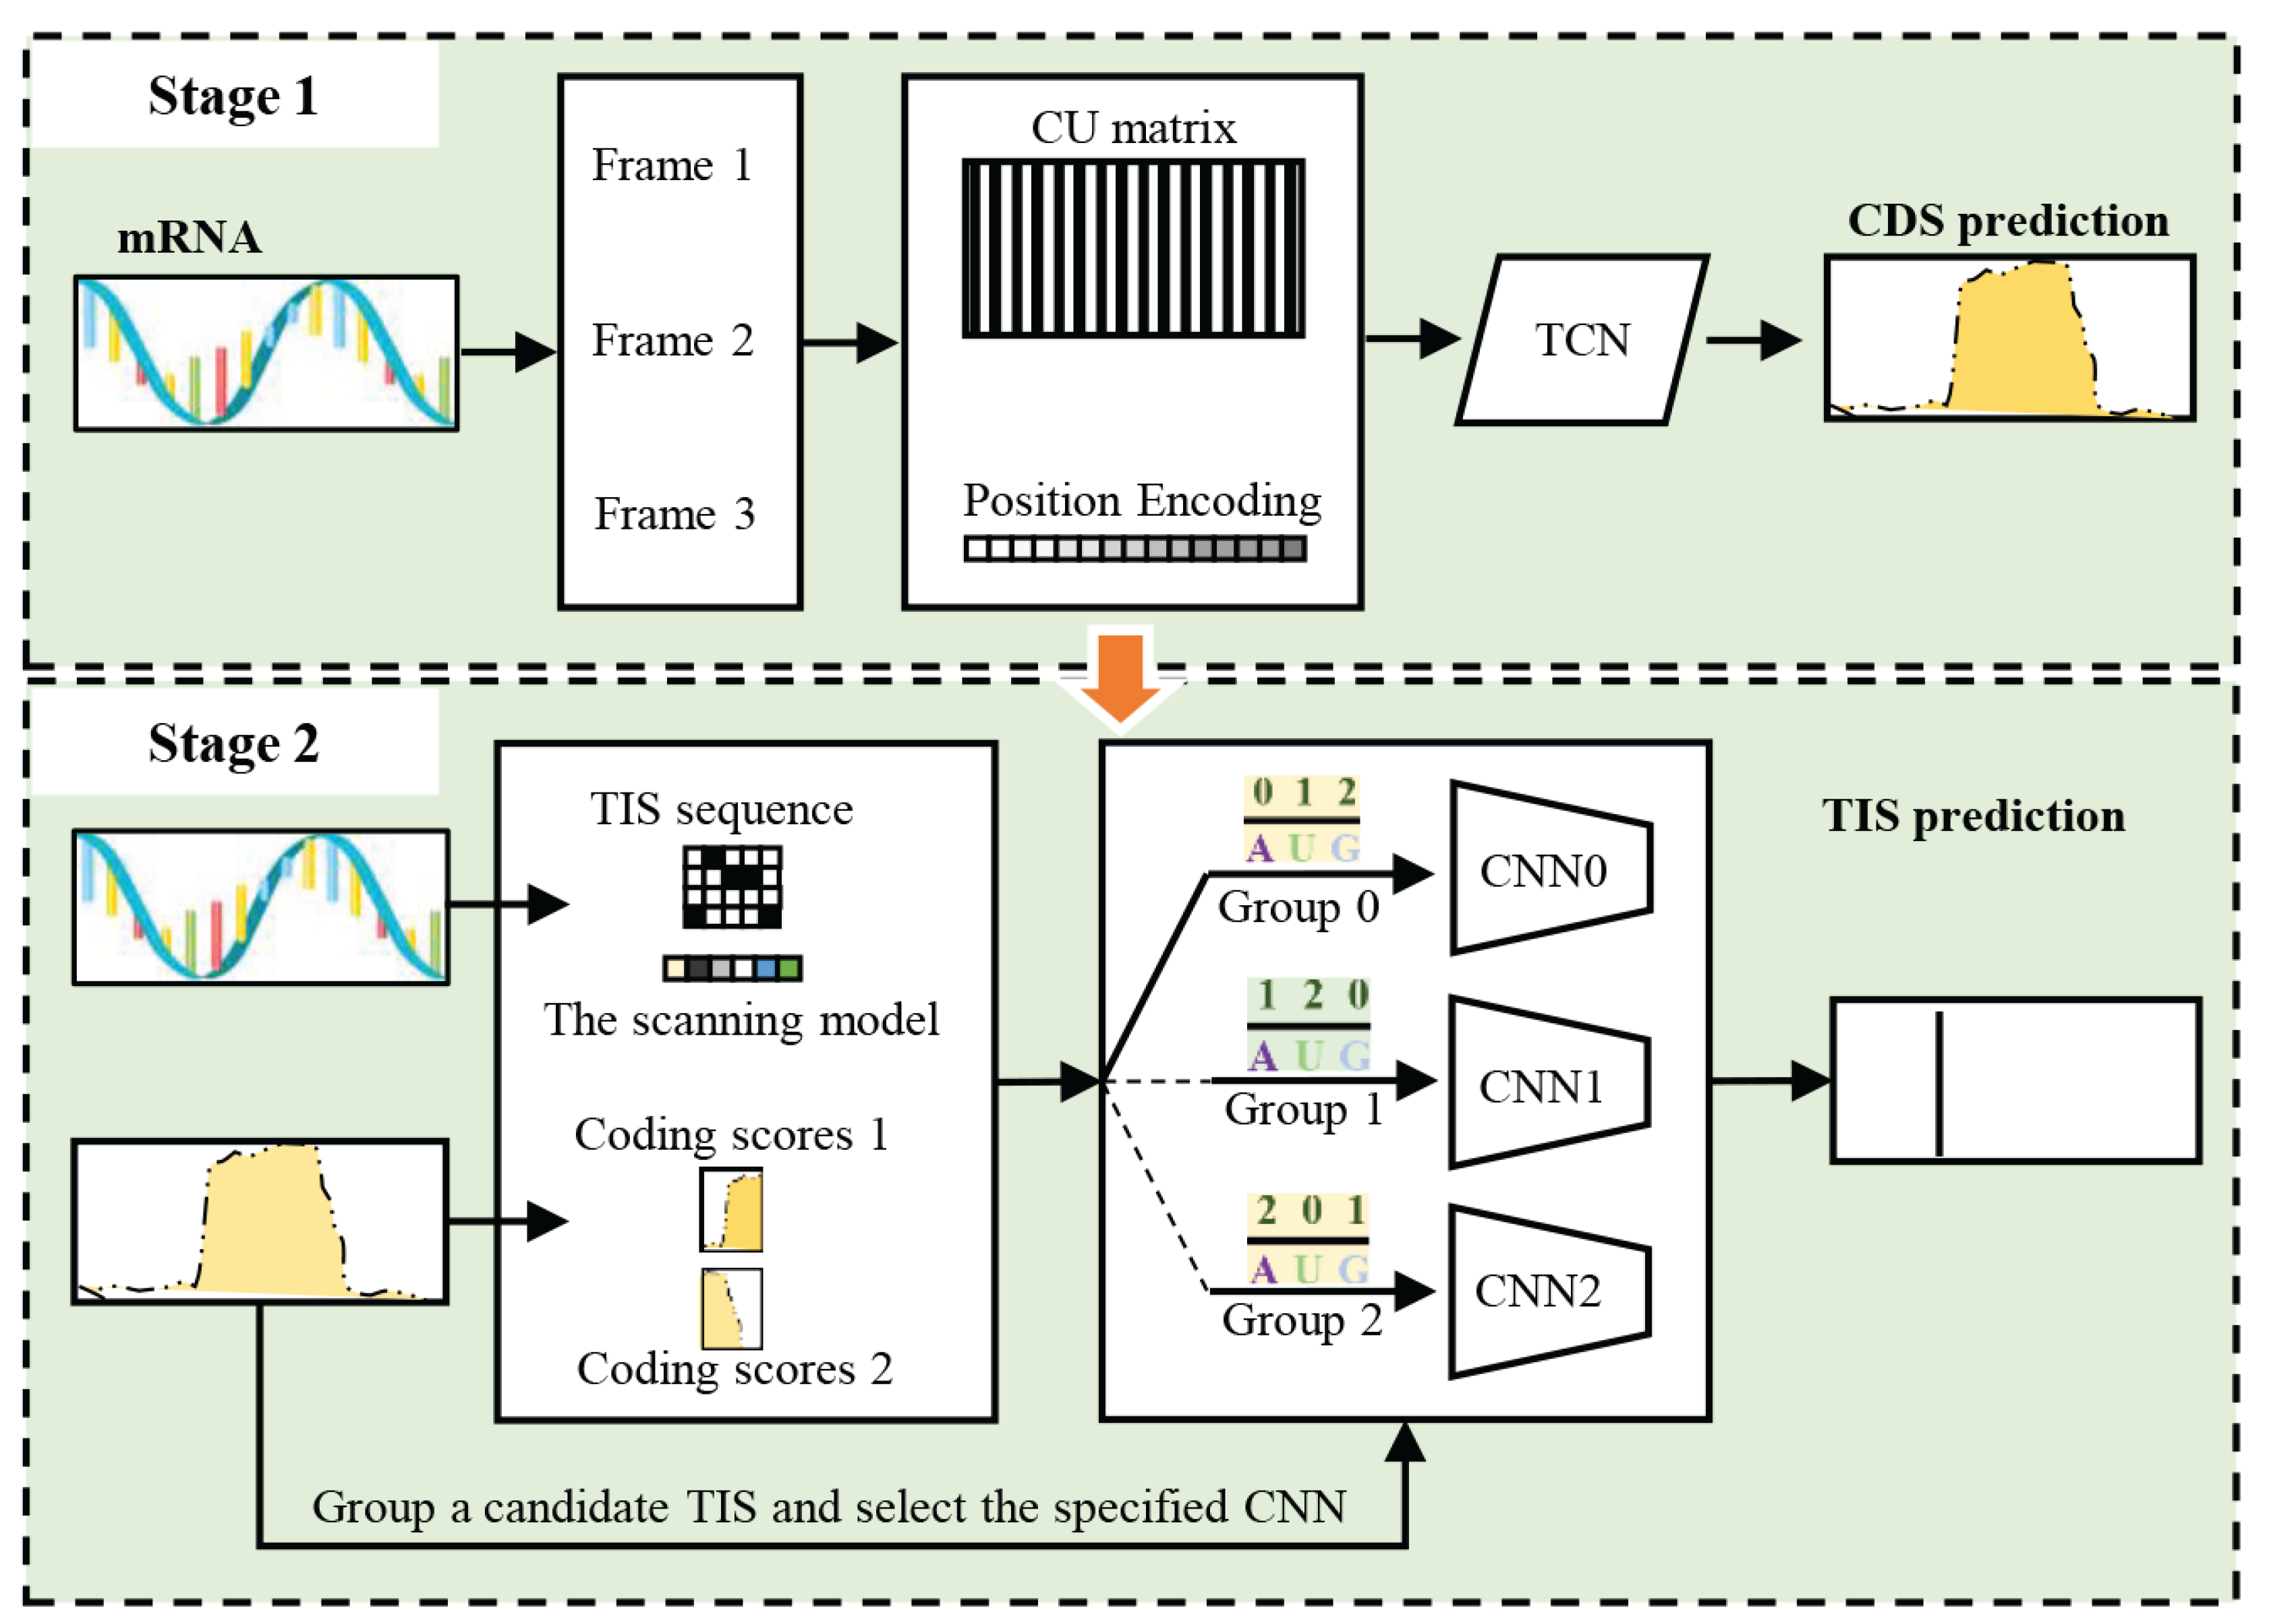
Using the above three equations, NeuroTIS+ can efficiently infer variables in three stages: one stage to predict CDS, and the second stage to predict frame of CDS, and the third stage to combine frame information and coding scores for TIS prediction. In the following sections, we introduce a TCN to estimate the conditional probability distribution , and a simple strategy to calculate f according to , and as for the conditional probability distribution , we estimate it by utilising frame-specific CNN.
3.3.2. Temporal Convolutional Network for CDS Prediction
TCN [40] is a class of artificial neural network dealing with time sequential data that exhibits correlations between time points. Unlike traditional recurrent neural networks (RNNs) or long short-term memory (LSTM) networks, TCN uses convolutional layers to capture dependencies in sequential data in a parallel way, which makes the training process efficient. In this subsection, we employ a TCN to model codon labels consistency, it is based on our intuition that the network can not only naturally performs multiple coding labels message aggregation by using convolutional layers, but also can easily implement this aggregation in a long distance by using dilated convolution. In the following parts, we first propose a fast codon usage matrix generation strategy and position encoding of a reading frame, and then the two features are fed into TCN for CDS prediction.
Fast Codon Usage Matrix Generation. NeuroTIS+ and NeuroTIS both use codon usage as a entity feature to predict coding and non-coding regions in mRNA sequence, hence it must calculate codon usage at each position of a reading frame. To attain this goal, a sliding window is performed with a step 3 and window size m along a reading frame and then the frequency of each codon (from 1 to 64) occurs in the window is calculated and summed in a 64-dimensional feature vector. Assume that scanning a codon is a basic operation, a reading frame with length n must perform times in total. In fact, the computational complexity can be reduced due to many repeated scanning operation, e.g., two sliding widows overlaps with only exception of the first codon and the last codon, hence once the feature vector of the first sliding window has been calculated, the next feature vector can be calculated directly by add 1 for the last codon and subtract 1 for the first codon. The detailed process is shown in Algorithm 1.
Position Encoding. In this paper, we introduce a position encoding for CDS prediction, it is based on our observation that the CDS portion is flanked by 5’ and 3’ UTRs where codon labels are zeros, and hence codon labels is dependent on position in a mRNA sequence in some way. To exploit this simple statistical dependency information, we add 1-dimension feature to codon usage measure by calculating the ratio of position and length of reading frame, . This encoding can bring a slight improvement of the prediction results.
TCN. Due to the triplet structure characteristics of codons in the CDS of mRNA sequence, there are three kinds of reading frames in mRNA sequence, and each reading frame satisfies the constraint of label consistency. Hence, without loss of generality, we consider one reading frame whether it contains CDS at a time, and the other two reading frame can be processed in the same way. Assume that represents the reading frame to be examined, and is the entity feature generated by a sliding window at the i-th position of (e.g., position encoding and codon usage). represents the hidden neuron at the i-th position on the l-th layer of the network, and represents the k-th component of the convolution kernel on the l-th layer. Then, the hidden neuron at the i-th position of the sequence can be expressed as:
where represents the index of the convolution kernel of length , represents the adjacent positions to the left and right of the i-th position in the sequence, and represents a nonlinear activation function. Note that the input layer uses a linear transformation to capture attribute features, that is, . Compared with our previously proposed skipBRNN, TCN has good properties: 1) Hidden neuron is the weighted sum of its neighboring positions via convolutional layers, which makes multiple labels message passing easier; 2) Each convolutional kernel can be performed independently, which makes parallel calculation possible; 3) It is natural to enhance the expressive power of the network by adding the number of convolutional layers, which helps to handle big data.
| Algorithm 1: Fast CU matrix generation strategy |
|
3.3.3. Frame-Specific CNN with Adaptive Grouping Strategy for TIS Prediction
Given the coding scores of a mRNA sequence, how to determine the correct frame where CDS is located, and then divide all the TISs into different groups? We here adopt a simple strategy to calculate the max mean scores of each frame. It is based on the fact that each coding score tends to be close to 1 in the correct frame, and close to zero in the other two frames. Then we can formulate the process as follows:
where denotes all the indices from f to n with step 3. It is worth noting that is predicted frame information of the positive TIS in a mRNA sequence. Hence, to group homogeneous TISs in all mRNA sequences, we must calculate which frame that a TIS is located in, then the group of k-th TIS in a mRNA sequence with position can be calculated as follows:
where denotes three kinds of groups, in which denotes that the candidate TIS is located in the same frame as positive TIS. After grouping all the TISs, we can build homogenous features from each group.
We here adopt the same feature set as NeuroTIS for each group and three specific CNNs are separately trained using samples that belongs to the same group. To be specific, for a TIS to be predicted, once that which group it has been determined, the features of coding scores, the scanning model, and one-hot encoding of sequence around AUG are generated and fed into a specific CNN for final TIS prediction. It is observed that NeuroTIS+ and NeuroTIS employ the same features for the final TIS prediction, the difference lies in that NeuroTIS+ builds homogenous features according to the predicted frame information.
4. Experiments
In this section, we conduct four experiments on two benchmark gene datasets. The first is to verify the significance of adaptive grouping strategy. The second is to evaluate the performance of TCN for CDS prediction. In the third experiment, we compare NeuroTIS+ with the other existing state-of-the-art methods such as NeuroTIS [29], TISRover [13], TITER [3]. The last experiment is to evaluate the time cost and running status of NeuroTIS+.
4.1. Datasets
We selected transcript datasets from Refseq (ftp://ftp.ncbi.nih.gov/refseq/), which provides a complete, well-annotated collection of biological molecules for various types of species. We downloaded transcriptome-wide mRNA sequences with prefixes ’NM_’ and a total number of 24842 human and 19900 mouse transcripts are obtained after clean up procedure. All these transcripts have canonical TISs. After redundancy removal by using CD-hit [41] with sequence identity cutoff 80%, there are 20488 and 11613 sequences left for human and mouse transcripts, respectively, from which we adopted the hold-out strategy and randomly selected 4/5 and 3/4 sequences as training set, and 1/5 and 1/4 sequences as test set for human and mouse datasets, respectively.
4.2. Performance Measurements
In order to evaluate the performance of NeuroTIS+, we here employ the standard performance evaluation criteria in terms of sensitivity (SN), specificity (SP), accuracy (ACC), precision (PRE), F-score, area under the receiver operating characteristic (auROC), area under the precision recall curve (auPRC) and MCC. These metrics can be calculated as follows:
All the above metrics are based on the notions of TP, FP, TN, and FN, which correspond to number of positive samples identified correctly, negative samples identified incorrectly, negative samples identified correctly, and positive samples identified incorrectly, respectively. The MCC is an overall measurement of performance and another objective assessment index. ROC curve is commonly used to measure performance for binary classification problems, whereas PRC is a better measure when dealing with an unbalanced dataset. The auROC and auPRC can be calculated by using the trapezoidal areas created between each curve points. Further details can be found in [42,43].
4.3. Significance of Adaptive Grouping Strategy
In order to verify the significance of adaptive grouping strategy. We make an ablation study and compare the prediction performance of NeuroTIS+ with and without adaptive grouping. As shown in Table 1 and Table 2, we can see that NeuroTIS+ (G) consistently outperforms NeuroTIS+ (nG) in all the datasets and measures, especially PRE, F1-score, auPRC, and MCC scores. Figure 4 also shows the training and test process of the second phase of NeuroTIS+ (G) and NeuroTIS+ (nG). It is observed that mixture of all the negative TISs lead to heavier predictive oscillation and more convergence time in training and test process, while adaptive grouping strategy makes the training process more stable and converge quickly. It is worth noting that group 1 and 2 shows more stable and accurate predictive results. This is because the positive TIS is located in the first frame and hence negative TISs in the first frame have higher false positives than that in the other two reading frames. All the above analysis demonstrates that features of negative TISs exhibit heterogenous, and construction of homogenous features according to frame information not only facilitate more accurate prediction performance, but also promote the stability of model training process.
4.4. Performance Comparison for CDS Prediction
In order to verify the effectiveness of TCN for CDS prediction, we compare kmer+TCN with existing state-of-the-art methods, including kmer+SVM, C2+DanQ, kmer+skipBRNN, and C2+gkm+CNN+skipBRNN. For fairness, all methods were trained and tested on the same datasets. All the comparable methods were implemented according to the parameter settings in their original literatures. As for DanQ network, C2 encoding was used instead of C4 encoding because C2 encoding is more efficient. DanQ sets the input sequence length to 1000, while 90 is used here like other methods. Moreover, in order to prevent underfitting or overfitting, the scale of the neural networks is set large enough and two regularization techniques, e.g., Dropout [44] and early stopping [45], are adopted. Moreover, in order evade the side effect of data imbalance on predictive model, we use random undersampling for the negative samples and make the ratio of positive samples to negative samples approximately 1:1.
Table 3 shows the performance comparison of kmer+TCN with existing state-of-the-art methods on human and mouse datasets. It is observed that kmer+TCN achieves the best prediction performance and consistently outperforms the other methods on all the datasets, with an average sensitivity of 99.7%, specificity of 99.2% and auROC of 0.9992, an improvement of 0.61%,1.15%,0.0007 over the second best method, C2+gkm+CNN+skipBRNN. Moreover, kmer+TCN only use 64-dimensional codon usage and 1-dimensional position encoding, and the scale of TCN is very small, and hence it is easy to train and requires very little time to converge, while C2+gkm+CNN+skipBRNN need several hours to train due to large dimension of C2 encoding and gkm features. Moreover, Figure 5 also plot the ROC curves of different methods on human and mouse transcripts, from which we can observe that kmer+TCN not only achieve competed performance in human and mouse transcript sequences, but also consistently outperform the other existing state-of-the-art methods, which verifies the significance of biological feature (e.g., codon usage) and structural information (e.g., codon labels consistency). All the experimental results demonstrate that kmer+TCN is a highly accurate method for predicting CDS.
4.5. Performance Comparison for TIS Prediction
We compare the performance of our proposed method NeuroTIS+ with that of existing state-of-the-art methods such as TITER, TISRover, NeuroTIS. To make a fair comparison, all the methods are trained and tested on the same dataset. In order to evade the side effect of imbalance dataset, we also limit the number of negative samples in training set like kmer+TCN, but in the test set, all the negative samples are selected. The other comparable methods are implemented with reference to their original papers. Note that for all the neural network-based methods, the network size is set large enough to ensure that the model training will not be underfitted. Also, two regularization methods (i.e., Dropout and early stopping) are used to ensure that the model will not be overfitted.
As shown in Table 1 and Table 2, NeuroTIS+ performed the best among all the existing state-of-the-art methods and achieved the highest scores in all the evaluation metrics, especially in PRE, F1-score and MCC, an average improvement of 41.26%/0.2803/0.0332/0.2508 over the second best method, NeuroTIS, on human and mouse datasets. This improvement indicates that NeuroTIS+ can effectively reduce false positives, which verifies the significance of promoting the CDS prediction and adaptive grouping strategy. Figure 6 also illustrate the ROC and PRC curves comparison of all the methods on the human and mouse datasets. It can be seen that NeuroTIS+ is consistently higher than other state-of-the-art methods on both curves. Given a false positive rate of 0.5%, NeuroTIS+ achieved 99.2% and 99.56% sensitivity on human and mouse genome sequences, respectively, which is 5.45% and 7.04% higher than the second best method NeuroTIS. For the PRC curve, given a recall rate of 95%, NeuroTIS+ achieved 98.8% and 99.15% precision on human and mouse genome sequences, respectively, which is 24.33% and 30.12% higher than NeuroTIS, respectively.
From the above analysis, we can conclude that accurate prediction of CDS and homogenous feature building by adaptive grouping strategy play an important role in predicting TIS. All the experimental results demonstrate that NeuroTIS+ is a high-precision TIS prediction method.
4.6. Time Cost of NeuroTIS+
We here briefly introduce the computational cost of the proposed method. All the experiments are performed on the Intel Core i7-11700 CPU 2.50GHz PC with 16GB RAM. For the fact that NeuroTIS+ preserves the basic computational framework of NeuroTIS, hence it exhibits very similar cost as NeuroTIS. As shown in Table 4, NeuroTIS is efficient and it spends only about 20 minutes to complete the training process for CDS and TIS prediction. kmer+TCN converges quickly in 20 minutes in human dataset for the fact that it only requires 65-dimensional features and the network scale is small. In contrast, CNN+gkm+C2+skipBRNN requires much more time and memory resources to train for large dimensional C2 encoding and gkm features. Furthermore, in the second phase of NeuroTIS+, frame-specific CNN is also very efficient owing to the efficiency of 1d-CNN and proper feature dimension. Moreover, the homogenous feature building by using adaptive grouping strategy also facilitate the convergence time of CNN.
5. Discussions
Translation site prediction is a important step for gene annotation, accurate prediction of TIS in mRNA sequence facilitates the understanding of gene regulating mechanism, and play an important role in studying the occurrence and development mechanism of diseases. Many computational methods have been proposed to evade the expensive and time-consuming wet experiment, and achieve acceptable prediction accuracy by exploiting features such as consensus motifs around TIS, coding features around TIS and the scanning model. However, how to fully exploit the aforementioned features so far is still an open problem. Most of existing computational methods directly capture the above features from raw data, whereas it has been verified by a few works that it is more beneficial from designing a series of more sophisticated submodels for feature extraction, e.g., NeuroTIS. This paper extends that idea and explore a method for TIS prediction by fully exploit structural information in mRNA sequence. Tests on transcriptome-wide human and mouse datasets demonstrate that our proposed method show remarkable prediction performance.
In our work, the main potential factors which may explain the outstanding performance of NeuroTIS+ over NeuroTIS lies in that the former one fully exploit structural information of mRNA sequence. First, as regard to codon labels dependency, NeuroTIS only realized the process of message passing among three neighboring codon labels by using skip connection in a BRNN, whereas NeuroTIS+ realize the process of message passing among all the codon labels in a local region by using temporal convolution. Moreover, NeuroTIS+ have stronger expressive power by increasing the number of network layers and convolution kernels. Second, NeuroTIS+ considered the heterogeneity of negative TISs and build homogenous features for TISs by using an adaptive grouping strategy, then three frame-specific CNNs are trained for TIS prediction, which significantly improve the prediction performance of NeuroTIS.
Despite its improved performance, NeuroTIS+ has several limitations. First, it requires full-length mRNA sequences for global feature generation. Fortunately, the availability of full-length mRNA sequences is increasing. Second, it only considers canonical downstream TISs, while numerous mRNAs contain alternative TISs (including non-AUG codons) [3]. Third, its assumption of a directed TIS-CDS dependency enables efficient inference, but cyclic dependencies might offer additional benefits. Future studies on these points are warranted.
6. Conclusion
Translation initiation site prediction is an important problem in transcriptome annotation which plays a key role in transcript function annotation. In this paper, in view of the shortcomings that our previous method do not fully structural information in mRNA sequence, we propose its improved version, NeuroTIS+, which allows for more sophisticated codon label dependency modelling by temporal convolution network and homogenous feature building by using an adaptive sample grouping strategy. The experimental results demonstrate that our proposed method not only outperform existing state-of-the-art methods for coding sequence and translation initiation site prediction, but also exhibit more stable model training process.
Author Contributions
Conceptualization, Methodology, Writing-original draft preparation, Funding acquisition, Chao Wei; Data curation, Writing-review and editing, Wenqiu Xiao; Funding acquisition, Writing-review and editing, Chao Wei.
Funding
This work is supported by the research initiation fund of Hubei University of Technology under Grants XJ2022007201.
Data Availability Statement
We selected transcript datasets from Refseq (ftp://ftp.ncbi.nih.gov/refseq/).
Acknowledgments
The authors extend their gratitude to all researchers whose work contributed to this study, as well as the anonymous reviewers for their invaluable feedback which significantly improved the manuscript.
Conflicts of Interest
The authors declare no conflicts of interests.
References
- Sonenberg, N.; Hinnebusch, A.G. Regulation of Translation Initiation in Eukaryotes: Mechanisms and Biological Targets. Cell 2009, 136, 0–745. [Google Scholar] [CrossRef]
- Barbosa, C.; Peixeiro, I.; Romão, L. Gene expression regulation by upstream open reading frames and human disease. PLoS genetics 2013, 9. [Google Scholar] [CrossRef] [PubMed]
- Zhang, S.; Hu, H.; Jiang, T.; Zhang, L.; Zeng, J. TITER: predicting translation initiation sites by deep learning. Bioinformatics 2017, 33, i234–i242. [Google Scholar] [CrossRef]
- Venket, R.; Louis, K.; Fantin, M.; Linda, R. A simple guide to de novo transcriptome assembly and annotation. Briefings in Bioinformatics 2022, 2. [Google Scholar]
- Kozak, M. Translation of insulin-related polypeptides from messenger RNAs with tandemly reiterated copies of the ribosome binding site. Cell 1983, 34, 971–978. [Google Scholar] [CrossRef]
- Malys, N. Shine-Dalgarno sequence of bacteriophage T4: GAGG prevails in early genes. Molecular biology reports 2012, 39, 33–39. [Google Scholar] [CrossRef]
- Bernal, A.; Crammer, K.; Hatzigeorgiou, A.; Pereira, F. Global discriminative learning for higher-accuracy computational gene prediction. PLoS computational biology 2007, 3, e54. [Google Scholar] [CrossRef]
- Hinnebusch, A.G.; Ivanov, I.P.; Sonenberg, N. Translational control by 5’-untranslated regions of eukaryotic mRNAs. Science 2016, 352, 1413–1416. [Google Scholar] [CrossRef]
- Boersma, S.; Khuperkar, D.; Verhagen, B.M.; Sonneveld, S.; Grimm, J.B.; Lavis, L.D.; Tanenbaum, M.E. Multi-color single-molecule imaging uncovers extensive heterogeneity in mRNA decoding. Cell 2019, 178, 458–472. [Google Scholar] [CrossRef]
- Khuperkar, D.; Hoek, T.A.; Sonneveld, S.; Verhagen, B.M.; Boersma, S.; Tanenbaum, M.E. Quantification of mRNA translation in live cells using single-molecule imaging. Nature Protocols 2020, 1–28. [Google Scholar] [CrossRef]
- Pedersen, A.G.; Nielsen, H. Neural network prediction of translation initiation sites in eukaryotes: perspectives for EST and genome analysis. In Proceedings of the International Conference on Intelligent Systems for Molecular Biology; 1997. [Google Scholar]
- Rajapakse, J.C.; Ho, L.S. Markov encoding for detecting signals in genomic sequences. IEEE/ACM Transactions on Computational Biology and Bioinformatics 2005, 2, 131–142. [Google Scholar] [CrossRef] [PubMed]
- Zuallaert, J.; Kim, M.; Soete, A.; Saeys, Y.; Neve, W.D. TISRover: ConvNets learn biologically relevant features for effective translation initiation site prediction. International Journal of Data Mining and Bioinformatics 2018, 20, 267–284. [Google Scholar] [CrossRef]
- Zien, A.; Rätsch, G.; Mika, S.; Schölkopf, B.; Lengauer, T.; Müller, K.R. Engineering support vector machine kernels that recognize translation initiation sites. Bioinformatics 2000, 16, 799. [Google Scholar] [CrossRef]
- Li, H.; Jiang, T. A class of edit kernels for SVMs to predict translation initiation sites in eukaryotic mRNAs. In Proceedings of the Eighth International Conference on Resaerch in Computational Molecular Biology; 2004. [Google Scholar]
- Chen, W.; Feng, P.M.; Deng, E.Z.; Lin, H.; Chou, K.C. iTIS-PseTNC: A sequence-based predictor for identifying translation initiation site in human genes using pseudo trinucleotide composition. Analytical Biochemistry 2014, 462, 76–83. [Google Scholar] [CrossRef]
- Salamov, A.A. Assessing protein coding region integrity in cDNA sequencing projects. Bioinformatics 1998, 14, 384. [Google Scholar] [CrossRef]
- Li, G.; Leong, T.Y.; Zhang, L. Translation Initiation Sites Prediction with Mixture Gaussian Models. IEEE Transactions on Knowledge and Data Engineering 2005, 17, 1152–1160. [Google Scholar] [CrossRef]
- Nishikawa, T.; Ota, T.; Isogai, T. Prediction of Fullness of cDNA Fragment sequences by combining Statistical Information and Similarity with Protein Sequences.
- Hatzigeorgiou, A.; Mache, N.; Reczko, M. Functional site prediction on the DNA sequence by artificial neural networks. In Proceedings of the Proceedings IEEE International Joint Symposia on Intelligence and Systems. IEEE; 1996; pp. 12–17. [Google Scholar]
- Hatzigeorgiou, A.G. Translation initiation start prediction in human cDNAs with high accuracy. Bioinformatics 2002, 18, 343–350. [Google Scholar] [CrossRef]
- Tzanis, G.; Berberidis, C.; Vlahavas, I. MANTIS: a data mining methodology for effective translation initiation site prediction. In Proceedings of the International Conference of the IEEE Engineering in Medicine and Biology Society; 2007. [Google Scholar]
- Tzanis, G.; Berberidis, C.; Vlahavas, I. StackTIS: A stacked generalization approach for effective prediction of translation initiation sites. Computers in Biology and Medicine 2012, 42, 61–69. [Google Scholar] [CrossRef]
- Solovyev, V.; Umarov, R. Prediction of prokaryotic and eukaryotic promoters using convolutional deep learning neural networks. arXiv preprint arXiv:1610.00121, arXiv:1610.00121 2016.
- Min, X.; Zeng, W.; Chen, S.; Chen, N.; Chen, T.; Jiang, R. Predicting enhancers with deep convolutional neural networks. BMC bioinformatics 2017, 18, 478. [Google Scholar] [CrossRef]
- Yi, Z.; Liu, X.; Macleod, J.N.; Liu, J. DeepSplice: Deep classification of novel splice junctions revealed by RNA-seq. In Proceedings of the IEEE International Conference on Bioinformatics and Biomedicine; 2017. [Google Scholar]
- Du, X.; Yao, Y.; Diao, Y.; Zhu, H.; Zhang, Y.; Li, S. DeepSS: Exploring Splice Site Motif Through Convolutional Neural Network Directly From DNA Sequence. IEEE Access 2018, 6, 32958–32978. [Google Scholar] [CrossRef]
- Zuallaert, J.; Godin, F.; Kim, M.; Soete, A.; Saeys, Y.; De Neve, W. SpliceRover: interpretable convolutional neural networks for improved splice site prediction. Bioinformatics 2018, 34, 4180–4188. [Google Scholar] [CrossRef] [PubMed]
- Wei, C.; Zhang, J.; Yuan, X.; He, Z.; Liu, G.; Wu, J. Neurotis: Enhancing the prediction of translation initiation sites in mrna sequences via a hybrid dependency network and deep learning framework. Knowledge-Based Systems 2021, 212, 106459. [Google Scholar] [CrossRef]
- Kirkpatrick, J.; Pascanu, R.; Rabinowitz, N.; Veness, J.; Desjardins, G.; Rusu, A.A.; Milan, K.; Quan, J.; Ramalho, T.; Grabska-Barwinska, A.; et al. Overcoming catastrophic forgetting in neural networks. Proceedings of the national academy of sciences 2017, 114, 3521–3526. [Google Scholar] [CrossRef] [PubMed]
- Lea, C.; Flynn, M.D.; Vidal, R.; Reiter, A.; Hager, G.D. Temporal convolutional networks for action segmentation and detection. In Proceedings of the proceedings of the IEEE Conference on Computer Vision and Pattern Recognition; 2017; pp. 156–165. [Google Scholar]
- Guo, Y.; Gu, S. Multi-Label Classification Using Conditional Dependency Networks. In Proceedings of the IJCAI 2011, Proceedings of the 22nd International Joint Conference on Artificial Intelligence, Barcelona, Catalonia, Spain, 16-22 July 2011. [Google Scholar]
- Li, S.; Farha, Y.A.; Liu, Y.; Cheng, M.M.; Gall, J. Ms-tcn++: Multi-stage temporal convolutional network for action segmentation. IEEE transactions on pattern analysis and machine intelligence 2020, 45, 6647–6658. [Google Scholar] [CrossRef]
- Collobert, R.; Weston, J.; Bottou, L.; Karlen, M.; Kavukcuoglu, K.; Kuksa, P. Natural language processing (almost) from scratch. Journal of machine learning research 2011, 12, 2493–2537. [Google Scholar]
- Li, L.; Fan, Y.; Tse, M.; Lin, K.Y. A review of applications in federated learning. Computers & Industrial Engineering 2020, 149, 106854. [Google Scholar]
- Huang, W.; Ye, M.; Du, B. Learn from others and be yourself in heterogeneous federated learning. In Proceedings of the Proceedings of the IEEE/CVF Conference on Computer Vision and Pattern Recognition, 2022, pp. 10143–10153.
- Hu, G.Q.; Zheng, X.; Zhu, H.Q.; She, Z.S. Prediction of translation initiation site for microbial genomes with TriTISA. Bioinformatics 2009, 25, 123–125. [Google Scholar] [CrossRef]
- Pérez-Rodríguez, J.; Arroyo-Peña, A.G.; García-Pedrajas, N. Improving translation initiation site and stop codon recognition by using more than two classes. Bioinformatics 2014, 30, 2702–2708. [Google Scholar] [CrossRef]
- Schum, D.A. The Evidential Foundations of Probabilistic Reasoning by David A. Schum; 1994.
- Goodfellow, I.; Bengio, Y.; Courville, A. Deep learning; MIT press, 2016.
- Li, W.; Godzik, A. Cd-hit: a fast program for clustering and comparing large sets of protein or nucleotide sequences. Bioinformatics 2006, 22, 1658–1659. [Google Scholar] [CrossRef]
- Mitchell, T.M.; Carbonell, J.G.; Michalski, R.S. Machine Learning; 1997.
- Davis, J.; Goadrich, M. The relationship between Precision-Recall and ROC curves. In Proceedings of the Proceedings of the 23rd international conference on Machine learning, 2006, pp. 233–240.
- Srivastava, N.; Hinton, G.; Krizhevsky, A.; Sutskever, I.; Salakhutdinov, R. Dropout: A Simple Way to Prevent Neural Networks from Overfitting. Journal of Machine Learning Research 2014, 15, 1929–1958. [Google Scholar]
- Treadgold, N.K.; Gedeon, T.D. Exploring constructive cascade networks. IEEE Transactions on Neural Networks 1999, 10, 1335–1350. [Google Scholar] [CrossRef]
Figure 1.
Illustration of the structural information exploited in the paper. 1) CDS is continuous and codon labels are consistent with a multiply of three; 2) The positive TIS is always located in the first reading frame, but negative TISs, and are located in different reading frames.
Figure 1.
Illustration of the structural information exploited in the paper. 1) CDS is continuous and codon labels are consistent with a multiply of three; 2) The positive TIS is always located in the first reading frame, but negative TISs, and are located in different reading frames.
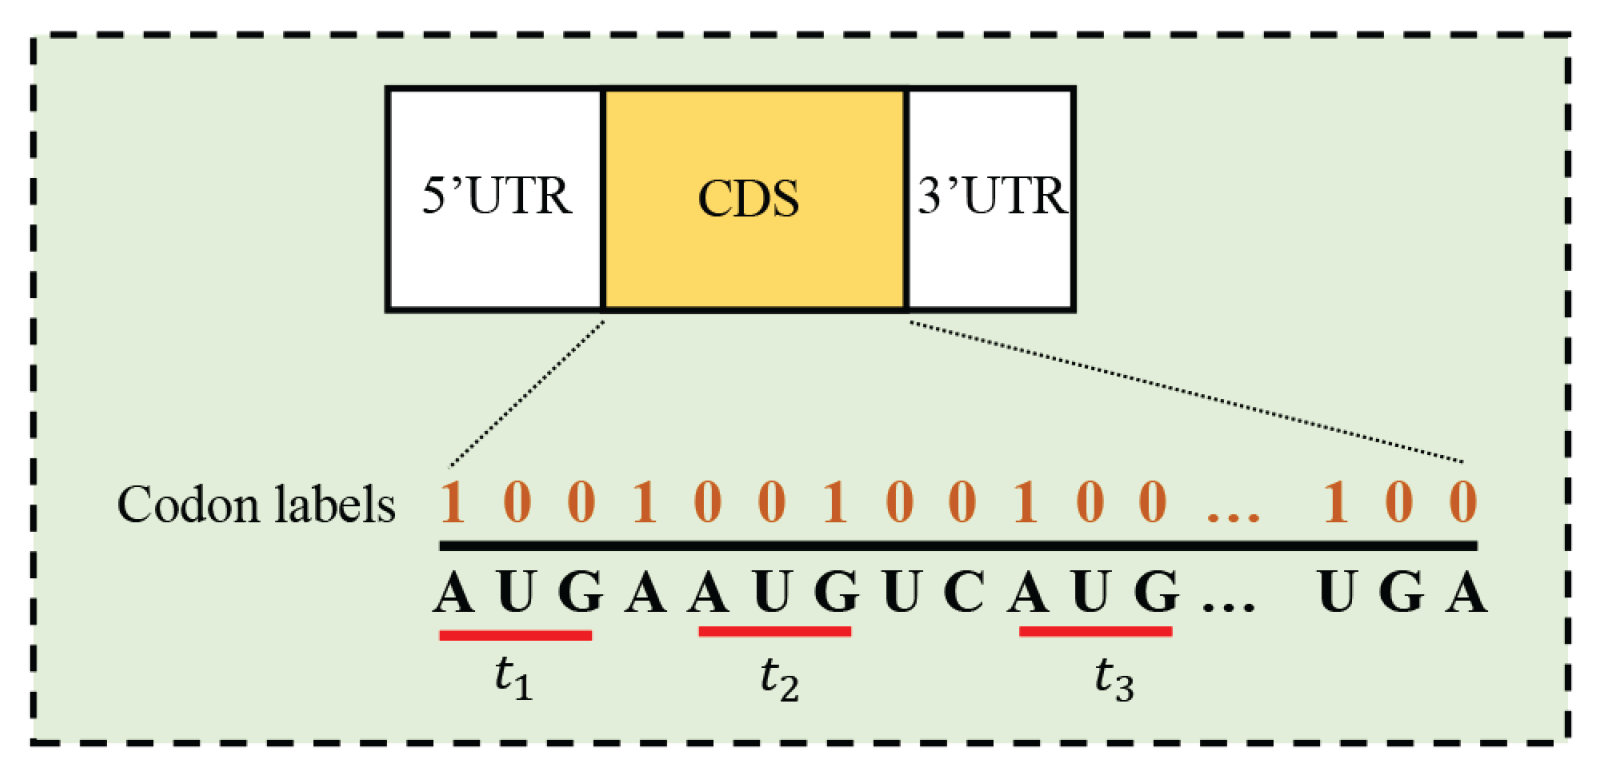
Figure 2.
The dependency network representation of NeuroTIS (left) and NeuroTIS+ (right) in which nodes denote random variables and arcs denote probabilistic dependencies between variables, dashed and solid circle directions respectively denote weak and strong dependency relationship among variables.
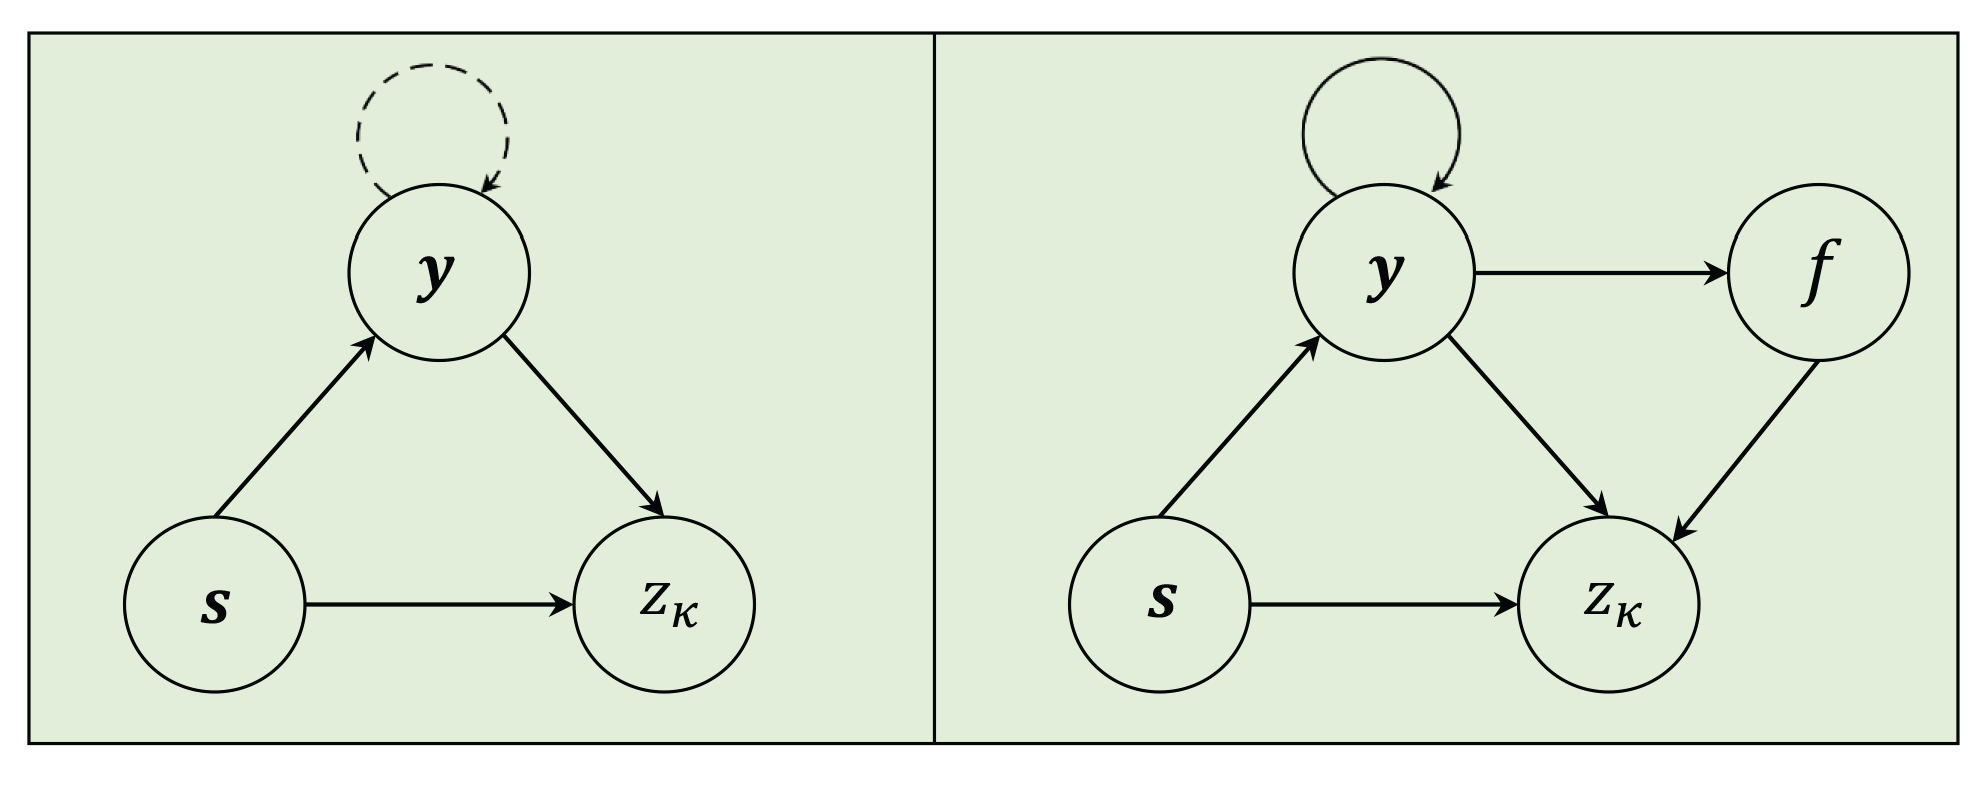
Figure 4.
Training and test process of NeuroTIS+ on human dataset. (A) without grouping; (B) CNN0 with group 0; (C) CNN1 with group 1; (D) CNN2 with group 2.
Figure 4.
Training and test process of NeuroTIS+ on human dataset. (A) without grouping; (B) CNN0 with group 0; (C) CNN1 with group 1; (D) CNN2 with group 2.

Figure 5.
Comparison of the ROC of different methods on (A) Human dataset; (B) Mouse dataset.
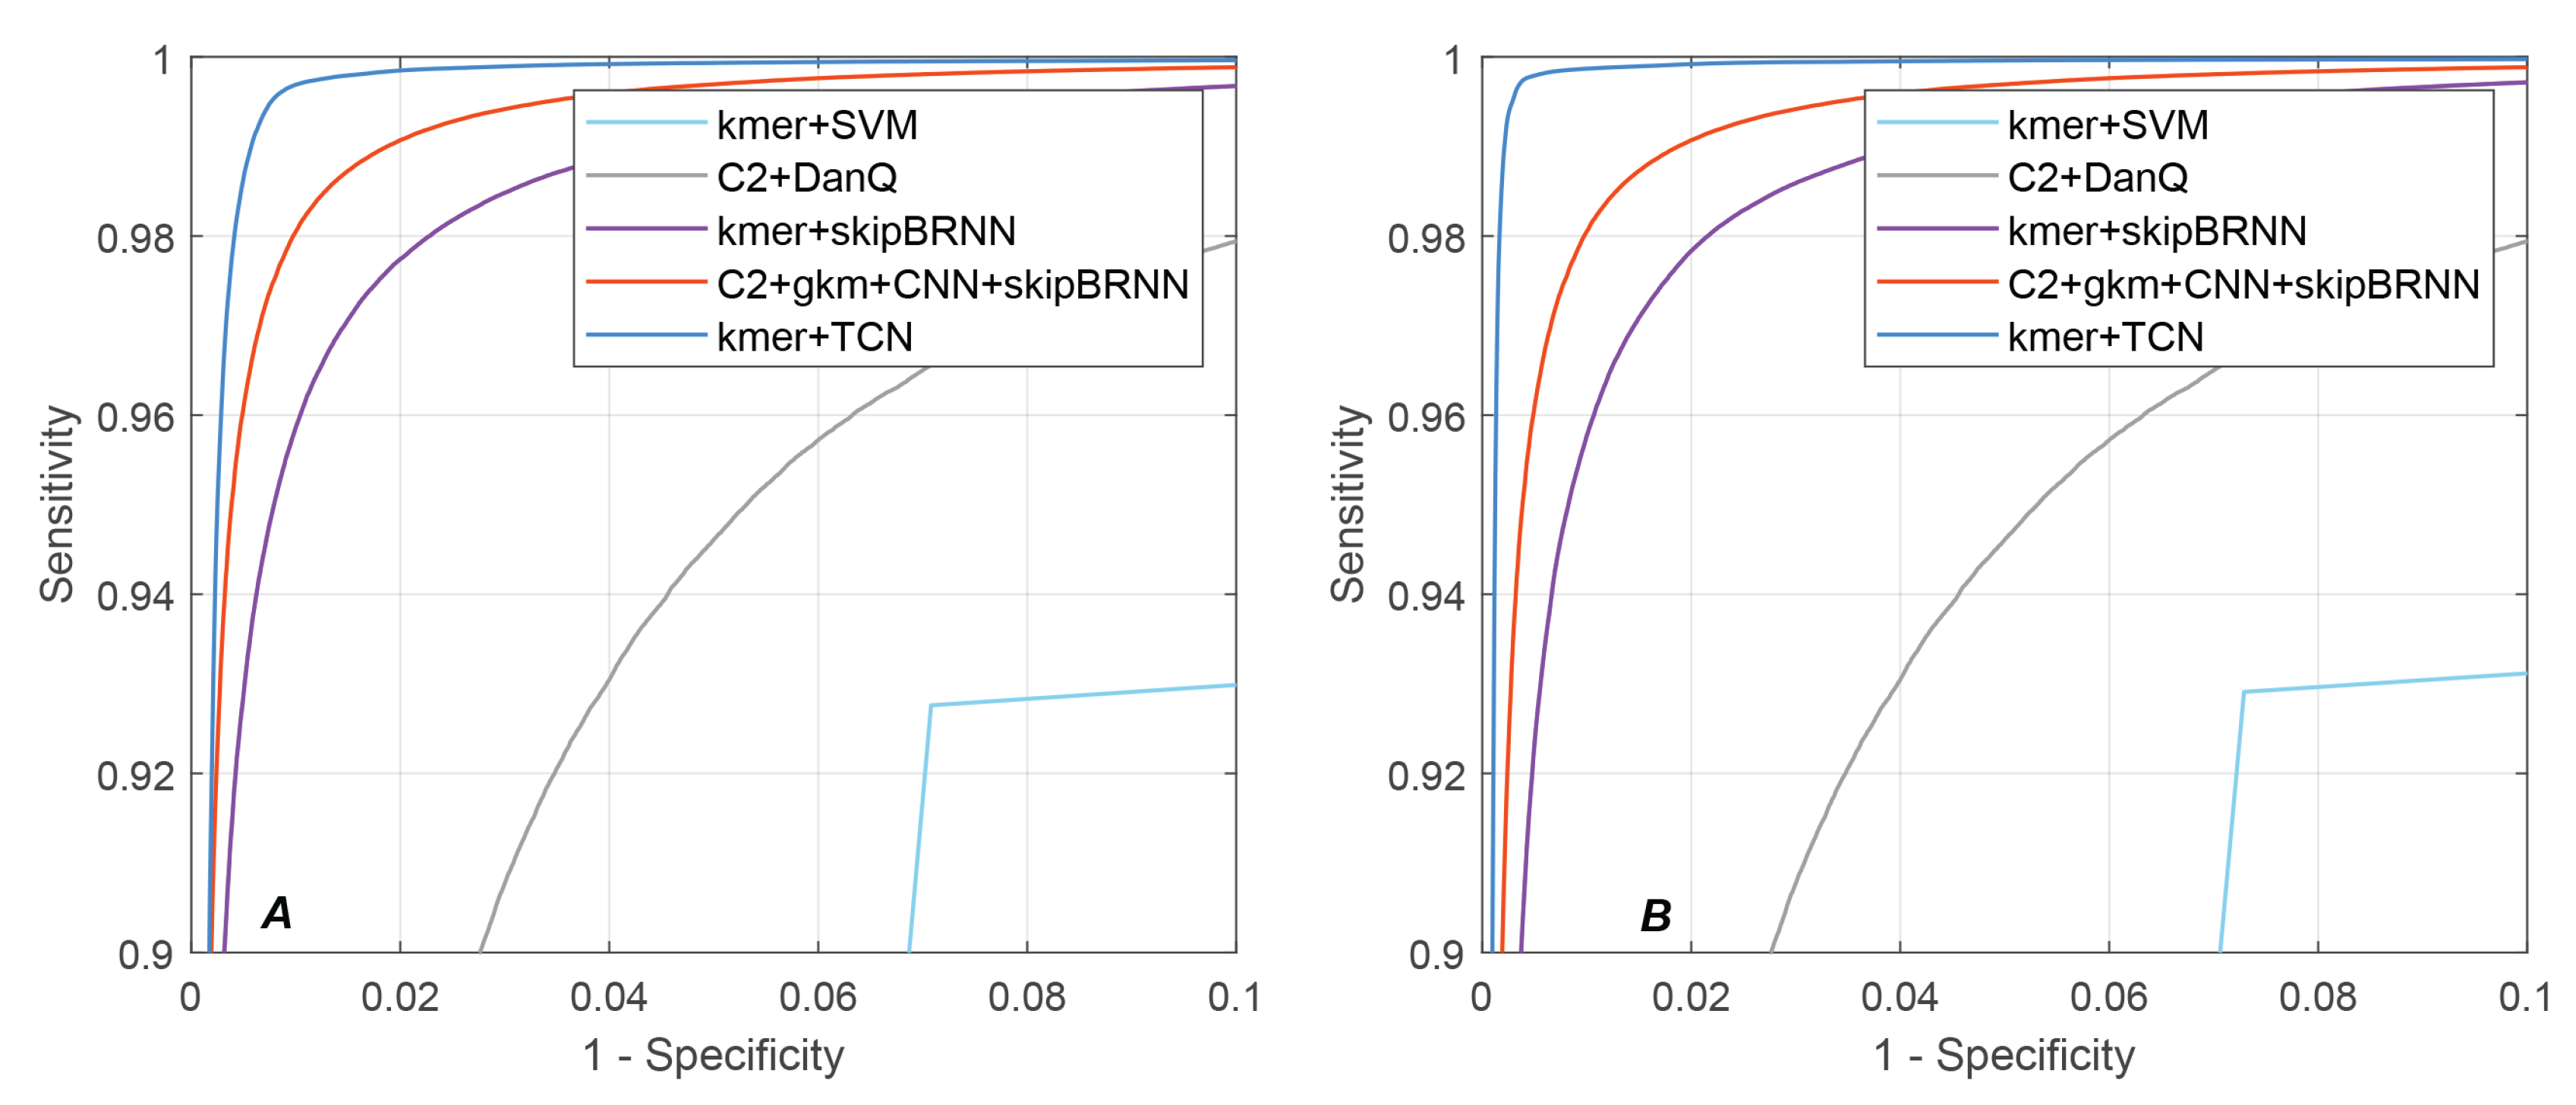
Figure 6.
Comparison of ROC and PRC results of different methods. (A) the ROC curve on Human dataset; (B) the ROC curve on Mouse dataset; (C) the precision-recall curve on Human dataset; (D) the precision-recall curve on Mouse dataset.
Figure 6.
Comparison of ROC and PRC results of different methods. (A) the ROC curve on Human dataset; (B) the ROC curve on Mouse dataset; (C) the precision-recall curve on Human dataset; (D) the precision-recall curve on Mouse dataset.
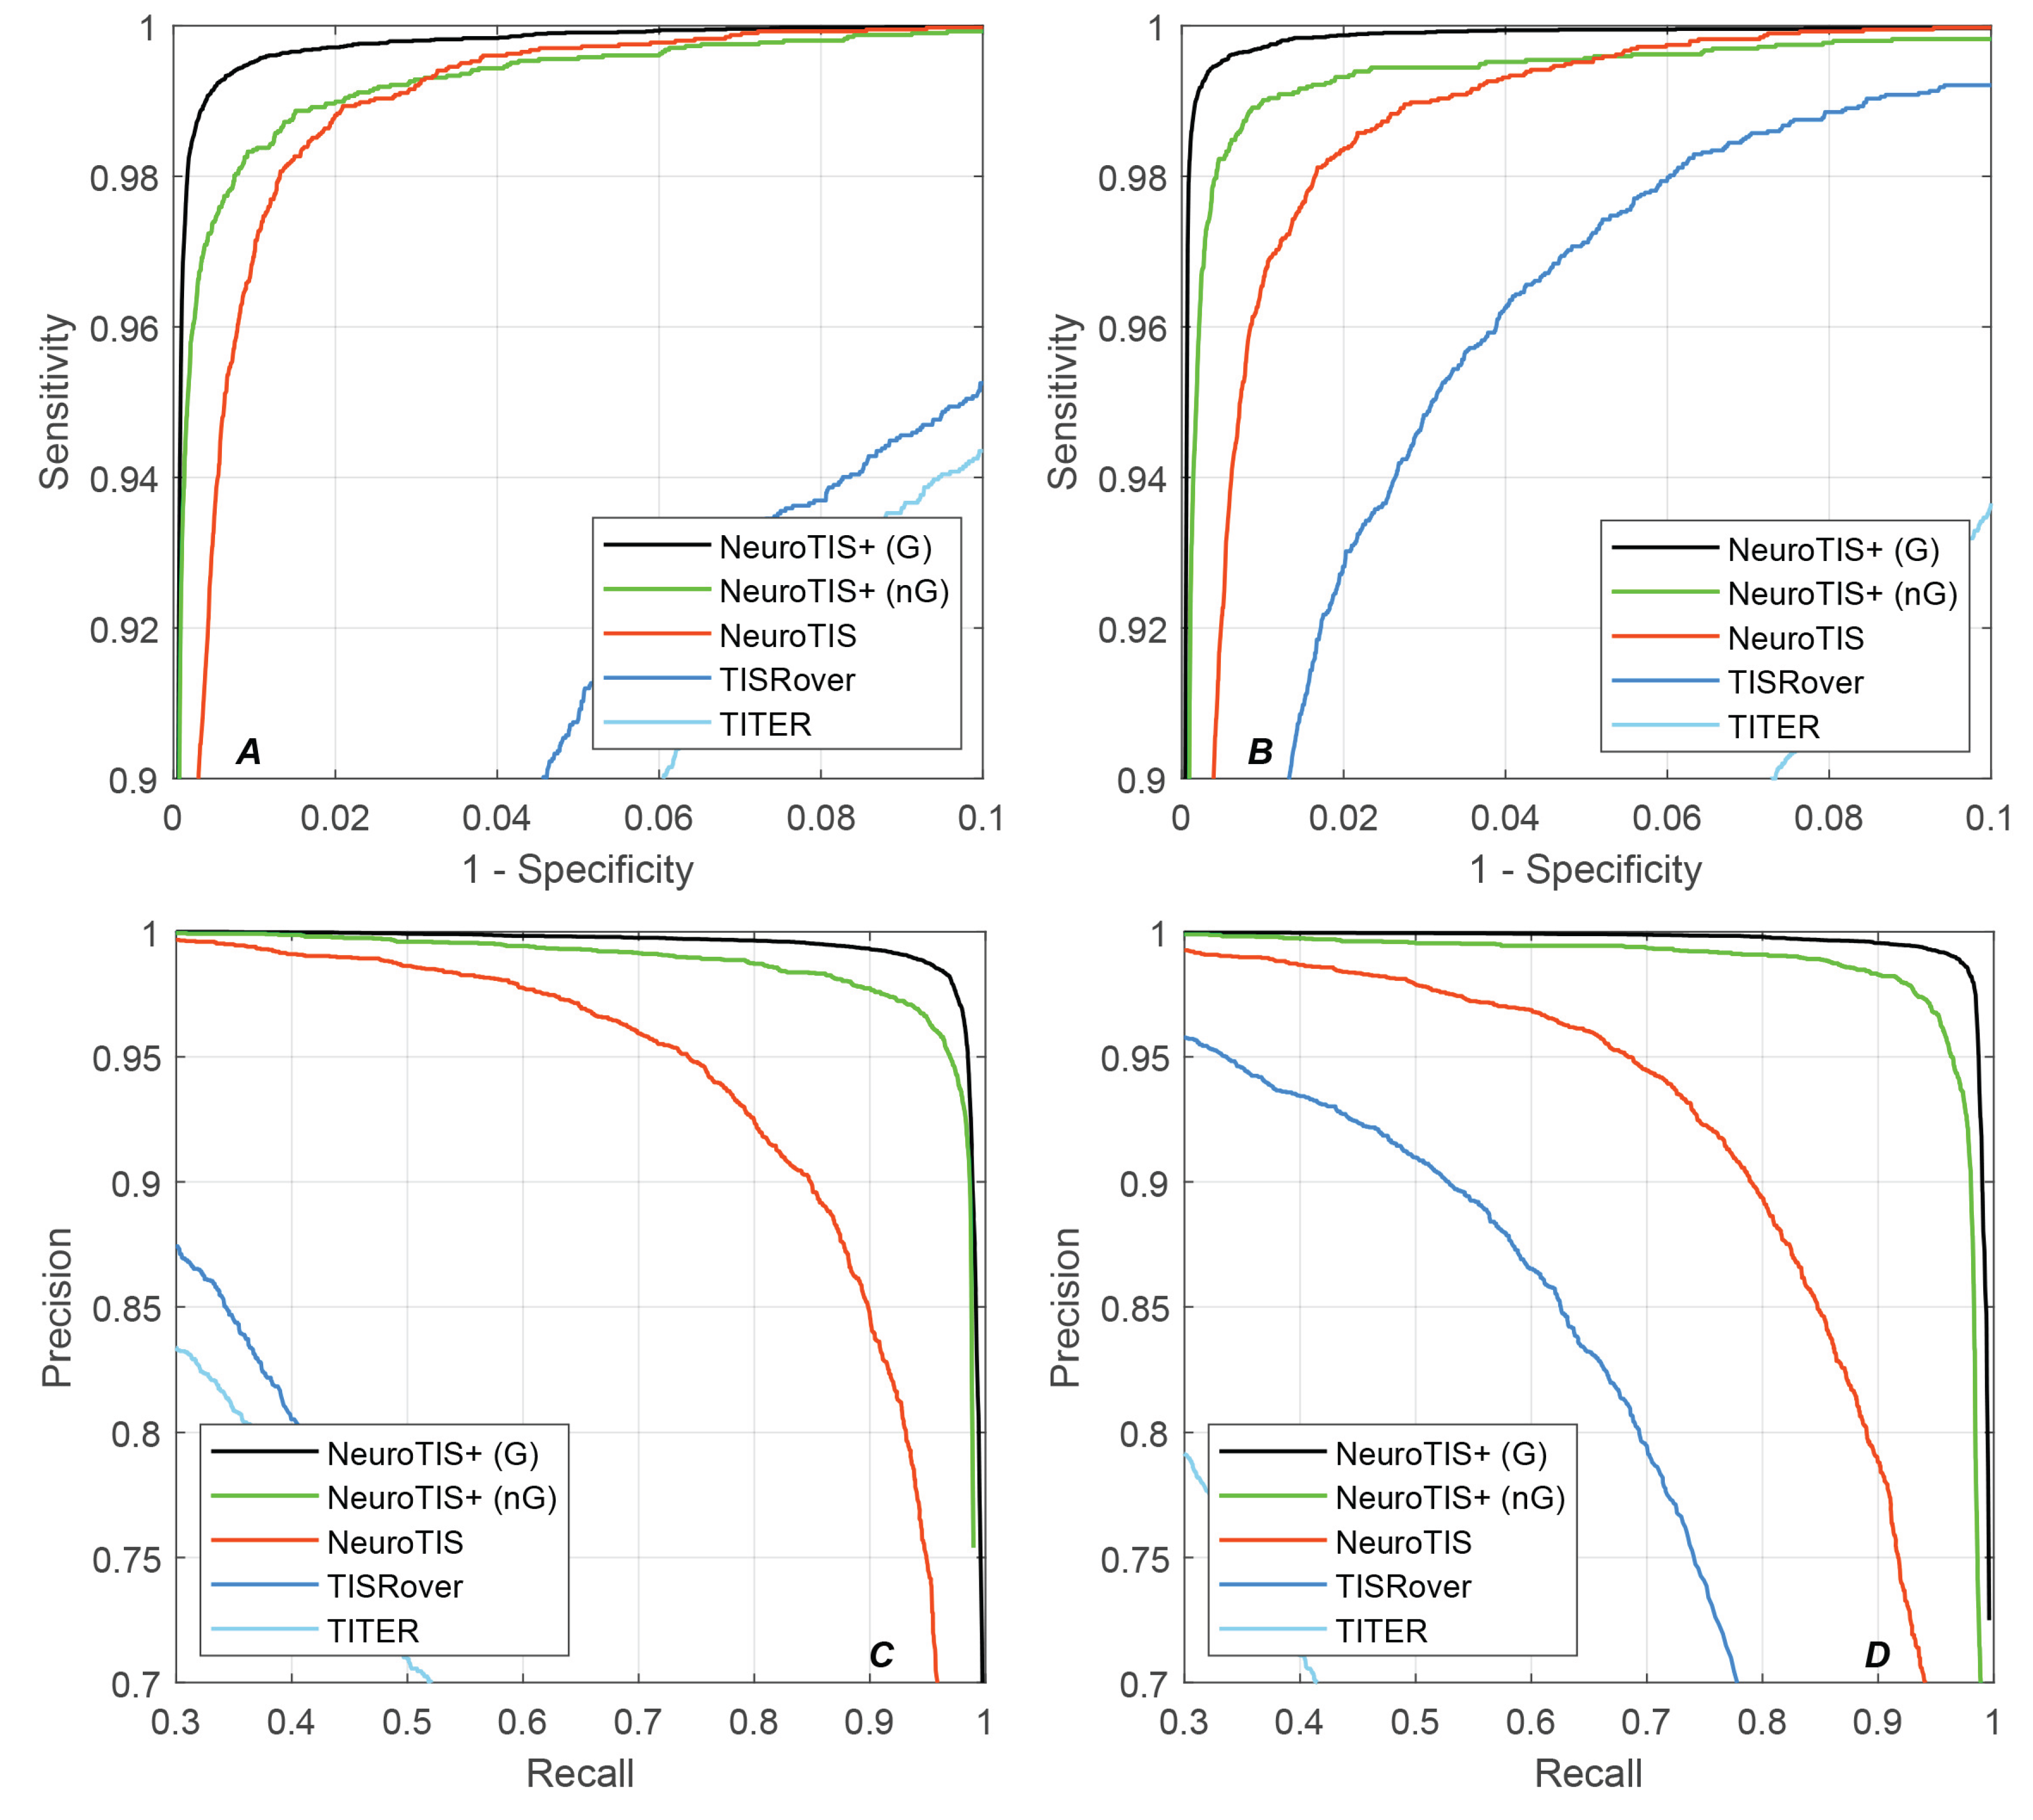

Table 1.
Performance comparison of NeuroTIS+ with the other state-of-the-art methods on Human dataset.
Table 1.
Performance comparison of NeuroTIS+ with the other state-of-the-art methods on Human dataset.
| Human | SN(%) | SP(%) | PRE(%) | ACC(%) | F1-score | auROC | auPRC | MCC |
|---|---|---|---|---|---|---|---|---|
| TITER | 0.02 | 100 | - | 98.31 | - | 0.9788 | 0.6186 | - |
| TISRover | 92.52 | 93.77 | 20.26 | 93.75 | 0.3324 | 0.9760 | 0.3998 | 0.4167 |
| NeuroTIS | 98.19 | 98.54 | 56.29 | 98.53 | 0.7156 | 0.9985 | 0.9150 | 0.7377 |
| NeuroTIS+ (nG) | 98.38 | 98.94 | 84.29 | 98.91 | 0.9079 | 0.9989 | 0.9266 | 0.9052 |
| NeuroTIS+ (G) | 99.08 | 99.56 | 92.87 | 99.53 | 0.9588 | 0.9996 | 0.9385 | 0.9569 |
Table 2.
Performance comparison of NeuroTIS+ with the other state-of-the-art methods on Mouse dataset.
Table 2.
Performance comparison of NeuroTIS+ with the other state-of-the-art methods on Mouse dataset.
| Mouse | SN(%) | SP(%) | PRE(%) | ACC(%) | F1-score | auROC | auPRC | MCC |
|---|---|---|---|---|---|---|---|---|
| TITER | 0.03 | 100 | - | 98.36 | - | 0.9766 | 0.5879 | - |
| TISRover | 95.29 | 96.74 | 32.52 | 96.72 | 0.4849 | 0.9936 | 0.7399 | 0.5463 |
| NeuroTIS | 98.12 | 98.31 | 48.90 | 98.30 | 0.6527 | 0.9982 | 0.9036 | 0.6865 |
| NeuroTIS+ (nG) | 98.63 | 99.26 | 86.96 | 99.23 | 0.9243 | 0.9991 | 0.9363 | 0.9223 |
| NeuroTIS+ (G) | 99.26 | 99.73 | 94.85 | 99.71 | 0.9701 | 0.9997 | 0.9460 | 0.9688 |
Table 3.
Performance comparison of kmer+TCN with existing state-of-the-art methods on Human and Mouse datasets.
Table 3.
Performance comparison of kmer+TCN with existing state-of-the-art methods on Human and Mouse datasets.
| Methods | Human | Mouse | ||||
|---|---|---|---|---|---|---|
| SN(%) | SP(%) | auROC | SN(%) | SP(%) | auROC | |
| kmer+SVM | 92.76 | 92.92 | - | 92.91 | 92.71 | - |
| C2+DanQ | 95.47 | 94.27 | 0.9889 | 95.32 | 94.37 | 0.9884 |
| kmer+skipBRNN | 98.25 | 97.39 | 0.9975 | 97.93 | 97.91 | 0.9973 |
| C2+gkm+CNN+skipBRNN | 99.08 | 97.97 | 0.9986 | 99.10 | 98.14 | 0.9985 |
| kmer+TCN | 99.64 | 99.67 | 0.9995 | 99.76 | 98.74 | 0.9988 |
Table 4.
Brief description of time cost on Human and Mouse datasets with regard to NeuroTIS+
| Dataset | Coding Number | TISs Number | Time cost (min) | |
| kmer+TCN | frame-specific CNN | |||
| Human | 9,545,915 | 32780 | 20 | 0.8 |
| Mouse | 7,883,216 | 17420 | 15 | 0.5 |
Disclaimer/Publisher’s Note: The statements, opinions and data contained in all publications are solely those of the individual author(s) and contributor(s) and not of MDPI and/or the editor(s). MDPI and/or the editor(s) disclaim responsibility for any injury to people or property resulting from any ideas, methods, instructions or products referred to in the content. |
© 2025 by the authors. Licensee MDPI, Basel, Switzerland. This article is an open access article distributed under the terms and conditions of the Creative Commons Attribution (CC BY) license (http://creativecommons.org/licenses/by/4.0/).
Copyright: This open access article is published under a Creative Commons CC BY 4.0 license, which permit the free download, distribution, and reuse, provided that the author and preprint are cited in any reuse.


