Submitted:
11 June 2025
Posted:
12 June 2025
You are already at the latest version
Abstract
Sea lice (Caligus rogercresseyi), represents a major constraint to Atlantic salmon (Salmo salar) aquaculture, affecting both fish health and production efficiency. Genetic variation for sea lice load has been previously documented in Atlantic salmon. To investigate the basis of the variation in sea lice burden at a transcriptomic level, two consecutive challenge trials were conducted. Infestation success rates of 47.5% and 43.5% were achieved, indicating high parasite attachment efficiency. For transcriptomic analysis, a total of 85 fish were selected based on their phenotypic values of parasite load, comprising 42 individuals with low lice burden and 43 with high lice burden. To elucidate the regulatory mechanisms underlying sea lice load variation, allele-specific expression (ASE) analysis was integrated with differential gene expression profiling. A total of 60 genes (33 overexpressed, 27 underexpressed) exhibited significant ASE (p < 0.05), indicating the presence of cis-regulatory variants influencing key host response pathways. Notably, overexpressed ASE genes included structural and immune-related components such as Keratin 15, Collagen types IV and V, TRIM16, and Angiopoietin-1-like, which are associated with epithelial integrity, inflammation, and tissue remodeling. In contrast, underexpressed ASE genes such as SOCS3, CSF3R, and Neutrophil cytosolic factor suggest genotype-dependent modulation of cytokine signaling and oxidative stress responses. Several ASE genes co-localized with previously reported QTLs for sea lice burden variation, supporting a model in which cis-regulatory variation contributes to phenotypic variation in host response against the parasite. These findings underscore the utility of ASE analysis for the identification of functionally relevant genomic regions and provide promising candidates for genetic improvement and precision breeding.
Keywords:
Sea Lice
; RNA-seq
; DEG
; ASE
1. Introduction
Aquaculture is the fastest-growing sector of animal protein production globally, reaching 223.2 million tonnes in 2022(FAO 2024). Among aquaculture species, salmonids represent a major economic driver, with growth rate, disease resistance, and carcass quality being primary traits targeted in selective breeding programs (Lhorente et al., 2019). In Chile, harvest weight is the main selection criterion, typically around 3 kg in coho salmon and rainbow trout, and 4.5–5.5 kg in Atlantic salmon. However, parasitic infections such as those caused by Caligus rogercresseyi (sea lice) represent a major constraint to the sustainability and productivity of salmon aquaculture (Bravo et al., 2014).
Control strategies have relied on antiparasitic treatments, though resistance has emerged (Helgesen et al., 2015), prompting increased interest in genetic resistance as a sustainable alternative (Gjedrem, 2015). Heritability estimates for resistance to sea lice in Salmo salar range from 0.12 to 0.32 (Cáceres et al., 2021; Lhorente et al., 2012; Yáñez et al., 2014), indicating sufficient genetic variation for improvement.
Sea lice impact growth performance and productivity, raising questions about the genetic relationship between growth and resistance. Favorable genetic correlations (e.g., r₉ = -0.32) suggest that selection for growth may reduce parasite burden (Yáñez et al., 2014). Nevertheless, the effect of infestation on growth dynamics remains unclear. Growth under parasite challenge may represent a distinct trait from growth in uninfected conditions, aligning with the concepts of tolerance and resilience (Anacleto et al., 2019; Bishop & Woolliams, 2014). Understanding the genetic basis of these traits is crucial for developing robust breeding strategies that improve both productivity and disease resistance in salmon aquaculture.
Genome-wide association studies (GWAS) have been employed as a genomic approach to elucidate the genetic architecture underlying economically important traits in aquaculture species, including Atlantic salmon (Salmo salar) (Gutierrez et al., 2015; Tsai et al., 2016; Yoshida et al., 2017). These studies have consistently demonstrated that growth-related traits are polygenic in nature, influenced by numerous loci each contributing small to moderate effects. Similarly, resistance to Caligus rogercresseyi has been characterized as a polygenic trait, with no loci of major effect detected to date (Gjerde et al., 2014; Correa et al., 2017; Tsai et al., 2016). Notably, Robledo et al., (2019) identified three quantitative trait loci (QTLs) associated with sea lice resistance that collectively accounted for 7–13% of the genetic variance, although only one locus reached genome-wide significance.
Gene expression profiling technologies, such as RNA sequencing (RNA-seq) (Wolf, 2013), offer a powerful tool to investigate host transcriptional responses under different experimental conditions or phenotypic groups. This approach allows for a comprehensive understanding of host–parasite interactions by identifying genes and molecular pathways involved in the response to infestation. Comparative transcriptomic studies between resistant and susceptible salmonid species, such as coho salmon (Oncorhynchus kisutch) or pink salmon (O. gorbuscha) versus Atlantic salmon, have demonstrated key differences in the activation of innate immune responses (Braden et al., 2015; Fast, 2014). In resistant species, increased expression of pattern recognition receptors (PRRs), such as C-type lectins, proinflammatory cytokines including interleukin-1β, and mechanisms related to iron sequestration or depletion have been reported (Sutherland et al., 2014).
Beyond interspecies comparisons, transcriptomic analyses of individuals with contrasting phenotypes can help reveal candidate genes involved in trait variation. However, studies examining differential gene expression between resistant and susceptible Atlantic salmon families in response to sea lice infestation remain limited. One study analyzing 32 immune-related genes indicated that resistant fish might avoid parasite-induced immunosuppression (Holm et al., 2015).
Additionally, allele-specific expression (ASE) has emerged as a complementary tool to study the functional effects of genetic variants in aquaculture species. ASE allows for the detection of differences in expression between paternal and maternal alleles within the same individual, which can reveal cis-acting regulatory variants that directly affect genes relevant to the immune response. In Atlantic salmon, for example, ASE has been used to identify functional variants in disease-resistance-related genes such as cd83 and tlr5, where one allele shows higher expression in more resistant individuals (Robledo et al., 2019). These analyses have proven useful in prioritizing variants in GWAS studies, providing a functional dimension that helps establish causal links between genotype and phenotype.
In rainbow trout, ASE has also been used to detect expression biases in genes involved in metabolism and immune response under thermal stress and pathogen exposure conditions (Ali et al., 2020). Integrating ASE data with transcriptomics and functional genomics represents a promising approach to enhance the accuracy of genetic selection in aquaculture, facilitating the identification of robust biomarkers for resistance and tolerance.
Moreover, to date, no published studies have investigated whether genetic variants contribute to allelic-specific expression (ASE) associated with susceptibility to sea lice (Caligus rogercresseyi) infestation. This is particularly relevant for aquaculture breeding programs aiming to improve multiple traits simultaneously. Identifying pleiotropic loci or shared regulatory networks could enhance selection strategies by enabling genomic predictions that account for complex trait interdependencies. Thus, integrative approaches combining high-resolution genotyping, RNA-seq, ASE, and eQTL mapping hold great promise for unraveling the genetic basis of economically important traits in Atlantic salmon and other aquaculture species.
Collectively, this study aims to advance the current understanding of the genetic mechanisms underlying host resistance to Caligus rogercresseyi in Atlantic salmon by identifying loci exhibiting allele-specific expression. The insights gained from this work have the potential to inform the implementation of marker-assisted and genomic selection strategies, contributing to the development of more resilient and productive breeding populations through the identification of functionally relevant genomic targets.
2. Materials & Methods
2.1. Animals
The challenge with Caligus rogercresseyi was conducted following the procedure described by Yáñez et al. (2014). A total of 1,200 fish were distributed in a 7 m³ pond with saltwater at 10 ppt at the ATC Patagonia Technological Center. A sanitary check was performed prior to their entry into the experimental center. RT-PCR was conducted on 15 samples of kidney and liver tissue to verify that the animals were free of Flavobacterium p., Infectious Pancreatic Necrosis Virus (IPNv), Piscirickettsia salmonis, Renibacterium salmoninarum, and Piscine orthoreovirus.
A 15-day acclimatization period was implemented, during which salinity was gradually increased to 100% seawater. Acclimatization conditions were maintained at a temperature of 12 ± 1°C, pH of 7.4 ± 0.1, and oxygen saturation of 98 ± 2.7%. Culture conditions, including temperature, oxygen, pH, and salinity, were monitored three times daily at 09:00, 12:30, and 16:30 using OxyGuard® Handy Polaris portable equipment. Prior to the challenge test, a second measurement of body weight (CBW) and length (CBL) was recorded for each fish.
To perform the infestation, copepodites provided by the Crustacean Ecophysiology Laboratory of the Universidad Austral de Chile were used. Upon arrival at the ATC Patagonia Technological Center, copepodite cultures were checked for developmental stage, viability, and behavior. The copepodites were maintained at a temperature of 10 ± 0.5°C. Infestation with C. rogercresseyi at the copepodite stage involved introducing 108,000 parasites (approximately 90 copepodites per fish) into the pond. The infestation process consisted of introducing the copepodites into the pond, kept in total darkness by covering it with a black tarp, and maintaining static water flow for 5 hours. During this period, oxygen and temperature were continuously monitored and recorded, with manual oxygen supplementation as needed. After the infestation period, the water flow gradually restored.
Four days post-challenge, 1,157 fish that had successfully completed the acclimatization period were evaluated. Parasite counts were conducted, differentiating parasite load by location (body, fins, and total load), and individual data were collected for PIT tag readings, weight, and length. This procedure was repeated on days 10 and 15 post-infestation under the same experimental conditions. Fish were anesthetized using 20% benzocaine (20 mL/100 liters of water) before sampling and were subsequently returned to their pond of origin.
Following the first infestation and parasite count, the fish were deloused by gradually reducing salinity over a 14-day period. Salinity was lowered to 0 ppt and maintained for 2–3 days, then gradually increased back to full-strength seawater. This procedure effectively removed all attached parasites, as confirmed by visual inspection. A total of 29 fish mortalities were recorded following the first delousing procedure.
The second challenge was conducted under the same conditions and procedures as the first, 12 days after the conclusion of the previous challenge. This round included 1,021 fish and resulted in 35 recorded mortalities. At the conclusion of the study, the fish were euthanized to assess variables relevant to the trial’s objectives, including parasite burden, body weight, and body length. Final body weight (FBW) and final body length (FBL) were recorded for each fish. Passive integrated transponder (PIT) tags were used to accurately link each individual to its respective phenotypic data
Several standardized phenotypic definitions were used. Body weight was recorded at three key stages: initial body weight (IBW), measured at the beginning of the acclimation period; challenge body weight (CBW), recorded at the start of each experimental infestation; and final body weight (FBW), measured at the end of each challenge.
Parasite load was assessed through lice count (LC), which corresponded to the number of sea lice manually counted on the skin surface of each fish. Given that LC data typically exhibit a left-skewed distribution, log transformation is often applied to approximate normality and ensure the assumptions of parametric models are met (Ødegård et al., 2014). To account for host body size and surface area available for parasite attachment, lice density (LD) was calculated as (LC + 1) divided by the cubic root of the square of FBW, where FBW is expressed in grams. This surface-area-corrected measure, proposed by Ødegård et al. (2014), is defined as:
Log-transformed lice density (LogLD): To normalize lice density data, a natural logarithm transformation was applied, defined as:
The LC value increased by 1 when individuals had no attached parasites, ensuring the correct application of the logarithmic transformation.
2.2. Transcriptome sequencing
The RNA-seq experiment biopsies were taken from the skin near the caudal fin of 951 animals, of which 85 animals were selected for RNA-seq sequencing. These were chosen by the sum of parasite load corrected by their weight in all measurements, considering 43 with higher total load and 42 with lower total load, thus considering both extremes of sea lice load. Tissue samples were preserved in RNA Later and stored at -80°C for total mRNA purification. They were purified from approximately 5 mg of tissue using a standard TRI reagent RNA extraction protocol. After RNA quality control, libraries were prepared using the Illumina Truseq mRNA library preparation kit protocol. The BGI laboratory performed the sequencing and mRNA extraction, considering a 150 bp paired-end sequencing strategy.
2.3. RNA-seq quality control and quantification
The quality of the RNA sequences was evaluated using FastQC v.0.11.5 (http://www.bioinformatics.babraham.ac.uk/projects/fastqc/). Residual adapter sequences were removed using Trimmomatic v.0.32 (Bolger et al., 2014). The filtered reads were aligned to the latest version of the Atlantic salmon reference genome Ssal_v3.1 (GenBank accession: GCA_905237065.2) using the RNA-seq aligner STAR (Dobin et al., 2013). Transcript abundance was quantified using the RSEM software (Li & Dewey, 2011). The abundance of transcripts was estimated using the Expectation-Maximization (EM) algorithm, with the default parameter option “--paired-end,” based on the gene annotation file (GFF) and the Atlantic salmon genome sequences (GenBank: GCA_905237065.2). RSEM generated a reference transcript set. Subsequently, the RNA-Seq read set was aligned with the reference transcripts. The alignments produced by RSEM were used to infer transcript abundance in transcripts per million (TPM).
After this, the GATK module, ASEReadCounter (Geraldine A. Van der Auwera & Brian D. O’Connor, 2020), was used to calculate the read count per allele for allele-specific expression analysis from the BAM files generated by alignment with STAR (Dobin et al., 2013). Using the allele-specific read count, differential gene expression (DEGs) characterization was performed using the DESeq2 software (Love et al., 2014). To control false discovery rates (FDR) in multiple hypothesis tests, p-values calculated by DESeq2 were adjusted. Subsequently, a list of differentially expressed transcripts with p-values less than 0.05 and log2FC (fold change in gene expression) > 1 for upregulated genes and log2FC < -1 for downregulated genes was generated.
The groups of downregulated and upregulated genes were used to calculate allele-specific expression (ASE), which was quantified through the differential abundance of allele copies of a transcript to identify putative regulatory polymorphisms acting in cis. The R package ASEP (Allele-Specific Expression Analysis in a Population, version 0.1.0) (Fan et al., 2020) was used. The “ASE_detection” function of the ASEP package was applied to detect significant ASE effects at the gene level (p-value <0.05) within the population and grouped by upregulated and downregulated genes. Gene annotation of the identified genes was performed using the R package bioMart (Durinck et al., 2009), which uses the EMBL-EBI database, European Bioinformatics Institute (Madeira et al., 2022), and the Atlantic salmon reference genome Ssal_v3.1.
3. Results
Fish were weighed and the number of attached sea lice counted on days 4, 10, and 15 of both the first and second challenge trials (Table 1). The average body weight prior to the first challenge was 168.64 ± 24.37 g, increasing to 170.56 ± 28.49 g at the end of the first challenge, and reaching 184.04 ± 31.71 g by the conclusion of the second challenge.
Regarding sea lice counts, an average of 18.99 ± 8.67 parasites per fish was recorded at the end of the first challenge, and 17.41 ± 6.75 at the end of the second challenge. Infestation success was calculated as the average proportion of parasites successfully infesting a host relative to the total number of parasites available per host during the infestation period (Samsing et al., 2014). This metric was evaluated at the end of each challenge, yielding infestation success rates of 47.46% and 43.51% for the first and second challenges, respectively.
The distribution of parasite burden throughout the infestation is illustrated in Figure 1. A slight increase in the number of attached parasites was observed during the first challenge, whereas a decrease over time in attached parasite numbers was evident during the second challenge.
Table 1 summarizes the descriptive statistics for fish weight, length, and sea lice counts recorded at different time points during two consecutive infestation challenges. Fish weight increased steadily from an average of 168.64 g pre-challenge to 184.04 g at the end of the second challenge, indicating ongoing growth throughout the experimental period. Length measurements remained relatively stable with low variability (CV ≈ 4.8%). Sea lice counts showed a moderate decrease from day 4 to day 15 post-infestation in both challenges, with a more pronounced reduction observed in the second challenge (from 19.64 to 17.41 lice per fish). Parasite burden variability was considerable (CV > 38%), highlighting individual differences in host susceptibility or parasite attachment success. The consistent parasite loads alongside increasing host size suggest a dynamic interaction influenced by host immune responses and possibly environmental or stress-related factors. Overall, these results underscore the importance of repeated longitudinal measurements for accurately characterizing infestation dynamics and host resilience in Atlantic salmon.
3.1. RNA seq
Paired-end RNA sequencing reads were aligned to the Atlantic salmon reference genome (Ssal_v3.1; GenBank accession: GCA_905237065.2) using the STAR aligner (Dobin et al., 2013). A total of 170 paired-end reads (85 forward and 85 reverse) were aligned per sample, and resulting alignments were output in BAM format. The STAR --quantMode TranscriptomeSAM GeneCounts option was enabled to simultaneously generate transcriptome-aligned reads and per-gene read counts for downstream analyses.
Transcript quantification was performed using RSEM (Li & Dewey, 2011), which utilizes the transcriptome-aligned BAM files produced by STAR to estimate transcript abundance. This approach yielded TPM (transcripts per million) matrices at both gene and isoform levels.
For allele-specific expression (ASE) analysis, we followed the GATK Best Practices workflow for RNA-seq variant discovery. A sequence dictionary was generated with GATK CreateSequenceDictionary, and spliced reads containing ‘N’ operators in their CIGAR strings were processed using GATK SplitNCigarReads. This step splits reads at intronic regions (i.e., at each N in the CIGAR string), producing k+1 new reads per original read, where k is the number of N operations. This transformation facilitates accurate variant calling and enables clean allele counting by removing artifacts associated with spliced alignments.
Raw allele counts were obtained using GATK ASEReadCounter, which outputs per-sample tables including genomic position, gene ID, reference allele, alternate allele, and their respective read counts. These counts were used for downstream ASE analyses.
Variant calling was performed using GATK HaplotypeCaller, followed by the complete GATK RNA-seq variant discovery pipeline. This resulted in the identification of 730,315 single nucleotide polymorphisms (SNPs) across the RNA-seq dataset.
3.2. Allele-Specific Expression Analysis
To detect and quantify allele-specific expression (ASE), we employed the R package Allele-Specific Expression in a Population (ASEP) (Fan et al., 2020), which enables population-level modeling of ASE. This approach allows for the identification of genes exhibiting biased allelic expression across individuals and facilitates the detection of specific alleles potentially associated with phenotypic traits of interest.
To complement the ASE analysis, a differential expression study was conducted to identify genes exhibiting significant up- or downregulation. This information was integrated with ASE results to prioritize candidate genes and alleles potentially involved in trait regulation.
3.3. Candidate genes
The candidate genes exhibiting significant allele-specific expression (ASE) with concurrent overexpression during sea lice infestation in Atlantic salmon is show in Table 2. A total of 33 genes showed robust ASE signals (P-value < 0.05), highlighting their potential regulatory modulation in response to parasite challenge. Notably, genes involved in structural integrity and immune response were prominently represented. For example, two paralogs of Keratin 15 (ENSSSAG00000045136 and ENSSSAG00000048512; p = 0.003), Collagen type IV alpha 5 (ENSSSAG00000064682), and Collagen type V alpha 3a (ENSSSAG00000090709) likely contribute to mucosal barrier maintenance and skin remodeling. Immune-related candidates include Tripartite motif-containing protein 16-like (ENSSSAG00000104872), a known innate immunity regulator, and Serine protease 35 (ENSSSAG00000119277), potentially involved in antimicrobial defense. Other notable genes include Fibronectin type III domain containing 1 (ENSSSAG00000008223), implicated in cell adhesion, and Angiopoietin-1-like (ENSSSAG00000012776), which may participate in vascular remodeling and tissue repair. Several novel and uncharacterized genes also demonstrated significant ASE, warranting further investigation. Collectively, these findings support the role of cis-regulatory variation in modulating key biological pathways underlying host resistance to Caligus rogercresseyi and provide valuable targets for functional validation and selective breeding programs.
In contrast to the upregulated ASE candidates, a distinct set of 27 underexpressed genes also exhibited significant allelic imbalance, as summarized in Table 3. These genes were predominantly associated with nucleolar function, RNA metabolism, and immune regulation. Several transcripts encoding nucleolar components, including NOP14 nucleolar protein homolog (ENSSSAG00000002452), Nucleolar protein 8 (ENSSSAG00000060839), Nucleolar protein 11 (ENSSSAG00000064522), and MIF4G domain-containing nucleolar protein 1 (ENSSSAG00000068370), displayed strong ASE signals, suggesting reduced ribosomal biogenesis and global protein synthesis during advanced stages of infestation. Immune-related genes such as Suppressor of cytokine signaling 3 (SOCS3, ENSSSAG00000067044) and Colony stimulating factor 3 receptor (CSF3R, ENSSSAG00000072535) were also significantly underexpressed with ASE, pointing to potential genotype-dependent attenuation of cytokine signaling pathways. The downregulation of Neutrophil cytosolic factor (ENSSSAG00000079828), a component of the NADPH oxidase complex, may impair reactive oxygen species (ROS) generation, further supporting the hypothesis of host tolerance mechanisms aimed at minimizing immunopathology. Additionally, transcripts related to extracellular matrix degradation, such as Matrix metalloproteinase 9 (ENSSSAG00000069874) and Collagenase 3 (ENSSSAG00000070495), were suppressed, indicating a temporal shift in tissue remodeling responses. Together, the ASE landscape of underexpressed genes complements the profile of overexpressed loci, underscoring a coordinated regulatory program involving both activation and repression of critical biological processes during sea lice infestation. The presence of ASE in genes with established or plausible roles in resistance mechanisms supports their candidacy as functional targets for selective breeding and molecular validation.
4. Discussion
Two consecutive sea lice (Caligus rogercresseyi) challenge trials were conducted, yielding valuable insights into parasite burden and growth dynamics in Atlantic salmon over time. Infestation success rates of 47% and 43% were recorded across the two trials, reflecting consistently high infection efficiency (Samsing et al., 2014). As shown in Figure 1, a shift in infestation dynamics occurred during the second challenge, characterized by a reduction in attached parasites. This decline was likely due to elevated stress levels in the fish (Delfosse et al., 2021), damaged mucosal surfaces (Easy & Ross, 2009), and decreased host attractiveness (Ødegård et al., 2022).
The integration of allele-specific expression (ASE) analysis with differential gene expression profiling revealed a suite of genes potentially modulated by cis-regulatory variants and involved in Atlantic salmon resistance to sea lice (Caligus rogercresseyi). Notably, 33 overexpressed and 27 underexpressed genes demonstrated significant ASE (Pvalue < 0.05), providing strong evidence for the contribution of regulatory variation to host parasite interactions.
Among the overexpressed genes, several encode structural and immune-related proteins previously implicated in parasite resistance. Two paralogs of Keratin 15 (ENSSSAG00000045136 and ENSSSAG00000048512; p = 0.003), together with Collagen type IV alpha 5 (ENSSSAG00000064682) and Collagen type V alpha 3a (ENSSSAG00000090709), exhibited robust ASE signals, supporting their involvement in mucosal barrier integrity and skin remodeling upon ectoparasite attachment (Holm et al., 2015; Robledo et al., 2018). Tripartite motif-containing protein 16-like (TRIM16, ENSSSAG00000104872), a known modulator of innate immunity and cell proliferation (Barker et al., 2019), also displayed strong ASE (p = 0), reinforcing its candidacy as a master regulator of resilience to sea lice.
Other upregulated ASE genes include Angiopoietin-1-like (ENSSSAG00000012776), potentially involved in vascular remodeling and tissue repair (LeBlanc et al., 2015), and Matrix metallopeptidase 28 (ENSSSAG00000076502), consistent with extracellular matrix (ECM) degradation and tissue regeneration. The presence of Fibronectin type III domain containing 1 (ENSSSAG00000008223) and Adhesion G-protein coupled receptor A3 (ENSSSAG00000069698) suggests active modulation of cell adhesion and signaling, processes previously associated with parasite defense (Skugor et al., 2008). Enzymes like D-amino acid oxidase (ENSSSAG00000063640) and Serine protease 35 (ENSSSAG00000119277) may contribute to antimicrobial activity and skin defense, while IGFBP2a (ENSSSAG00000056022) might link growth immune trade-offs during parasite challenge (Braden et al., 2020).
Conversely, the underexpressed ASE genes includes numerous transcripts involved in nucleolar function, RNA processing, and innate immune signaling. The downregulation of Matrix metalloproteinase 9 (ENSSSAG00000069874) and Collagenase 3 (ENSSSAG00000070495) may reflect a context-specific suppression of ECM turnover during later stages of infestation, contrasting with earlier reports (Braden et al., 2015). Several nucleolar proteins with ASE, such as NOP14, Nucleolar protein 8, and MIF4G domain-containing protein 1, suggest an attenuated ribosome biogenesis and translational response under high parasitic burden.
Importantly, immune-related genes such as Suppressor of cytokine signaling 3 (SOCS3) (ENSSSAG00000067044) and Colony stimulating factor 3 receptor (CSF3R) (ENSSSAG00000072535) were significantly underexpressed with ASE, indicating a possible genotype-dependent suppression of cytokine signaling pathways. These genes have been previously linked to granulopoiesis and inflammatory regulation (Dwivedi & Greis, 2017; Ullah & Haq, 2010), and their repression could represent a tolerance mechanism aimed at limiting immunopathology. Likewise, Neutrophil cytosolic factor (ENSSSAG00000079828) showed consistent ASE and downregulation, which may impact reactive oxygen species (ROS) generation.
Taken together, the ASE landscape highlights the role of cis-regulatory variants in modulating gene expression in key biological processes such as skin barrier maintenance, ECM remodeling, innate immunity, and cellular stress response. Many ASE genes detected in this study, such as TRIM16, Keratin 15, CSF3R, and SOCS3, map near previously identified QTLs associated with sea lice resistance and host resilience traits (Yoshida & Yáñez, 2022; Cáceres et al., 2021). Their co-localization supports a model in which expression-modulating variants contribute causally to observed phenotypic variance, providing targets for genomic selection or functional validation.
Future work should focus on fine-mapping cis-regulatory elements affecting ASE genes and validating their functional roles via genome editing or transgenic approaches. The integration of ASE with eQTL and GWAS data continues to represent a powerful strategy for dissecting complex traits such as parasite resistance in aquaculture species.
5. Conclusion
This study integrated transcriptomic profiling, variant discovery, and allele-specific expression (ASE) analysis to investigate the role of cis-regulatory variation in Atlantic salmon. Several overexpressed ASE genes were functionally relevant, including Angiopoietin-1-like, IGFBP2a, Collagen IV and V isoforms, TRIM21-like, keratins (e.g., KRT15), metalloproteinases (e.g., MMP28), and adhesion molecules (e.g., ADGR-A3), highlighting coordinated regulation of tissue integrity, growth, and immune function. Among underexpressed ASE genes, key candidates such as ABCA1, SOCS3, MMP9, and Collagenase 3 were identified, alongside nucleolar and RNA-processing genes, suggesting transcriptional control mechanisms. This integrative approach enables the prioritization of functional variants and candidate genes for host resistance and performance traits. These findings advance our understanding of the genetic architecture of complex traits in salmonids and highlight the utility of ASE analyses in functional genomics and selective breeding. Further validation across diverse populations will help link these regulatory variants to economically important phenotypes.
Funding
This work was funding by FONDECYT Regular (No. 1211761), funded by Chile’s Government Programme, Ministerio de Economia, Fomento y Turismo, and Pablo Cáceres, is supported by doctoral funding (No. 21211569) of Agencia Nacional de Investigacion y Desarrollo (ANID).
Data availability
The data that support the findings of this study are the property of AquaGen AS and restrictions apply to their availability, which were used under their permission for the current study. Therefore, the data are not deposited on a public repository, but can be accessed under agreement with AquaGen AS
Acknowledgment
The authors would like to thank the contribution of AquaGen and AquaGen Chile for providing the biological material and phenotypic records of the experimental challenges and Agencia de Investigacion y Desarrollo (ANID) for funding and support with FONDECYT Regular (No. 1211761). Liane Bassini wants to thank funding from FONDECYT Iniciación (No.11241026).
Declaration of competing interest
Jose Manuel Yanez reports financial support was provided by Agencia nacional de investigacion y desarrollo. Pablo Caceres reports financial support was provided by Agencia nacional de investigacion y desarrollo. Paulina Lopez reports a relationship with Aquagen that includes: employment. Daniela Cichero reports a relationship with Aquagen that includes: employment. Thomas Moen reports a relationship with Aquagen that includes: employment. Paulina Lopez, Daniela Cichero, Jorgen Odegard, and Thomas Moen were hired by AquaGen during the period of the study.
References
- Anacleto, O., Cabaleiro, S., Villanueva, B., Saura, M., Houston, R. D., Woolliams, J. A., & Doeschl-Wilson, A. B. (2019). Genetic differences in host infectivity affect disease spread and survival in epidemics. Scientific Reports, 9(1). [CrossRef]
- Bishop, S. C., & Woolliams, J. A. (2014). Genomics and disease resistance studies in livestock. Livestock Science, 166(1), 190–198. [CrossRef]
- Bolger, A. M., Lohse, M., & Usadel, B. (2014). Trimmomatic: A flexible trimmer for Illumina sequence data. Bioinformatics, 30(15), 2114–2120. [CrossRef]
- Braden, L. M., Koop, B. F., & Jones, S. R. M. (2015). Signatures of resistance to Lepeophtheirus salmonis include a TH2-type response at the louse-salmon interface. Developmental and Comparative Immunology, 48(1), 178–191. [CrossRef]
- Braden, L. M., Monaghan, S. J., & Fast, M. D. (2020). Salmon immunological defence and interplay with the modulatory capabilities of its ectoparasite Lepeophtheirus salmonis. Parasite Immunology, 42(8). [CrossRef]
- Bravo, S., Silva, M. T., & Treasurer, J. (2014). Factors affecting the abundance of Caligus rogercresseyi (Boxshall and Bravo) on farmed salmonids in Chile in the period 2006-2007. Aquaculture, 434, 456–461. [CrossRef]
- Cáceres, P., Barría, A., Christensen, K. A., Bassini, L. N., Correa, K., Garcia, B., Lhorente, J. P., & Yáñez, J. M. (2021). Genome-scale comparative analysis for host resistance against sea lice between Atlantic salmon and rainbow trout. Scientific Reports, 11(1). [CrossRef]
- Delfosse, C., Pageat, P., Lafont-Lecuelle, C., Asproni, P., Chabaud, C., Cozzi, A., & Bienboire-Frosini, C. (2021). Effect of handling and crowding on the susceptibility of Atlantic salmon (Salmo salar L.) to Lepeophtheirus salmonis (Krøyer) copepodids. Journal of Fish Diseases, 44(3), 327–336. [CrossRef]
- Dobin, A., Davis, C. A., Schlesinger, F., Drenkow, J., Zaleski, C., Jha, S., Batut, P., Chaisson, M., & Gingeras, T. R. (2013). STAR: Ultrafast universal RNA-seq aligner. Bioinformatics, 29(1), 15–21. [CrossRef]
- Durinck, S., Spellman, P. T., Birney, E., & Huber, W. (2009). Mapping identifiers for the integration of genomic datasets with the R/ Bioconductor package biomaRt. Nature Protocols, 4(8), 1184–1191. [CrossRef]
- Dwivedi, P., & Greis, K. D. (2017). Granulocyte colony-stimulating factor receptor signaling in severe congenital neutropenia, chronic neutrophilic leukemia, and related malignancies. In Experimental Hematology (Vol. 46, pp. 9–20). Elsevier Inc. [CrossRef]
- Easy, R. H., & Ross, N. W. (2009). Changes in Atlantic salmon (Salmo salar) epidermal mucus protein composition profiles following infection with sea lice (Lepeophtheirus salmonis). Comparative Biochemistry and Physiology - Part D: Genomics and Proteomics, 4(3), 159–167. [CrossRef]
- Fan, J., Hu, J., Xue, C., Zhang, H., Susztak, K., Reilly, M. P., Reilly, M. P., Xiao, R., & Li, M. (2020). ASEP: Gene-based detection of allele-specific expression across individuals in a population by RNA sequencing. PLoS Genetics, 16(5). [CrossRef]
- Fast, M. D. (2014). Fish immune responses to parasitic copepod (namely sea lice) infection. In Developmental and Comparative Immunology (Vol. 43, Issue 2, pp. 300–312). [CrossRef]
- Geraldine A. Van der Auwera, & Brian D. O’Connor. (2020). Genomics in the Cloud: Using Docker, GATK, and WDL in Terra (1st Edition) (1st ed., Vol. 1). O’Reilly Media, Inc.
- Gjedrem, T. (2015). Disease resistant fish and shellfish are within reach: A review. In Journal of Marine Science and Engineering (Vol. 3, Issue 1, pp. 146–153). MDPI AG. [CrossRef]
- Gutierrez, A. P., Yáñ Ez, J. M., Fukui, S., Swift, B., & Davidson, W. S. (2015). Genome-Wide association study (GWAS) for growth rate and age at sexual maturation in atlantic salmon (Salmo salar). PLoS ONE, 10(3). [CrossRef]
- Helgesen, K. O., Romstad, H., Aaen, S. M., & Horsberg, T. E. (2015). First report of reduced sensitivity towards hydrogen peroxide found in the salmon louse Lepeophtheirus salmonis in Norway. Aquaculture Reports, 1, 37–42. [CrossRef]
- Holm, H., Santi, N., Kjøglum, S., Perisic, N., Skugor, S., & Evensen, Ø. (2015). Difference in skin immune responses to infection with salmon louse (Lepeophtheirus salmonis) in Atlantic salmon (Salmo salar L.) of families selected for resistance and susceptibility. Fish and Shellfish Immunology, 42(2), 384–394. [CrossRef]
- LeBlanc, M. E., Wang, W., Caberoy, N. B., Chen, X., Guo, F., Alvarado, G., Shen, C., Wang, F., Wang, H., Chen, R., Liu, Z. J., Webster, K., & Li, W. (2015). Hepatoma-derived growth factor-related protein-3 is a novel angiogenic factor. PLoS ONE, 10(5). [CrossRef]
- Lhorente, J. P., Araneda, M., Neira, R., & Yáñez, J. M. (2019). Advances in genetic improvement for salmon and trout aquaculture: the Chilean situation and prospects. Reviews in Aquaculture, 11(2), 340–353. [CrossRef]
- Lhorente, J. P. , Gallardo, J. A., Villanueva, B., Araya, A. M., Torrealba, D. A., Toledo, X. E., & Neira, R. (2012). Quantitative genetic basis for resistance to Caligus rogercresseyi sea lice in a breeding population of Atlantic salmon (Salmo salar). Aquaculture, 324–325, 55–59. [CrossRef]
- Li, B., & Dewey, C. N. (2011). RSEM: Accurate transcript quantification from RNA-Seq data with or without a reference genome. BMC Bioinformatics, 12. [CrossRef]
- Love, M. I., Huber, W., & Anders, S. (2014). Moderated estimation of fold change and dispersion for RNA-seq data with DESeq2. Genome Biology, 15(12). [CrossRef]
- Madeira, F., Pearce, M., Tivey, A. R. N., Basutkar, P., Lee, J., Edbali, O., Madhusoodanan, N., Kolesnikov, A., & Lopez, R. (2022). Search and sequence analysis tools services from EMBL-EBI in 2022. Nucleic Acids Research, 50(W1), W276–W279. [CrossRef]
- Ødegård, J., Kjøglum, Sissel., Medina M., Torgersen J.S., Korsvoll S.A., Deerenberg R., Yáñez J.M., Cichero D., López P., & Moen T. (2022). Genetics of parasite attraction in Atlantic salmon: potential for group-level protection against sea lice. 2371–2374. [CrossRef]
- Ødegård, J., Moen, T., Santi, N., Korsvoll, S. A., Kjøglum, S., & Meuwisse, T. H. E. (2014). Genomic prediction in an admixed population of Atlantic salmon (Salmo salar). Frontiers in Genetics, 5(NOV). [CrossRef]
- Robledo, D., Gutiérrez, A. P., Barría, A., Lhorente, J. P., Houston, R. D., & Yáñez, J. M. (2019). Discovery and functional annotation of quantitative trait loci affecting resistance to Sea lice in Atlantic salmon. Frontiers in Genetics, 10(FEB). [CrossRef]
- Robledo, D., Gutiérrez, A. P., Barría, A., Yáñez, J. M., & Houston, R. D. (2018). Gene expression response to sea lice in Atlantic salmon skin: RNA sequencing comparison between resistant and susceptible animals. Frontiers in Genetics, 9(AUG). [CrossRef]
- Samsing, F., Oppedal, F., Johansson, D., Bui, S., & Dempster, T. (2014). High host densities dilute sea lice Lepeophtheirus salmonis loads on individual Atlantic salmon, but do not reduce lice infection success. Aquaculture Environment Interactions, 6(1), 81–89. [CrossRef]
- Skugor, S., Glover, K. A., Nilsen, F., & Krasnov, A. (2008). Local and systemic gene expression responses of Atlantic salmon (Salmo salar L.) to infection with the salmon louse (Lepeophtheirus salmonis). BMC Genomics, 9. [CrossRef]
- Sutherland, B. J. G., Koczka, K. W., Yasuike, M., Jantzen, S. G., Yazawa, R., Koop, B. F., & Jones, S. R. M. (2014). Comparative transcriptomics of Atlantic Salmo salar, chum Oncorhynchus keta and pink salmon O. gorbuscha during infections with salmon lice Lepeophtheirus salmonis. BMC Genomics, 15(1). [CrossRef]
- The State of World Fisheries and Aquaculture 2024. (2024). In The State of World Fisheries and Aquaculture 2024. FAO. [CrossRef]
- Tsai, H. Y., Hamilton, A., Tinch, A. E., Guy, D. R., Bron, J. E., Taggart, J. B., Gharbi, K., Stear, M., Matika, O., Pong-Wong, R., Bishop, S. C., & Houston, R. D. (2016). Genomic prediction of host resistance to sea lice in farmed Atlantic salmon populations. Genetics Selection Evolution, 48(1). [CrossRef]
- Ullah, S., & Haq, S. (2010). Structure and role of neutrophil cytosol factor 1 (NCF1) gene in various diseases. African Journal of Biotechnology, 9(54), 9286–9294. Available online: http://www.academicjournals.org/AJB.
- Wolf, J. B. W. (2013). Principles of transcriptome analysis and gene expression quantification: An RNA-seq tutorial. Molecular Ecology Resources, 13(4), 559–572. [CrossRef]
- Yáñez, J. M., Lhorente, J. P., Bassini, L. N., Oyarzún, M., Neira, R., & Newman, S. (2014). Genetic co-variation between resistance against both Caligus rogercresseyi and Piscirickettsia salmonis, and body weight in Atlantic salmon (Salmo salar). Aquaculture, 433, 295–298. [CrossRef]
- Yoshida, G. M., Lhorente, J. P., Carvalheiro, R., & Yáñez, J. M. (2017). Bayesian genome-wide association analysis for body weight in farmed Atlantic salmon (Salmo salar L.). Animal Genetics, 48(6), 698–703. [CrossRef]
Figure 1.
Density plot for the first and second challenges, showing parasite counts on days 4, 10, and 15.
Figure 1.
Density plot for the first and second challenges, showing parasite counts on days 4, 10, and 15.
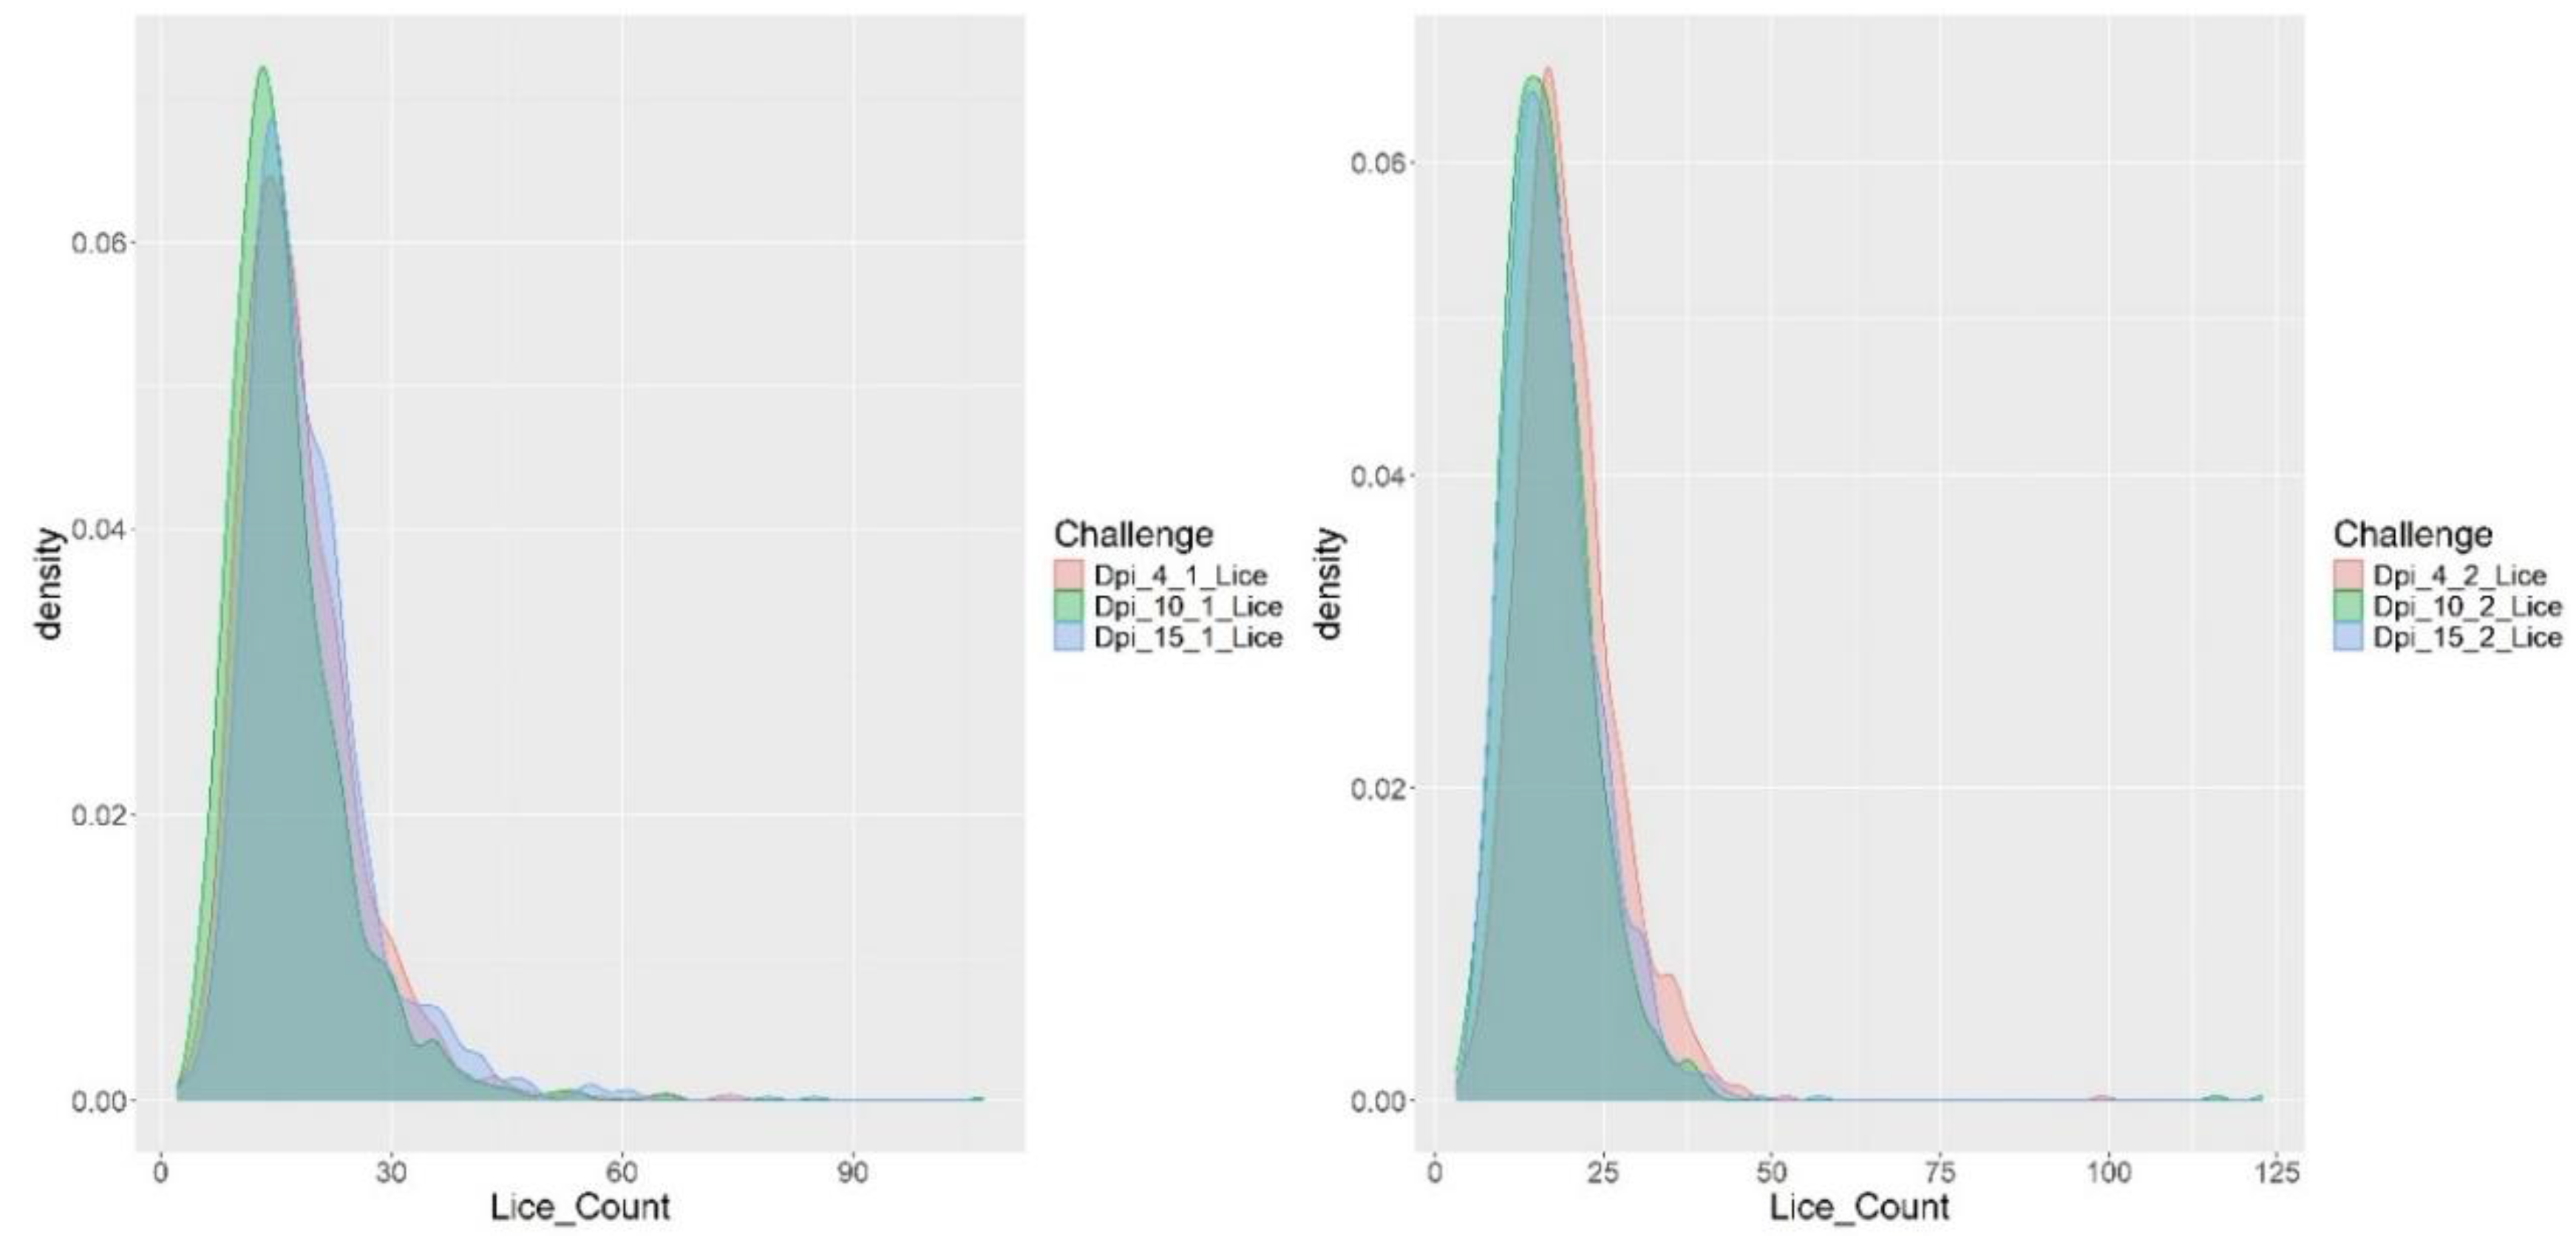
Figure 2.
Volcano plot showing the expression variation of 69,389 evaluated genes. The y-axis indicates the -log of the p-value, and the x-axis indicates the log fold change.
Figure 2.
Volcano plot showing the expression variation of 69,389 evaluated genes. The y-axis indicates the -log of the p-value, and the x-axis indicates the log fold change.
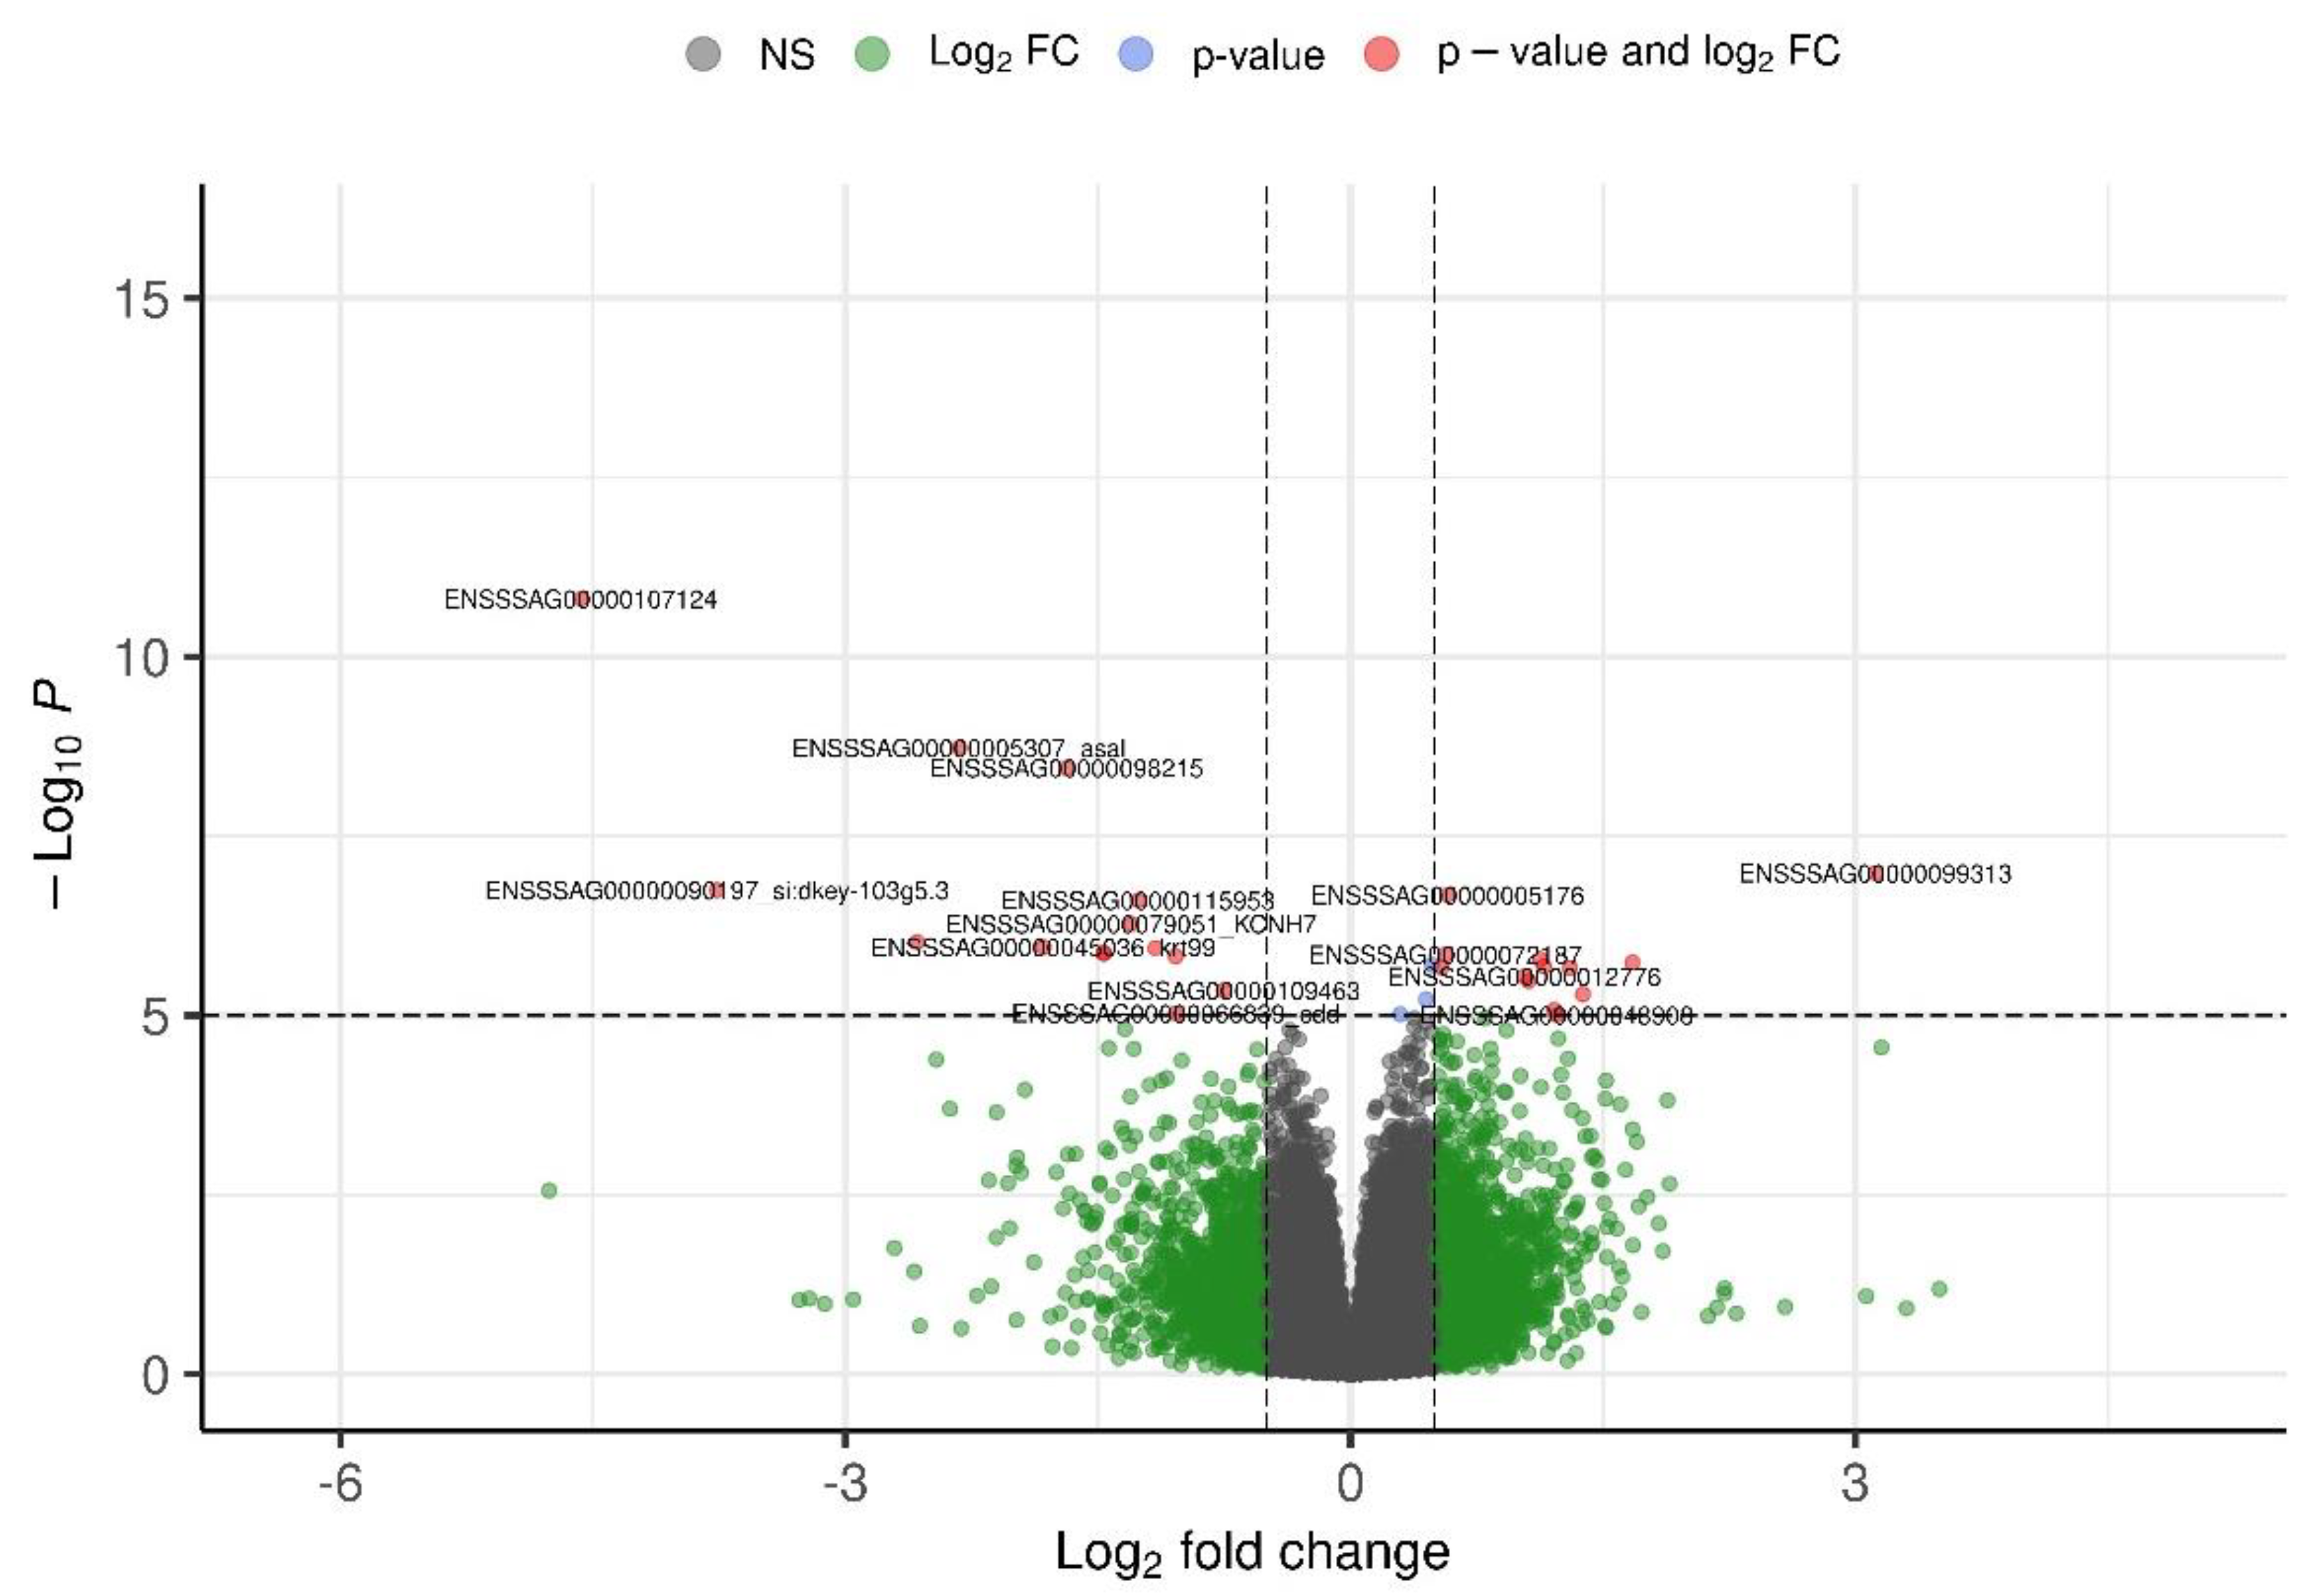

Table 1.
Summary statistics of fish weight, length, and parasite counts during pre-challenge and days post infestation (DPI) in two consecutive sea lice challenges.
Table 1.
Summary statistics of fish weight, length, and parasite counts during pre-challenge and days post infestation (DPI) in two consecutive sea lice challenges.
| Trait | N | Mean | SD | Med. | Min | Max | CV (%) |
|---|---|---|---|---|---|---|---|
| Weight Pre- challenge | 1126 | 168.6 | 24.4 | 165 | 108 | 271 | 14.5 |
| Length Pre- challenge | 1126 | 24.3 | 1.16 | 24.3 | 15.6 | 29.5 | 4.8 |
| DPI4_1 Parasites | 1127 | 18.0 | 8.2 | 17 | 2 | 75 | 45.8 |
| DPI10_1 Parasites | 1122 | 16.4 | 8.1 | 15 | 4 | 107 | 49.2 |
| DPI15_1 Parasites | 1019 | 19.0 | 8.7 | 17 | 2 | 85 | 45.7 |
| DPI4_1 Weight | 1127 | 169.1 | 24.1 | 167 | 108 | 278 | 14.3 |
| DPI10_1 Weight | 1122 | 166.9 | 23.8 | 165 | 104 | 276 | 14.3 |
| DPI15_1 Weight | 1019 | 170.6 | 28.5 | 169 | 16.3 | 402 | 16.7 |
| DPI4_2 Parasites | 992 | 19.6 | 7.5 | 19 | 4 | 99 | 38.2 |
| DPI10_2 Parasites | 978 | 17.0 | 7.8 | 16 | 3 | 123 | 45.5 |
| DPI15_2 Parasites | 952 | 17.4 | 6.8 | 16 | 4 | 57 | 38.8 |
| DPI4_2 Weight | 992 | 179.1 | 29.9 | 178 | 85 | 312 | 16.7 |
| DPI10_2 Weight | 978 | 188.1 | 32.8 | 186 | 94 | 340 | 17.4 |
| DPI15_2 Weight | 952 | 184.0 | 31.7 | 184 | 5 | 320 | 17.2 |
DPI, days post infestation; N, numbers of animals. SD, standard deviation; CV, coefficient of variation.
Table 2.
Overexpressed genes that exhibit ASE along with their respective p-values.
| Gene | P Value | Description |
|---|---|---|
| ENSSSAG00000008223 | 0 | Fibronectin type III domain containing 1 |
| ENSSSAG00000012776 | 0.005 | Angiopoietin-1-like |
| ENSSSAG00000035308 | 0 | Membrane associated ring-CH-type finger 3 |
| ENSSSAG00000045136 | 0.003 | Keratin 15 |
| ENSSSAG00000048512 | 0.003 | Keratin 15 |
| ENSSSAG00000054925 | 0 | Myristoylated alanine rich protein kinase C substrate |
| ENSSSAG00000056022 | 0.045 | Insulin-like growth factor binding protein 2a |
| ENSSSAG00000063640 | 0 | D-amino acid oxidase |
| ENSSSAG00000064326 | 0 | GULP PTB domain containing engulfment adaptor 1a |
| ENSSSAG00000064378 | 0 | novel |
| ENSSSAG00000064682 | 0 | Collagen, type IV, alpha 5 |
| ENSSSAG00000065229 | 0.005 | Novel gene |
| ENSSSAG00000069698 | 0 | Adhesion G protein-coupled receptor A3 |
| ENSSSAG00000070277 | 0 | Beta 3-glucosyltransferase a |
| ENSSSAG00000070579 | 0 | disintegrin and metalloproteinase with thrombospondin motifs 12 |
| ENSSSAG00000073657 | 0.001 | LOC106569355 |
| ENSSSAG00000076502 | 0.035 | matrix metallopeptidase 28 |
| ENSSSAG00000076511 | 0.004 | EGF like domain multiple 6 |
| ENSSSAG00000083329 | 0 | LOC106612420 |
| ENSSSAG00000085545 | 0 | Novel gene |
| ENSSSAG00000087971 | 0.003 | Synaptotagmin XII |
| ENSSSAG00000090709 | 0.001 | Collagen, type V, alpha 3a |
| ENSSSAG00000094685 | 0.002 | Sperm acrosome associated 4 like |
| ENSSSAG00000097547 | 0 | Novel gene |
| ENSSSAG00000102125 | 0 | Osteoglycin |
| ENSSSAG00000104092 | 0.008 | Novel gene |
| ENSSSAG00000104872 | 0 | tripartite motif-containing protein 16-like |
| ENSSSAG00000104937 | 0 | Iodothyronine deiodinase 1 |
| ENSSSAG00000109080 | 0 | CD248 molecule, endosialin a |
| ENSSSAG00000111485 | 0 | Novel gene |
| ENSSSAG00000118058 | 0 | myosin-7 |
| ENSSSAG00000119277 | 0 | Serine protease 35 |
| ENSSSAG00000122110 | 0.01 | E3 ubiquitin-protein ligase TRIM21-like |
Table 3.
Subexpressed genes that exhibit ASE along with their respective p-values.
| Gene | P Value | Description |
|---|---|---|
| ENSSSAG00000000392 | 0 | RNA exonuclease 5 |
| ENSSSAG00000002452 | 0 | NOP14 nucleolar protein homolog (yeast) |
| ENSSSAG00000003919 | 0.016 | Novel gene |
| ENSSSAG00000004485 | 0 | immunoglobulin like and fibronectin type III domain containing 1 |
| ENSSSAG00000008409 | 0.001 | Cell death inducing DFFA like effector b |
| ENSSSAG00000010799 | 0 | Novel gene |
| ENSSSAG00000015527 | 0 | palmitoyltransferase |
| ENSSSAG00000018923 | 0 | phospholipid-transporting ATPase ABCA1 |
| ENSSSAG00000041926 | 0 | phospholipid-transporting ATPase ABCA1 |
| ENSSSAG00000045036 | 0 | Keratin 99 |
| ENSSSAG00000049698 | 0 | RNA binding motif protein 34 |
| ENSSSAG00000060839 | 0 | Nucleolar protein 8 |
| ENSSSAG00000064522 | 0 | Nucleolar protein 11 |
| ENSSSAG00000066839 | 0.001 | Cytidine deaminase |
| ENSSSAG00000067044 | 0 | Suppressor of cytokine signaling 3 |
| ENSSSAG00000068370 | 0 | Nucleolar protein with MIF4G domain 1 |
| ENSSSAG00000068818 | 0 | TRNA methyltransferase 2 homolog A |
| ENSSSAG00000069874 | 0.016 | Matrix metalloproteinase 9 |
| ENSSSAG00000070332 | 0 | AMP-activated, alpha 1 catalytic subunit |
| ENSSSAG00000070495 | 0 | Collagenase 3 |
| ENSSSAG00000071944 | 0 | Nle1 |
| ENSSSAG00000072535 | 0.024 | Colony stimulating factor 3 receptor (granulocyte) |
| ENSSSAG00000079794 | 0 | Novel gene |
| ENSSSAG00000079828 | 0 | neutrophil cytosolic factor |
| ENSSSAG00000080634 | 0 | Deoxynucleotidyltransferase, terminal, interacting protein 2 |
| ENSSSAG00000090197 | 0.039 | zona pellucida-like domain-containing protein 1 |
| ENSSSAG00000117724 | 0 | Guanine deaminase |
Disclaimer/Publisher’s Note: The statements, opinions and data contained in all publications are solely those of the individual author(s) and contributor(s) and not of MDPI and/or the editor(s). MDPI and/or the editor(s) disclaim responsibility for any injury to people or property resulting from any ideas, methods, instructions or products referred to in the content. |
© 2025 by the authors. Licensee MDPI, Basel, Switzerland. This article is an open access article distributed under the terms and conditions of the Creative Commons Attribution (CC BY) license (http://creativecommons.org/licenses/by/4.0/).
Copyright: This open access article is published under a Creative Commons CC BY 4.0 license, which permit the free download, distribution, and reuse, provided that the author and preprint are cited in any reuse.


