Submitted:
11 June 2025
Posted:
12 June 2025
You are already at the latest version
Abstract
This study presents a data-driven investigation into the determinants of national happinessusing data from the World Happiness Report. Leveraging a structured workflow ofexploratory data analysis and predictive modeling, the study assesses how socio-economic,health and governance indicators influence subjective well-being. Four regression models,Linear Regression, Random Forest, Gradient Boosting and XGBoost, were trained andevaluated using a time-based validation split, with robustness assessed over 5 randomizedseeds per model. Gradient Boosting outperformed the others, achieving the highest average R2 of 0.83 and the lowest mean squared error (MSE) of 0.24. Model interpretability wasaddressed using SHapley Additive exPlanations (SHAP), which identified GDP per capita,healthy life expectancy, and social support as the most influential predictors of happiness.These findings underscore the multifaceted nature of well-being and highlight the importanceof combining economic development with social support and good governance. The resultssuggest policy implications that prioritize investments in health, education, institutionaltrust, and social infrastructure alongside economic growth.
Keywords:
World happiness
; Machine learning
; Data science
; Exploratory analysis
; Predictive modeling
1. Introduction
The pursuit of happiness has long been a central concern for individuals and societies alike. For centuries, philosophers, psychologists, and policymakers have grappled with the question of what constitutes happiness and how it can be achieved, both on a personal and societal level. In recent years, the concept of measuring and analyzing happiness on a global scale has gained significant traction, driven by the increasing recognition that human well-being extends far beyond traditional economic metrics.
Historically, happiness was considered a vague and personal experience, often framed within the context of philosophical debates. As mentioned in Graham and Nikolova (2015), happiness was seen as an elusive and subjective concept, often shaped by philosophical discussions such as Benthamite utilitarianism versus Aristotelian eudaimonia. However, over time, there has been a growing shift toward making the concept of happiness more measurable, particularly in terms of how societies and governments can influence it.
One of the most significant developments in this regard has been the emergence of global indices, like the World Happiness Report, which aim to quantify happiness in measurable terms. These reports combine data on subjective well-being with economic, social, and governance-related factors to rank countries according to the happiness levels of their citizens. This approach reflects a broader movement away from traditional economic indicators such as Gross Domestic Product (GDP) as the sole benchmarks for a country’s success. Increasingly, policymakers and governments are recognizing that true progress cannot be measured only by material wealth but must also account for the health, social cohesion, and overall well-being of citizens.
As governments and international organizations seek to prioritize national happiness as a policy goal, there is a pressing need for more robust, data-driven methodologies to analyze and predict happiness levels. This is especially critical as societies face new challenges: economic inequalities, environmental sustainability, mental health crises, and the ongoing impacts of geopolitical conflicts. To guide policy decisions, a deep understanding of what contributes to happiness, how it can be measured, and how it can be influenced is becoming essential.
The World Happiness Report (Helliwell et al. (2024)), an annual publication by the Sustainable Development Solutions Network (SDSN) and Gallup, ranks countries by average life evaluation (Cantril ladder score) and examines key contributing factors. Traditional economics (GDP per capita) is known to correlate strongly with happiness at a point in time, yet rising incomes do not always yield higher well-being over time. Moreover, newer research emphasizes that social and environmental conditions are equally important: trust, social support, health, and governance quality significantly predict life satisfaction, while factors like inequality or ecological impact can influence or complicate these relationships. In short, objective metrics like GDP are necessary but not sufficient measures of well-being.
The existing body of research on global happiness has grown significantly, with an increasing focus on the complex interplay between economic, social, and governance-related factors in shaping subjective well-being. This study extends the existing literature by performing an exploratory and predictive analysis of global happiness determinants using the latest data and techniques. Specifically, Exploratory Data Analysis (EDA) is conducted to visualize trends and identify patterns. Then, various regression and machine learning models are trained and compared for predictive analysis to model national happiness scores and suggest insights. Randomized model runs are also included to provide robust estimates of model performance. Crucially, model interpretability is addressed using SHAP methods.
By combining insights from data-driven studies and integrating modern machine learning tools with economics and social science, this study provides evidence-based insights on what drives global happiness.
2. Literature Review
The study of happiness and subjective well-being has evolved significantly over the past few decades, with researchers increasingly emphasizing the importance of multidimensional frameworks. Dolan and Metcalfe (2012) provides a foundational perspective on measuring subjective well-being, advocating for the integration of these metrics into national policy-making. While their recommendations are valuable, their approach has been criticized for relying heavily on self-reported data, which can be influenced by cultural biases and individual interpretation. For instance, in societies where expressing complaints is discouraged, self-reported happiness scores may be artificially inflated, undermining the reliability of cross-country comparisons. This limitation highlights the need for additional objective measures of well-being, such as behavioral or physiological indicators, to complement self-reported data.
Graham and Nikolova (2015) explores the philosophical underpinnings of happiness, contrasting Benthamite utilitarianism with Aristotelian eudaimonia. Their empirical findings suggest that capabilities such as education, health, and social connections play a critical role in shaping subjective well-being. However, their study has been critiqued for failing to account for multicollinearity among predictors, which can distort the interpretation of results. For example, factors like income and education are often highly correlated, but their analysis does not adequately address this issue, potentially leading to overstated conclusions about the independent effects of these variables. Additionally, their focus on economic development contexts limits the generalizability of their findings to contexts where cultural or environmental influences are stronger.
The World Happiness Report, as detailed by Helliwell et al. (2024), has been instrumental in advancing the global discourse on happiness. By providing a standardized methodology for assessing subjective well-being, the report has enabled cross-country comparisons and informed policy decisions worldwide. However, missing data and inconsistencies across different years of the report are often not adequately addressed, potentially compromising the reliability of findings. These gaps highlight the need for more rigorous data validation and greater consistency in reporting standards within happiness research.
The advent of big data and machine learning has revolutionized the study of happiness, enabling researchers to identify patterns and predict trends with unprecedented accuracy. Brandy (2024) employs descriptive analytics to map global trends in subjective well-being, providing a broad overview of the factors influencing happiness. While this study serves as a useful starting point for more advanced analyses, it has been criticized for its lack of depth. By focusing on descriptive statistics, the study fails to explore the relationships between different factors, limiting its utility for policy-making. Therefore, there is a need for more rigorous data analysis that moves beyond description and toward inference and prediction.
Mukhopadhyay, Adhikary, Saha, Dutta, and Baksi (2022) conducts exploratory data analysis on the relationship between healthy lifestyle choices and happiness scores in Asia and Europe, using data from the World Happiness Report. The authors examine factors such as life expectancy, healthcare, and lifestyle choices to identify patterns and correlations with happiness scores. The study highlights regional differences and potential drivers of well-being, offering insights into how health-related factors influence happiness across these continents. Similarly, Saputri and Lee (2015) assess national happiness visualizations and statistical summaries to uncover trends and insights, providing an early exploration of data-driven happiness analysis and setting the stage for further machine learning modeling. However, their analysis does not account for factors from other perspectives such as income, which may significantly affect both healthcare access and overall well-being.
Machine learning techniques have been particularly effective in predicting happiness levels. Jannani, Sael, and Benabbou (2021) and Azad et al. (2023) demonstrate the utility of predictive modeling, including regression-based models, tree-based algorithms, support vector regression (SVR), and neural networks, to predict happiness scores based on economic and social indicators. Feature selection techniques are used to identify the most influential predictors. Network-based approaches have also been leveraged in happiness analysis. Dixit, Chaudhary, and Sahni (2020) explores network learning techniques to study global happiness patterns, demonstrating how interconnected factors influence happiness scores. However, these studies have been criticized for their reliance on black-box models, which lack transparency and interpretability. Without a clear understanding of how these models arrive at their predictions, policymakers may be hesitant to adopt their recommendations. Furthermore, many studies fail to employ rigorous validation techniques, raising concerns about the robustness of their predictive models. This limitation highlights the need for more transparent and reproducible methodologies to build trust in data-driven approaches to happiness research.
These studies underscore the complexity of happiness research, revealing the significant roles played by economic, social, cultural, and governance-related factors in shaping global well-being. Traditional approaches have provided foundational insights but often fail to account for cultural nuances and causal relationships. The emergence of data-driven methodologies, including machine learning and artificial intelligence, has transformed the field, offering more accurate predictions and deeper insights into the determinants of happiness. However, challenges such as data quality, algorithmic bias, and model interpretability remain unresolved.
Despite these advancements, many studies still focus narrowly on isolated variables or rely on models that do not fully explain their predictions. There is a growing recognition that happiness is not determined by any single factor but emerges from the combined influence of income, health, education, trust in institutions, and personal freedoms. In addition, social cohesion and perceptions of fairness can amplify or weaken the effects of material resources. Therefore, in this study, I will be testing the following hypotheses: While global happiness levels are highly correlated with GDP per capita, they are also significantly shaped by an interplay of economic, social, and governance-related factors.
3. Methods
This study adopts a multi-phase analytical approach to uncover the factors influencing global happiness levels. The methodological design begins with data collection and preprocessing, utilizing country-level indicators from trusted international sources. A structured exploratory data analysis (EDA) is then conducted to identify patterns, distributions, and potential correlations between predictor variables and national happiness scores. To build predictive insight, four regression models—Linear Regression, Random Forest, Gradient Boosting, and XGBoost—are trained, each under five randomized seed configurations to ensure robustness. Finally, model interpretability is explained through SHAP (SHapley Additive exPlanations), which quantifies the contribution of each variable to the model predictions. This integrated framework enables both predictive accuracy and a transparent understanding of the most influential socio-economic and governance-related factors.
3.1. Data Description and Preprocessing
The research uses data from the World Happiness Report (WHR) Helliwell et al. (2024), an annual publication initiated in 2012 based on Gallup World Poll data. The report collects survey responses globally from 2005 onward. As of the time of this analysis, I considered the latest data ranging from 2005 to 2023 with observations for up to 165 countries. Each country-year entry comprises happiness scores and a set of socio-economic and subjective well-being indicators.
The key target variable is the Life Ladder score, derived from the Cantril ladder question in which respondents rate their current life on a scale from 0 (worst possible life) to 10 (best possible life). Other features include log GDP per capita (adjusted for purchasing power parity), binary-averaged social support (having someone to count on in times of trouble), healthy life expectancy at birth, freedom to make life choices, generosity (as a residual from a regression on GDP), and perceptions of corruption. Positive and negative affect variables reflect reported emotional states from the previous day.
To ensure analytical validity, I began the analysis with several data preprocessing steps. From the data quality check results, around of entries were missing in the year 2005, while all other years had less than missing data. Median imputation was applied to fill in missing values in critical features, a conservative and robust choice given the nature of the data. All features, except country names, were retained in their original numeric format. The cleaned dataset was subsequently used for both exploratory visualization and predictive modeling.
Table 1 presents the descriptive statistics for the processed data from the World Happiness Report. The dataset includes a total of 2363 observations over 19 years. The mean happiness score (Life Ladder) is 5.48, with a standard deviation of 1.13. The scores range from a minimum of 1.28 to a maximum of 8.02, reflecting significant variation in life satisfaction levels globally. Key factors influencing well-being include log GDP per capita, with a mean of 9.40 and a standard deviation of 1.15, and social support, with a mean of 0.81 and a standard deviation of 0.12. Healthy life expectancy at birth has an average of 63.42 years, ranging from a minimum of 6.72 years—an extremely low value that reflects severe disparities in health outcomes across countries. Freedom to make life choices shows a mean value of 0.75, with relatively low variation (standard deviation of 0.14). Generosity has a more variable distribution, with a standard deviation of 0.16 and values ranging from -0.34 to 0.70. Finally, positive and negative affect scores suggest an emotional balance, with the positive affect having a mean of 0.65 and the negative affect a mean of 0.27, indicating that people generally report more positive emotions than negative ones.
3.2. Regression Models
Regression models are widely used tools for understanding and predicting relationships between a dependent variable and one or more independent variables. These models are essential for quantifying how socio-economic and governance factors influence national happiness scores. In this study, four regression-based models are applied to estimate happiness scores, utilizing a broad array of predictors that capture multiple dimensions of well-being.
To begin, I employ linear regression as the baseline model due to its simplicity, interpretability, and foundational role in statistical analysis. Linear regression offers clear insights into the strength and direction of relationships between predictors and the outcome variable. The coefficients derived from the model are directly interpretable, providing benchmark expectations for how changes in predictors (e.g., GDP, social support, or freedom to make life choices) are associated with changes in happiness. As a foundational method, it serves as a useful reference for evaluating the performance of more advanced models.
Since linear regression may not fully capture complex or non-linear relationships, I also employ three advanced machine learning models: Random Forest, Gradient Boosting, and XGBoost. These models are chosen to capture interactions between predictors and to improve prediction performance.
3.2.1. Random Forest
Introduced by Breiman (2001), Random Forest builds many decision trees and averages their outputs, improving prediction accuracy and generalizability. Each tree is trained on a random subset of the data, and the final prediction is an average of individual tree predictions. This method reduces overfitting and performs well even when the input space is noisy or high-dimensional, making it well-suited for data involving complex socio-economic patterns.
3.2.2. Gradient Boosting
Formulated by Friedman (2001), Gradient Boosting sequentially fits new models to the residuals of earlier ones, improving predictions over time. This iterative process prioritizes hard-to-predict cases and helps capture subtle patterns in the data. Its ability to model complex interactions between variables makes it a strong candidate for social science applications where relationships are rarely linear or isolated.
3.2.3. XGBoost
Developed by Chen and Guestrin (2016), XGBoost extends gradient boosting by optimizing for speed and incorporating regularization techniques to prevent overfitting. It uses tree pruning, parallel computing, and robust handling of missing values, making it one of the most effective tools for structured data. Its superior performance and scalability have made it a popular choice for competitions and applied research across disciplines.
3.3. SHapley Additive exPlanations (SHAP)
SHAP (SHapley Additive exPlanations) is an interpretability technique grounded in cooperative game theory. It assigns each feature an importance value that explains how much it contributed to a particular prediction. Introduced by Lundberg and Lee (2017), SHAP unifies various earlier interpretation methods into a single framework that satisfies key properties such as local accuracy and consistency.
In regression models, SHAP values explain how each feature contributed to the difference between a prediction and the average model output. In this study, SHAP is used to interpret predictions from all four models, making it possible to assess not only which features matter most, but also how their influence varies across countries. By averaging SHAP values across all predictions, the study derives a global feature importance ranking that reveals the most consistent drivers of national happiness. This approach provides both transparency in model decisions and actionable insights for policymakers aiming to enhance well-being.
4. Results
4.1. Exploratory Analysis
To gain deeper insight into patterns that inform predictive modeling, I conducted exploratory analysis, including visualization of distributions, detailed statistical summaries, assessment of missing data patterns, evaluation of variable transformations, and exploration of regional and temporal trends.
The happiness distribution in Figure 1 reveals that most countries cluster around the mean score of 5–6 on the 0–10 scale, indicating a moderate level of life satisfaction across the global population. There are few extreme values: highest scores ~7.7–7.8 (Finland, Denmark, Iceland) and lowest ~2.8–3.0 (lowest-ranking countries). A clear upward trend is visible in the subjective well-being scores from 2006 to 2023, with the median Life Ladder values steadily rising from approximately 5.1 to 5.9. This increase reflects improvements in global life satisfaction over the past two decades. However, it’s important to note that due to the absence of data from 2005, the average Life Ladder score for that year is less representative and thus can’t be directly compared. Year 2023 exhibiting the highest recorded median (5.9) and most compact distribution (narrowest interquartile ranges), suggesting that 1) the average life satisfaction across countries has improved over time; 2) there is less variability in well-being outcomes, which indicates a reduction in inequality in subjective well-being across nations.
Since the dataset contains geographic and time components, I plotted the happiness score over time for all reported countries on a world map visualization. Figure 2 illustrates the changes in happiness globally, updating every 3 years. Nordic nations persistently demonstrate the highest Life Ladder scores (), forming a stable well-being core throughout the observation period. On the other hand, we can see an accelerating positive trajectory in East Asia, transitioning happiness scores from moderate () to high () happiness tiers by 2023. These geospatial patterns confirm regional clustering of well-being trajectories and underscore the geographical zones with pre-existing vulnerabilities where well-being scores remain persistently low.
Pairwise relationship plots are used to explore the relationships between all variables. Life Ladder, Log GDP per capita, Social support, Healthy life expectancy at birth, and Generosity are highlighted in Figure 3. As expected, happiness rises with GDP per capita, as shown by the scatterplot, however, substantial scatter around the trendline indicates that other factors are also influencing well-being. Both Social support and Healthy life expectancy at birth show clear correlations with Life Ladder, with both variables exhibiting heavily left-skewed distributions. This suggests that while these factors are positively associated with life satisfaction, they also display significant inequality in their distribution across countries. Generosity, however, reveal an obvious pattern with the Life Ladder, implying that further analysis is needed to identify the importance and underlying relationship of this determinant.
Next I conducted correlation analysis for all variables. Figure 4 shows that the correlations between features were generally moderate (Pearson ). The strongest positive correlates of happiness are log GDP per capita (), social support (), and healthy life expectancy (). Generosity has a weaker but positive correlation (). Corruption perception shows a modest negative correlation, indicating that higher levels of perceived corruption in a country are associated with lower happiness scores. Notably, Freedom of choice displays a moderate correlation with Life Ladder (), but forms a distinct cluster with Positive affect () and Social support (), suggesting that autonomy-affect factors and emotional well-being may be distinct from the economic factors driving happiness. The overall absence of strong multicollinearity (all ) supports to model these as distinct operational constructs in well-being architecture.
4.2. Predictive Modeling
In order to examine if the explanatory variables are key determinant that can influence and predict the happiness score trend, I built regression models for predictive modeling. Since the dataset includes time series components, instead of randomly splitting the data into training and validation sets, I split by years. The training set contains data from 2005 to 2021 (2085 data points), while the validation set includes data from 2022 and 2023 (278 data points), resulting in an approximately 88% to 12% split.
I fit four regression models to predict the happiness score: (1) Linear Regression; (2) Random Forest (3) Gradient Boosting Machine (GBM) and (4) XGBoost (extreme gradient boosting). These models cover both linear and non-linear approaches, providing a broad view of the predictive landscape. Among these models, I used linear regression model results as the baseline to compare, see if more complicated model with non-linearity can achieve better overall performance. The metrics I considered for model comparison include Mean Squared Error (), Mean Absolute Error () and (coefficient of determination).
As the baseline, the Linear Regression (Figure 5) achieves reasonable performance with testing metrics: , , ), explaining of the variance in well-being scores. These results suggest that the linear regression model is fairly effective in capturing the overall trend in happiness, offering a solid starting point for comparison. While these metrics indicate decent explanatory power, the model likely suffers from potential underfitting, meaning it may not fully capture more complex patterns or interactions within the data. Additionally, the model’s sensitivity to certain variables may be limited, as it assumes linear relationships between predictors and the outcome. Despite these limitations, the linear regression model provides a valuable competitive benchmark for evaluating the performance of more sophisticated models in subsequent comparisons.
The performance of all other models (Figure 6) demonstrate distinct trade-offs between training accuracy and generalization capability. Random Forest achieves very high testing performance (, ) with reasonable training-testing gap (), suggesting effective regularization despite its high training accuracy (). This indicates that the model can effectively learn from the data while preventing overfitting. Gradient Boosting shows more balanced results (testing ), but has limited generalization ability, as shown in its smaller testing-to-training difference (). XGBoost shows extreme training precision (, ), reveals potential overfitting, as evidenced by its testing performance () falling below Random Forest. Notably, Random Forest maintains the lowest testing MSE ( vs for the other models) and the most stable MAE (0.3734), making it the current front-runner among the models. All three models outperform the linear regression baseline (testing ), confirming their value for this prediction task. However, the variance in their generalization patterns suggests that further analysis of feature importance is needed to optimize model selection and enhance generalization across unseen data.
Therefore, to optimize model selection and ensure stable results, I conducted experiments to fine-tune the models and account for randomness. Each model was trained and tested 5 times using different random seeds (Table 2). The evaluation of Random Forest, Gradient Boosting, and XGBoost across the 5 distinct random seeds provides critical insights into their stability, predictive accuracy and generalization capabilities. This repeated testing allows for a more robust understanding of how each model performs under varying conditions. All models were evaluated using , , and to measure performance consistency.
Gradient Boosting emerges as the top performer, achieving the lowest mean and highest mean across all trials. Figure 7 shows the actual vs predicted happiness with the best Gradient Boosting model. This level of predictive accuracy is particularly impressive given the model’s consistent performance. With standard deviations of just for and for , Gradient Boosting shows remarkable precision and stability, indicating that it not only fits the training data well but also generalizes effectively to unseen data. These low standard deviations suggest minimal variation in its performance across different random seeds, implying that the model is reliable and resistant to fluctuations. The high performance of Gradient Boosting makes it a robust choice for predicting well-being scores, especially when the goal is to make accurate predictions across a range of scenarios.
Random Forest, while demonstrating reliable performance, achieves slightly weaker results compared to Gradient Boosting, with a mean and . However, it compensates for this with a remarkable level of stability. The standard deviation for is extremely low, at just , which indicates that Random Forest’s performance is exceptionally stable, irrespective of the random seeds used in training. This stability suggests that the model is not sensitive to slight variations and can consistently provide predictions with minimal deviation. Additionally, the ratio of approximately suggests that Random Forest handles prediction errors in a balanced manner. This means it does not show a significant bias towards over-predicting or under-predicting outcomes, which is crucial for maintaining fairness and reliability in predictions.
XGBoost, on the other hand, shows the most variable performance among the three models. Its ranges from to () and its fluctuates between and . Although the best performance of XGBoost nearly matches the average performance of Random Forest, the model exhibits greater variability in its results, suggesting that it is more sensitive to initialization, such as random seed choices, and may be more prone to overfitting or instability in certain cases. This higher variability could also point to the need for more extensive hyperparameter tuning, as small adjustments in parameters like learning rate or tree depth could have a significant impact on its performance. Additionally, the ratio of approximately indicates that XGBoost’s error distribution is slightly more “heavy-tailed” than that of Random Forest and Gradient Boosting, suggesting higher sensitivity to outliers or large prediction errors. This suggests that XGBoost might struggle with certain types of noisy or irregular data, where a more stable error distribution is preferred.
In summary, while all three models demonstrate stronger predictive capabilities than the Linear Regression baseline, Gradient Boosting stands out as the best model due to its highest accuracy, lowest variability, and overall robust performance across different random seeds. Therefore, I used Gradient Boosting for further intepretability analysis.
4.3. SHAP Analysis
Gradient Boosting, as the best model from my experiments, contains non-linear modeling, it is essential to add more interpretability to the model’s behaviour. To achieve this, I conducted SHAP analysis to quantify and visualize the marginal contribution of each input feature to the predicted national happiness scores. SHAP provides both global and local interpretability, making it well-suited for complex models like Gradient Boosting, which could otherwise function as black boxes. By using SHAP, we can gain valuable insights into how each feature influences the model’s predictions, helping to enhance its transparency.
Figure 8 presents the SHAP summary plot for the top six predictors. Each point represents a country-year observation, with the SHAP value on the x-axis indicating the direction and magnitude of a feature’s effect on the model’s output. Features are ranked top-to-bottom by their mean absolute SHAP values. The color gradient reflects the actual feature values, where red denotes high and blue denotes low values.
The plot reveals that Log GDP per capita is the most influential predictor, with high-income countries (red points) consistently pushing happiness predictions upward, and low-income countries (blue points) exerting a negative impact. Social support and Healthy life expectancy follow as the next most impactful features. Countries with strong social networks and longer expected healthy lifespans tend to receive positive contributions to their predicted happiness scores. Freedom to make life choices and Generosity show more dispersed effects, indicating that their influence varies across national contexts. Lastly, perceptions of corruption primarily exhibit negative SHAP values, meaning that higher levels of perceived corruption diminish model-predicted happiness, while lower corruption levels provide modest positive contributions.
To further interpret model behavior, SHAP dependence plots were used to investigate how the effect of a feature changes across its value range and how it interacts with other variables. In Figure 9, we can see the dependence of SHAP values on Log GDP per capita, colored by Social support. The nonlinear association shows increasing returns to GDP up to a log value of about . Importantly, countries with higher Social support (redder points) exhibit greater SHAP contributions for the same level of GDP, indicating that the positive impact of income on happiness is amplified when embedded in strong social frameworks. This interaction reinforces the notion that economic prosperity and social cohesion are driving subjective well-being together.
For the dependence plot of healthy life expectancy at birth, with color indicating log GDP per capita, the positive relationship is evident: as healthy life expectancy increases, so does its SHAP contribution, especially between 55 and 70 years. This effect, however, diminishes beyond 70 years, suggesting diminishing marginal utility of health at higher thresholds. Notably, countries with higher GDP per capita (redder points) experience stronger SHAP gains from improvements in life expectancy, pointing to an interaction effect that wealthier countries are more likely to translate longevity into higher subjective well-being.
Finally, global feature importance (Figure 10) was quantified by averaging the absolute SHAP values across all country-year observations. The top six contributors to predicted happiness were: log GDP per capita (mean ), healthy life expectancy at birth (), social support (), freedom to make life choices (), generosity (), and perceptions of corruption (). These values confirm the dominance of economic and health-related variables, with log GDP per capita alone accounting for over of the total feature attribution. Together, the top three features comprise more than of the total SHAP contribution, indicating that these dimensions overwhelmingly drive the model’s predictions. The relatively smaller but still meaningful contributions of freedom, generosity, and corruption suggest these governance and behavioral factors act as important refinements rather than primary determinants in the model.
The SHAP analysis provides a robust and interpretable framework help us to understand better the criteria that the best Gradient Boosting model uses to predict cross-national happiness scores. The patterns confirm the centrality of wealth, health, and social cohesion, and highlights the important non-linearities and interaction effects that deepen our understanding of the structural drivers of subjective well-being.
5. Discussion
The findings from the descriptive analysis and predictive modeling largely support the initial hypotheses, offering valuable insights into the key determinants of country-level happiness. The strongest predictors of global happiness, as indicated by the models, are log GDP per capita, social support networks, and healthy life expectancy, as explained by SHAP analysis. These factors consistently emerged as the most important contributors to the variability in happiness scores across nations. From an economic perspective, the positive relationship between wealth and life satisfaction is well-established, with higher GDP per capita providing the resources and security that individuals need to achieve greater well-being. Wealth enables access to better healthcare, education, and living standards, all of which are essential for a higher quality of life and, in turn, greater life satisfaction.
However, the analysis also highlights the equally crucial role of social capital and governance-related factors in explaining national happiness. The role of social support networks emerges as a key factor in promoting happiness. Similarly, healthy life expectancy underscores the impact of public health and healthcare systems on happiness, reinforcing the notion that well-being is not solely driven by economic factors. These results suggest that policies aimed at improving social cohesion, healthcare infrastructure, and public health initiatives should be prioritized alongside economic growth when seeking to enhance national happiness.
Conversely, perceptions of corruption emerged as a significant negative predictor of happiness. As shown in the SHAP (Shapley Additive Explanations) results, higher levels of corruption are strongly linked with lower happiness, aligning with existing research that suggests corruption undermines trust in government institutions and erodes social capital. Once countries reach a certain income level, corruption becomes especially damaging, reducing happiness despite high wealth levels. This finding supports the idea that good governance, transparency, and the rule of law are essential for fostering national well-being.
Interestingly, generosity and freedom to make life choices, despite being important components of well-being theory, showed weaker direct effects in our regression models. This could be due to challenges in the cross-country comparability of the generosity and freedom surveys. Additionally, the impact of these variables might be more indirect, mediated through income and social channels, suggesting that their influence on happiness is more subtle and contingent on other socio-economic factors.
From the predictive modeling and model performance comparison, we conclude that Gradient Boosting outperforms all other models, achieving a of approximately 0.0567 over the baseline linear regression model. This improvement highlights the advantage of non-linear models in capturing complex patterns that linear models often miss. While global happiness follows some linear trends, Gradient Boosting accounts for interactions among predictors, such as GDP, social support, and life expectancy, which enhances its explanatory power. Additionally, Gradient Boosting demonstrated high stability across different random seeds, reinforcing its robustness and reliability. This stability ensures that the model’s performance is consistent, even when trained on different data subsets.
Overall, the findings support the hypothesis that while global happiness levels are strongly correlated with GDP per capita, they are also significantly shaped by an interplay of economic, social, and governance-related factors. Wealth, particularly through GDP per capita, remains a central driver of happiness. However, the study also reveals that factors like social support, public health, and governance play equally important roles in influencing national well-being. This suggests that a more holistic approach that combines economic prosperity with strong social safety nets, effective governance and public health initiatives, is essential for improving happiness at a national level.
6. Future Work
This study provides a comprehensive snapshot of the key correlates of global happiness but also presents several avenues for further exploration. One key area for future research is the time dimension. While this analysis captures important cross-sectional relationships, a more detailed time-series analysis could offer deeper insights into how happiness and its determinants evolve over time. This would involve examining how changes, such as economic shocks, policy reforms, or global events (e.g., the COVID-19 pandemic), impact well-being at both individual and societal levels. A time-series approach could shed light on causal relationships and long-term trends that were not fully explored in the current study, such as the sustained effects of short-term events or policy interventions.
In particular, the role of global “black swan” events, like the COVID-19 pandemic, warrants more in-depth investigation. These unprecedented events can have profound and immediate effects on happiness, and understanding how they influence different regions and demographics could refine our understanding of how external shocks impact global well-being. Future studies should focus on exploring the short-term disruptions caused by such events and their long-term recovery patterns, offering valuable insights for policymakers and researchers aiming to strengthen resilience and improve national happiness in times of crisis.
Another promising direction for future research is the application of more advanced machine learning techniques. While the current study employs a robust set of models, incorporating more complex techniques, such as deep learning algorithms, could improve predictive accuracy and reveal even more intricate, non-linear relationships between happiness and its various correlates. These methods could uncover patterns that simpler models may overlook, offering new perspectives on the factors that contribute to well-being.
Additionally, expanding the dataset to include a broader range of global indices and sources could significantly enhance the depth and robustness of future analyses. While this study relies heavily on the World Happiness Report, integrating data from other global indices, such as the Happy Planet Index (HPI) Abdallah, Hoffman, and Akenji (2024) and national surveys, could provide a more nuanced and comprehensive understanding of happiness across different cultural and economic contexts. By incorporating diverse datasets, future studies can address potential biases or limitations inherent in any single source, offering a more holistic view of global well-being.
Finally, future research could focus on examining individual-level data with controls for demographic factors such as age, gender and income. This would provide valuable insights into how broad, macro-level trends manifest at the personal level. A more granular analysis could reveal whether the patterns observed in this study hold true across different demographic groups and individual experiences, helping to identify specific factors that drive happiness for different populations.
In conclusion, while this study offers a thorough examination of the correlates of global happiness, future research can expand upon these findings by incorporating time-series analysis, more advanced machine learning techniques, and diverse datasets. These efforts would further refine our understanding of the drivers of happiness and provide actionable insights to improve well-being on a global scale.
Data Availability Statement
The raw happiness data used in this study comes from the World Happiness Report, which is based on the Gallup World Poll. For academic purposes, the most up-to-date and publicly available version of the data can be accessed through Kaggle, a popular platform for data science and research. Researchers can access and analyze this dataset under the terms of Kaggle’s licensing, which supports its non-commercial, academic, and research-oriented use. Code for this study is available at https://github.com/KVonY/GRAD699-World-Happiness-Analysis.
References
- Abdallah, S., Hoffman, A., & Akenji, L. (2024). The 2024 happy planet index. Berlin: Hot or Cool Institute.
- Azad, A., Talwar, B., Shah, S., Prasad Shendre, H., Jyoti, A., Pandit, G., & Tiwari, V. (2023). Prediction model for world happiness index using machine learning technique. Kilby, 100, 7th.
- Brandy, S. (2024). Mapping global joy: Descriptive analytics of subjective well-being from the world happiness report. International Journal of Information Technology and Computer Science Applications, 2(1), 33–47. [CrossRef]
- Breiman, L. (2001). Random forests. Machine Learning, 45(1), 5–32. [CrossRef]
- Chen, T., & Guestrin, C. (2016). XGBoost: A scalable tree boosting system. Proceedings of the 22nd ACM SIGKDD International Conference on Knowledge Discovery and Data Mining, 785–794. ACM. [CrossRef]
- Dixit, S., Chaudhary, M., & Sahni, N. (2020). Network learning approaches to study world happiness. arXiv Preprint arXiv:2007.09181.
- Dolan, P., & Metcalfe, R. (2012). Measuring subjective wellbeing: Recommendations on measures for use by national governments. Journal of Social Policy, 41(2), 409–427. [CrossRef]
- Friedman, J. H. (2001). Greedy function approximation: A gradient boosting machine. Annals of Statistics, 1189–1232. [CrossRef]
- Graham, C., & Nikolova, M. (2015). Bentham or aristotle in the development process? An empirical investigation of capabilities and subjective well-being. World Development, 68, 163–179. [CrossRef]
- Helliwell, J. F., Layard, R., Sachs, J., De Neve, J.-E., Aknin, L. B., & Wang, S. (2024). World happiness report: Origins, purpose, contents, impact and future. In Encyclopedia of happiness, quality of life and subjective wellbeing (p. 296). Edward Elgar Publishing.
- Jannani, A., Sael, N., & Benabbou, F. (2021, December). Predicting quality of life using machine learning: Case of world happiness index. 1–6. [CrossRef]
- Lundberg, S. M., & Lee, S.-I. (2017). A unified approach to interpreting model predictions. In I. Guyon, U. V. Luxburg, S. Bengio, H. Wallach, R. Fergus, S. Vishwanathan, & R. Garnett (Eds.), Advances in neural information processing systems 30 (pp. 4765–4774). Curran Associates, Inc. Retrieved from http://papers.nips.cc/paper/7062-a-unified-approach-to-interpreting-model-predictions.pdf.
- Mukhopadhyay, K., Adhikary, C., Saha, D., Dutta, C., & Baksi, R. (2022). Exploratory data analysis on healthy lifestyle & world happiness report in asia & europe. PREPARE@ u®| FOSET Conferences.
- Saputri, T. R. D., & Lee, S.-W. (2015). Are we living in a happy country: An analysis of national happiness from machine learning perspective. SEKE, 174–177.
Figure 1.
Distribution for World Happiness by Year
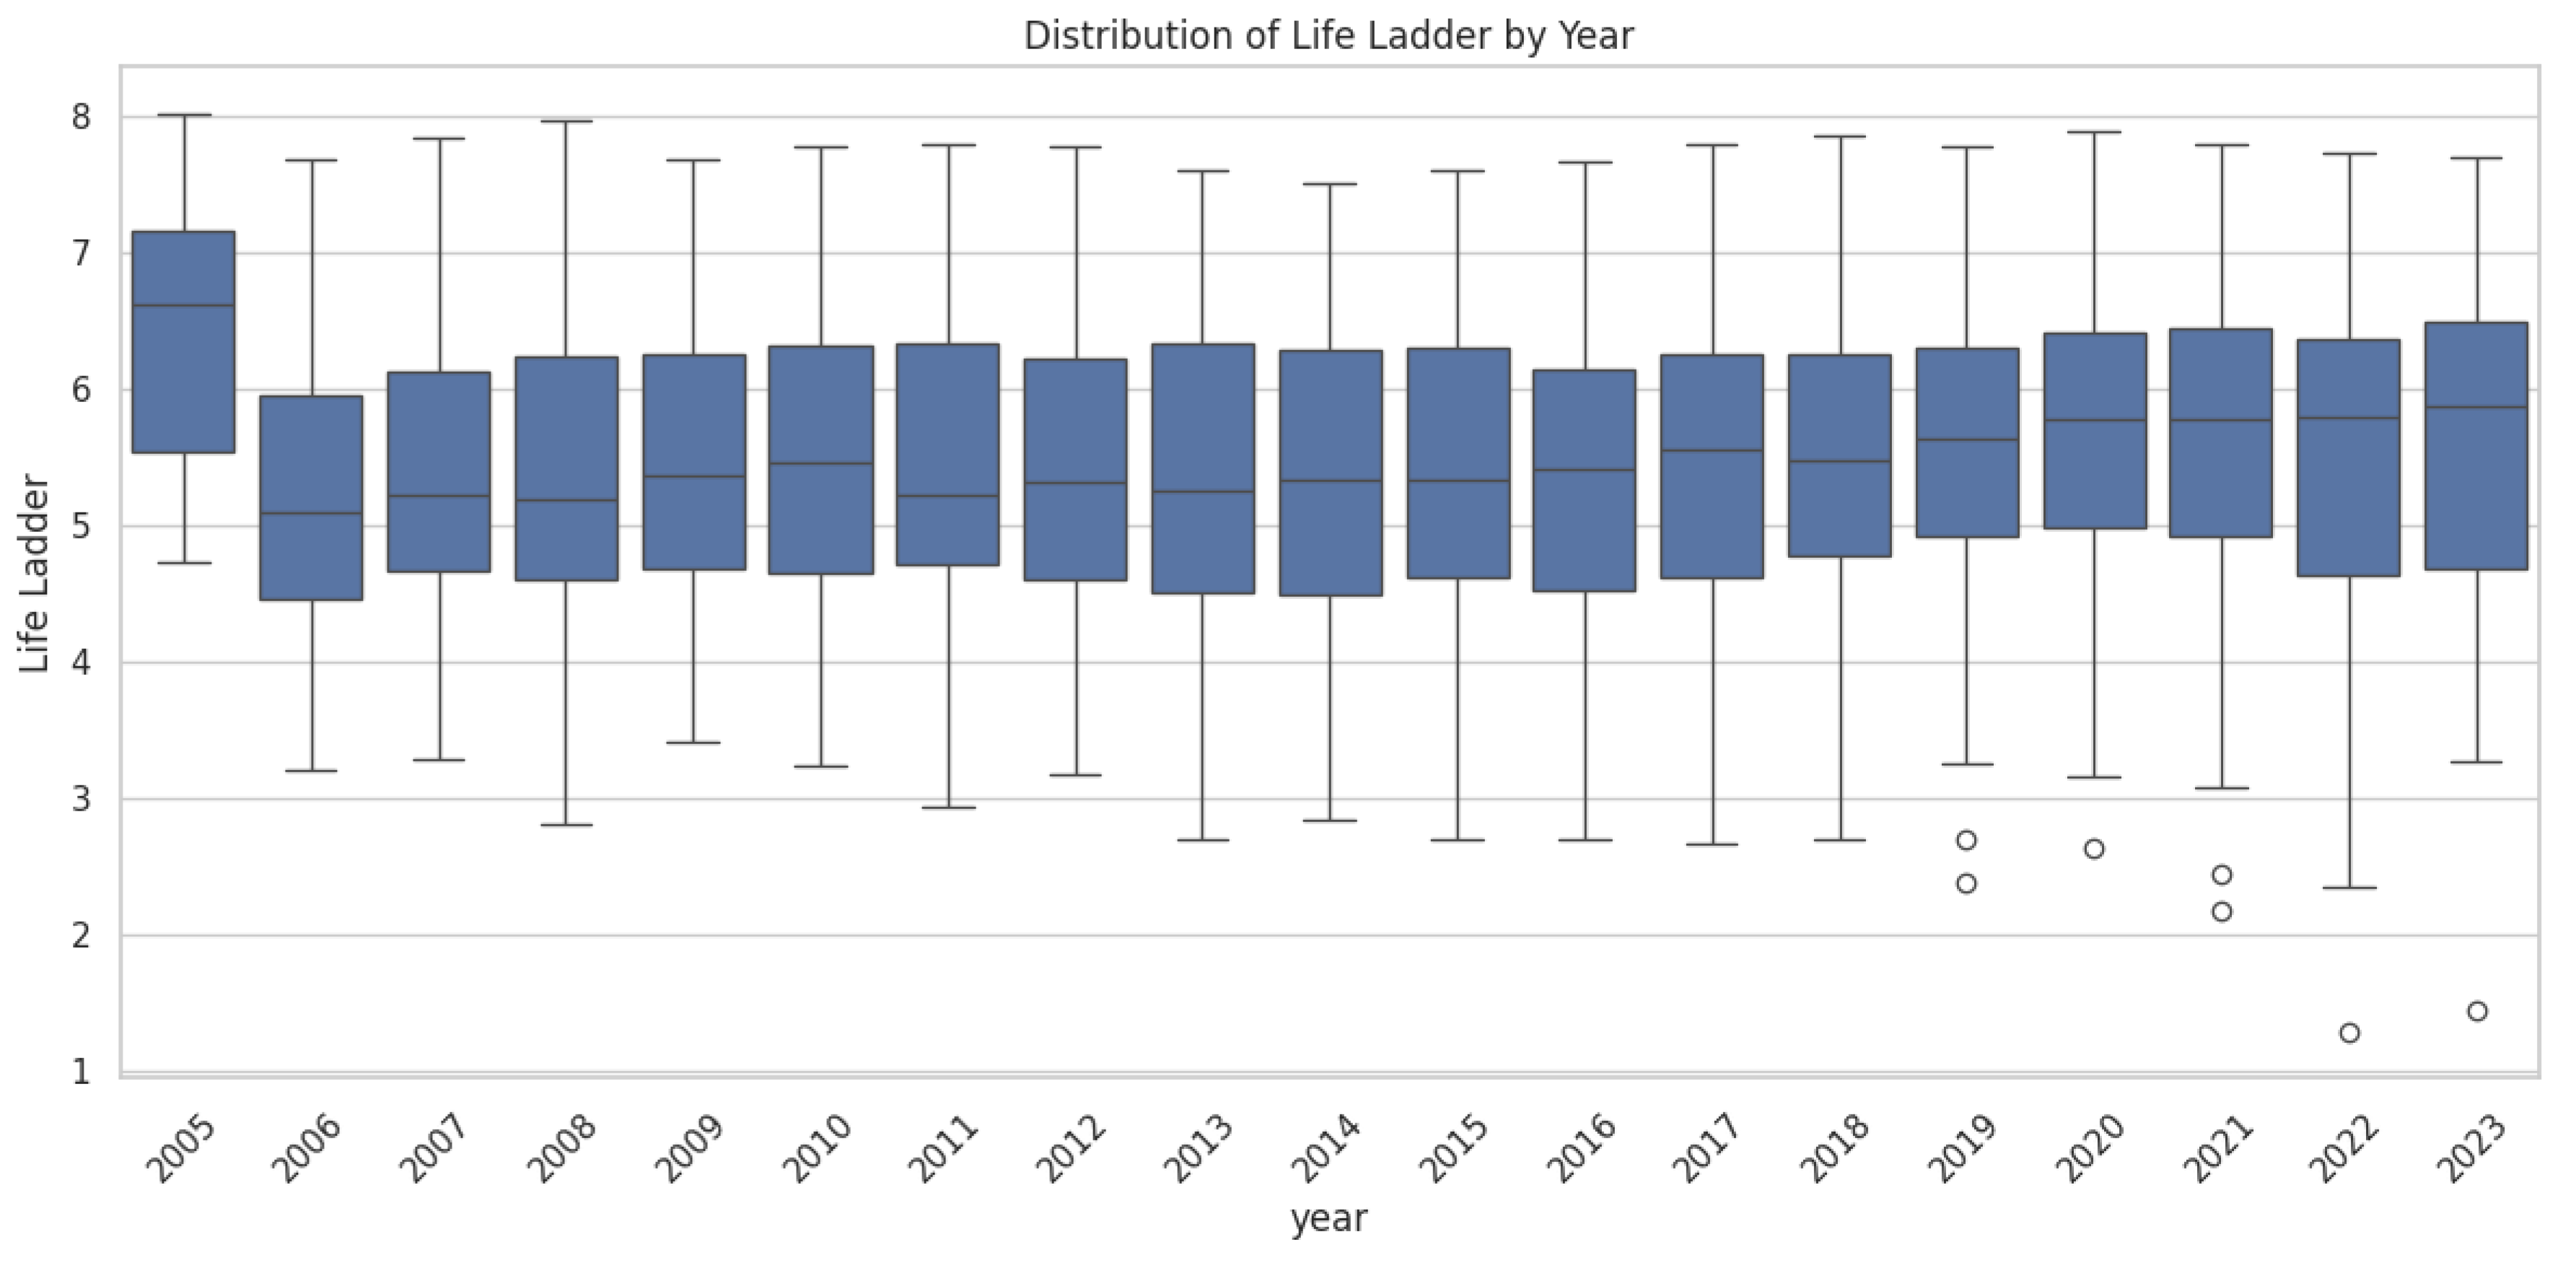
Figure 2.
World Happiness by Year
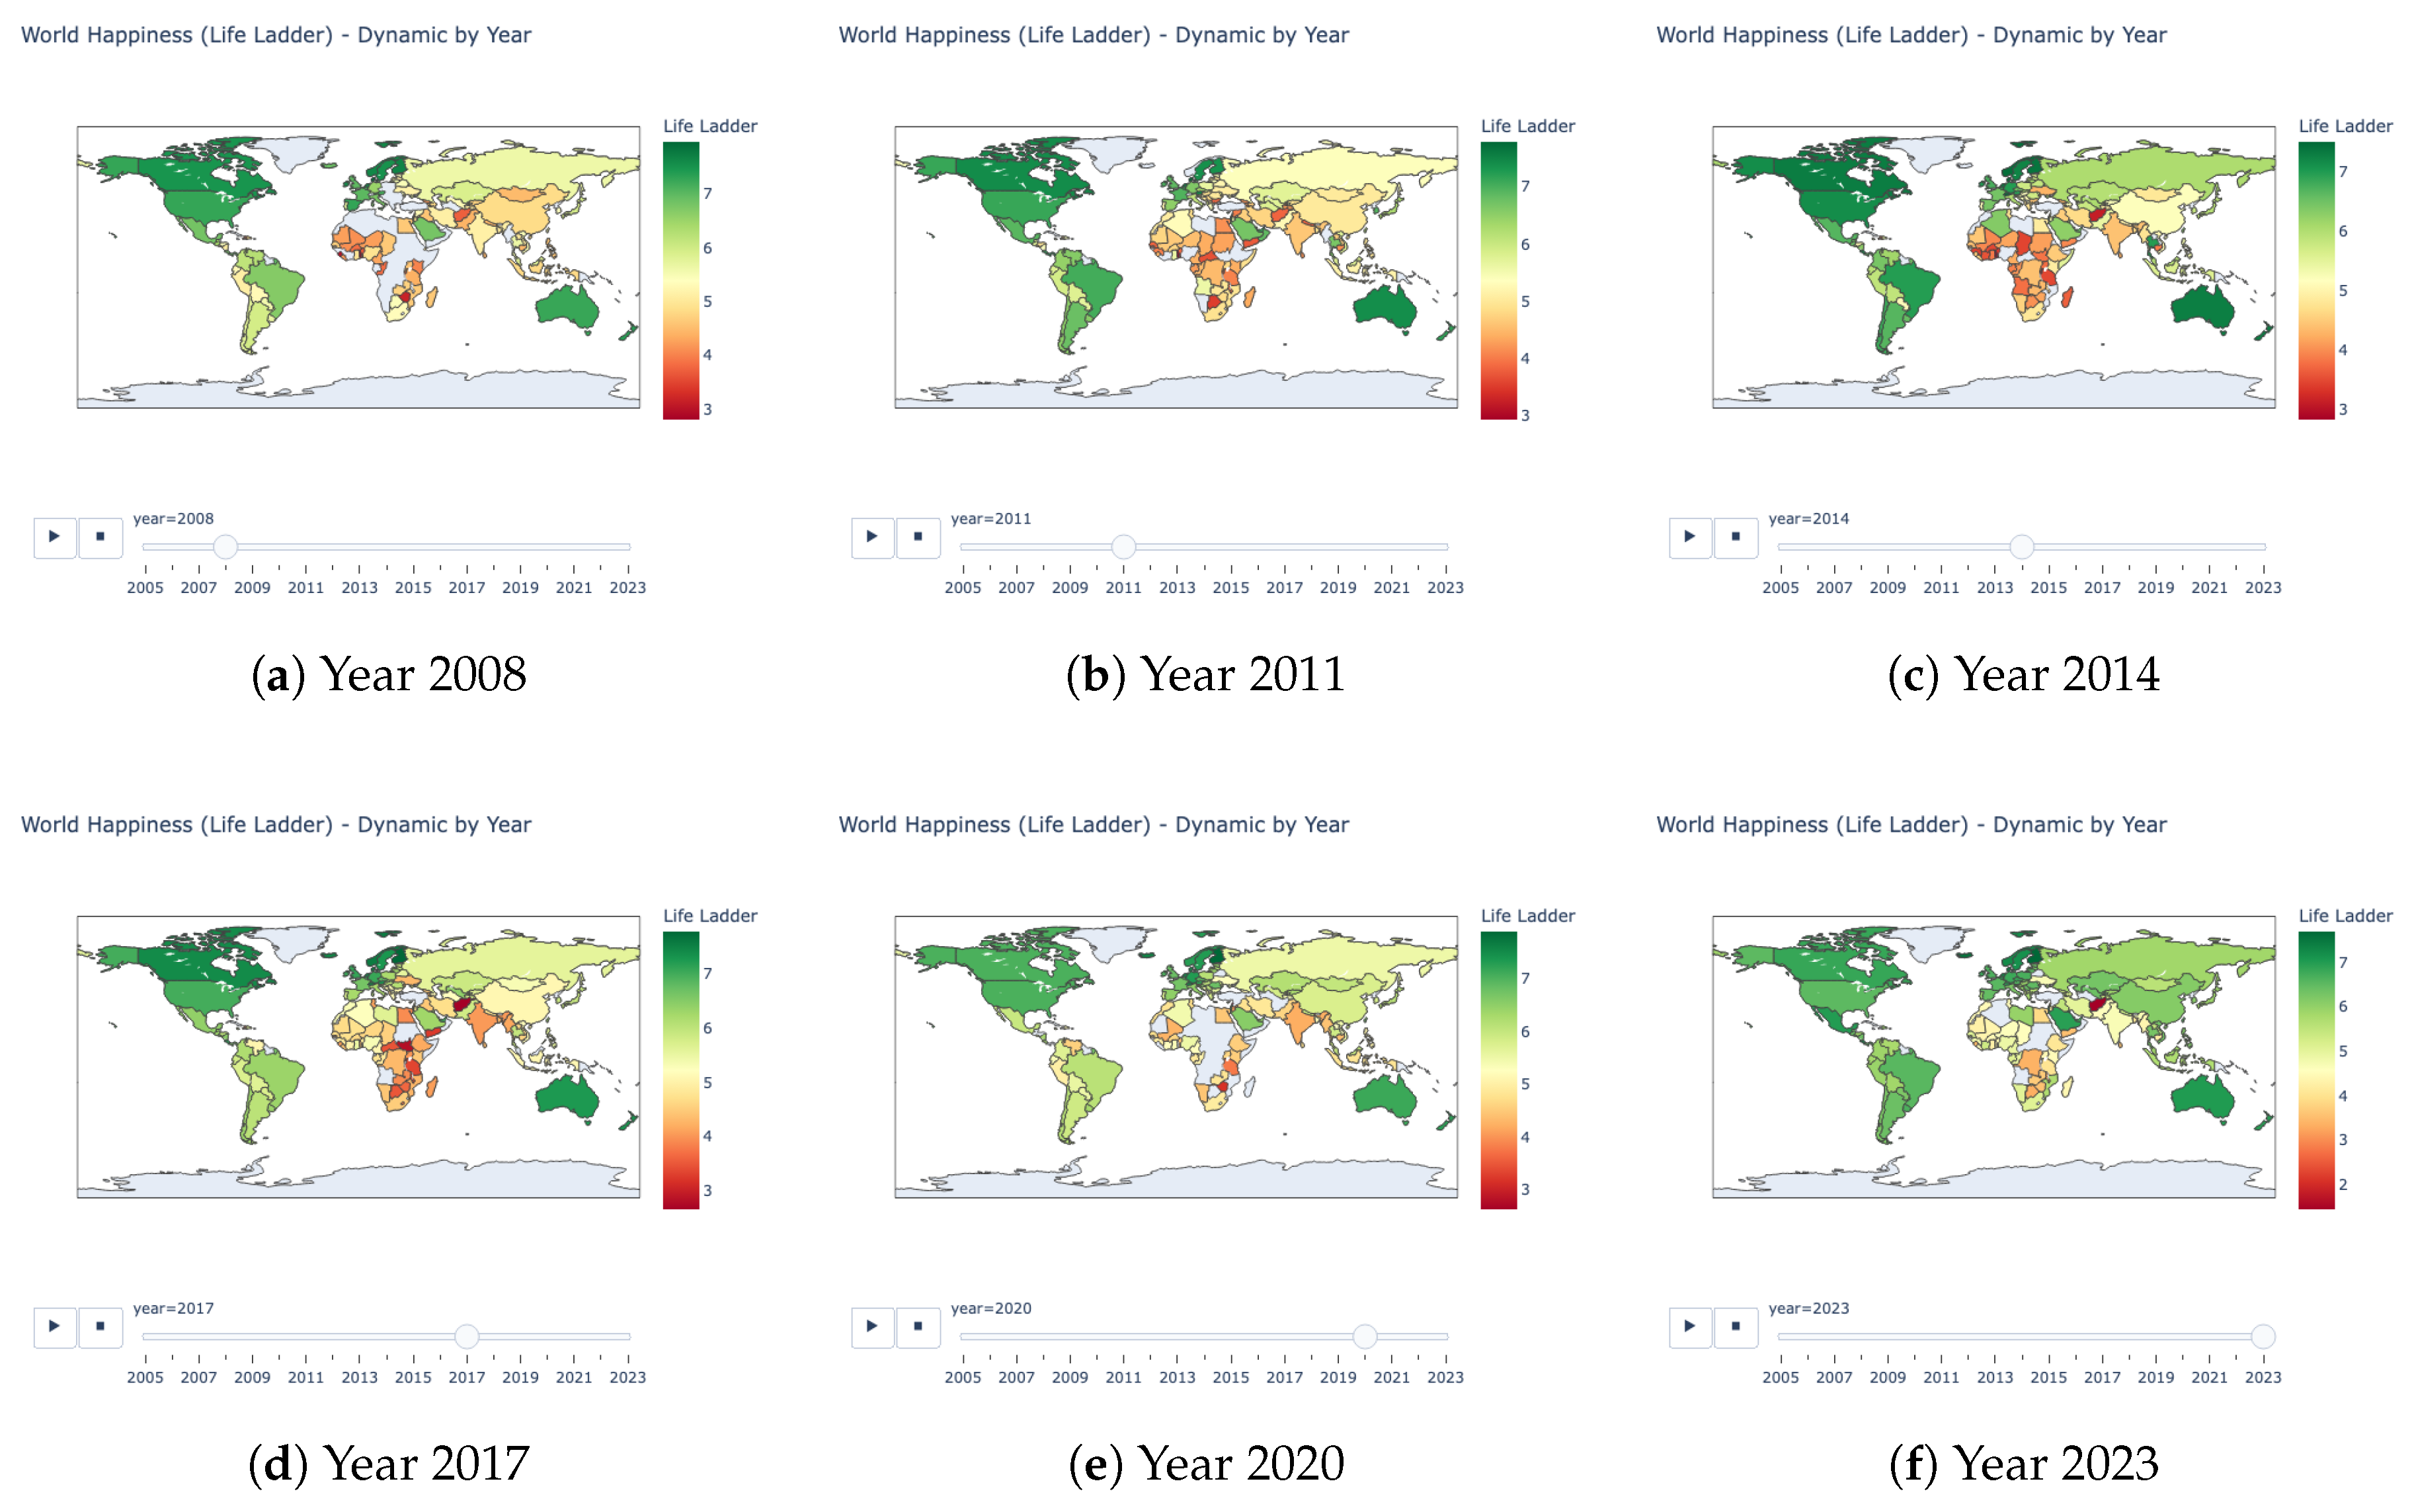
Figure 3.
Pairwise Relationship for Highlighted Variables
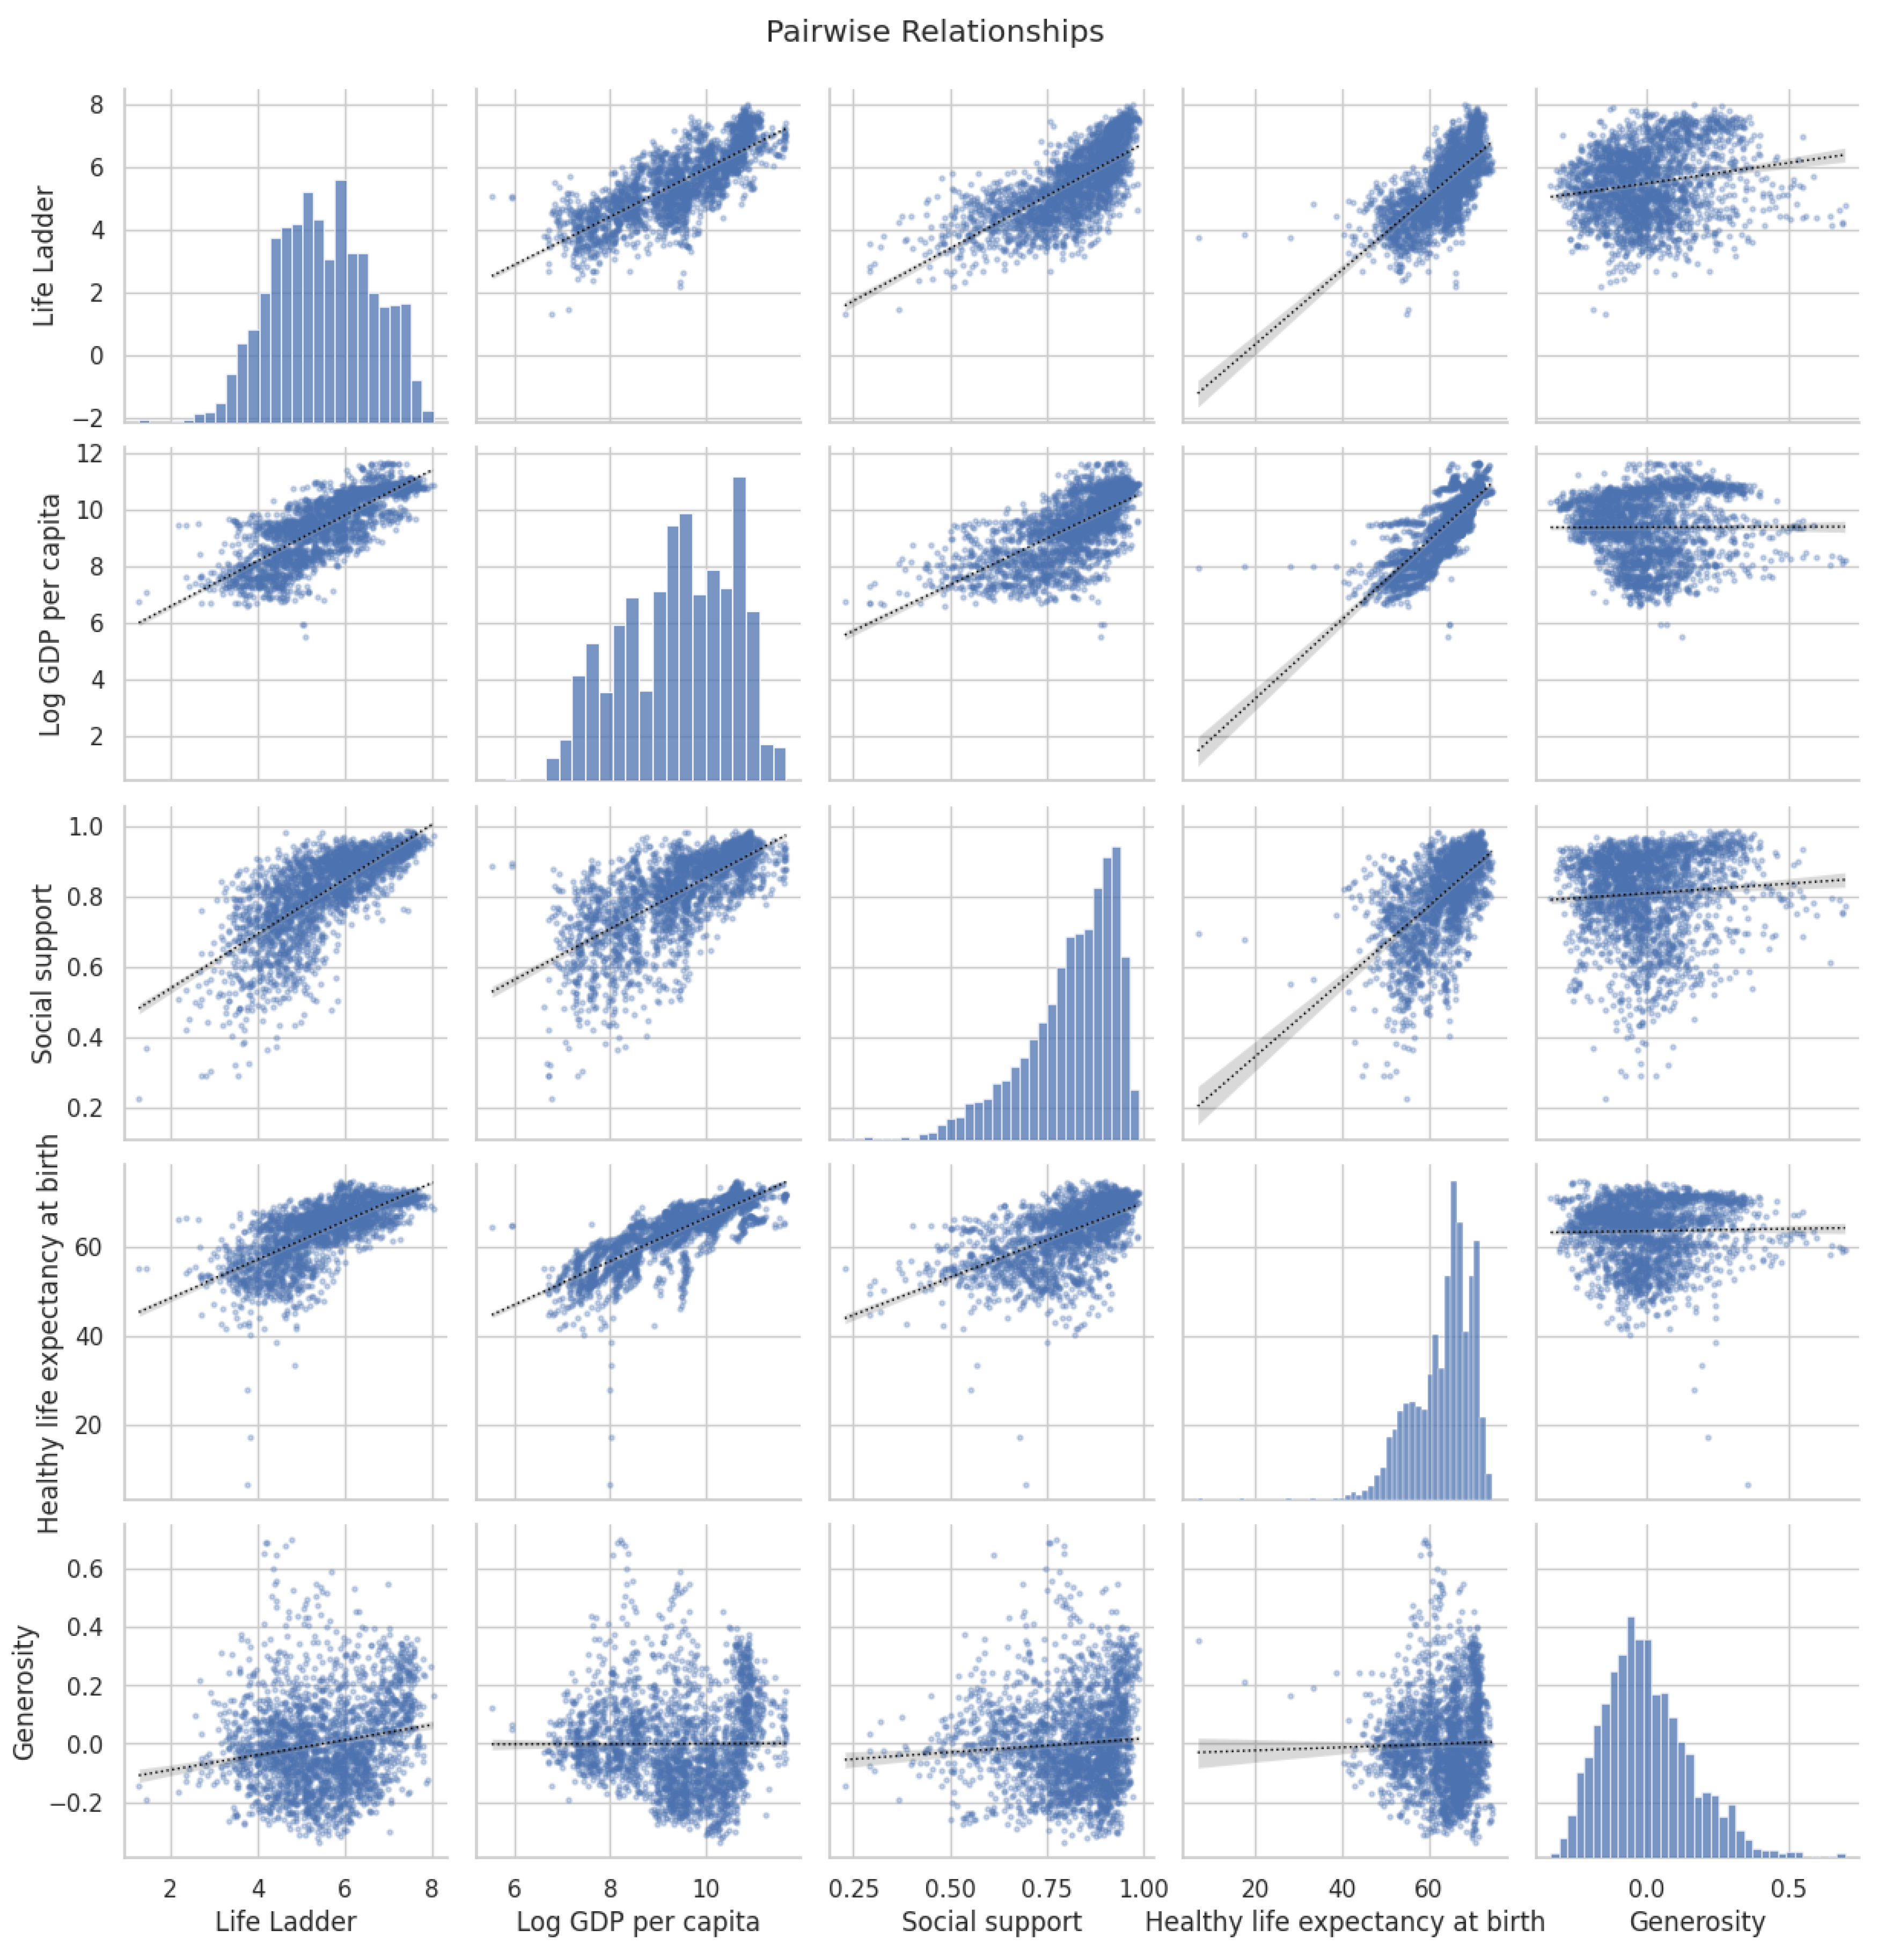
Figure 4.
Correlation Heatmap of Happiness Factors
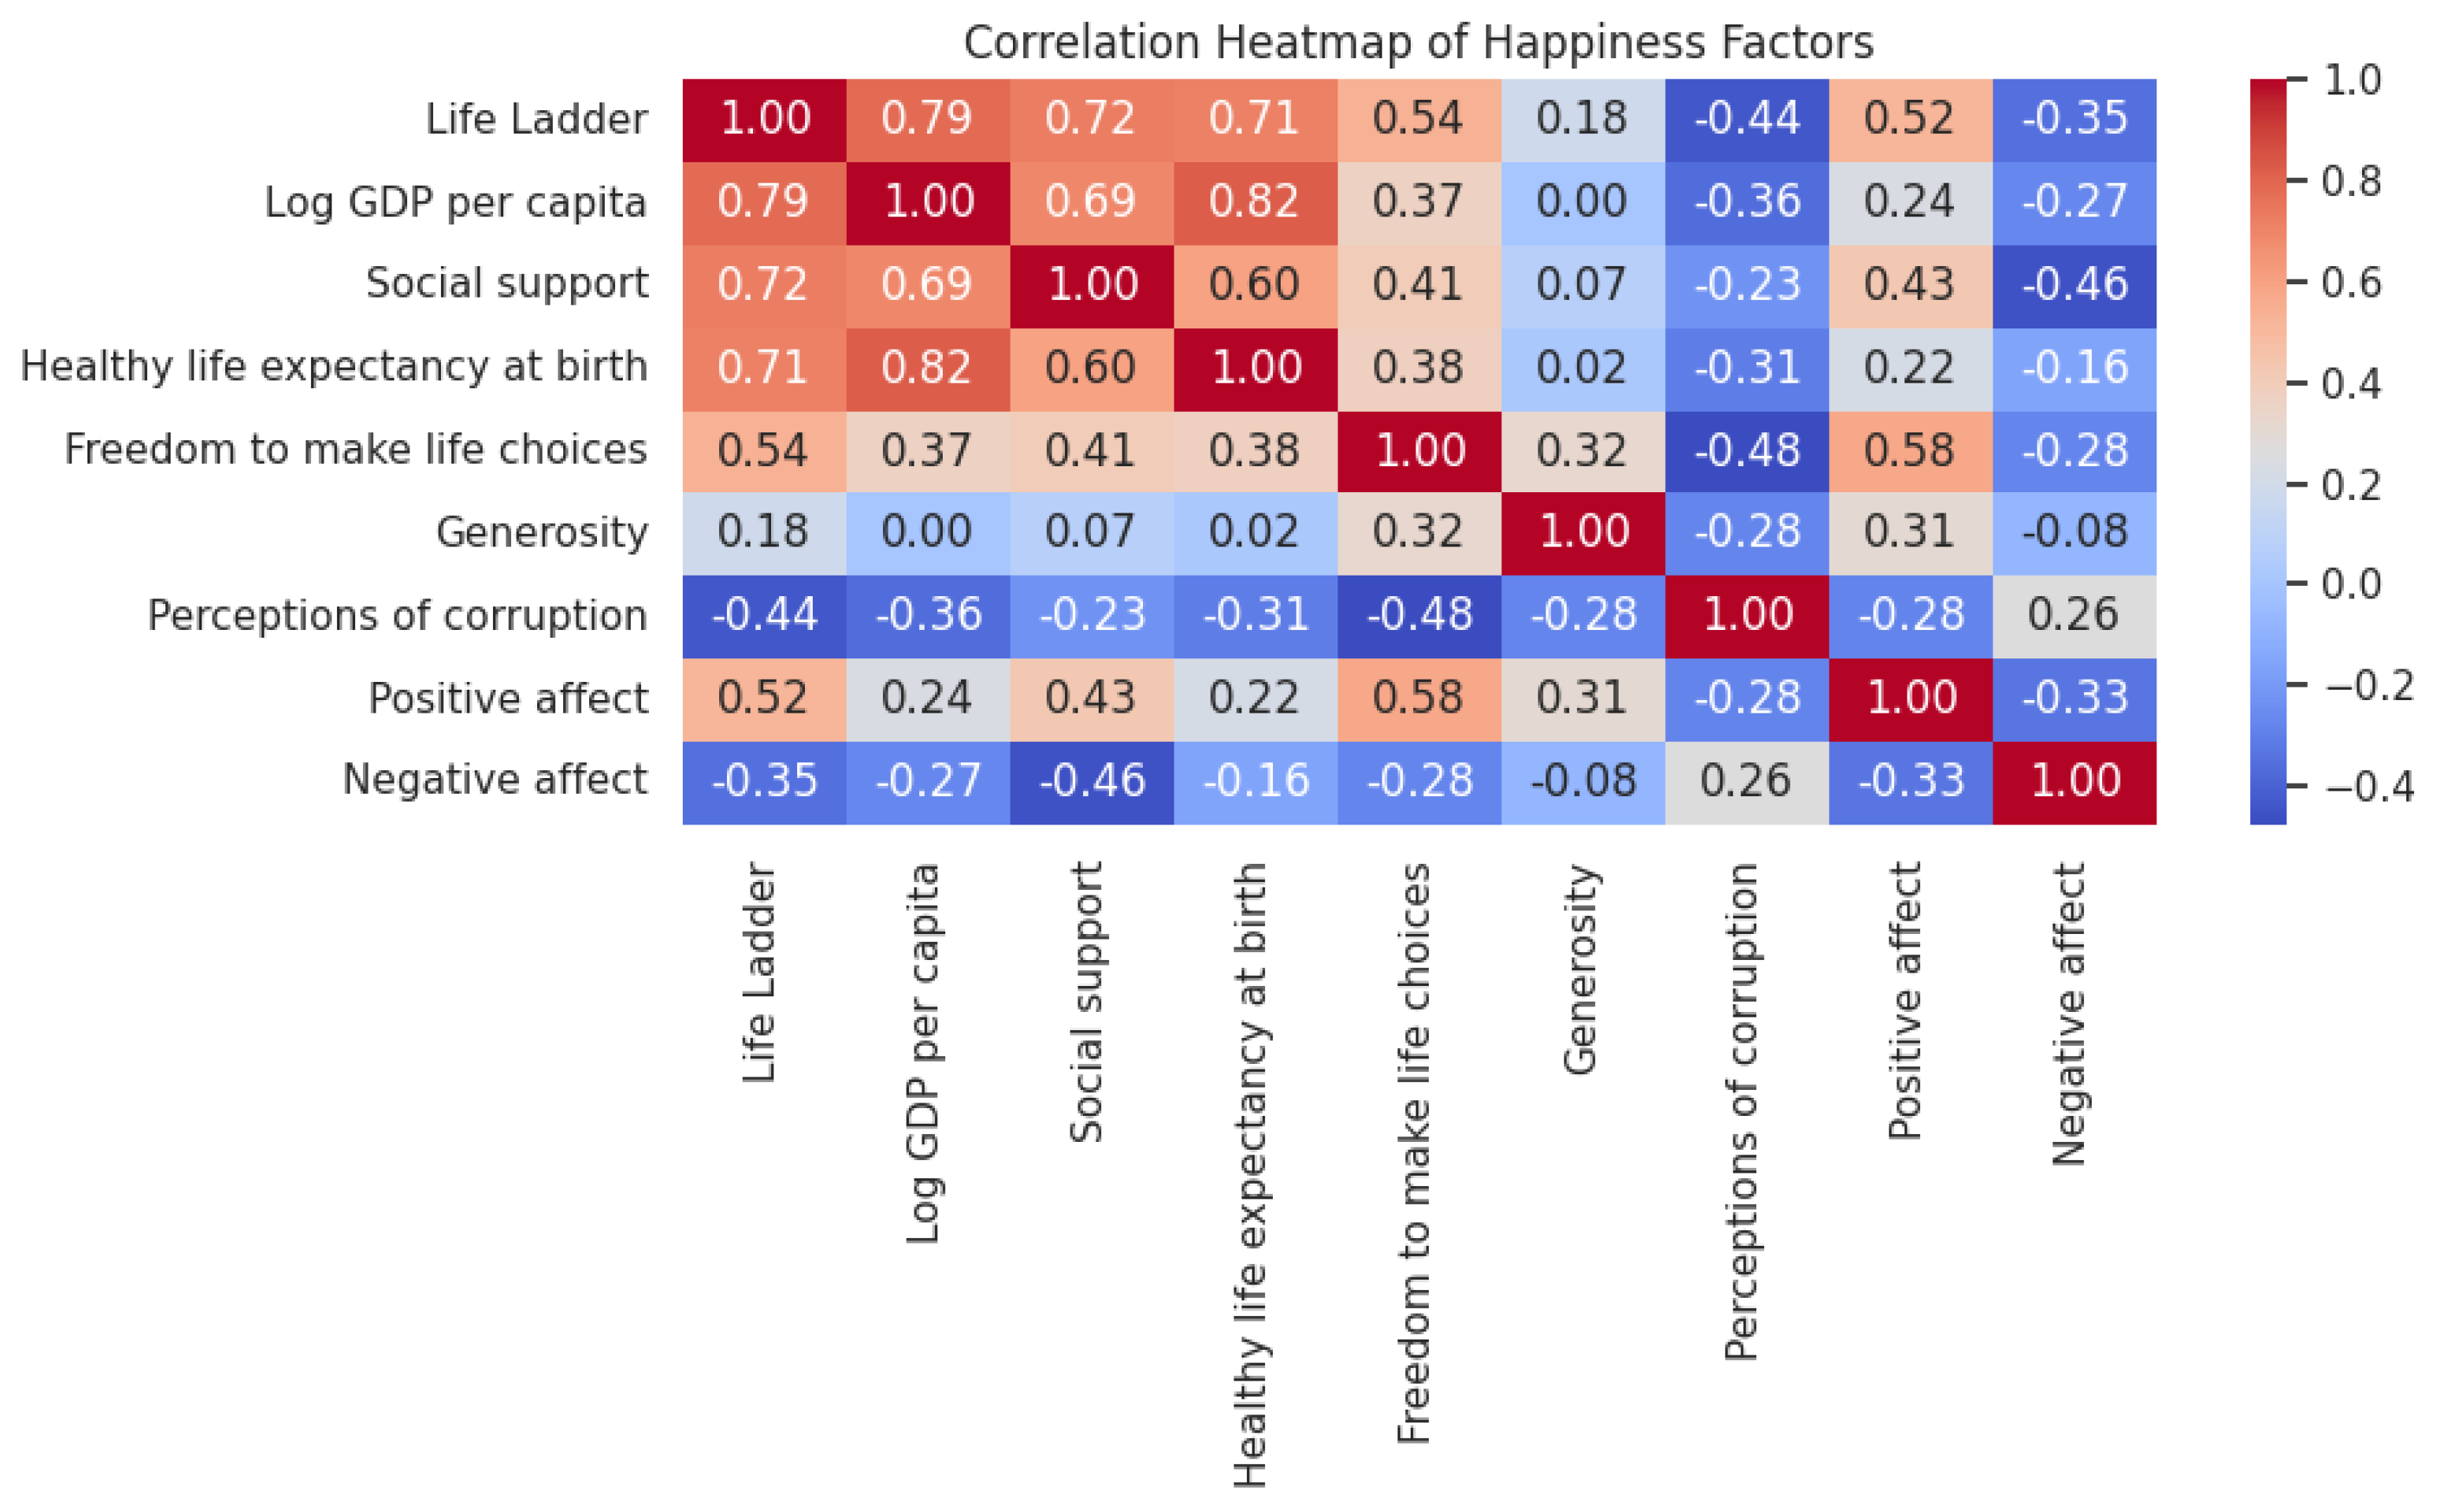
Figure 5.
Linear Regression - Training (till 2021) v.s. Validation (2022-2023)
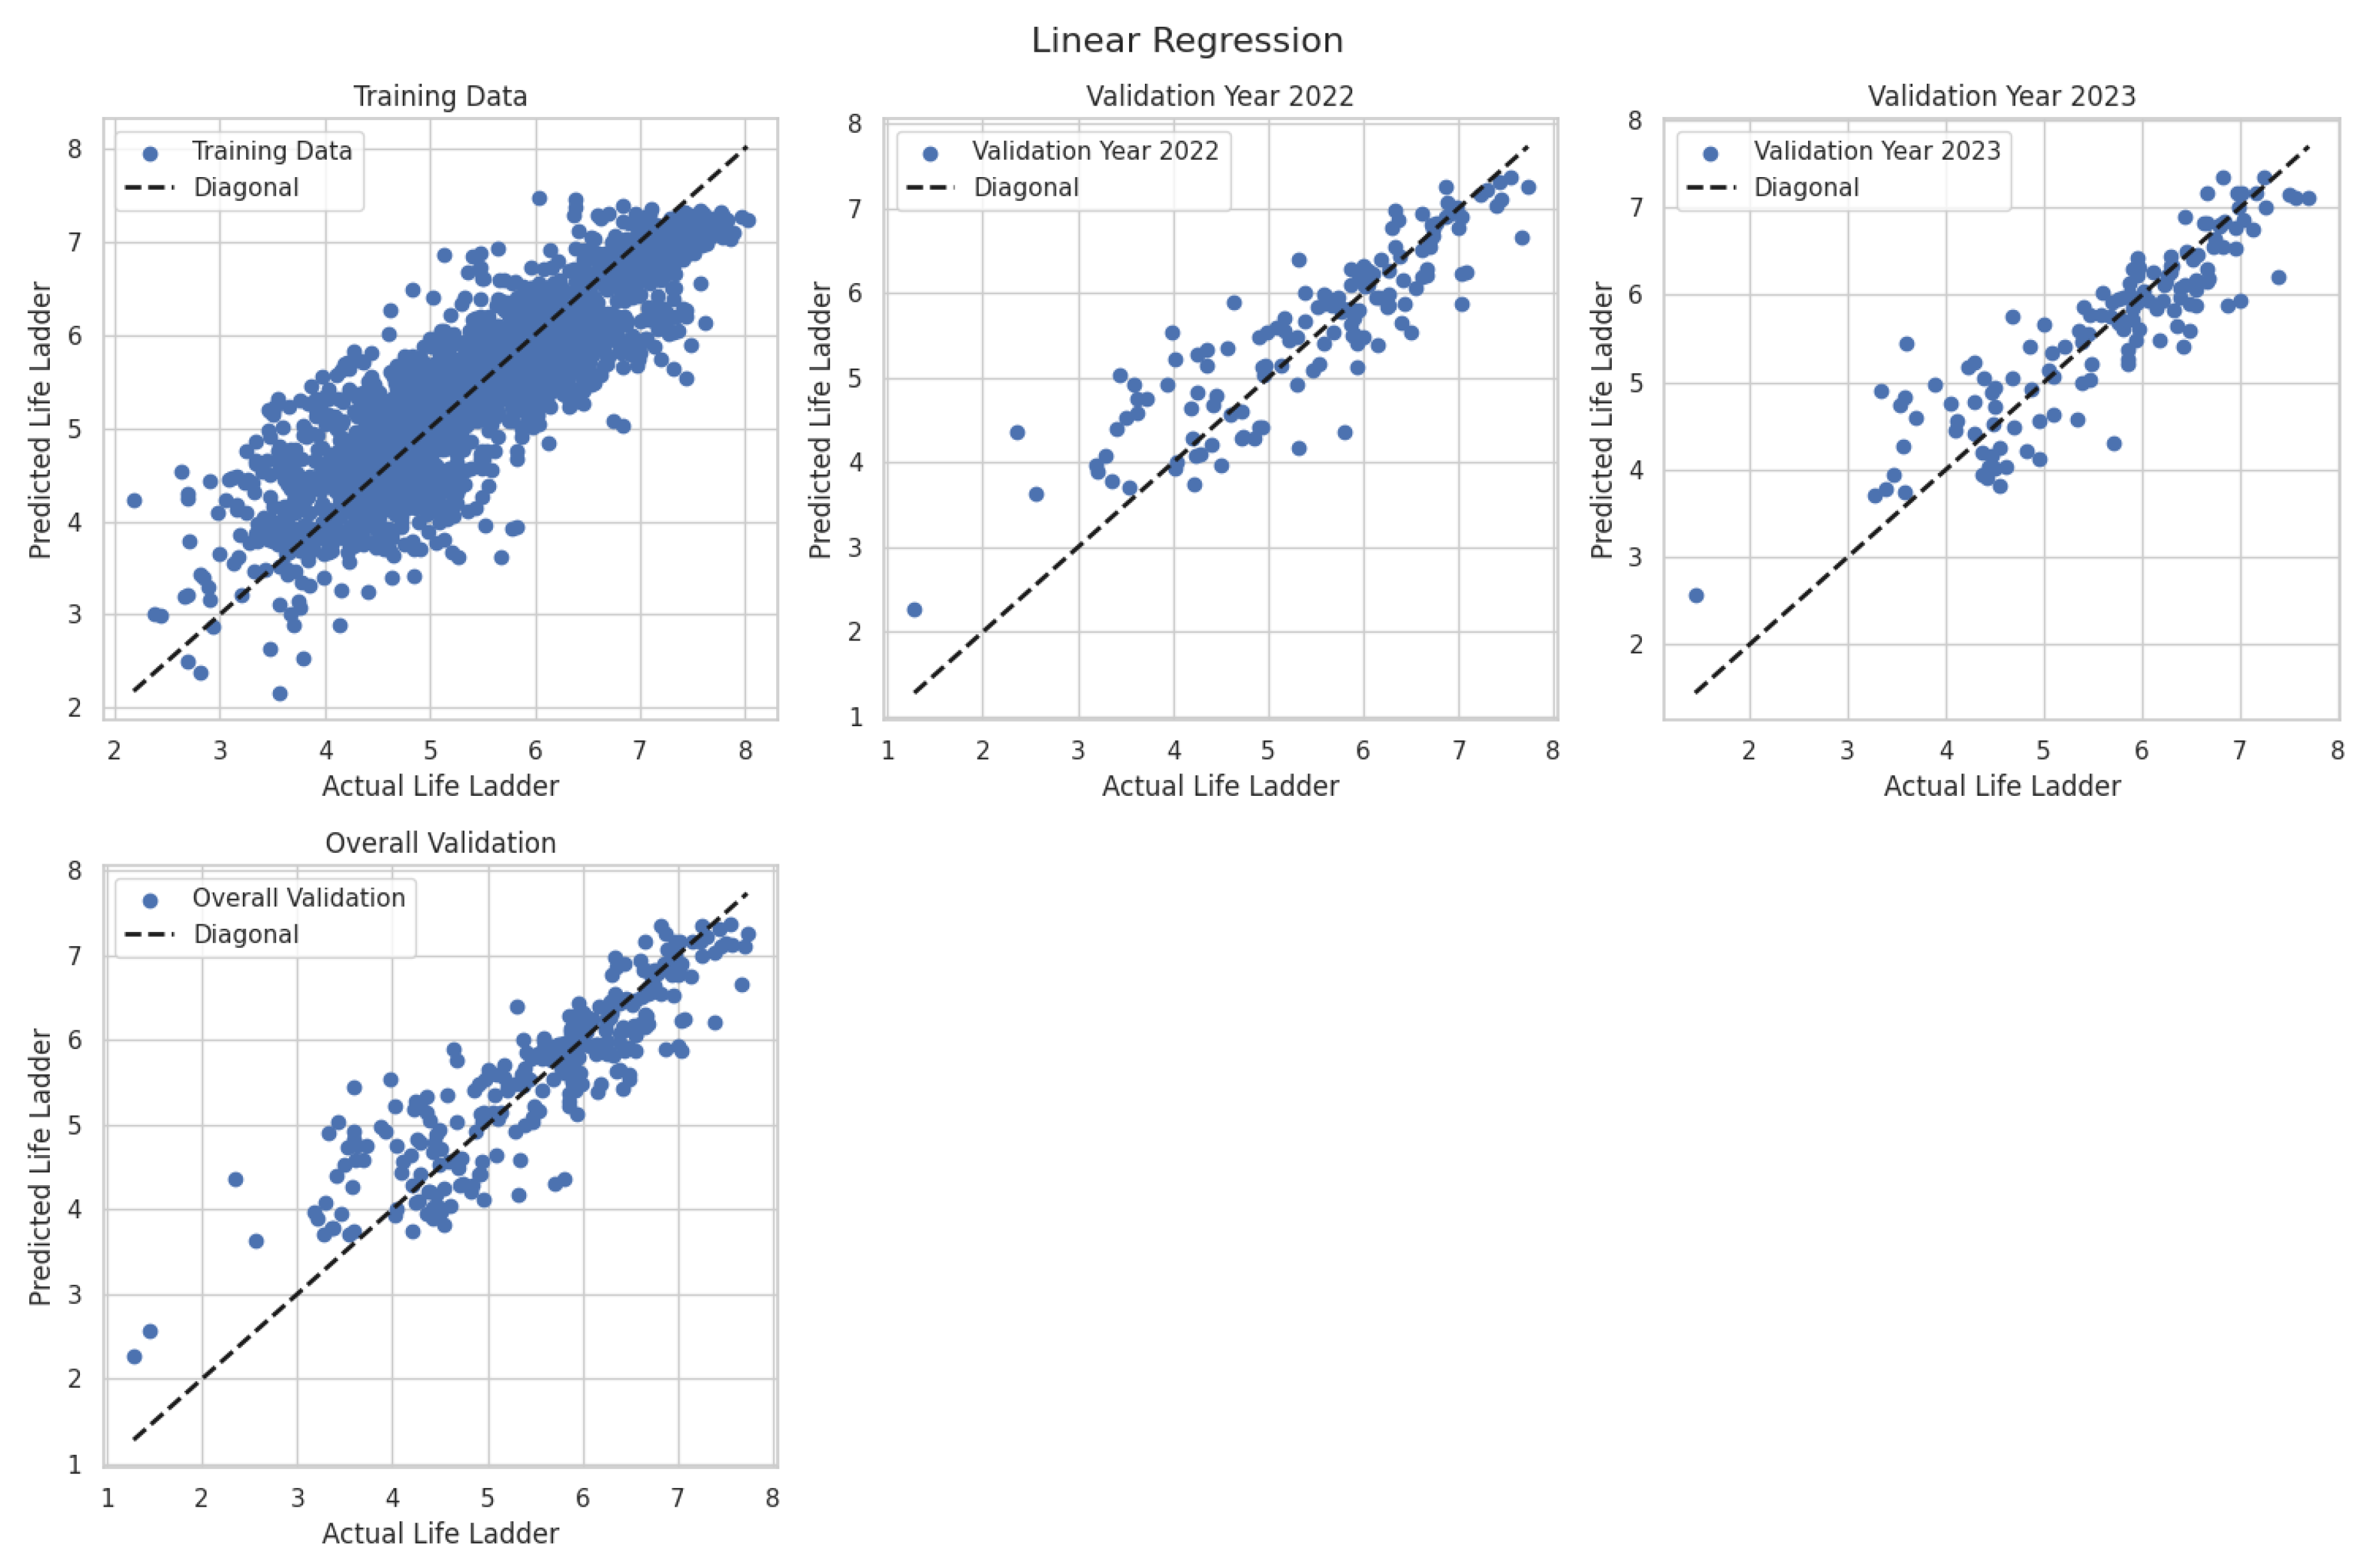
Figure 6.
Various Model performance - Training (till 2021) v.s. Validation (2022-2023)
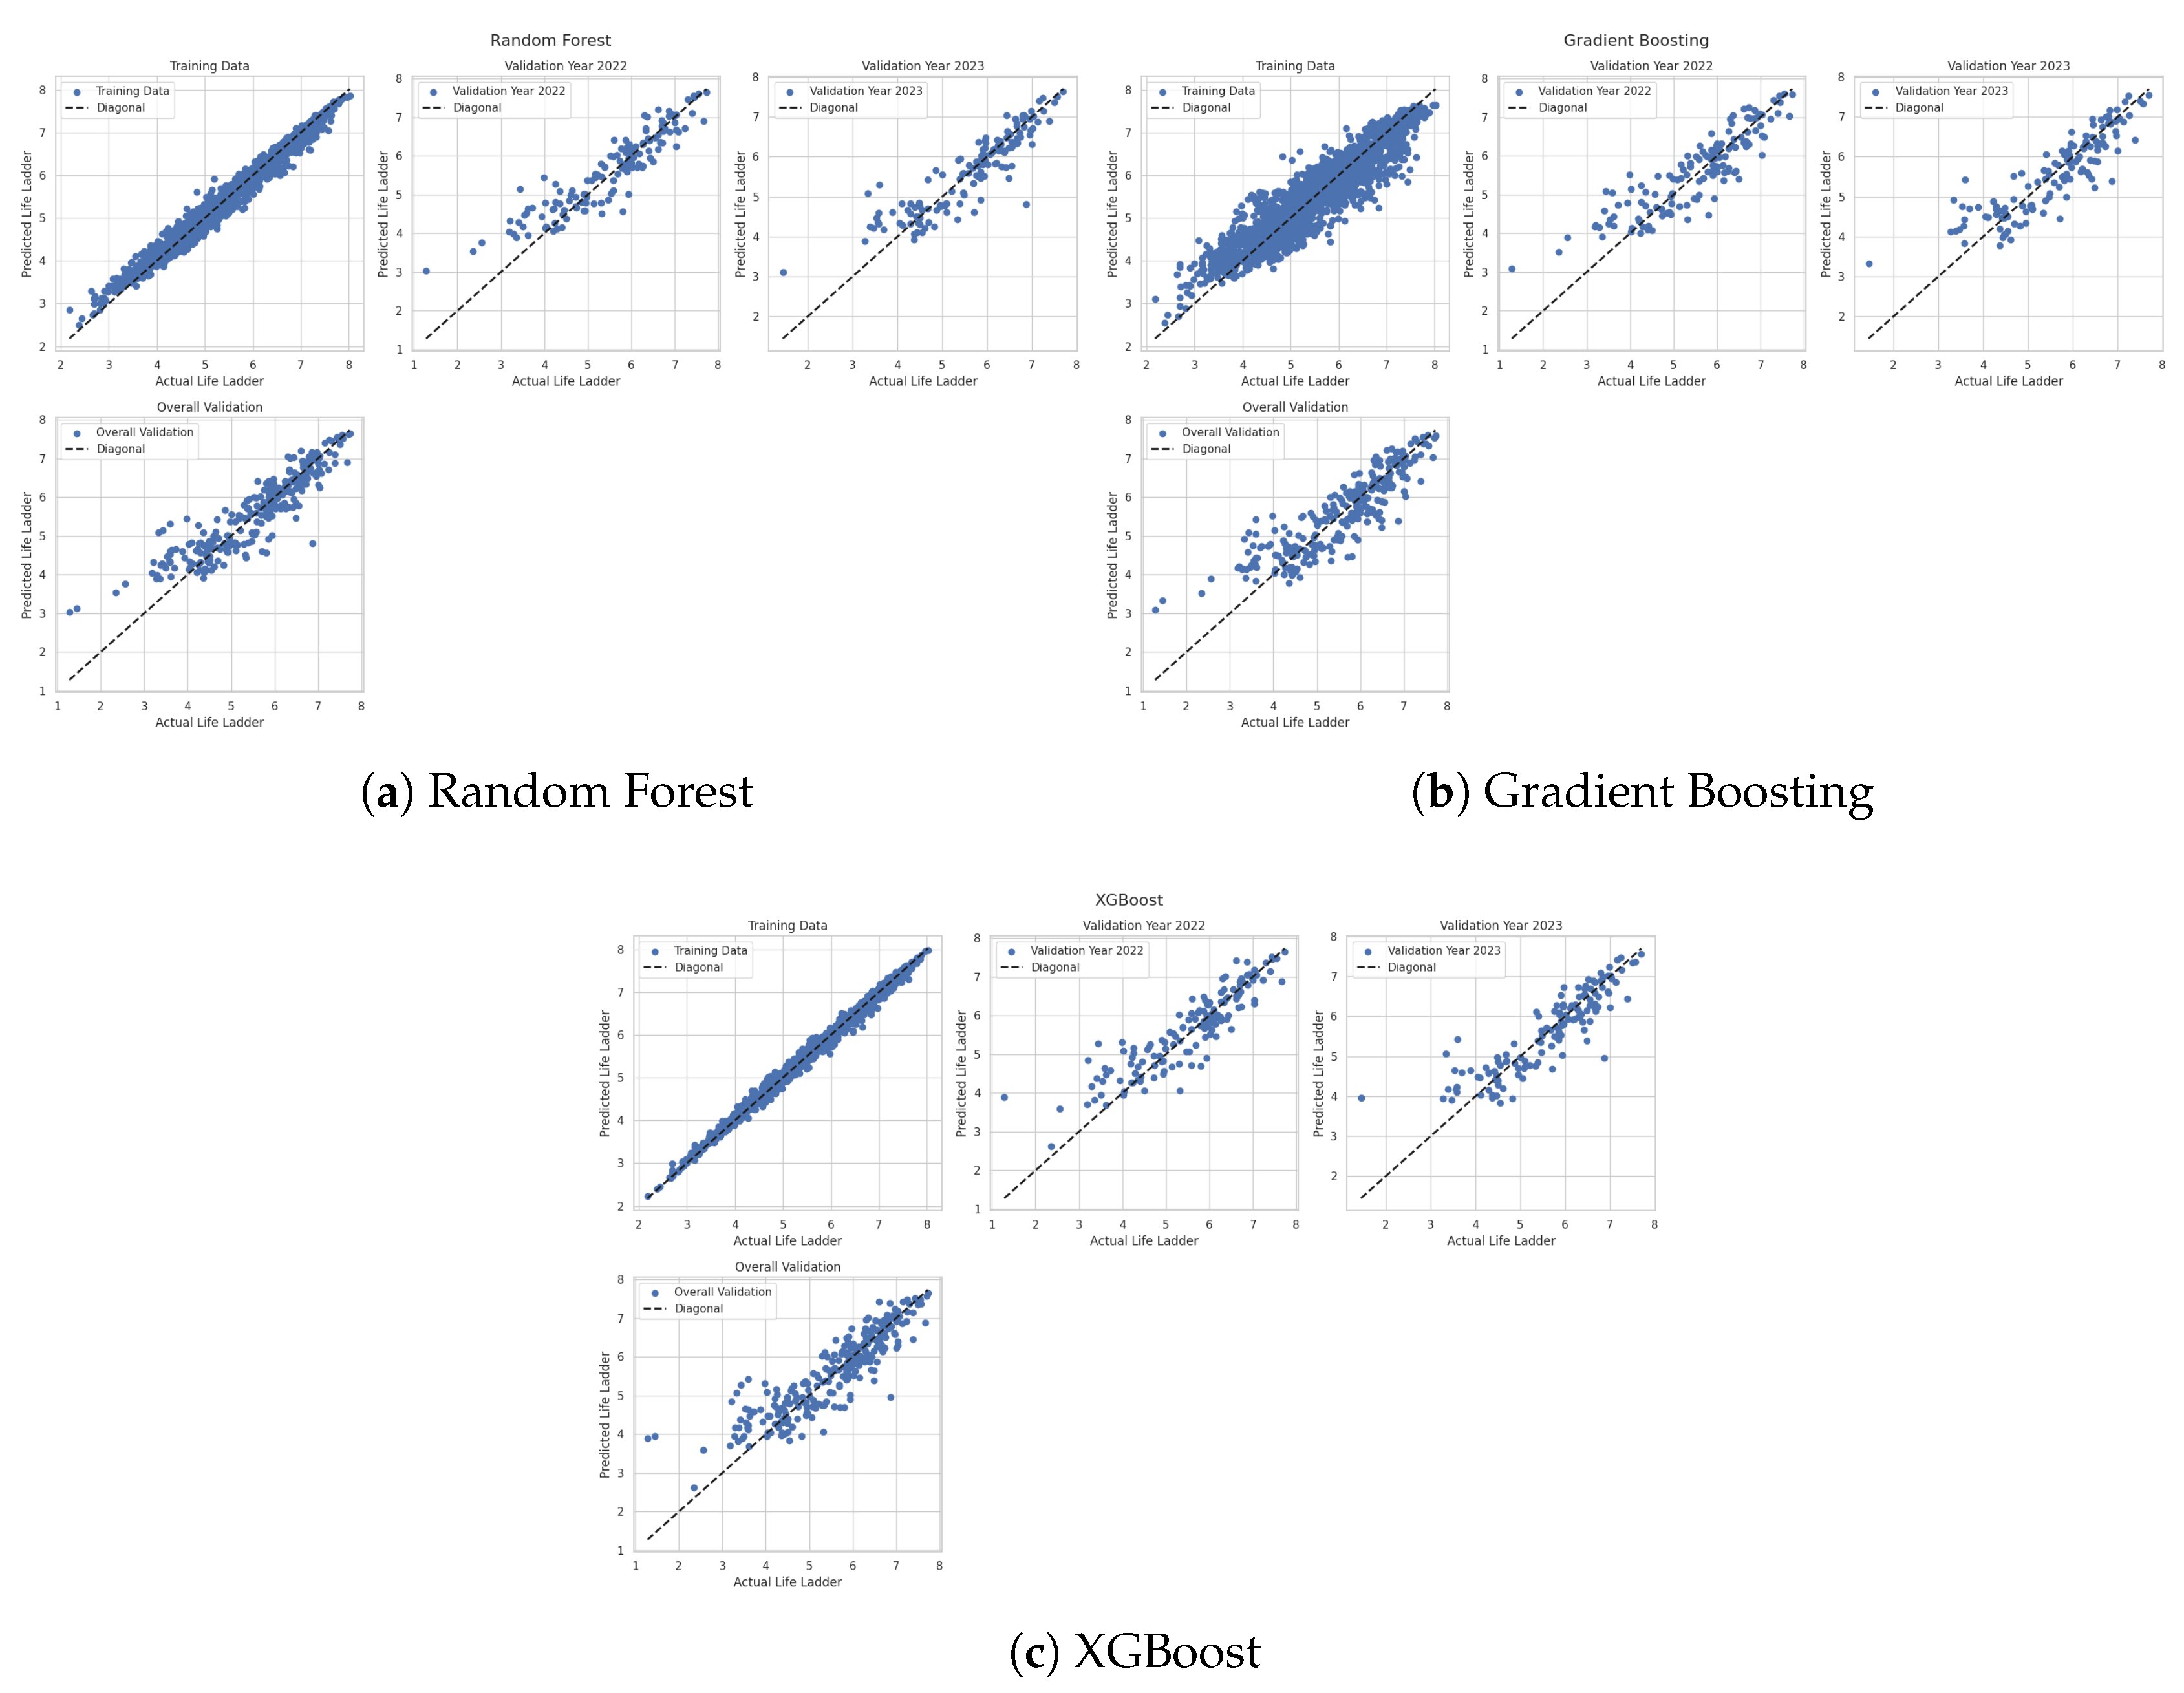
Figure 7.
Best Model Results - Gradient Boosting
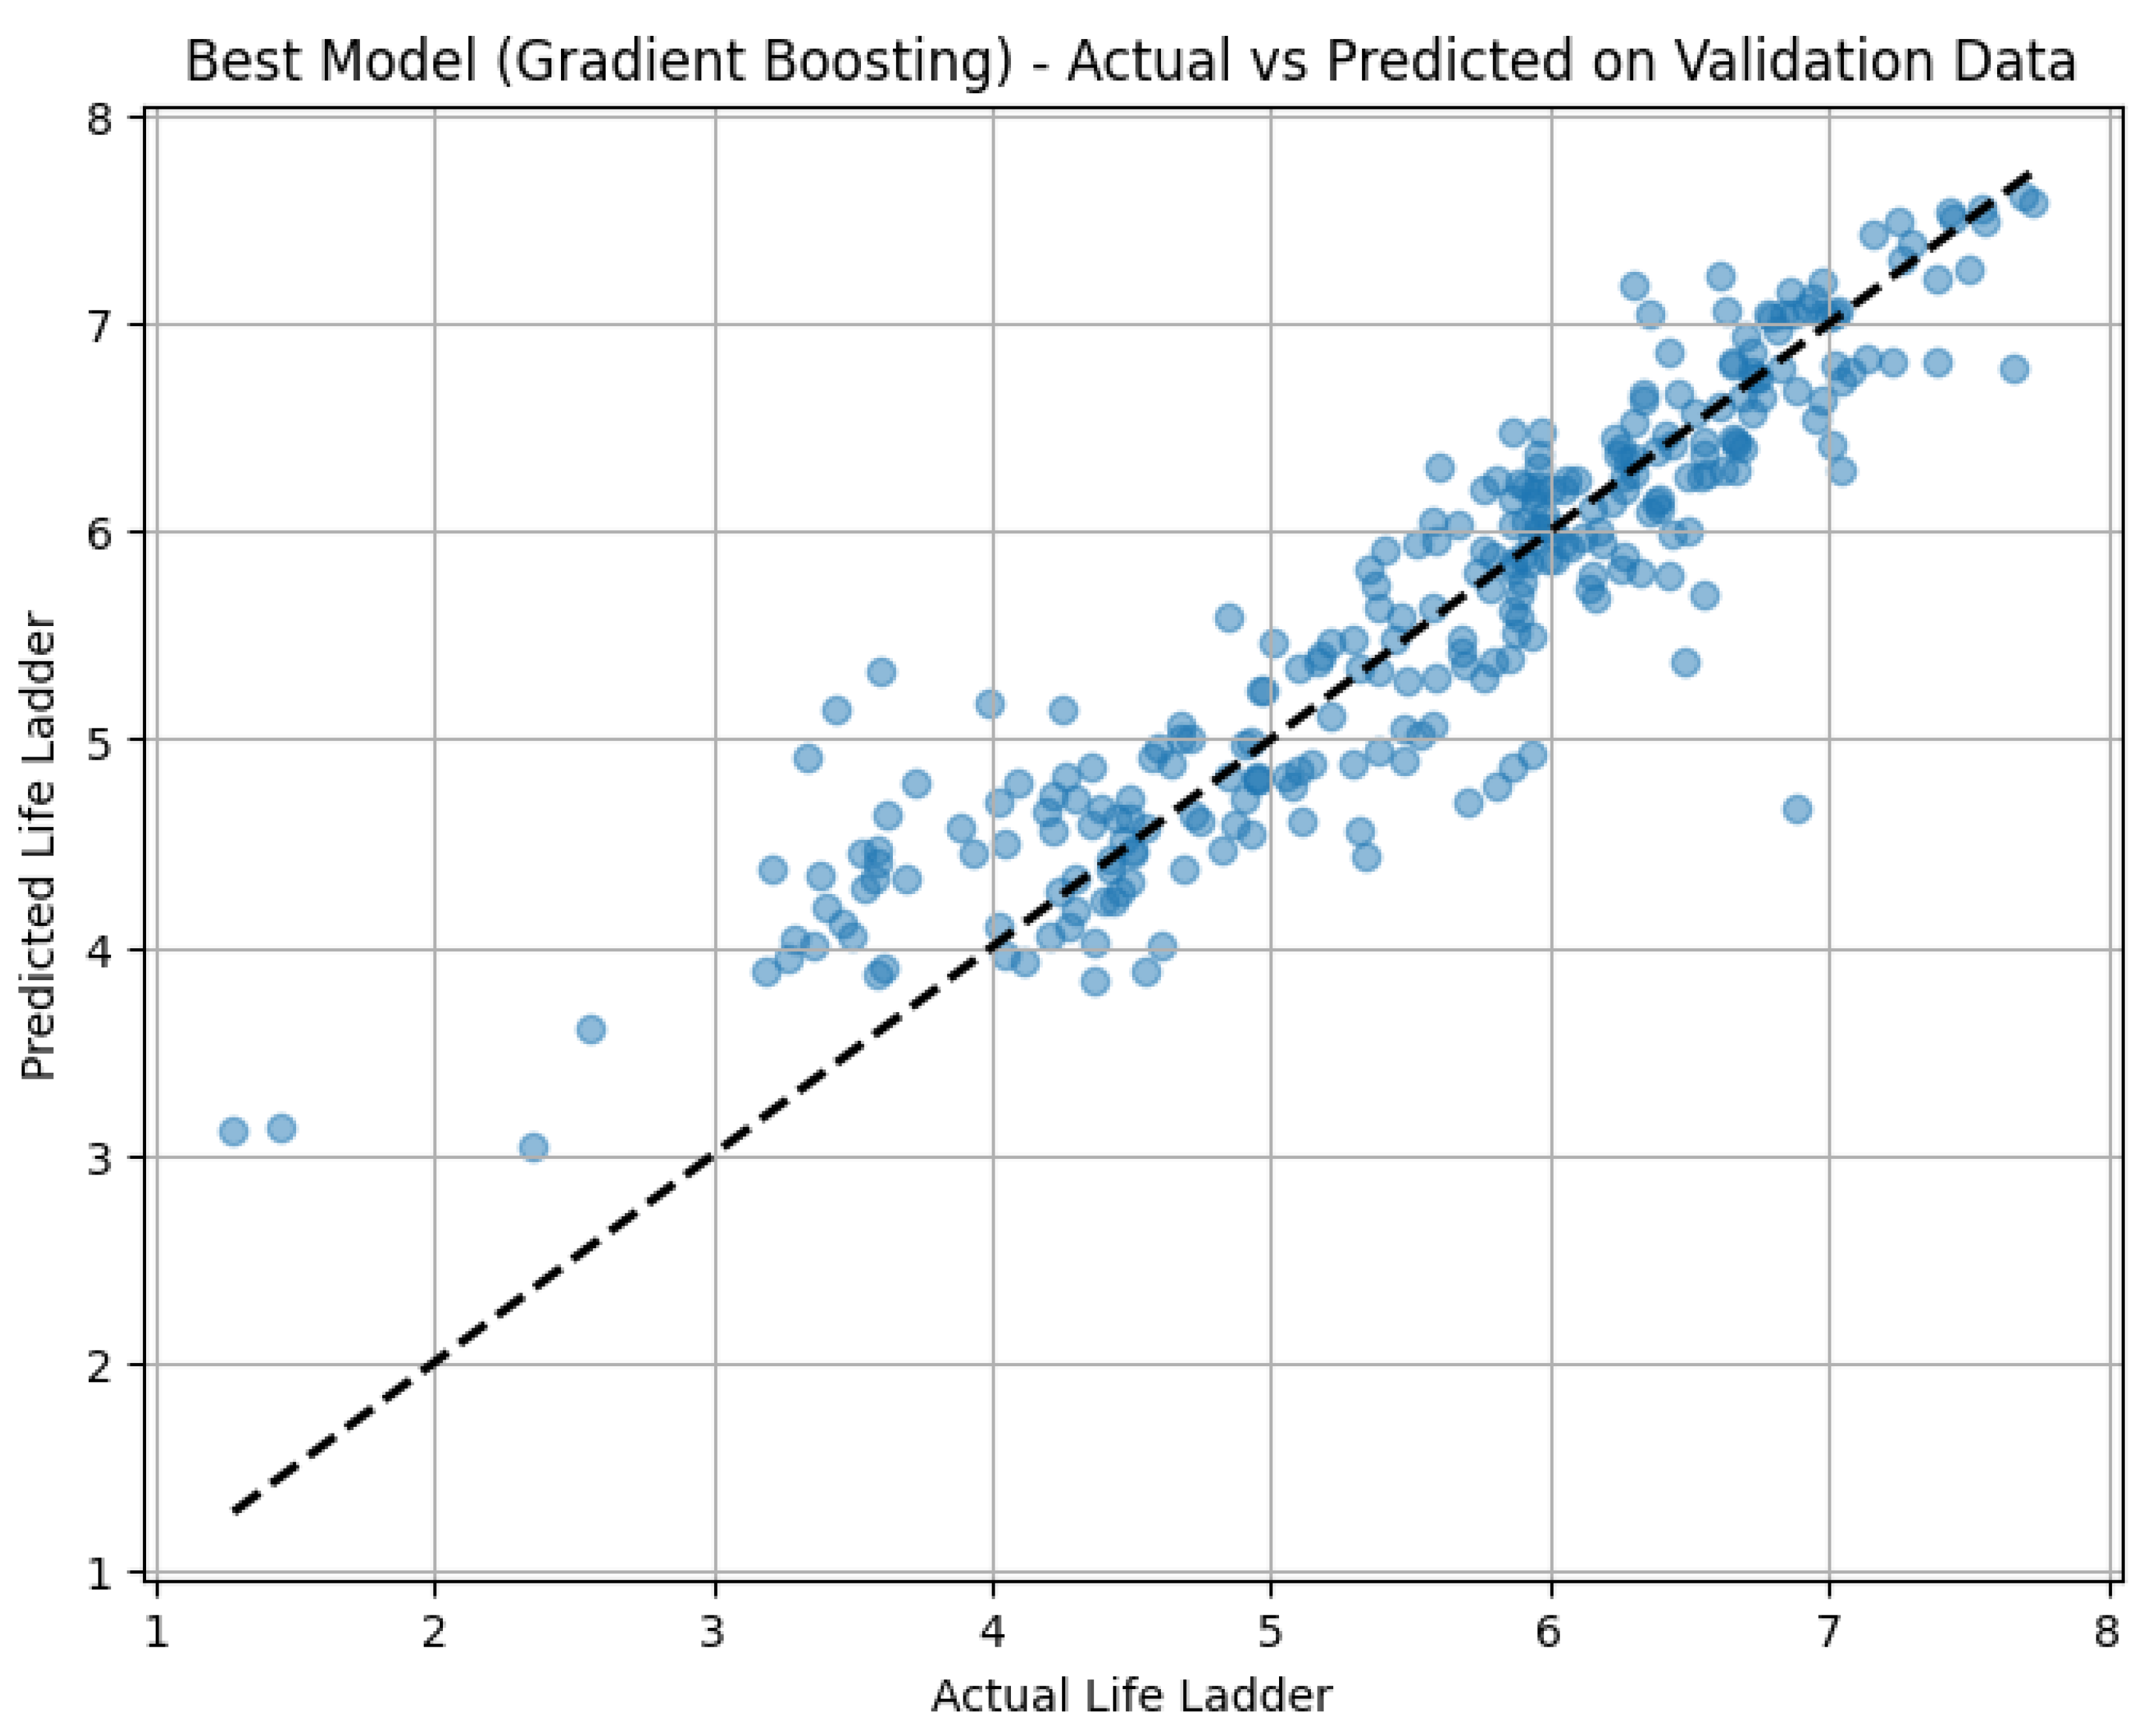
Figure 8.
SHAP Summary for Variables
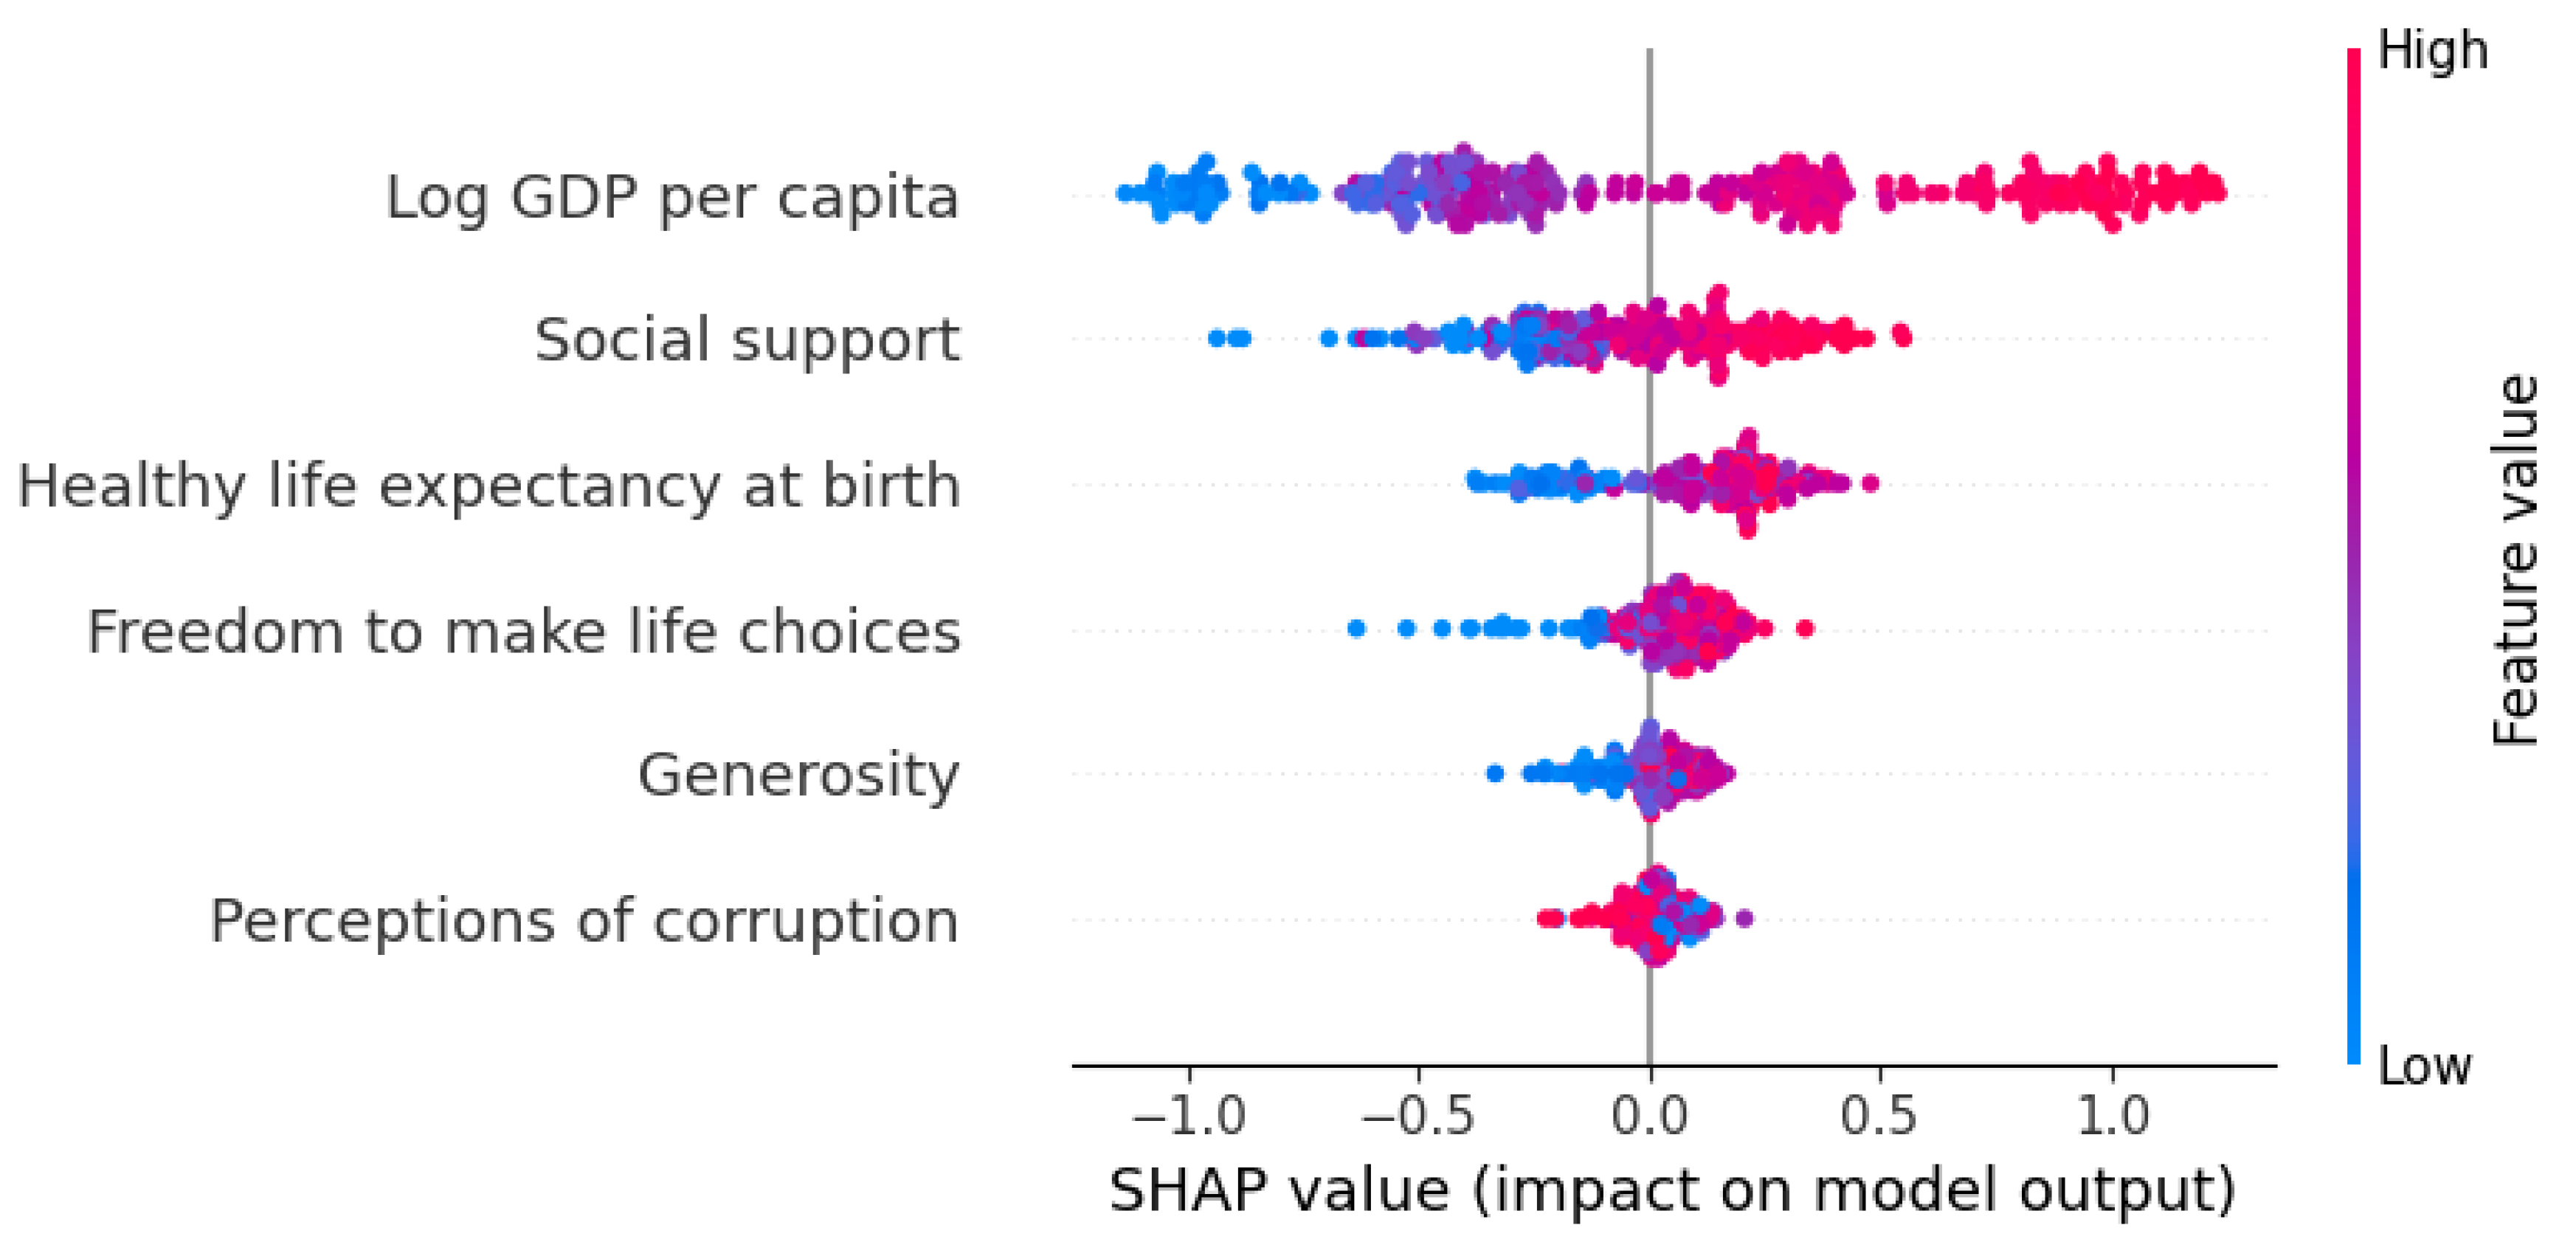
Figure 9.
SHAP Dependency Plot for Variables
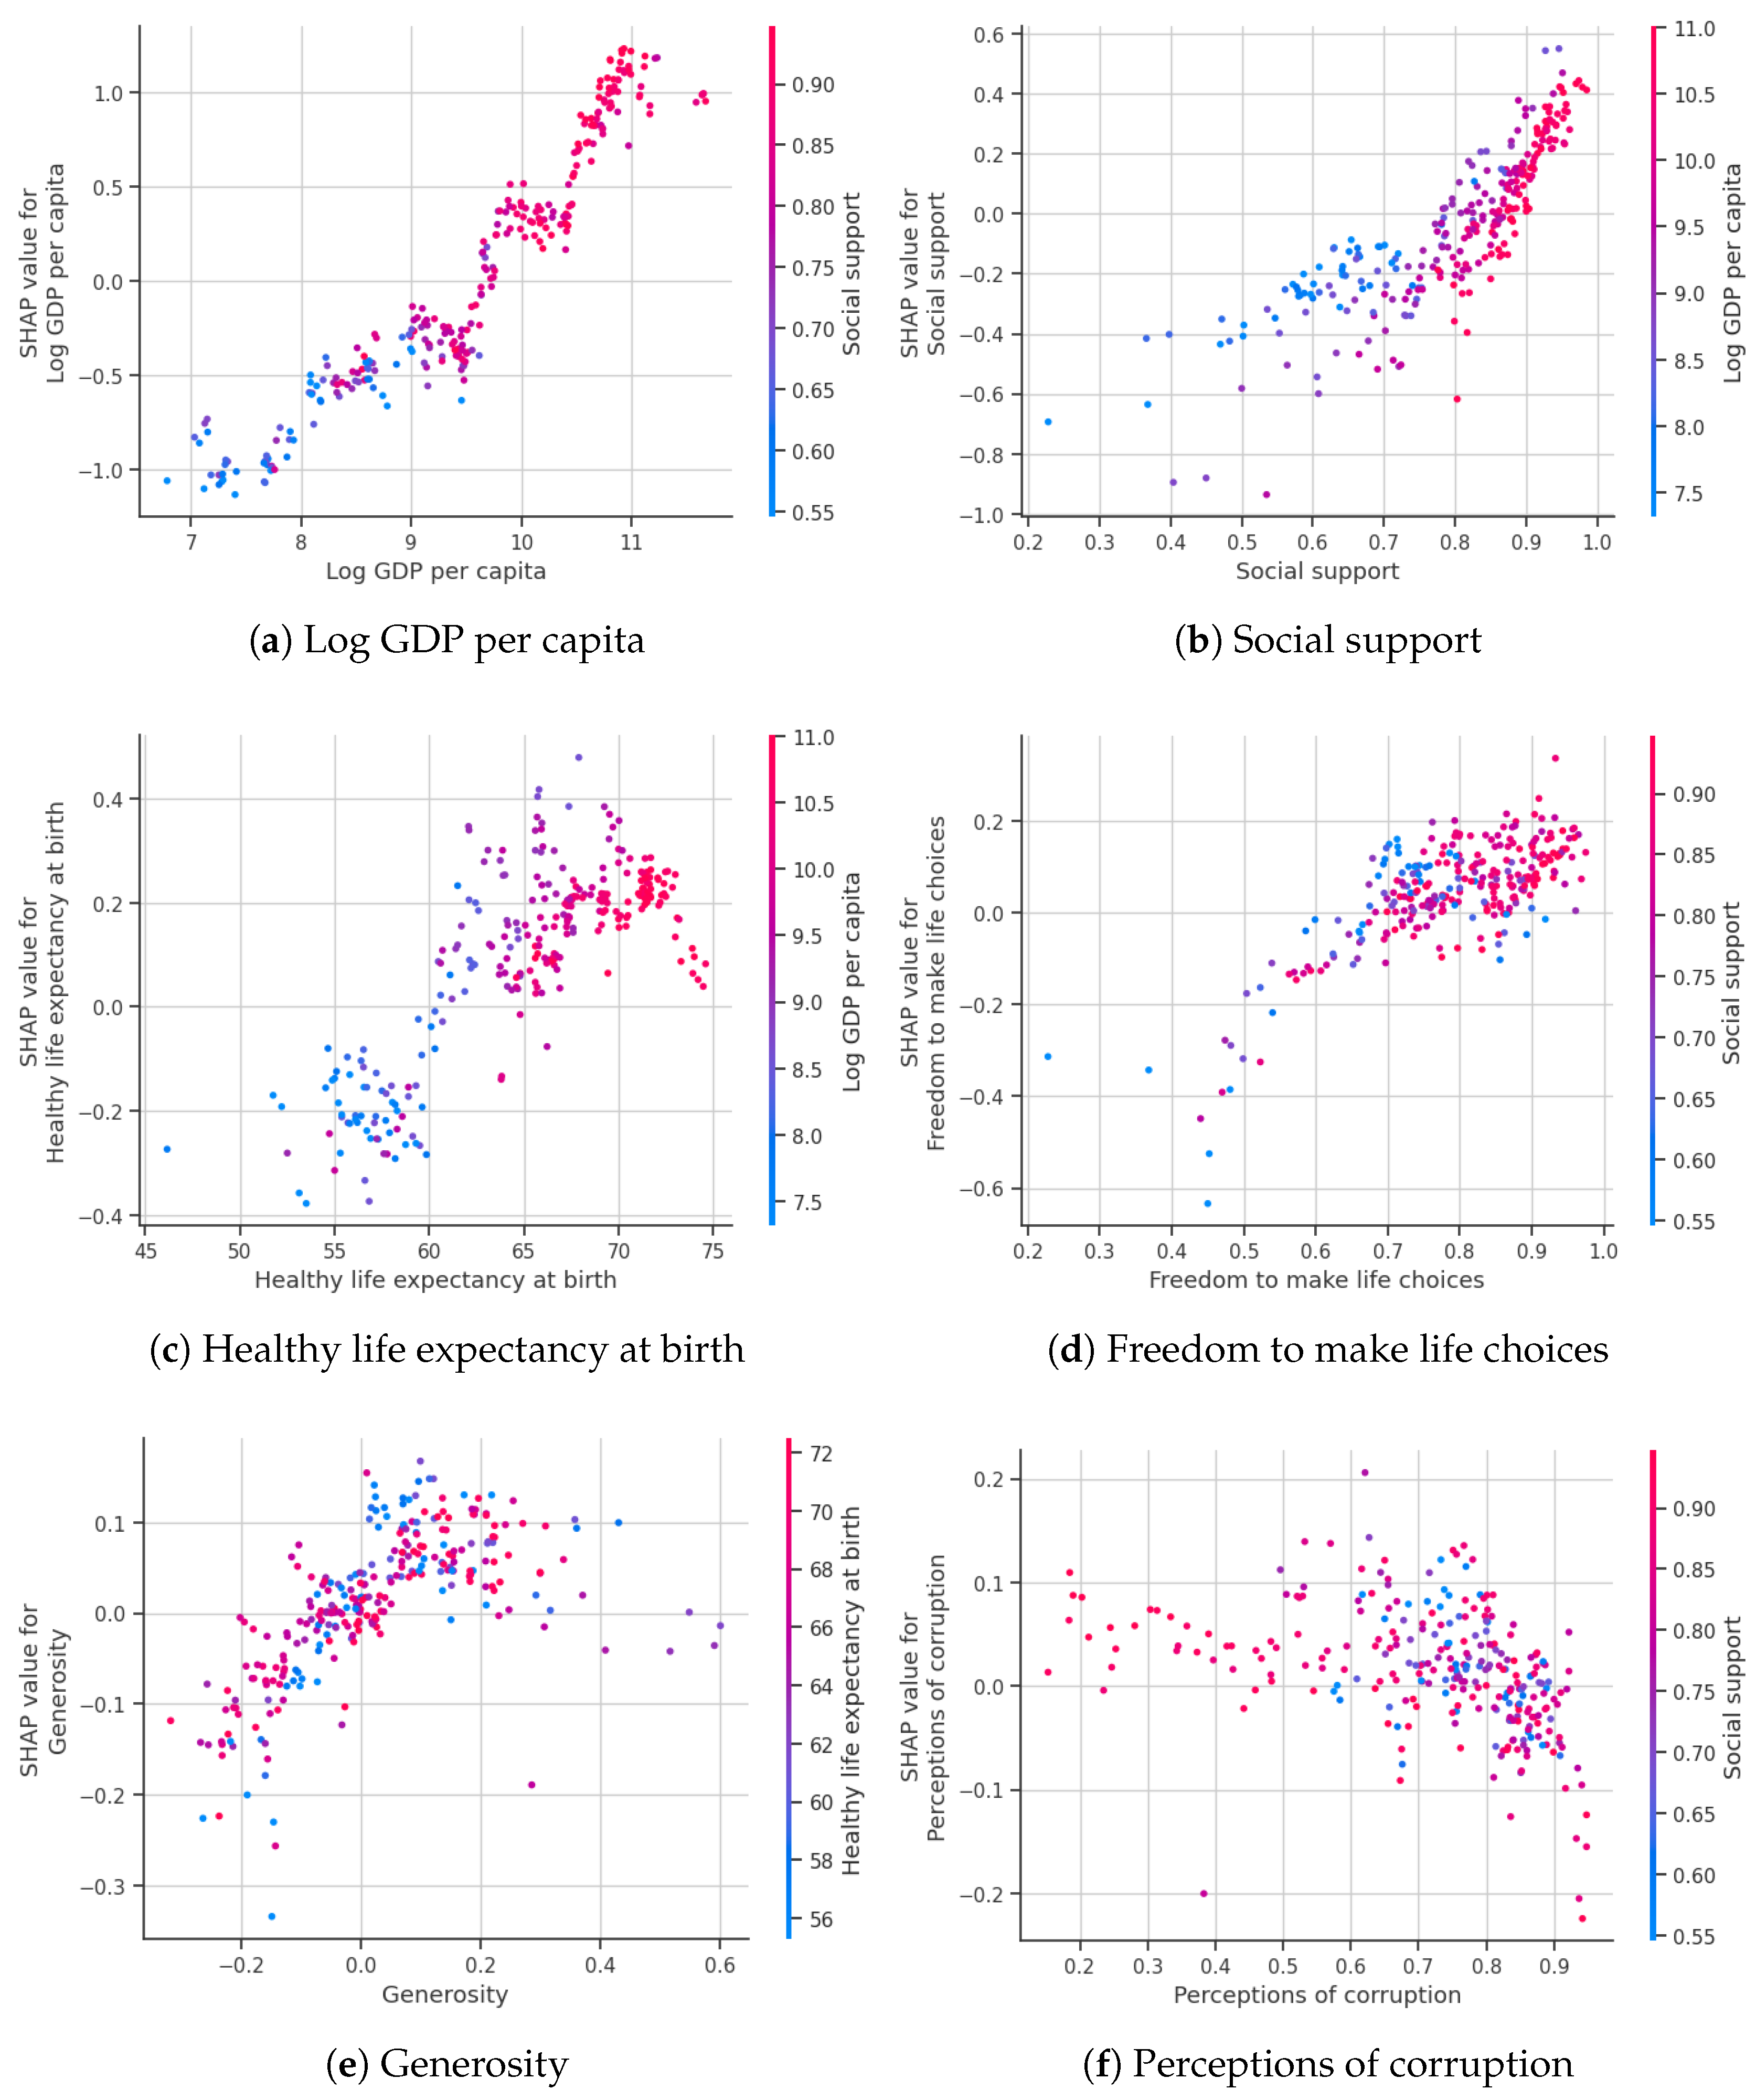
Figure 10.
Feature Importance from the Best Model
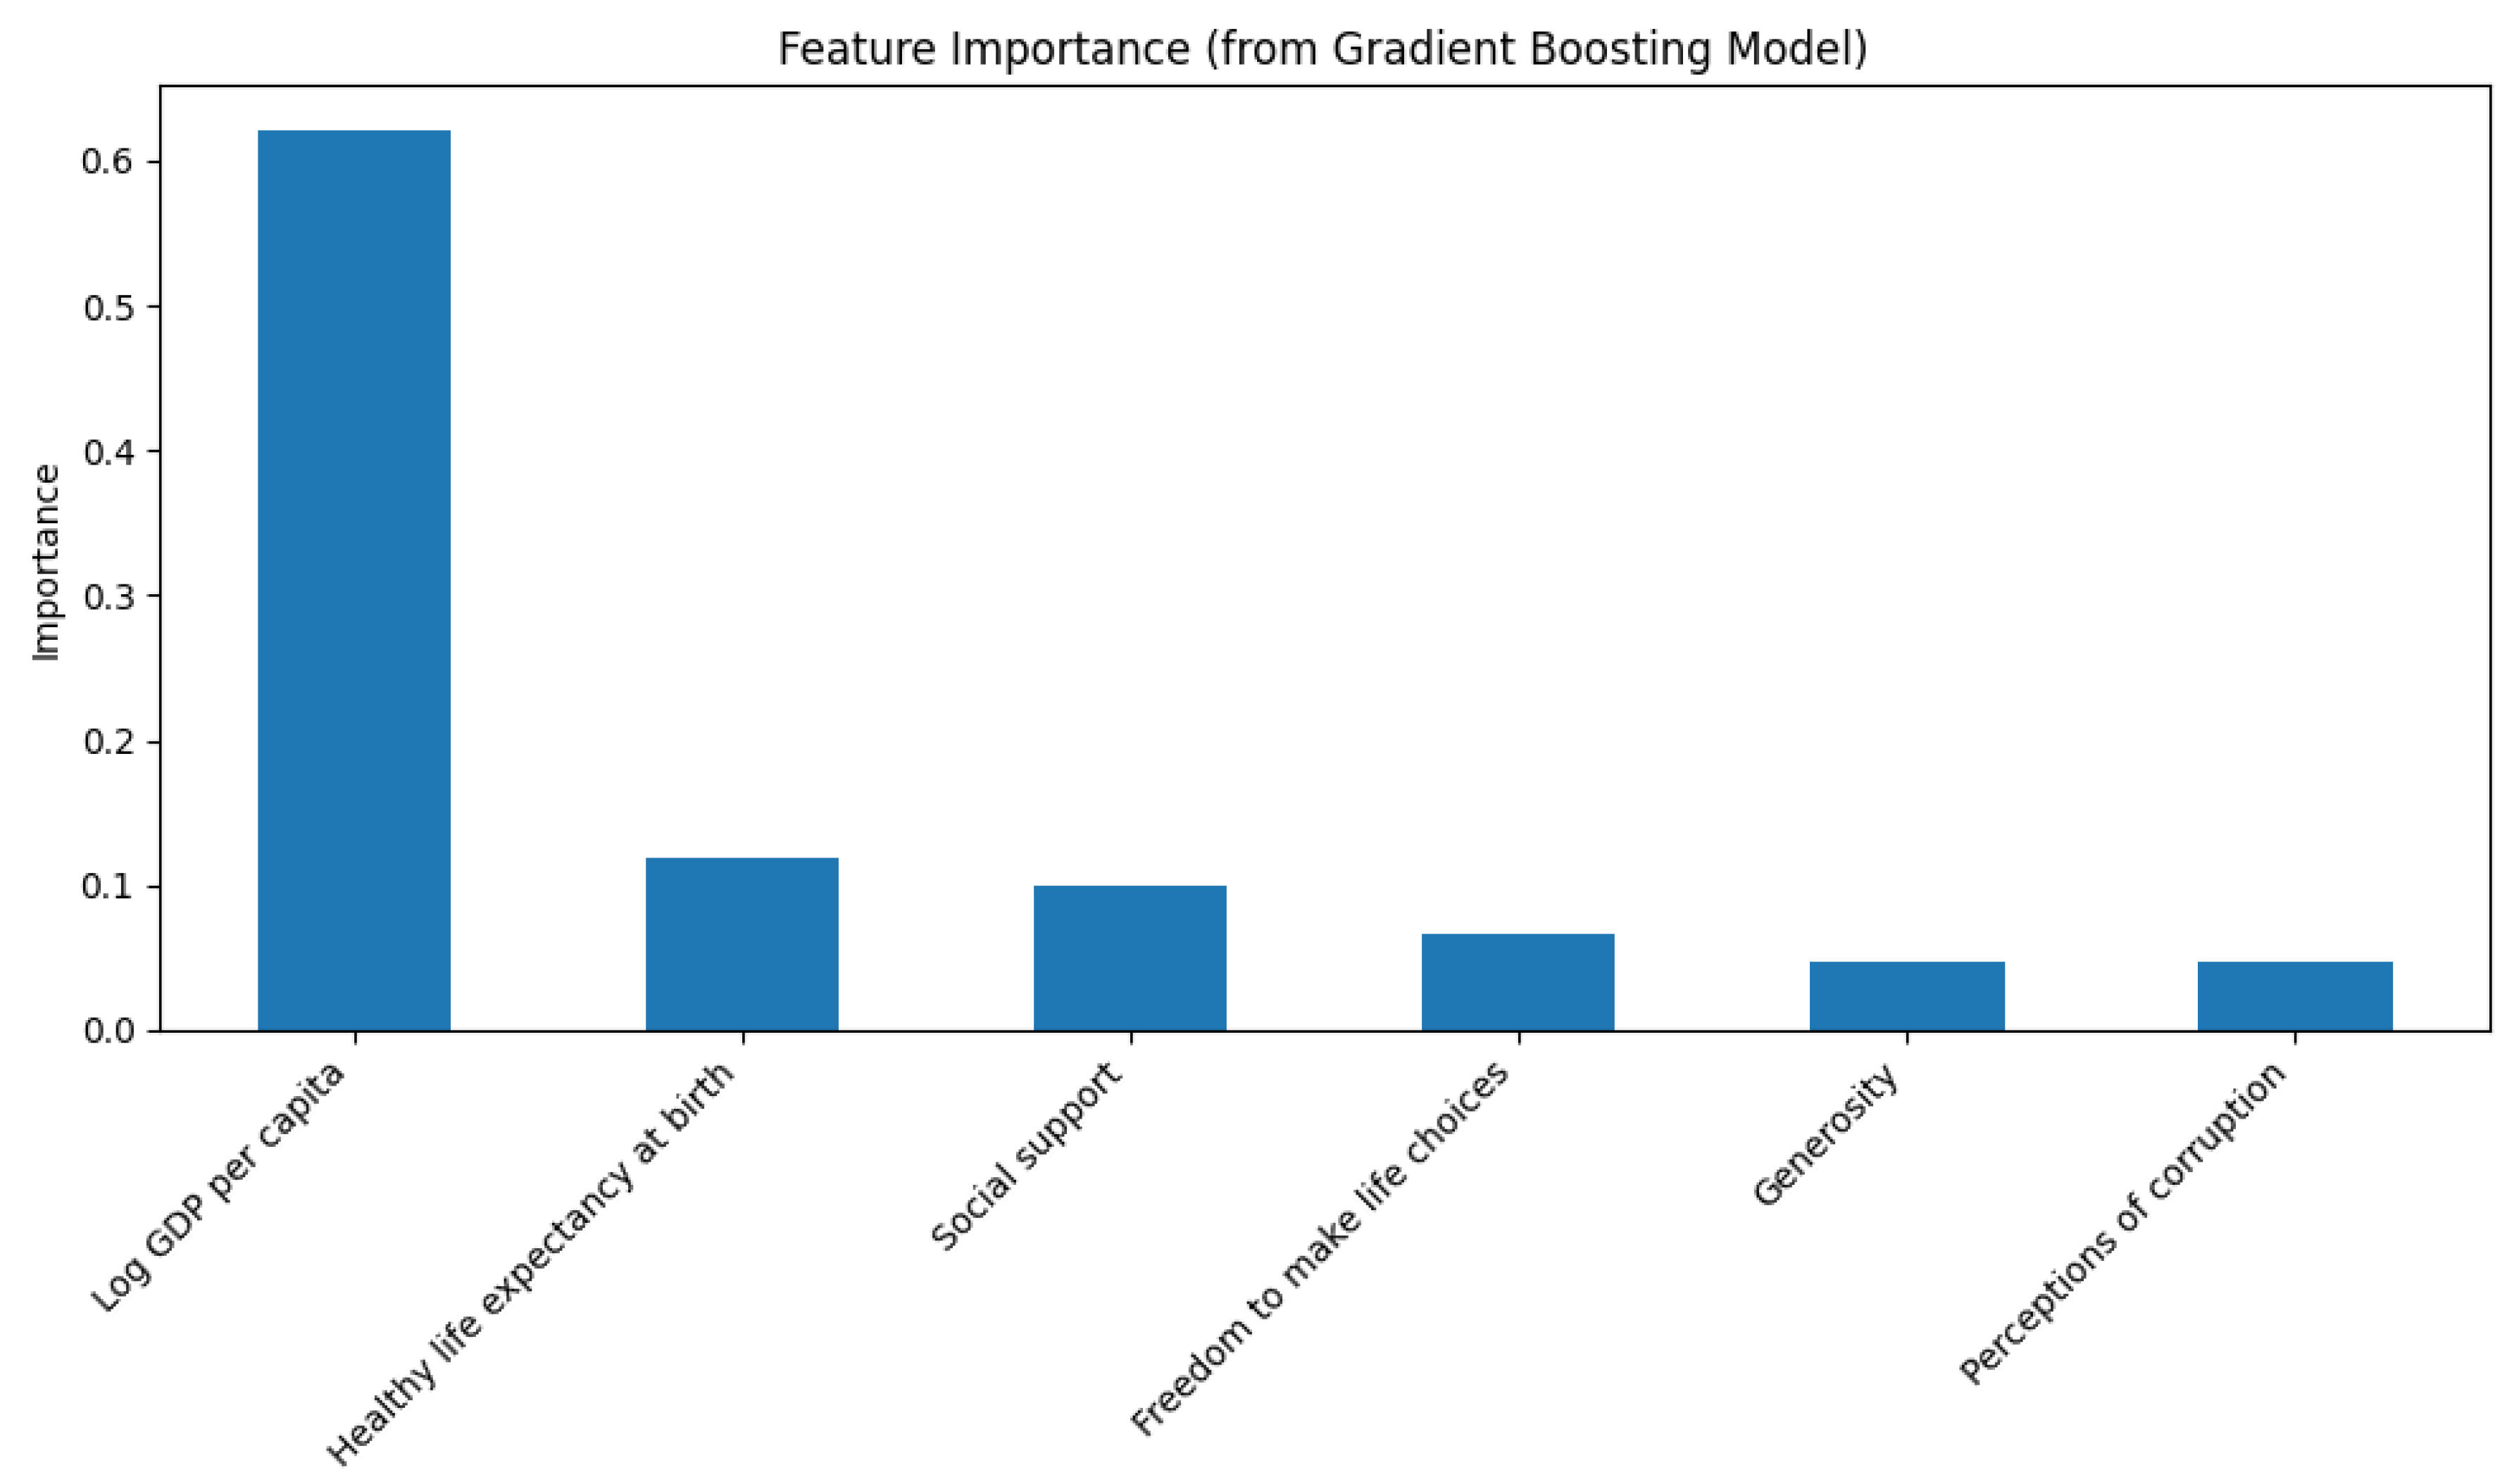

Table 1.
Descriptive statistics of key variables.
| Variable | Mean | SD | Min | Max |
|---|---|---|---|---|
| Life Ladder (0–10) | 5.48 | 1.13 | 1.28 | 8.02 |
| Log GDP per capita (log US$) | 9.40 | 1.15 | 5.53 | 11.68 |
| Social support (%) | 0.81 | 0.12 | 0.23 | 0.99 |
| Healthy life expectancy at birth | 63.42 | 6.79 | 6.72 | 74.60 |
| Freedom to make life choices (0–1) | 0.75 | 0.14 | 0.23 | 0.99 |
| Generosity | 0.00 | 0.16 | -0.34 | 0.70 |
| Perceptions of corruption | 0.74 | 0.18 | 0.05 | 1.01 |
| Positive affect | 0.65 | 0.11 | 0.18 | 0.88 |
| Negative affect | 0.27 | 0.09 | 0.08 | 0.71 |
Table 2.
Best Model performance from Finetuning on 5 Random Seeds
| Model | Seed | MSE | MAE | R2 |
|---|---|---|---|---|
| Random Forest | 1908474288 | 0.2491 | 0.3595 | 0.8216 |
| Random Forest | 1934061814 | 0.2521 | 0.3644 | 0.8194 |
| Random Forest | 538373376 | 0.2532 | 0.3655 | 0.8187 |
| Random Forest | 1005904197 | 0.2501 | 0.3611 | 0.8209 |
| Random Forest | 839934497 | 0.2522 | 0.3607 | 0.8194 |
| Gradient Boosting | 1908474288 | 0.2421 | 0.3508 | 0.8266 |
| Gradient Boosting | 1934061814 | 0.2475 | 0.3564 | 0.8228 |
| Gradient Boosting | 538373376 | 0.2431 | 0.3558 | 0.8259 |
| Gradient Boosting | 1005904197 | 0.2386 | 0.3518 | 0.8291 |
| Gradient Boosting | 839934497 | 0.2402 | 0.3582 | 0.8280 |
| XGBoost | 1908474288 | 0.2697 | 0.3753 | 0.8069 |
| XGBoost | 1934061814 | 0.2677 | 0.3737 | 0.8083 |
| XGBoost | 538373376 | 0.2651 | 0.3727 | 0.8102 |
| XGBoost | 1005904197 | 0.2781 | 0.3746 | 0.8008 |
| XGBoost | 839934497 | 0.2674 | 0.3764 | 0.8085 |
Disclaimer/Publisher’s Note: The statements, opinions and data contained in all publications are solely those of the individual author(s) and contributor(s) and not of MDPI and/or the editor(s). MDPI and/or the editor(s) disclaim responsibility for any injury to people or property resulting from any ideas, methods, instructions or products referred to in the content. |
© 2025 by the authors. Licensee MDPI, Basel, Switzerland. This article is an open access article distributed under the terms and conditions of the Creative Commons Attribution (CC BY) license (http://creativecommons.org/licenses/by/4.0/).
Copyright: This open access article is published under a Creative Commons CC BY 4.0 license, which permit the free download, distribution, and reuse, provided that the author and preprint are cited in any reuse.


