Submitted:
10 June 2025
Posted:
12 June 2025
You are already at the latest version
Abstract
Understanding regime shifts in crypto asset markets is essential for anticipating systemic risk and enhancing real-time monitoring tools. This study investigates structural changes in five major cryptocurrencies—Bitcoin (BTC), Ethereum (ETH), Solana (SOL), Aave (AAVE), and Bitcoin Cash (BCH)—over the 2023–2025 period. Using the Generalized Sup Augmented Dickey-Fuller (GSADF) test applied to daily high-frequency mid-price data, we assess the presence and timing of structural breaks in each asset. The results reveal that BTC and BCH experienced regime shifts that aligned with macroeconomic developments such as monetary policy announcements. In contrast, DeFi-related tokens (ETH, SOL, and AAVE) exhibited more fragmented and short-lived shifts, often driven by project-specific technical changes. Notably, ETH showed a structural break in April 2024, likely related to Layer-2 migration pressures and delays in protocol upgrades. In April 2025, both the crypto asset market and traditional financial markets experienced substantial turbulence following heightened trade policy actions by the United States, which fueled global economic uncertainty. Despite these disturbances, the S&P 500 index did not exhibit persistent structural breaks, suggesting that traditional equity markets are more resilient to transient macroeconomic shocks. This contrast underscores Bitcoin’s emerging role as a macro-sensitive digital asset and highlights the structural volatility within decentralized finance ecosystems. Although the GSADF test is computationally intensive (O(T4)), we discuss future research directions involving GPU acceleration and surrogate modeling. Additionally, we propose the integration of LPPLS-based frameworks to support real-time detection of financial exuberance and contribute to more robust risk management strategies in volatile crypto-financial systems.
Keywords:
GSADF
; structural break
; cryptocurrencies
; Bitcoin
; Ethereum
; DeFi
; S&P 500
; bubble detection
1. Introduction
Asset prices in financial markets often appear to fluctuate randomly. However, beneath this apparent randomness lie identifiable patterns and structural changes—commonly referred to as regime shifts—that reflect deeper market dynamics not captured by simple random walk models. Particularly during the formation and bursting of asset bubbles, markets may transition from a stationary, mean-reverting state to a momentum-driven, non-stationary regime. These regime shifts can signal structural changes in the pricing mechanism, often triggered by macroeconomic shocks, speculative sentiment, or technological developments.
A broad array of econometric techniques has been proposed to detect speculative bubbles, yet they differ in assumptions and statistical robustness. Gurkaynak (2008) [4] surveys these approaches and highlights the ongoing debate over the empirical detectability of bubbles. The inherent challenge lies in distinguishing rational exuberance from explosive price behavior. More recent techniques, such as the Generalized Supremum Augmented Dickey-Fuller (GSADF) test proposed by Phillips et al. [1], address this issue by allowing for flexible, rolling-window tests that can detect multiple episodes of explosiveness within a single price series.
From a statistical perspective, the core problem is to determine whether observed price trends are stationary—reflecting temporary deviations—or non-stationary, indicating structural change. Non-stationary price processes often exhibit self-reinforcing dynamics, such as accelerating price movements without corresponding shifts in fundamentals. These dynamics are closely associated with speculative bubbles, particularly when investor expectations become unanchored and positive feedback loops dominate. Under the Efficient Market Hypothesis (EMH), prices should follow a martingale process:
However, during bubble regimes, this expectation shifts:
This departure from martingale behavior signals a breakdown in informational efficiency and a transition to a structurally altered market regime.
Identifying such transitions in real-time has become increasingly important for risk management, regulatory oversight, and quantitative investment strategies. Econometric tests like the SADF by Phillips et al. [2], and GSADF offer a theoretically grounded and empirically validated framework for bubble detection. Unlike traditional unit root tests, the GSADF allows for varying window sizes in both the starting and ending points of the estimation sample, making it particularly well-suited for detecting transient but impactful episodes of explosiveness.
Despite its effectiveness, the GSADF method is computationally intensive, scaling on the order of in naive implementations. In this study, to mitigate computational challenges, we utilize GPU acceleration techniques and MPI parallelization, which together enable practical analysis of high-frequency, multi-asset data. While this paper focuses on GSADF-based detection, other modeling approaches such as Log-Periodic Power Law Singularity (LPPLS) analysis, which targets bubble termination prediction, represent promising directions for future research. Incorporating such methods may complement GSADF testing by improving real-time detection and forecasting capabilities.
This study applies the GSADF test to high-frequency price data from five major cryptocurrencies—Bitcoin (BTC), Ethereum (ETH), Solana (SOL), Bitcoin Cash (BCH), and Aave (AAVE)—over the 2023–2025 period. These are compared to the S&P 500 index to highlight differences between crypto and traditional financial markets. Our analysis reveals that BTC and BCH exhibit regime shifts that align closely with macroeconomic announcements and monetary policy changes, while DeFi tokens show more fragmented structural breaks, often associated with protocol-specific developments. Notably, ETH experienced a major structural break in April 2024, triggered by Layer-2 migration pressures and delays in scaling upgrades.
In April 2025, both the crypto asset market and traditional financial markets faced significant turbulence driven by escalating trade tensions originating in the United States and disruptions in international trade agreements, which heightened global economic uncertainty. However, the S&P 500 index’s fluctuations during this period did not result in persistent structural breaks but were interpreted as short-term volatility caused by transient macroeconomic shocks. These findings suggest that the time series structure of traditional equity indices like the S&P 500 is more stable compared to crypto asset markets, maintaining structural integrity even amid events such as presidential elections or temporary macroeconomic disturbances.
By combining structural break testing with high-frequency data, this work contributes to the ongoing debate about the maturity and systemic relevance of cryptocurrency markets. It also opens up avenues for real-time structural risk assessment using improved computational tools. The results have implications for investors, policymakers, and developers seeking to understand the evolving dynamics of crypto-financial systems in a post-pandemic, high-volatility era.
2. Materials and Methods
2.1. Detection of Explosive Episodes via the GSADF Test
To detect episodes of transient explosiveness in asset prices, we employ the Generalized Supremum Augmented Dickey-Fuller (GSADF) test proposed by [1]. This method extends the standard ADF test by applying it over a range of subsamples, thereby enabling the identification of temporally localized episodes of explosive behavior.
The underlying data-generating process (DGP) is defined as a unit root process with a weak, sample-size-dependent drift term:
Here, is a constant drift magnitude, T is the sample size, and is a localization parameter that governs the asymptotic impact of the drift. When , the drift remains on the same order as the martingale component , allowing for transient deviations from the unit root—interpreted as episodes of speculative exuberance.
Empirically, the test is implemented via the Augmented Dickey-Fuller (ADF) regression on subsamples:
where and denote the relative start and end points of the subsample interval, and k is the lag order. The null hypothesis is tested over rolling and expanding windows.
The Supremum ADF (SADF) statistic fixes and varies , taking the maximum ADF statistic over all valid end points:
The GSADF statistic further allows to vary, computing the maximum ADF statistic over all valid subsamples such that :
Because the GSADF statistic does not follow a standard asymptotic distribution—especially when —critical values must be derived through Monte Carlo simulation under the null hypothesis of a unit root.
2.2. Data Sources and Preprocessing
We applied the GSADF test to the following datasets:
- S&P 500 futures tick-level data from March 2000 to December 2019, obtained from Kaggle [5].
- Cryptocurrency hourly data (BTC-USD, ETH-USD, SOL-USD, BCH-USD, AAVE-USD) and S&P 500 (USD) spot data for the most recent 730 days up to April 30, 2024, collected using the yfinance API.
For the S&P 500 futures, we focused on the period from March 2005 to December 2019, which includes major market events such as the 2008 financial crisis and the 2018 VIX shock. The tick data were aggregated into daily median-based dollar bars, and only the closing prices were used for constructing the time series. The ADF lag order was fixed to 1.
For cryptocurrencies and the S&P 500 spot index, the hourly data were also aggregated into daily dollar bars, and converted into daily return series. The final sequence lengths were approximately 600 observations per asset, which allowed efficient analysis without HPC acceleration.
2.3. Lag Order Selection
For the shorter cryptocurrency and spot index series, the optimal lag order k for the ADF regression was selected using the Bayesian Information Criterion (BIC). Specifically, for each series, autoregressive models with lag orders up to 5 were estimated, and the lag that minimized the BIC was chosen.
2.4. Monte Carlo Simulation for Critical Values
To obtain valid critical values for the GSADF statistic, we generated 1000 synthetic time series under the unit root null hypothesis for each real series length. From these Monte Carlo replications, the 90% and 95% quantiles of the GSADF distribution were computed and used as critical thresholds in subsequent analyses.
2.5. Computational Environment
For the long S&P 500 futures dataset (length > 5000), we implemented a custom PyTorch-based GSADF pipeline that utilized GPU acceleration and MPI-based parallelization. All simulations and regressions were executed on the Cambridge Computing Center’s Dawn cluster [6], optimized for large-scale numerical computation.
For cryptocurrency and spot index data, which were computationally light, all calculations were performed on a MacBook with Apple M3 cores, without the use of GPU or MPI.
We note that the implementation did not rely on standard Python packages such as statsmodels, as our custom setup allowed better optimization for large-scale recursive ADF regression.
Language localization and translation from Japanese to English, together with the collection of publicly available news sources, were supported by ChatGPT (OpenAI) under the direct supervision and verification of the authors.
3. Results
3.1. GSADF Application to S& 500 futures (2005–2019)
Figure 1 presents the results of the GSADF test applied to daily dollar-bar data of S&P 500 futures from March 2005 to December 2019, with the 90% and 95% critical values estimated via 1,000 Monte Carlo simulations. The GSADF test, by design, detects multiple episodes of transient explosiveness, rejecting the null hypothesis of a pure unit root process whenever the statistic exceeds the simulated thresholds.
During May to July 2007, the GSADF statistic intermittently crossed the 90% critical line, aligning with the escalation of the subprime mortgage crisis that followed the February 2007 bankruptcy of New Century Financial [17]. The signal intensified during the collapse of two Bear Stearns hedge funds in June and BNP Paribas’s suspension of three ABS funds in August [18], suggesting that the method captured early signs of systemic stress and market regime shift.
A pronounced spike above the 95% threshold in October 2008 corresponds precisely to the global financial crisis triggered by the Lehman Brothers collapse on September 15, 2008. This phase typifies a self-reinforcing crash where feedback loops drive rapid, nonlinear price declines—an archetype of bubble bursts.
The GSADF statistic again exceeded the 95% level on January 10, 2018, shortly before the “VIX shock” in early February. This period was marked by record-breaking highs in U.S. equity indices and heightened speculative activity. The subsequent volatility spike led to the unwinding of inverse VIX products like XIV and a cascade of algorithmic selloffs, forming a mechanical feedback loop [7]. The GSADF test appears to have preemptively detected the instability underlying this sharp correction.
These results affirm the GSADF test’s capacity to identify local structural breaks and speculative surges, even in mature markets like the S&P 500. Unlike conventional ADF tests, which may fail to detect periodically collapsing bubbles as highlighted by Evans (1991) [3], GSADF offers a more robust framework for real-time market monitoring and risk assessment.
In the following section, we apply this methodology to the cryptocurrency market, where price dynamics are more volatile and speculative episodes more frequent. We examine whether GSADF can similarly uncover meaningful signals from this emerging asset class.
3.2. GSADF Application to to Bitcoin and Altcoins
In this section, we apply GSADF test to a selection of major crypto asset pairs: BTC-USD, ETH-USD, SOL-USD, BCH-USD, and AAVE-USD. As shown in Figure 2, the GSADF statistic for BTC-USD intermittently exceeded the 90% and 95% critical thresholds from late October 2023 to early April 2024. This indicates that structural changes in the time series—specifically, episodes of explosive price behavior—persisted over this period in the cryptocurrency market.
Several macroeconomic and institutional factors coincided during this time, contributing to the observed price dynamics:
- In November 2023, the U.S. Federal Reserve paused its interest rate hikes [8], which increased risk appetite among investors and facilitated capital inflows into risk assets including cryptocurrencies.
- Around the same period, the U.S. Securities and Exchange Commission (SEC) signaled a more favorable stance toward approving several spot Bitcoin ETFs [9], enhancing the perceived institutional legitimacy of the crypto market.
- Persistent inflation and geopolitical uncertainties [10] also contributed to the reevaluation of cryptocurrencies as an alternative asset class.
- Furthermore, the victory of the Republican candidate in the U.S. presidential election in November 2024 raised expectations of deregulatory policies toward crypto assets. This development coincided with a renewed spike in the GSADF statistic in early 2025.
These interacting external drivers likely explain the broad and intermittent structural shifts observed in BTC-USD from October 2023 through April 2024.
In contrast, as shown in Figure 3(a), ETH-USD experienced short-lived structural changes in November and December 2023, and a sharp spike in March 2024 that was temporally aligned with BTC. However, unlike BTC, which exhibited a prolonged elevation of the GSADF statistic following the peak, ETH’s spike declined rapidly below the critical threshold. This suggests that while both assets reacted to the same macroeconomic event, their structural responses differed in duration and intensity. Notably, no significant change was detected after the 2024 U.S. election, further indicating that Ethereum may follow a distinct price formation mechanism compared to Bitcoin. In February 2025, ETH recorded a 36% decline from its 7-week local high [11], likely driven by a combination of deteriorating market sentiment and panic-induced retail selling amid widespread fear, uncertainty, and doubt (FUD).
As shown in Figure 3(b), SOL-USD exhibited a more prolonged period of structural change between November 2023 and January 2024. This shift was clearly linked to rapid expansion in Solana’s DeFi ecosystem. In November 2023, the monthly trading volume on decentralized exchanges (DEXs) built on Solana surged past $100 billion and reached $129 billion in November 2024—surpassing Ethereum’s previous all-time high of $117 billion set in May 2021 [12]. This expansion was driven by Solana’s low fees and fast processing capabilities, combined with a retail influx fueled by a meme coin boom.
Another wave of structural change was observed in March–April 2024, synchronized with BTC and ETH. However, after the summer of 2024, no significant GSADF spikes were detected, and the market structure appeared relatively stable.
For AAVE-USD , Figure 3(c), short-term structural changes were observed in November 2023, April 2024, and November 2025, though these episodes also lacked persistence.
In the case of BCH-USD, Figure 3(d), structural changes began slightly later, from December 2023, possibly due to its genealogical relationship with BTC. However, these changes were short-lived, and no significant shifts were detected in November 2023 or April 2025.
These results indicate that BTC and BCH are more sensitive to macroeconomic and institutional developments, while DeFi-related altcoins such as ETH, SOL, and AAVE exhibit structural changes tied to ecosystem-specific drivers.
In particular, ETH and SOL were influenced by internal factors such as upgrade schedules, Layer-2 migration plans, and developer activity. Their structural dynamics showed limited synchrony with BTC. A notable example is the structural change observed in ETH in April 2024, which likely stemmed from Ethereum-specific fundamental shifts—including migration pressure to Layer-2 networks, declining transaction fees, and delays in major upgrades [13].
In summary, the timing and persistence of structural breaks vary depending on the asset’s role and its sensitivity to external or internal market conditions. The GSADF test appears to capture not merely price fluctuations, but structurally significant episodes of speculative behavior consistent with macroeconomic, policy, or geopolitical catalysts. These findings support the utility of the GSADF procedure as a robust statistical tool for detecting speculative bubbles in cryptocurrency markets.
3.3. GSADF to the S&P 500 in 2023–2025
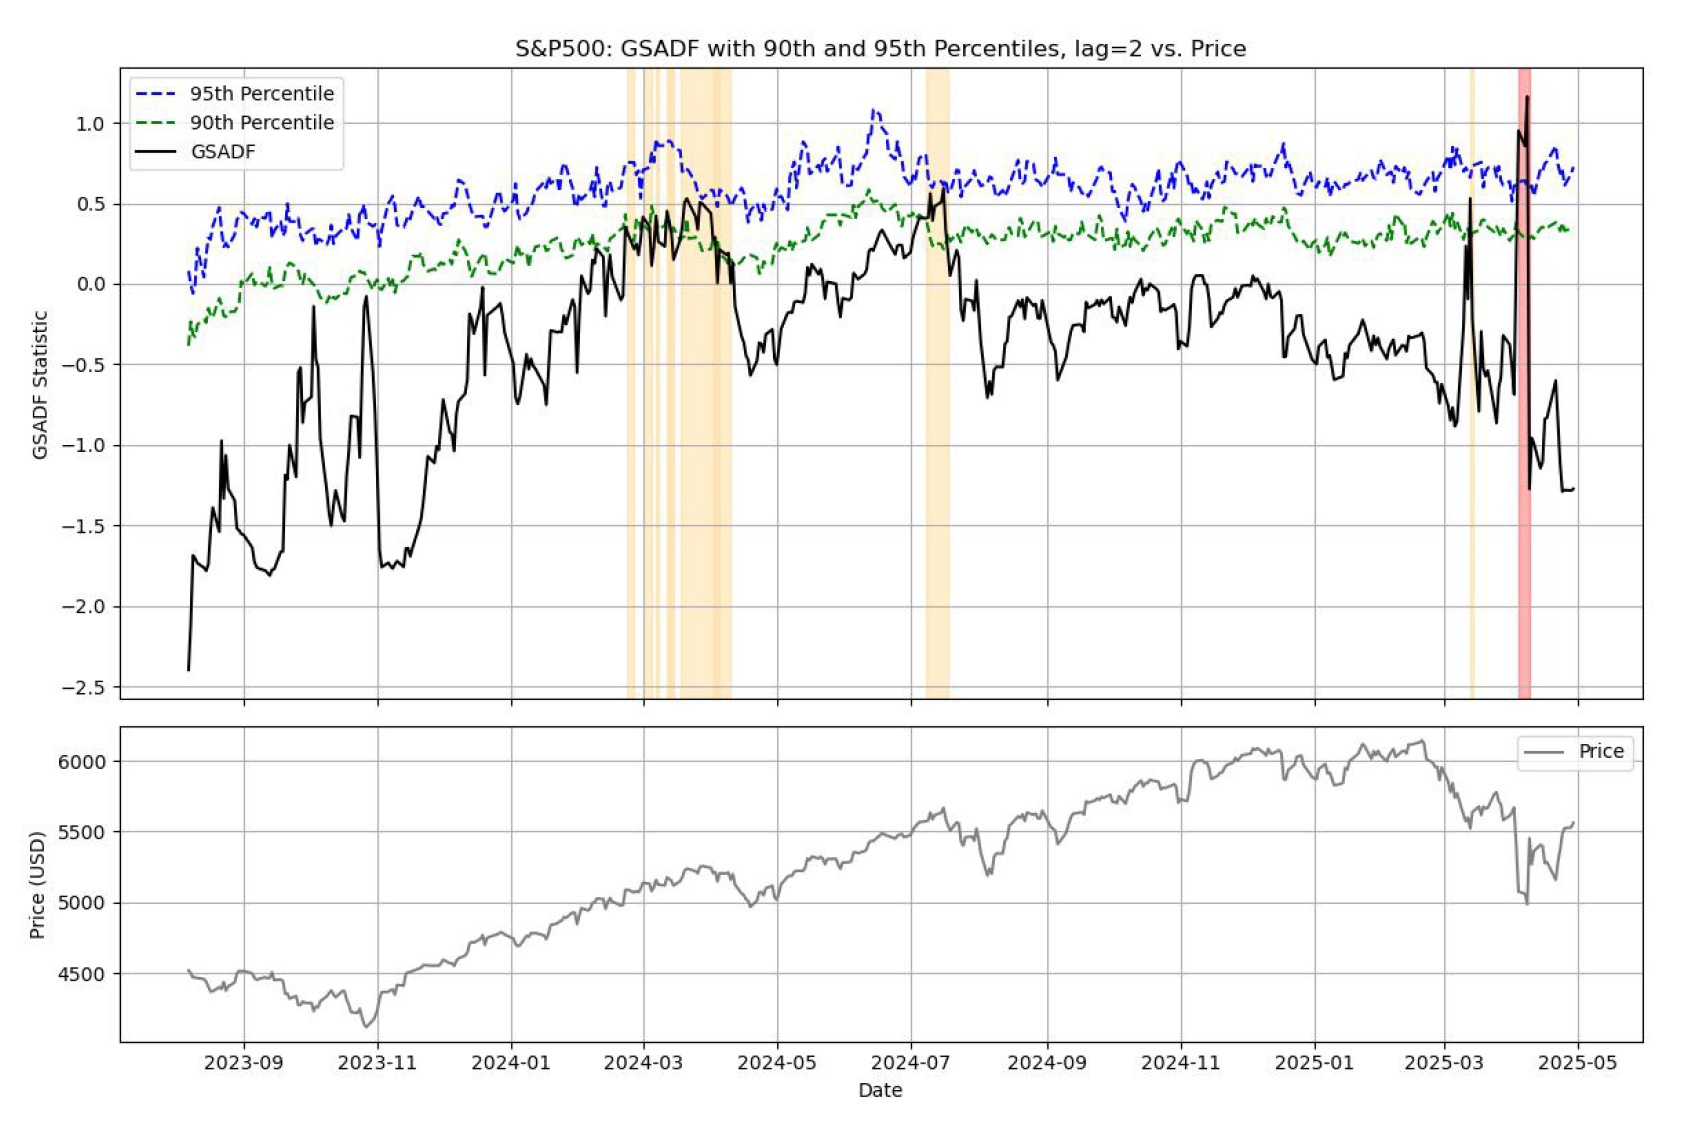
To compare structural dynamics between cryptocurrency and traditional equity markets, we applied the GSADF test to the S&P 500 index over the same two-year period using an identical methodology.
As shown in Figure 4, the GSADF statistics for the S&P 500 remained well below the critical thresholds throughout most of the period, and no significant structural break was observed. The brief fluctuation around April 2025 did not evolve into a persistent regime shift and is interpreted as a short-term reaction to transient macroeconomic shocks.
These results suggest that the time series structure of traditional equity indices, such as the S&P 500, is considerably more stable than that of crypto assets. Even in the presence of major events—such as presidential elections or temporary macroeconomic disturbances—the underlying structure appears resistant to abrupt changes, tending instead to absorb such events as statistical noise.
By contrast, Bitcoin exhibited multiple episodes of structural change during the same period, reflecting its heightened sensitivity to macroeconomic and institutional signals. Compared to DeFi-related altcoins such as ETH, SOL, and AAVE, Bitcoin’s regime shifts were more temporally aligned and persistent, suggesting its emerging role as a relatively "safe-haven" asset within the crypto ecosystem.
This contrast supports the interpretation that Bitcoin’s market value is no longer driven solely by speculative sentiment but increasingly reflects fundamental valuation factors. It may therefore function as a leading indicator of macro-level risk perception and economic shifts within the digital asset landscape.
3.4. Figures
Figure 1.
The top panel displays the GSADF statistic over time, with horizontal lines marking the 90% and 95% critical thresholds obtained via Monte Carlo simulation. The bottom panel shows the underlying asset price. Peaks in the GSADF statistic above these thresholds suggest structural breaks associated with bubble dynamics, such as the 2008 financial crisis and the 2018 volatility shock.
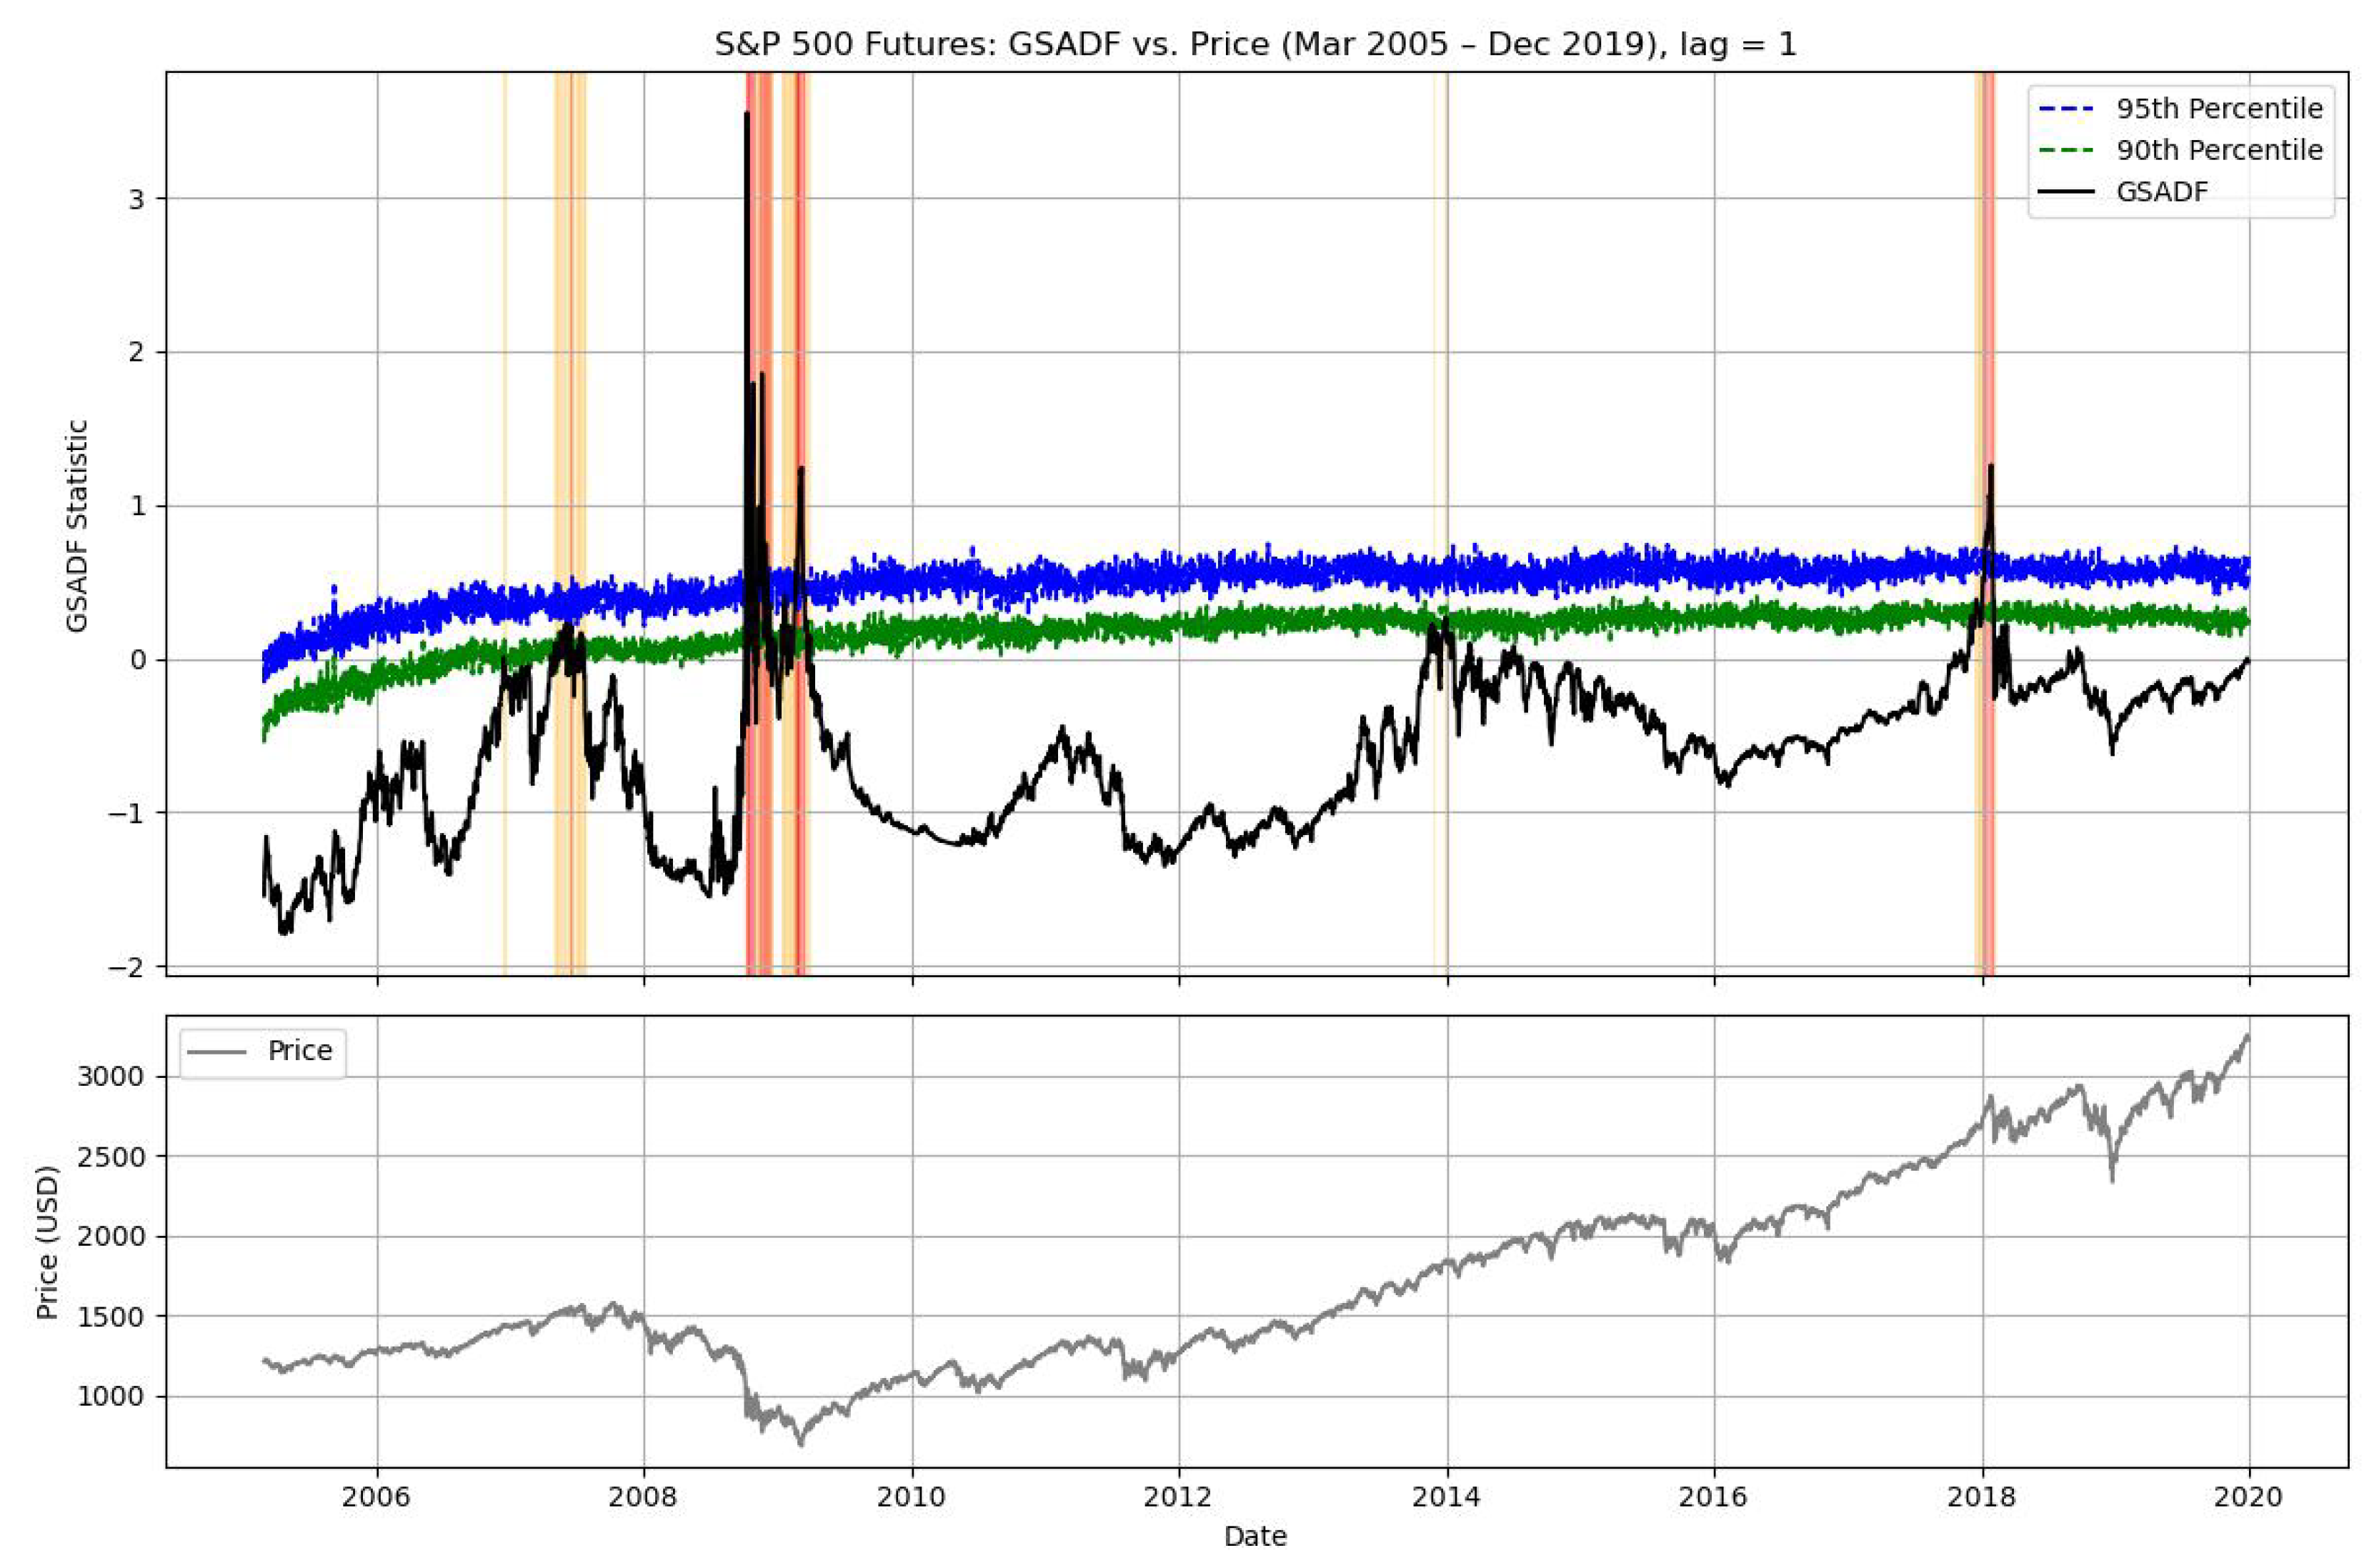
Figure 2.
The top panel displays the GSADF statistic over time, with horizontal lines marking the 90% and 95% critical thresholds obtained via Monte Carlo simulation. The bottom panel shows the BTC-USD hourly median price aggregated daily. The GSADF statistic intermittently exceeds the critical values from late October 2023 through mid-January 2024, then persistently surpasses the 90% and 95% thresholds from February to early April. Another spike above the 95% level occurs in mid-November, coinciding with post-election market reactions in the United States.
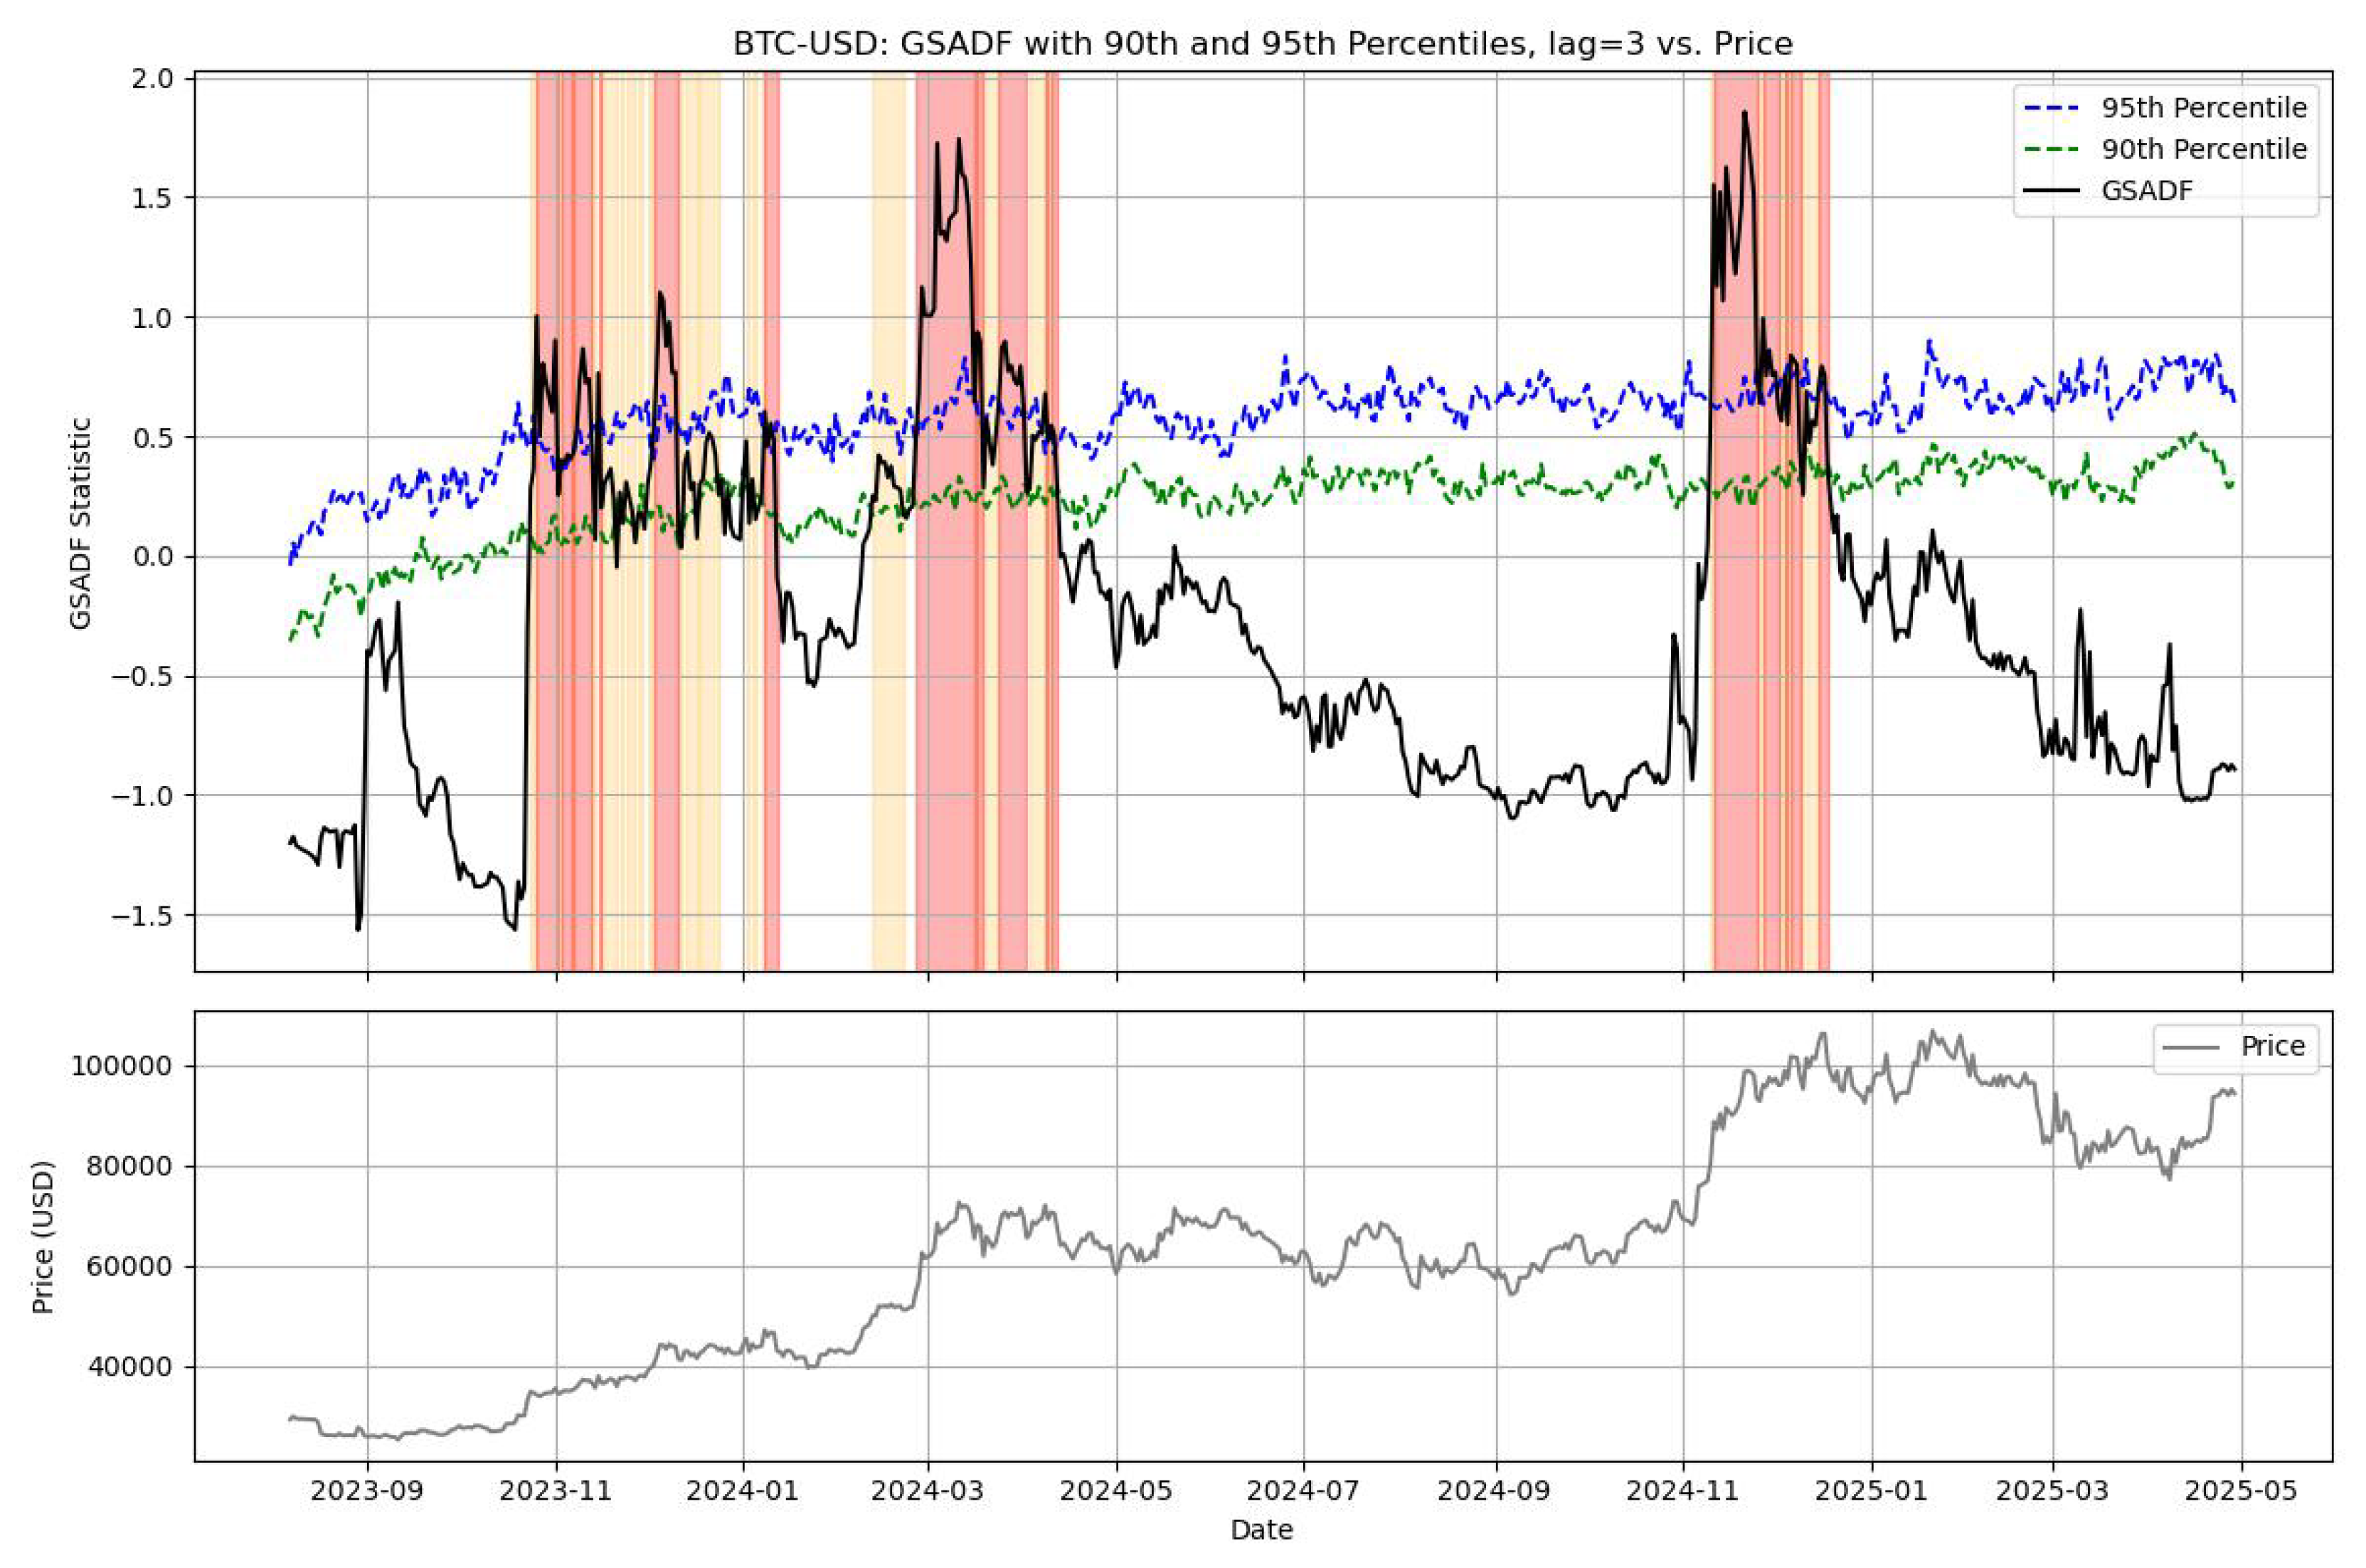
Figure 3.
Each subpanel corresponds to a different altcoin (ETH, SOL, AAVE, BCH). The top row of each subpanel shows the GSADF statistic over time for the altcoin-USD pair, with horizontal lines indicating the 90% and 95% critical values. The bottom row shows the daily aggregated hourly median price. ETH-USD a, SOL-USD (b) , AAVE-USD (c) and BCH-USD (d)
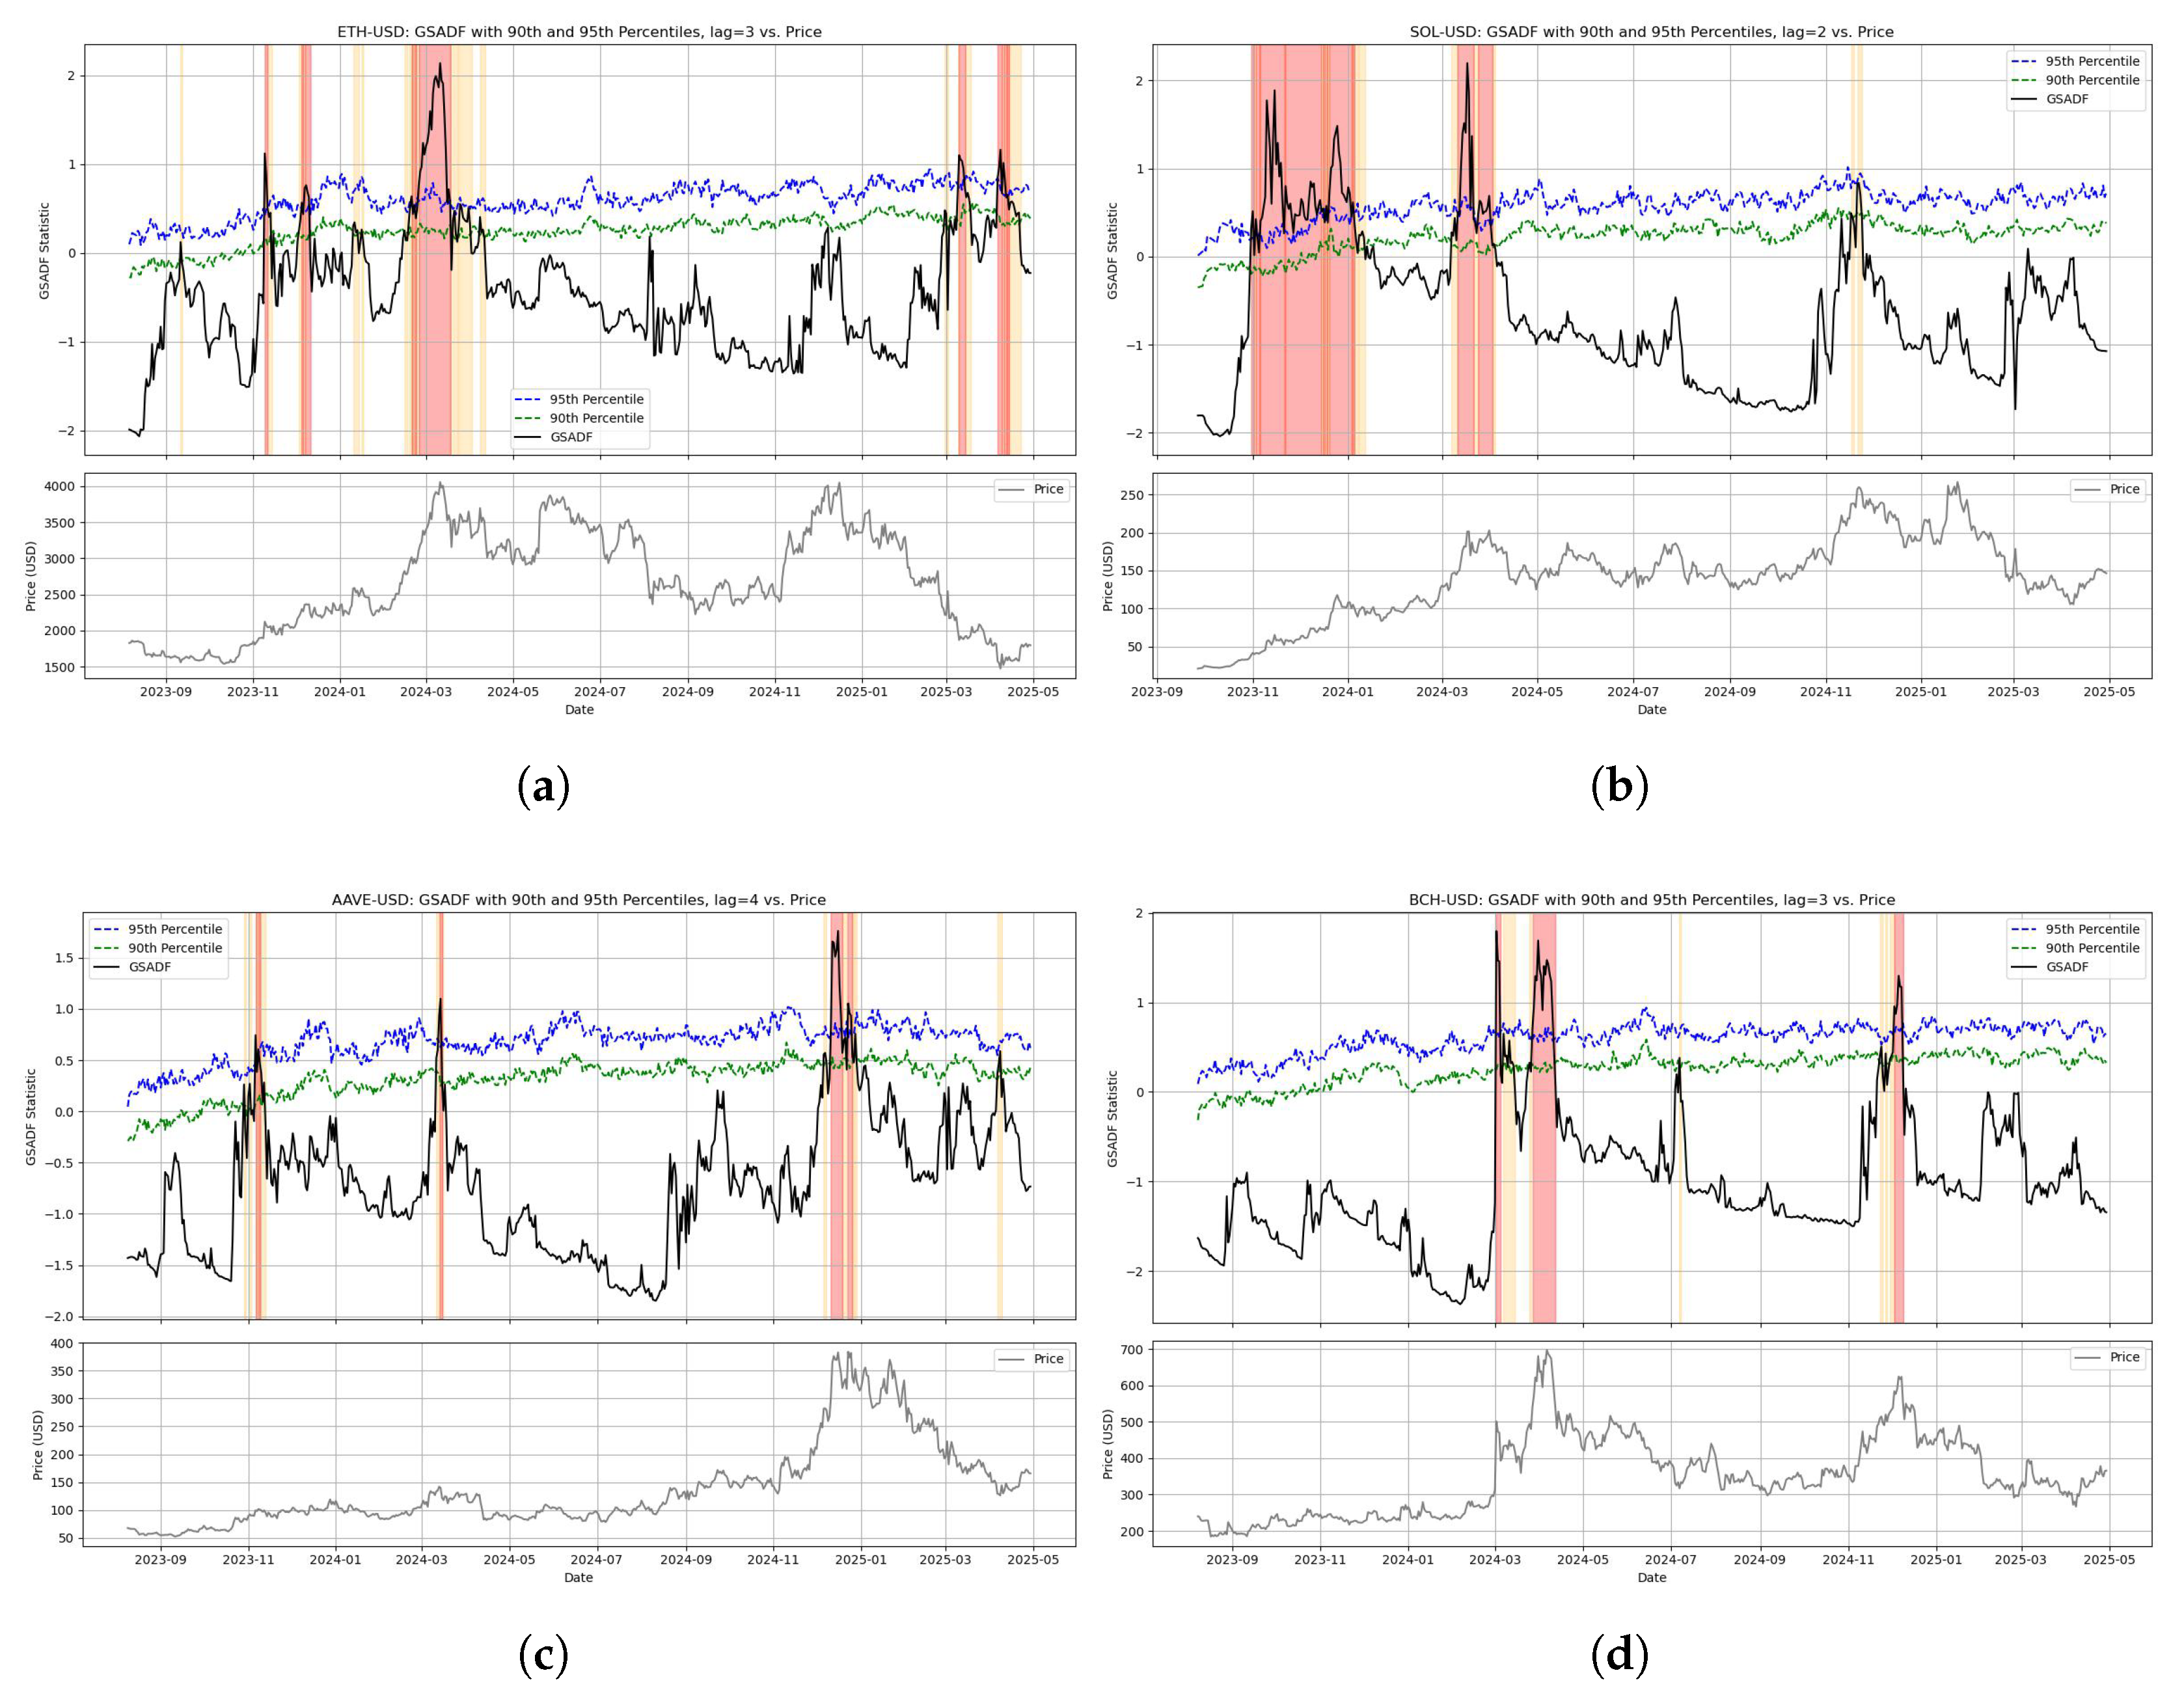
Figure 4.
S&P 500 spot. The top panel displays the GSADF statistic over time, with horizontal lines marking the 90% and 95% critical thresholds obtained via Monte Carlo simulation. The bottom panel shows the S&P500-USD spot hourly median price aggregated daily.
Figure 4.
S&P 500 spot. The top panel displays the GSADF statistic over time, with horizontal lines marking the 90% and 95% critical thresholds obtained via Monte Carlo simulation. The bottom panel shows the S&P500-USD spot hourly median price aggregated daily.
4. Discussion and Conclusion
Speculative bubbles in financial markets can present substantial short-term opportunities but also pose serious systemic risks. Detecting such nonstationary structural changes at an early stage is therefore a critical task in financial engineering, economics, and asset management.
In this study, we applied the Generalized Supremum Augmented Dickey-Fuller (GSADF) test to high-frequency data from five major crypto assets—BTC, ETH, SOL, AAVE, and BCH—covering the two-year period from April 2023 to April 2025. The results revealed multiple episodes of structural change, particularly in BTC, ETH and SOL, corresponding to macroeconomic events, institutional signals, and ecosystem-specific developments. These findings underscored the heterogeneous nature of regime shifts within the broader cryptocurrency market.
We then applied the same methodology to the S&P 500 index over the same period, using identical preprocessing and critical value estimation procedures. In contrast to crypto assets, the S&P 500 showed no significant structural breaks. Short-term volatility around April 2025 did not evolve into persistent regime changes, suggesting that the time series structure of traditional equity indices is substantially more stable and capable of absorbing transitory shocks without triggering systemic shifts.
Among the crypto assets, Bitcoin exhibited relatively persistent and temporally coherent structural breaks, indicating a higher sensitivity to macro-level developments and policy signals. In comparison, Ethereum and other DeFi-related tokens showed more fragmented and short-lived regime shifts, often triggered by internal technical changes such as Layer-2 migration or protocol upgrades. This contrast suggests that Bitcoin is increasingly regarded as a distinct asset class—less speculative, more fundamentally anchored, and potentially evolving into a macro-sensitive digital reserve asset.
The GSADF test proved effective in identifying meaningful structural transitions across both asset classes. However, several technical limitations remain, pointing to important areas for future research.
First, while the GSADF test offers strong statistical power, it is computationally intensive. Even the SADF test has a theoretical time complexity of , and the GSADF test, involving repeated SADF computations over all sub-samples, approaches . When applied to high-frequency data such as hourly prices, this leads to excessive memory usage and compute time. We currently mitigate this via GPU acceleration (using PyTorch) and inter-node parallelism (via MPI), but further scalability improvements are needed.
Second, estimating critical values requires nontrivial computational effort. We conducted over 1,000 Monte Carlo simulations per time-series length to ensure accuracy. Future directions may include reusing pseudo-random sequences, distributing simulations across high-performance computing environments, or using learning-based approximators for critical value estimation.
Third, while this study relies on traditional statistical tests, there is considerable scope for incorporating machine learning and AI. Neural networks or graph neural networks (GNNs) could serve as surrogate models to approximate test statistics across sub-samples, drastically reducing overhead. Evolutionary algorithms such as CMA-ES [14] may assist in selecting representative time series, while reinforcement learning could optimize the scanning strategy under limited computational budgets.
Finally, although our framework effectively detects bubble-like structural breaks, it does not estimate when such bubbles will end or model divergent price trajectories. Future research should consider integrating the Log-Periodic Power Law Singularity (LPPLS) model [15,16] to forecast the termination points of bubbles detected via GSADF. Despite the nonlinear complexity of LPPLS, its combination with AI-based optimizers—such as Bayesian optimization or evolutionary strategies—could improve both predictive accuracy and efficiency.
Addressing these challenges will lay the foundation for real-time structural break detection and bubble forecasting in high-frequency crypto markets. Ultimately, such methods can support more informed risk management and policy decision-making in a rapidly evolving financial landscape.
Funding
AY was funded under a sponsored research agreement with the Intel Corporation.
Institutional Review Board Statement
Not applicable.
Informed Consent Statement
Not applicable.
Data Availability Statement
The data supporting the findings of this study are publicly available from the following sources: - Cryptocurrency price data were retrieved from Yahoo Finance (https://finance.yahoo.com/ - S&P 500 futures tick data were obtained from Kaggle [5]
Acknowledgments
We acknowledge the use of the DAWN supercomputing system provided by the University of Cambridge Open Zettascale Lab. The authors acknowledge the use of ChatGPT (OpenAI) to assist with translation and the discovery of publicly available data sources. All scientific analysis and final writing decisions were carried out independently by the authors.
Conflicts of Interest
The authors declare no conflicts of interest. The funders had no role in the design of the study; in the collection, analyses, or interpretation of data; in the writing of the manuscript; or in the decision to publish the results.
References
- Phillips, P. C. B., Shi, S.-P., & Yu, J. (2015). Testing for multiple bubbles: Historical episodes of exuberance and collapse in the S&P 500. International Economic Review, 56(4), 1043–1078.
- Phillips, P. C. B., Shi, S.-P., & Yu, J. (2011). Explosive behavior in the 1990s Nasdaq: When did exuberance escalate asset values? International Economic Review. [CrossRef]
- Evans, G. W. (1991). Pitfalls in testing for explosive bubbles in asset prices. The American Economic Review, 81(4), 922–930.
- Gürkaynak, R. S. (2008). Econometric tests of asset price bubbles: Taking stock. Journal of Economic Surveys, 22(1), 166–186. [CrossRef]
- Kaggle. (2020). S&P 500 Futures Tick Data (2000–2019). Available online: https://www.kaggle.com/datasets/finnhub/sp-500-futures-tick-data-sp (accessed on 29 May 2025).
- Cambridge Open Zettascale Lab. (2023). Dawn: The UK’s fastest AI supercomputer. Available online: https://www.hpc.cam.ac.uk/d-w-n (accessed on 3 June 2025).
- Antoshin, S., Cortes, F., Kerry, W., & Piontek, T. (2018). Volatility Strikes Back. Available online: https://www.imf.org/en/Blogs/Articles/2018/05/03/volatility-strikes-back (accessed on 3 June 2025).
- Board of Governors of the Federal Reserve System. (2023). Federal Reserve issues FOMC statement - November 1, 2023. FederalReserve.gov. Available online: https://www.federalreserve.gov/newsevents/pressreleases/monetary20231101a.htm (accessed on 3 June 2025).
- Reuters. (2023). U.S. SEC has 8–10 filings of possible bitcoin ETF products. Available online: https://www.reuters.com/business/finance/sec-has-8-10-filings-possible-bitcoin-etf-products-gensler-2023-10-26/ (accessed on 3 June 2025).
- International Monetary Fund. (2023). IMF: Regional Economic Outlook Middle East and Central Asia. Available online: https://www.imf.org/en/Publications/REO/MECA/Issues/2023/10/12/regional-economic-outlook-mcd-october-2023 (accessed on 3 June 2025).
- Santiment. (2025). Ethereum’s Correction Has Led to Coins Sitting at Losses. Available online: https://santiment.net/read/ethereum-s-correction-has-led-to-coins-sitting-at-losses-8455 (accessed on 3 June 2025).
- SolanaFloor. (2024, December). Inside Solana’s record year: Unpacking the milestones behind DeFi’s growth in 2024. SolanaFloor. Available online: https://solanafloor.com/news/inside-solana-s-record-year-unpacking-the-milestones-behind-de-fi-s-growth-in-2024 (accessed on 3 June 2025).
- Cointelegraph. (2024). ETH price drops after Dencun upgrade as Ethereum Layer-2s slash transaction costs. Available online: https://cointelegraph.com/news/eth-price-drops-after-dencun-upgrade-ethereum-layer-2s-lower-transaction-costs (accessed on 3 June 2025).
- Hansen, N., & Ostermeier, A. (2001). Completely derandomized self-adaptation in evolution strategies. Evolutionary Computation, 9(2), 159–195.
- Johansen, A., & Sornette, D. (1999). Critical Crashes. arXiv:cond-mat/9901035. Available online: https://arxiv.org/abs/cond-mat/9901035 (accessed on 3 June 2025).
- Sornette, D. (2003). Why Stock Markets Crash: Critical Events in Complex Financial Systems. Princeton University Press.
- BLB&G.(2010).In re New Century Securities Litigation. Available online: https://www.blbglaw.com/cases-investigations/new-century-financial-corporation (accessed on 3 June 2025).
- BNP Paribas(2007).BNP Paribas Investment Partners temporaly suspends the calculation of the Net Asset Value of the following funds : Parvest Dynamic ABS, BNP Paribas ABS EURIBOR and BNP Paribas ABS EONIA. Available online: https://group.bnpparibas/en/press-release/bnp-paribas-investment-partners-temporaly-suspends-calculation-net-asset-funds-parvest-dynamic-abs-bnp-paribas-abs-euribor-bnp-paribas-abs-eonia (accessed on 3 June 2025).
Disclaimer/Publisher’s Note: The statements, opinions and data contained in all publications are solely those of the individual author(s) and contributor(s) and not of MDPI and/or the editor(s). MDPI and/or the editor(s) disclaim responsibility for any injury to people or property resulting from any ideas, methods, instructions or products referred to in the content. |
© 2025 by the authors. Licensee MDPI, Basel, Switzerland. This article is an open access article distributed under the terms and conditions of the Creative Commons Attribution (CC BY) license (http://creativecommons.org/licenses/by/4.0/).
Copyright: This open access article is published under a Creative Commons CC BY 4.0 license, which permit the free download, distribution, and reuse, provided that the author and preprint are cited in any reuse.


