
Submitted:
10 June 2025
Posted:
11 June 2025
You are already at the latest version
Abstract
Background: Previous studies have suggested that neuropathy is linked to changes in temperature in the soles of diabetic patients and rats. However, primary care in Mexico is limited. This study explores whether thermography can detect temperature changes in areas with sensitivity alterations (assessed using monofilament testing).Objectives: This study aims to compare the temperature of the soles of diabetic patients with tactile sensitivity alterations against those without such alterations. Additionally, we compared the temperature between non-sensitive and sensitive sites on the feet and finally found a regression model. Methods: A case-control study was conducted involving 116 feet with sensitivity alterations and 116 feet without alterations by the Semmes-Weinstein monofilament (SWM). We performed a comparative cross-sectional analysis of sensitive and non-sensitive sites' temperatures and a logistic regression. Sensitivity was evaluated using the SWM at nine sites. Sensitivity alteration was defined as the inability to detect all tested sites on the sole with SWM. Additionally, pallesthesia was assessed using a 128 Hz tuning fork. The temperature of the soles was measured using a FLIR model T865 thermal imaging camera, capturing minimum, maximum, and mean temperatures in degrees Celsius (°C) across the same nine sites assessed for sensitivity. Results: No significant differences were observed in temperature between cases and controls or between sensitive and non-sensitive sites in patients with diabetes. Logistic regression resulted in a model that included only creatinine. However, the temperature was not associated with the model. Conclusions: The study found no association between sensitivity alterations and temperature in the sole in patients with type 2 diabetes, as determined through SWM testing.
Keywords:
thermography
; sensitivity
; monofilament
; diabetes
1. Introduction
In primary care in Mexico, time is short. As in other countries, the estimated time per patient ranges from 48 seconds to 22.5 minutes, and 50% of countries have an average consultation time of 5 minutes or less [1]. This forces us to optimize time. In addition to the lack of access to other diagnostic studies, which are considered gold standards, clinicians must use the tools available quickly.Chronic diseases and their complications are among the most frequent reasons for consultation in family medicine, such as diabetes and neuropathy. Diabetic neuropathy (DPN) can be assessed in multiple ways through symptoms (like pain or insensibility), vibration perception with a tuning fork, Achilles reflex, monofilament, skin biopsy, electromyography, or a combination of these, such as the Toronto criteria [2] or the Michigan inventory [3]; the latter are either very extensive or inaccessible in primary care. However, the Semmes-Weinstein 5.07 (10 g) monofilament (SWM) test is a simple examination technique, low cost, used in clinical practice for the evaluation of pressure sensitivity, and tactile that allows early detection of patients with loss of “protective sensitivity” as a component of neuropathies and with a greater risk of suffering injuries and/or amputation of lower limbs, regardless of the vascular situation and the evolution time of diabetes [4]. Although its sensitivity is low, in primary care, it is sometimes the only diagnostic method available for neuropathy in diabetics. In previous studies, neuropathy was associated with changes in the sole temperature of diabetic patients [5] and rats [6]. As reported by Bagavathiappan et al. (2010), who found a higher average temperature in the feet of diabetic patients with neuropathy compared to diabetics without neuropathy [7]. Likewise, Zhou et al. (2020) reported that epidermal temperature corresponding to the plantar blood vessels of patients with mild DPN is greater than that of healthy controls (p<0.001), except for the posterior tibial artery [8]. On the other hand, Astasio-Picado et al. (2019) found a lower temperature in the head of the first metatarsal, the head of the fifth metatarsal, the heel, and both pads of the first toes, in patients who had neuropathy, vasculopathy, or neurovasculopathy compared to patients without these diseases [9]. However, we wondered if any decrease in sensation in the sole could show temperature changes, using only SWM.
2. Materials and Methods
Subjects: This study involved cases (116 feet) and controls (116 feet) of patients with type 2 diabetes mellitus, resulting in a total of 232 feet analyzed. The cases were defined as patients who could not feel all the evaluated points using the SWM. The control group was matched based on age range (within 5 years) and glycosylated hemoglobin levels, categorized as either controlled (<7%) or uncontrolled (>7%), and did not have alteration in pallesthesia. Exclusion criteria included patients with neurological disorders (such as degenerative lumbar spine disease, deformities, or a history of neural tube defects) that could affect sensitivity. Patients whose relevant information was not adequately captured in the variables of interest were also excluded. Participants were recruited from a family medical unit at the Mexican Social Security Institute (primary care) in Jalisco, Mexico. They were informed about the purpose of the study and provided written informed consent. The study protocol received approval from the ethics committee (COPEPRIS 17 CI 14 039 030) and was registered with CONBIOETICA 15201122, approved on December 1, 2022, by the local health research committee 1305. The principles of the Helsinki Declaration were upheld throughout the study.
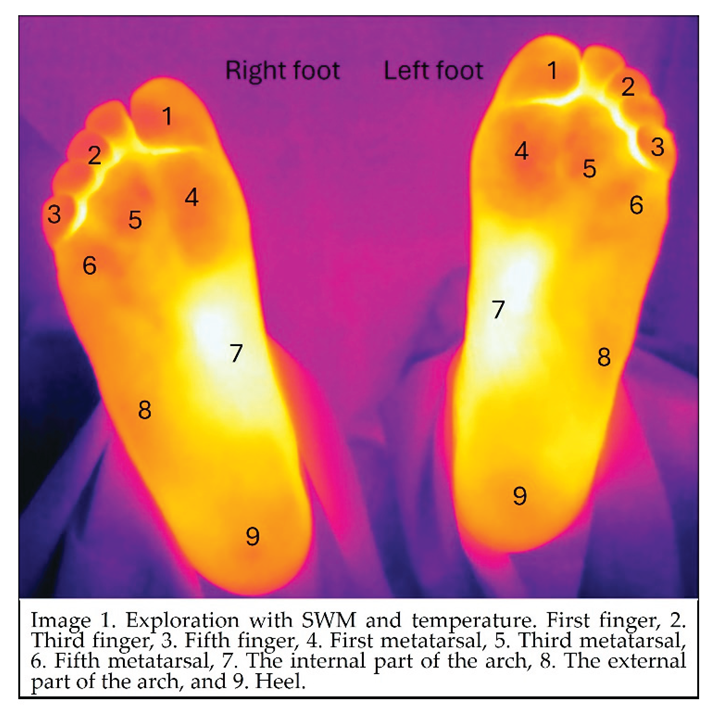
Sensitivity was evaluated in the supine position using a SWM at nine specific sites: 1. First finger, 2. Third finger, 3. Fifth finger, 4. First metatarsal, 5. Third metatarsal, 6. Fifth metatarsal, 7. The internal part of the arch, 8. The external part of the arch, and 9. Heel (Image 1). Patients were instructed to respond “yes” each time they felt the application of the monofilament. If they did not respond to contact in a specific area of the foot, the evaluation continued to the next site. After completing the initial sequence, the areas where the patient did not indicate feeling contact with the monofilament were retested. If the patient could feel it during this retesting, that point was recorded as sensitive. Additionally, pallesthesia (sensitivity to vibration) was assessed using a 128 Hz tuning fork placed on the following areas: 1. Head of the first metatarsal, 2. Lateral malleolus, and 3. Medial malleolus. Patients were asked whether they felt the vibration at each site. An alteration in pallesthesia is considered present if the patient reports feeling vibrations only in one or two of the three evaluated areas.
The temperatures of nine sites evaluated for sensitivity were recorded, capturing the minimum, maximum, and mean temperatures for each site. The conditions and tools used to obtain these measurements are detailed as follows. Temperature assessments were conducted on the soles of the participants' feet using a FLIR thermal imaging camera (model T865), with a resolution of 640 x 480 pixels and an accuracy of ± 1°C. The measurements occurred in a room maintained at 21 degrees Celsius, with humidity monitored using a hygrometer. The emissivity setting for human skin was set at 0.98. Participants were instructed not to apply any products that could affect their skin temperature, such as creams, antiperspirants, or powders. All patients were evaluated in a supine position after undergoing a 15-minute acclimatization period with their feet uncovered. The camera was positioned 80 cm above the participants' feet. The analysis was performed using the FLIR thermal imaging software.
Additional variables were also considered in the evaluation, including age, gender, duration of diabetes mellitus, smoking index (number of cigarettes smoked per day) * (number of years of smoking)/20. Smoking risk was classified as follows: <10 null, 10–20 moderate, 21–40 intense, >41 high, comorbidities: hypertension, obesity (based on body mass index), kidney disease, biochemical: fasting glucose levels, glycated hemoglobin, creatinine, uric acid, lipid profiles (cholesterol, triglycerides, LDL, and HDL), blood counts, and the presence of ulcers, pain, or discomfort in the lower extremities.
The statistical analyses conducted were as follows: We compared the temperatures at nine evaluated sites between cases and controls to determine if there were any temperature differences. This analysis was performed using the student’s t-test for independent samples, utilizing the SPSS Version 29 statistical package. Additionally, we conducted a comparative cross-sectional study to analyze the temperatures of non-sensitive areas against the temperatures of sensitive areas. Finally, a forward conditioned logistic regression was performed to find a model.
3. Results
A total of 232 feet of patients with diabetes mellitus were analyzed, with a mean age of 67 years (± 10 years; range: 35 to 84 years). Among the participants, 54.3% (63 individuals) were women. The average duration of diabetes mellitus was 11 years and 6 months (± 8 years; range: 3 months to 38 years). The most common comorbidities included hypertension (79.3%, 92 patients), obesity (43.1%, 50 patients), overweight (37.1%, 43 patients), and smoking (37.9%, 44 patients). Of the patients smoking, 24.1% (28 individuals) were classified as low risk, 7.8% (9 individuals) as moderate risk, and 6.0% (7 individuals) as high risk. According to KDIGO classification, renal function was categorized as follows: G3a (13.8%, 16 patients), G3b (12.1%, 14 patients), and G4 (1.7%, 2 patients). No patients were in stage G5. Alterations in pallesthesia were noticed in 34.5% (20 patients) of the cases, while none of the control patients exhibited this alteration. Regarding pain perception, 77.6% (45 patients) of those with altered sensitivity reported pain, compared to 39.7% (23 patients) in the control group. Neither cases nor controls reported the presence of plantar ulcers. Table 1 displays the means and standard deviations of the variables in both participant groups. In patients with altered sensitivity, hematocrit levels were lower, creatinine levels were higher, and the glomerular filtration rate was lower. It is important to note that the average filtration rate was greater than 60 ml/min in both groups.
In the first analysis, the temperature of 116 feet with sensitivity alteration (feet that fell at eight or fewer of the nine analyzed sites) was compared to the temperature of 116 feet without disturbances (felt in all nine analyzed sites). We did not find any statistically significant differences (Table 2).
In the second analysis, when comparing the temperature of the sites that were not sensitive vs. the temperature of the same site in feet that were sensitive, no statistically significant differences were found either (Table 3). In addition, to find difference between temperature in feet with less sensitivity we performed a subgroup with 35 cases (who could only perceive 6 or fewer sites) vs. 35 controls, matched in the same way, age, and glycosylated hemoglobin values; however, the results of both analyses were similar, and there was no significant difference.
Logistic regression resulted in a model of sensitivity alterations that included only creatinine. The significance of the model was p<0.001, Cox and Snell R square 0.151, Nagelkerke R square 0.201. Creatinine showed a positive B value, which is interpreted as a directly proportional relationship, and the odds ratio was 19.371; therefore, a patient with sensitivity alterations has a 19 times greater risk of presenting higher creatinine levels. However, temperature had no association in this model. In Table 4, the values of the model are shown.
4. Discussion
Diabetic neuropathy is the most common symptomatic complication in patients with diabetes mellitus (DM), as well as the leading cause of injuries and amputations. This condition affects the sensory, motor, and autonomic fibers of the peripheral nervous system distally [10]. This can result in pain in 7.5% to 24% of patients, according to the report by Russell and Zilliox (2014) [11]. However, a higher frequency was observed in our population, ranging from 39.7% in controls to 77.6% in cases, However, there could be other underlying causes that explain the pain in both cases and controls, such as venous insufficiency and joint disorders. Another manifestation of diabetic neuropathy is altered pallesthesia, which occurred at a frequency of 34.5% in our study group. This is associated with a high risk of ulceration, as shown by the results of Boulton et al. (1986), who reported an Odds ratio of 10.7 (p=0.001) for developing ulcers in patients with pallesthesia disorders [12]. It should be noted that no ulcerations were currently observed in our study group. The high frequency of pain and pallesthesia in our patients could be explained by glycated hemoglobin high levels or poor metabolic control, since both cases and controls showed glycated hemoglobin greater than 7%. Poor metabolic control, assessed by continuously monitored high glucose levels (Glucose Risk Index), has already been identified as a cause of neuropathy manifestations [13]. Similarly, the regression model of our study showed an association between altered sensitivity with increased creatinine. This variable has already shown its impact as a risk factor in another regression model reported in diabetic patients from Taiwan [14]. Finally, we found no association between alterations in sensitivity measured by SWM and temperature; however, this lack of association could be due to the variability in sensitivity (0.53–0.93) and specificity (0.64–1.0) of monofilament scanning for detecting neuropathy [15]. Furthermore, most publications that demonstrated an association between diabetic neuropathy and thermography used combinations of methods to determine diabetic neuropathy, not just SWM. This is a weakness of the study, although it also provides concrete information supporting the possibility that this method may not be sufficient to determine diabetic neuropathy. Furthermore, the thermographic cameras and the standardization of image acquisition vary across studies, making it difficult to compare one study with another [7,8]. Future perspectives: Future studies could use other methods to assess neuropathy, providing greater sensitivity and specificity, larger sample sizes, and the possible homogenization of thermographic imaging. However, in primary care, the monofilament test remains useful and is sometimes the only one available, so its use should not be discouraged.
Conclusion: Alteration in sensitivity assessed with SWM did not reveal an association with temperature in the soles of the feet of diabetic patients. The regression model showed an association between increased creatinine in diabetic patients with neuropathy assessed with a monofilament.
Funding
The author(s) received financial support for the research from Foundation IMSS. For Priority Topics, Vulnerable Population, and Emerging Topics, with registration number r2023-1303-003. https://fundacionimss.org.mx/somos/.
Institutional Review Board Statement
“The study was conducted by the Declaration of Helsinki, and approved by the Ethics Committee of INSTITUTO MEXICANO DEL SEGURO SOCIAL (clies 1305 r-2022-1305-088) (COPEPRIS 17 CI 14 039 030, Registre CONBIOETICA CONBIOETICA-15201122).”.
Informed Consent Statement
“Informed consent was obtained from all subjects involved in the study.”
Acknowledgments
Ramón Quiroz Navarrete, Ruth Velázquez Mier, Silvia Georgina Mosqueda Lara, Cinthya Guadalupe Veliz Ramírez, Ulises Cruz Carrillo, Gloria Llasania García Corrales, José Damaso Israel González Acosta, Karen Yadira Carrillo Carrillo, Karen Lizbeth Aguayo Gómez, Martha Delia Palacios Avelar y Andrea Penélope Aguilar Quintana.
Conflicts of Interest
Declare conflicts of interest or state “The authors declare no conflicts of interest.”
References
- Irving, G.; Neves, A.L.; Dambha-Miller, H.; Oishi, A.; Tagashira, H.; Verho, A.; Holden, J. International variations in primary care physician consultation time: a systematic review of 67 countries. BMJ Open 2017, 7, e017902. [Google Scholar] [CrossRef] [PubMed]
- Bril, V.; Perkins, B.A. Validation of the Toronto Clinical Scoring System for Diabetic Polyneuropathy. Diabetes Care: 2002, 25, 2048–2052. [Google Scholar] [CrossRef] [PubMed]
- Moghtaderi, A.; Bakhshipour, A.; Rashidi, H. Validation of Michigan neuropathy screening instrument for diabetic peripheral neuropathy. Clinical Neurology and Neurosurgery 2005, 108, 477–481. [Google Scholar] [CrossRef] [PubMed]
- Dube, S.; Hulke, S.M.; Wakode, S.L.; Khadanga, S.; Thakare, A.E.; Bharshankar, R.N.; Pakhare, A. Effectiveness of Semmes Weinstein 10 gm monofilament in diabetic peripheral neuropathy, taking nerve conduction and autonomic function study as reference tests. Journal of Family Medicine and Primary Care 2022, 11, 6204–6208. [Google Scholar] [CrossRef] [PubMed]
- Ilo, A.; Romsi, P.; Mäkelä, J. Infrared thermography and vascular disorders in diabetic feet. Journal of Diabetes Science and Technology 2019, 14, 28–36. [Google Scholar] [CrossRef] [PubMed]
- Kambiz, S.; Van Neck, J.W.; Cosgun, S.G.; Van Velzen, M.H.N.; Janssen, J.A.M.J.L.; Avazverdi, N.; Hovius, S.E.R.; Walbeehm, E.T. An early diagnostic tool for diabetic peripheral neuropathy in rats. PLoS ONE 2015, 10, e0126892. [Google Scholar] [CrossRef] [PubMed]
- Bagavathiappan, S.; Philip, J.; Jayakumar, T.; Raj, B.; Rao, P.N.S.; Varalakshmi, M.; Mohan, V. Correlation between Plantar Foot Temperature and Diabetic Neuropathy: A Case Study by Using an Infrared Thermal Imaging Technique. Journal of Diabetes Science and Technology 2010, 4, 1386–1392. [Google Scholar] [CrossRef] [PubMed]
- Zhou, Q.; Qian, Z.; Wu, J.; Liu, J.; Ren, L.; Ren, L. Early diagnosis of diabetic peripheral neuropathy based on infrared thermal imaging technology. Diabetes/Metabolism Research and Reviews 2020, 37. [Google Scholar] [CrossRef] [PubMed]
- Astasio-Picado, Á.; Martínez, E.E.; Gómez-Martín, B. Comparison of Thermal Foot Maps between Diabetic Patients with Neuropathic, Vascular, Neurovascular, and No Complications. Current Diabetes Reviews: 2019, 15, 503–509. [Google Scholar] [CrossRef] [PubMed]
- Velasco, M.B.; Rodríguez, D.C.; Montalbán, A.I.R.; Jiménez, S.V.; De Valderrama Martínez, I.F. Actualización en el diagnóstico, tratamiento y prevención de la neuropatía diabética periférica. Angiología 2016, 69, 174–181. [Google Scholar] [CrossRef]
- Russell, J.W.; Zilliox, L.A. Diabetic neuropathies. CONTINUUM Lifelong Learning in Neurology 2014, 20, 1226–1240. [Google Scholar] [CrossRef] [PubMed]
- Boulton, A.J.M.; Kubrusly, D.B.; Bowker, J.H.; Gadia, M.T.; Quintero, L.; Becker, D.M.; Skyler, J.S.; Sosenko, J.M. Impaired vibratory perception and diabetic foot ulceration. Diabetic Medicine 1986, 3, 335–337. [Google Scholar] [CrossRef] [PubMed]
- Tang, Y.; Zhang, P.; Li, L.; Li, J. Diabetic Peripheral Neuropathy and glycemia Risk Index in Type 2 Diabetes: A Cross-Sectional Study. Diabetes Metabolic Syndrome and Obesity 2024, 17, 4191–4198. [Google Scholar] [CrossRef]
- Wang, C.-S.; Pai, Y.-W.; Lin, C.-H.; Lee, I.-T.; Chang, M.-H. Renal impairment is one of the appropriate predictors of future diabetic peripheral neuropathy: a hospital-based 6-year follow-up study. Scientific Reports 2022, 12. [Google Scholar] [CrossRef] [PubMed]
- Mogilevskaya, M.; Gaviria-Carrillo, M.; Feliciano-Alfonso, J.E.; Barragan, A.M.; Calderon-Ospina, C.A.; Nava-Mesa, M.O. Diagnostic Accuracy of screening tests for Diabetic peripheral Neuropathy: An umbrella review. Journal of Diabetes Research: 2024, 2024. [Google Scholar] [CrossRef] [PubMed]

Table 1.
Intervening variables in cases and controls.
| Control | Cases | ||||
| Mean | Standard deviation | Mean | Standard deviation | p | |
| Body Mass Index | 29.40 | 4.66 | 29.81 | 5.85 | 0.68 |
| Systolic blood pressure(mm/Hg) | 139.20 | 22.00 | 145.59 | 22.87 | 0.14 |
| Diastolic blood pressure(mm/Hg) | 80.52 | 8.24 | 82.70 | 9.97 | 0.22 |
| Leukocytes(miles/uL) | 6.65 | 1.50 | 6.88 | 1.43 | 0.41 |
| Neutrophils (%) | 66.00 | 6.52 | 66.39 | 7.88 | 0.77 |
| Hemoglobin(g/dL) | 13.75 | 1.43 | 13.30 | 1.62 | 0.11 |
| Hematocrit (%) | 42.12 | 6.98 | 39.82 | 4.34 | 0.04* |
| Platelets (miles/uL) | 214.83 | 73.82 | 205.21 | 63.24 | 0.45 |
| Glucose (mg/dL) | 131.14 | 65.95 | 134.71 | 91.92 | 0.81 |
| Creatinine (mg/dL) | 0.91 | 0.19 | 1.17 | 0.40 | <0.05* |
| Uric acid (mg/dL) | 4.13 | 1.33 | 4.64 | 1.50 | 0.06 |
| Glomerular filtration rate(mL/min/1.73) | 81.22 | 14.31 | 66.22 | 22.96 | <0.05* |
| Total cholesterol(mg/dL) | 165.32 | 46.69 | 170.42 | 48.08 | 0.56 |
| Triglycerides(mg/dL) | 158.65 | 80.91 | 210.69 | 343.11 | 0.27 |
| Cholesterol HDL (mg/dL) | 40.87 | 12.88 | 40.93 | 9.31 | 0.98 |
| Cholesterol LDL (mg/dL) | 92.71 | 39.99 | 94.71 | 35.34 | 0.78 |
| Cholesterol VLDL (mg/dL) | 31.73 | 16.18 | 31.09 | 16.92 | 0.84 |
| Glycated hemoglobin A1c (%) | 7.86 | 1.75 | 8.07 | 2.01 | 0.55 |
| Estimated average glucose (mg/dL) | 178.96 | 50.07 | 184.98 | 57.55 | 0.55 |
Table 2.
Temperatures recorded in cases vs controls, at nine sites on the sole.
| Analyzed sites | Controls (n=116)/ Cases (n=116) |
Measured temperature | Mean (C°) | Standard deviation | p |
| 1. First finger | 0 | Max1 | 26.93 | 3.04 | 0.98 |
| 1 | 26.91 | 3.06 | |||
| 0 | Min1 | 25.18 | 2.95 | 0.95 | |
| 1 | 25.14 | 2.67 | |||
| 0 | Mean1 | 26.03 | 3.08 | 0.85 | |
| 1 | 26.14 | 2.98 | |||
| 2. Third finger | 0 | Max2 | 26.14 | 2.89 | 0.87 |
| 1 | 26.23 | 2.74 | |||
| 0 | Min2 | 24.79 | 2.65 | 0.86 | |
| 1 | 24.71 | 2.36 | |||
| 0 | Mean2 | 25.49 | 2.88 | 0.90 | |
| 1 | 25.55 | 2.76 | |||
| 3. Fifth finger | 0 | Max3 | 26.78 | 2.77 | 0.78 |
| 1 | 26.93 | 2.94 | |||
| 0 | Min3 | 24.84 | 2.47 | 0.58 | |
| 1 | 24.59 | 2.38 | |||
| 0 | Mean3 | 25.76 | 2.68 | 0.75 | |
| 1 | 25.92 | 2.78 | |||
| 4. First metatarsus | 0 | Max4 | 27.59 | 2.64 | 0.96 |
| 1 | 27.57 | 2.63 | |||
| 0 | Min4 | 26.46 | 2.66 | 0.91 | |
| 1 | 26.41 | 2.55 | |||
| 0 | Mean4 | 27.02 | 2.67 | 0.95 | |
| 1 | 26.99 | 2.57 | |||
| 5. Third metatarsus | 0 | Max5 | 27.76 | 2.58 | 0.77 |
| 1 | 27.90 | 2.58 | |||
| 0 | Min5 | 26.57 | 2.51 | 0.75 | |
| 1 | 26.72 | 2.50 | |||
| 0 | Mean5 | 27.17 | 2.55 | 0.75 | |
| 1 | 27.32 | 2.51 | |||
| 6. Fifth metatarsus | 0 | Max6 | 27.50 | 2.49 | 0.69 |
| 1 | 27.69 | 2.49 | |||
| 0 | Min6 | 26.20 | 2.51 | 0.83 | |
| 1 | 26.30 | 2.34 | |||
| 0 | Mean6 | 26.91 | 2.46 | 0.80 | |
| 1 | 27.02 | 2.40 | |||
| 7. The internal part of the arch | 0 | Max7 | 29.06 | 2.11 | 0.33 |
| 1 | 28.67 | 2.18 | |||
| 0 | Min7 | 27.64 | 2.20 | 0.33 | |
| 1 | 27.24 | 2.18 | |||
| 0 | Mean7 | 28.62 | 2.12 | 0.29 | |
| 1 | 28.19 | 2.19 | |||
| 8. The external part of the arch | 0 | Max8 | 27.92 | 2.18 | 0.69 |
| 1 | 27.76 | 2.17 | |||
| 0 | Min8 | 26.56 | 2.17 | 0.75 | |
| 1 | 26.44 | 2.16 | |||
| 0 | Mean8 | 27.24 | 2.14 | 0.68 | |
| 1 | 27.07 | 2.16 | |||
| 9. Heel | 0 | Max9 | 26.93 | 2.34 | 0.97 |
| 1 | 26.91 | 2.37 | |||
| 0 | Min9 | 25.70 | 2.13 | 0.67 | |
| 1 | 25.54 | 2.03 | |||
| 0 | Mean9 | 26.37 | 2.30 | 0.83 | |
| 1 | 26.27 | 2.22 | |||
| 0: Controls, 1:Cases, Max: Maximum, Min: Minimum. | |||||
Table 3.
Temperature was recorded in the sensitive site vs the non-sensitive area in nine areas on the sole assessed by monofilament.
Table 3.
Temperature was recorded in the sensitive site vs the non-sensitive area in nine areas on the sole assessed by monofilament.
| Analyzed areas | Sample size | Measured temperature | Temperature Mean (C°) | Standard deviation | p | |
| 1. First finger | S | 88 | Max1 | 26.98 | 2.79 | 0.74 |
| NS | 28 | 26.72 | 3.76 | |||
| S | 88 | Min1 | 25.15 | 2.62 | 0.96 | |
| NS | 28 | 25.18 | 3.35 | |||
| S | 88 | Mean1 | 26.10 | 2.82 | 0.93 | |
| NS | 28 | 26.04 | 3.62 | |||
| 2. Third finger. | S | 90 | Max2 | 26.06 | 2.55 | 0.45 |
| NS | 26 | 26.63 | 3.57 | |||
| S | 90 | Min2 | 24.64 | 2.38 | 0.37 | |
| NS | 26 | 25.14 | 2.89 | |||
| S | 90 | Mean2 | 25.36 | 2.56 | 0.34 | |
| NS | 26 | 26.08 | 3.54 | |||
| 3. Fifth finger. | S | 89 | Max3 | 26.81 | 2.53 | 0.82 |
| NS | 26 | 27.00 | 3.78 | |||
| S | 89 | Min3 | 24.66 | 2.16 | 0.68 | |
| NS | 26 | 24.93 | 3.20 | |||
| S | 89 | Mean3 | 25.77 | 2.45 | 0.69 | |
| NS | 26 | 26.08 | 3.55 | |||
| 4. First metatarsus. | S | 94 | Max4 | 27.57 | 2.48 | 0.95 |
| NS | 22 | 27.61 | 3.22 | |||
| S | 94 | Min4 | 26.44 | 2.46 | 0.96 | |
| NS | 22 | 26.41 | 3.16 | |||
| S | 94 | Mean4 | 27.00 | 2.46 | 0.96 | |
| NS | 22 | 27.04 | 3.23 | |||
| 5. Third metatarsus. | S | 91 | Max5 | 27.79 | 2.42 | 0.75 |
| NS | 25 | 27.98 | 3.09 | |||
| S | 91 | Min5 | 26.61 | 2.35 | 0.75 | |
| NS | 25 | 26.78 | 3.03 | |||
| S | 91 | Mean5 | 27.21 | 2.38 | 0.76 | |
| NS | 25 | 27.39 | 3.02 | |||
| 6. Fifth metatarsus. | S | 94 | Max6 | 27.58 | 2.28 | 0.89 |
| NS | 22 | 27.68 | 3.27 | |||
| S | 94 | Min6 | 26.24 | 2.27 | 0.98 | |
| NS | 22 | 26.26 | 3.04 | |||
| S | 94 | Mean6 | 26.95 | 2.25 | 0.95 | |
| NS | 22 | 27.00 | 3.12 | |||
| 7. The internal part of the arch. | S | 104 | Max7 | 28.87 | 1.96 | 1.00 |
| NS | 12 | 28.87 | 3.45 | |||
| S | 104 | Min7 | 27.48 | 2.01 | 0.76 | |
| NS | 12 | 27.15 | 3.51 | |||
| S | 104 | Mean7 | 28.41 | 1.97 | 0.95 | |
| NS | 12 | 28.38 | 3.50 | |||
| 8. The external part of the arch. | S | 99 | Max8 | 27.87 | 2.10 | 0.69 |
| NS | 17 | 27.64 | 2.61 | |||
| S | 99 | Min8 | 26.51 | 2.08 | 0.93 | |
| NS | 17 | 26.46 | 2.62 | |||
| S | 99 | Mean8 | 27.17 | 2.07 | 0.82 | |
| NS | 17 | 27.05 | 2.58 | |||
| 9. Heel. | S | 96 | Max9 | 26.92 | 2.24 | 0.99 |
| NS | 20 | 26.91 | 2.83 | |||
| S | 96 | Min9 | 25.62 | 2.01 | 0.98 | |
| NS | 20 | 25.61 | 2.40 | |||
| S | 96 | Mean9 | 26.33 | 2.18 | 0.96 | |
| NS | 20 | 26.30 | 2.66 | |||
| S: Sensitive site, NS: No sensitive site.Max: Maximum, Min: Minimum. | ||||||
Table 4.
Logistic regression model of sensitivity alterations using SWM and creatinine.
| B | Error estándar | Wald | gl | Sig. | Odds Ratio | |
| Creatinine mg/dl | 2.964 | .821 | 13.031 | 1 | .000 | 19.371 |
| Constante | -3.006 | .830 | 13.120 | 1 | .000 | .049 |
Disclaimer/Publisher’s Note: The statements, opinions and data contained in all publications are solely those of the individual author(s) and contributor(s) and not of MDPI and/or the editor(s). MDPI and/or the editor(s) disclaim responsibility for any injury to people or property resulting from any ideas, methods, instructions or products referred to in the content. |
© 2025 by the authors. Licensee MDPI, Basel, Switzerland. This article is an open access article distributed under the terms and conditions of the Creative Commons Attribution (CC BY) license (http://creativecommons.org/licenses/by/4.0/).
Copyright: This open access article is published under a Creative Commons CC BY 4.0 license, which permit the free download, distribution, and reuse, provided that the author and preprint are cited in any reuse.


