Submitted:
05 June 2025
Posted:
11 June 2025
You are already at the latest version
Abstract
Brief treatment of a bottled dry red wine with low intensity natural emissions in the mid -infrared and far-infrared/near-microwave regions of the electromagnetic spectrum resulted in moderate changes in the concentrations of certain odorants in the wine headspace (vapor), as shown by headspace-solid phase microextraction-gas chromatography/mass spectrometry (HS-SPME-GC/MS). The headspace levels of certain long chain ethyl carboxylate esters and methyl salicylate were somewhat enhanced, whereas those of certain aromatic monohydric alcohols, a succinate ester, and oak lactone were somewhat depleted. These results were supported by formal sensory analysis (difference test, triangular version), where 90% of panelists were able to differentiate between untreated (control) and treated wine and descriptions of this difference were in broad agreement with the HS-SPME-GC/MS results. Although a good quality wine brand was chosen for analysis, 90% of panelists preferred the wave-treated wine. A tentative explanation of these results is offered whereby waveform treatment results in general re-organization of non-covalent associations of both odorant (volatile) and non-volatile components in wine, leading to the preferential extra release of certain odorants into the headspace (vapor phase) and preferential increased trapping of certain other odorants in wine (liquid phase).
Keywords:
red wine aroma
; pinotage
; HS-SPME-GC/MS
; infrared waves
1. Introduction
Over the past few decades, emphasis in global wine production has shifted from ‘vin ordinaire’ to ‘quality wines’, the general increase in quality arising largely from increased application of science and technology at all stages of the grape growing and winemaking processes. More recently, there is growing interest in wave treatment of grapes, must, fermenting wine or maturing wine to achieve specific outcomes, such as microbe inactivation/sanitation, improvement of color extraction in red wine production, acceleration of aging, and sensory value improvement, as reviewed by [1,2,3,4]. The wave forms used so far are of four basic kinds. Firstly, longitudinal mechanical waves; ultrasound (US) [5,6,7,8,9,10,11,12,13,14]. Secondly, pulsed electric fields (PEF) [1,3,5,15,16,17,18,19,20,21,22,23]. Thirdly, microwaves (MW) [6,7,10,14,24,25,26]. Fourthly, light or pulsed light (UV/C, visible, or mid IR light) [27,28,29,30,31,32]. Generally, these methods are applied to industrial bulk or pilot scale samples using specialist equipment and often involve relatively high transfer of energy.
We now describe a first investigation into the influence of a mid-infrared and far-infrared/near-microwave wave combination on the aroma/flavor profile of individual bottles of a good quality commercial dry red wine. This work was prompted by the observations of one of the authors (S.L.) at various wine exhibitions held in Korea. He found that 93% of over one hundred informal (casual) tasters were not only able to differentiate between untreated and wave-treated red wines, but preferred the treated version. Also, the effects of wave treatment were found (informally) to persist for up to 1 year, implying at least semi-permanency. In terms of transfer of energy from waveform to wine, this is an extremely ‘soft’ treatment compared with the wave treatments mentioned above, which generally lead to several rather drastic changes, such as inactivation of certain fungi or bacteria, and/or substantial changes in wine composition (favorable or unfavorable). Moreover, our waves are of relatively low intensity, so that no discernable increase in temperature of the treated wine was observed during the brief exposure required and hence cooling was unnecessary. Since there are appears to be no reports of finished wine (in bottle) treatments using mid-/far-IR/near-microwave emissions (but see [32] for mid-IR treatment of grapes), the aim of our first experiments was to determine the extent and nature of aroma/flavor modification in fine dry red wine upon exposure to these relatively low energy waves. The wine chosen was a well-known Western Cape (South Africa) branded Pinotage of the 2021 season. For analysis we used headspace-solid phase microextraction-gas chromatography/mass spectrometry (HS-SPME-GC/MS), supported by formal sensory analysis (difference test; one-way triangle version).
2. Materials and Methods
2.1. Reagents, Samples and Materials
All reagents were of analytical grade and of the purest quality available. The dry red wine samples, four 750 mL bottles of a high quality Western Cape (South Africa) Pinotage of the 2021 vintage, were purchased from a local store. The SPME devices were purchased from Supelco (Aldrich, Bornem, Belgium). Three different fibers were used: red code (100 μm poly(dimethylsiloxane) sorbent – PDMS, 2 cm fiber) for optimum extraction of low polarity components; gray code (50/30 μm divinylbenzene/carboxen/poly(dimethylsiloxane) sorbent – DVB/CAR/PDMS, 2 cm fiber), for low-moderate polarity components; and white code (85 μm poly(acrylate) sorbent – PA, 2 cm fiber), for higher polarity components. Each fiber was conditioned according the manufacturer’s recommendations, at a few degrees below their maximum temperature, before they were used for the first time. Additionally, each fiber was conditioned at 250 oC in the GC injector for 5 minutes before being used for headspace extraction.
2.2. Generation and Characterization of Waveforms
Complex waveforms originating from a natural ceramic source were used in these experiments. Investigation of the source with Fourier transform infrared (FTIR) spectroscopy in reflectance mode indicated that a major part of the emission was within the mid-infrared region; in fact between 1200 and 600 cm-1 (from 8.33 μm wavelength or ~3.6 x 10¹³ Hz frequency to 16.7 μm wavelength or ~1.8 x 10¹³ Hz frequency), with prominent peaks at approximate reciprocal wavelengths 1200, 1130, 1000, and 720 cm-1. Additionally, investigation with Terahertz (THz) spectroscopy, using a Femtosecond laser as light source, again in reflectance mode, indicated that significant emissions occurred at lower energies than mid-IR – within the neighboring far-IR and near-microwave regions (sometimes called the ‘Terahertz region’); in fact between 0.5 x 10¹¹ Hz (3 mm wavelength) and 4.0 x 10¹² Hz (75 μm wavelength), with prominent peaks of approximately 0.05, 0.4, 0.8, 1.1, and 1.3 x 10¹² Hz frequencies.
In the literature, there are several ways in which the infrared region is subdivided according to wavelength or frequency (and, ultimately energy) ranges. To avoid confusion, we have adopted the International Organization for Standardization subdivision for mid-IR and far-IR sub-regions (ISO 20473.2007). Here, the mid-IR region is defined as that between 3,333 cm-1 reciprocal wavelength (3.0 μm wavelength; 1014 Hz frequency) and 200 cm-1 (50 μm; 6 x 10¹² Hz). The far-IR band is defined as that between 200 cm-1 (50 μm; 6 x 10¹² Hz) and 10 cm-1 (1000 μm; 3 x 10¹¹ Hz). Thus, the emission used in these experiments is a complex set of electromagnetic waves, but with prominent components in the lower energy (far) section of the mid-IR region and also in the neighboring far-IR region, with only one (of lower intensity) in the near microwave region (0.05 x 10¹² Hz).
For convenience, dry red wine in our experiments was subjected to these waveforms via a mobile ‘phone application (‘app’). The waveforms emanating from the original ceramic source were transferred by direct contact onto either the drive of a USB device (10 weeks contact time) or, much more conveniently, onto the magnetic tape of an audio cassette (2 hours contact time). They were then transferred to a PC by the usual methods and saved as an MP4 file, with the name ‘flavor alchemist’, which was subsequently saved as mobile ‘phone app using the same name. Anyone wishing to use the wave generation video can do so at vimeo (http://vimeo.com/926101212; password 4183).
It is well known that coincidental (or residual) radiation from mobile ‘phones (independent of our app) is in the radiofrequency (UHF) and far-microwave regions of the electromagnetic spectrum (typically 6 x 10⁸ – 3.5 x 10⁹ Hz) and so its influence on the headspace composition of dry red wine reasonably can be neglected, especially considering the short exposure (10 min) given to the wine sample.
2.3. HS-SPME-GC/MS Procedure
2.3.1. Sample Preparation and Wave Treatment of Wine
Wave-treated wine was obtained by exposing a sample of the control wine (19.00 mL, plus 1.00 mL of internal standard – see 2.3.2) to the wave source for 10 minutes at room temperature. The wave source was the mobile phone app ‘flavor alchemist’ and the phone was fixed in the longitudinal vertical position some 2 cm from the wine (Figure 1).
2.3.2. Triple SPME Procedure
The entire analytical procedure (triple HS-SPME-GC/MS) is based on a previously reported method [33]; three different fibers were used in order to enhance experimental sensitivity. Untreated (‘original’ or ‘control’) wine (19.00 mL) was introduced into a triple neck round bottom flask (100 mL), along with internal standard (ISTD; 1.00 mL of a 5.00 mg/L solution of 1-decanol in ethanol). The flask was closed with silicone stoppers and placed in a thermostatted water bath maintained at 60 oC for 10 minutes for incubation (equilibration). After this, the stoppers were rapidly removed and replaced with SPME devices (one each of codes gray, red and white – see 2.1) fitted with silicone bungs so as to sample the headspace above the wine. The fibers were exposed and headspace sampling was conducted for 30 minutes, after which, the fibers were retracted and the devices removed from the flask, ready for injection into the GC inlet (see 2.3.3). Regarding the wave-treated wine; original wine (19.00 mL) and ISTD (1.00 mL) were introduced into a triple neck round-bottom flask, which was stoppered and exposed to the wave source at room temperature, as described in 2.3.1. The procedure following this was the same as that described for the original (control) wine.
2.3.3. GC/MS Instrumentation
An Agilent 6890 GC (Palo Alto, CA) with an Agilent 5973 mass selective detector were used for GC/MS analysis. The column was HP-INNOWax (Agilent 19091N-136IE) of dimensions 60 m length, 0.25 mm i.d. and 0.25 μm poly(ethyleneglycol) (PEG) stationary phase thickness. The MS detector was tuned before analysis, using perfluorotributylamine (PFTBA).
2.3.4. GC/MS Analysis Procedure
The entire analytical procedure (headspace extraction, followed by GC analysis) was performed in triplicate for both original and wave-treated wine samples.
Immediately after the headspace extraction procedure (see 2.3.2), the SPME devices were sequentially applied to the GC inlet port, where the fibers were exposed and desorbed for 2 minutes each at 240 oC, while the column temperature was maintained at 30 oC throughout. The fiber of each SPME device was retracted after 2 minutes and the device removed. Chromatographic separation was conducted in splitless mode using an oven temperature of 30 oC for 6 minutes, followed by ramping at 3 oC /min to 180 oC, where it was held for 20 minutes, before ramping at 5 oC /min to 200 oC and holding for 20 minutes, followed by ramping at 10 oC /min to 240 oC and finally holding at this temperature for 20 minutes. Helium gas flow was 1 mL/min and MS detector was operated at scan mode 35–350 amu. The MS source and analyzer temperature was 230 oC and 150 oC, respectively. The ionization mode was electron impact, at 70 eV energy. Following an experiment, each SPME fiber was conditioned before the next experiment, as described in 2.1.
Mass spectral identification of headspace components was achieved by comparison with mass spectra of known pure compounds, held in NIST and Wiley MS libraries.
2.3.5. Statistical Treatment of HS-SPME-GC/MS Results
Owing to rather large standard deviations for some of the components observed in the HS-SPME-GC/MS results (see Table 1), we did not apply standard statistical treatments, such as Tukey’s test. Instead, we designated the pairs of results (control versus treated) as statistically significantly different if the standard deviations about the means did not overlap (symbol * in Table 1). If there was a very slight overlap, we designated the result as statistically probably different (symbol # in Table 1), and in all other cases as statistically indeterminate.
2.4. Sensory (Difference Test, Triangle Version One-Sided, P=1/3) Analysis
Shortly before the sensory analysis session, three 750 mL bottles of the same brand of 2021 Western Cape Pinotage wine were opened. One was subjected to the same wave form, as described in 2.3.1 for the HS-SPME-GC/MS experiments (10 minutes exposure time). The two wines were distributed between 3 glasses for each of 10 panelists, so that 2 contained the control wine and one the treated wine; the identities known only to the organizers. The treated wine identity was A in 3 cases, B in 3 cases and C in 4 cases. Ten panelists (8 males and 2 females) were each presented with three glasses of wine (50 mL in each), labeled A, B or C. Eight of the panelists were widely experienced in wine tasting (and indeed are regular, discerning wine drinkers), the remaining two having more limited experience. They were told only that two wines were identical (these were the control wine) and one was different (the treated wine). They were instructed to determine which sample was different from the other two (compulsory answer 1 on the score sheet; Figure 2). The number of correct replies for answer 1 (right or wrong for each taster) was tested for statistical significance (at the level α ≤ 0.05) using standard tables; see https://adam-carpenter-2hfe.squarespace.com>Triangular+Test+Statistics+Table.pdf. Additionally, two questions were included on the score sheet; one (compulsory) asking for broad descriptions of the difference, the other (non-compulsory) asking for any preference (Figure 2). The tasting was carried out at 11 am in conditions based upon ISO-4120-2021 protocol for triangle difference tests. No communication between panelists was allowed during tasting and completion of the score sheet.
3. Results
3.1. HS-SPME-GC/MS Analysis
The results in Table 1 demonstrate that, according to our HS-SPME-GC/MS analyses, there is a modest, but statistically significant difference between the aroma profile of the original untreated wine and that of its wave-treated equivalent. In particular, the treated wine is rather richer in the fruity esters ethyl hexanoate, ethyl octanoate, ethyl decanoate and methyl salicylate, whereas it is slightly poorer in some components that are noted for spicy, floral or woody/nutty aromas, notably benzyl alcohol, ethyl isopentyl succinate, 2-phenylethanol, and oak lactone (Table 2). Additionally, the wave-treated wine is probably somewhat depleted of long chain carboxylic acids heptanoic acid and octanoic acid (Table 1), which are all known to give rise to cheesy-rancid notes. The first 15 minutes of chromatographic time were taken up entirely by elution of the ‘solvent front’ (water and ethanol), the first peak of interest being at t = 19.738 min (Table 1).
3.2. Sensory Analysis
Nine out of ten panelists were able to distinguish the treated wine from the control (Figure 2; question 1), which means that the significance was at the 99.9% confidence level. The minimum score required at the 95% confidence level is 7/10. Of the options to describe the overall difference between control and treated wine (Figure 2; question 2), the most common choice was (c) – the treated wine is softer – with 7/10 choices, followed by (a) – the treated wine is fruitier – with 5/10 choices and (e) – the treated wine has more body/flavor – with 2/10 choices. Options (b), (d), and (f) were not chosen. Nine out 10 panelists preferred the treated wine, with only one professing no preference (Figure 2; question 3).
Before discussing these results, we now explain why it was decided to perform a triangle difference test, rather than a more detailed test such as flavor profiling. These are our first experiments in this field and so our main concern was sensory test support for the HS-SPME-GC/MS results. We wanted to know whether a team of sensory panelists was able to recognize any difference between control and treated samples, in a broad, general sense. A triangle difference test best fits this requirement.
4. Discussion
4.1. HS-SPME-GC-MS Results
Our HS-SPME-GC/MS results show clearly that exposure of a good quality dry red wine to natural mid and far IR/near microwave waveforms leads to subtle changes in its aroma (headspace) profile. Dry red wine is a complex mixture of hundreds of components, belonging to a very wide range of chemical families. Many are volatile (i.e., they have significant vapor pressures at atmospheric pressure and room temperature) and so their molecules can be found in both wine and its vapor (or headspace). Many others are non-volatile and hence, under normal conditions, will be found only in wine. Apart from water, ethanol is the most abundant component (typically ~13% v:v), and like water, is volatile. Next are the acids (~6 g/L total), mostly non-volatile and including tartaric, malic, succinic, fumaric, and sugar acids, followed by phenolic compounds (~4 g/L total), again mostly non-volatile and including various anthocyanin-based pigments and polyphenols. Then come minerals (~3 g/L total), sugars (~3 g/L total for dry red wine; mainly fructose and glucose), glycerol; (~1 g/L), and aminoacids, peptides and proteins (~1 g/L total); all non-volatile. After these, there is a host of volatile components, known as odorants, aroma or flavor compounds, which includes alcohols, carbonyl compounds, volatile carboxylic acids, carboxylate esters (and lactones), acetals, organosulfur compounds, terpenoids and norisoprenoids, volatile heterocyclics and volatile phenols. They are usually of very low to low concentrations, typically between 0.02 mg/L and 105 mg/L. It is the presence of these compounds in the headspace that gives the wine its aroma (scent or bouquet); they are detected by the drinker on sniffing the wine and also by drinking, whence they contribute to the overall wine flavor, along with taste (sourness, sweetness, bitterness, saltiness) and touch or mouthfeel (for still dry red wine, this includes astringency).
The aroma of a particular wine, as perceived by tasters depends on the identity of volatile compounds in the headspace (or vapor phase) and their relative concentrations; the greater the concentration of a specific aroma compound, the greater its contribution to overall aroma and the more intense will be its organoleptic perception, although the linguistic description of this will change according to both its concentration (see Table 2) and the presence or absence of other components, both volatile and non-volatile – see the work of [38] and [39] for good examples of this.
Since the treatment waveforms belong essentially to the low energy end of the mid-IR region and also the far-IR and near-microwave regions, they are too low in energy for promotion of typical chemical reactions, such as esterification (e.g., octanoic acid + ethanol → ethyl octanoate + water), ester hydrolysis (the reverse process), oxidations/reductions, or hydrolysis of odorant glycosides, many of which have activation energies above 20 kJ/mol, and frequently over 50 kJ/mol. The waveform of highest energy (1200 cm-1 or 8.33 mm) corresponds to only ~7.2 kJ/mol, which is generally too low for the making and breaking of covalent chemical bonds. However, this is sufficient to rupture and recreate weak-to-medium strength hydrogen bonds, other dipole-dipole attractions, ion-dipole attractions (‘Keesom forces’), π-π attractions, and induced dipole-induced dipole attractions (‘London forces’). Thus, we propose that treatment of dry red wine with our waveforms results in the re-organization of volatile molecule-nonvolatile molecule non-covalent clusters in wine, thereby releasing more of certain volatile compounds into the vapor phase (headspace), whilst trapping more of other volatile components into the liquid phase, and hence decreasing their concentration in the headspace (or vapor phase). In a broad schematic way, Figure 3 illustrates possible aroma molecule interactions (associations) for both ‘free’ (headspace or vapor) and ‘bound’ (liquid phase) situations involving ethyl decanoate, one of the wine odorants shown to exist in higher headspace concentrations in the wave-treated wine. Associations such as those suggested in Figure 3 are certain to exist in both liquid and vapor phase, and indeed, Tsachaki et al. [40,41] have demonstrated that ethanol in water-ethanol solutions tends to accumulate at the liquid-vapor interface, and in model wine solutions, the presence of ethanol maintains the dynamic headspace concentrations of various odorants close to equilibrium values during vapor phase dilution for several minutes. Furthermore, this team also showed that the presence of low levels of proteins in model wine solutions reduced the headspace equilibrium values of these odorants. Low levels of proteins are found in all wines and it is possible that phenolic compounds, present at much higher concentrations in red wines, may have a similar effect on headspace levels of odorants.
- (a)
- Volatile hydrogen bonded associations in wine vapor (headspace).
- (b)
- Non-volatile hydrogen bonded associations in wine, involving sugars and phenolics.
- (c)
- Non-volatile hydrogen bonding and ion-dipole associations in wine, involving aminoacids and proteins.
- (d)
- Non-volatile ion-dipole associations in wine, involving metal ions (minerals).
However, our present data is insufficient to explain the observed selectivity (i.e., why particular volatile components are more abundant in the headspace after wave treatment, whilst the opposite is true for certain other odorants, and indeed, yet others are unaffected). Likewise, we have no data on the re-organization of intermolecular non-covalently bonded associations of non-volatile components in wine, such as between phenolic compounds (anthocyanins and derivatives, flavan-3-ols, and other polyphenols, in particular), carboxylic acids, proteins and other nitrogenous compounds, glycerol, sugars and ionic species; considering both intra- and inter-chemical family types of associations. Note that many non-volatile component molecules (polyphenols, proteins, and sugars in particular) have multiple sites for non-covalent attractive interactions, principal amongst which are hydrogen bonding donor and acceptor sites. We can further postulate that treatment with our waveforms increases the interactions between some of these non-volatile components, which in total are much more abundant than odorants. See also 4.2.
From Table 1 and Table 2, and Figure 4, it appears that 3/4 of the odorants that are definitely enhanced in the vapor phase after wave treatment of wine are two-sited hydrogen bonding acceptors (ethyl hexanoate, octanoate and decanoate), whereas those that are definitely diminished in the vapor phase have either a single hydrogen bonding donor/acceptor site; notably an OH group (benzyl alcohol, 2-phenylethanol), or multiple acceptor sites (ethyl isopentyl succinate). It is conceivable that diesters like succinates could act in non-covalently bonded clusters as bridging units between non-odorant molecules, like proteins and/or polyphenols, via interaction with hydrogen bonding donor sites in these molecules. The two exceptions are methyl salicylate with one acceptor/donor site (phenolic OH) and two acceptor sites (the methyl ester group) and oak lactone (a cyclic ester) with two acceptor sites. The former anomaly can be explained by the existence of competing intramolecular hydrogen bonding between the phenolic OH group (donor) and the carbonyl oxygen of the ester group (acceptor), thus diminishing that molecule’s ability to be an intermolecular hydrogen bonding donor. The latter exception cannot be readily explained, but it should be noted that this molecule is a much more conformationally rigid than typical long chain esters, such as ethyl decanoate.
We are presently reviewing methodologies for the investigation of non-covalent associations of non-volatile components of wine.
4.2. Sensory Analysis
Although a perceived increased fruity aroma/flavor of the treated wine is in broad agreement with the HS-SPME-GC/MS results, a perceived increase in softness is more difficult to explain if one considers changes in odorants alone, hence it is likely that subtle changes involving certain non-volatile components are also the result of our wave treatment of wine. The term ‘softness’ (or ‘smoothness’), when applied to dry red wine usually implies a low level of bitterness (which is a taste sensation) and/or astringency (which is a tactile sensation). Both these sensations are due to the presence of a wide variety of (usually non-volatile) polyphenols (often loosely called ‘tannins’), especially monomeric flavan-3-ols (like (+)-catechin and (-)-epicatechin), and oligomeric procyanidins. Bitterness is a salient characteristic of the presence of monomeric polyphenols such as (-)-epicatechin, whereas astringency is more closely associated with the presence of oligomeric polyphenols, such as procyanidins; it manifests itself as a dry, rough sensation in the mouth cavity, which is known to be caused by co-precipitation with proteins (such as a-amylase) in the saliva (i.e., by the formation of insoluble saliva protein/polyphenol complexes) upon tasting [42].
We have already postulated that treatment of dry red wine with our waveforms increases attractive non-covalent bonding interactions (via the making and breaking of hydrogen bonds and other weak attractions – see 4.1) between non-volatile components, such as proteins, and other nitrogenous species, polyphenols, and sugars. If this is so, it is reasonable to suppose that, upon tasting, there is lesser interaction between polyphenols and taste bud receptors and/or proteins like a-amylase in saliva. Hence, the treated wine appears rather less bitter and/or less astringent (i.e., it appears to be somewhat ‘softer’). In support of this idea, it has been previously demonstrated that addition of monosaccharides to dry red wine reduces its astringency [43], and more generally, the presence of polysaccharides in tannic foods reduces their astringent character by competing with saliva proteins during tasting for complexation and/or by a ‘masking’ effect such as polysaccharide-tannin interaction within the foodstuff itself [44].
5. Conclusions
According to the results of HS-SPME-GC/MS experiments, brief treatment of a finished (bottled) good quality dry red wine with natural waveforms, belonging to the mid-IR, far -IR and near-microwave regions of the electromagnetic spectrum, leads to modification of the composition of odorants in the headspace (vapor phase). This subtle change of aroma and flavor was perceived by a formal tasting panel largely as increased fruitiness or fullness of flavor, although the treated wine was also perceived as having enhanced softness of flavor. Wave-induced aroma modification is tentatively linked to reorganization of non-covalent attractive interactions involving both wine odorants and non-volatile components (non-odorants), such as polyphenols, proteins and carbohydrates.
6. Patents
There are no existing patents resulting from the work reported in this manuscript, but it is possible that application for a patent may be made in the future.
Author Contributions
conceptualization, S.L.; methodology, C.L., H.J., A.J.B.; investigation, C.L., H.J., S.L.; writing – original draft manuscript, A.J.B.; writing – review and editing, A.J.B., E.K.L., S.K.; formal analysis, E.K.L., S.K.; visualization, A.J.B., E.K.L., S.K. All authors have read and agreed to the published version of the manuscript.
Funding
This research received no external funding.
Data Availability Statement
Data are contained within the article.
Acknowledgments
Thanks are due to the voluntary sensory panelists.
Conflicts of Interest
The authors declare no conflicts of interest.
References
- Feng, Y.; T. Yang; Y. Zhang; A. Zhang; L. Gai and D. Niu. Potential applications of pulsed electric field in the fermented wine industry. Front. Nutr. 2022, 9, 1048632. [Google Scholar]
- Kumar, Y.; M. Marangon and C. Mayr Marangon. The Application of Non-Thermal Technologies for Wine Processing, Preservation, and Quality Enhancement. Beverages 2023, 9, 30. [Google Scholar] [CrossRef]
- Ozturk, B. and E. Anli. Pulsed electric fields (PEF) applications on wine production: A review. BIO Web Conf. 2017, 9, 02008. [Google Scholar] [CrossRef]
- Yıldırım, H.K. and E. Dündar. New techniques for wine aging. BIO Web Conf. 2017, 9, 02012. [Google Scholar]
- García Martín, J.F. and D.-W. Sun. Ultrasound and electric fields as novel techniques for assisting the wine ageing process: The state-of-the-art research. Trends Food Sci Technol. 2013, 33, 40–53. [Google Scholar] [CrossRef]
- Liu, L.; I. Loira; A. Morata; J.A. Suárez-Lepe; M.C. González and D. Rauhut. Shortening the ageing on lees process in wines by using ultrasound and microwave treatments both combined with stirring and abrasion techniques. Eur. Food Res. Technol. 2016, 242, 559–569. [Google Scholar] [CrossRef]
- Muñoz-García, R.; M. C. Díaz-Maroto; M. Arévalo Villena; M.S. Pérez-Coello and M.E. Alañón. Ultrasound and microwave techniques as physical methods to accelerate oak wood aged aroma in red wines. LWT 2023, 179, 114597. [Google Scholar] [CrossRef]
- Natolino, A. ; T. Roman; G. Nicolini and E. Celotti. Innovations on red winemaking process by ultrasound technology. Enoform Web Conference, 2021.
- Natrella, G.; M. Noviello; A. Trani; M. Faccia and G. Gambacorta. The Effect of Ultrasound Treatment in Winemaking on the Volatile Compounds of Aglianico, Nero di Troia, and Primitivo Red Wines. Foods 2023, 12, 648. [Google Scholar] [CrossRef]
- Romero-Díez, R.; M. Matos; L. Rodrigues; M.R. Bronze; S. Rodríguez-Rojo; M.J. Cocero and A.A. Matias. Microwave and ultrasound pre-treatments to enhance anthocyanins extraction from different wine lees. Food Chem. 2019, 272, 258–266. [Google Scholar] [CrossRef]
- Sánchez-Córdoba, C.; E. Durán-Guerrero and R. Castro. Olfactometric and sensory evaluation of red wines subjected to ultrasound or microwaves during their maceration or ageing stages. LWT 2021, 144, 111228. [Google Scholar] [CrossRef]
- Tan, J.; Q. Li; H. Xue and J. Tang. Ultrasound-assisted enzymatic extraction of anthocyanins from grape skins: optimization, identification, and antitumor activity. J. Food Sci. 2020, 85, 3731–3744. [Google Scholar] [CrossRef] [PubMed]
- Xie, Q.; Y. Tang; X. Wu; Q. Luo; W. Zhang; H. Liu; Y. Fang; X. Yue and Y. Ju. Combined ultrasound and low temperature pretreatment improve the content of anthocyanins, phenols and volatile substance of Merlot red wine. Ultrason. Sonochem. 2023, 100, 106636. [Google Scholar] [CrossRef] [PubMed]
- Zhang, Y.; Q. Qiu; Y. Xu; J. Zhu; M. Yuan and M. Chen. Fast aging technology of novel kiwifruit wine and dynamic changes of aroma components during storage. FS&T 2023, 43, e98422. [Google Scholar]
- Comuzzo, P.; S. Voce; C. Grazioli; F. Tubaro; M. Marconi; G. Zanella and M. Querzè. Pulsed Electric Field Processing of Red Grapes (cv. Rondinella): Modifications of Phenolic Fraction and Effects on Wine Evolution. Foods 2020, 9, 414. [Google Scholar] [CrossRef]
- Delso, C.; A. Berzosa; J. Sanz; I. Álvarez and J. Raso. Pulsed electric field processing as an alternative to sulfites (SO2) for controlling saccharomyces cerevisiae involved in the fermentation of Chardonnay white wine. Food Res. Int. 2023, 165, 112525. [Google Scholar] [CrossRef]
- Delso, C.; A. Berzosa; J. Sanz and I. Álvarez. Microbial Decontamination of Red Wine by Pulsed Electric Fields (PEF) after Alcoholic and Malolactic Fermentation: Effect on Saccharomyces cerevisiae, Oenococcus oeni, and Oenological Parameters during Storage. Foods 2023, 12, 278. [Google Scholar] [CrossRef]
- El Darra, N.; H. N. Rajha; M.-A. Ducasse; M.F. Turk; N. Grimi; R.G. Maroun; N. Louka and E. Vorobiev. Effect of pulsed electric field treatment during cold maceration and alcoholic fermentation on major red wine qualitative and quantitative parameters. Food Chem. 2016, 213, 352–360. [Google Scholar] [CrossRef]
- Evrendilek, A.G. Pulsed Electric Field Processing of Red Wine: Effect on Wine Quality and Microbial Inactivation. Beverages 2022, 8, 78. [Google Scholar] [CrossRef]
- Galązka-Czarnecka, I.; E. Korzeniewska and A. Czarnecki. Influence of pulsed electric field on the content of polyphenolic compounds in wine. Korzeniewska and A. Czarnecki. Influence of pulsed electric field on the content of polyphenolic compounds in wine. PTZE 2018, 33. [Google Scholar]
- Puértolas, E.; G. Saldaña; S. Condón; I. Álvarez and J. Raso. A Comparison of the Effect of Macerating Enzymes and Pulsed Electric Fields Technology on Phenolic Content and Color of Red Wine. J. Food Sci. 2009, 74, C647–C652. [Google Scholar] [CrossRef]
- Silva, F.V.; R. Borgo; A. Guanziroli; J.M. Ricardo-da-Silva; M. Aguiar-Macedo and L.M. Redondo. Pilot Scale Continuous Pulsed Electric Fields Treatments for Vinification and Stabilization of Arinto and Moscatel Graúdo (Vitis vinifera L.) White Grape Varieties: Effects on Sensory and Physico-Chemical Quality of Wines. Beverages 2024, 10, 6. [Google Scholar]
- van Wyk, S.; F. V.M. Silva and M.M. Farid. Pulsed electric field treatment of red wine: Inactivation of Brettanomyces and potential hazard caused by metal ion dissolution. IFSET 2019, 52, 57–65. [Google Scholar]
- Casassa, L.F.; M. L. Fanzone and S.E. Sari. Comparative phenolic, chromatic, and sensory composition of five monovarietal wines processed with microwave technology. Heliyon 2022, 8, e12332. [Google Scholar] [CrossRef] [PubMed]
- Muñoz-García, R.; M. C. Díaz-Maroto; M.A. Villena; M.S. Pérez-Coello and M.E. Alañón. Effect of Microwave Maceration and SO2 Free Vinification on Volatile Composition of Red Wines. LWT 2023, 179, 114597. [Google Scholar] [CrossRef]
- Yuan, J-F. ; T-T. Wang; Z-Y. Chen; D-H. Wong; M-G. Gong and P-Y. Li. Microwave irradiation: impacts on physicochemical properties of red wine. CYTA J. Food 2020, 18, 281. [Google Scholar] [CrossRef]
- Kim, S.H.; H. J. Jung and J.H. Lee. Changes in the levels of headspace volatiles, including acetaldehyde and formaldehyde, in red and white wine following light irradiation. J. Food Sci. 2021, 86, 834–841. [Google Scholar] [CrossRef]
- Mohammadi, X.; G. Matinfar; R. Mandal; A. Singh; G. Fiutak; D.D. Kitts and A. Pratap Singh. Kinetics of anthocyanin condensation reaction in model wine solution under pulsed light treatment. Food Chem. 2023, 405, 134600. [Google Scholar] [CrossRef]
- Mohammadi, X.; D. D. Kitts; A. Singh; A. Amiri; G. Matinfar and A. Pratap-Singh. Pulsed light treatment helps reduce sulfur dioxide required to preserve Malbec wines. Food Biosci. 2024, 61, 104776. [Google Scholar] [CrossRef]
- Pérez-López, A.J.; M. I. Rodríguez-López; F. Burló; Á.A. Carbonell-Barrachina; J.A. Gabaldón and V.M. Gómez-López. Evaluation of Pulsed Light to Inactivate Brettanomyces bruxellensis in White Wine and Assessment of Its Effects on Color and Aromatic Profile. Foods 2020, 9, 1903. [Google Scholar] [CrossRef]
- Santamera, A.; C. Escott; I. Loira; J.M. del Fresno; C. González and A. Morata. Pulsed Light: Challenges of a Non-Thermal Sanitation Technology in the Winemaking Industry. Beverages 2020, 6, 45. [Google Scholar] [CrossRef]
- Yin, H.; L. Wang; H. Su; Y. Liang; P. Ji; X. Wang and Z. Xi. Effects of ultraviolet and infrared radiation absence or presence on the aroma volatile compounds in winegrape during veraison. Food Res. Int. 2023, 167, 112662. [Google Scholar] [CrossRef] [PubMed]
- Lee, C.; Y. Lee; J.-G. Lee and A.J. Buglass. Development of a simultaneous multiple solid-phase microextraction-single shot-gas chromatography/mass spectrometry method and application to aroma profile analysis of commercial coffee. J. Chromatogr. A 2013, 1295, 24–41. [Google Scholar] [CrossRef] [PubMed]
- Leffingwell. Odor detection thresholds. Available from: Leffingwell.com.
- García, M.; B. Esteve-Zarzoso; J. Crespo; J.M. Cabellos and T. Arroyo. Influence of Native Saccharomyces cerevisiae Strains from D.O. “Vinos de Madrid” in the Volatile Profile of White Wines. Ferment. 2019, 5, 94. [Google Scholar] [CrossRef]
- Ma, T.-Z.; P. -F. Gong; R.-R. Lu; B. Zhang; A. Morata and S.-Y. Han. Effect of Different Clarification Treatments on the Volatile Composition and Aromatic Attributes of ‘Italian Riesling’ Icewine. Mol. 2020, 25, 2657. [Google Scholar] [CrossRef]
- Brown, R.C.; M. A. Sefton; D.K. Taylor and G.M. Elsey. An odour detection threshold determination of all four possible stereoisomers of oak lactone in a white and a red wine. Aust. J. Grape Wine Res. 2006, 12, 115–118. [Google Scholar] [CrossRef]
- Escudero, A.; E. Campo; L. Fariña; J. Cacho and V. Ferreira. Analytical Characterization of the Aroma of Five Premium Red Wines. Insights into the Role of Odor Families and the Concept of Fruitiness of Wines. J. Agric. Food Chem. 2007, 55, 4501–4510. [Google Scholar] [CrossRef]
- Sáenz-Navajas, M.-P.; E. Campo; L. Culleré; P. Fernández-Zurbano; D. Valentin and V. Ferreira. Effects of the Nonvolatile Matrix on the Aroma Perception of Wine. J. Agric. Food Chem. 2010, 58, 5574–5585. [Google Scholar] [CrossRef]
- Tsachaki, M.; A. -L. Gady; M. Kalopesas; R.S.T. Linforth; V. Athès; M. Marin and A.J. Taylor. Effect of Ethanol, Temperature, and Gas Flow Rate on Volatile Release from Aqueous Solutions under Dynamic Headspace Dilution Conditions. J. Agric. Food Chem. 2008, 56, 5308–5315. [Google Scholar] [CrossRef]
- Tsachaki, M.; R. S.T. Linforth and A.J. Taylor. Aroma Release from Wines under Dynamic Conditions. J. Agric. Food Chem. 2009, 57, 6976–6981. [Google Scholar] [CrossRef]
- McManus, J.P.; K.G. Davis; T.H. Lilley and E. Haslam. The association of proteins with polyphenols. J. Chem. Soc., Chem. Commun. 1981, 309b-311.
- Soares, S.I.; R. M. Gonçalves; I. Fernandes; N. Mateus and V. de Freitas. Mechanistic Approach by Which Polysaccharides Inhibit α-Amylase/Procyanidin Aggregation. J. Agric. Food Chem. 2009, 57, 4352–4358. [Google Scholar] [CrossRef]
- Valentová, H.; S. Skrovánková; Z. Panovská and J. Pokorný. Time–intensity studies of astringent taste. Food Chem. 2002, 78, 29. [Google Scholar] [CrossRef]
Figure 1.
Arrangement for exposure of wine to waveforms.
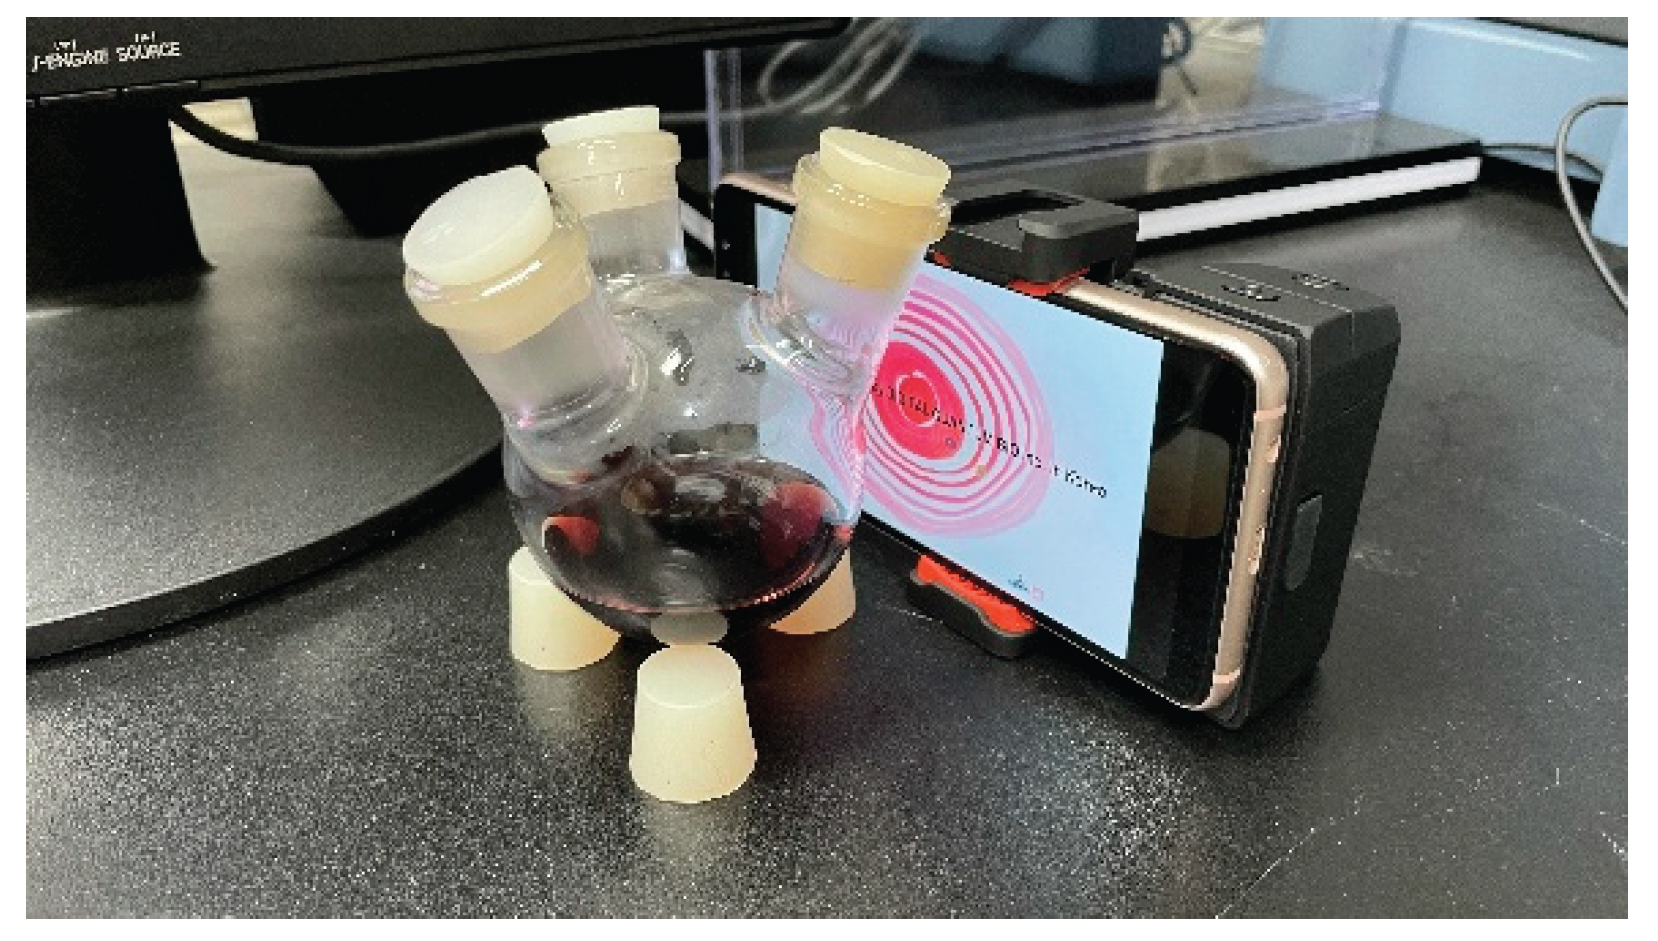
Figure 2.
Score sheet for sensory analysis (difference test, triangular version) of control and treated dry red wine. Note: the actual score sheet used in the sensory analysis session was in Korean; this is a translation.
Figure 2.
Score sheet for sensory analysis (difference test, triangular version) of control and treated dry red wine. Note: the actual score sheet used in the sensory analysis session was in Korean; this is a translation.
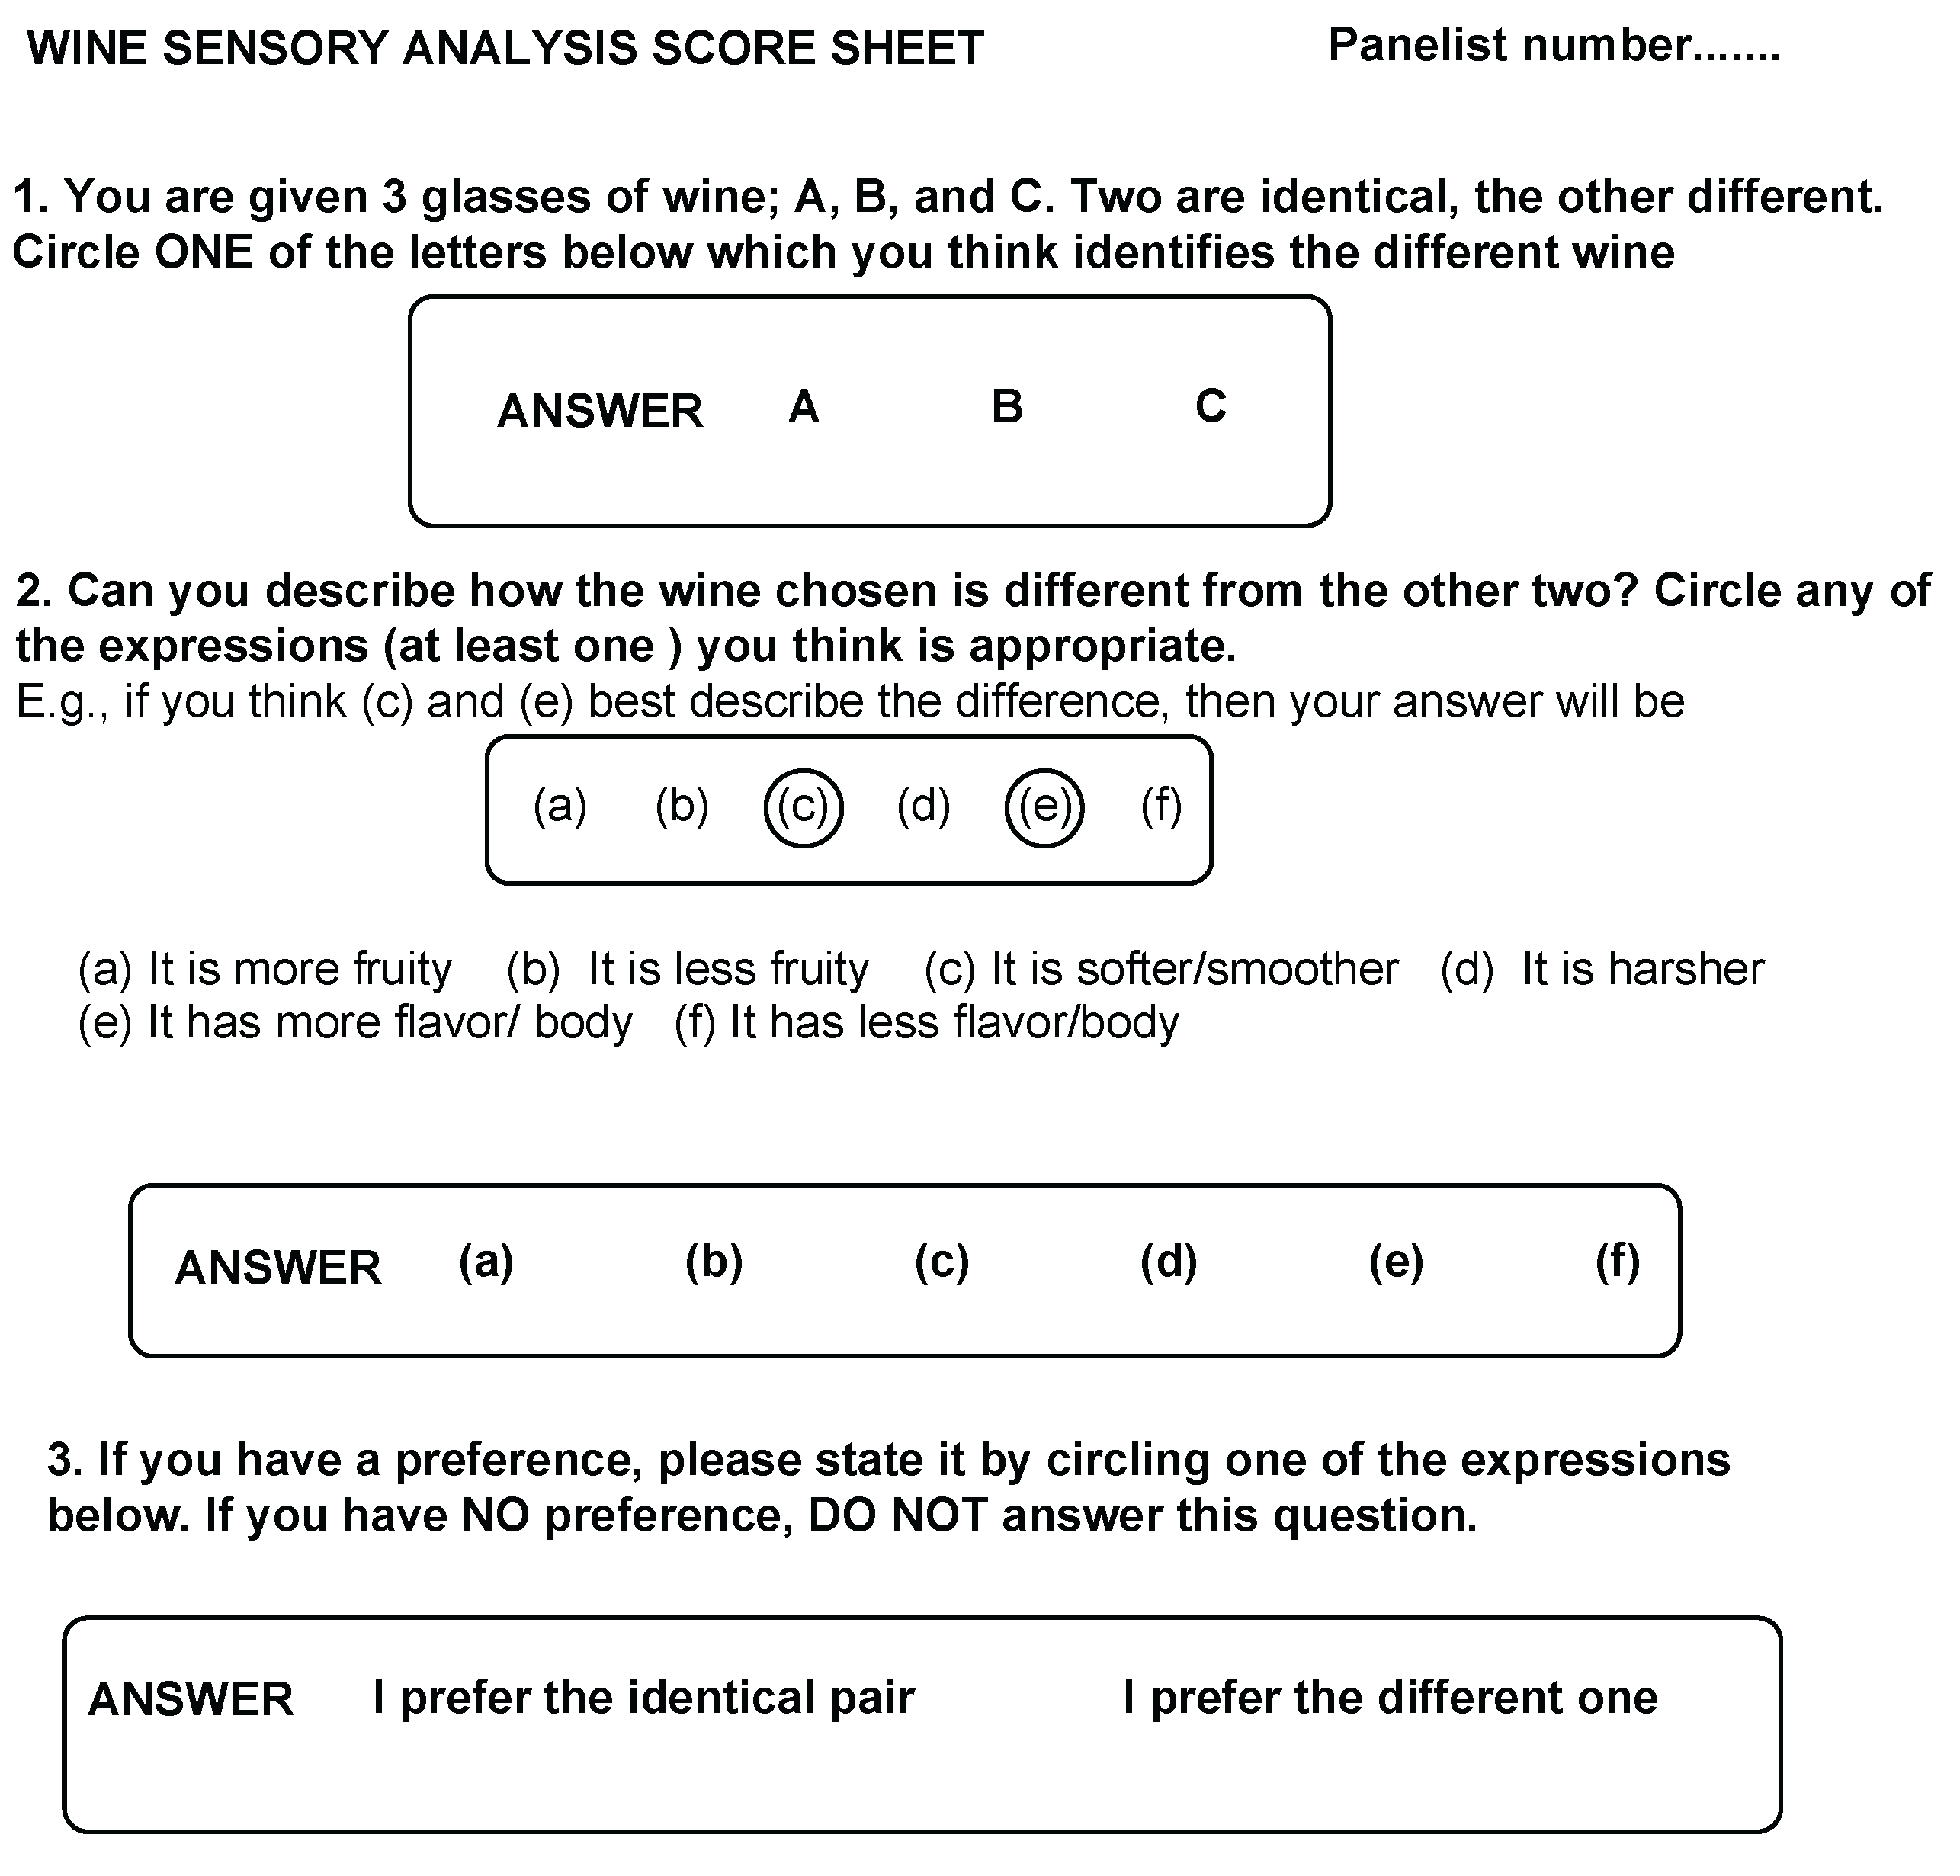
Figure 3.
Possible aroma molecule interactions (schematic representations only; much simplified and illustrated for ethyl decanoate).
Figure 3.
Possible aroma molecule interactions (schematic representations only; much simplified and illustrated for ethyl decanoate).
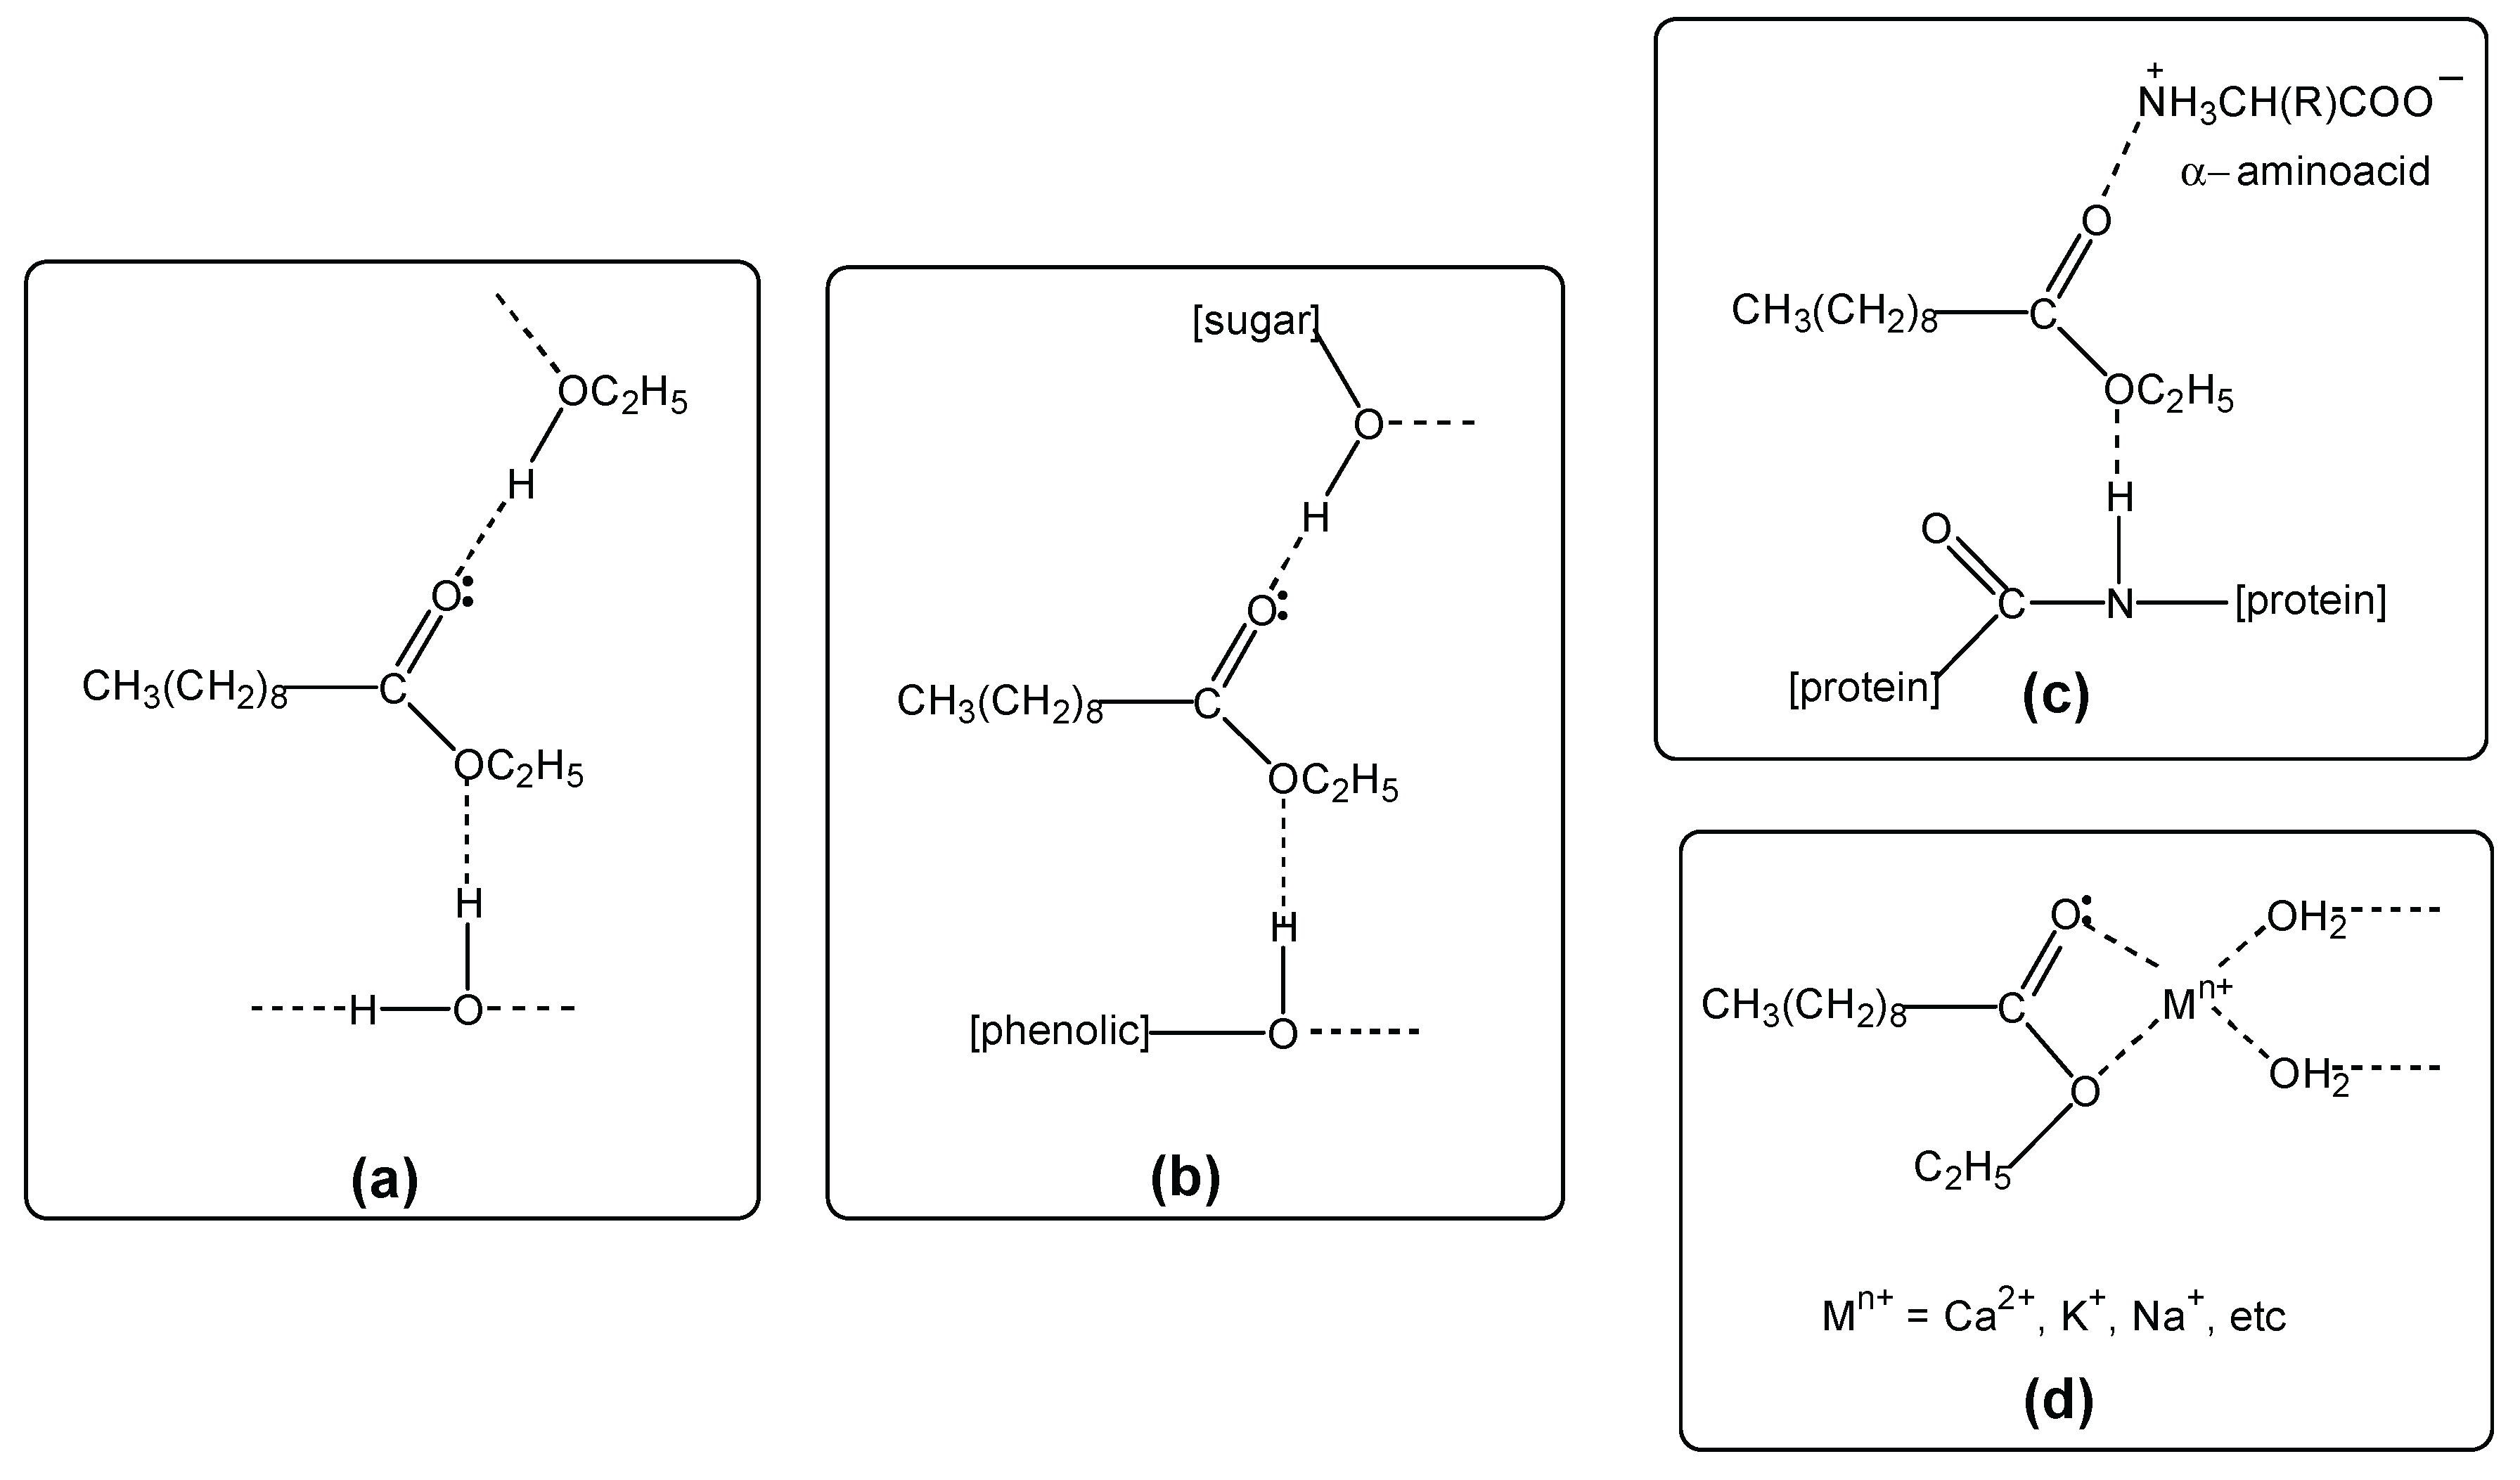
Figure 4.
Bar chart depicting major changes in headspace odorant levels upon treating dry red wine with combined mid IR, far IR/near microwave waveforms. Only statistically definite changes (see 2.3.5) are included. The first digit above or under each bar gives the number of hydrogen bonding donor sites per molecule, the second digit gives the number of hydrogen bonding acceptor sites per molecule.
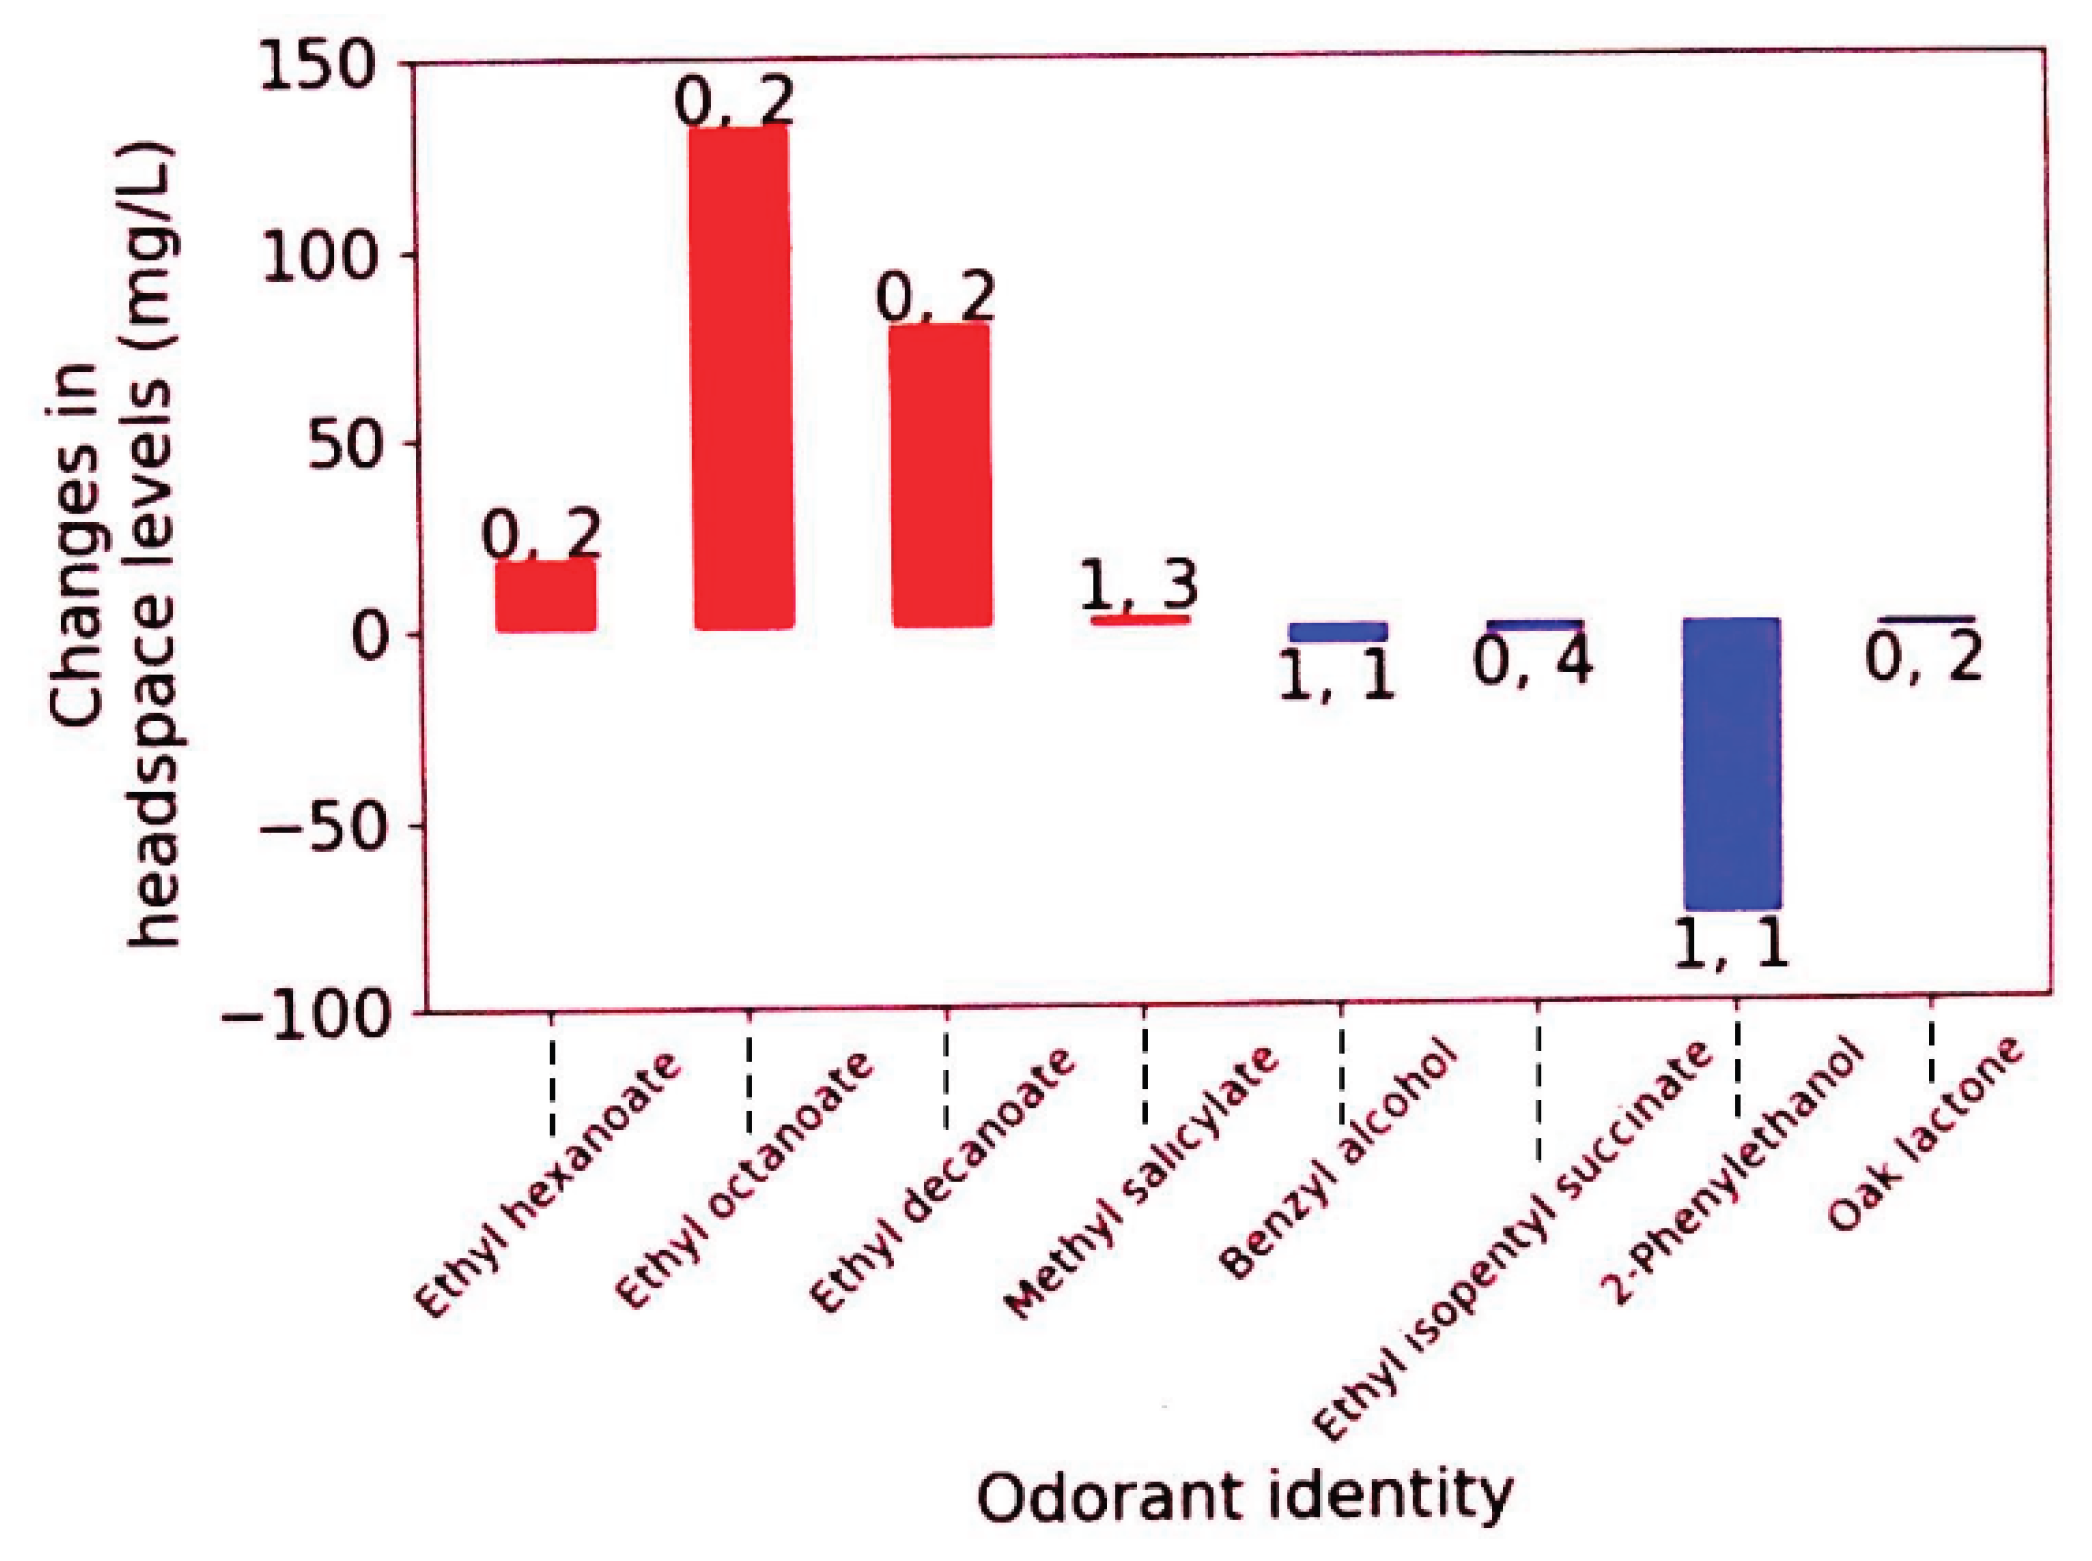

Table 1.
HS-SPME-GC/MS analysis results for control and wave-treated dry red wine.
| Component | Retention time/mina | Semi-quantitative concentration/mg/Lb (SD, %RSD)c |
|
|---|---|---|---|
| Control | Treated | ||
| 2-Methyl-1-propanol (isobutyl alcohol) | 19.738 | 161 (42, 26) | 183 (66, 36) |
| 1-Butanol | 22.360 | 8 (1.8, 22) | 9 (4.3, 47) |
| 1-Pentanol | 24.889 | 24.5 (5.3, 22)# | 29.5 (6, 20)# |
| Ethyl hexanoate | 25.906 | 31.3 (6.5 20.8)* | 49.8 (3.5, 7)* |
| Ethyl octanoate | 35.257 | 173.3 (44, 25.4)* | 304.8 (43, 14)* |
| Acetic acid | 36.354 | 290 (85.8, 29) | 290.3 (119, 41) |
| Furfural | 37.084 | 30 (6.3, 21)# | 36 (5.3, 15)# |
| Vitispirane | 39.297 | 10 (2.5, 25) | 11.3 (1.3, 11) |
| 2,3-Butanediol | 40.079 | 183 (45.5, 25) | 162 (129.5, 80) |
| 1-Octanol | 40.546 | 20.5 (8, 39) | 17.8 (5.5, 31) |
| b-Caryophyllene | 42.059 | 21.8 (11.3, 52) | 12.8 (3, 24) |
| Ethyl decanoate | 43.721 | 175.3 (40.8, 23)* | 255 (21.6, 8.5)* |
| Menthol | 43.946 | 419 (79, 19)# | 287.3 (59.8, 21)# |
| g-Butyrolactone | 44.158 | 8.5 (2.5, 29) | 9 (11, 2.8) |
| Diethyl succinate | 45.462 | 541 (77, 14)# | 436 (54, 12.4)# |
| a-Terpineol | 46.242 | 19.8 (2, 10)# | 21.5 (1, 4.6)# |
| 1-Decanol (ISTD) | 49.482 | - | - |
| Methyl 2-hydroxybenzoate (salicylate) | 49.490 | 17 (0.1, 0.6)* | 20 (0.3, 1.5)* |
| p-anethole (p-propenylanisole) | 51.225 | 10 (2.4, 24) | 7.8 (0.8, 10) |
| Heptanoic acid | 51.628 | 29.3 (5, 17)# | 22 (2.3, 10.5)# |
| Butyl O-butyryllactate | 52.731 | 38 (21, 55) | 39.5 (8.3, 21) |
| Benzyl alcohol | 52.977 | 20.3 (0.7, 3.4)* | 15.3 (3.8, 25)* |
| Ethyl isopentyl succinate (Ethyl 3-methylbutyl succinate) | 53.666 | 14.8 (0.4, 2.7)* | 12.8 (0.9, 7)* |
| 2-Phenylethanol | 54.199 | 320.5 (20.8, 6.4)* | 243.5 (52.8, 21.7)* |
| 1-Dodecanol | 55.682 | 9.3 (0.7, 7.5) | 11.3 (1.9, 16.8) |
| Oak, Quercus or Whiskey lactone ( cis or trans-5-Butyl-4-methyl dihydro-2(3H)-furanone) | 55.964 | 7.3 (0.2, 2.7)* | 5.5 (1, 18)* |
| Octanoic acid | 59.149 | 87 (2.6, 3)# | 74.3 (19.3, 26)# |
| Decanoic acid | 70.564 | 39.3 (6.3, 16) | 41 (8.3, 20) |
aThe first 15 min of elution time were taken up by the solvent front and so are not included here. bThese are strictly approximate values, based on a single internal standard (ISTD) concentration of 0.25 mg/L. Normalized GC peak areas (= peak area of component/peak area of ISTD) can be generated by dividing the values in the table by 0.25 mg/L. cSD = standard deviation (n = 3); %RSD = relative standard deviation (or coefficient of variance) = 100SD/mean value. *Definite statistical significance, as described in 2.3.5 #Probable statistical significance.
Table 2.
Summary of aroma compound concentration changes in dry red wine upon wave treatment according to HS-SPME-GC/MS, along with common aroma descriptors, and odor threshold values (OTVs).
Table 2.
Summary of aroma compound concentration changes in dry red wine upon wave treatment according to HS-SPME-GC/MS, along with common aroma descriptors, and odor threshold values (OTVs).
| Compound (CAS reg, no.) | Increased ▲ or decreased ▼level on wave treatment* | Common aroma descriptors | OTV‡/mg/L (media) |
|---|---|---|---|
| Ethyl hexanoate (123-66-0) |
▲ | Apple, pineapple | 0.001 (in water)a; 0.014b |
| Ethyl octanoate (106-32-1) |
▲ | Orange, pineapple, brandy-like | 0.015 (in water)a; 0.24c |
| Ethyl decanoate (110-38-3) |
▲ | Fruity, oily, brandy-like | 0.001 (in water)a; 0.510 (in wine)a |
| Methyl salicylate (119-36-8) | ▲ | Fruity, root beer, mint | 0.04 (in water)a |
| Benzyl alcohol (100-51-6) |
▼ | Floral-rose, toasted | 10 (in water)a |
| Ethyl isopentyl succinate (28024-16-0) 2-Phenylethanol (60-12-8) |
▼ ▼ |
Fatty, pungent, fruity Rose, woody |
Unknown 0.75-1.1 (in water)a |
| Oak lactone (unknown isomer) 55013-32-6 (cis) or 39638-67-0 (trans) |
▼ | Coconut, woody$ | 0.024 (cis-isomer); 0.054 (trans-isomer) (both in wine)d |
*Only statistically definite changes (see 2.3.5) are included $Depending on isomer. ‡Odor threshold value (OTV) refers to minimum concentration of odorant detectable in a particular medium (e.g., pure water, 12% ethanol-water, model wine, etc., depending on the experimenters) by 50% of panelists in a sensory test. Values differ according to medium (given, where known) and method of determination. Values for OTVs are taken from a[34], b[35] and references therein, c[36] and references therein, or d[37].
Disclaimer/Publisher’s Note: The statements, opinions and data contained in all publications are solely those of the individual author(s) and contributor(s) and not of MDPI and/or the editor(s). MDPI and/or the editor(s) disclaim responsibility for any injury to people or property resulting from any ideas, methods, instructions or products referred to in the content. |
© 2025 by the authors. Licensee MDPI, Basel, Switzerland. This article is an open access article distributed under the terms and conditions of the Creative Commons Attribution (CC BY) license (http://creativecommons.org/licenses/by/4.0/).
Copyright: This open access article is published under a Creative Commons CC BY 4.0 license, which permit the free download, distribution, and reuse, provided that the author and preprint are cited in any reuse.


