
Submitted:
22 July 2025
Posted:
24 July 2025
You are already at the latest version
Abstract
Background/Objectives: Phase III trials are critical for evaluating therapeutic efficacy and safety, but African site inclusion has historically been limited, raising questions about generalizability and efficiency. This retrospective study aimed to analyse success rates and timelines of Phase III trials incorporating at least one African site compared with established global benchmarks. Methods: 461 publicly reported Phase III trials completed between December 2014 and December 2024 with ≥1 African trial site were retrospectively reviewed. Trials were categorized as oncology or non-oncology, and primary endpoint outcomes (positive vs. negative) and durations from initiation to primary endpoint completion were analysed descriptively. Results: Overall, 69.6% (95% CI, 65.5%-73.7%) of the trials samples achieved positive primary endpoints. Non-oncology trials (n=359) had a higher success rate (73.5% [95% CI, 69.0%-78.0%]) than oncology trials (n=102; 55.9% [95% CI, 46.3%-65.5%]). Both rates exceed or align with global benchmarks (historically ~58–67% overall, ~26–40% oncology). Mean trial duration was 1,085 days (95% CI, 1036-1135 days), shorter than typical global durations (~1,200 days). Oncology trials had longer timelines (mean 1,366 days [95% CI, 1268-1465 days]) than non-oncology trials (mean 989 days [95% CI, 936-1042 days]), but remained within global norms. Conclusions: Phase III trials including African sites demonstrated robust primary endpoint success rates and competitive timelines compared to global norms, notably outperforming historical oncology success rates. Stakeholders should cautiously consider broader African inclusion to improve diversity and global relevance of clinical trial data.
Keywords:
Africa
; Clinical Trials
; Phase III
; Oncology
; Globalization
; Research Design
; Patient Selection
; Drug Development
; Time Factors
1. Introduction
Over the past two decades, the globalisation of clinical research has markedly broadened the geographic footprint of Phase III drug development. Historically, these pivotal trials crucial for determining whether a therapy merits regulatory approval have been disproportionately conducted in North America, Europe, and parts of Asia. Recent estimates indicate that less than 3–4% of global clinical trials take place in Africa [1], despite the continent comprising roughly 16% of the world’s population. This under-representation has raised concerns about the generalizability of trial results and equity in access to research benefits. As pressures mount to diversify patient populations, improve trial efficiency, and enhance the relevance of clinical data to all global regions, understanding the performance of trials that include African sites is increasingly pertinent.
A substantial body of literature has quantified Phase III success rates and timelines, yet it often lacks specific insights into African-inclusive trials. Overall, Phase III success rates, defined as progressing from a completed trial to product approval, have generally been reported in the range of 57–67% across all indications [2,3,4,5,6]. When success is benchmarked against achieving the primary endpoint itself - an earlier and more direct measure of clinical benefit - estimates range from approximately 25% to over 70%, depending on the therapeutic area and study definitions [7,8,9,10]. Oncology trials, in particular, remain a persistent outlier, often demonstrating markedly lower rates of primary endpoint success (26–40%) compared to their non-oncology counterparts [7,8,11]. Even when measured by progression to Biologics Licensing Application or New Drug Application submission, oncology’s transition rates (often ~35–52%) fall below those of other indications, which consistently reach or exceed 60% [2,3,4].
In addition to success rates, trial duration exerts a substantial impact on the drug development landscape. Multiple large-scale assessments indicate that Phase III trials typically span around three years (roughly 1,200 days) from initiation to completion of primary endpoint analyses [5,10]. For oncology, some studies have reported slightly shorter or comparable timelines, while others suggest that complexities in patient recruitment, endpoint measurement, and regulatory oversight can prolong the process. However, all of these benchmarks predominantly reflect trials conducted in well-established research hubs, leaving open questions about whether timelines differ when studies incorporate sites from Africa, where healthcare infrastructures, patient populations, and regulatory environments can vary widely. Such differences could influence both trial conduct and outcomes, potentially offering unique advantages, challenges, or insights into patient responsiveness, feasibility of trial execution, and overall efficiency.
To date, the limited inclusion and examination of African trial sites in aggregated analyses have precluded definitive conclusions about whether their involvement affects Phase III success rates or timelines. Given the ongoing expansion of global clinical research networks and the imperative to enhance diversity and representation in clinical trials, these data gaps are increasingly problematic. This study aims to quantitatively assess the success rates and operational timelines of African-inclusive Phase III clinical trials. The objectives were: (1) to determine the proportion of these trials that met their primary endpoints; (2) to compare oncology vs. non-oncology outcomes based on the distinct trial profiles; and (3) to evaluate whether African site inclusion impacts trial duration. We hypothesize that African-inclusive trials do not underperform relative to global benchmarks in either success rates or timelines.
2. Materials and Methods
2.1. Study Design and Eligibility
The author conducted a retrospective observational study of Phase III clinical trials completed between December 2014 and December 2024 that included African site participation. Eligible trials were those meeting all of the following criteria: (1) the trial had reached completion of its primary endpoint assessment within the specified date range; (2) it was a Phase III interventional trial (examining therapeutic efficacy/safety in patients); and (3) at least one investigative site was located in an African country. African site inclusion was confirmed via explicit country listings in clinical trial registries (e.g., ClinicalTrials.gov) and verified using sponsor press releases or publication footnotes. When country names were absent from registry fields, the author cross-referenced narrative descriptions or public databases to confirm African participation. Country-specific terms (e.g., ‘Nigeria’, ‘Kenya’, ‘South Africa’) were used in manual filtering and verification processes. Trials were excluded if no African site could be confirmed or if the primary endpoint result was not publicly reported through any source.
2.2. Data Sources
Publicly available information was used to identify and characterize trials. Sources included clinical trial registries (e.g., ClinicalTrials.gov, the EU Clinical Trials Register), peer-reviewed journal publications, press releases, conference abstracts, and regulatory documents. To minimize bias, this research only included trials with publicly verifiable outcomes (positive or negative primary endpoint results). In practice, most included trials were identified via registry entries cross-linked to result summaries or sponsor announcements. A sample verification was performed of 10%, ensuring the accuracy of trial registries and databases. No errors were identified during the sample verification.
2.3. Outcome Classification
For each trial, the primary endpoint outcome was recorded as positive if the trial’s main efficacy endpoint was met (as defined in the trial protocol or results report), or negative if it was not met. In cases where results were ambiguously reported (e.g., phrased as “did not demonstrate a significant improvement” without a clear statement of success/failure), the author performed a manual review. This review included examining any subsequent regulatory approvals or label indications stemming from the trial, as well as sponsor communications. If a trial led to drug approval or a positive regulatory decision despite ambiguity in phrasing, it was classified as having a positive outcome for the primary endpoint (on the rationale that regulatory approval implies the trial achieved its efficacy objectives). Conversely, if no approval or supportive action followed and the available data did not confirm the primary endpoint’s success, the outcome was classified as non-positive. Nineteen trials (4.1%) required such case-by-case classification due to ambiguous result reporting.
2.4. Timeline Measurement
For each trial, the start date was captured (defined as the date of first patient enrolment, or “first patient in”) and the primary endpoint completion date (the date when the trial had accrued the necessary events or follow-up to evaluate the primary endpoint, often corresponding to “primary completion date” on registries). Using these, the trial duration was calculated to primary endpoint in days. Where available, the author used registry-defined primary completion dates; if not, the author inferred the date from the timing of primary results in publications or reports. Trials with inconsistent or missing dates that could not be resolved would be excluded from timeline analyses, although in practice, all trials had sufficient information. As the data period includes the COVID-19 pandemic (2020–2022), timelines may have been affected by trial suspensions or acceleration efforts. While no trials were excluded on this basis, the author acknowledges potential timeline variability due to pandemic-era disruptions.
2.5. Data Analysis
The data stratified trials into two broad categories: Oncology and Non-oncology. This stratification was prespecified given known differences in Phase III success between oncology and other indications. The author calculated the proportion of trials with positive primary endpoints for the entire sample and within each stratum. Alongside proportions, standard errors (SE) for these binomial estimates were computed (using the formula SE = √[p(1-p)/n]) [12]. For timelines, mean and median duration (in days) was calculated from start to primary endpoint, overall and by stratum. To convey variability, the author calculated the standard deviation (SD) of trial durations and the standard error of the mean. No formal statistical hypothesis tests (e.g., comparing oncology vs. non-oncology) were performed, as the goal was descriptive insight rather than inference. However, descriptive comparisons to external benchmarks are discussed. No differential weighting or stratification was applied to trials conducted across multiple regions (Africa + other continents). The analysis treated all trials as a single unit, provided they included at least one African site, regardless of whether other regions also participated.
This study involved retrospective analysis of publicly available, non-identifiable clinical trial data and did not involve any human subjects or patient interventions. In accordance with widely accepted research ethics standards, such use of public data does not require ethical approval. No institutional review board oversight was applicable as the study was conducted independently and outside the scope of institutional affiliation.
3. Results
Figure 1 illustrates the trial selection process. A total of 14,438 Phase III interventional trials completed or were terminated between December 2014 and December 2024. Of these, 2,722 had publicly available primary endpoint results. Among these, 461 trials included at least one site located in Africa and were retained for analysis. Of the 461 trials, 87.9% included sites in Sub-Saharan Africa and 12.1% in Northern Africa.
3.1. Primary Endpoint Success Rates
A total of 461 completed Phase III trials with African site inclusion were analyzedThe overall proportion of trials achieving a positive primary endpoint was 69.6% (321/461; SE 2.1%; 95% CI 65.5%-73.7%). This high-level result suggests that more than two-thirds of African-inclusive Phase III trials met their key efficacy objective. Success rates differed by therapeutic area. Among oncology trials (n = 102), 55.9% (57/102; SE 4.9%; 95% CI, 46.3%-65.5%) achieved a positive primary endpoint. In contrast, non-oncology trials (n = 359) had a success rate of 73.5% (264/359; SE 2.3%; 95% CI 69.0%-78.0%). Table 1 summarizes these outcomes. Non-oncology trials thus outperformed oncology trials in this sample by a substantial margin. It is noteworthy that even the oncology subset, at ~56% success, exceeds many historical reports of Phase III oncology success rates (often cited around 38% [7]). The overall 69.6% success rate across all indications places these African-inclusive trials at the upper end of previously reported Phase III success ranges, with a previous study finding 59% success across therapy areas [2]. A high-level comparison of the results of this study and past literature is presented in Figure 2.
3.2. Timelines to Primary Endpoint Completion
The time from trial initiation to primary endpoint completion was analyzed for the same set of trials. Overall, the mean duration was 1,085 days (95% CI, 1036-1135 days), with a median of 996 days. This suggests that a typical African-inclusive Phase III trial in the past decade reached its primary endpoint in roughly two and three-quarter years, though there was wide variance, with a SD in the order of ~510–540 days. When broken down by category, oncology trials were notably longer in duration than non-oncology trials. Oncology trials had a mean time to primary endpoint of 1,366 days (95% CI, 1268-1465 days) and a median of 1,280 days, whereas non-oncology trials averaged 989 days (95% CI, 936-1042 days), median of 884 days. Thus, on average, the oncology trials in this dataset took approximately 377 days longer to reach primary endpoints than non-oncology trials. Table 2 provides a summary of the trial duration metrics by stratum. Importantly, even the overall timelines compare favorably with global benchmarks. Prior global analyses have reported mean Phase III durations around 1,200–1,300 days [5,10]. In our sample, the overall median (996 days) was considerably below 1,000 days, and even the mean (1,085 days) was substantially lower than the aforementioned 1,200-1,300 days. This suggests that including African sites did not introduce delays; if anything, trials still completed slightly faster in reaching their endpoints than the global norm, although caution is warranted in interpreting this difference, as many factors beyond geography influence trial length.
With the differences between the median duration and mean duration, Figure 3 provides a histogram of the distribution of trial durations across all indications. The distribution of trial durations appeared right-skewed, with a minority of trials extending beyond 1,800 days. The median of 996 days remained substantially lower than the global average.
4. Discussion
The results of this analysis suggest that Phase III trials including at least one African site can achieve both favourable success rates and competitive timelines, in comparison to established global benchmarks. Across all indications, 69.6% of the analysed trials met their primary endpoints, placing this success rate toward the upper end of previously reported ranges for Phase III trials. While many prior studies have focused on the probability of progressing from Phase III to regulatory approval (often around 57–67% success), the direct primary endpoint success observed here (~70%) indicates robust trial performance. This distinction is important: a trial can meet its primary endpoint yet still not led to a product approval for various reasons (e.g., safety issues or strategic decisions). Our finding that nearly 7 in 10 African-inclusive trials hit their efficacy targets is encouraging and suggests that these trials are not failing at disproportionate rates.
When comparing by therapeutic area, a particularly notable finding is the strong performance of oncology trials in Africa-inclusive studies. This research observed a 55.9% primary endpoint success rate in the oncology subset. This is substantially higher than the ~26–40% success range reported by several oncology-focused analyses in predominantly non-African studies [3,7,8,9]. Such a discrepancy invites careful interpretation. It is unlikely due to chance alone, given over 100 oncology trials in the sample, but rather hints at underlying differences.
Several hypotheses may explain why oncology trials with African sites showed higher success rates than historical norms:
- Patient Population and Treatment History: Patients enrolled in African sites might have had limited prior exposure to advanced therapies, which can make a new treatment’s effect more pronounced. In many African settings, novel cancer drugs or multiple lines of therapy are less accessible outside trials [13]. Thus, trial participants might be more “treatment-naïve” or have less resistant disease. A drug that could show only marginal benefit in heavily pre-treated populations (common in trials in high-income countries) might demonstrate clearer efficacy in a population that hasn’t exhausted other options. This notion aligns with literature suggesting that clinical trials often provide access to otherwise unavailable interventions, potentially amplifying the therapeutic signal when patients have unmet medical need [14]. In other words, the difference in background therapy and disease stage could tilt outcomes favourably.
- Sponsor and Site Selection Bias: There may be a selection bias whereby sponsors who include African sites are conducting trials with particular characteristics. For instance, sponsors might choose African sites for trials that align well with local disease epidemiology, for example, a trial for a cancer type or subtype prevalent in African populations, ensuring a good match between the investigational therapy and the patient population. This targeted alignment could lead to better outcomes if the drug addresses a variant of disease that is particularly responsive. While such biases mean the higher success rate may not be solely due to operating in Africa, they indicate that the trials which do occur in Africa are often those with strong fundamentals.
- Operational Excellence and Support: Trials in Africa may benefit from focused operational support. It’s possible that only certain companies or well-resourced organizations embark on multi-region trials, and these sponsors may run higher-quality studies with rigorous designs and execution, thereby improving success odds [15}. Additionally, sponsors often partner with experienced local investigators and invest in training and infrastructure when expanding to a new region. The trials in our sample might have had robust monitoring and patient engagement strategies, contributing to success. In some cases, global health organizations or public-private partnerships are involved in African trials, potentially adding expertise and resources [16]. The presence of international oversight might ensure high protocol adherence and data quality, indirectly boosting the chance of meeting endpoints.
It is important to emphasize that these are hypotheses. The data shows an association whereby African-inclusive oncology trials had relatively high success rates, but any causation requires more research.
Non-oncology trials in this analysis also performed strongly, with a 73.5% success rate that compares favourably to historical benchmarks for Phase III success in non-oncology indications (often around 60–70% in prior reports) [3,4,6]. This high success rate in non-oncology could reflect the maturity of certain fields: many non-oncology diseases (like hypertension, diabetes, infectious diseases) have well-established endpoints and available effective therapies, so Phase III trials might be testing incremental improvements or non-inferiority, which are more likely to succeed than the high-risk novel mechanism trials often seen in oncology. It might also reflect that global sponsors felt confident expanding these trials to Africa, perhaps because they anticipated success based on earlier phase data. The key takeaway is that geographic diversification to Africa did not impede success in any way for non-oncology trials, and those trials achieved outcomes in line with the best expectations globally.
Another dimension is the timelines. Our findings show that overall, African-inclusive trials reached primary endpoints in a median of about 2.7 years. This is very much in line with typical Phase III trial lengths (2.5–3.5 years) and was in fact slightly shorter than some global averages reported in the literature [5,10]. Notably, the non-oncology trials had a median duration under 2.5 years, which is quite efficient for Phase III. This suggests that potential delays feared in multi-continent trials (e.g., slower patient recruitment in new regions, additional regulatory hurdles) were either minimal or offset by other advantages in our sample.
It is worth exploring why timelines were not prolonged by African participation and, in some cases, possibly shortened:
- Patient Recruitment Advantages: Africa offers a large pool of patients for many diseases, often with significantly less competition from other trials. Many African patients are eager to participate because trial participation can be a way to access cutting-edge treatments at no cost [15]. Faster recruitment can dramatically shorten the time to reach the required sample size or number of endpoint events. In our data, non-oncology trials were able to complete more quickly, and a potential reason for that is the inclusion of infectious disease or vaccines studies for diseases which are more prevalent in Africa, bringing a higher rate of recruitment.
- Operational Strategies to Mitigate Delays: Sponsors appear to have found ways to handle logistical and regulatory challenges. For example, regional regulatory harmonization efforts, such as the African Vaccine Regulatory Forum, and authority recommended local regulatory experts can accelerate approvals [16]. In one recent case, South Africa’s regulator was the fastest to approve a trial site after the US, highlighting improved efficiency [1]. Sponsors have also employed specialized contract research organizations or partnerships focused on Africa. These partners leverage on-the-ground expertise to navigate customs, import/export, and multi-country coordination. There are reports of systems where a single entity handles regulatory and logistics across multiple African countries, obtaining import licenses and clearances much faster than traditional trial approaches [17]. Such streamlining can compensate for what used to be seen as bureaucratic delays. The net effect is that trial startup and conduct in Africa can proceed on a faster timeline comparable to some regions.
- Adaptation of Trial Design: It’s possible that some trials adjusted their design to the realities of the settings, for instance, using adaptive designs or staged enrolment that concentrate on high-yield regions first. Adaptive trial designs allow for a more flexible approach to clinical trials and have been shown to have a higher probability of success [18]. Additionally, if African sites enrolled faster through staged enrolment, the trial might reach its endpoint trigger sooner even if other regions were slower. In some cases, the inclusion of high-incidence regions (for diseases like malaria or tuberculosis) means the required number of endpoint events (e.g., number of cases, relapses) accrues more quickly, shortening the trial.
In summary, the data counter the notion that expanding trials to Africa inevitably introduces delays or risks. With proper planning and investment, trials in Africa can run efficiently. Our findings align with the growing consensus that underrepresentation of Africa in clinical research is more a lost opportunity than a reflection of insurmountable obstacles [1]. That said, context matters; not every trial will have the same experience, and this analysis likely includes many well-supported trials (which is a success bias in itself).
Despite the positive implications, it is crucial to discuss the limitations of this analysis. First and foremost, this is a retrospective study based on publicly reported outcomes. There is a potential publication or reporting bias – trials that failed or were terminated early have a risk of not having their outcome reported and therefore would be missed, and it’s possible that some unsuccessful trials involving African sites remained unreported, due to lacking a harmonised reporting process in Africa, which would inflate the success rate in our observed sample. Secondly, the analysis did not control for confounding variables. The trials were heterogeneous in indications, sample sizes, endpoints, sponsor types, etc. The data was grouped by oncology vs non-oncology as a coarse stratification, but even within those groups there could be differences (for example, if the non-oncology group had many vaccine trials, those often have high success rates, which could skew the overall non-oncology success upward). Similarly, geography itself may be confounded with other factors – e.g., a sponsor running a trial in Africa might also be employing better recruitment practices or might be a globally experienced sponsor. Thus, it cannot concluded that ‘being in Africa’ causes higher success; one can only observe an association in this dataset.
Furthermore, the observational nature of this analysis means there is no evidence of causality. While this paper can hypothesise reasons for the favourable outcomes, a prospective or matched comparison study would be needed to rigorously test those hypotheses. For instance, an ideal analysis might compare Phase III trials of similar drugs or indications with and without African sites to see if outcomes differ. Comparison to historical benchmarks must be interpreted with caution. Many older success rate studies do not reflect the complexity of newer drug classes, such as immunotherapies or adaptive platform trials. Inclusion/exclusion criteria have evolved substantially, potentially limiting the comparability of this study’s results to those published a decade ago
Additionally, it’s notable that regional participation varied. Sub-Saharan African countries were far more represented than North African ones, possibly reflecting infrastructure and sponsor familiarity. This underlines the importance of considering regional heterogeneity when generalizing findings. Africa is not monolithic; a trial in South Africa (which has stronger research infrastructure) may experience different challenges than a trial in a lower-resource setting. Our aggregate view could obscure important nuances like these.
Another limitation is the timeframe: our data up to 2024 includes the period of the COVID-19 pandemic, which disrupted many trials globally. It’s possible some timeline data were affected (e.g., some trials could have paused and then resumed). The author did not systematically account for pandemic-related delays or accelerations, although one might note that COVID spurred some regulatory fast-tracking in Africa for related trials [16].
Lastly, the study’s focus on primary endpoint success is a specific metric. A trial meeting its primary endpoint is a critical milestone, but not the only measure of success. This research did not evaluate safety outcomes, cost, or post-trial impacts. It’s conceivable that some trials met endpoints but had other issues (e.g., safety concerns or only marginal clinical benefit), which could temper the interpretation of ‘success’.
5. Conclusions
This retrospective analysis demonstrates that Phase III clinical trials including at least one African site achieve positive primary endpoints at rates comparable to or exceeding global benchmarks, without significant delays in operational timelines. Notably, oncology trials involving African sites showed success rates substantially higher than historical global norms, underscoring potential advantages of including diverse patient populations and broader geographic representation. Although these results do not establish direct causality, they suggest that incorporating African trial sites can enhance clinical trial performance and dispel misconceptions regarding inherent operational challenges in African contexts. Future clinical trial designs should thoughtfully consider African inclusion to improve diversity, equity, and the global relevance of clinical evidence. Further prospective studies are needed to identify specific factors driving these successful outcomes and to optimize global trial strategies accordingly.
Author Contributions
This research was designed, conducted and written by Joab Williamson.
Funding
This research received no external funding.
Institutional Review Board Statement
Not applicable.
Informed Consent Statement
Not applicable.
Data Availability Statement
The original contributions presented in this study are included in the article. Further inquiries can be directed to the corresponding author.
Conflicts of Interest
The author declares no conflicts of interest.
Abbreviations
The following abbreviations are used in this manuscript:
| COVID-19 | 2019 Novel Coronavirus |
| Ph3 | Phase III |
| SE | Standard Error |
| SD | Standard Deviation |
References
- Grenfel G, Rickwood S. How clinical development can meet Africa’s unique health needs. World Economic Forum. 2022 May 18. Available at: https://www.weforum.org/stories/2022/05/how-clinical-development-can-meet-africas-unique-health-needs/ (last accessed December 9, 2024).
- Wong CH, Siah KW, Lo AW. Estimation of clinical trial success rates and related parameters. Biostatistics. 2018, 20, 2, 273–286. [CrossRef]
- Thomas DW, Burns J, Audette J, Carroll A, Dow-Hygelund C, Hay M. Clinical development success rates 2006–2015. BIO, Biomedtracker, Amplion. 2016. Available at: https://go.bio.org/rs/490-EHZ-999/images/Clinical%20Development%20Success%20Rates%202006-2015%20-%20BIO%2C%20Biomedtracker%2C%20Amplion%202016.pdf (last accessed December 9, 2024).
- Stopke S, Burns J. Phase III trial failures: Costly but preventable. Appl Clin Trials. 2016 Dec 13. Available at: https://www.appliedclinicaltrialsonline.com/view/phase-iii-trial-failures-costly-preventable (last accessed December 9, 2024).
- Thomas DW, Burns J, Audette J, Carroll A, Dow-Hygelund C, Hay M. Clinical development success rates and contributing factors 2011–2020. BIO, Biomedtracker, Amplion. 2021. Available at: https://go.bio.org/rs/490-EHZ-999/images/ClinicalDevelopmentSuccessRates2011_2020.pdf (last accessed December 9, 2024).
- IQVIA. Global trends in R&D 2024: Activity, productivity and enablers. IQVIA. 2024. Available at: https://www.iqvia.com/insights/the-iqvia-institute/reports-and-publications/reports/global-trends-in-r-and-d-2024-activity-productivity-and-enablers (last accessed December 9, 2024).
- Gan, HK; You, B; Pond, GR; Chen, EX. Assumptions of Expected Benefits in Randomized Phase III Trials Evaluating Systemic Treatments for Cancer. JNCI. 2012, 104, 8, 590-598. [CrossRef]
- Unger JM, Cook E, Tai E, Bleyer A. The role of clinical trial participation in cancer research: Barriers, evidence, and strategies. Am Soc Clin Oncol Educ Book. 2016, 36, 185–198. [CrossRef]
- Djulbegovic B, Kumar A, Glasziou PP, Perera R, Miladinovic B, Bonneterre J, Chalmers I. New treatments compared to established treatments in randomized trials. Arch Intern Med. 2008, 168, 6, 632–642. [CrossRef]
- Martin L, Hutchens M, Hawkins C. How much do clinical trials cost? Nat Rev Drug Discov. 2017, 16, 6, 381–382. [CrossRef]
- Wu L, Ono S. Subsequent oncology drug approvals after failing to meet a primary endpoint in phase III randomized trials. Clin Transl Sci. 2020, 13, 5, 924–933. [CrossRef]
- Altman, D.G.; Bland, J.M. Standard Deviations and Standard Errors. BMJ 2005, 331, 903. [CrossRef]
- Oximio. Africa: Unleashing the Potential of the New Superpower in Clinical Trials Available online: https://www.pharmaceutical-technology.com/sponsored/africa-unleashing-the-potential-of-the-new-superpower-in-clinical-trials/ (accessed on 19 May 2025).
- Loehrer, P.J.; Carpten, J.; Gopal, S.; Shamley, D. Strategies to Increase Participation of African Populations in Clinical Trials. American Society of Clinical Oncology Educational Book 2022, 1, 457–462. [CrossRef]
- Rickwood S, Bailey S, Mora-Brito P. How scaling clinical research in Africa can benefit society and the economy. Gavi, The Vaccine Alliance. 2024 Jan 5. Available at: https://www.gavi.org/vaccineswork/how-scaling-clinical-research-africa-can-benefit-society-and-economy (last accessed December 9, 2024).
- Ndembi, N.; Mekonen, T.T.; Folayan, M.O.; Dereje, N.; Kruger, A.; Fokam, J.; Temfack, E.; Raji, T.; Nachega, J.; Boum, Y.; et al. Strengthening and Expanding Capacities in Clinical Trials: Advancing Pandemic Prevention, Preparedness and Response in Africa. Nature Communications 2024, 15. [CrossRef]
- Hwenda, L.; Sidibe, M.; Makanga, M. The African Medicines Agency: The Key to Unlocking Clinical Research in Africa. The Lancet Global Health 2022, 10. [CrossRef]
- Chow, S.-C.; Corey, R. Benefits, Challenges and Obstacles of Adaptive Clinical Trial Designs. Orphanet Journal of Rare Diseases 2011, 6, 79. [CrossRef]
Figure 1.
Flowchart illustrating trial screening and inclusion.
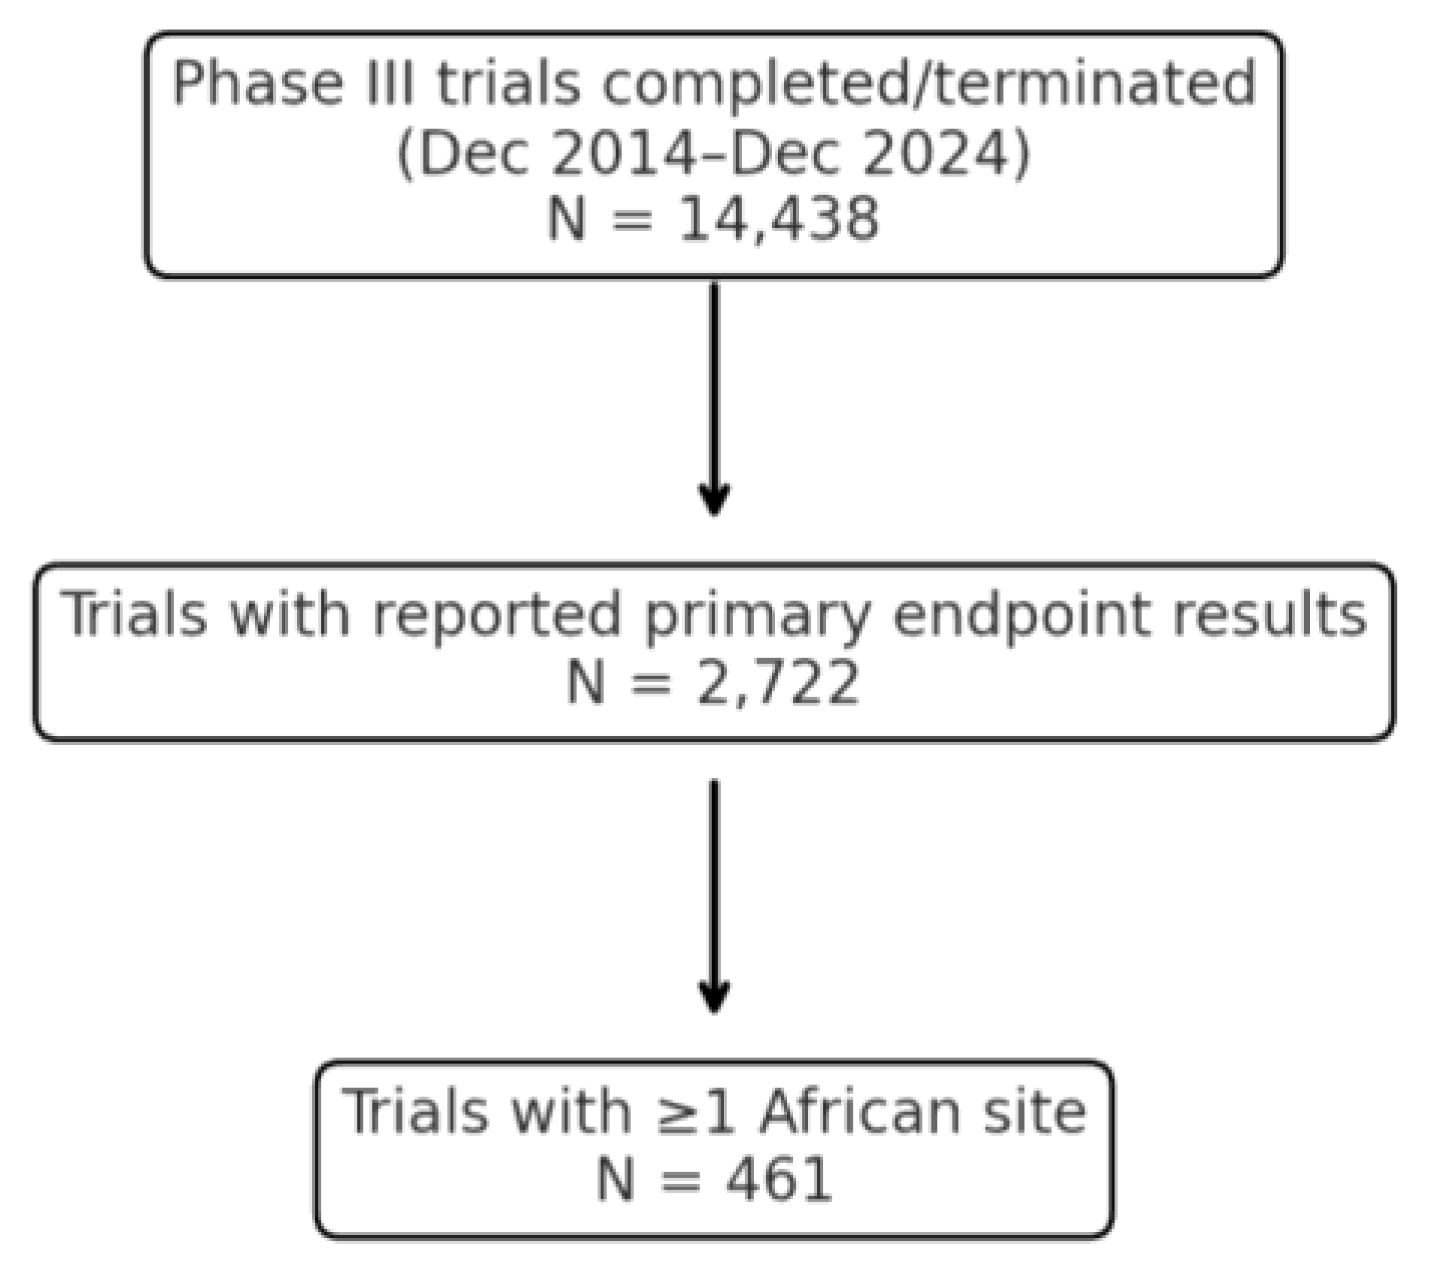
Figure 2.
Chart comparing Likelihood of positive Phase 3 primary endpoints to literature.
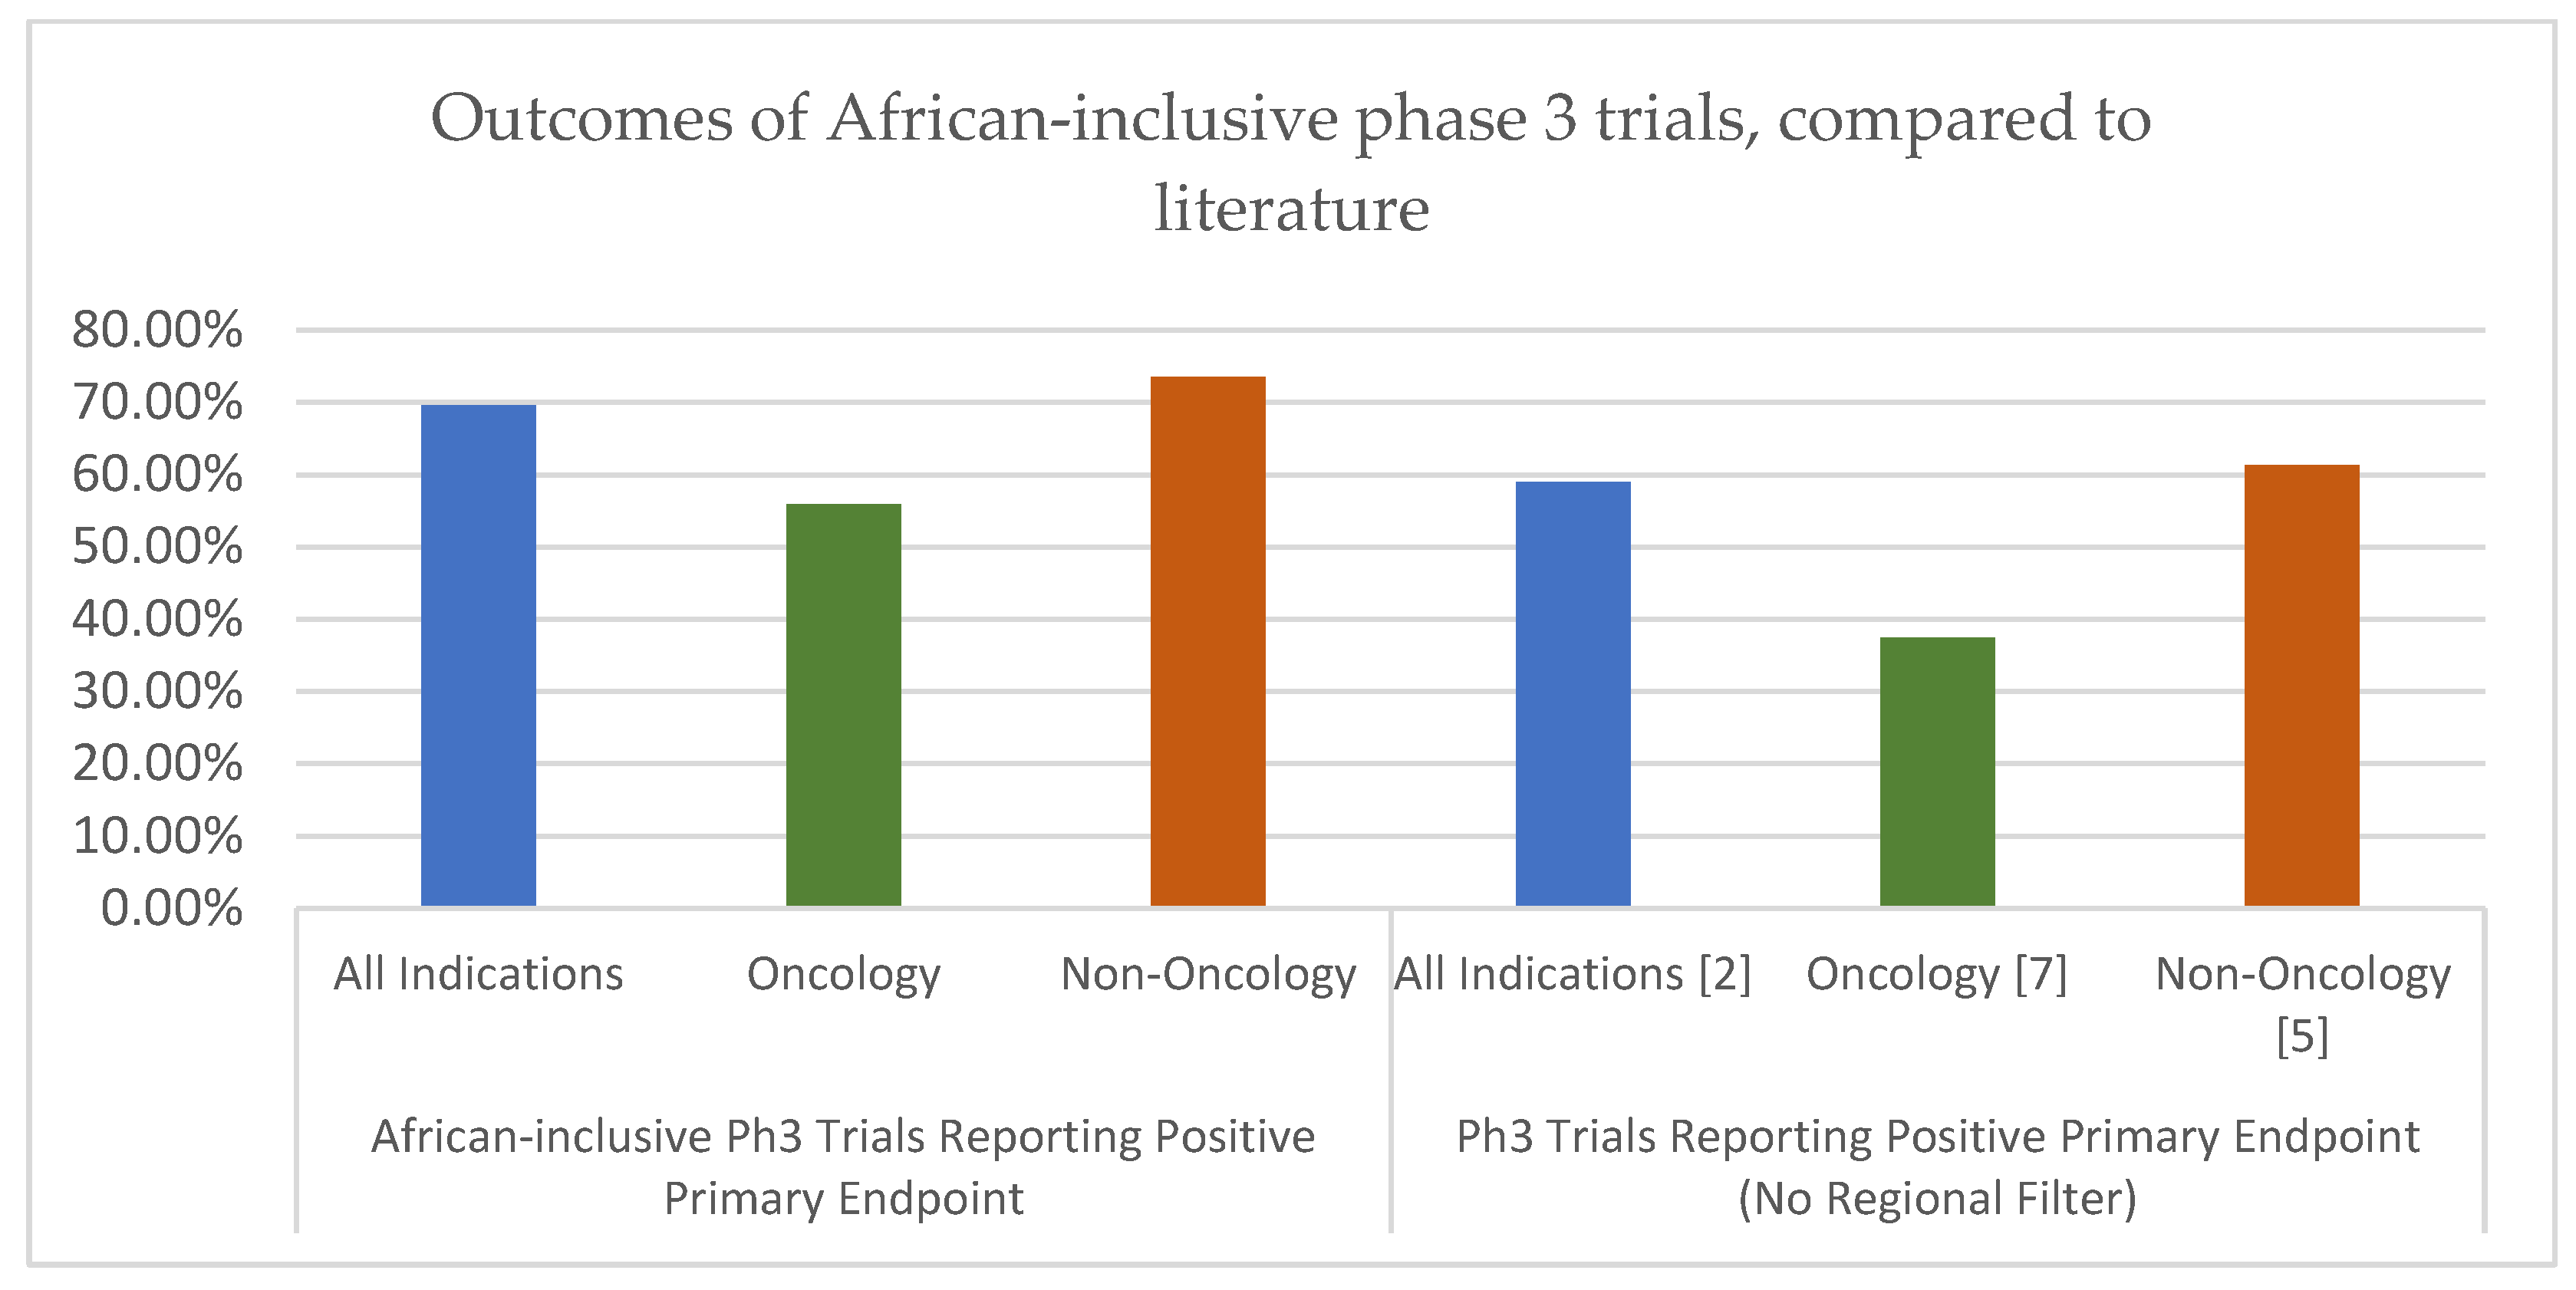
Figure 3.
Histogram showing the distribution of Phase III durations across all indications.
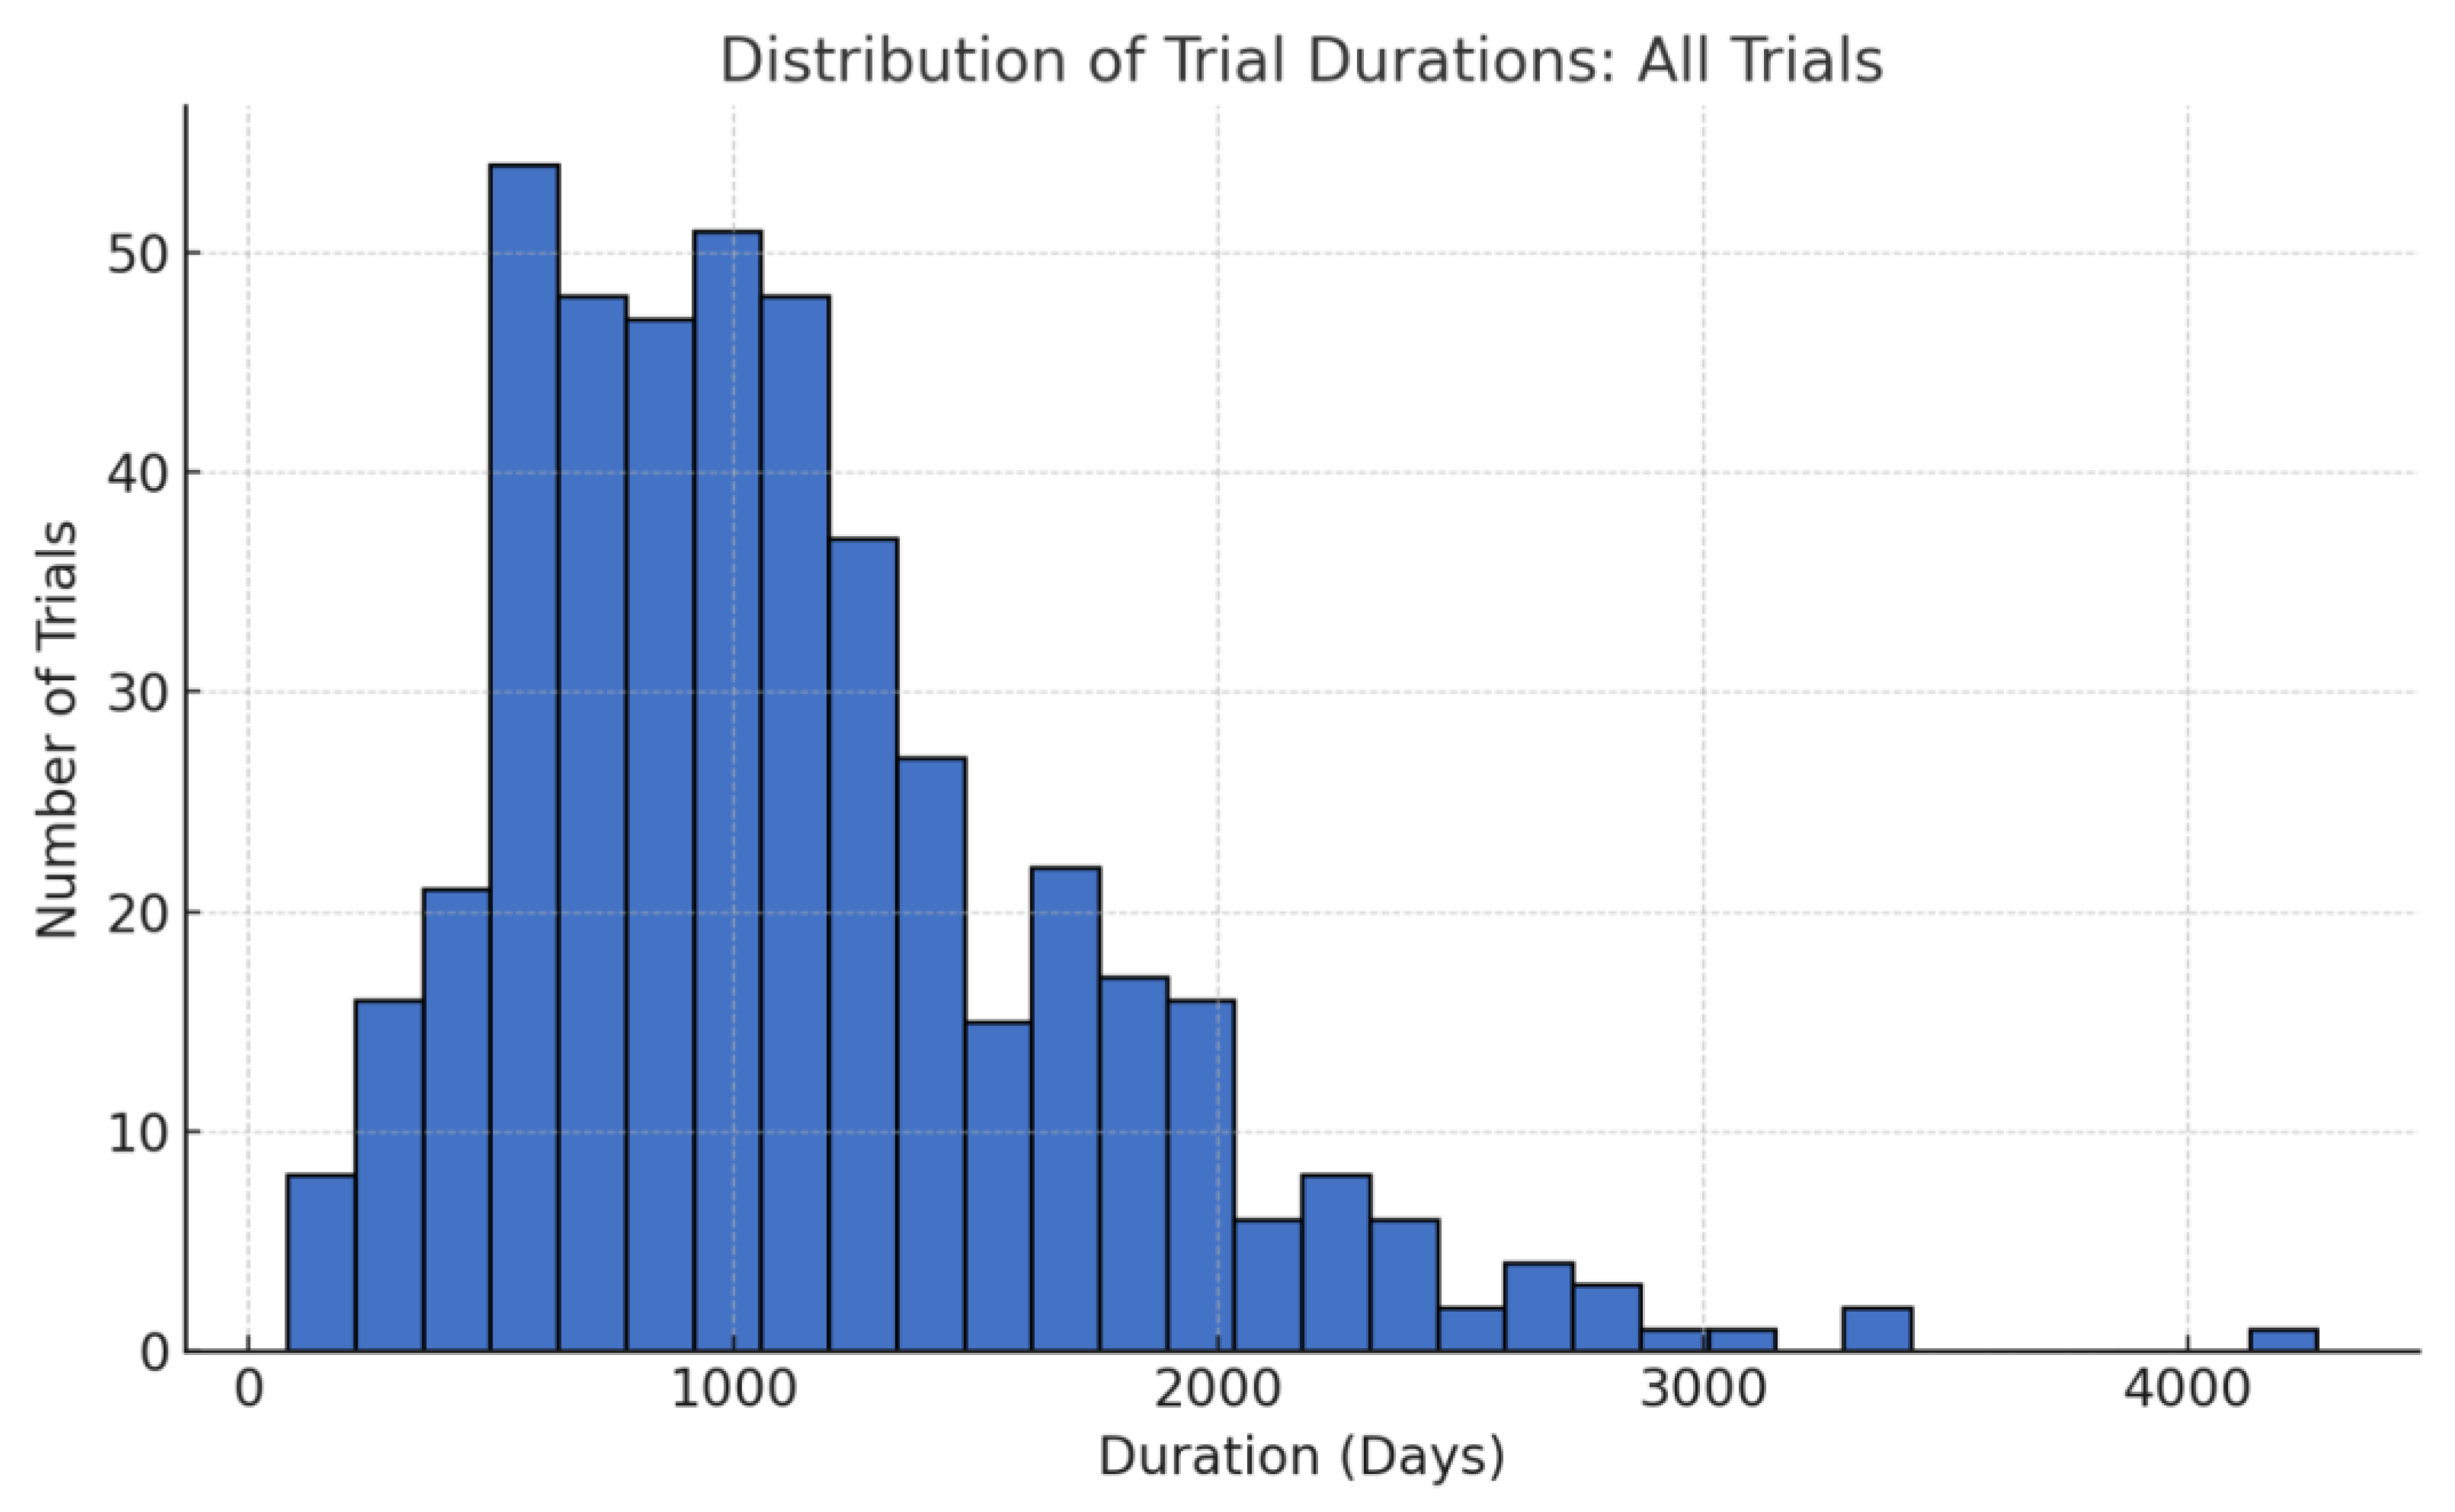

Table 1.
Likelihood of positive Phase 3 primary endpoints for trials containing African trial sites.
Table 1.
Likelihood of positive Phase 3 primary endpoints for trials containing African trial sites.
| Criteria | Sample Size | Outcome (%) | SE |
|---|---|---|---|
| Likelihood of Positive Ph3 Primary Endpoint - All Indications | 461 | 69.6% | 2.1% |
| Likelihood of Positive Ph3 Primary Endpoint - Oncology | 102 | 55.9% | 4.9% |
| Likelihood of Positive Ph3 Primary Endpoint - Non-Oncology | 359 | 73.5% | 2.3% |
Table 2.
Timelines from trial start to primary endpoint completion for trials containing African trial sites.
Table 2.
Timelines from trial start to primary endpoint completion for trials containing African trial sites.
| Criteria | Sample Size | Outcome (Days) | SD | SE | |
|---|---|---|---|---|---|
| Mean | Median | ||||
| Mean Ph3 Time from Declared Start to Primary Endpoint Completion - All Indications | 461 | 1085.15 | 996.00 | 542.05 | 25.25 |
| Mean Ph3 Time from Declared Start to Primary Endpoint Completion - Oncology | 102 | 1366.30 | 1280.00 | 508.25 | 50.32 |
| Mean Ph3 Time from Declared Start to Primary Endpoint Completion - Non-Oncology | 359 | 988.70 | 884.00 | 512.27 | 27.04 |
Disclaimer/Publisher’s Note: The statements, opinions and data contained in all publications are solely those of the individual author(s) and contributor(s) and not of MDPI and/or the editor(s). MDPI and/or the editor(s) disclaim responsibility for any injury to people or property resulting from any ideas, methods, instructions or products referred to in the content. |
© 2025 by the authors. Licensee MDPI, Basel, Switzerland. This article is an open access article distributed under the terms and conditions of the Creative Commons Attribution (CC BY) license (http://creativecommons.org/licenses/by/4.0/).
Copyright: This open access article is published under a Creative Commons CC BY 4.0 license, which permit the free download, distribution, and reuse, provided that the author and preprint are cited in any reuse.


