
Submitted:
09 June 2025
Posted:
10 June 2025
You are already at the latest version
Abstract
We employ a Time-Varying Parameter Vector Autoregression (TVP-VAR) and wavelet approach to gain new insights into the integration and dynamic asymmetric volatility risk spillovers between Bitcoin exchange rates, currency pairs, and traditional financial assets. The findings reveal strengthened integration between traditional financial assets and currency pairs, whereas a weak integration with BTC/ZAR. Furthermore, BTC/ZAR and traditional financial assets are receivers of shocks, while traditional currency pairs are transmitters of spillovers. Gold emerges as an attractive investment during periods of inflation or currency devaluation. However, it also offers a reduced systemic risk, as the total connectedness represents only 28.37%. Forex markets and traditional financial assets present distinct patterns in scale and frequency, with leading and lagging relationships observed in the long, medium, and short terms. BTC/ZAR leads the ALSI in the medium term, while its relationship with Bonds moves in opposite directions. Gold's negative influence on BTC/ZAR suggests diversification benefits, potential hedging strategies, and insights into market sentiment and macroeconomic dynamics. Bitcoin's high volatility and lack of regulatory oversight continue to be deterrents for institutional investors. These findings contribute to a deeper understanding of the interplay between Bitcoin, forex markets, and traditional financial assets in the South African context.
Keywords:
bitcoin
; TVP-VAR
; integration
; spillover
; wavelet
; network connectedness
1. Introduction
1.1. Background of the Study
Financial market integration is a key issue in international finance with significant implications for investment decisions. The integration of cryptocurrencies has garnered considerable attention due to their distinct qualities because they have received attention in both the financial press and empirical literature and have a dual economic impact. Recent literature has examined how the cryptocurrency market integrates with stock and other markets, revealing potential benefits for worldwide portfolio diversification and the risk to financial stability from excessive volatility. The South African financial market faces volatility due to political instability and policy uncertainty, necessitating the introduction of non-government financial assets like Bitcoin. Urquhart and Zhang (2019) state that cryptocurrencies, such as Bitcoin, are primarily used as speculative investments, not substitute currencies. Bitcoin has proven to be a versatile asset, serving as a payment method as well as a short- and long-term investment vehicle. This multifunctional use has sparked curiosity about how Bitcoin compares to other financial assets. South Africa’s approach to Bitcoin is marked by cautious interest and gradual steps towards regulation. Its use as an investment, payment method, and remittance tool reflects a growing recognition of the potential benefits of cryptocurrencies, balanced by a need to address associated risks and challenges.
Cryptocurrencies have existed for more than two decades. Nakamoto (2008) published the Bitcoin whitepaper, which outlined the concept and technical details of Bitcoin. Bitcoin, the first cryptocurrency market, entered its second decade starting in 2019. This implies that cryptocurrencies have matured beyond their initial years and are now in a more established phase of development and influence in financial markets. Financial markets now have a new layer that is characterised by high volatility and speculative trading due to the rapid growth of cryptocurrencies. Regardless of their main intended use, cryptocurrencies have brought in significant interest as speculative investment instruments, largely due to their exceptionally high price volatility. Rather than being used primarily for decentralised peer-to-peer payments, they attract investors seeking potential profits. Although the cryptocurrency market expanded steadily until 2017, Bitcoin maintained a leading market capitalisation of around 80–90%.
The cryptocurrency market has garnered significant attention, with a considerable body of research focusing on Bitcoin's potential as a safe-haven asset. However, there remains a notable scarcity of research that delves into the integration and risk transmission mechanisms between the cryptocurrency market and traditional asset classes. While many studies focus on how cryptocurrencies can act as a safe investment (Bouri et al., 2020; Urquhart and Zhang, 2019; Corbet et al., 2020; Shahzad et al., 2022; Wang et al., 2019; Mariana et al., 2021), some have looked at their use as protective assets (Naeem et al., 2021; Koutmos et al., 2021), and a few have examined how cryptocurrencies connect with stock markets (Pukthuanthong and Roll, 2009; Kumah and Odei-Mensah, 2021; Gajardo et al., 2018; Tiwari et al., 2013).
The brief overview of the cryptocurrency market reveals substantial heterogeneity among leading cryptocurrencies in terms of volatility, returns, and market capitalisation. For instance, Giannellis (2022) employed the TVP-VAR dynamic connectedness method to provide insights into cryptocurrency connectivity during the COVID-19 pandemic. Gajardo et al. (2018) examined the dynamics and behaviours of cryptocurrencies, specifically focusing on their interaction with conventional financial assets, including volatility, market efficiency, and potential diversification benefits. Their work aims to understand the interplay between cryptocurrencies and established financial markets, as well as their potential role in investment strategies. Harwick (2016) suggested that Bitcoin possesses characteristics that could render it a valuable complement to the currencies of developing markets, many of which are susceptible to political instability, weak policies, and limited asset protection. Alvarez-Ramirez and Rodriguez (2021) investigated the efficiency of cryptocurrencies by computing the singular value decomposition (SVD) entropy of lagged price return vectors. Furthermore, the increasing prevalence of cryptocurrencies in financial markets has amplified the potential for systemic risk spillover among them (Xu et al., 2021).
Researchers have shown growing interest in examining the transmission of cryptocurrency risk to traditional stocks or currencies (Yi et al., 2018; Ji et al., 2019; Chen and Sun, 2024; Akhtaruzzaman et al., 2022; Zięba et al., 2019; Andrada-Félix et al., 2020). Notably, the risk features and connectivity of higher moments in cryptocurrencies are often overlooked in current research. Chen and Sun (2024) dynamically analysed these characteristics across four levels: kurtosis, skewness, volatility, and return. Bitcoin's historical price fluctuations, such as the increase to nearly $20,000 in December 2017, followed by a significant decline in 2018, and its more recent volatility with a peak above $73,000 in March 2024 and a subsequent drop, underscore the dynamic and volatile nature of these assets. This volatility necessitates the application of sophisticated econometric techniques to accurately capture their interdependencies and risk transmission mechanisms. The co-movement among cryptocurrencies remains an important and interesting area of inquiry, as the interconnectedness of the Bitcoin market directly impacts volatility spillovers, returns, and hedging strategies (portfolio diversification and risk management) during turbulent periods.
Financial literature suggests that integrating the cryptocurrency market with other markets can attract more investors and enhance liquidity, potentially threatening financial stability in the event of shocks. Kumah and Odei-Mensah (2021) utilised wavelet-based techniques to investigate the degree of integration between cryptocurrency and African stock markets, revealing integration at lower frequencies. However, the detailed relationship between Bitcoin, stocks, Gold, and Bonds remains largely unexplored, particularly regarding Bitcoin's potential integration and risk transmission within the South African context. Since the seminal works of Grubel (1968), Engle, and Granger (1987), a substantial body of literature has examined the integration of African stock markets with global and commodity markets for asset pricing benefits. Applying multiple cross-correlation and wavelet multiple correlation, Tiwari et al. (2013) found limited opportunities for foreign investors in nine Asian stock markets due to strong integration at lower frequencies. While wavelet approaches have been used in a limited number of studies to examine multi-scale integration and diversification benefits across cryptocurrencies and traditional South African financial assets (Ndlovu and Chikobvu, 2023; Okonkwo et al., 2021; Kumah et al., 2022; Bhuiyan et al., 2023), Pukthuanthong and Roll (2009) indicated increasing global market integration, although a universally accepted measure remains elusive. Mensi et al. (2019) examined the impact of Bitcoin's co-movement with other prominent cryptocurrencies on portfolio risk. It is important to note that the volatility of cryptocurrencies significantly exceeds that of fiat currencies and traditional financial assets (Baur and Dimpfl, 2021).
Greeff (2019) indicates that the South African Revenue Service issued a media statement regarding the standard tax treatment of cryptocurrencies like Bitcoin. However, a clear policy governing the value-added tax (VAT) treatment of cryptocurrencies is currently absent. Milne and Lawack (2024) discussed the use of digital assets in payments and transaction banking, highlighting their efficiency advantages over traditional financial assets. Reddy and Lawack (2019) outlined South Africa's regulatory developments on cryptocurrencies, noting the South African Reserve Bank's proposed three-phase approach focusing on service provider licensing and registration, while also pointing out the lack of provisions for consumer protection, loss reparation, and fraud. The increasing adoption of cryptocurrencies in South Africa necessitates regulatory oversight, as highlighted by Lose and Kalitanyi (2025), who examined the cultural, regulatory, and technological challenges affecting cryptocurrency adoption, revealing a lack of specific regulations, awareness, and adequate technological infrastructure. Adelowotan (2024) also emphasised the need for regulatory frameworks in South Africa. A Financial Action Task Force (FATF) report identified a lack of regulation in South Africa, prompting the Financial Sector Conduct Authority (FSCA) to establish regulations.
Bitcoin's higher market capitalisation compared to other cryptocurrencies makes it a significant asset to study. Its increasing impact on the South African financial system is due to high crypto adoption rates in South Africa (Chainalysis, 2023), where investors utilise Bitcoin for remittances, hedging against Rand depreciation, and speculative trading. Even without formal regulation, Bitcoin's market movements can influence local liquidity and capital flows. Furthermore, strict exchange controls and Rand volatility in South Africa led some investors to use Bitcoin as a proxy for dollar exposure, contributing to informal dollarisation and capital flight. Bouri et al. (2018) noted that the connection between stock markets and cryptocurrencies is contingent on the economic conditions of a specific market.
The decision to investigate Bitcoin's relationship with South African traditional assets is driven by several financial and economic factors, despite the current lack of formal cryptocurrency regulation. In the financial factors, we consider the effort to lower overall risk; investors are always looking for methods to diversify their holdings. Bitcoin may present a fresh opportunity for diversification due to its possible lack of correlation with conventional assets such as stocks and South African real estate. Bitcoin has revealed periods of substantial price appreciation, attracting investors seeking higher returns than those of traditional South African assets, especially in a potentially low-growth environment. Bitcoin is a volatile asset; the financial analysis must evaluate the risk-adjusted returns of incorporating Bitcoin into a South African portfolio and comprehend how the volatility of the cryptocurrency affects the risk of the entire portfolio. Bitcoin can serve as a hedge against inflation; examining this assertion in light of South Africa's inflation history and prospects is crucial from a financial standpoint. In the economic factors, we consider that in times of economic uncertainty in South Africa (e.g., currency fluctuations, political instability), investors might look to alternative assets like Bitcoin as a store of value or a hedge against local economic risks. The interaction between Bitcoin and traditional South African assets could influence capital flows into and out of the country. Understanding these dynamics is important for economic stability. Information about investor sentiment and possible pressures on the local currency can be assembled from the price fluctuations and trading volumes of Bitcoin against the Rand.
This study is particularly relevant given the growing interaction between Bitcoin, currencies, and traditional financial assets in developing countries like South Africa. However, these interactions may exhibit different behaviours compared to developed economies due to South Africa's unique financial landscape and relatively high cryptocurrency adoption. Gopane (2022) found bidirectional volatility spillover and shock transmission between Bitcoin and USD/ZAR, but an independent relationship between Bitcoin and the South African stock market. Similarly, Msomi and Nyandeni (2025) reported volatility spillovers and bidirectional shock transmissions between Bitcoin and the Johannesburg Stock Exchange (JSE), and unidirectional spillovers between other cryptocurrencies and the JSE, while also noting that cryptocurrencies are not yet effective replacements for Gold as hedging tools in the South African market. These studies suggest the possibility of long-term diversification during crisis periods and indicate Bitcoin's increasing role as safe-haven in the COVID-19 period. Furthermore, research suggests volatility contagion between Bitcoin and Gold across long, medium, and short-term horizons during turmoil periods (Bhuiyan et al., 2023; Ibrahim et al., 2024; Maghyereh and Abdoh, 2022; Wu, 2021). Among the existing literature examining the integration and risk transmission between cryptocurrencies, currencies, and traditional South African financial assets, few studies on cryptocurrencies and equities or commodities originate from developed economies or global markets (Milunovich, 2018; Wątorek et al., 2023; Jeleskovic et al., 2023; Rehman et al., 2024). A significant gap in the research on the integration and risk transmission across Bitcoin, conventional currencies, and South African financial assets lies in the scant examination of asymmetric risk spillovers and their implications for risk management and portfolio diversification in developing markets. While research has explored these interconnections in developed nations, less attention has been paid to their manifestation within South Africa's distinct financial ecosystem. Given the increasing interconnectedness of financial markets in South Africa, including currencies, stocks, and Bonds, they are potentially susceptible to the influence of this digital asset. Therefore, comprehending the integration and risk transmission dynamics between these markets is crucial for investors, policymakers, and regulators.
This study aims to address the gap by expanding the limited research on the dynamic connectivity and integration within cryptocurrency marketplaces could enable crypto-investors to more effectively formulate trading and investment strategies encompassing multiple top cryptocurrencies within a unified portfolio. The particularity of this study with the existing literature is that we employ a Time-Varying Parameter VAR (TVP-VAR) approach and Wavelet analysis to examine the asymmetric risk spillovers and their implications for risk management and portfolio diversification, and to provide insights into the evolving nature of risk transmission across different time scales and frequencies, particularly during periods of market volatility. We also focus on the interaction between BTC/ZAR and South African traditional financial assets (ALSI, Bonds, and Gold), the associated systemic risks, and the interconnections and risk transmission between currency pairs (USD/ZAR, GBP/ZAR, and EUR/ZAR) and traditional assets. The integration of the BTC/ZAR exchange rate, forex, and South African ALSI, Gold, and Bonds in the frequency domain has not been adequately explored. This study further contributes by using wavelet coherence analysis to investigate how the strength of integration and risk-sharing changes across short and long investment horizons. This approach will provide valuable information for policymakers and investors to leverage diversification opportunities and the hedging potential of Bitcoin in the South African context.
2. Literature Review
2.1. Integration Market
Zeng and Ahmed (2023) seek to offer new insights into the integration of East Asian and the dynamic spread of volatility to the Bitcoin market and stock market returns using the data from 2014 to 2020. Applied the VAR-BEKK-GARCH approach and the vine-copula-CoVaR framework. The findings reveal that the upper tail risk is better at capturing strong general variations. When it comes to tail risk, all markets have asymmetric and two-way risk spillover effects. The Bitcoin market offers advantages for diversification. Notably, there was an exciting correlation between Bitcoin and the Chinese stock market. Kumah and Odei-Mensah (2021) showed the integration of other markets with the cryptocurrency market, potentially increasing investor participation and causing excessive liquidity. This integration is crucial for understanding the impact on African stock markets. The frequency domain spillover index and wavelet-based techniques reveal that at higher frequencies, integration is weak; at medium frequencies, it becomes stronger; and at lower frequencies, it is flawless. International investors may need to hedge price risk using cryptocurrencies in the short term.
From February 2014 to September 2018, Andrada-Félix et al. (2020) investigated the instability relationship between the main cryptocurrencies and conventional currencies. They both make use of the Diebold and Yilmaz (2014) framework and the revised approach by Antonakakis et al. (2020). The findings indicate that shocks across the eight cryptocurrencies and conventional currencies under study account for 34.43% of the overall variance in forecast errors. Furthermore, the findings reveal that financial market variables primarily drive total connectedness in traditional currencies, whereas cryptocurrency-specific variables predominantly determine total connectedness in the cryptocurrency market. Katsiampa et al. (2019) employ Asymmetric Diagonal BEKK and Diagonal BEKK methodologies on intra-day data for eight cryptocurrencies to assess the volatility co-movements and the conditional volatility dynamics of main cryptocurrencies. The findings revealed that tremors in OmiseGo are the smallest persistent, while those in Bitcoin are the greatest persistent. Nonetheless, over time, all of the cryptocurrencies under investigation show substantial degrees of volatility persistence. Jeribi and Fakhfekh (2021) explore the relationship between oil prices, five cryptocurrencies, and US indices and determine the best portfolio hedging strategy. It uses data from January 2016 to November 2019, revealing a negative leverage effect in crude oil and US indices, and a positive asymmetric volatility effect in cryptocurrency markets. The study suggests holding more conventional financial assets to minimise risk. Gil-Alana et al. (2020) explore the stochastic characteristics of six leading cryptocurrencies and their bilateral relationships with six stock market indices through fractional integration techniques. Their results reveal a lack of cointegration between stock market indices and cryptocurrencies, suggesting that cryptocurrencies operate independently from traditional financial and economic assets. This highlights the potential of cryptocurrencies as a valuable diversification tool in investor portfolios, affirming their emergence as a distinct investment asset class. Maiti et al. (2020) analyse the co-movements of five cryptocurrencies across time and frequency domains, uncovering significant policy and investment implications. It emphasises the existence of both short and long-term contagion effects among cryptocurrency pairs and suggests that diversifying into XBP and Bitcoin could be advantageous for investors. This predictable pattern may serve as a crucial strategy for investment decisions.
2.2. Cryptocurrencies as a Safe Haven and Hedging
According to Wu et al. (2019), under normal circumstances, Bitcoin and Gold are not suitable safe havens or effective hedges against economic policy uncertainty (EPU). Gold has smaller coefficients and maintains stability, but Bitcoin is more sensitive to shocks. High volatility and sensitivity to news, events, and future projections characterise this emerging market. During the COVID-19 pandemic, Mariana et al. (2021) tested Ethereum and Bitcoin as safe havens. The findings indicate that Ethereum and Bitcoin are good short-term safe havens, with Ethereum potentially being a better option. However, they exhibit high volatilities. The hedging and safe-haven characteristics of conventional currencies are examined by Shahzad et al. (2022) for cryptocurrencies such as Litecoin, Ripple, Ethereum, and Bitcoin. Except for the Euro, the findings disclose that the Japanese yen is the most trustworthy hedge for cryptocurrencies, followed by the British pound, the Chinese yuan, and the Euro, all of which act as safe havens amid market turbulence. Shahzad et al. (2019) examined whether Bitcoin is a safe-haven asset for stock market investments during extreme market conditions and compared its properties with those of Gold and a general commodity index, across a variety of stock market returns, with those from China, the US, and other emerging and developed economies.
Corbet et al. (2020) examine the relationships among the largest cryptocurrencies, and the findings indicate that these digital assets not only offer diversification benefits for investors but also serve as a safe-haven, akin to precious metals, during historical crises. According to Bouri et al. (2020), eight cryptocurrencies offer safe-haven and hedging qualities against declines in the S&P 500 and its ten equity sectors. The results confirm the value of cryptocurrencies as digital assets, but also highlight significant heterogeneity among them, offering insights for investors to mitigate equity losses. Sebastião and Godinho (2020) investigate the hedging properties of the Chicago Board Options Exchange CBOE Bitcoin futures, finding they are effective for Bitcoin and other major cryptocurrencies, but may leverage extreme losses. Naeem et al. (2021) explore the role of cryptocurrencies as a hedge and safe-haven for commodities, focusing on four groups: metal, agriculture, precious metals, and energy. It reveals that cryptocurrencies' underlying properties remain persistent during crisis periods.
2.3. Risk Spillover
Yi et al. (2018) examine the connectivity of eight well-known cryptocurrencies' static and dynamic volatility. The findings indicate that their connectedness fluctuates cyclically and has demonstrated a clear upward trend since late 2016. Additionally, it is observed that these cryptocurrencies are highly linked, with mega-cap cryptocurrencies being more likely to propagate volatility shocks to others. Zięba et al. (2019) investigate the co-movements between log-returns of cryptocurrencies, with a particular emphasis on Bitcoin. Utilising a VAR model to evaluate how demand shocks spread throughout clusters. The findings indicate specifically that changes in Bitcoin's price neither influence nor are influenced by the prices of other cryptocurrencies. Akhtaruzzaman et al. (2022) create a systemic contagion index (SCI) for cryptocurrencies using the CoVaR model for cryptocurrencies, revealing high valuation during the COVID-19 pandemic. This helps investors identify systemic vulnerability and make informed decisions. Ji et al. (2019) examine return and volatility risk spillovers among six major cryptocurrencies from August 7, 2015, to February 22, 2018. Using a set of measures established by Diebold and Yilmaz (2012), the findings reveal that Bitcoin and Litecoin have a greater effect on the network of returns, regardless of their direction. This suggests that other cryptocurrencies are greatly impacted by return shocks from these two cryptocurrencies. Additionally, the analysis shows that negative returns result in greater connectedness than positive returns.
Hsu et al. (2021) employ a Diagonal BEKK model to examine the risk spillovers from cryptocurrencies to traditional currencies and Gold prices over the period from August 2015 to June 2020. Their findings reveal significant co-volatility spillover effects, especially during periods of economic turbulence that occurred during the COVID-19 pandemic and the 2018 cryptocurrency crash. The study indicates that the behaviour of cryptocurrencies differs between normal and extreme market conditions, with negative return shocks having a more pronounced impact. This suggests that both cryptocurrencies and traditional currencies can be valuable tools for risk management and dynamic hedging. Li et al. (2020) investigate the risk connectedness among seven major cryptocurrencies: Bitcoin, Ethereum, Ripple, Litecoin, Stellar, Monero, and Dash, based on their significant market capitalisations. Using the CAViaR model to assess return risks, the study reveals similar risk patterns across these cryptocurrencies. The net pairwise spillover index, which measures risk connectedness, shows a strong correlation between risk spillover directions and market capitalisations, with lower-capitalisation cryptocurrencies transmitting risks to those with higher market capitalisation. The research further explores risk connectedness across different timescales, finding that risk spillovers are most prominent at medium-term frequencies. The findings offer important insights for regulators and cryptocurrency investors.
This study of integration and asymmetric risk transmission helps identify how shocks in one asset class can affect others, enabling more effective risk management strategies. For regulators and financial institutions, this insight can lead to better policy-making and the development of robust mechanisms to mitigate potential systemic risks within the South African financial market. By understanding the risk transmission between these asset classes, investors can better diversify their portfolios, lowering total exposure. The distinct behaviour of cryptocurrencies compared to traditional financial assets offers opportunities to hedge against market volatility, especially in times of economic stress. A key aspect of the research question is based on what the short-term and long-term interactions are between these markets, and how these interactions change across different market conditions. The answer to this question is to investigate how connectedness between Bitcoin and traditional financial assets reacts during times of distress.
However, there is a lack in the literature that addresses integration and risk transmission between Bitcoin, currency pairs, and traditional financial assets. The majority of existing research focuses solely on the integration of cryptocurrencies and conventional financial resources, as well as the risk spillover between cryptocurrencies and traditional assets. Firstly, the TVP-VAR-based wavelet analysis is the appropriate techniques that allow for the complex and dynamic interactions between Bitcoin, traditional currencies, and South African financial assets, enabling more informed decision-making in both investment and policy contexts. Financial markets are not static, and the strength and direction of interactions can change due to various factors such as economic policies, market sentiment, or global events. TVP-VAR can capture these time-varying dynamics, providing a more nuanced understanding of integration and risk spillovers. Secondly, Wavelet analysis, when combined with TVP-VAR, enables the decomposition of data across different time frequencies. This is particularly beneficial for distinguishing between short-term and long-term interactions. For instance, the impact of a sudden market shock might be more pronounced in the short term, while structural links between Bitcoin and traditional financial assets may reveal themselves in the long term. Wavelet analysis helps in identifying these patterns across various scales, offering a comprehensive view of market integration. Thirdly, by understanding how risk spillovers vary over time and across different frequencies, investors and policymakers can develop more effective risk management strategies. For example, during periods of high volatility, the technique can identify when Bitcoin might pose a greater risk to traditional financial assets or vice versa. This insight is crucial for adjusting portfolios or implementing regulatory measures to mitigate potential adverse effects. The South African financial market has its unique characteristics, influenced by local economic conditions, currency fluctuations, and global commodity prices. This is particularly useful in a South African context where the interaction between Bitcoin, local currencies, and traditional assets may differ from global trends due to country-specific economic dynamics.
3. Methodology of the study
3.1. ARFIRMA-EGARCH
The Autoregressive Fractionally Integrated Moving Average ARFIMA process is represented by:
where: L denotes the lag operator, ϕ denotes the autoregressive (AR) parameter, d denotes the fractional integration parameter, allowing the long memory in the series, μ is the mean, and is the white noise error term is (iid), this procedure is covariance stationary for −0.5 < d < 0.5, with mean reversion occurring, in case of d<1. The fractional white-noise mechanism covered in this model is expanded upon the studies discussed in Hosking (1981), Granger (1980), and Granger and Joyeux (1980). The preliminary tests indicate that a lag of 1 is the optimal lag length for the EGARCH (1,1) model applied to the data. Moreover, extensive literature supports the use of an EGARCH (1,1) model, as it effectively captures the immediate spread of daily stock markets according to (Chang et al., 2013; Arouri et al., 2011). To assess the robustness of the standardised residuals from these models, heteroscedasticity and ARCH tests are conducted. To obtain the marginal distribution for the standardised residuals in an EGARCH(1,1) model, the following expression is typically used:
where ω denotes the constant term, β denotes the lagged coefficient for the lagged conditional variance, α is the coefficient for the standardised residuals , capturing the leverage effect, and γ is the coefficient that allows for the asymmetry impacted by past shocks on the present volatility.
This model is useful for capturing long memory in the return series (through the ARFIMA component) and for modeling volatility clustering with asymmetries (through the EGARCH component). To account for the asymmetry in the volatility distribution of any stock market, Nelson (1991) developed a GARCH model that is asymmetric, known as the EGARCH model. The standardised residuals are derived from the model's error terms divided by the conditional standard deviation. Once you estimate the parameters ω, β, γ, and α, you can extract the standardised residuals, which can then be analysed for their marginal distribution. This approach allows for the modeling of the variance dynamics over time while capturing potential asymmetries in the distribution of the residuals. The parameter γ represents the asymmetric effect in the model. When γ is significantly negative, it proposes the existence of a leverage effect, meaning that negative news impacts market volatility more strongly than positive news. The magnitude effect is apprehended by the GARCH model, whereas the ARCH effect is measured by α. The presence of volatility clustering is indicated by a positive and significant α, accordingly, financial modeling benefits greatly from the application of the EGARCH model (Wang & Wang, 2011). A simple indicator of the persistence of stock volatility is usually the sum of the ARCH and GARCH effects.
This study adopts the connectedness measurement framework proposed by Diebold and Yilmaz (2014) and the extension to the TVP-VAR framework developed by Antonakakis et al. (2020). Since the TVP-VAR method is a versatile and powerful tool for analysing time-varying relationships between multiple time series variables. Its ability to capture evolving dynamics, improve forecasting performance, and provide insights into market behaviour makes it particularly useful in financial and economic research. Whether used for risk management, portfolio optimisation, policy analysis, or macroeconomic research, TVP-VAR models offer valuable insights that can inform decision-making and enhance our understanding of complex market dynamics. The strengths of TVP-VAR and wavelet analysis, the method offers comprehensive insights into the interactions between variables spanning various periods and market circumstances. This holistic view is valuable for researchers, practitioners, and policymakers in understanding and responding to dynamic market environments. Hence, wavelet graphs can effectively display how the correlations' strength and direction alter over time, encompassing shifts between positive and negative values and spanning both short-term (high frequency) and long-term (low frequency) ranges. The TVP-VAR model is defined as:
where the vector has N × 1 elements and represents an endogenous variable at time t. Similarly, the vector contains N × 1 elements and is an error term at time t. The matrix has an N × N dimension, is a perturbation vector. The vectorisation of () is denoted as. At time t, the matrix has N × N dimensions and is the coefficient matrix of a VAR model. The matrix is a time-varying variance-covariance matrix with N2 × 1 dimensions. The vector is a time-varying variance-covariance matrix that consists of N2 × N2 elements.
Pesaran and Shin (1998) and Koop et al. (1996) presented the generalised forecast error variance decomposition (GFEVD), which is based on the Wold representation theorem. Therefore, we use the following equation to translate the estimated TVP-VAR technique into its TVP-VMA process.. The GFEVD is preferred over the orthogonal variant since the outcomes are fully independent of the order of the variables. Moreover, Wiesen et al. (2018) emphasise that the generalised forecast error variance decomposition should be applied without a theoretical foundation capable of identifying the error structure. The following form, which represents the GFEVD, illustrates how shock in variable j affects variable i in terms of its contribution to the forecast error variance at horizon H.
where is the jth variable's contribution to the prediction error variance for the ith variable at horizon H. represents any variable of the seven variables (Bond, Gold, ALSI, USD/ZAR, EUR/ZAR, GBP/ZAR, or BTC/ZAR) used as the recipient variable, j is the variable from which the shock originates and which adds to the forecast error variance of variable represented by this index. Likewise, j can be any of the following seven variables: USD/ZAR, EUR/ZAR, GBP/ZAR, ALSI, Bond, Gold, or BTC/ZAR. You would evaluate how much each of these variables' shocks contributed to the forecast error variance of each recipient variable (i).
For illustration, would represent the percentage of the H-step-ahead forecast error variance of the ALSI that is attributable to shocks originating from the USD/ZAR exchange rate. In this study, N=7, we will have a matrix of dimension. Therefore, both i and j will iterate through the same set of the chosen variables: ALSI, Bond, Gold, USD/ZAR, EUR/ZAR, GBP/ZAR, and BTC/ZAR. The GFEVD will show how much each variable's innovation (shock) contributes to the forecast error variance of every other variable in the system at different forecast horizons.
Since the rows of do not naturally sum to one, it is required to normalise them. This normalisation process yields. As a result of the normalisation, the following identities are established:
3.2. Measuring Connectedness
The net pairwise volatility spillover between markets i and j is driven by the difference between the volatility shocks sent from market i to market j and those sent from market j to market i. The next phase includes computing all connectedness measures. Initially, we compute the net pairwise connectedness, which is expressed by:
When NPDCijt(H) > 0 and NPDCijt(H) < 0, it signifies that variable j exerts a stronger influence on variable i than the other way around.
The degree to which a shock in variable i spreads to all other variables j is measured by the total directional connectivity to others:
The total directional connectedness FROM others assesses the extent to which variable i is affected by shocks from all other variables j:
The net total directional connectedness is given by the difference between the total connectivity TO and FROM others, which provides a measure of how much variable i influences the network under analysis. The net volatility spillover from market i to every other market j is calculated as:
If , shows the variable i as a net transmitter (receiver) of shocks, meaning that it influences all other variables j more (less) than it is influenced by them.
Rather than using the original total connectedness index (TCI), we apply the revised version suggested by Chatziantoniou and Gabauer (2021), which evaluates the level of interconnectedness within the network.
TCI reflects an average value that indicates the degree of interconnectedness. This measure essentially shows how a shock to one variable affects all other variables on average. Greater market risk is indicated by a larger value, while less market risk is suggested by a lower value.
3.3. Connectedness Network Measures
Considering a total of n variables, the systemic network of those variables is represented by xij in Equation (14). The value of xij is binary, where 1 indicates a substantial Granger causal connection between two variables, and 0 indicates the absence of such relationship.
For illustration of one variable Bitcoin connected to other assets3, it is important to remember that matrix A creates a directed graph. While the off-diagonal components in the jth column show how Bitcoin j affects the other assets, the off-diagonal elements in the ith row show how other assets affect Bitcoin i.
The systemic network's density, interconnections, centroid, total path length, and the sum of all variables' distances from the centroid are computed. The centroid denotes the most systemically focused point in the network, as defined in Equation (15). A higher centroid value thus signifies a more pronounced systemic network.
where signifies the centroid of the systemic of the variable network built in time t
3.4. Wavelet-Squared Coherence
The combined behaviour of time and frequency scales is studied using wavelet-squared coherence. However, as demonstrated by Bloomfield et al. (2004), the Cross-Wavelet Transform (XWT) between two variables is only the product of the first complex wavelet transform and the complex conjugate of the second. Since the cross wavelet is generally merged, cross wavelet power ∣Wxy(u,s)∣ is commonly applied to assess the relationship between two variables. This approach signals zones in the frequency domain in which the two variables exhibit great power, indicating localised covariance. Nevertheless, the interpretation of cross-wavelet power is limited by the lack of defined boundaries. As a measure of wavelet coherence, Torrence and Webster (1999) calculated the squared absolute value of each time series' smoothed cross-wavelet power spectrum. Consequently, the parameter expressing the squared wavelet coherence is given by:
Here, S denotes the smoothing parameter. The squared wavelet coherence ranges between 0 and 1, 0 ≤ R2(u,s) ≤ 1. A coefficient closer to zero indicates weak interdependence, while a higher coefficient signifies robust co-movement. This metric is particularly effective in detecting the transmission effect among the variables.
3.5. Wavelet Transform Coherence (WTC)
The robustness of the results is evaluated using Wavelet-Coherence-based tests, with causality testing conducted across three frequency domains, such as long-term, medium-term, and short-term. Wavelet coherency, which acts as a correlation coefficient in the time-frequency domain, is proposed to solve this problem.
The wavelet coherence is a valuable technique for identifying potential relationships among two variables by exploring the time scale and frequency domain. It enhances correlation analysis by revealing irregular connections between two time series and highlighting their significant relationships. Wavelet coherence consistently aids in conducting reliability analysis for interactive studies, even during periods of strong coherence.
The WTC merges linear correlation with cross-spectrum analysis, distinguishing itself by examining the relationship between two time-series in both the time and frequency domains. This measure of wavelet coherence is based on the XWT and the wavelet power spectrum of each time series. Consequently, the wavelet coherence equation is expressed as follows:
For illustration, in this study, X will represent BTC/ZAR, USD/ZAR, GBP/ZAR, and EUR/ZAR, and Y will represent ALSI, Bond, and Gold.
4. Empirical Results and Discussion
This section describes the study's findings and discusses relevant issues raised by our analysis. We primarily emphasise the marginal results that allow us to extant the dynamic and frequency results, which we get from an empirical framework.
4.1. Data Analysis
We empirically study the integration and asymmetric risk transmission across the exchange rate of Bitcoin, currencies and traditional South African financial assets, sampled by data availability for the Bitcoin and currencies and the traditional assets. The data were collected from Thomson Reuters https://workspace.refinitiv.com/web/Apps/GlobalMarkets/ and https://stooq.com/q/?s=btczar. The sampled data start from January 18, 2010, to January 22, 2024. Marginal distribution of South Africa used such as the exchange rate between Bitcoin and the South African Rand, the forex: dollar to South African Rand, Pound to South African Rand and Euro to South African Rand, and the financial traditional assets (All share index, 10-year Bond, and Gold price). Our series is transformed with the following expression of the log returns:
We further estimate the connectedness of the variables and the wavelet coherence analysis used in considering the exchange rate of Bitcoin with each of the traditional financial assets and each of the forex with each of the traditional financial assets.
4.2. Statistic Descriptive Results
The summary statistics for the South African returns of various financial instruments, such as the traditional assets (ALSI, Bonds, Gold), and exchange rates of BTC/ZAR, GBP/ZAR, USD/ZAR, and EUR/ZAR are reported in Table 1. All returns are close to zero, indicating low average daily returns. BTC/ZAR has the highest mean return, suggesting higher average returns compared to other assets. Bond has a negative mean, indicating a slight average loss. All other selected variables presented positive returns. The difference between the mean and median indicates a slight asymmetry in the return distributions. BTC/ZAR has the highest standard deviation compared to other assets, indicating the most volatile asset, reflecting the volatility characteristic of the cryptocurrency. These findings align with the findings of Bonga-Bonga and Khalique (2023). Most assets have low skewness, while Bond and BTC/ZAR have high kurtosis, indicating fat tails and a higher probability of extreme returns. Other assets have kurtosis values greater than 3, demonstrating leptokurtic distributions. All assets have very high Jarque-Bera statistics and corresponding probabilities of zero, indicating strong rejection of the null hypothesis of normality. All returns are not normally distributed. These statistics highlight the differences in return characteristics between the assets, providing information about their risk and return profiles. BTC/ZAR stands out for its high returns and volatility, whereas Bonds exhibit positive skewness and extreme kurtosis. Other assets have moderate skewness and kurtosis, with non-normal return distributions.
The estimated coefficient for the chosen ARFIMA (1, 0, 0)-EGARCH (1,1) model for the South African traditional assets (ALSI, Bond, and Gold) as well as the exchange rate of Bitcoin, dollar, pound, and Euro to South African Rand respectively (BTC/ZAR, USD/ZAR, GBP/ZAR, EUR/ZAR) is displayed in Table 2. The selected model fits the data quite well. The EGARCH coefficients for foreign exchange and stocks are both positive and substantial at the 1% level. The positive and significant mean returns on Bonds indicate that investors can expect to earn a positive return over the investment period, which can be attractive for risk-averse investors looking for stable income. Investors may favour Bonds as a safer investment option, especially in uncertain economic times, as they provide a reliable return. A positive and significant mean return on Gold suggests that Gold has been appreciating over time, making it an attractive investment for those seeking to hedge against inflation or currency devaluation. Investors may view Gold as a safe-haven asset, increasing their allocation to Gold in their portfolios to protect against economic and market uncertainties. The positive and significant mean returns for BTC/ZAR indicate that Bitcoin has been appreciating against the South African Rand, suggesting strong performance and potential gains for investors. Investors seeking high returns may be attracted to Bitcoin, despite its higher volatility and risk. It highlights the potential for significant capital appreciation in the cryptocurrency market. The positive and significant mean returns for USD/ZAR, GBP/ZAR and EUR/ZAR suggest that the US Dollar, the British Pound, and the Euro have been strengthening against the South African Rand, reflecting favourable economic conditions in the US, UK and Eurozone or economic challenges in South Africa. A negative and insignificant mean return for the ALSI suggests underperformance and potential risks without strong statistical evidence of consistent negative returns. Investors might approach the ALSI with caution, seeking more stable and positive-returning assets, while some contrarian investors might view it as a potential opportunity for future gains. The parameter ϕ is an autoregressive term in the mean equation, indicating how past returns influence current returns. We observe positive and significant parameters of ALSI and EUR/ZAR, indicating that past returns positively influence current returns. Bond has a negative and significant coefficient, indicating that past returns negatively influence current returns. The other variables are not significant, indicating that past returns do not significantly influence current returns. The positive and significant α coefficients indicate that past shocks impact current volatility across all variables. BTC/ZAR exhibits very high and significant β coefficients, suggesting highly persistent volatility, as highlighted in the summary statistics. This persistent volatility is also evident for ALSI, Bond, Gold, USD/ZAR, GBP/ZAR, and EUR/ZAR. Additionally, the positive and significant γ coefficients suggest asymmetry in volatility responses to all variables of the study.
The ARFIMA(1, 0, 0) and EGARCH(1, 1) model sheds light on the dynamics of return and volatility for various financial assets. Significant autoregressive terms (ϕ) in the mean equation indicate that past returns influence current returns. Significant coefficients in the variance equation (ω, α, β, γ, and φ) reveal volatility's persistence and response to past shocks, as well as potential asymmetries in how shocks impact volatility. The high significance levels of these parameters demonstrate the robustness of the model in capturing the underlying financial processes. The ARCH[3] has p-values greater to 5%, failing to reject the null hypothesis of no autocorrelations in the series.
Table 3 exhibits the dynamic connectedness of the selected variables. This connectedness table provides insights into the interdependencies and risk transmission mechanisms among these financial assets, highlighting which assets are primarily influenced by others and which serve as key transmitters of shocks in the system. Total connectedness index (TCI) between exchange rate of Bitcoin, USD, Pound, and Euro to South African Rand, (BTC/ZAR, USD/ZAR, GBP/ZAR, EUR/ZAR) against the South African traditional financial assets (ALSI, Bond and Gold) represents 28.37% of the volatility forecast error variance in seven assets comes from spillovers, and indicates the degree of overall connectedness among the assets that is independent of one another. The idiosyncratic component of each variable represents the other factors that account for the remaining 71.63%. The financial implication is the reduced systemic risk. We notice that Lower connectedness means that shocks or risks in one variable are less likely to spread to others. This reduces the likelihood of systemic risk where a problem in one area could lead to widespread financial instability. Investors might find the overall financial system to be more resilient. This can instil confidence in market stability, potentially leading to more investment and lower risk premiums. This also gives greater opportunities for diversification. When assets are less correlated, the overall risk of a portfolio can be reduced by holding a variety of these assets. This indicates an important degree of spillover effects in the system of these markets. For policymakers, lower connectedness might suggest that the financial system is less prone to contagion effects. Policy measures can be more targeted without fearing widespread repercussions.
Net Pairwise Transmission (NPT) ranks the assets based on their role in transmitting shocks, with EUR/ZAR, GBP/ZAR, and USD/ZAR being the most influential. The diagonal elements represent the own-variable effects. For example, 94.49% of the volatility in ALSI is due to its past shocks, and 93.75% of the volatility in BTC/ZAR is due to its past shocks. The row sum “FROM” indicates how much each asset is affected by others. For instance, 5.51% of ALSI's volatility comes from other assets, while 6.25% of BTC/ZAR's volatility comes from other assets. The row sum “TO” indicates how much each asset contributes to the volatility of others. For example, ALSI contributes 3.86% to the volatility of other assets, while EUR/ZAR, GBP/ZAR, and USD/ZAR contribute respectively with 62.41%, 60.26%, and 58.69%, indicating that these assets have a significant influence on other assets. The NET is the spillover effect, calculated as the difference between the "TO" and "FROM" values. Positive NET values indicate that an asset is a net transmitter of shocks, while negative NET values indicate that an asset is a net receiver of shocks. In the present scenario, ALSI, Bond, Gold, BTC/ZAR, are receivers of shocks, whereas USD/ZAR, GBP/ZAR, and EUR/ZAR are transmitters of shocks. This result confirms the findings of (Mensi et al., 2019; and Hoque et al., 2023), where Bitcoin and Gold are the recipients of the spillovers. In the same perspective as confirmed in the study of Bonga-Bonga and Khalique (2023), where ALSI and USD/ZAR are the receivers of shocks, but with a contrasting result showing Bitcoin as the transmitter of the spillover to others. Our results contrast with the study of Hung (2022) on the one hand, who found Bitcoin as a transmitter of spillover, on the other hand, confirm our findings showing that Gold is a recipient of shocks, as evidenced by (Shahzad et al., 2023). We discuss the off-diagonal elements, which represent the pairwise directional connectedness, to determine the transmission of volatility shocks across assets. The largest one is from BTC/ZAR to ALSI (1.15%).
The largest spillover effect in the system occurs from EUR/ZAR to GBP/ZAR is 29.68%. In return, the pairwise directional connectedness from GBP/ZAR to EUR/ZAR is 29.21%. Whereas the weakest spillover effect is from ALSI to GBP/ZAR 0.31%, in return, the pairwise directional connectedness from GBP/ZAR to ALSI is 0.71%. Among the spillover effects between markets, the spillover effects from BTC/ZAR to ALSI and Gold are greater than those from forex (USD/ZAR, GBP/ZAR, and EUR/ZAR) to ALSI and Gold. This can be explained by the high volatility and speculative nature of Bitcoin. The higher spillover can also be attributed to the emerging dynamics of their asset class. Here, investors who are active in both Bitcoin and traditional markets (stock and Gold) can contribute to higher spillover effects as they reallocate funds between these assets based on perceived opportunities or risks. In contrast, the relative stability of forex markets, different drivers and dynamics, and segregation of investment strategies contribute to lower spillover effects from ALSI to BTC/ZAR. Forex markets, especially for major currencies like USD, GBP, and EUR, tend to be more stable due to central bank interventions and well-established monetary policies. This stability reduces the likelihood of significant spillover effects. Forex markets are mainly determined by macroeconomic factors such as inflation, interest rates, and geopolitical events, which may not have immediate or direct impacts on traditional assets like stocks and Gold.
Figure 1 presents the Network Partial Directed Coherence (NPDC) graph that is often used in the analysis of multivariate time series data to understand the directional influence or causal relationships between different variables or assets. The important elements of the graph are: Nodes representing different variables or assets in the network; Edges/Arrows indicate the direction and strength of the influence from one node to another; Edge Weight/Thickness represents the strength of the causal influence. Thicker edges indicate stronger influences. Figure 1 shows that ALSI, Bond, Gold, and BTC/ZAR are the receivers of shocks; they do not influence any movement among these assets. While the currency pairs (USD/ZAR, GBP/ZAR, and EUR/ZAR) are transmitters of shocks to other assets. BTC/ZAR receive shocks from the dollar, pound, and Euro. The Figure 1 interpretation confirms the result of Table 3. Usually, a certain degree of interconnection among asset classes helps investors to effectively spread their holdings. GBP/ZAR has thick arrows pointing towards USD/ZAR, indicating that changes in the GBP/ZAR exchange rate strongly affect the USD/ZAR.
The volatility in the South African Bond prices is influenced by the GBP/ZAR exchange rate volatility. This is because the volatility in the exchange rate may indicate a broader sentiment of risk that impacts the fixed-income markets. The GBP/ZAR exchange rate shows the economic strength as well as the trade relationship between South Africa and the UK. Changes in the exchange rate mark the shifting of one or more economic fundamentals which directly affect the bond market expectations, such as inflation or interest rates. The exchange rate volatility provides insight into the GBP/ZAR capital flows and can have significant ramifications on the supply and demand in the bond market. The exchange rate movements have a direct impact on the South African bond returns. For instance, if the Rand were to depreciate against the GBP, there might be an expectation that inflation will be higher in SA, driving up bond yields (and dropping prices), causing you to have negative returns. A higher Rand, on the other hand, could be a function of lower inflation expectations, resulting in possibly higher bond returns.
The volatility spillover from the GBP/ZAR is influencing the volatility of the South African stock index (ALSI). Most SA companies are also internationally exposed or at least participating in import/ export transactions with pricing in currencies such as the GBP. If the value of the currency they receive is volatile, that can inject more uncertainty into the level of their future income, which raises stock market volatility. Large fluctuations in the GBP/ZAR exchange rate probably also suggest there is simply too much general uncertainty in the broader economy, and this is also putting a damper on the investment case for the South African share market. The rate of exchange may also impact the attractiveness (or otherwise) of South African stocks for UK-based investors and vice versa, influencing demand and volatility.
The instability of the GBP/ZAR exchange rate is causing fluctuations in Gold prices (potentially within the Rand. USD is the prevalent currency used to purchase gold. Fluctuations in GBP/ZAR will be correlated with USD movements to determine the Rand price of gold. Uncertainty in the GBP/ZAR market can lead to uncertainty regarding the local gold price. The GBP/ZAR exchange rate's volatility, whether caused by economic or political instability, could result in investors choosing safe-haven assets like gold, which could impact its price dynamics in Rand terms. The fluctuations in the GBP/ZAR exchange rate are affecting the returns of Gold. A decrease in the Rand's value against GBP (and possibly other major currencies) would usually result in a higher price for gold in Rand terms, which could be advantageous for local gold investors, even if the USD price of gold is not affected. Conversely, a higher Rand would lead to lower local prices for gold, potentially resulting in lower returns.
The interpretation above regarding the arrows from the GBP/ZAR pointing toward ALSI, Bond, and Gold is similar for the currency pairs (USD/ZAR, EUR/ZAR) and the South African financial assets. These nodes, USD/ZAR, GBP/ZAR, and EUR/ZAR, are central; they are interconnected, with several arrows indicating mutual influences, and the arrows between these nodes also suggest strong bidirectional influences, indicating interconnectedness among these currency pairs. These currency pair changes are driving or influencing BTC/ZAR exchange rate, ALSI, Bond, and Gold movements. For instance, the arrow from USD/ZAR to BTC/ZAR implies that keeping an eye on USD/ZAR can give a trader or analyst predictive insight into BTC/ZAR movements. In light of the volatility of USD/ZAR, risk managers may see this as an indication to hedge BTC/ZAR positions. The dynamics of the USD/ZAR exchange rate have a statistically significant and directional influence on the dynamics of the BTC/ZAR exchange rate, most likely through the transmission of volatility, information, or market sentiment. Figure 1 doesn't provide any statistical evidence of volatility or return spillovers from the BTC/ZAR exchange rate to traditional asset classes in South Africa, as indicated by the absence of arrows. The South African Bond prices are not significantly influenced by fluctuations in the Bitcoin price. The level of price changes in one market does not necessarily lead to increased or decreased price changes in the other. The performance of the Bitcoin exchange rate does not provide reliable signals for future bond returns. Volatility in the BTC/ZAR exchange rate is not significantly transmitted to the volatility of the South African stock market (ALSI), and the returns on BTC/ZAR are not significantly affecting the returns of the ALSI. The volatility of the BTC/ZAR is not significantly influencing the volatility of Gold prices. Nevertheless, this uncertainty remains. The returns of Gold are not significantly impacted by BTC/ZAR returns, showing return independence.
Investigating these spillovers is important for investors, policymakers, and risk managers in South Africa as it indicates the interconnectedness of the currency market with other vital segments of the financial system. The strength and direction of these spillovers can offer insights into market integration, investor behaviour, and the transmission of economic shocks. The System-wide connectedness network across Bitcoin, currencies, and South African traditional assets. We observe that forex influences the traditional assets such as ALSI, and the Gold price, while Bitcoin does not have any influence on South African traditional assets. There is a weak influence between Bitcoin and forex. USD/ZAR has thick arrows pointing towards ALSI, Gold, indicating that the variations in USD/ZAR exchange rates will strongly impact the prices of ALSI and Gold.
Figure 2 presents the Pairwise Connectedness Index (PCI). This graph depicts the pairwise connectivity of different variables or assets in a network. In financial contexts, PCI aids in understanding how interconnected the returns or volatilities of various assets are, revealing systemic risk, contagion, and diversification opportunities. The nodes of BTC/ZAR, ALSI, Bond, and Gold are isolated with no arrows connecting them to other nodes. This indicates that the Bitcoin exchange rate, ALSI, Bond, and Gold do not have significant pairwise connectedness with the other assets in the network. Their price movements are independent of the other assets in this network. These assets may be influenced by different factors than the other assets in the network, or they may be less responsive to changes in the broader market represented by the connected assets. The factors linked to the lack of PCI are caused, on the one hand, by divergent market drivers and investor behaviour. BTC/ZAR behaviour is influenced by global Crypto trends and regulations, and news around the technology as opposed to economic fundamentals. Its high volatility can also cause Bitcoin to behave as though it can move independently of traditional securities such as bonds and equities. The interest rates, inflation, fiscal policy and sovereign risk perceptions are macroeconomic drivers. In times of crisis, such as based on regional events (e.g., Russia-Ukraine war), bonds might move on a flight-to-safety flow in a way that Bitcoin would not. Time-honoured safe-haven asset, demand for gold surges during market stress, but is less correlated with local equity or crypto markets. It is priced based on global risk aversion, strength of USD and real rates. It might not be correlated to Bitcoin or bonds because they have different risk-return profiles. On another hand, asymmetric responses to market conditions; in this case, Bitcoin and bonds exhibit opposite reactions to uncertainty. For instance, Bitcoin may rally during risk-on periods, while bonds gain during risk-off phases. Gold and ALSI also display asymmetry; gold thrives in crises, while equities (ALSI) decline. The financial implications of these factors are the strategy to achieve these asymmetries in the asset allocation. For instance, including gold in a portfolio dominated by the ALSI could hedge against equity declines. The diversification benefits. Bring investors to reduce portfolio risk by holding these assets together, as their returns are not tightly connected.
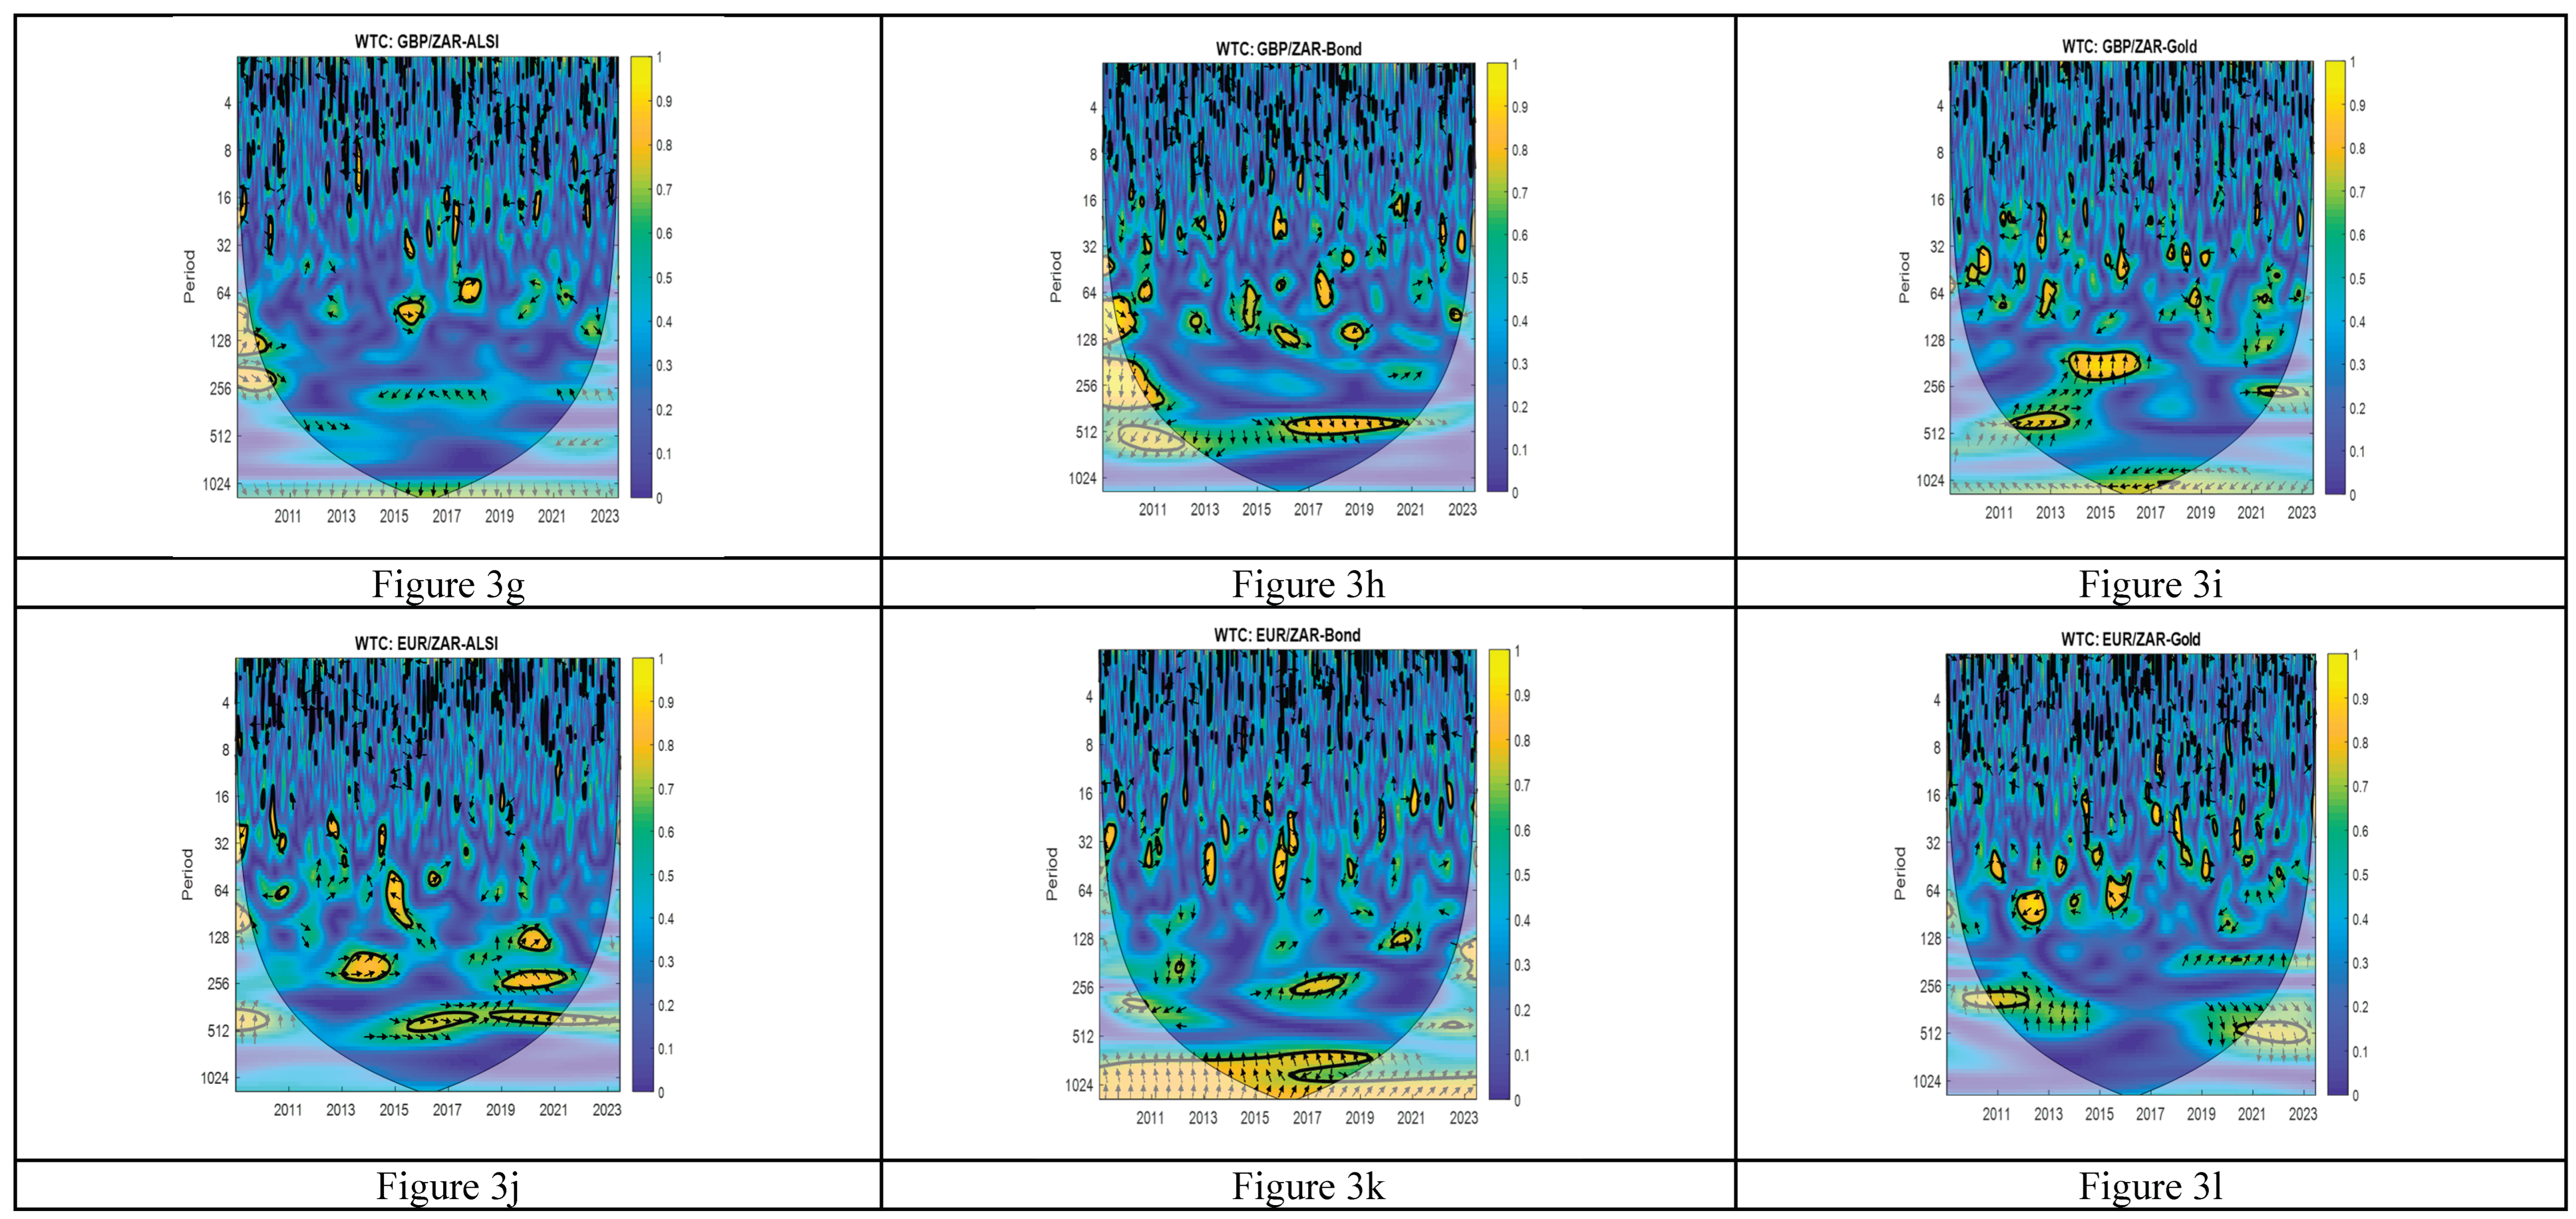
Figure 3a-3l presents the graph of the wavelet coherence between the Bitcoin and the traditional assets, and the forex with the South African traditional assets.
Figure 3a demonstrates the significance of the higher frequency at the short-term, at 8-16 days, covering the period 2018, with BTC/ZAR leading ALSI. In the medium term, at 32-64 days with BTC/ZAR leading ALSI by a quarter cycle of the observed frequency, that will be 8-16 days, covering the period 2020. These findings are similar to those investigated by Kumah and Odei-Mensah (2021). In the long-term, at 64-128 days and 128-256 days with BTC/ZAR leading ALSI in the periods 2011-2012 and 2011-2013, respectively, and at 128-256 days showed a confusing relationship in higher coherency in the lower-frequency for the period 2022. There is an indication of the strong integration at diverse time scales and frequencies. Understanding this relationship can help investors better navigate market dynamics and adjust their portfolios accordingly to balance risk and return.
Figure 3b shows the wavelet coherence between BTC/ZAR and Bond in the higher frequency over the long term (64-128 days), with BTC/ZAR lagging behind Bond, indicating that BTC/ZAR negatively influences the Bond market, as evidenced by the downward right-pointing arrows during the 2017 and 2018-2020 periods respectively. This signifies a negative correlation between the two variables. Financially, this has several implications. In this scenario, BTC/ZAR and Bonds move in opposite directions. When BTC/ZAR appreciates, Bond prices tend to fall, and vice versa. The direction of the arrow indicates that fluctuations in BTC/ZAR lead to changes in Bond prices. This suggests that movements in Bitcoin can be predictive of future changes in the Bond market, indicating market integration. A negative correlation often reflects shifts in market sentiment and risk appetite. Typically, Bitcoin is regarded as a riskier, more speculative asset, while Bonds are viewed as safer investments. This finding is supported by (Maghyereh and Abdoh 2022). When investors are risk-seeking, they may prefer Bitcoin over Bonds, and vice versa. Figure 3c shows the plot of the wavelet coherence between BTC/ZAR and Gold, presenting a negative relationship between the two variables in the higher frequency over the medium term (16-32 days) covering 2016, with BTC/ZAR lagging behind the Gold market as indicated by the downward right-pointing arrows. We observe a similar movement in the long term at (64-128 days) covering the periods of 2017-2018 and in 2020, which aligns with the findings of (Kang et al., 2019; Bhuiyan et al., 2023), though differences are noted in both domains. The long term at (256-512 days) in the higher frequency exhibited a downward left-pointing arrow during the 2019-2021 periods, implying that BTC/ZAR is leading Gold. This relationship suggests diversification benefits, potential hedging strategies, and insights into market sentiment and macroeconomic impacts. Investors can use this information to make more informed decisions regarding asset allocation and risk management.
Figure 3d illustrates the wavelet coherence between USD/ZAR and ALSI. Over the long term, throughout the entire sample period, there is an anti-phase association between USD/ZAR and ALSI, indicating that these two variables move in opposite directions, except during the 2015-2016 period. When one asset rises, the other tends to fall, and vice versa. A strengthening USD/ZAR typically coincides with a declining ALSI, while a weakening USD coincides with a rising ALSI. This relationship offers valuable insights for risk management, investment strategies, and understanding the broader economic context. With this knowledge, investors may determine the best ways to allocate their assets and devise hedging strategies in response to currency and equity market movements. In the long term, at (64-128 days), a downward left-pointing arrow covers the 2017-2018 periods, implying that ALSI negatively influences USD/ZAR. When USD/ZAR appreciates, the ALSI market tends to decline, and vice versa. The same result is noted at 512-1024 days during the 2015-2016 period. In the medium term, at 32-64 days in 2020, USD/ZAR leads ALSI. Figure 3e presents a plot of WTC for USD/ZAR and Bond in the long term. At (64-128 days), the relationship is in phase during the 2012-2013 period. In the 2018-2019 period, the USD/ZAR lags behind Bond; this same movement is observed in the long term from 2016 to 2020 at 512-1024 days. This suggests that the Bond market may drive USD/ZAR movements, with investors responding first to signals from the Bond market, while the USD/ZAR exchange rate is only affected subsequently. This may be due to changes in risk sentiment, capital flows, or interest rate expectations occurring within the Bond market before impacting currency valuation. If demand for the local currency rises, investors purchasing South African Bonds may strengthen the Rand (lower USD/ZAR), and vice versa. Lastly, in the 2014-2015 period at 64-128 days, a confusing scenario is observed where the direction of the arrows is not clearly defined.
Figure 3f exhibits the WTC plot of USD/ZAR and Gold, showing several significant areas with no clear direction in the short and medium terms. From the period covering 2010-2014, at (128-256 days) in the long term, the co-movement between the two series is not clear as the arrows are showing left upward and straight upward. Giving a confusing movement. The period 2012-2020 is covered by the long term (512-1024 days), the arrows are pointing left downward, USD/ZAR leads Gold, implying that the Gold price negatively affects the exchange rate USD/ZAR. Gold may be less in demand as a safe-haven asset by investors if the USD/ZAR is rising. One of the main producers of Gold is South Africa. Because of increased export earnings, rising Gold prices may be associated with a lower USD/ZAR. Falling Gold prices may be accompanied by a higher USD/ZAR, which would lower mining profits and have an effect on the local economy. In the short term, at 16-32 days covering the year 2010 USD/ZAR lagged Gold.
Figure 3g presents the graph of the WTC showing a substantial level at 5% in the long term at (64-128 days) covering the year 2015. An in-phase relationship between GBP/ZAR and ALSI means that these two variables move together in the same direction over time. When one rises, the other also rises, and when one falls, the other falls. This relationship suggests that similar economic factors and investor sentiments influence both the forex and equity markets in South Africa. In the medium term, at 32-64 days, there is a positive co-movement covering the 2018 year, implying the GBP/ZAR exchange rate influences the ALSI market, with the arrows showing right and up. Figure 3h showed several cones of influence in different areas covering the long term (64-128 days) in the period 2010, where GBP/ZAR influence negatively the Bond market, and in 2018, the GBP/ZAR leads the Bond market. In the medium term, at 32-64 days, the left-upward direction indicates that GBP/ZAR lags the Bond prices, meaning changes in the exchange rate tend to precede changes in Bond prices. Movements in the GBP/ZAR exchange rate can be used as a leading indicator for Bond market movements.
In 2019, the Bond market led negatively to the exchange rate. In the long term, at 512-1024 days covering the periods 2016-2020, GBP/ZAR is lagging the Bond market. Left-downward arrows indicate a negative correlation where GBP/ZAR and Bond prices move in opposite directions. Implies that the market of Bonds is influenced first before influencing the change in GBP/ZAR. It indicates that Bond prices lead the exchange rate, meaning changes in Bond prices tend to precede changes in the GBP/ZAR exchange rate. For instance, if Bond prices rise, the GBP/ZAR exchange rate is likely to follow with a decrease (meaning the Rand strengthens against the Pound), and vice versa. Figure 3i exhibits the WTC plot between GBP/ZAR and Gold. The short term showed certain significant areas in the frequency domain with no discernible direction of the relationship between GBP/ZAR and Gold. The long-term covering (64-128 days) in 2018, there is a cone of influence indicating the significance at the 5% level. Straight upward arrows indicate a positive correlation between GBP/ZAR and Gold. This means that when the British Pound strengthens against the South African Rand, the price of Gold also tends to rise, and vice versa. Investors can expect that movements in the GBP/ZAR exchange rate are directly related to movements in Gold prices. In the medium term, at 32-64 days in 2016, GBP/ZAR is lagging Gold, implying the influence of GBP/ZAR first before influencing Gold. The long-term (256-512 days), including the periods 2011-2013, with arrows pointing right-upward movements in the GBP/ZAR exchange rate, can be used as a leading indicator for Gold market movements. If the Pound strengthens against the Rand (GBP/ZAR increases), Gold prices are likely to follow with an increase, and vice versa.
Figure 3j exhibits the WTC between EUR/ZAR and ALSI. This graph shows an important zone, in the first episode, covering the short term we discover the 5% significance level in 2010 (16-32 days), ALSI is negatively correlated with EUR/ZAR. We observe several significant zones at different periods without a clear direction of their relationship between EUR/ZAR and ALSI. The second episode is seen over a long-term period (128-256 days) in 2013-2014, showing a confusing relationship between the two assets. In the period covering 2014-2015, at (64-128 days), EUR/ZAR is lagging the ALSI. The long-term (512-1024 days) in 2016-2017 shows in phase relationship with two series, meaning that these two variables move together in the same direction over time. When one rises, the other also rises, and when one falls, the other falls. An in-phase relationship suggests that similar economic factors and investor sentiments influence both the EUR/ZAR exchange rate and the ALSI. In the long term, covering respectively the periods 2018-2020 at 512-1024 days and 2020 at 128-256 days, the arrows are pointing right-upward, implying the EUR/ZAR influences positively ALSI. Figure 3k presents the WTC between EUR/ZAR and Bond. Several significant zones in the short and medium terms imply that EUR/ZAR and Bond are related, but the direction of their relationship is not defined. In contrast, the relationship is positive in the medium term (32–64 days) for 2013 and 2015, suggesting that EUR/ZAR leads the Bond market. In the long term (512-1024 days), covering the period 2013-2018, a confusing movement was observed. It indicates complex lead-lag relationships and correlations between the two variables. Right-upward arrows suggest a positive correlation with the EUR/ZAR leading Bond, while left-upward arrows suggest a negative correlation with the EUR/ZAR still leading Bond inversely. This mixed dynamic highlights the need for investors to consider changing market conditions and external factors when making investment decisions, as the leading and lagging roles can switch over time and across different frequencies. Figure 3l presents the WTC between EUZ/ZAR and Gold. In the short-term (16-32 days) and medium term (32-64 days, we observe several zones of significant cone of influence in different periods. The high frequency at a 5% significance level shows that EUR/ZAR and Gold are significantly related, but the direction of influence is unclear, meaning that (leading-lagging behaviour is uncertain. In the long term, at 64-128 days in 2011-2012, EUR/ZAR leads Gold. The negative correlation might reflect different market sentiments or economic conditions. At the same time scale, EUR/ZAR is lagging behind Gold in the year 2015. A strengthening Euro against the Rand in 2015 might have been associated with less demand for Gold, possibly due to increased confidence in the Eurozone and reduced need for Gold as a safe-haven.
Same notes as in Figure 3a-3f.
Same notes as in Figure 3a-3f.
The overall findings demonstrated that the Bitcoin exchange rate and the South African traditional assets (ALSI, Bond, and Gold), as well as the traditional currency pairs and the South African traditional financial assets, are integrated on different horizons in the frequency domain and time scale. The integration of Bitcoin exchange rate and traditional financial assets in wavelet coherence shows how synchronised BTC/ZAR and each of these assets (ALSI, Gold, and Bond) are time-varying and across different frequencies, with the arrows indicating the nature and direction of their relationship. The results confirm that there is some level of integration and varying degrees of co-movement between BTC/ZAR and South African traditional financial assets, but the nature and strength of these relationships can depend heavily on the period and market conditions considered. The long-term and medium-term integration is present through the persistence of high coherence areas between BTC/ZAR and ALSI, BTC/ZAR and Bond, and BTC/ZAR and Gold.
5. Conclusion and Policy Recommendations
This study applied TVP-VAR and Wavelet analysis to investigate new understandings into the integration and dynamic assymmetric volatility risk spillover of the exchange rate of Bitcoin (BTC/ZAR) against South African traditional financial assets, as well as forex and South African traditional financial assets. Our empirical analysis has provided significant insights into the interconnectedness and asymmetric risk transmission across various financial assets in South Africa, including exchange rate BTC/ZAR, currency pairs (USD/ZAR, GBP/ZAR, and EUR/ZAR), and traditional financial assets, exploring the multifaceted feeding mechanism and functional rules of the inter-market linkage. The study reveals notable differences in return characteristics, volatility, and the dynamic relationships among these assets. BTC/ZAR, characterised by its high returns and volatility, is consistent with its speculative nature, while traditional assets like Bonds show negative average returns but exhibit characteristics appealing to risk-averse investors. Gold and currency pairs (USD/ZAR, GBP/ZAR, EUR/ZAR) exhibit positive and significant returns, supporting their status as safe-haven or strong-performing assets.
The dynamic connectedness analysis shows a weak system-wide integration, with a total connectedness index of 28.37%, which indicates potential opportunities for diversification and reduced systemic risk. Currency exchange rates dominate the transmission of shocks, while traditional assets and Bitcoin primarily receive these shocks. Wavelet coherence analysis further confirms varying short-, medium-, and long-term relationships between BTC/ZAR and traditional assets, often marked by negative correlations, reflecting contrasting investor risk preferences. The varying levels of integration between BTC/ZAR, forex, and South African traditional assets over different frequencies and periods provide useful insights for portfolio diversification and risk management decisions. However, it is important to note that BTC/ZAR is extremely volatile and lacks the liquidity found in traditional assets such as stocks. Furthermore, the lack of regulation in cryptocurrency markets discourages institutional investors from participating in these new and contentious investment opportunities.
There is persistent volatility and a dynamic nature of these assets, highlighting the role of past returns and shocks in influencing current financial dynamics. Asymmetry in volatility responses to shocks is evident across all assets.
The connectedness analysis indicates a weak level of systemic risk within the network, with significant spillover effects primarily originating from forex markets (GBP/ZAR, USD/ZAR and EUR/ZAR.). These currencies act as key transmitters of shocks, influencing other assets, whereas traditional assets (ALSI, Gold, and Bond), and Bitcoin exchange rate are more likely to be receivers of these shocks, in contrast to the study of Mensi et al. (2019). The dynamic connectedness of traditional assets reveals interdependencies and risk transmission mechanisms. The total connectedness index (TCI) of all assets represents 28.37%, indicating the degree of overall connectedness among the assets. Lower connectedness reduces systemic risk, reducing the likelihood of widespread financial instability. GBP/ZAR, USD/ZAR and EUR/ZAR are the most influential. The spillover effect from EUR/ZAR to GBP/ZAR is the strongest (29.68%), while the weakest is from ALSI to GBP/ZAR (0.31%).
There is higher spillover from BTC/ZAR to ALSI and Gold compared to the spillover from currency pairs (USD/ZAR, GBP/ZAR, and EUR/ZAR) to ALSI and Gold. This higher spillover is due to the high volatility and speculative nature of cryptocurrencies, as well as emerging asset class dynamics. Forex markets, particularly for major currencies like USD, GBP, and EUR, are more stable due to central bank interventions and well-established monetary policies, reducing the likelihood of significant spillover effects. The wavelet coherence analysis further underscores the complex relationships between the Bitcoin market and traditional assets, with periods of synchronised movements that can have profound implications for diversification and risk management strategies.
In general, this study has laid a solid foundation for understanding the financial dynamics in South Africa, offering valuable insights for investors, policymakers, and researchers interested in the intricate linkages between BTC/ZAR, forex and traditional financial assets, allowing for more targeted policy measures. There is evidence of a strengthen integration between BTC/ZAR and each of traditional assets (ALSI, Bond, Gold) and between currency pairs (USD/ZAR, GBP/ZAR, and EUR/ZAR and each of traditional financial assets, which means these assets are statistically significant at 5% level in different time scales and frequencies at short-, medium-, and long-run horizons. Future research could explore structural breaks and regime shifts to better understand these relationships under different market conditions.
| 1 | USD/ZAR, GBP/ZAR, and EUR/ZAR |
| 2 | All share index (ALSI), bonds, and gold |
| 3 | ALSI, Bond, Gold, USD/ZAR, EUR/ZAR, GBP/ZAR |
References
- (Adelowotan, 2024) Adelowotan, M. (2024). Exploring the development of regulatory framework for crypto assets in South Africa. The Business and Management Review, 15, p.75. [CrossRef]
- (Akhtaruzzaman et al., 2022) Akhtaruzzaman, M., Boubaker, S., Nguyen, D.K. and Rahman, M.R. (2022). Systemic risk-sharing framework of cryptocurrencies in the COVID–19 crisis. Finance Research Letters, 47, p.102787. [CrossRef]
- (Alvarez-Ramirez & Rodriguez, 2021) Alvarez-Ramirez, J. and Rodriguez, E. (2021). A singular value decomposition approach for testing the efficiency of Bitcoin and Ethereum markets. Economics Letters, 206, p.109997. [CrossRef]
- (Andrada-Félix et al., 2020) Andrada-Félix, J., Fernandez-Perez, A. and Sosvilla-Rivero, S. (2020). Distant or close cousins: Connectedness between cryptocurrencies and traditional currencies' volatilities. Journal of International Financial Markets, Institutions and Money, 67, p.101219. [CrossRef]
- (Antonakakis et al., 2020) Antonakakis, N., Chatziantoniou, I. and Gabauer, D. (2020). Refined measures of dynamic connectedness based on time-varying parameter vector autoregressions. Journal of Risk and Financial Management, 13(4), p.84. [CrossRef]
- (Arouri et al., 2011) Arouri, M. E. H., Jouini, J. & Nguyen, D. K., (2011). Volatility spillovers between oil prices and stock sector returns: Implications for portfolio management. Journal of International Money and Finance, Volume 30, p. 1387–1405. [CrossRef]
- (Baur & Dimpfl, 2021) Baur, D.G. and Dimpfl, T. (2021). The volatility of Bitcoin and its role as a medium of exchange and a store of value. Empirical Economics, 61(5), pp.2663-2683. [CrossRef]
- (Bhuiyan et al., 2023) Bhuiyan, R.A., Husain, A. and Zhang, C. (2023). Diversification evidence of Bitcoin and Gold from wavelet analysis. Financial Innovation, 9(1), p.100. [CrossRef]
- (Bloomfield et al., 2004) Bloomfield, D. Shaun, RT James McAteer, Bruce W. Lites, Philip G. Judge, Mihalis Mathioudakis, and Francis P. Keenan. (2004). Wavelet Phase Coherence Analysis: Application to a Quiet-Sun Magnetic. The Astrophysical Journal 617: 623–32.
- (Bonga-Bonga & Khalique, 2023) Bonga-Bonga, L. and Khalique, M. (2023). The dynamic relationship between digital currency and other financial markets in developed and emerging markets. Available at SSRN 4790892.
- (Bouri et al., 2020) Bouri, E., Shahzad, S.J.H. and Roubaud, D. (2020). Cryptocurrencies as hedges and safe-havens for US equity sectors. The Quarterly Review of Economics and Finance, 75, pp.294-307. [CrossRef]
- (Chang et al., 2013) Chang, C.-L., McAleer, M. & Tansuchat, R. (2013). Conditional correlations and volatility spillovers between crude oil and stock index returns. The North American Journal of Economics and Finance, Volume 25, pp. 116-138. [CrossRef]
- (Chatziantoniou & Gabauer, 2021) Chatziantoniou, I. and Gabauer, D. (2021). EMU risk-synchronisation and financial fragility through the prism of dynamic connectedness. The Quarterly Review of Economics and Finance, 79, pp.1-14. [CrossRef]
- (Chen & Sun, 2024) Chen, B.X. and Sun, Y.L. (2024). Risk characteristics and connectedness in cryptocurrency markets: New evidence from a non-linear framework. The North American Journal of Economics and Finance, 69, p.102036. [CrossRef]
- (Corbet et al., 2020) Corbet, S., Larkin, C. and Lucey, B. (2020). The contagion effects of the COVID-19 pandemic: Evidence from Gold and cryptocurrencies. Finance Research Letters, 35, p.101554. [CrossRef]
- (Diebold & Yilmaz, 2012) Diebold, F.X. and Yilmaz, K. (2012). Better to give than to receive: Predictive directional measurement of volatility spillovers. International Journal of Forecasting, 28(1), pp.57-66. [CrossRef]
- (Diebold & Yilmaz, 2014) Diebold, F.X. and Yılmaz, K. (2014). On the network topology of variance decompositions: Measuring the connectedness of financial firms. Journal of Econometrics, 182(1), pp.119-134. [CrossRef]
- (Engle & Granger, 1987) Engle, R.F. and Granger, C.W. (1987). Co-integration and error correction: representation, estimation, and testing. Econometrica: journal of the Econometric Society, pp.251-276. [CrossRef]
- (Gajardo et al., 2018) Gajardo, G., Kristjanpoller, W.D. and Minutolo, M., (2018). Does Bitcoin exhibit the same asymmetric multifractal cross-correlations with crude oil, Gold and DJIA as the Euro, Great British Pound and Yen?. Chaos, Solitons & Fractals, 109, pp.195-205. [CrossRef]
- (Giannellis, 2022) Giannellis, N. (2022). Cryptocurrency market connectedness in Covid-19 days and the role of Twitter: Evidence from a smooth transition regression model. Research in International Business and Finance, 63, p.101801. [CrossRef]
- (Gil-Alana et al., 2020) Gil-Alana, L.A., Abacha, E.J.A. and Rojo, M.F.R. (2020). Cryptocurrencies and stock market indices. Are they related?. Research in International Business and Finance, 51, p.101063.
- (Gopane, 2022) Gopane, T.J. (2022). Volatility behaviour of Bitcoin as a digital asset: evidence of shock transmission dynamics from the South African financial markets. Journal of Telecommunications and the Digital Economy, 10(2), pp.195-213.
- (Granger & Joyeux, 1980) Granger, C.W. and Joyeux, R., (1980). An introduction to long-memory time series models and fractional differencing. Journal of time series analysis, 1(1), pp.15-29. [CrossRef]
- (Granger, 1980) Granger, C.W. (1980). Long memory relationships and the aggregation of dynamic models. Journal of Econometrics, 14(2), pp.227-238.
- (Greeff, 2019) Greeff, C. (2019). An investigation into the output tax consequences of Bitcoin transactions for a South African value-added tax vendor. South African Journal of Economic and Management Sciences, 22(1), pp.1-9. [CrossRef]
- (Grubel, 1968) Grubel, H.G. (1968). Internationally diversified portfolios: welfare gains and capital flows. The American Economic Review, pp.1299-1314.
- (Harwick, 2016) Harwick, C. (2016). Cryptocurrency and the problem of intermediation. The Independent Review, 20(4), pp.569-588.
- (Hoque et al., 2023) Hoque, M.E., Soo-Wah, L., Tiwari, A.K. and Akhter, T. (2023). Time and frequency domain connectedness and spillover among categorical and regional financial stress, Gold and Bitcoin market. Resources Policy, 85, p.103786. [CrossRef]
- (Hosking, 1981) Hosking, J.R.M., (1981). Equivalent forms of the multivariate portmanteau statistic. Journal of the Royal Statistical Society Series B: Statistical Methodology, 43(2), pp.261-262.
- (Hsu et al., 2021) Hsu, S.H., Sheu, C. and Yoon, J. (2021). Risk spillovers between cryptocurrencies and traditional currencies and Gold under different global economic conditions. The North American Journal of Economics and Finance, 57, p.101443. [CrossRef]
- (Hung, 2022) Hung, N.T. (2022). Asymmetric connectedness among S&P 500, crude oil, Gold and Bitcoin. Managerial Finance, 48(4), pp.587-610.
- (Ibrahim et al., 2024) Ibrahim, B.A., Elamer, A.A., Alasker, T.H., Mohamed, M.A. and Abdou, H.A. (2024). Volatility contagion between cryptocurrencies, Gold and stock markets pre-and-during COVID-19: evidence using DCC-GARCH and cascade-correlation network. Financial Innovation, 10(1), p.104. [CrossRef]
- (Jankeeparsad & Tewari, 2022) Jankeeparsad, R.W. and Tewari, D. (2022). Bitcoin: an exploratory study investigating adoption in South Africa. Interdisciplinary Journal of Information, Knowledge & Management, 17. [CrossRef]
- (Jeleskovic et al., 2023) Jeleskovic, V., Latini, C., Younas, Z.I. and Al-Faryan, M.A. (2023). Optimization of portfolios with cryptocurrencies: Markowitz and GARCH-Copula model approach. arXiv preprint arXiv:2401.00507.
- (Jeribi & Fakhfekh, 2021) Jeribi, A. and Fakhfekh, M. (2021). Portfolio management and dependence structure between cryptocurrencies and traditional assets: evidence from FIEGARCH-EVT-Copula. Journal of Asset Management, 22(3), pp.224-239. [CrossRef]
- (Ji et al., 2019) Ji, Q., Bouri, E., Lau, C.K.M. and Roubaud, D. (2019). Dynamic connectedness and integration in cryptocurrency markets. International Review of Financial Analysis, 63, pp.257-272. [CrossRef]
- (Kang et al., 2019) Kang, S.H., McIver, R.P. and Hernandez, J.A. (2019). Co-movements between Bitcoin and Gold: A wavelet coherence analysis. Physica A: Statistical Mechanics and its Applications, 536, p.120888. [CrossRef]
- (Katsiampa et al., 2019) Katsiampa, P., Corbet, S. and Lucey, B. (2019). High frequency volatility co-movements in cryptocurrency markets. Journal of International Financial Markets, Institutions and Money, 62, pp.35-52. [CrossRef]
- (Koop et al., 1996) Koop, G., Pesaran, M.H. and Potter, S.M. (1996). Impulse response analysis in nonlinear multivariate models. Journal of econometrics, 74(1), pp.119-147. [CrossRef]
- (Koutmos et al., 2021) Koutmos, D., King, T. and Zopounidis, C. (2021). Hedging uncertainty with cryptocurrencies: Is Bitcoin your best bet?. Journal of Financial Research, 44(4), pp.815-837. [CrossRef]
- (Kumah & Odei-Mensah, 2021) Kumah, S.P. and Odei-Mensah, J. (2021). Are Cryptocurrencies and African stock markets integrated?. The Quarterly Review of Economics and Finance, 81, pp.330-341. [CrossRef]
- (Kumah et al., 2022) Kumah, S.P., Odei-Mensah, J. and Baaba Amanamah, R. (2022). Co-movement of cryptocurrencies and African stock returns: A multiresolution analysis. Cogent Business & Management, 9(1), p.2124595. [CrossRef]
- (Li et al., 2020) Li, Z., Wang, Y. and Huang, Z. (2020). Risk connectedness heterogeneity in the cryptocurrency markets. Frontiers in Physics, 8, p.243. [CrossRef]
- (Lose & Kalitanyi, 2025) Lose, A. and Kalitanyi, V. (2025). Regulating and Monitoring Challenges in Compliance of Cryptocurrencies in South Africa. The Journal of Developing Areas, 59(2), pp.291-299. [CrossRef]
- (Maghyereh & Abdoh, 2022) Maghyereh, A. and Abdoh, H. (2022). COVID-19 and the volatility interlinkage between Bitcoin and financial assets. Empirical Economics, 63(6), pp.2875-2901. [CrossRef]
- (Maiti et al., 2020) Maiti, M., Vukovic, D., Krakovich, V. and Pandey, M.K. (2020). How integrated are cryptocurrencies. International Journal of Big Data Management, 1(1), pp.64-80.
- (Mariana et al., 2021) Mariana, C.D., Ekaputra, I.A. and Husodo, Z.A. (2021). Are Bitcoin and Ethereum safe-havens for stocks during the COVID-19 pandemic?. Finance research letters, 38, p.101798. [CrossRef]
- (Mensi et al., 2019) Mensi, W., Rehman, M.U., Al-Yahyaee, K.H., Al-Jarrah, I.M.W. and Kang, S.H. (2019). Time frequency analysis of the commonalities between Bitcoin and major Cryptocurrencies: Portfolio risk management implications. The North American Journal of Economics and Finance, 48, pp.283-294. [CrossRef]
- (Milne & Lawack, 2024) Milne, A. and Lawack, V. (2024). Digital assets in payments and transaction banking (No. 11073).
- (Milunovich, 2018) Milunovich, G. (2018). Cryptocurrencies, mainstream asset classes and risk factors: A study of connectedness. Australian Economic Review, 51(4), pp.551-563. [CrossRef]
- (Msomi & Nyandeni, 2025) Msomi, S. and Nyandeni, A. (2025). Spillover effects and hedging abilities of cryptocurrencies: a case of the South African market. International Journal of Blockchains and Cryptocurrencies, 6(1), pp.42-68.
- (Naeem et al., 2021) Naeem, M.A., Farid, S., Balli, F. and Hussain Shahzad, S.J. (2021). Hedging the downside risk of commodities through cryptocurrencies. Applied Economics Letters, 28(2), pp.153-160. [CrossRef]
- (Nakamoto, 2008) Nakamoto, S. (2008). A peer-to-peer electronic cash system. Bitcoin.–URL: https://Bitcoin. Org/Bitcoin. Pdf, 4(2), p.15.
- (Ndlovu & Chikobvu, 2023) Ndlovu, T. and Chikobvu, D. (2023). A Wavelet-Decomposed WD-ARMA-GARCH-EVT Model Approach to Comparing the Riskiness of the Bitcoin and South African Rand Exchange Rates. Data, 8(7), p.122. [CrossRef]
- (Nelson, 1991) Nelson, D.B. (1991). Conditional heteroskedasticity in asset returns: A new approach. Econometrica: Journal of the Econometric Society, pp.347-370.
- (Okonkwo et al., 2021) Okonkwo, C., Osu, B.O., Chighoub, F. and Oruh, B.I. (2021). The co-movement of Bitcoin and some African currencies–A wavelet analysis. Journal of Research in Emerging Markets. [CrossRef]
- (Pesaran & Shin, 1998) Pesaran, H.H. and Shin, Y., (1998). Generalized impulse response analysis in linear multivariate models. Economics Letters, 58(1), pp.17-29. [CrossRef]
- (Pukthuanthong & Roll, 2009) Pukthuanthong, K. and Roll, R. (2009). Global market integration: An alternative measure and its application. Journal of Financial Economics, 94(2), pp.214-232. [CrossRef]
- (Sebastião & Godinho, 2020) Sebastião, H. and Godinho, P. (2020). Bitcoin futures: An effective tool for hedging cryptocurrencies. Finance Research Letters, 33, p.101230. [CrossRef]
- (Shahzad et al., 2022) Shahzad, S.J.H., Balli, F., Naeem, M.A., Hasan, M. and Arif, M. (2022). Do conventional currencies hedge cryptocurrencies? The Quarterly Review of Economics and Finance, 85, pp.223-228.
- (Shahzad et al., 2019) Shahzad, S.J.H., Bouri, E., Roubaud, D., Kristoufek, L. and Lucey, B. (2019). Is Bitcoin a better safe-haven investment than Gold and commodities?. International Review of Financial Analysis, 63, pp.322-330. [CrossRef]
- (Shahzad et al., 2021) Shahzad, S.J.H., Naeem, M.A., Peng, Z. and Bouri, E. (2021). Asymmetric volatility spillover among Chinese sectors during COVID-19. International Review of Financial Analysis, 75, p.101754. [CrossRef]
- (Shahzad et al., 2023) Shahzad, U., Mohammed, K.S., Tiwari, S., Nakonieczny, J. and Nesterowicz, R. (2023). Connectedness between geopolitical risk, financial instability indices and precious metals markets: Novel findings from Russia Russia-Ukraine conflict perspective. Resources Policy, 80, p.103190.
- (Reddy & Lawack, 2019 ) Reddy, E. and Lawack, V. (2019). An overview of the regulatory developments in South Africa regarding the use of cryptocurrencies. SA Mercantile Law Journal, 31(1), pp.1-28.
- (Rehman et al., 2024) Rehman, S.U., Ahmad, T., Desheng, W.D. and Karamoozian, A. (2024). Analyzing selected cryptocurrencies' spillover effects on global financial indices: Comparing risk measures using conventional and eGARCH-EVT-Copula approaches. arXiv preprint arXiv: 2407.15766.
- ((Tiwari et al., 2013) Tiwari, A.K., Dar, A.B., Bhanja, N. and Shah, A. (2013). Stock market integration in Asian countries: Evidence from wavelet multiple correlations. Journal of Economic Integration, pp.441-456. [CrossRef]
- (Torrence & Webster, 1999) Torrence, Christopher, and Peter J. Webster. (1999). Interdecadal Changes in the ENSO–Monsoon System. Journal of Climate 12: 2679–90.
- (Urquhart & Zhang, 2019) Urquhart, A. and Zhang, H., 2(019). Is Bitcoin a hedge or safe haven for currencies? An intraday analysis. International Review of Financial Analysis, 63, pp.49-57. [CrossRef]
- (Wang & Wang, 2011) Wang, P. and Wang, P. (2011). Asymmetry in return reversals or asymmetry in volatilities?—New evidence from new markets. Quantitative finance, 11(2), pp. 271-285.
- (Wang et al., 2019) Wang, P., Zhang, W., Li, X. and Shen, D., 2019. Is cryptocurrency a hedge or a safe-haven for international indices? A comprehensive and dynamic perspective. Finance Research Letters, 31, pp.1-18. [CrossRef]
- (Wątorek et al., 2023) Wątorek, M., Kwapień, J. and Drożdż, S. (2023). Cryptocurrencies are becoming part of the world global financial market. Entropy, 25(2), p.377. [CrossRef]
- (Wiesen et al., 2018) Wiesen, T.F., Beaumont, P.M., Norrbin, S.C. and Srivastava, A. (2018). Are generalized spillover indices overstating connectedness?. Economics Letters, 173, pp.131-134. [CrossRef]
- (Wu , 2021) Wu, S. (2021). Co-movement and return spillover: Evidence from Bitcoin and traditional assets. SN Business & Economics, 1(10), p.122. [CrossRef]
- (Wu et al., 2019) Wu, S., Tong, M., Yang, Z. and Derbali, A. (2019). Does Gold or Bitcoin hedge economic policy uncertainty? Finance Research Letters, 31, pp.171-178.
- (Xu et al., 2021) Xu, Q., Zhang, Y. and Zhang, Z. (2021). Tail-risk spillovers in cryptocurrency markets. Finance Research Letters, 38, p.101453. [CrossRef]
- (Yi et al., 2018) Yi, S., Xu, Z. and Wang, G.J. (2018). Volatility connectedness in the cryptocurrency market: Is Bitcoin a dominant cryptocurrency? International Review of Financial Analysis, 60, pp.98-114.
- (Zeng & Ahmed, 2023) Zeng, H. and Ahmed, A.D. (2023). Market integration and volatility spillover across major East Asian stock and Bitcoin markets: an empirical assessment. International Journal of Managerial Finance, 19(4), pp.772-802. [CrossRef]
- (Zięba et al., 2019) Zięba, D., Kokoszczyński, R. and Śledziewska, K. (2019). Shock transmission in the cryptocurrency market. Is Bitcoin the most influential?. International Review of Financial Analysis, 64, pp.102-125. [CrossRef]
Figure 1.
Network Partial Directed Coherence (NPDC). Notes: This network diagram illustrates the volatility connectedness among seven variables. The size of each node reflects the magnitude of the Network Partial Directed Coherence. Arrows indicate the direction of the net pairwise connectedness.
Figure 1.
Network Partial Directed Coherence (NPDC). Notes: This network diagram illustrates the volatility connectedness among seven variables. The size of each node reflects the magnitude of the Network Partial Directed Coherence. Arrows indicate the direction of the net pairwise connectedness.
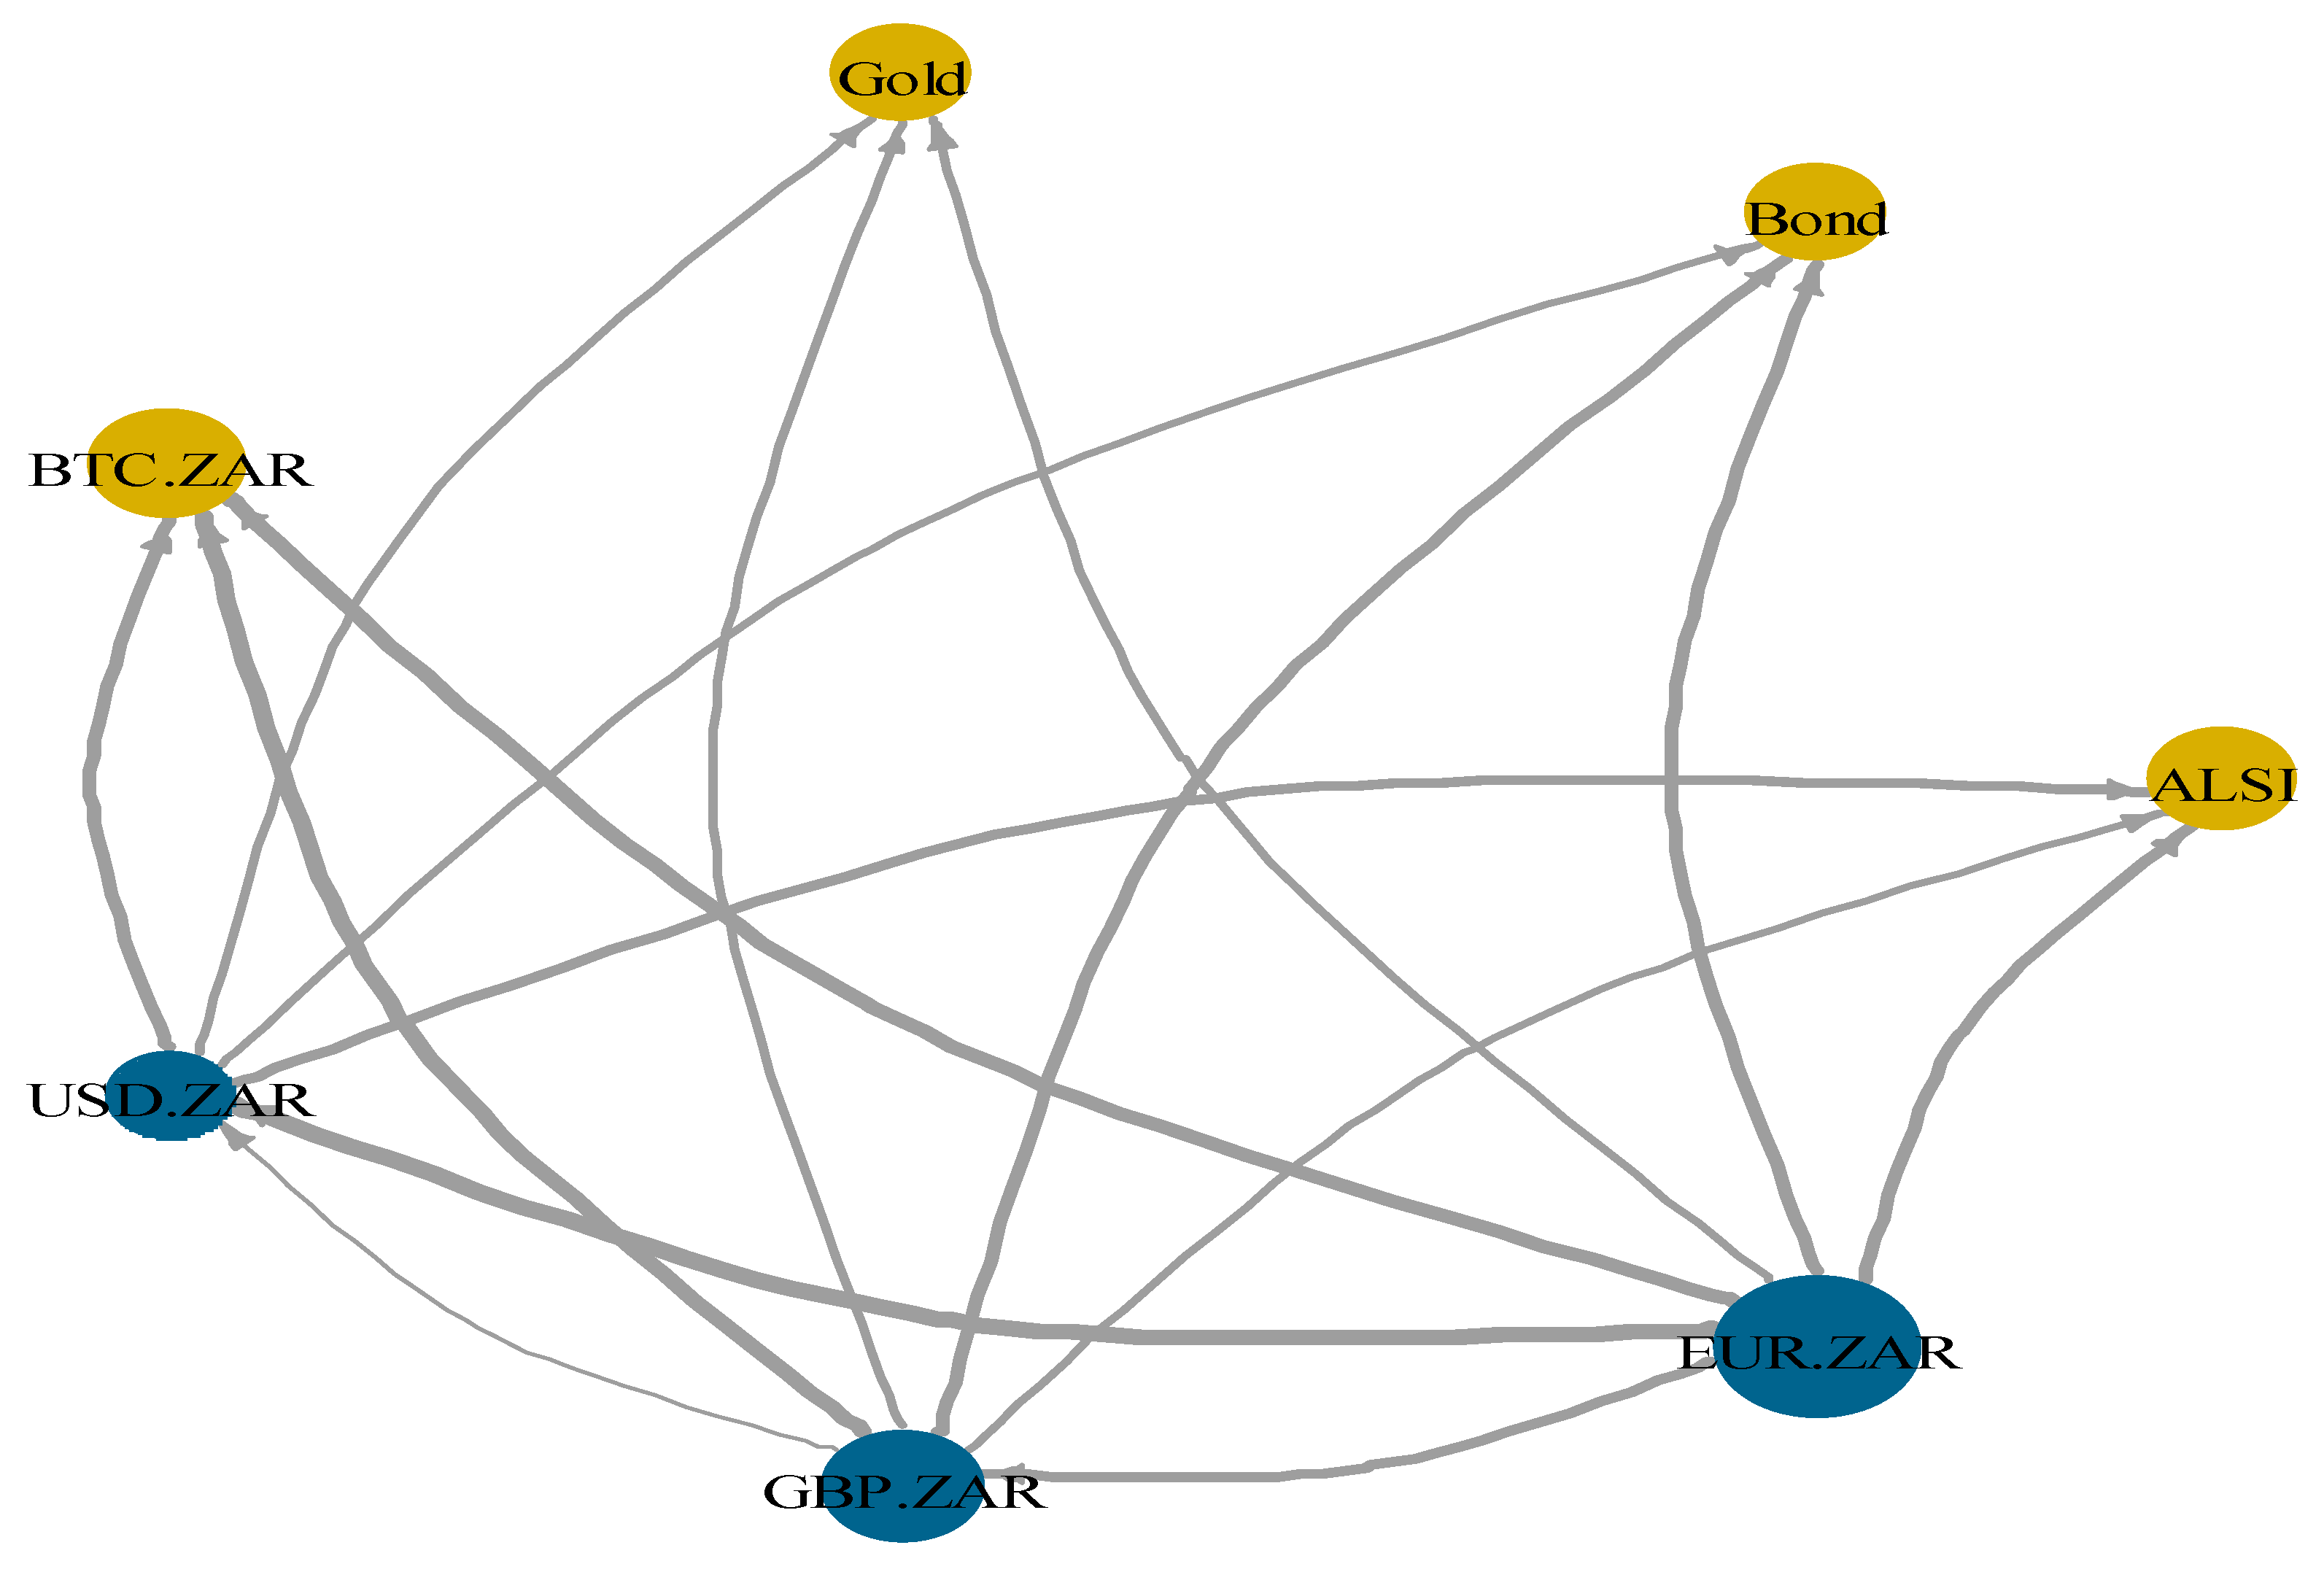
Figure 2.
Graph of the Pairwise Connectedness Index (PCI). Note: This network diagram illustrates the volatility connectedness among seven variables. The size of each node reflects the magnitude of net pairwise connectedness. Arrows indicate the direction of the net pairwise connectedness.
Figure 2.
Graph of the Pairwise Connectedness Index (PCI). Note: This network diagram illustrates the volatility connectedness among seven variables. The size of each node reflects the magnitude of net pairwise connectedness. Arrows indicate the direction of the net pairwise connectedness.
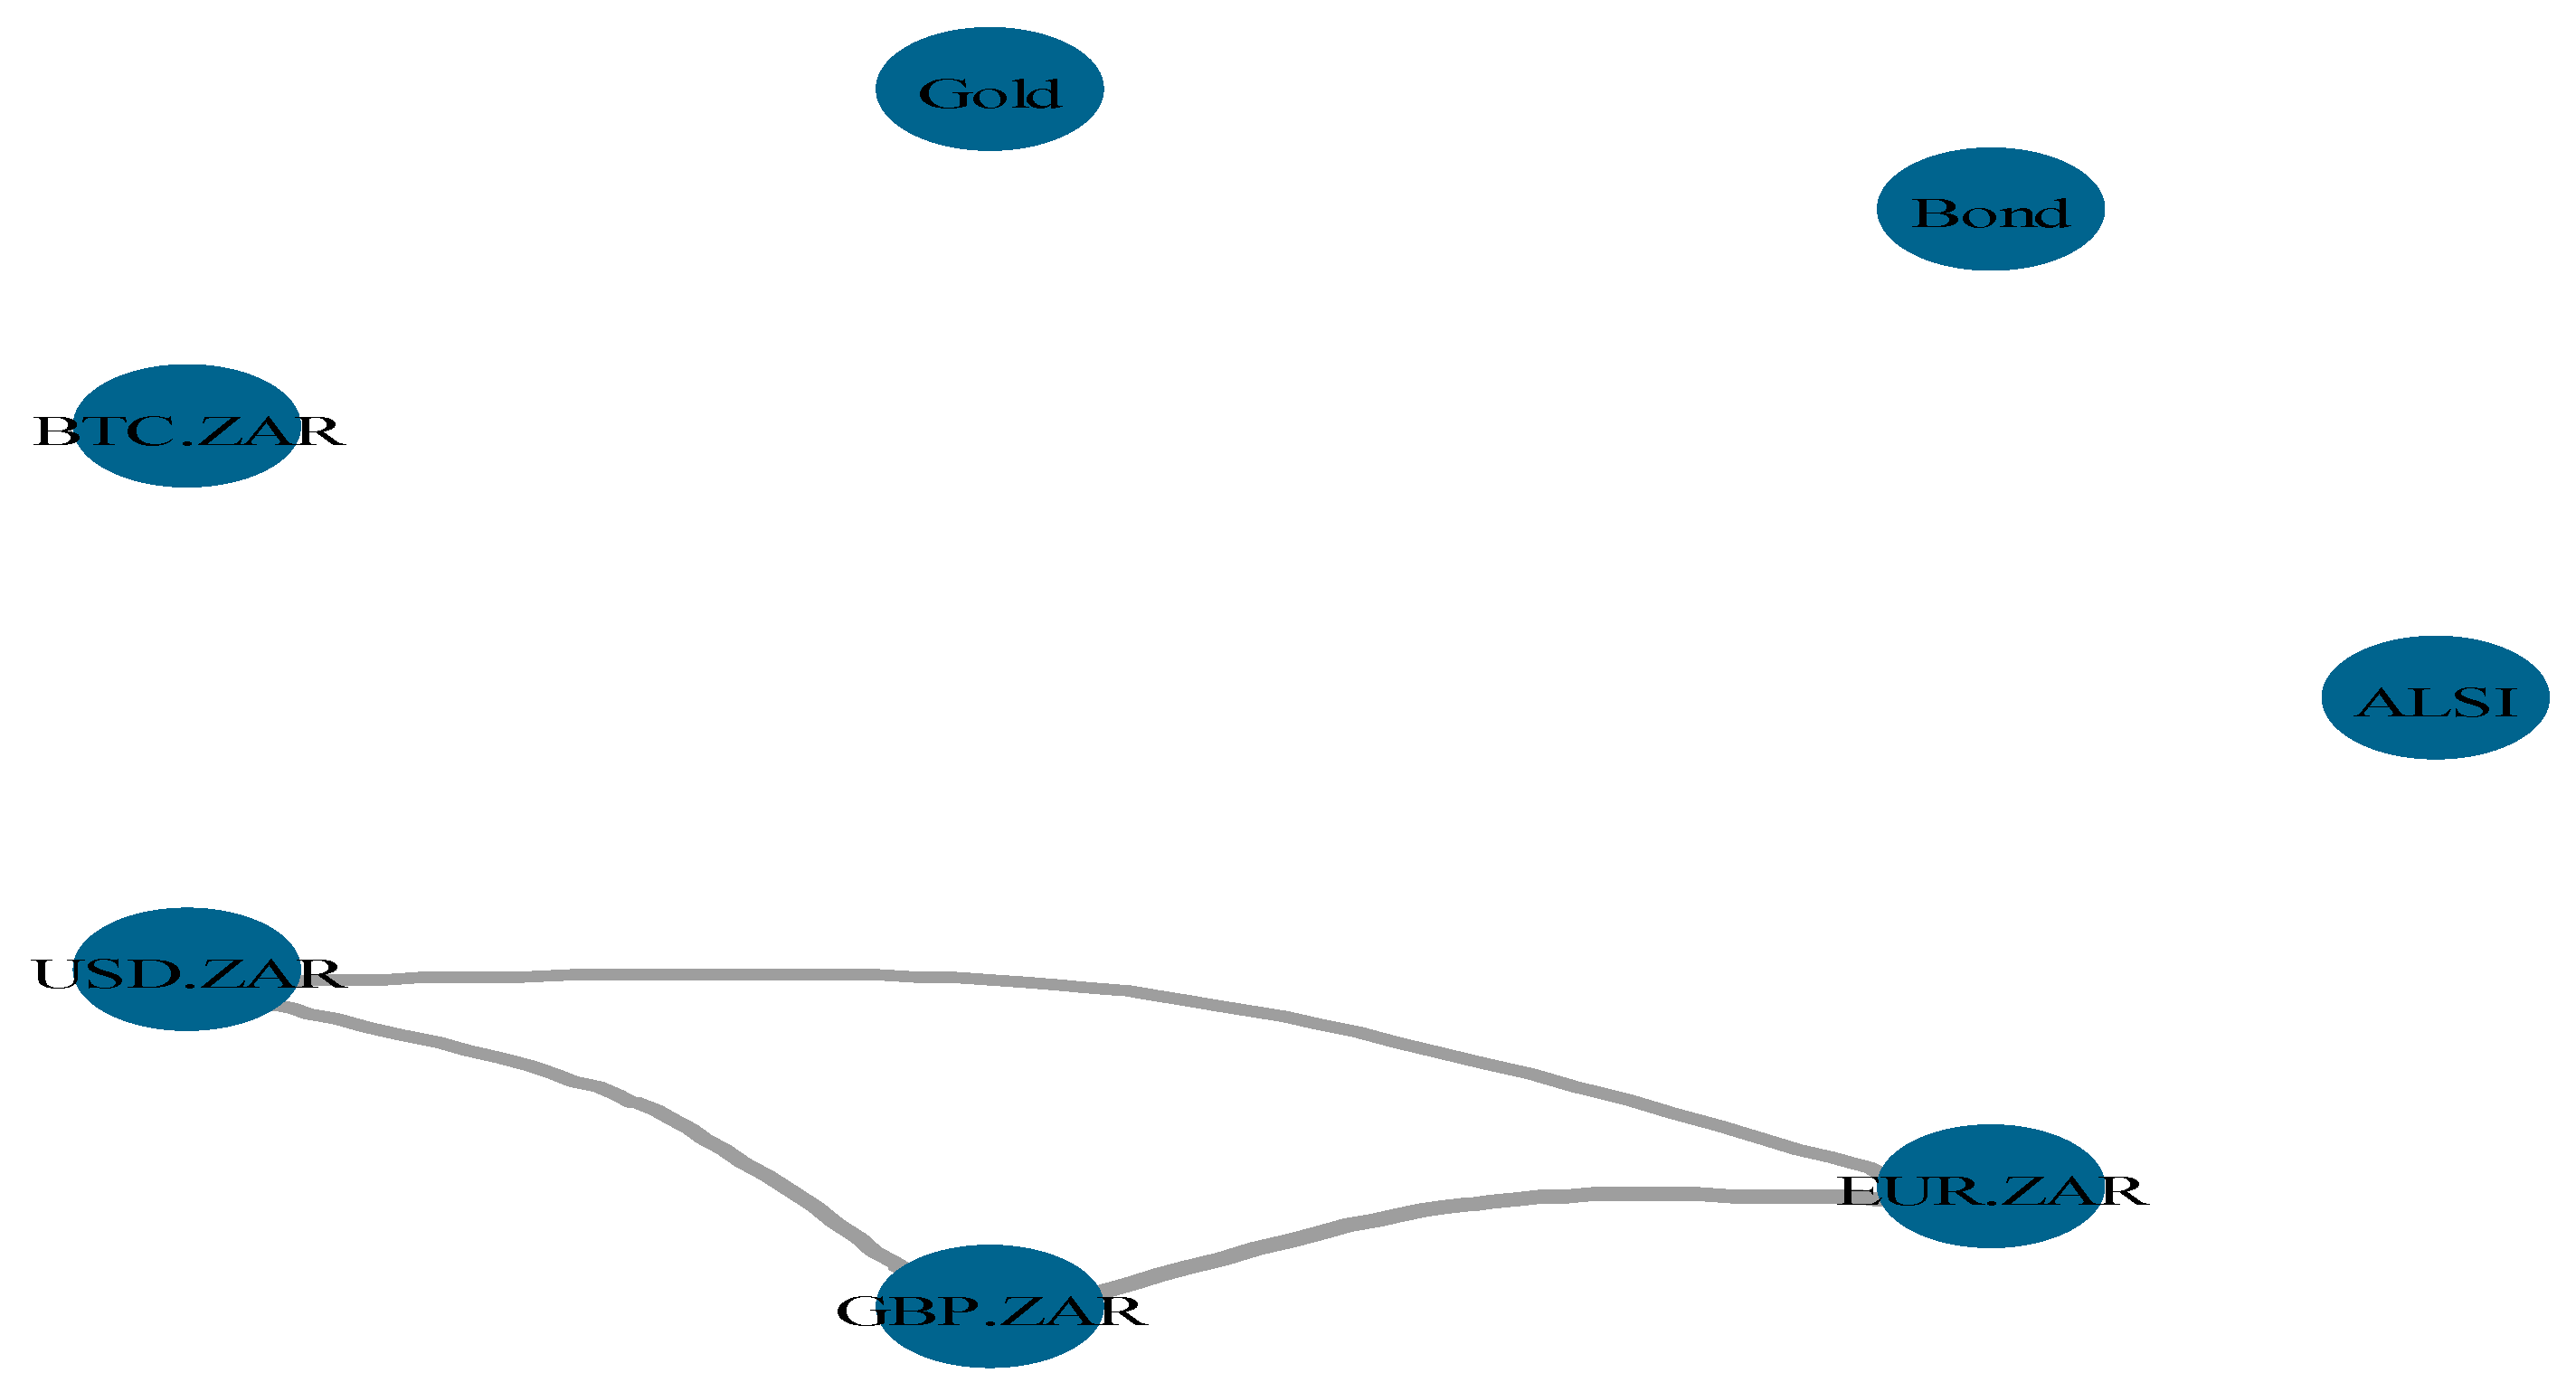
Figure 3.
Wavelet Transform Coherence for the exchange rate of Bitcoin, forex, Bond, Gold, and ALSI. Notes: Figure 3 describes the coherence represented by colors ranging from blue (low coherence) to yellow (high coherence). Thick black contour outlines the areas with a 5% significance level. The horizontal axis shows the period being studied, while the vertical axis shows the scale that corresponds to. The series can be identified as in-phase or out-of-phase by the arrows pointing to the right or left, respectively. The arrows showing upward and right indicate that the first variables are leading, whereas the arrows pointing right and downward indicate the first variable lagging. Arrows pointing to the left and upward indicate the first variable lagging. The arrows are pointing left and downward, implying the first variable leads.
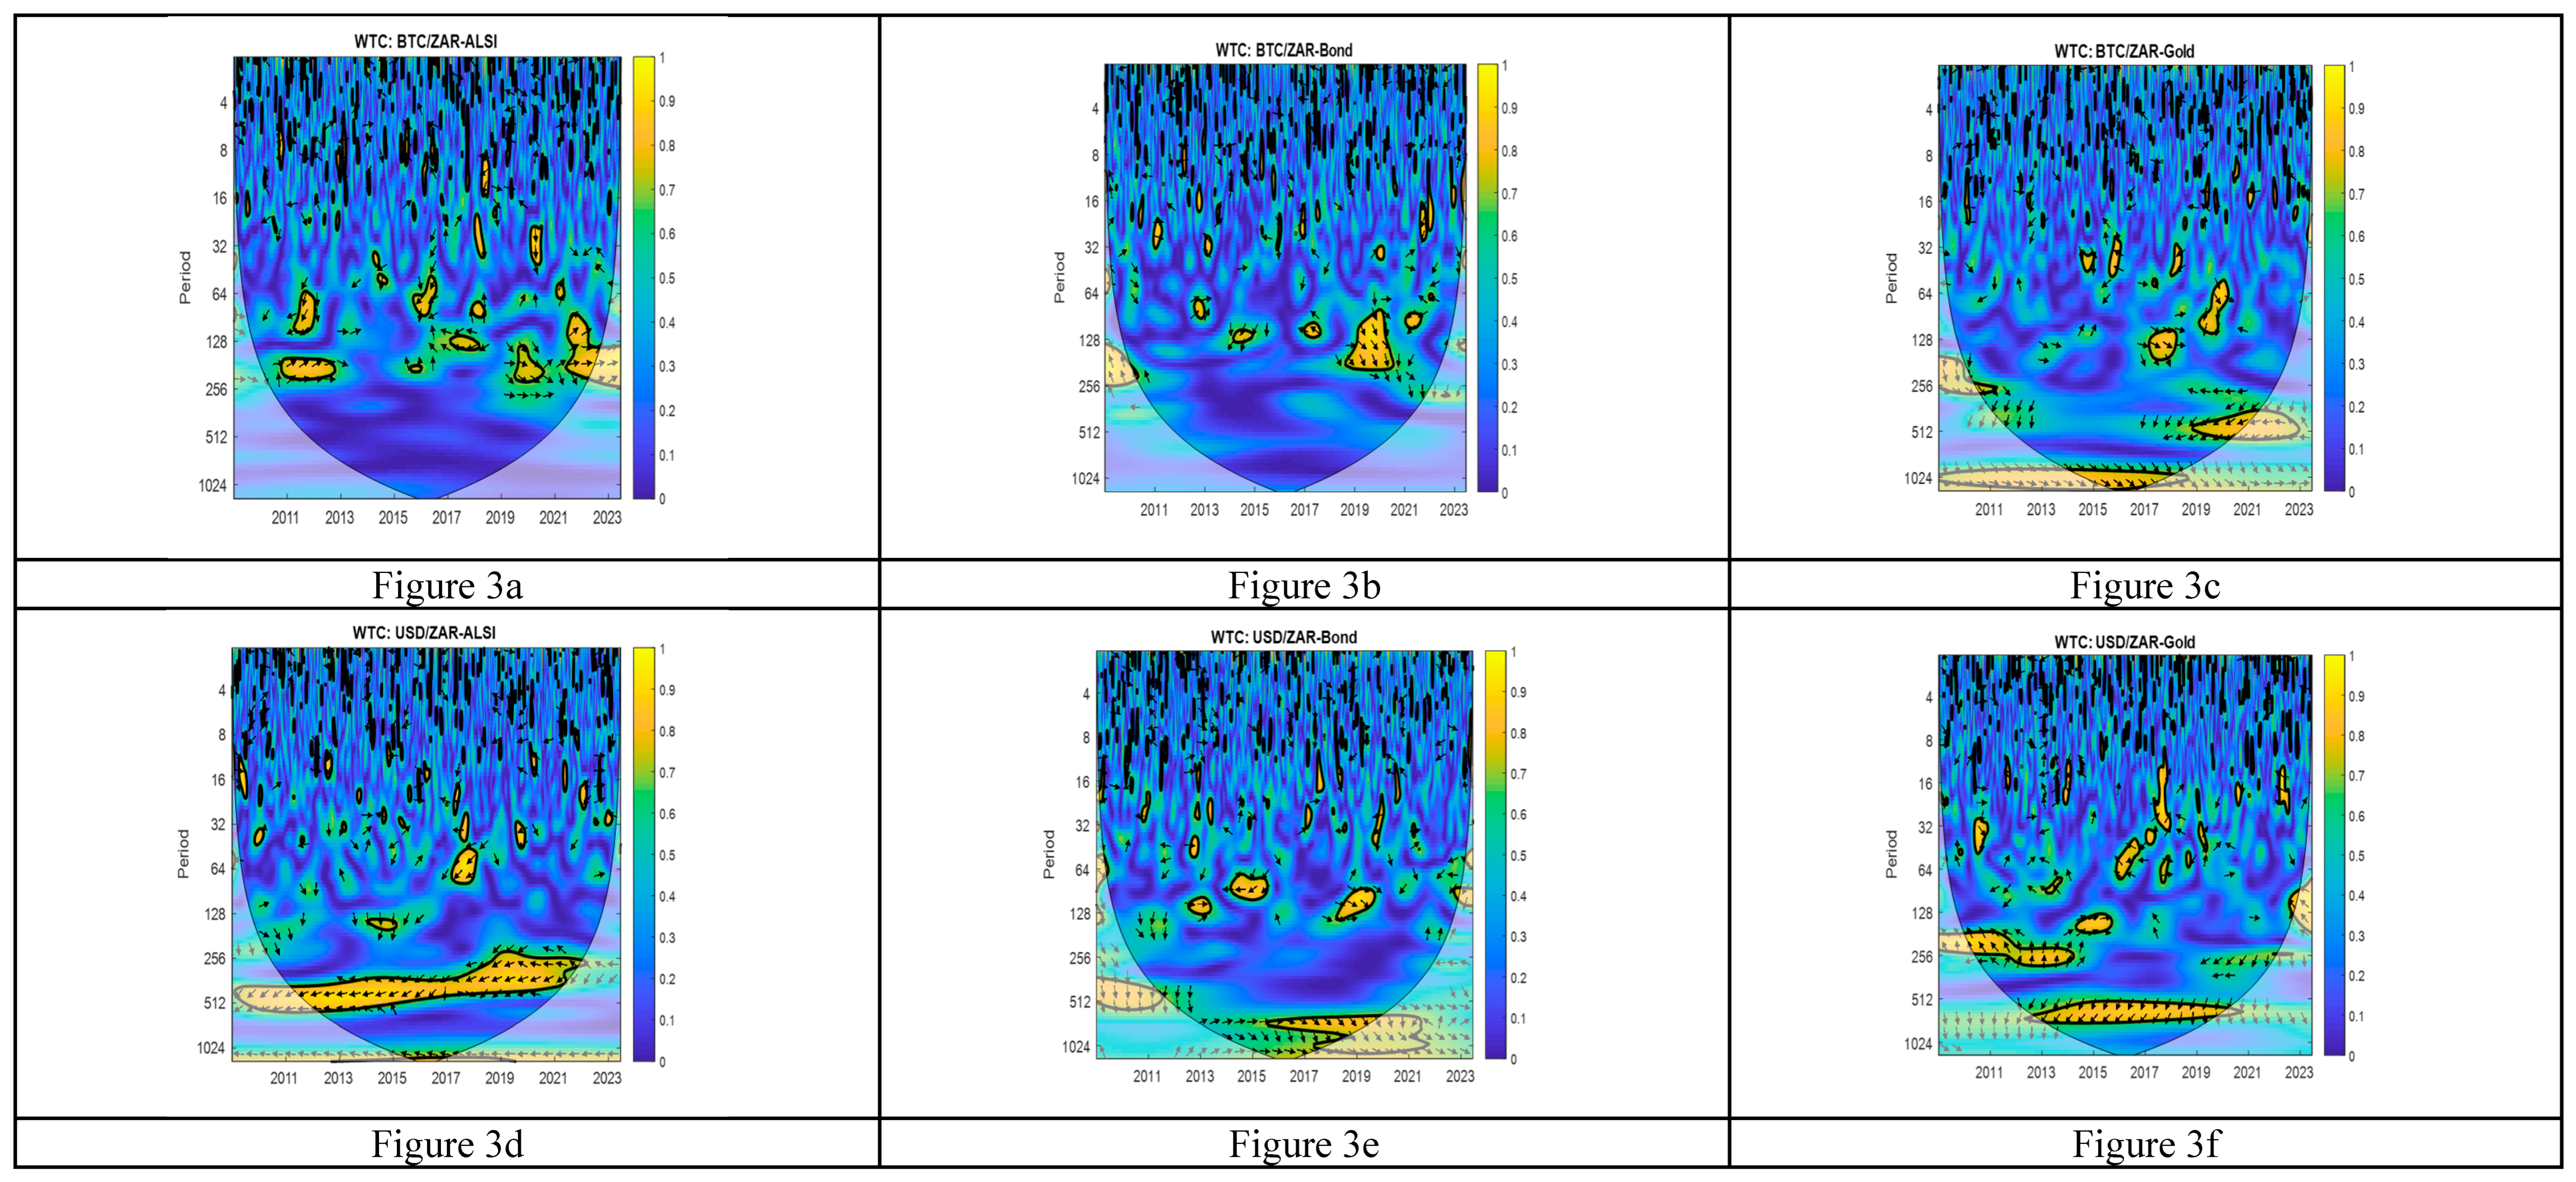

Table 1.
Descriptive statistics.
| ALSIr | Bondr | Goldr | BTC/ZARr | GBP/ZARr | USD/ZARr | EUR/ZARr | |
| Mean | 0.000323 | -1.22E-05 | 0.000230 | 0.002483 | 0.000177 | 0.000254 | 0.000177 |
| Median | 0.000479 | 0.000000 | 0.000307 | 0.001866 | -0.000207 | -0.000105 | -0.000154 |
| Std. Dev. | 0.010269 | 0.009241 | 0.009969 | 0.049487 | 0.008919 | 0.009580 | 0.008792 |
| Skewness | -0.119433 | 0.732539 | -0.307999 | -0.273970 | 0.214797 | 0.263403 | 0.372391 |
| Kurtosis | 4.571204 | 12.16870 | 6.593023 | 11.66077 | 4.247051 | 3.988566 | 4.783945 |
| Jarque-Bera | 380.1235 | 12974.84 | 2000.035 | 11334.03 | 261.8231 | 188.8456 | 562.4425 |
| Probability | 0.000000 | 0.000000 | 0.000000 | 0.000000 | 0.000000 | 0.000000 | 0.000000 |
Notes: Table 1 exhibits the descriptive statistics for the returns of all share index (ALSIr), 10-year Bond (Bondr), Gold (Goldr) and the Bitcoin currency to South African rand (BTC/ZAR) and finally the forex US dollar to South African Rand (USD/ZARr), British Pound to South African Rand (GBP/ZARr) and the Euro to South African Rand (EUR/ZARr).
Table 2.
The marginal univariate ARFIMA (1, 0, 0) +EGARCH (1, 1) estimates.
| Variables | ARCH (3) | |||||||
| ALSI | -0.0002 (0.0001) |
0.0687*** (0.0154) |
-0.4370*** (0.0198) |
0.0322** (0.0126) |
0.9542*** (0.0020) |
0.16014*** (0.0201) |
4.9954*** (0.4071) |
0.1081 [0.7423] |
| Bond | 0.0003*** (0.0001) |
-0.0384** (0.0150) |
-0.0892*** (0.0066) |
0.0181** (0.0089) |
0.9703*** (0.0007) |
0.0849** (0.0365) |
4.0719*** (0.5057) |
0.3670 [0.5446] |
| Gold | 0.0020*** (0.0005) |
0.0090 (0.0163) |
-1.4517*** (0.1263) |
0.0348*** (0.0040) |
0.7436*** (0.0209) |
0.6231*** (0.0708) |
2.5390*** (0.1399) |
0.0003 [0.9851] |
| BTC/ZAR | 0.0003** (0.0001) |
-0.0054 (0.0168) |
-0.1237*** (0.0012) |
0.0429*** (0.0080) |
0.9868*** (0.0004) |
0.0758*** (0.0023) |
13.7971*** (2.5556) |
0.4051 [0.5245] |
| USD/ZAR | 0.0021*** (0.0002) |
-0.0012 (0.0169) |
-0.2315*** (0.0005) |
0.0278*** (0.0096) |
0.9756*** (0.0002) |
0.1025*** (0.0054) |
8.8175*** (1.1316) |
3.1200 [0.0773] |
| GBP/ZAR | 0.0004*** (0.0001) |
0.0119 (0.0173) |
-0.3521*** (0.0066) |
0.0391*** (0.0109) |
0.9632*** (0.0007) |
0.1274*** (0.0127) |
8.4339*** (1.0224) |
0.1555 [0.693] |
| EUR/ZAR | 0.0003*** (0.0001) |
0.9165*** (0.0015) |
-0.9265*** (0.0055) |
0.0525*** (0.0053) |
0.9590*** (0.0023) |
0.0460*** (0.0090) |
14.9380*** (3.3820) |
0.4625 [0.4964] |
Notes: Table 2 displays the results of the univariate marginal for the assets. In parentheses, the values are standard errors, and in brackets are p-values; ARCH LM Tests. ‘’*’’, ‘’**’’, and ’’ ***’’ represent the significance at the 10%, 5%, and 1% levels, respectively. The EGARCH parameters, and are substantial at the 1% level, and at the 5% level for propose that our specification is suitable.
Table 3.
Averaged dynamic connectedness.
| ALSI | Bond | Gold | BTC/ZAR | USD/ZAR | GBP/ZAR | EUR./ZAR | FROM | |
| ALSI | 94.49 | 0.95 | 0.96 | 1.15 | 0.88 | 0.71 | 0.85 | 5.51 |
| Bond | 0.78 | 93.96 | 1.21 | 0.83 | 0.95 | 1.13 | 1.13 | 6.04 |
| Gold | 0.99 | 1.36 | 94.33 | 0.97 | 0.82 | 0.77 | 0.76 | 5.67 |
| BTC/ZAR | 1.08 | 0.82 | 0.93 | 93.75 | 1.07 | 1.15 | 1.21 | 6.25 |
| USD/ZAR | 0.36 | 0.50 | 0.44 | 0.52 | 42.12 | 27.28 | 28.78 | 57.88 |
| GBP/ZAR | 0.31 | 0.52 | 0.37 | 0.44 | 26.97 | 41.72 | 29.68 | 58.28 |
| EUR/ZAR | 0.34 | 0.54 | 0.42 | 0.43 | 28.00 | 29.21 | 41.05 | 58.95 |
| TO | 3.86 | 4.69 | 4.33 | 4.35 | 58.69 | 60.26 | 62.41 | 198.59 |
| TCI | ||||||||
| NET | -1.66 | -1.35 | -1.34 | -1.90 | 0.81 | 1.98 | 3.46 | 28.37 |
| NPT | 1.00 | 2.00 | 0.00 | 3.00 | 4.00 | 5.00 | 6.00 |
Notes: This table presents the results based on a 200-day rolling-window TVP-VAR model with a lag length of order 1; the values represent the corresponding time-connectedness metrics.
Disclaimer/Publisher’s Note: The statements, opinions and data contained in all publications are solely those of the individual author(s) and contributor(s) and not of MDPI and/or the editor(s). MDPI and/or the editor(s) disclaim responsibility for any injury to people or property resulting from any ideas, methods, instructions or products referred to in the content. |
© 2025 by the authors. Licensee MDPI, Basel, Switzerland. This article is an open access article distributed under the terms and conditions of the Creative Commons Attribution (CC BY) license (http://creativecommons.org/licenses/by/4.0/).
Copyright: This open access article is published under a Creative Commons CC BY 4.0 license, which permit the free download, distribution, and reuse, provided that the author and preprint are cited in any reuse.


