
Submitted:
06 June 2025
Posted:
10 June 2025
You are already at the latest version
Abstract
Gene editing technologies such as CRISPR/Cas9 have revolutionized functional genomics, yet their application in marine fish cell lines remains limited by inefficient delivery. This study compares three delivery strategies—electroporation, lipid nanoparticles (LNPs), and magnetofection using gelatin-coated superparamagnetic iron oxide nanoparticles (SPIONs)—for CRISPR/Cas9-mediated editing of the ifi27l2a gene in DLB-1 and SaB-1 cell lines. We evaluated transfection and editing efficiency, intracellular Cas9 localization, and genomic stability of the target locus. Electroporation achieved up to 95% editing in SaB-1 under optimized conditions, but only 30% in DLB-1, which exhibited locus-specific ge-nomic rearrangements. Diversa LNPs enabled intracellular delivery and moderate edi-ting (~25%) in DLB-1, while SPION-based magnetofection resulted in efficient uptake but no detectable editing, highlighting post-entry barriers. Confocal imaging and fluore-scence correlation spectroscopy revealed that nuclear localization and Cas9 aggregation are critical determinants of editing success. Our findings demonstrate that CRISPR/Cas9 delivery efficiency is cell line-dependent and governed by intracellular trafficking and genomic integrity. These insights provide a practical framework for optimizing gene editing in marine teleosts, advancing both basic research and selective breeding in aquaculture.
Keywords:
CRISPR
; Cas9
; gene editing
; editing efficiency
; aquaculture
; sea bass
; sea bream
1. Introduction
Gene editing using CRISPR/Cas9 is radically transforming aquaculture biotechnology by enabling the precise modification of genes associated with economically relevant traits such as growth, sterility, and disease resistance [1,2,3]. This tool has been applied in fish embryos via microinjection, achieving high knockout rates in species such as zebrafish, Atlantic salmon, and cod, but its use in cell lines is limited by several species-specific barriers that complicate the direct implementation of protocols developed for mammalian systems. These barriers include low transfection efficiency, slow cell proliferation, differences in promoter compatibility, and reduced nuclear access of large plasmids [4,5,6,7,8,9].
One of the main factors underlying efficient genome editing in fish cell lines is the choice of delivery system, which must overcome unique physiological and molecular barriers associated with teleost species [10]. Electroporation of Cas9–sgRNA ribonucleoprotein (RNP) complexes has emerged as a highly effective strategy, with editing efficiencies up to 61.5% in medaka and 39% in rainbow trout, while avoiding genomic integration [4,11]. Viral vectors such as lentiviruses have also achieved high editing efficiencies in salmonid cell lines, but their integration into the host genome and sustained Cas9 expression raise biosafety concerns , and most fish cell lines are immune to lentivirus infection [4,6].
Lipofection methods, including those using lipid nanoparticles and lipofectamine reagents, have demonstrated moderate cellular uptake but limited editing efficiency in fish cells, often attributed to intracellular barriers such as endosomal retention and insufficient nuclear import; only nuclear localization correlates with gene editing outcomes [8,12,13]. For example, lipofection using Lipofectamine 3000 in CHSE/F cells yielded only ~10% transfection efficiency and no detectable genome editing [9,13]. Meanwhile, emerging delivery platforms, including magnetic nanoparticles and carbon nanotubes, are being explored in vivo in species such as Poecilia reticulata and Litopenaeus vannamei, but their application in marine fish cell lines is still limited [14]. As aquaculture continues to grow, there is a need to optimize CRISPR/Cas9 delivery methods tailored to specific cell types and species, consolidating fish cell lines as essential in vitro platforms for functional genomics and research on the genomic basis of traits of interest [10].
In this study, we conducted a comprehensive comparative analysis of three CRISPR/Cas9 delivery strategies for editing marine fish cell lines derived from Dicentrarchus labrax Brain 1 (DLB-1) and Sparus aurata Brain (SaB-1) (Figure 1). The approaches evaluated included electroporation of Cas9–sgRNA RNPs; lipofection with sgRNA-loaded Diversa lipid nanoparticles (LNPs), followed by Cas9 protein internalization (tested only in DLB-1); and magnetofection using RNPs conjugated to fluorescent gelatin-coated superparamagnetic iron oxide nanoparticles (SPIONs@Gelatin). These nanoparticles offer a potential delivery alternative based on passive uptake and magnetic guidance. We assessed not only transfection and editing efficiency, but also the subcellular localization of Cas9 (tracked by Cy5 and FLUOGREEN labeling) and the genomic stability of the edited locus, where multiple PCR amplicons in DLB-1 cells suggested possible structural rearrangements not present in the original tissue source. Both in vitro transcribed and chemically modified sgRNAs (Synthego) were tested. This integrated evaluation provides a practical framework for optimizing genome editing protocols in non-model teleost species and highlights key factors—such as nuclear import and genomic integrity—that determine editing outcomes. The findings support the applicability of these tools for both basic and applied research in aquaculture species, advancing sustainability through targeted biotechnological innovation and offering new platforms for the rational design of CRISPR delivery systems.
2. Results
2.1. Electroporation Efficiency
To characterize the performance of CRISPR-Cas9 editing in marine fish cell lines, first we systematically evaluated electroporation-based delivery of Cas9-sgRNA RNPs in DLB-1 and SaB-1 cells. This included assessing transfection efficiency, editing outcomes, and cell viability across a range of electroporation parameters and RNP concentrations. These results are summarized in Figure 2.
First, the best electroporation parameters in terms of transfection efficiency and cell viability were established in both cell lines. Transfection efficiency was evaluated using Cas9 protein conjugated to Cy3 (Cas9-Cy3), quantifying uptake 1 h post-electroporation. Cell viability was simultaneously assessed using trypan blue exclusion. Successful Cas9-Cy3 uptake was observed in both DLB-1 and SaB-1 cells, with SaB-1 displaying more homogeneous and intense signal (Figure 2A). Quantifications performed under a fixed RNP concentration (3 µM) across different electroporation settings confirmed that SaB-1 cells maintained higher transfection efficiency and survival (Figures 2B and 2C). In contrast, DLB-1 cells showed more variability and sensitivity to electroporation parameters, with some conditions resulting in sharply reduced viability and transfection performance. Based on this analysis, no single condition simultaneously maximized all variables in DLB-1 cells. The highest editing was obtained at 1700 V, 20 ms, 2 pulses (up to ~28% editing), though this came at the expense of reduced viability. In contrast, 1600 V, 15 ms, 3 pulses provided a better compromise, yielding high transfection (~75%) and acceptable viability (~50%), albeit with moderate editing efficiency (~10%). For SaB-1 cells, editing efficiency increased with voltage, reaching nearly 100% at 1800 V, 20 ms, 2 pulses, with high transfection (~78%) but lower survival (~20%). Intermediate conditions such as 1600 V offered a more balanced outcome, combining moderate editing with higher viability. These comparative results were used to select the optimal parameters for genome editing experiments.
Secondly, we aimed to evaluate the genome editing efficiency of a CRISPR-Cas9 RNP strategy targeting the ifi27l2a gene in both marine fish cell lines using the electroporation parameters tested above. We compared two sgRNA sources: in vitro transcribed (IVT) and chemically synthesized (Synthego), at two RNP concentrations (2 and 3 µM). For these experiments, electroporation was carried out under the conditions that previously yielded the highest editing efficiency at 3 µM RNP, as determined in Figures 2B and 2C: 1700 V, 20 ms, 2 pulses for DLB-1, and 1800 V, 20 ms, 2 pulses for SaB-1. As shown in Figure 2D, SaB-1 cells exhibited markedly higher editing frequencies than DLB-1, particularly when using synthetic sgRNAs at 3 µM, with editing reaching up to ~95%. In contrast, IVT sgRNAs resulted in lower or undetectable editing, especially in DLB-1. Testing a higher RNP dose (5 µM) in DLB-1 cells did not lead to further improvement (data not shown), and this condition was therefore not extended to SaB-1. Overall, these findings confirm that SaB-1 cells are more amenable to efficient genome editing than DLB-1, and that synthetic sgRNAs at 3 µM RNP under optimized electroporation conditions yield the most robust outcomes.
To better characterize the nature of the edits, indel profiles were analyzed using the ICE tool based on Sanger sequencing data. As shown in Supplementary Figure S1, DLB-1 cells exhibited a narrow mutation spectrum, with most edited alleles consisting of single-nucleotide insertions or small deletions around the sgRNA cut site. ICE analysis estimated that approximately 66% of the alleles remained unedited (Supplementary Figure S1A), indicating low editing efficiency and limited diversity. In contrast, SaB-1 samples showed a broader mutational landscape, including complex deletions and combined indels affecting both sgRNA target sites within the same locus (Supplementary Figure S1B). These two cut sites were simultaneously targeted using a pair of sgRNAs during electroporation. The most abundant edited allele accounted for 62% of the signal, while the remaining profiles consisted of numerous low-frequency indels, suggesting a more efficient and heterogeneous editing response in SaB-1 cells.
To evaluate whether the amount of Cas9–sgRNA RNP impacts editing efficiency, we quantified editing at two concentrations (2 and 3 µM) and calculated the corresponding RNP dose per cell. For SaB-1 cells, the most effective condition (3 µM Synthego RNP, ~94% editing) corresponded to ~0.0336 ng RNP per cell, while DLB-1 cells reached similar but modest editing levels at 3 µM (~30% editing), corresponding to ~0.0080 ng per cell (Figure 2D). Increasing the RNP dose to 5 µM in DLB-1 cells did not result in any substantial improvement in editing efficiency (data not shown), and therefore this condition was not further tested in SaB-1 cells. These per-cell estimates provide a functional context for the observed differences between cell lines, suggesting that intracellular RNP availability—rather than total protein uptake or sgRNA type alone—may act as a limiting factor for efficient genome editing in DLB-1 cells.
To examine whether intracellular Cas9 levels correlate with editing efficiency, we assessed Cas9-Cy5 uptake by flow cytometry across four protein concentrations (1–5 µM) using three representative electroporation protocols: 1400 V 20 ms 1 pulse, 1400 V 20 ms 2 pulses, and 1650 V 15 ms 2 pulses. These settings were selected based on previous viability and editing results (Figure 2B–C) to represent a range of moderate-to-high transfection conditions while capturing variability in pulse number and voltage. Mean fluorescence intensity (MFI) increased with protein dose in both DLB-1 and SaB-1, and SaB-1 cells consistently exhibited higher MFI values (Supplementary Figure S2A). However, the percentage of Cy5-positive cells remained close to 100% under all conditions—including in non-electroporated controls—indicating that surface-bound or vesicle-trapped protein may contribute to total fluorescence (Supplementary Figure S2B). Among the tested electroporation settings, all showed similar uptake trends, but the 1400 V 20 ms 2-pulse condition produced the most reproducible and discriminative MFI response and was therefore selected for detailed statistical comparison (Supplementary Figure S2C). Under this condition, MFI increased significantly with concentration, but editing efficiency plateaued beyond 3 µM, suggesting that once a threshold of functional Cas9 reaches the nucleus, additional uptake does not improve editing outcomes. This supports the interpretation that intracellular delivery saturates at high doses and that nuclear access—not uptake—is the limiting factor for gene editing efficiency.
To visually inspect the cytotoxic effects of electroporation and Cas9-Cy5 loading, brightfield images of both cell lines were captured immediately prior to flow cytometry (Supplementary Figures S3A and S3B). Cells were subjected to increasing Cas9-Cy5 concentrations (0–5 µM) under four electroporation conditions. Morphological inspection revealed that higher voltages, pulse numbers, or protein concentrations were associated with visibly reduced cell density and signs of stress in both DLB-1 and SaB-1 cultures. These images confirmed the anticipated cytotoxic impact of more aggressive electroporation settings and provided qualitative validation of the viability trends quantified elsewhere. Together, these results demonstrate that while electroporation can achieve high gene editing efficiency in SaB-1 cells, the DLB-1 line exhibits intrinsic limitations. In DLB-1, the highest editing efficiency (~30%) was obtained at 1700 V, 20 ms, 1 pulse, a condition that also resulted in moderate cell viability (~50%) (Figure 2B). In contrast, SaB-1 cells reached editing levels above 90% at 1800 V, 20 ms, 2 pulses, but this came at the cost of severely reduced survival (~10%) (Figure 2C). Further increases in voltage or RNP concentration in DLB-1 did not enhance editing efficiency, suggesting that intracellular trafficking and nuclear access may represent limiting steps in this cell line. Overall, while SaB-1 cells tolerate more aggressive electroporation and respond with efficient genome editing, DLB-1 cells appear fundamentally constrained by intrinsic aspects of their cellular physiology.
To investigate subcellular distribution, we performed confocal microscopy 24–48 hours post-electroporation using Cas9 conjugated to Cy5 (Cas9-Cy5) (Supplementary Figures S4A–B, Video S1). In both DLB-1 and SaB-1 cells, Cas9-Cy5 fluorescence was predominantly confined to the cytoplasm, with limited or no nuclear accumulation. In DLB-1, the signal appeared as punctate, vesicle-like structures, indicative of endosomal entrapment or restricted cytoplasmic diffusion. Complementary live-cell imaging of DLB-1 cells stained with Rhodamine123 (targeting mitochondria) revealed persistent Cas9-Cy5 signal 48 hours post-treatment (Video S1). The red fluorescence partially colocalized with cytoplasmic structures and also accumulated in a diffuse, rounded region lateral to the cell center—suggestive of potential nuclear localization. Additional discrete foci were visible throughout the cytoplasm, consistent with protein aggregation or vesicular sequestration. Although no direct confocal analysis was conducted in SaB-1 under identical conditions, widefield imaging showed a more homogeneous cytoplasmic signal with fewer puncta. These observations suggest that inefficient cytosolic trafficking and limited nuclear access may contribute to the lower editing efficiency observed in DLB-1, compared to the more permissive behavior inferred in SaB-1.
2.2. Lipofection with Diversa LNPs: Promising Yet Suboptimal for Gene Editing
To address the poor genome editing efficiency observed in DLB-1 cells by electroporation, we explored lipid-based delivery systems as an alternative approach (Figure 3). As a first step, we evaluated whether DIVERSA lipid nanoparticles (LNPs) could successfully deliver Cas9–sgRNA complexes into cells. Using FLUOGREEN-labeled LNPs and Cy3-labeled Cas9, we performed widefield fluorescence microscopy and observed widespread green signal in nearly all cells, indicating robust association with the nanoparticles (Figure 3A). A substantial number of cells also showed clear red fluorescence (Cas9 presence), and merged images revealed colocalization between both signals, suggesting that Cas9 was co-delivered with the LNPs into the same cells. Although this initial assessment was qualitative, it strongly indicated that the lipid-based approach achieved a broader and more uniform delivery than electroporation. This interpretation was supported by confocal imaging of lipofected SaB-1 cells (Supplementary Figure S4), which showed intense FLUOGREEN signal concentrated near the cell periphery, suggesting widespread LNP-membrane interaction and efficient cell targeting.
To further investigate whether these signals corresponded to internalized material and to examine their relative subcellular localization, we performed confocal microscopy using Cas9 labeled with Cy5 (to avoid spectral overlap with the FLUOGREEN-labeled LNPs). Z-stack imaging acquired 24–48 hours post-transfection revealed that the Cas9-Cy5 signal consistently appeared in focal planes deeper than the LNP signal, which remained closer to the apical surface of the cells (Figure 3B). This spatial separation is clearly visible in Supplementary Video S2, which highlights the axial displacement between both signals in a 3D projection. Supplementary Video S3, taken from a different region of the same culture, confirms this pattern and further includes an overlaid brightfield image, allowing clearer visualization of cell boundaries and reinforcing the intracellular localization of Cas9. Although both videos illustrate the same distribution trend, their complementary focus—depth localization in S2 and morphological context in S3—justifies the inclusion of both. Moreover, Supplementary Video S4 provides a detailed view of an individual cell, showing the green LNP signal as more diffuse and confined to a superficial layer, while the red Cas9 signal is distributed at multiple points within the cytoplasm. These discrete red foci resemble the scattered Cas9 patterns observed in Supplementary Video S1, although no clear nuclear localization could be confirmed in this case, likely due to the use of culture plates with suboptimal optical quality, which limited resolution in the nuclear plane. Nonetheless, these results support successful transfection and intracellular delivery of Cas9.
We next investigated how genome editing efficiency was influenced by delivery conditions, focusing on reagent dose per cell. Four experimental setups were tested using identical LNP formulations (25 ng/µL sgRNA), applied at two volumes (50 µL and 75 µL) in two plate formats: 96-well (∼20,000 cells/well) and 24-well (∼100,000 cells/well). Since the total concentration of RNPs was fixed, the effective dose per cell varied depending on the cell density. Genome editing efficiency was highly dependent on the per-cell concentration of LNPs – i.e. exposure to Cas9–sgRNA complexes. As shown in Figure 3C, the highest editing efficiency (~25%) was obtained when 75 µL of LNPs were applied to a 96-well plate, corresponding to an estimated 0.094 ng of sgRNA and 0.535 ng of RNP per cell. In contrast, the lowest efficiency (~2%) occurred in the 24-well plate with 50 µL of reagent, delivering only 0.013 ng of sgRNA and 0.071 ng of RNP per cell. These data clearly demonstrate that editing efficiency scales with the effective dose of RNPs per cell.
Importantly, the type of sgRNA used appeared to influence editing outcomes. In electroporation assays, chemically synthesized sgRNAs (Synthego) consistently outperformed in vitro transcribed (IVT) guides, confirming their superior performance in both cell lines. Although LNP-mediated delivery was primarily tested with synthetic sgRNAs, preliminary assays with IVT guides failed to produce detectable editing or yielded only very low efficiencies (data not shown), possibly due to suboptimal dosing or reduced stability. Further optimization would be required to fully evaluate the compatibility of IVT sgRNAs with lipid-based delivery systems.
2.3. Cas9 Protein Aggregation
Previous experiments revealed the tendency of Cas9 to aggregate and its potential impact on the formation of the RNP complex, and consequently, on gene editing efficiency. For this reason, Cas9 aggregation was studied under various experimental conditions using Fluorescence Correlation Spectroscopy (FCS).
Throughout our comparative analysis of electroporation and lipid-based delivery strategies, we observed that Cas9 uptake alone does not necessarily translate into effective genome editing. Flow cytometry revealed high percentages of Cy5-positive cells even under non-electroporated conditions—suggesting potential membrane association or passive surface adsorption of Cas9. Moreover, confocal microscopy consistently showed heterogeneous and predominantly cytoplasmic distribution of the protein across delivery conditions, with limited nuclear localization regardless of the method used. This was especially evident in lipid-mediated delivery, where Cas9 and nanoparticles occupied distinct intracellular compartments.
These observations raised the possibility that the physicochemical state of Cas9 itself—particularly its tendency to aggregate—might be influencing its delivery efficiency, intracellular distribution, and ultimately its genome editing activity. This hypothesis was further supported by the apparent discrepancy between intracellular Cas9 levels and functional editing outcomes observed across several experimental conditions. We therefore sought to evaluate whether differences in aggregation behavior could explain, at least in part, the discrepancies observed between delivery methods.
FCS curves (Supplementary Figure S5) were obtained for Cas9 labeled with a cyanine dye (see the Methods and Materials section) under the experimental conditions of two of the delivery strategies: electroporation and lipofection with Diversa LNPs, to try to assess the conditions of the Cas9 molecule and relate it with their edition efficiency. The conditions chosen for the different delivery methods were the following:
- for electroporation, the labeled Cas9 was measured in cell culture medium, which is the environment in which Cas9 is present during the electroporation process.
- for the lipofection with Diversa LNPs, the final step of the preparation protocol was selected as a key point in the delivery process. In this step, the preloaded-sgRNA LNPs are incubated with Cas9 dissolved in a 10 mM HEPES solution at pH 7.4. Therefore, the Cas9 was measured in this buffer solution.
The curves were analyzed to obtain a diffusion correlation time, , related to the size and shape of the particle. Diffusional properties like the diffusion coefficient, , and hydrodynamic radius, , were calculated from (see the Methods and Materials section) and shown in Table 1.
We observe a much larger diffusion time for Cas9 in the lipofection buffer in comparison to the Cas9 in the cell medium used in electroporation assays. This difference suggests that Cas9 tends to form higher-order aggregates or multimeric species in lipofection buffer, which dissolve in the presence of salt and other compounds present in the cell medium. This may allude to a potential aggregation tendency of Cas9 alone in solution, which could alter its intracellular behavior after delivery. Some authors have already reported Cas9 aggregation under similar buffer conditions [15,16,17].
The diffusion coefficient and hydrodynamic radius of the Cas9 monomer, observed in cell medium, align well with previously reported values in the literature, which place the size of monomeric Cas9 in 10.3 ± 1.5 nm, obtained with Dynamic Light Scattering techniques [16,17].
The hydrodynamic radius of Cas9 in HEPES is nearly twice that of the monomeric form due to aggregate formation. This could interfere with its internalization into the Diversa LNPs in the incubation step of Diversa’s protocol, just before the gene editing process.
These findings underscore the importance of molecular characterization of Cas9 formulations under different delivery conditions, as aggregation could significantly influence editing outcomes—even in cases where intracellular uptake is confirmed. An aggregation study on the Cas9 protein is currently underway by our group.
2.4. Evaluation of CRISPR-Cas9 Magnetofection Using Iron Oxide Nanoparticles Coated with Gelatin
To evaluate intracellular barriers limiting CRISPR/Cas9 delivery in marine fish cell lines, we tested a magnetofection approach based on gelatin-coated superparamagnetic iron oxide nanoparticles (SPIONs@Gelatin) conjugated with Cas9–sgRNA RNPs. RNPs were assembled in vitro by complexing recombinant Cas9 protein with synthetic sgRNAs (Synthego), followed by bioconjugation onto FITC-labeled SPIONs using EDC/Sulfo-NHS chemistry. These complexes were applied to DLB-1 and SaB-1 cells under magnetofection conditions, with or without exposure to an external magnetic field generated by custom neodymium magnet plates. Doses of 100, 200, and 500 µL per well (equivalent to 0.41, 0.82, and 2.05 ng of RNP per cell) were tested at two incubation times (30 and 60 minutes).
Fluorescence microscopy showed robust delivery of SPIONs@Gelatin–RNPs, with dose-dependent increases in green (FITC-labeled nanoparticles) and red (Cas9-Cy3) signals (Figure 4A). Colocalization of both signals (yellow/orange) indicated stable conjugation and cell-associated retention. These signals persisted after multiple washes, supporting stable association with the cell surface or interior. However, due to the resolution limitations of widefield microscopy, we cannot exclude the possibility that some fluorescent signals derive from membrane-associated aggregates rather than fully internalized complexes.
To quantify nanoparticle internalization without interference from protein–nanoparticle interactions or fluorescence overlap, we used SPIONs@Gelatin nanoparticles without RNPs. As shown in Figure 4B, intracellular iron levels increased with nanoparticle concentration and were significantly higher in magnet-assisted conditions, particularly at 200 µL after 30 minutes. Statistical analysis by two-way ANOVA followed by Tukey’s post hoc test confirmed significant differences between uptake conditions (*p < 0.05, **p < 0.01; n = 3). These results validate that magnetofection effectively enhances cellular internalization of SPIONs under the same physical and temporal conditions used for RNP delivery.
Prior to their application, bioconjugated SPIONs@Gelatin–RNP complexes were validated by confocal microscopy to confirm successful labeling and conjugation. As shown in Figure 4C, FITC-labeled nanoparticles, Cy3-labeled RNPs, and the resulting conjugates specific for DLB-1 and SaB-1 cells exhibited distinct and overlapping fluorescent signals, confirming efficient complex formation for genome editing of the ifi27l2a gene.
Despite efficient uptake and colocalization of Cas9 and nanoparticles, PCR-based genotyping consistently failed to detect genome editing in either cell line across all tested conditions. Two independent experiments, each with six biological replicates per condition, revealed no detectable indels at the target locus. Occasional low-frequency editing signals (<4%) were sporadically observed in isolated replicates, but lacked reproducibility or correlation with experimental variables, and were thus considered background artifacts.
Notably, our SPIONs were not specifically optimized for nuclear targeting, which may partially explain the absence of editing despite effective delivery. Even at the lowest nanoparticle dose (0.41 ng of RNP per cell), the amount was comparable to the most efficient Diversa LNP condition in DLB-1 cells (0.535 ng/cell), while the highest dose (2.05 ng/cell) exceeded it nearly fourfold. Yet, none of the magnetofection conditions led to detectable editing, underscoring that intracellular accumulation alone is insufficient. Similar to results obtained with Diversa LNPs, where delivery of Cas9 did not always result in editing unless specific criteria were met, these findings highlight that critical intracellular barriers—such as endosomal escape, RNP release, and nuclear import—likely limit editing efficiency.
Altogether, our results indicate that although SPIONs@Gelatin–RNP complexes are robustly internalized and retained by marine fish cells under magnetofection conditions, their inability to mediate genome editing suggests that post-uptake bottlenecks must be addressed. Optimizing strategies for endosomal escape and nuclear trafficking is essential to unlock the full potential of nanoparticle-mediated CRISPR delivery in hard-to-transfect systems.
2.5. Amplification and Sequencing
Amplification and sequencing of the ifi27l2a gene revealed striking differences in the genomic architecture of DLB-1 and SaB-1 fish cell lines. Early PCR attempts on DLB-1 genomic DNA using standard Taq polymerases yielded weak, diffuse, or inconsistent bands, in contrast to the cleaner and more robust amplification observed in SaB-1 cells and crude seabass DNA. As shown in Supplementary Figure S6A, amplification quality was influenced by both the DNA extraction method and the polymerase used. In general, Chelex 100 and DNeasy protocols outperformed QuickExtract, especially when combined with BioTaq or Applied Biosystems polymerases. BioTaq consistently produced the most intense amplification products but also generated additional non-specific bands across all three primer pairs (PE, P1, P2), particularly in DLB-1 cell line samples (highlighted with red asterisks). Applied Biosystems offered a balance between intensity and specificity, producing cleaner results with fewer spurious bands.
Despite these optimizations, PCR amplification of the ifi27l2a locus from DLB-1 cells frequently yielded multiple bands, especially with the P2 primer pair, regardless of the polymerase or extraction method used. These additional bands, which were absent in SaB-1 and seabass DNA, are indicated by red asterisks in Supplementary Figures S6A and S6B and likely reflect underlying genomic alterations in the DLB-1 cell line. In contrast, both SaB-1 cells and crude seabass DNA consistently produced a single, sharp product with each primer set, consistent with an intact and non-rearranged target locus.
Sequencing of the P2 amplicon from crude seabass DNA confirmed the presence of a single canonical exon. Sanger chromatograms showed high-quality, unambiguous reads with no evidence of mixed sequences or allelic variation (Supplementary Figure S6C). These results suggest that the multiple PCR products observed specifically in DLB-1 cells are not due to primer misannealing or polymerase error, but rather reflect culture-acquired genomic duplications or structural rearrangements at the target locus. These findings are consistent with previous reports of chromosomal instability in long-term fish cell cultures. Importantly, the presence of duplicated or rearranged genomic regions could interfere with CRISPR-Cas9 genome editing by introducing multiple near-identical target sites, thereby reducing on-target precision or increasing off-target activity. Conversely, the consistent single-band amplification and clean exon sequence observed in SaB-1 support its use as a genomically stable and tractable platform for functional genomics and precise genome editing in marine fish models.
To confirm these observations and improve amplification consistency, we also tested a high-fidelity proofreading enzyme, Platinum™ SuperFi™ II DNA Polymerase (Thermo Fisher Scientific), across the same DNA samples and target regions. As shown in Supplementary Figure S7, this polymerase yielded sharp and specific bands across all extraction methods, including QuickExtract, and minimized non-specific amplification. However, even under these optimized conditions, amplicon P2 from DLB-1 still displayed banding patterns distinct from those of SaB-1 or seabass, suggesting that the observed heterogeneity arises from genuine genomic alterations rather than polymerase artifacts. These results reinforce the conclusion that DLB-1 cells harbor culture-acquired rearrangements at the ifi27l2a locus, which may compromise PCR-based analyses and gene editing assays.
3. Discussion
This study provides a rigorous comparative assessment of three CRISPR/Cas9 delivery systems: electroporation, lipid-based transfection using Diversa LNPs, and magentofection using SPIONs@Gelatin-RNPs, in two marine fish cell lines, DLB-1 and SaB-1, targeting the gene ifi27l2a. This gene has been identified as a strong candidate for resistance to nervous necrosis virus (NNV), particularly in European sea bass, based on QTL and eQTL analyses [18,19,20].
3.1. Electroporation Enables Efficient Genome Editing in Marine Fish Cell Lines
Electroporation of Cas9-sgRNA RNP complexes achieved the highest editing efficiencies across the systems tested, with SaB-1 cells consistently exceeding 90% indel formation under optimized parameters. These findings align with previous studies in medaka and salmonid models, where RNP-based electroporation produced robust editing without requiring plasmid transfection or viral vectors [6,11]. As a physical delivery method, electroporation bypasses endocytic and vesicular trafficking pathways, allowing direct cytoplasmic entry of macromolecular complexes. This facilitates nuclear access, particularly for large proteins such as Cas9, which depend on active transport mechanisms to cross the nuclear envelope [12,21]. The consistent efficiency observed in SaB-1 suggests that this line possesses favorable biophysical properties for genome editing, potentially including a more accessible nuclear envelope or less compacted chromatin. In addition, electroporation allows precise control of RNP dosage per cell, a key parameter for achieving reproducible and predictable editing outcomes, as demonstrated by quantitative comparisons between effective concentrations and observed efficiencies. Similar principles were reported by Qin et al. (2016), who achieved efficient genome editing in fish embryos using plasmid-encoded zinc finger nucleases (ZFNs) delivered by electroporation [22]. Although based on a different system, their results further validate electroporation as a powerful and versatile strategy for gene editing in aquatic models.
In contrast, editing in DLB-1 cells was markedly less efficient despite similar uptake of Cas9-Cy5, as confirmed by flow cytometry and microscopy. Notably, PCR amplification of the ifi27l2a locus in DLB-1 yielded multiple amplicons, whereas genomic DNA from the original fish source produced a single band. This strongly suggests structural variation in the cell line, such as gene duplication, partial rearrangement, or chromosomal fragmentation, phenomena frequently observed in long-term cultured teleost cells [6,13,23]. Such genomic instability can severely impact CRISPR efficiency by introducing competing target sites, altering PAM accessibility, or disrupting homology between alleles, which may lead to partial or mosaic editing patterns. Sequencing of these PCR products revealed high-quality reads, indicating that the amplification anomalies are not artifacts but reflect underlying genomic complexity. Additionally, a puzzling but reproducible observation was the detection of Cas9-Cy5 fluorescence even in control conditions lacking electroporation (0 V, 0 pulses, 0ms), particularly in DLB-1. Although this signal was weaker and more diffuse than that seen in electroporated samples, it sometimes yielded unexpectedly high positivity rates in flow cytometry. This phenomenon likely reflects membrane adsorption or low-efficiency passive uptake of Cas9 complexes, a known confounder in RNP delivery assays [13,21]. Crucially, no editing was detected under these conditions, reaffirming that intracellular signal alone cannot be used as a proxy for nuclear access or genome modification. These results underscore the need to complement fluorescence-based delivery metrics with functional readouts and to conduct prior cytogenetic or genomic characterization of recipient cell lines, particularly when working with non-model organisms where genome integrity cannot be assumed.
Notably, PCR amplification of the ifi27l2a locus in DLB-1 cells consistently produced two distinct bands, in contrast to the single amplicon observed in SaB-1 and wild-type seabass DNA. Sequencing confirmed that the larger band in DLB-1 corresponds to the expected target sequence, while the presence of an additional, less intense band suggests the existence of genomic rearrangements or duplications acquired during in vitro propagation. These structural anomalies, not present in the original organism, point to the emergence of distinct subpopulations within the DLB-1 culture, each potentially harboring unique genomic configurations. Such heterogeneity could compromise CRISPR/Cas9 targeting by diluting the effective editing signal or introducing confounding allelic variants. Therefore, editing outcomes in cell lines like DLB-1 should be interpreted with caution, and future strategies may benefit from single-cell genotyping or clonal isolation to disentangle the contributions of genetically divergent subclones.
3.2. LNP-Mediated Delivery Achieves Transfection but Limited Editing in DLB-1 Cells
Diversa LNPs enabled efficient delivery of Cas9 RNPs into DLB-1 cells, as evidenced by strong Cy5 fluorescence in flow cytometry and confocal microscopy. However, despite achieving substantial transfection levels, genome editing efficiency remained lower than expected. This discrepancy likely arises from a combination of intrinsic cell line characteristics and potential formulation-related factors. Indeed, the DLB-1 line consistently exhibited low editing efficiency even under electroporation, suggesting that cellular traits may play a dominant role.
FCS indicated that Cas9 tends to aggregate in the HEPES buffer used during the incubation step of the Diversa protocol, potentially reducing its ability to form stable RNP complexes and limiting effective encapsulation within LNPs. This aggregation could also hinder intracellular release and nuclear import, as suggested by the punctate cytoplasmic fluorescence observed in DLB-1 cells (Supplementary Videos S2-S4). This pattern is consistent with previous observations of electroporated Cas9, which also exhibited punctate staining, potentially indicative of aggregation, endosomal entrapment, or other forms of intracellular sequestering [12].
Importantly, the RNP doses used in these assays reflect the total amount of complex added to the cultures, not the actual quantity internalized or reaching the nucleus, which remains challenging to quantify. This distinction is critical, as the efficiency of intracellular delivery and the fraction of RNP that successfully reaches the nucleus remain largely unquantified [13,23,24]. Additionally, these calculations are based on the initial loading amounts, without direct measurement of intracellular RNP levels, meaning that the reported efficiencies are normalized to the total complex used, not necessarily the amount that actually penetrated the cells or reached the nucleus. This is a significant limitation, as variations in uptake efficiency, endosomal escape, and nuclear import can dramatically influence the final editing outcomes [25](Goodwin and Huang, 2014).
Taken together, the modest editing results obtained with LNPs in DLB-1 cells likely reflect both formulation-dependent and cell-intrinsic barriers, with the latter potentially being the primary limiting factor. Additional comparative experiments in SaB-1 cells—where editing efficiencies were consistently higher across delivery systems—support this hypothesis.
3.3. Iron Oxide Nanoparticles Enable uptake but Not Functional Editing
Magenetofection using SPIONs@Gelatin resulted in strong Cas9-Cy5 signal in both DLB-1 and SaB-1 cells, yet no genome editing was detected under any tested condition. Although Cas9 fluorescence was clearly visible in the cytoplasm, no nuclear localization was observed, and PCR-based genotyping consistently failed to detect indel formation. These findings suggest that, despite uptake, the RNPs were likely trapped within endosomal compartments or degraded prior to reaching the nucleus. This limitation is not unique to our system—similar challenges have been reported in mammalian cells using nanoparticle-based CRISPR delivery platforms that lack mechanisms for endosomal escape or nuclear targeting [26]. Unlike virus-like particles (VLPs), which can be engineered to bypass these barriers, the iron oxide particles used here do not possess fusogenic elements or targeting ligands. In rare instances, low-percentage indels were sporadically detected, but they were inconsistent, lacked statistical significance, and may reflect stochastic editing from trace nuclear entry. Although ineffective for DNA editing, these nanoparticles may still serve as valuable tools for decoupling uptake from functional delivery or for transporting molecules with lower nuclear access requirements, such as RNA-targeting enzymes.
Fluorescence microscopy further supported these conclusions by showing persistent retention of the RNP–nanoparticle complex in the cell layer up to 48 hours post-treatment. Both Alexa-labeled gelatin (green) and Cas9-Cy3 (red) signals increased in intensity with nanoparticle dose and magnetic enhancement, and their merged colocalization confirmed that Cas9 remained stably conjugated to the particles over time. However, because wide-field microscopy lacks the resolution to distinguish between internalized and membrane-bound complexes, it remains unclear whether the observed fluorescence represents true intracellular localization. The presence of both fluorophores in the same focal plane as the cells suggests close interaction with the membrane or shallow internalization, but the absence of editing despite this robust and sustained association reinforces a critical point: cellular uptake alone is not sufficient for genome editing. Effective delivery systems must also enable cytoplasmic release and promote nuclear import of functional Cas9 RNPs to achieve editing outcomes.
3.4. Editing Depends on Nuclear RNP Dose and Cell-Specific Trafficking
Our comparative analysis revealed that genome editing efficiency is strongly dependent on the nuclear availability of functional, aggregate-free Cas9 RNPs, rather than on the total amount internalized into the cell. This was evident when contrasting the three delivery systems tested. Electroporation consistently resulted in the highest editing efficiencies, particularly in SaB-1 cells, where >90% indel formation was achieved with an estimated delivery of ~0.017 ng Cas9 and ~0.0080 ng sgRNA per cell. In contrast, both lipid-based (Diversa LNPs and Lipofectamine 3000) and iron nanoparticle-based methods delivered higher amounts of RNPs per cell in DLB-1—~0.535 ng Cas9 in the case of Diversa LNPs—but failed to produce detectable editing. This supports the conclusion that total uptake is insufficient: successful editing requires that a threshold concentration of RNPs be reached in the nucleus, a finding consistent with [12], who demonstrated via FCS that efficient genome editing in mammalian cells requires ≥1300 RNPs per nucleus and prolonged nuclear residency.
Differences between delivery platforms were further illustrated by subcellular localization patterns. Confocal microscopy revealed diffuse and punctate Cas9-Cy5 signal in LNP-treated DLB-1 cells, suggestive of cytoplasmic aggregation or endosomal trapping. FCS confirmed that aggregation was promoted in the HEPES-based buffer used in the LNP protocol, a phenomenon known to impair nuclear trafficking [13,21]. In contrast, electroporation bypasses endocytic pathways and allows direct cytoplasmic entry of RNPs, facilitating nuclear import [6,11]. Notably, no editing was observed in conditions with strong uptake but absent nuclear localization, such as Lipofectamine 3000 in DLB-1 (Supplementary Figure S8), or magnetofection of iron nanoparticles in either line, reinforcing that nuclear access is the critical bottleneck. This dissociation between fluorescence signal and editing outcome underscores the need to complement transfection metrics with functional assays and to avoid over-reliance on fluorescence intensity as a proxy for editing efficiency.
3.5. Future Directions
The development of alternative delivery platforms continues to expand the toolbox for gene editing in aquatic species. Viral vectors such as lentiviruses and baculoviruses have been successfully used to transduce fish cells and may allow for stable expression of CRISPR components [3,27]. Recent efforts using virus-like particles (VLPs) and pseudotyped viral systems have demonstrated enhanced delivery of RNP complexes in mammalian systems, with potential application in marine species [26]. These strategies may overcome some of the barriers faced by non-viral methods, such as aggregation, endosomal sequestration, or nuclear exclusion, challenges that were evident in our study using lipid nanoparticles and iron-based systems [12,13].
Ultimately, effective genome editing in marine fish cells requires coordinated optimization of the delivery system, RNP formulation, nuclear import mechanisms, and the structural integrity of the target genome. Our results support electroporation as the most robust and reproducible technique for functional editing. However, the identification of structural alterations at the ifi27l2a locus in DLB-1 cells, reflected in the presence of multiple PCR amplicons and inconsistent editing outcomes, raises concerns about the reliability of editing readouts in cell lines with complex genomic rearrangements. These observations are consistent with the findings of Gonçalves et al. (2019), who showed that CRISPR-Cas9 targeting of tandemly duplicated or rearranged regions can trigger gene-independent loss-of-fitness effects [28]. Such effects may confound phenotypic interpretation. Therefore, future studies should incorporate genome structural analysis, for example through karyotyping, long-read sequencing, or copy-number ratio metrics, to validate editing targets and interpret functional outcomes appropriately.
The establishment of gene-edited marine fish cell lines, such as those targeting ifi27l2a, offers a valuable platform to investigate antiviral responses and host-pathogen interactions under controlled in vitro conditions. These systems reduce the need for in vivo experimentation and facilitate functional validation of immune-related genes, as demonstrated by the robust editing achieved in SaB-1 cells. In contrast, challenges such as genomic instability and impaired nuclear import, exemplified by the lower editing observed in DLB-1, underscore the importance of cytogenetic validation and delivery optimization. Edited cell lines also support broader applications, including toxicological assays, infection challenges, and pre-validation of CRISPR reagents, which are increasingly relevant for sustainable aquaculture research [21,25,26,29]. As delivery systems and functional assays continue to evolve, genome editing in fish cell lines stands as a promising tool for mechanistic studies, biomarker discovery, and translational applications in aquatic biomedicine.
4. Materials and Methods
4.1. Cell Culture
DLB-1 (Dicentrarchus labrax) and SaB-1 (Sparus aurata) cell lines were maintained under optimized conditions to ensure stable proliferation and viability. Cells were cultured in Leibovitz’s L-15 medium (Thermo Fisher Scientific), supplemented with 10% fetal bovine serum (FBS) and 1% penicillin/streptomycin (P/S). Cultures were maintained at 28 °C in a CO₂-independent environment. Cells were routinely passaged at 80–90% confluence using 0.25% trypsin-EDTA solution, incubated for 2–3 minutes at room temperature. Trypsin activity was neutralized with complete medium containing FBS, and cells were then resuspended and replated at a controlled density. All experiments were conducted using cells at no more than 15 passages to minimize genomic instability.
DLB-1 and SaB-1 cell lines were originally derived from brain tissue of European sea bass and gilthead seabream, respectively, and were established at the University of Murcia using retroviral immortalization with the snakehead retrovirus (SnRV), as described in Morcillo et al. (2017) and Ruiz-Palacios et al. (2020) [29,30]. Both cell lines have been genetically and functionally characterized, showing glial marker expression and susceptibility to viral infection. They are registered in the Cellosaurus database under the following accession numbers: DLB-1 (CVCL_HG31) and SaB-1 (CVCL_A9H7).
4.2. Primer Design for PCR Amplification of ifi27l2a
To amplify the ifi27l2a locus in DLB-1 and SaB-1 cells, multiple primer pairs were designed using NCBI Primer-BLAST (https://www.ncbi.nlm.nih.gov/tools/primer-blast/) based on the reference sequence of D. labrax. Three independent amplicons of 855 bp, 630 bp, and 419 bp were selected to ensure robust amplification and facilitate sequencing across the target region. Primer selection prioritized specificity, optimal melting temperature (Tm), GC content, and low self-complementarity. The sequences and thermodynamic parameters of all primers are detailed in Supplementary Table S1.
4.3. sgRNA Synthesis and Preparation
Two sgRNAs targeting the ifi27l2a gene were selected for each species (DLB-1 and SaB-1) based on predicted on-target activity and minimal off-target effects, using CRISPRscan and genome annotations. The selected guide sequences, together with the corresponding T7 promoter-containing forward primers and the universal reverse oligo used for template generation, are listed in Supplementary Table S2.
Templates for in vitro transcription (IVT) were generated by PCR amplification using the T7 forward primer and the universal reverse oligo. PCR products (~117 bp) were purified using a silica-based column kit. IVT was performed using the MAXIscript™ T7 Transcription Kit (Thermo Fisher Scientific), and the resulting RNA was treated with DNase I, precipitated with LiCl and ethanol, washed, and resuspended in RNase-free water. RNA integrity was verified by gel electrophoresis, and concentration was measured with a NanoDrop spectrophotometer.
Additionally, chemically synthesized sgRNAs corresponding to the selected sequences were obtained from Synthego (Redwood City, CA). These were diluted to working concentrations (50–100 nM) in nuclease-free water and stored at –80 °C until use. Both IVT and synthetic sgRNAs were tested in parallel to compare genome editing efficiency.
4.4. Electroporation
To deliver the CRISPR-Cas9 complex into the cells, electroporation was performed using a protocol optimized for marine fish cell lines. Cells were harvested at 80–90% confluency, washed with phosphate-buffered saline (PBS), and centrifuged at 600 × g for 5 minutes. The pellet was resuspended in Opti-MEM (Gibco) to a final density of 1 × 10⁶ cells per reaction. In parallel, Cas9 protein (IDT) was precomplexed with synthetic sgRNA (Synthego) at a 1:2 molar ratio to form RNP complexes. After 10–15 minutes of incubation at room temperature, the RNP mix was combined with the cell suspension in a total volume of 10 µl for electroporation.
Cells were electroporated using different conditions depending on the assay. For the optimization experiment, electroporation was performed using 3 µM RNP under eight distinct combinations of voltage, pulse number, and pulse duration (as shown in Figures 2D and 2E). For the dose–response assay, SaB-1 cells were electroporated with 1 and 3 µM RNP, and DLB-1 cells with 1, 3, and 5 µM RNP using the condition determined as optimal in the previous experiment. Immediately after electroporation, 10 µl of the mixture were transferred into wells of a 24-well plate containing 990 µl of complete L-15 culture medium (supplemented with 10% fetal bovine serum and 1% glutamine, but without antibiotics). Cells were incubated at 25 °C, and after 24 hours, the medium was replaced with fresh L-15 containing antibiotics. Cells were incubated at 25 °C, and after 24 hours, the medium was replaced with fresh medium containing antibiotics.
To evaluate transfection efficiency shortly after delivery, replicate electroporations were carried out using Cas9 protein labeled with Cy3 (Cas9-Cy3). Immediately after electroporation, 10 µl of the cell–RNP suspension were added to each well of a 24-well plate containing 990 µl of complete L-15 medium (10% FBS, 1% GlutaMAX, no antibiotics; final volume 1 ml per well). After 1 hour of incubation at 25 °C, when cells were still in suspension and had not adhered to the culture surface, 10 µl of cell suspension were collected from each well and mixed 1:1 with 0.4% Trypan Blue Stain (Cat# 15250-061, Gibco, Thermo Fisher Scientific). The mixture was gently homogenized and loaded into a Neubauer chamber. Manual counts of fluorescent (Cy3-positive) and non-fluorescent cells were performed under widefield fluorescence microscopy. Cell viability was assessed simultaneously by trypan blue exclusion. This sampling step did not affect total cell recovery, and no reduction in cell number or viability was observed.
4.5. Lipofection
Two different lipid-based transfection strategies were employed to introduce the CRISPR-Cas9 complex into cells:
Lipid nanoparticles (LNPs) from Diversa Technologies were used for the encapsulation and delivery of CRISPR-Cas9 complexes in DLB-1 cells. The LNPs were fluorescently labeled with FLUOGREEN (Ex/Em = 495/503 nm) to enable visualization and uptake analysis by fluorescence and confocal microscopy. Formulations were prepared according to the manufacturer’s instructions (Ref. DIV063F1), involving ethanol injection of sgRNA into citrate buffer (pH 3), followed by buffer exchange into HEPES buffer (pH 7.4) using Amicon Ultra 10 kDa centrifugal filters. Cas9 protein (20 µg in 50 µl HEPES) was gently mixed with the sgRNA-loaded LNPs and incubated for 4 hours at room temperature, then stored overnight at 4 °C. DLB-1 cells were seeded in 24-well plates at 70–80% confluency the day before transfection. The prepared LNP formulation was added directly to the culture medium without additional reagents. Both in vitro transcribed (IVT) sgRNAs and chemically modified sgRNAs (Synthego) were used for formulation and delivery. After 24–48 hours of incubation at 25 °C, cells were imaged to evaluate nanoparticle uptake and subsequently subcultured for 7 days before genomic DNA extraction and mutation analysis. All procedures were carried out under RNase-free conditions, avoiding surfactants such as SDS, Triton X-100, or Tween-20 to preserve nanoparticle stability.
4.6. Mutation Detection and Analysis
Following transfection, genomic DNA was extracted from cells using one of three protocols: (i) QuickExtract™ DNA Extraction Solution (Lucigen), (ii) Chelex® 100 Resin (Bio-Rad), and (iii) the DNeasy Blood & Tissue Kit (Qiagen). For the QuickExtract protocol, cells were lysed directly in the solution by heating at 65 °C for 10 minutes, followed by 95 °C for 5 minutes to inactivate enzymatic activity, as per manufacturer instructions. For Chelex extraction, cell pellets were resuspended in 100 µl of 10% Chelex solution with 1 µl of Proteinase K, incubated at 56 °C for 15 minutes, and then at 100 °C for 1 hour. In the DNeasy protocol, DNA was purified according to the manufacturer’s guidelines using silica-membrane spin columns.
Each extracted DNA sample was used as a template for PCR amplification of the ifi27l2a target region. Initial amplifications were conducted using AmpliTaq Gold DNA Polymerase (Applied Biosystems), following the manufacturer’s protocol. However, this approach yielded inconsistent results across extraction methods, including weak or nonspecific amplification.
To compare the performance of different polymerases and DNA templates, we tested three commercial Taq-based enzymes—MyTaq™ Red Mix (Bioline), AmpliTaq Gold (Applied Biosystems), and GoTaq® Flexi (Promega)—on three target regions (ifi27l2a-P1, P2, and PE), using genomic DNA obtained with the three extraction methods above, as well as crude seabass DNA as a control. PCR reactions were carried out according to each manufacturer’s instructions and resolved on 1% agarose gels stained with GelRed. As shown in Supplementary Figure S6, amplification quality varied depending on the enzyme-template combination. In general, DNA extracted with Chelex and the DNeasy Kit yielded stronger and more specific bands, whereas QuickExtract often resulted in weaker or diffuse products, particularly when combined with Taq-based enzymes. Among the polymerases tested, the Bioline enzyme showed the broadest compatibility across conditions, but none matched the consistency obtained with a high-fidelity enzyme.
To improve specificity and robustness, we subsequently employed Platinum™ SuperFi™ II DNA Polymerase (Thermo Fisher Scientific), a proofreading enzyme optimized for difficult or GC-rich templates. Using this polymerase, consistent and high-quality amplification was achieved across all extraction methods, including QuickExtract, as illustrated in Supplementary Figure S7. These reactions were performed under standard conditions recommended by the manufacturer, and products were resolved on 1% agarose gels stained with SYBR™ Safe.
To assess genome editing efficiency, PCR products were denatured at 95 °C for 5 minutes and slowly cooled to room temperature to promote reannealing and heteroduplex formation. The resulting DNA mixtures were loaded onto 10% non-denaturing polyacrylamide-agarose gels, stained with SYBR™ Safe, and run at 120 V for 20 minutes. The presence of heteroduplex bands was interpreted as evidence of CRISPR-induced indels and used to estimate editing efficiency. To validate and further characterize these editing events, PCR products were purified and subjected to Sanger sequencing using the BigDye Terminator v3.1 Cycle Sequencing Kit (Applied Biosystems), followed by capillary electrophoresis on an ABI 3500xl DNA Analyzer. The resulting chromatograms (.ab1 files) were analyzed with the ICE (Inference of CRISPR Edits) tool, which quantified indel frequencies and identified specific insertions or deletions at the target locus, thus providing both qualitative and quantitative confirmation of genome editing outcomes.
4.7. Fluorescence Microscopy
Fluorescence microscopy was performed to evaluate transfection efficiency and intracellular localization of delivered components. To visualize the intracellular distribution of Cas9, Cy3-labeled Cas9 protein (1.5 µg/µL) and Cy5-labeled Cas9 protein (9 µg/µL), both acquired through the Proteomics Service of the Andalusian Centre for Developmental Biology (CABD, a joint institute of Pablo de Olavide University and the Spanish National Research Council, Seville, Spain), were used in the transfection complexes. This dual labeling strategy enabled real-time tracking of protein uptake and subcellular distribution. Fluorescence signals were captured using the AZ100 wide-field fluorescence microscope, with optimized exposure settings to minimize photobleaching. The intensity and localization patterns of Cas9-Cy3 and Cas9-Cy5 were analyzed using FIJI-ImageJ software. Rhodamine123 staining was applied as a cytoplasmic counterstain to highlight mitochondria in electroporated cells. This stain was omitted in lipofection experiments to avoid overlap with the green fluorescence of FLUOGREEN-labeled lipid nanoparticles.
Two imaging techniques were used:
Widefield fluorescence microscopy (AZ100, Nikon): This system was employed to visualize transfected cells, particularly those electropored and transfected with Diversa LNPs. Due to filter limitations, only Cy3-labeled Cas9 fluorescence was detectable, while Cy5 fluorescence remained outside the detection range. The fluorescent signal of FLUOGREEN-labeled Diversa LNPs was successfully captured, allowing the assessment of nanoparticle uptake and intracellular distribution.
Confocal laser scanning microscopy (Leica TCS SPE): High-resolution confocal imaging was performed to visualize the intracellular distribution of Cy5-labeled Cas9 and FLUOGREEN-labeled Diversa LNPs, providing detailed insights into the uptake and subcellular localization of lipofected components. Cells were cultured in 24-well BioLite™ Microwell Plates (Thermo Fisher Scientific) and imaged using a Leica TCS SPE laser scanning inverted confocal microscope equipped with a 5× objective lens (HC PL S-APO 5×/0.15 DRY). This system includes laser lines at 488 nm and 635 nm for selective excitation of FLUOGREEN and Cy5 fluorophores, respectively. Emission was detected using wide bandpass filters set at 500–600 nm (green) and 645–730 nm (red), with channels acquired sequentially to prevent spectral overlap. Photomultiplier gain and laser power were adjusted to avoid pixel saturation, and the pinhole was set to 1.0 Airy unit. Images were acquired at a resolution of 1024×1024 pixels. For volumetric analysis, z-stack series spanning 100–150 μm in depth were captured and processed using FIJI-ImageJ to generate three-dimensional projections and videos.
Newly, high-resolution confocal imaging was conducted to track Cy5-labeled Cas9 electroporated cells. Leica TCS SPE laser scanning inverted confocal microscope equipped with a 63X (HC PL APO CS2 63x/1.4 OIL UV) objective lens was used to conduct experiments. m-Slide 8 well high glass bottom wells from Ibidi with 170 mm +/- 5 mm bottom were used to obtain optimal resolution images. This microscope is equipped with several laser lines enabling to excite different wavelengths (488 nm and 635 nm) to reveal Rhodamine 123 (Sigma Aldrich R8004) and Cy5 and respectively. Green and red fluorescence emission was collected using 500-600 and 645-730 wide emission slits, respectively, in sequential mode to avoid any interference between channels. In addition, photomultipliers and laser excitation sensitivity was set to prevent pixel saturation, the pinhole was set to 1.0 Airy unit and images of 1024x1024 pixels were acquired. Finally, images and videos from z-stacks were generated using FIJI-ImageJ software.
4.8. Fluorescence Correlation Spectroscopy
Fluorescence correlation spectroscopy (FCS) was used to study the Cas9 protein under the conditions of two of the different delivery methods (specified in the main text). For the electroporation conditions Cas9 labeled with Cy3 was used, while for the lipofection with Diversa LNPs a Cy5 label was utilized, due to limitations in reagent availability. The equipment used in the FCS measurements was provided with different components to excite the Cy3 or Cy5 dyes. For the Cy3, the light of a CW diode laser at 532 nm (Oxxius, LCX-532S, FR) was coupled to a monomode optical fiber (Oxxius, PM460-HP, FR), collimated (Schäfter&Kirchhof, 60FC-4-A6.2-01-DI, DE) and redirected by a dichroic mirror (Semrock, Brightline BS R532, US) and focused into the sample by a microscope objective (Olympus, UPLSAPO 60xW/1.20, water immersion) mounted in an inverted microscope (Olympus, IX71). The resulting fluorescence was collected by the same objective, directed through a pinhole (Thorlabs, Ø = 150 μm, US) and split into two beams by a nonpolarizing beamsplitter cube (Newport, 05BC17 MB.1, US). The fluorescence was separated from scattered light through a band-pass filter (Semrock, Brightline HC 582/75, US). Each of these beams was then focused onto an avalanche photodiode (MPD50CTC APD, Ø = 50 μm, MPD, IT). For the Cy5, a different set-up was used, the laser was changed to a CW diode laser at 635 nm (Oxxius, LBX-638, FR), the optical fiber (Thorlabs, RB41A1, US), the collimator (Schäfter&Kirchhof, 60FC-4-A7.5-01-DI, DE), the dichroic mirror (Semrock, Brightline BS R635, US), the pinhole (Thorlabs, Ø = 100 μm, US) and band-pass filter (Semrock, Brightline HC 679/41, US) were changed to match the excitation and emission of the dye, as well as the focal volume. The signals from the detectors were processed and recorded by two TCSPC-modules (SPC 132, Becker & Hickl GmbH, Berlin, DE) for the Cy3 and a module (MultiHarp 150, PicoQuant, DE) for the Cy5 measurements.
A 100 μL drop of each sample was deposited on clear flat bottom black polystyrene 96-well microplate. The measurements were collected at 25.0 ± 0.5 °C. An excitation laser power of = 50 μW was chosen for the Cy3 measurements, while a power of = 200 μW was selected for the Cy5, corresponding to a mean irradiance of = (0.035 ± 0.003) kW cm-2 and = (0.33 ± 0.01) kW cm-2, respectively. Even though a power series could not be performed to select the excitation power, photobleaching is unlikely due to low irradiances. Currently, an aggregation study on the Cas9 protein is underway to assess these issues.
The curves were obtained from the binary data using a custom routine that runs under Python using Peulen’s library [30] and analyzed using a fit function with two diffusion correlation times and a triplet term:
where is the correlation time, the number of molecules in the focal volume, and are the diffusion correlation time of the species diffusing through the focal volume weighted by , the aspect ratio of the focal volume, the amplitude of the triplet term with triplet lifetime and the baseline value for the correlation curve. Two diffusion terms had to be used due to the presence of the free label dye in solution.
To calibrate the sample volume, Rhodamine 6G and Cy5 were used as reference with diffusion coefficient values of (4.3 ± 0.3) × 10-10 m2 s-1 and of (3.6 ± 0.1) × 10-10 m2 s-1, respectively, at 25 °C, obtained after revision of the literature values [31,32,33,34]. For the measurements with Cy3, we obtained with Rhodamine 6G a mean diffusion correlation time of (525 ± 4) μs giving a mean radial 1/e2 radius of = (0.95 ± 0.03) μm and a mean focal volume of = (16 ± 2) μm3; for the case of the measurements with Cy5, a mean diffusion correlation time of (271 ± 4) μs was obtained, with a = (0.62 ± 0.01) μm and a mean focal volume of = (3.8 ± 0.3) μm3, using the following equation:
Diffusion coefficients were determined using the Stokes-Einstein:
where is Boltzmann’s constant, the temperature, the dynamic viscosity of the solvent and thehydrodynamic radius of the particle. Values for the viscosity of water were set at (25 °C) = 0.89 cP.
4.9. Flow Cytometry
To evaluate the efficiency of electroporation-mediated delivery of Cas9-Cy5, we used SaB-1 and DLB-1 marine fish cell lines. Cells were seeded in 24-well plates and allowed to reach approximately 90% confluence. On the day of electroporation, cells were detached using 0.25% Trypsin-EDTA, counted, and 100,000 cells per condition were collected. After washing with PBS, cells were resuspended in buffer R at a concentration of 1 × 10⁷ cells/ml and incubated with Cas9 protein conjugated to Cy5 at final concentrations of 1, 2, 3, or 5 µM.
Electroporation was carried out using the Neon NxT Electroporation System (Invitrogen) with three pulse settings: 1400 V 20 ms 1 pulse, 1400 V 20 ms 2 pulses, and 1650 V 15 ms 2 pulses. Non-electroporated controls and mock-electroporated controls (0 µM Cas9-Cy5) were included in the experimental design to control for background fluorescence and treatment effects. Electroporated cells were immediately transferred to L-15 medium supplemented with 10% heat-inactivated FBS and seeded in 24-well plates. Each condition was analyzed in duplicate (n = 2).
Forty-eight hours after electroporation, cells were dissociated and resuspended in 100 µl of flow cytometry buffer (PBS + 1% hiFBS). We acquired 10,000 events per sample on a CytoFLEX flow cytometer (Beckman Coulter), equipped with a red laser (638 nm) and a 660/10 APC filter to detect the Cy5 signal.
The gating strategy included an initial selection of the cell population on the FSC-A vs. SSC-A plot to exclude debris, followed by a singlet gate on the FSC-A vs. FSC-H plot to eliminate aggregates. The percentage of cells containing Cas9-Cy5 was then determined on an APC-H histogram or APC-H vs. Count plot. The fluorescence threshold for positivity was established using the 0 µM Cas9-Cy5 controls and remained consistent across all samples.
Phase contrast images were acquired using an inverted Oxion 2053.PLPH microscope and CMEX-5 Pro camera (Euromex), and processed with ImageFocus Alpha and ImageJ software.
4.10. Data Visualization and Analysis
Sequence validation and editing analysis were conducted using a combination of Benchling, GraphPad Prism (v9.5.1), and R (v4.3.1). Chromatograms from Sanger sequencing were first uploaded to Benchling (www.benchling.com) to verify base calling accuracy, annotate sgRNA binding sites and predicted cut sites, and confirm the absence of polymorphisms in wild-type controls.
Editing efficiency was then quantified from ICE (Inference of CRISPR Edits) outputs derived from the validated Sanger data. Indel percentages were plotted using GraphPad Prism to compare editing performance across delivery methods, RNP doses, and cell lines. To visualize the diversity and frequency of edited alleles, ICE-generated .json files were processed using a custom R script with the packages jsonlite, tidyverse, ggplot2, and stringr. The script extracted indel variants and generated color-coded alignments, using a consistent base-color scheme: adenine (green), thymine (red), guanine (orange), cytosine (blue), deletions (gray), and cut site markers (black).
Flow cytometry data were analyzed in R to assess transfection efficiency. Raw CytExpert exports were processed using readxl, dplyr, ggplot2, and ggpubr. The percentage of Cy5-positive cells (%_pos) and mean fluorescence intensity (MFI) were extracted from the “Cas9-Cy5 % Total” and “Cas9-Cy5 Mean APC-H” columns, respectively. Missing MFI entries (e.g., “####”) were replaced with a conservative fixed value (100) for plotting consistency. Three types of plots were generated: line plots for %_pos across electroporation conditions and doses, bar plots of MFI values, and bubble plots integrating both metrics (MFI as point size). Statistical analysis was performed using two-way ANOVA followed by Bonferroni post hoc correction (ggpubr::compare_means), with significance set at p < 0.05.
4.11. Synthesis and Characterization of SPIONs@Gelatin
4.11.1. Materials
Monodisperse gelatin PH3226 was kindly provided by Gelita (Germany). Glutaraldehyde aqueous solution (25%) was purchased from Acros Organics (Belgium), and genipin was obtained from Fujifilm Wako (Japan). Hydrochloric acid solution (37%) was acquired from Fisher Scientific (USA), and sodium hydroxide from Merck (Germany). Reagent-grade acetone and absolute ethanol were purchased from Scharlau (Spain). Iron(III) chloride hexahydrate (FeCl₃·6H₂O, 99%), iron(II) sulfate heptahydrate (FeSO₄·7H₂O, 99%), sodium citrate dihydrate (C₆H₅Na₃O₇·2H₂O, 98%), ammonium hydroxide (NH₄OH, 28%), fluorescein isothiocyanate (FITC, 90%) and phosphate-buffered saline (PBS) were obtained from Merck (USA). Milli-Q® deionized water (Millipore, USA) was used in all experiments.
4.11.2. Synthesis of Citrate coated SPIONs
SPIONs coated with citrate (SPIONs@Citrate) were synthesized via a coprecipitation method [35]. Briefly, 45 mmol of FeCl₃·6H₂O and 30 mmol of FeSO₄·7H₂O (Fe³⁺/Fe²⁺ molar ratio of 1.5) were dissolved in 100 mL of a 10 mM aqueous HCl solution under mechanical stirring (210 rpm). Once the salts were completely dissolved, the solution was heated to 60 °C. Upon reaching this temperature, 770 mmol of NH₄OH were added, resulting in an immediate color change from brown to black, indicating the formation of magnetite. After 30 seconds, 1.11 mmol of sodium citrate were added, and the reaction was allowed to proceed for 1 hour under constant stirring.
After completion, the reaction mixture was cooled to room temperature and acidified to pH 5 using a 9% HCl solution, under continuous stirring. The magnetite nanoparticles were then separated from the reaction medium using a neodymium magnet. The resulting SPIONs were washed thoroughly with Milli-Q® water (6×) and finally redispersed in Milli-Q® water.
4.11.3. Synthesis of Fluorescent Gelatin coated SPIONs
Fluorescent gelatin-based magnetic nanoparticles loaded with SPIONs were synthesized using SPIONs@Citrate as the magnetic core. To ensure homogeneous dispersion, an aqueous suspension of SPIONs@Citrate (3.5 mL, 0.72 mg/mL) was sonicated for 5 minutes (Branson Sonifier, output 1, 95% duty cycle). Immediately after sonication, an equal volume of a FITC-functionalized gelatin solution (40 mg/mL, containing 20 mg of FITC) was added under constant stirring. Fluorescent magnetic nanoparticle formation was subsequently carried out by the desolvation method, following previously established protocols. In this preparation, magnetic separation was employed for fluorescent SPIONs@Gelatin isolation using an external magnet over 24 hours [35]. The supernatant was then removed, and the resulting fluorescent magnetic gelatin nanoparticles were resuspended in 2 mL of PBS.
4.11.4. Bioconjugation of Fluorescent Gelatin-coated SPIONs with Cas9–sgRNA Complexes
To directly immobilize the two sgRNA complexes (derived from DLB-1 and SaB-1 species) onto the fluorescent SPIONs@Gelatin nanoparticles, the method described by Puertas was modified accordingly [36]. For this purpose, 200 μL of MES buffer solution (50 mM) containing EDC (0.0432 M) and Sulfo-NHS (0.0648 M) was added to 5 mg of fluorescent SPIONs@Gelatin dispersed in 800 μL of MES buffer (50 mM), yielding a final reaction volume of 1 mL. The mixture was homogenized using a vortex mixer and then incubated at 37 °C for 30 minutes under orbital shaking (200 rpm). Following activation, the supernatant was removed by pipetting after centrifugation at 13,000 rpm for 15 minutes, and the activated nanoparticles were resuspended in 1 mL of Milli-Q water using a 2-minute ultrasonic bath. This washing step was repeated twice.
Next, 100 μg of the desired sgRNA complexes were added to the activated fluorescent SPIONs@Gelatin suspension in Milli-Q water, and the mixture was incubated at 37 °C under orbital shaking (200 rpm) for 16 hours. After conjugation, the fluorescent SPIONs@Gelatin-RNPs were collected by centrifugation (13,000 rpm, 15 minutes, 4 °C), and the supernatant was discarded. The pellet was resuspended in 1 mL of Milli-Q water and sonicated for 2 minutes. This washing step was repeated two additional times.
Finally, the fluorescent SPIONs@Gelatin-RNPs were resuspended in sterile-grade water for further use.
4.12. Physicochemical and Biological Characterizations of SPIONs@Gelatin and SPIONs@Gelatine-RNP
4.12.1. Structural Characterization
The crystalline phase of the SPIONs@Gelatin was characterized by X-ray diffraction (XRD) using powder sample and a Philips PW1710 diffractometer (Panalytical, Brighton, UK) equipped with a Cu Kα radiation source (λ = 1.54186 Å). Data were collected over a 2θ range of 10° to 80°, with a step size of 0.02° and a counting time of 10 s per step. The XRD pattern of SPIONs@Gelatin is presented in Supplementary Figure S9A. The observed diffraction peaks correspond to the characteristic reflections at (220), (311), (400), (422), (511), (440), (620), and (553), in agreement with the standard pattern from the Joint Committee on Powder Diffraction Standards (JCPDS card no. 19-0629), which is consistent with the inverse spinel crystalline structure of magnetite [37]. In addition, a broad band observed at around 20°in the pattern is indicative of the amorphous nature of the gelatin coating [38].
4.12.2. Morphological Characterization
The morphology and size of SPIONs@Gelatin nanoparticles were analyzed by scanning transmission electron microscopy (STEM) using a Zeiss Gemini 450 Field Emission Scanning Electron Microscope (Carl Zeiss, Germany). Particle size distribution was determined by measuring 400 individual nanoparticles using ImageJ software. As shown in Supplementary Figure S9a, the SPIONs@Gelatin exhibit a relatively uniform distribution of spherical core–shell structures. The darker central regions correspond to the superparamagnetic iron oxide cores (SPIONs), while the lighter halos are indicative of the gelatin coating. The particles display good dispersion and minimal aggregation, suggesting effective surface functionalization with gelatin. The corresponding size distribution histogram (Supplementary Figure S9b) shows an average particle diameter of approximately 100 nm, with a narrow size range, indicating uniformity in synthesis.
Upon jugation with the Cas9–sgRNA complex, a morphological change is observed. Both bright-field (Supplementary Figure S9c) and dark-field (Supplementary Figure S9d) STEM images reveal that while the spherical morphology of the nanoparticles is preserved, there is a clear tendency toward aggregation. This behavior is likely due to intermolecular interactions between the gelatin-coated surfaces and the biomolecular components of the Cas9–sgRNA complex
4.12.3. Surface Characterization
The FT-IR spectra of gelatin, SPIONs@Citrate, and SPIONs@Gelatin are presented in Supplementary Figure S9
C. The spectrum of pure gelatin exhibits characteristic absorption bands at 3301 cm⁻¹ (νN–H), 1672 cm⁻¹ (νC=O, amide I), and 1473 cm⁻¹ (δN–H, amide II), which are consistent with its polypeptide structure and indicative of the presence of amide functional group [39,40]. In the spectrum of SPIONs@Citrate, several distinct absorption bands are observed at 3348, 2923, 2862, 1568, 1373, 1367, 1356, and 1063–1068 cm⁻¹. These signals correspond to O–H stretching (3348 cm⁻¹), C–H stretching of methylene groups (2923 and 2862 cm⁻¹), asymmetric and symmetric stretching vibrations of carboxylate groups (1568, 1373, 1367, and 1356 cm⁻¹), and C–O or C–C stretching modes (1063–1068 cm⁻¹). The presence of these bands confirms the successful functionalization of the SPIONs surface with citrate molecules, which act as stabilizing and anchoring agents for subsequent biopolymer coating [41]. The spectrum of SPIONs@Gelatin retains the characteristic bands of both gelatin and citrate, demonstrating the successful encapsulation of citrate-functionalized SPIONs within the gelatin matrix. In addition, a prominent absorption band at 580 cm⁻¹ is observed, corresponding to the Fe–O stretching vibration, which confirms the presence of magnetite as the magnetic core of the nanostructure [42]. The coexistence of organic (gelatin and citrate) and inorganic (Fe₃O₄) vibrational modes in the spectrum supports the effective stepwise functionalization of SPIONs, resulting in a stable citrate-modified, gelatin-coated magnetic core-shell nanostructure.
The Cas9–sgRNA quantification procedure was carried out following the manufacturer’s protocol using the Micro BCA Protein Assay Kit (Thermo Fisher Scientific). Bovine serum albumin (BSA) was used as the protein standard to construct the calibration curve. Standard BSA solutions were prepared at concentrations of 0, 3.125, 6.25, 12.5, 25, 50, 100, and 200 µg/mL (Figure 6b). Each standard and nanoparticle-protein sample was measured in triplicate in a 96-well microplate by adding 100 µL per well. After incubation, the absorbance of each well was measured at 562 nm using a microplate reader. The absorbance values obtained from the BSA standards were used to construct a linear calibration curve, resulting in the following regres-sion equation:
where y corresponds to the absorbance at 562 nm and x to the protein concentration in µg/mL. This linear relationship allowed accurate determination of the concentration of Cas9–sgRNA conjugated to the SPIONs@Gelatin nanoparticles based on the measured absorbance values. To evaluate the efficiency of different Cas9–sgRNA complexes upon immobilization, it tested two constructs, DLB-1 and SaB-1, starting from 100 µg of each complex. The immobilized DLB-1 complex exhibited a cleavage efficiency of 42.90%, corresponding to 42.90 µg retained on the nanoparticle surface. Similarly, the SaB-1 complex reached an efficiency of 38.68%, equivalent to 38.68 µg immobilized. These results indicate that both complexes retain a significant proportion of their mass upon immobilization, with DLB-1 showing slightly higher efficiency under the tested conditions. The remaining fraction, not bound to the Fluorescent SPIONs@Gelatin, accounted for 57.10 µg and 61.32 µg for DLB-1 and SaB-1, respectively.
y = 0.0092x ± 2.44 × 10⁻⁴ (R² = 0.998)
4.12.4. DLS Characterization
Hydrodynamic size and ζ-potential of fluorescent SPIONs@Gelatin and SPIONs@Gelatin-RNPs were measured using a Zetasizer Nano ZS (Malvern Instruments, UK) equipped with a 633 nm He–Ne laser at a 173° scattering angle and room temperature. Measurements were conducted in Milli-Q water at ~0.4 mg/mL magnetic nanomaterial concentration and pH 6.5. In Table 2, the hydrodynamic diameter, PDI, and ζ-potential values of SPIONs@Gelatin and SPIONs@Gelatin-RNPs are presented (the detailed values for each magnetic nanomaterial are in the Supplementary Figure S9). SPIONs@Gelatin exhibited a relatively small size (112.4 ± 44.0 nm) with a low polydispersity index (0.11), indicating a homogeneous population and good colloidal stability in aqueous medium. Upon bioconjugation, a significant increase in hydrodynamic diameter was observed (629.5 ± 180.7 nm), which is consistent with the formation of larger conjugates or mild aggregation induced by the biomolecule binding. Despite this increase in size, the PDI remained low (0.17), suggesting that the dispersion maintained acceptable uniformity. The ζ-potential also became more negative after bioconjugation (–25.0 ± 6.1 mV vs. –13.3 ± 3.6 mV), likely due to the presence of negatively charged functional groups on the biomolecules, which may contribute to enhanced electrostatic stabilization.
4.12.5. Optical Characterization
Optical characterization of fluorescent SPIONs@Gelatin and SPIONs@Gelatin-RNPs was performed using a Leica TCS SP8 SMD confocal laser scanning microscope with multispectral fluorescence imaging capability. Technical parameters included a resolution of 1024 × 1024 pixels, bidirectional X-axis scanning, and a HC PL APO CS 63×/1.40 oil immersion objective. Excitation was achieved using the 488 nm and 552 nm laser lines for FITC-labeled SPIONs@Gelatin and Cy5-labeled Cas9, respectively [43].
Confocal microscopy images (Figure 7) provide fluorescence-based visualization of SPIONs@Gelatin and their bioconjugation with fluorescent Cas9–sgRNA complexes. Figure 4Ca shows green fluorescence from SPIONs@Gelatin, indicating effective functionalization with the fluorophore. Figure 4Cb displays red fluorescence corresponding to the labeled Cas9–sgRNA complex. Upon bioconjugation using the DLB-1 complex (Figure 4Cc), strong colocalization of green and red fluorescence is observed, resulting in a yellow/orange merged signal. This suggests successful and efficient conjugation of Cas9–sgRNA to SPIONs@Gelatin mediated by DLB-1. Similarly, panel d (SaB-1 complex) shows fluorescence colocalization, though to a slightly lower extent compared to DLB-1. These results are consistent with the previously quantified immobilization efficiencies and confirm that both complexes effectively facilitate the attachment of Cas9–sgRNA to the magnetic nanoparticl platform.
4.12.6. Magnetic Characterization
The magnetic properties of the SPIONs@Gelatin nanocomposite were evaluated using a vibrating sample magnetometer (VSM, DMS, Lowell, MA, USA) at room temperature. As shown in Supplementary Figure S9D, the magnetization curve exhibits a typical hysteresis loop with negligible coercivity and remanence, indicating superparamagnetic behavior at room temperature [44]. The saturation magnetization (Ms) was approximately 66 emu/gFe3O4, which confirms the retention of magnetic properties after gelatin coating. The inset of Figure 6 displays the zero-field-cooled (ZFC) and field-cooled (FC) magnetization curves recorded under an applied field of 100 Oe measured by a Superconducting Quantum Interference Device (SQUID) Magnetometer (Quantum Design, Darmstadt, Germany). The divergence between the ZFC and FC curves, along with the broad maximum observed in the ZFC curve around the blocking temperature (TB = 90 K), further confirms the presence of superparamagnetic nanoparticles at room temperature [45].
4.12.7. Magnetofection Protocol Using Neodymium-Based Magnetic Plates
Magnetofection was performed using custom magnetic arrays designed to fit under standard 24-well and 96-well tissue culture plates. Each position in the array consisted of a circular neodymium magnet disc (diameter: 10 mm; thickness: 2 mm; strength: N52 grade) placed inside a polypropylene support that aligned precisely beneath each well. The magnetic plate was positioned beneath the culture plate immediately after the addition of SPIONs@Gelatin–RNP complexes.
Cells were seeded at ~20,000 cells/well (96-well format) or ~100,000 cells/well (24-well format) and allowed to adhere overnight at 28 °C. On the day of treatment, SPIONs@Gelatin–RNP complexes were added directly to the culture medium in each well. Immediately after addition, the magnetic array was placed underneath the culture plate to generate a downward magnetic force, enhancing nanoparticle sedimentation and cell contact.
Three volumes of nanoparticle suspension were tested: 100, 200, and 500 µL per well, corresponding to final RNP doses of 0.41, 0.82, and 2.05 ng per cell, respectively. Incubations were carried out at 25 °C for 30 or 60 minutes. After exposure, the culture medium was replaced with fresh L-15 medium supplemented with 10% FBS and 1% penicillin/streptomycin, and cells were cultured for 48 hours prior to fluorescence imaging and genomic DNA extraction.
Control conditions lacking magnetic exposure were processed in parallel using identical volumes and incubation times but without the magnetic plate. All experimental steps were conducted in triplicate for each cell line and condition.
Supplementary Materials
The following supporting information can be downloaded at the website of this paper posted on Preprints.org, Table S1: Primers used for amplification of ifi27l2a in seabass (DLB-1) and gilthead seabream (SaB-1) cell lines; Table S2: CRISPR/Cas9 sgRNAs targeting ifi27l2a in seabass and gilthead seabream; Figure S1: ICE analysis of CRISPR/Cas9 editing outcomes at the ifi27l2a locus in DLB-1 and SaB-1 cells; Figure S2: Quantitative analysis of Cas9-Cy5 delivery in DLB-1 and SaB-1 cells by flow cytometry; Figure S3A: Brightfield images of DLB-1 cells acquired immediately prior to flow cytometry analysis, showing the effects of different electroporation conditions (voltage, pulse number/duration) and Cas9-Cy5 concentrations (0–5 µM); Figure S3B: Brightfield images of SaB-1 cells captured immediately before flow cytometry, following identical electroporation protocols as in S5A; Video S1: Intracellular distribution of Cas9-Cy5 following electroporation in DLB-1 cells stained with Rhodamine; Figure S4: Confocal imaging of SaB-1 cells after lipofection with Diversa lipid nanoparticles (LNPs); Video S2: Confocal imaging showing the subcellular distribution of components following lipofection with Diversa lipid nanoparticles (LNPs); Video S3: Imaging of a different region of the cell culture, showing the same distribution pattern: Diversa nanoparticles (green) remain in the upper focal planes, while Cas9-Cy5 (red) is detected in deeper intracellular locations; Video S4: High-magnification confocal video of two cells showing initial localization of LNPs (green) in upper focal planes, followed by Cas9-Cy5 (red) in deeper layers, superimposed on a brightfield image; Figure S5: Normalized fluorescence correlation curves of Cas9 labeled with Cy5 in cell medium (ThermoFisher, Opti-MEM™) (left panel) and Cas9 labeled with Cy3 in HEPES buffer, pH 7.4 (right panel); Figure S6: PCR amplification of three genomic regions (P1, P2, PE) from SaB-1 and DLB-1 cell lines using three commercial DNA polymerases (BioTaq, Applied Biosystems, Promega) and four DNA sources: QuickExtract (QE), Chelex 100, DNeasy Blood & Tissue Kit (Kit), and crude seabass DNA (positive control); Figure S7: Amplification of genomic DNA extracted from fish cell lines using three different methods: QuickExtract DNA, Chelex 100, and the DNeasy Blood and Tissue Kit; Figure S8: Representative fluorescence microscopy image of DLB-1 cells transfected with Cas9-Cy3 RNPs using Lipofectamine 3000. Red signal (Cy3) indicates Cas9 distribution; Figure S9.
Author Contributions
Conceptualization, D.R., Á.J.A. and L.S.; methodology, Á.J.A., S.V., D.C. and M.A.G.-G.; software, Á.J.A., S.V., D.C. and M.A.G.-G.; validation, Á.J.A., S.V., D.C. and M.A.G.-G.; formal analysis, Á.J.A., S.V., D.C. and M.A.G.-G.; investigation, Á.J.A., S.V., D.C., M.A.G.-G., A.S., M.C., D.P. and A.C.; resources, D.R., L.S., P.M., M.N., W.A.-S., Y.P., J.R., A.C. and Á.J.A.; data curation, Á.J.A., S.V., D.C., M.A.G.-G. and A.C.; writing—original draft preparation, Á.J.A.; writing—review and editing, Á.J.A., D.R., P.M., M.N., D.C., M.A.G.-G., A.S. and S.V.; visualization, Á.J.A., S.V., D.C. and M.A.G.-G.; supervision, Á.J.A., D.R., L.S. and P.M.; project administration, D.R., P.M., L.S., M.N. and Á.J.A.; funding acquisition, D.R., P.M., L.S., M.N. and Á.J.A. All authors have read and agreed to the published version of the manuscript.
Funding
This research was founded by the collaborative project at Campus Terra, University of Santiago de Compostela, within the framework of the Collaboration Agreement between the USC and the Department of Culture, Education, Vocational Training, and Universities and it was also founded by Fundación Caixa Rural Galega Tomás Notario Vacas within the project Optimizing CRISPR/Cas9 genome editing to improve disease resistance in aquaculture. Additionally, this research was carried out under the framework of Spain's Recovery and Resilience Plan, specifically under investment line nº 1 and component number 17, which includes the Complementary RTDI Plan for Marine Science. This plan is part of the Complementary RTDI Plan with the autonomous regions of Spain, including the Marine Science Program for Galicia. This work also was funded by the European Union ERC Starting Grant programme 2022 under grant agreement No 101076432 (FishTRIM). DR was supported by the Oportunius programme of the Axencia Galega the Innovación (GAIN, Xunta de Galicia), and by BBSRC Institute Strategic Grants to the Roslin Institute (BBS/E/20002172, BBS/E/D/30002275, BBS/E/D/10002070 and BBS/E/RL/230002A).
Acknowledgments
A.S. thanks Fundación Caixa Rural Galega Tomás Notario Vacas for his predoctoral contract. D.C. thanks the Xunta de Galicia for his research scholarship “Campus de Especialización Campus Terra”.
Conflicts of Interest
The authors declare no conflicts of interest.
Abbreviations
The following abbreviations are used in this manuscript:
| CRISPR | Clustered Regularly Interspaced Short Palindromic Repeats |
| Cas9 | CRISPR-associated protein 9 |
| RNP | Ribonucleoprotein complex |
| sgRNA | Single-guide RNA |
| LNP | Lipid nanoparticle |
| SPIONs | Superparamagnetic iron oxide nanoparticles |
| ICE | Inference of CRISPR Edits |
| FCS | Fluorescence Correlation Spectroscopy |
| PCR | Polymerase Chain Reaction |
| PBS | Phosphate-buffered saline |
| FBS | Fetal bovine serum |
| PE P1 P2 |
Primer pairs used for PCR amplification of ifi27l2a |
| WT | Wild-type |
| KO | Knock-out |
| DLB-1 | Dicentrarchus labrax brain-derived cell line |
| SaB-1 | Sparus aurata brain-derived cell line |
| DAPI | 4′,6-diamidino-2-phenylindole |
| Cy5 | Cyanine 5 (fluorophore) |
| SEM | Standard error of the mean |
| GC | Guanine–cytosine content |
References
- Jinek, M.; Chylinski, K.; Fonfara, I.; Hauer, M.; Doudna, J.A.; Charpentier, E. A Programmable Dual-RNA-Guided DNA Endonuclease Adaptive Bacterial Immunity. Science 2012, 337, 816–821. [CrossRef]
- Yang, Z.; Fu, G.; Lee, M.; Yeo, S.; Yue, G.H. Genes for Editing to Improve Economic Traits in Aquaculture Fish Species. Aquac. Fish. 2025, 10, 1–18. [CrossRef]
- Gratacap, R.L.; Wargelius, A.; Edvardsen, R.B.; Houston, R.D. Potential of Genome Editing to Improve Aquaculture Breeding and Production. Trends Genet. 2019, 35, 672–684. [CrossRef]
- Zoppo, M.; Okoniewski, N.; Pantelyushin, S.; Vom Berg, J.; Schirmer, K. A Ribonucleoprotein Transfection Strategy for CRISPR/Cas9-mediated Gene Editing and Single Cell Cloning in Rainbow Trout Cells. Cell Biosci. 2021, 11, 103. [CrossRef]
- Lopez, A.; Fernandez-Alonso, M.; Rocha, A.; Estepa, A.; Coll, J.M. Transfection of Epithelioma Papulosum Cyprini (EPC) Carp Cells.
- Gratacap, R.L.; Regan, T.; Dehler, C.E.; Martin, S.A.M.; Boudinot, P.; Collet, B.; Houston, R.D. Efficient CRISPR/Cas9 Genome Editing in a Salmonid Fish Cell Line Using a Lentivirus Delivery System. BMC Biotechnol. 2020, 20, 35. [CrossRef]
- Kim, M.S.; Kim, K.H. Effect of CRISPR/Cas9-Mediated Knockout of Either Mx1 or ISG15 Gene in EPC Cells on Resistance against VHSV Infection. Fish Shellfish Immunol. 2019, 93, 1041–1046. [CrossRef]
- Hamar, J.; Kültz, D. An Efficient Vector-Based CRISPR/Cas9 System in an Oreochromis Mossambicus Cell Line Using Endogenous Promoters. Sci. Rep. 2021, 11, 7854. [CrossRef]
- Escobar-Aguirre, S.; Arancibia, D.; Escorza, A.; Bravo, C.; Andrés, M.E.; Zamorano, P.; Martínez, V. Development of a Bicistronic Vector for the Expression of a CRISPR/Cas9-mCherry System in Fish Cell Lines. Cells 2019, 8, 75. [CrossRef]
- Zhu, M.; Sumana, S.L.; Abdullateef, M.M.; Falayi, O.C.; Shui, Y.; Zhang, C.; Zhu, J.; Su, S. CRISPR/Cas9 Technology for Enhancing Desirable Traits of Fish Species in Aquaculture. Int. J. Mol. Sci. 2024, 25, 9299. [CrossRef]
- Liu, Q.; Yuan, Y.; Zhu, F.; Hong, Y.; Ge, R. Efficient Genome Editing Using CRISPR/Cas9 Ribonucleoprotein Approach in Cultured Medaka Fish Cells. Biol. Open 2018, bio.035170. [CrossRef]
- Karp, H.; Zoltek, M.; Wasko, K.; Vazquez, A.L.; Brim, J.; Ngo, W.; Schepartz, A.; Doudna, J.A. Packaged Delivery of CRISPR–Cas9 Ribonucleoproteins Accelerates Genome Editing. Nucleic Acids Res. 2025, 53, gkaf105. [CrossRef]
- Seijas, A.; Cora, D.; Novo, M.; Al-Soufi, W.; Sánchez, L.; Arana, Á.J. CRISPR/Cas9 Delivery Systems to Enhance Gene Editing Efficiency 2025.
- Marnis, H.; Syahputra, K. Advancing Fish Disease Research through CRISPR-Cas Genome Editing: Recent Developments and Future Perspectives. Fish Shellfish Immunol. 2025, 160, 110220. [CrossRef]
- K. Jain, P.; H. Lo, J.; Rananaware, S.; Downing, M.; Panda, A.; Tai, M.; Raghavan, S.; E. Fleming, H.; N. Bhatia, S. Non-Viral Delivery of CRISPR/Cas9 Complex Using CRISPR-GPS Nanocomplexes. Nanoscale 2019, 11, 21317–21323. [CrossRef]
- Nguyen, D.N.; Roth, T.L.; Li, P.J.; Chen, P.A.; Apathy, R.; Mamedov, M.R.; Vo, L.T.; Tobin, V.R.; Goodman, D.; Shifrut, E.; et al. Polymer-Stabilized Cas9 Nanoparticles and Modified Repair Templates Increase Genome Editing Efficiency. Nat. Biotechnol. 2020, 38, 44–49. [CrossRef]
- Manzano, I.; Taylor, N.; Csordas, M.; Vezeau, G.E.; Salis, H.M.; Zydney, A.L. Purification of Cas9—RNA Complexes by Ultrafiltration. Biotechnol. Prog. 2021, 37. [CrossRef]
- Delpuech, E.; Vandeputte, M.; Morvezen, R.; Bestin, A.; Besson, M.; Brunier, J.; Bajek, A.; Imarazene, B.; François, Y.; Bouchez, O.; et al. Whole-genome Sequencing Identifies Interferon-Induced Protein IFI6/IFI27-like as a Strong Candidate Gene for VNN Resistance in European Sea Bass. Genet. Sel. Evol. 2023, 55, 30. [CrossRef]
- Mukiibi, R.; Ferraresso, S.; Franch, R.; Peruzza, L.; Dalla Rovere, G.; Babbucci, M.; Bertotto, D.; Toffan, A.; Pascoli, F.; Faggion, S.; et al. Integrated Functional Genomic Analysis Identifies Regulatory Variants Underlying a Major QTL for Disease Resistance in European Sea Bass. BMC Biol. 2025, 23, 75. [CrossRef]
- Vela-Avitúa, S.; Thorland, I.; Bakopoulos, V.; Papanna, K.; Dimitroglou, A.; Kottaras, E.; Leonidas, P.; Guinand, B.; Tsigenopoulos, C.S.; Aslam, M.L. Genetic Basis for Resistance Against Viral Nervous Necrosis: GWAS and Potential of Genomic Prediction Explored in Farmed European Sea Bass (Dicentrarchus Labrax). Front. Genet. 2022, 13, 804584. [CrossRef]
- Camperi, J.; Moshref, M.; Dai, L.; Lee, H.Y. Physicochemical and Functional Characterization of Differential CRISPR-Cas9 Ribonucleoprotein Complexes. Anal. Chem. 2022, 94, 1432–1440. [CrossRef]
- Qin, Z.; Li, Y.; Su, B.; Cheng, Q.; Ye, Z.; Perera, D.A.; Fobes, M.; Shang, M.; Dunham, R.A. Editing of the Luteinizing Hormone Gene to Sterilize Channel Catfish, Ictalurus Punctatus, Using a Modified Zinc Finger Nuclease Technology with Electroporation. Mar. Biotechnol. 2016, 18, 255–263. [CrossRef]
- Chen, Z.-Y.; Li, N.-J.; Cheng, F.-Y.; Hsueh, J.-F.; Huang, C.-C.; Lu, F.-I.; Fu, T.-F.; Yan, S.-J.; Lee, Y.-H.; Wang, Y.-J. The Effect of the Chorion on Size-Dependent Acute Toxicity and Underlying Mechanisms of Amine-Modified Silver Nanoparticles in Zebrafish Embryos. Int. J. Mol. Sci. 2020, 21, 2864. [CrossRef]
- Kazemian, P.; Yu, S.-Y.; Thomson, S.B.; Birkenshaw, A.; Leavitt, B.R.; Ross, C.J.D. Lipid-Nanoparticle-Based Delivery of CRISPR/Cas9 Genome-Editing Components. Mol. Pharm. 2022, 19, 1669–1686. [CrossRef]
- Goodwin, T.; Huang, L. Nonviral Vectors: We Have Come a Long Way. Adv. Genet. 2014, 88, 1–12. [CrossRef]
- Pudgerd, A.; Saedan, S.; Santimanawong, W.; Weerachatyanukul, W.; Jariyapong, P.; Chaijarasphong, T.; Jongsomchai, K.; Sritunyalucksana, K.; Vanichviriyakit, R.; Chotwiwatthanakun, C. Genome Editing of WSSV CRISPR/Cas9 and Immune Activation Extends the Survival of Infected Penaeus Vannamei. Sci. Rep. 2024, 14, 26306. [CrossRef]
- Schauber, C.A.; Tuerk, M.J.; Pacheco, C.D.; Escarpe, P.A.; Veres, G. Lentiviral Vectors Pseudotyped with Baculovirus Gp64 Efficiently Transduce Mouse Cells in Vivo and Show Tropism Restriction against Hematopoietic Cell Types in Vitro. Gene Ther. 2004, 11, 266–275. [CrossRef]
- Gonçalves, E.; Behan, F.M.; Louzada, S.; Arnol, D.; Stronach, E.A.; Yang, F.; Yusa, K.; Stegle, O.; Iorio, F.; Garnett, M.J. Structural Rearrangements Generate Cell-Specific, Gene-Independent CRISPR-Cas9 Loss of Fitness Effects. Genome Biol. 2019, 20, 27. [CrossRef]
- Van Eenennaam, A.L. New Genomic Techniques (NGT) in Animals and Their Agri/Food/Feed Products. EFSA Support. Publ. 2023, 20. [CrossRef]
- Peulen, T.-O.; Hemmen, K.; Greife, A.; Webb, B.M.; Felekyan, S.; Sali, A.; Seidel, C.A.M.; Sanabria, H.; Heinze, K.G. Tttrlib: Modular Software for Integrating Fluorescence Spectroscopy, Imaging, and Molecular Modeling. Bioinformatics 2025, 41, btaf025. [CrossRef]
- Culbertson, C.T.; Jacobson, S.C.; Ramsey, J.M. Diffusion Coefficient Measurements in Microfluidic Devices. Talanta 2002, 56, 365–373.
- Gendron, P.-O.; Avaltroni, F.; Wilkinson, K.J. Diffusion Coefficients of Several Rhodamine Derivatives as Determined by Pulsed Field Gradient–Nuclear Magnetic Resonance and Fluorescence Correlation Spectroscopy. J. Fluoresc. 2008, 18, 1093–1101. [CrossRef]
- Muller, C.B.; Loman, A.; Richtering, W.; Enderlein, J. Dual-Focus Fluorescence Correlation Spectroscopy of Colloidal Solutions: Influence of Particle Size. J. Phys. Chem. B 2008, 112, 8236–8240.
- Majer, G.; Zick, K. Accurate and Absolute Diffusion Measurements of Rhodamine 6G in Low-Concentration Aqueous Solutions by the PGSE-WATERGATE Sequence. J. Chem. Phys. 2015, 142, 164202. [CrossRef]
- Teijeiro-Valiño, C.; González Gómez, M.A.; Yáñez, S.; García Acevedo, P.; Arnosa Prieto, A.; Belderbos, S.; Gsell, W.; Himmelreich, U.; Piñeiro, Y.; Rivas, J. Biocompatible Magnetic Gelatin Nanoparticles with Enhanced MRI Contrast Performance Prepared by Single-Step Desolvation Method. Nano Express 2021, 2, 020011. [CrossRef]
- uertas, S.; Batalla, P.; Moros, M.; Polo, E.; Del Pino, P.; Guisán, J.M.; Grazú, V.; De La Fuente, J.M. Taking Advantage of Unspecific Interactions to Produce Highly Active Magnetic Nanoparticle−Antibody Conjugates. ACS Nano 2011, 5, 4521–4528. [CrossRef]
- Jiang, W.; Lai, K.-L.; Hu, H.; Zeng, X.-B.; Lan, F.; Liu, K.-X.; Wu, Y.; Gu, Z.-W. The Effect of [Fe3+]/[Fe2+] Molar Ratio and Iron Salts Concentration on the Properties of Superparamagnetic Iron Oxide Nanoparticles in the Water/Ethanol/Toluene System. J. Nanoparticle Res. 2011, 13, 5135–5145. [CrossRef]
- Sultan, M.; Ibrahim, H.; El-Masry, H.M.; Hassan, Y.R. Antimicrobial Gelatin-Based Films with Cinnamaldehyde and ZnO Nanoparticles for Sustainable Food Packaging. Sci. Rep. 2024, 14, 22499. [CrossRef]
- Peng, J.; Wang, X.; Lou, T. Preparation of Chitosan/Gelatin Composite Foam with Ternary Solvents of Dioxane/Acetic Acid/Water and Its Water Absorption Capacity. Polym. Bull. 2020, 77, 5227–5244. [CrossRef]
- Ibrahim, H.M.; Taha, G.M.; El-Alfy, E.A.; El-Bisi, M.K. Enhancing Antibacterial Action of Gauze by Adding Gelatin Nanoparticles Loaded with Spectinomycin and Chloramphenicol. Cellulose 2022, 29, 5677–5688. [CrossRef]
- Nalbandian, L.; Patrikiadou, E.; Zaspalis, V.; Patrikidou, A.; Hatzidaki, E.; N. Papandreou, C. Magnetic Nanoparticles in Medical Diagnostic Applications: Synthesis, Characterization and Proteins Conjugation. Curr. Nanosci. 2016, 12, 455–468. [CrossRef]
- Rajan, A.; Sharma, M.; Sahu, N.K. Assessing Magnetic and Inductive Thermal Properties of Various Surfactants Functionalised Fe3O4 Nanoparticles for Hyperthermia. Sci. Rep. 2020, 10, 15045. [CrossRef]
- García Acevedo, P.; González Gómez, M.A.; Arnosa Prieto, Á.; De Castro Alves, L.; Seco Gudiña, R.; Piñeiro, Y.; Rivas, J. Fluorescent Single-Core and Multi-Core Nanoprobes as Cell Trackers and Magnetic Nanoheaters. Magnetochemistry 2022, 8, 83. [CrossRef]
- Wallyn, J.; Anton, N.; Vandamme, T.F. Synthesis, Principles, and Properties of Magnetite Nanoparticles for In Vivo Imaging Applications—A Review. Pharmaceutics 2019, 11, 601. [CrossRef]
- Liu, C.; Zou, B.; Rondinone, A.J.; Zhang, Z.J. Chemical Control of Superparamagnetic Properties of Magnesium and Cobalt Spinel Ferrite Nanoparticles through Atomic Level Magnetic Couplings. J. Am. Chem. Soc. 2000, 122, 6263–6267. [CrossRef]
Figure 1.
Schematic overview of the CRISPR/Cas9 delivery strategies evaluated in this study. The diagram illustrates three distinct methods for delivering CRISPR/Cas9 components into marine fish cell lines. Electroporation: Pre-assembled Cas9–sgRNA RNP complexes were mixed with cells and introduced via the Neon™ electroporation system. Cells were subsequently seeded for recovery and genotyping. Lipofection: Synthetic sgRNAs were formulated with DIVERSA lipid nanoparticles (LNPs) in citrate buffer to generate sgRNA-loaded LNPs. After incubation with cells, endogenous Cas9 protein was internalized to reconstitute functional RNPs intracellularly. Magnetofection: Cas9–sgRNA RNPs were directly conjugated to gelatin-coated superparamagnetic iron oxide nanoparticles (SPIONs@Gelatin-RNP). Following conjugation, cells were incubated with the complexes and subjected to magnetic field exposure to enhance sedimentation and uptake of the nanoparticles.
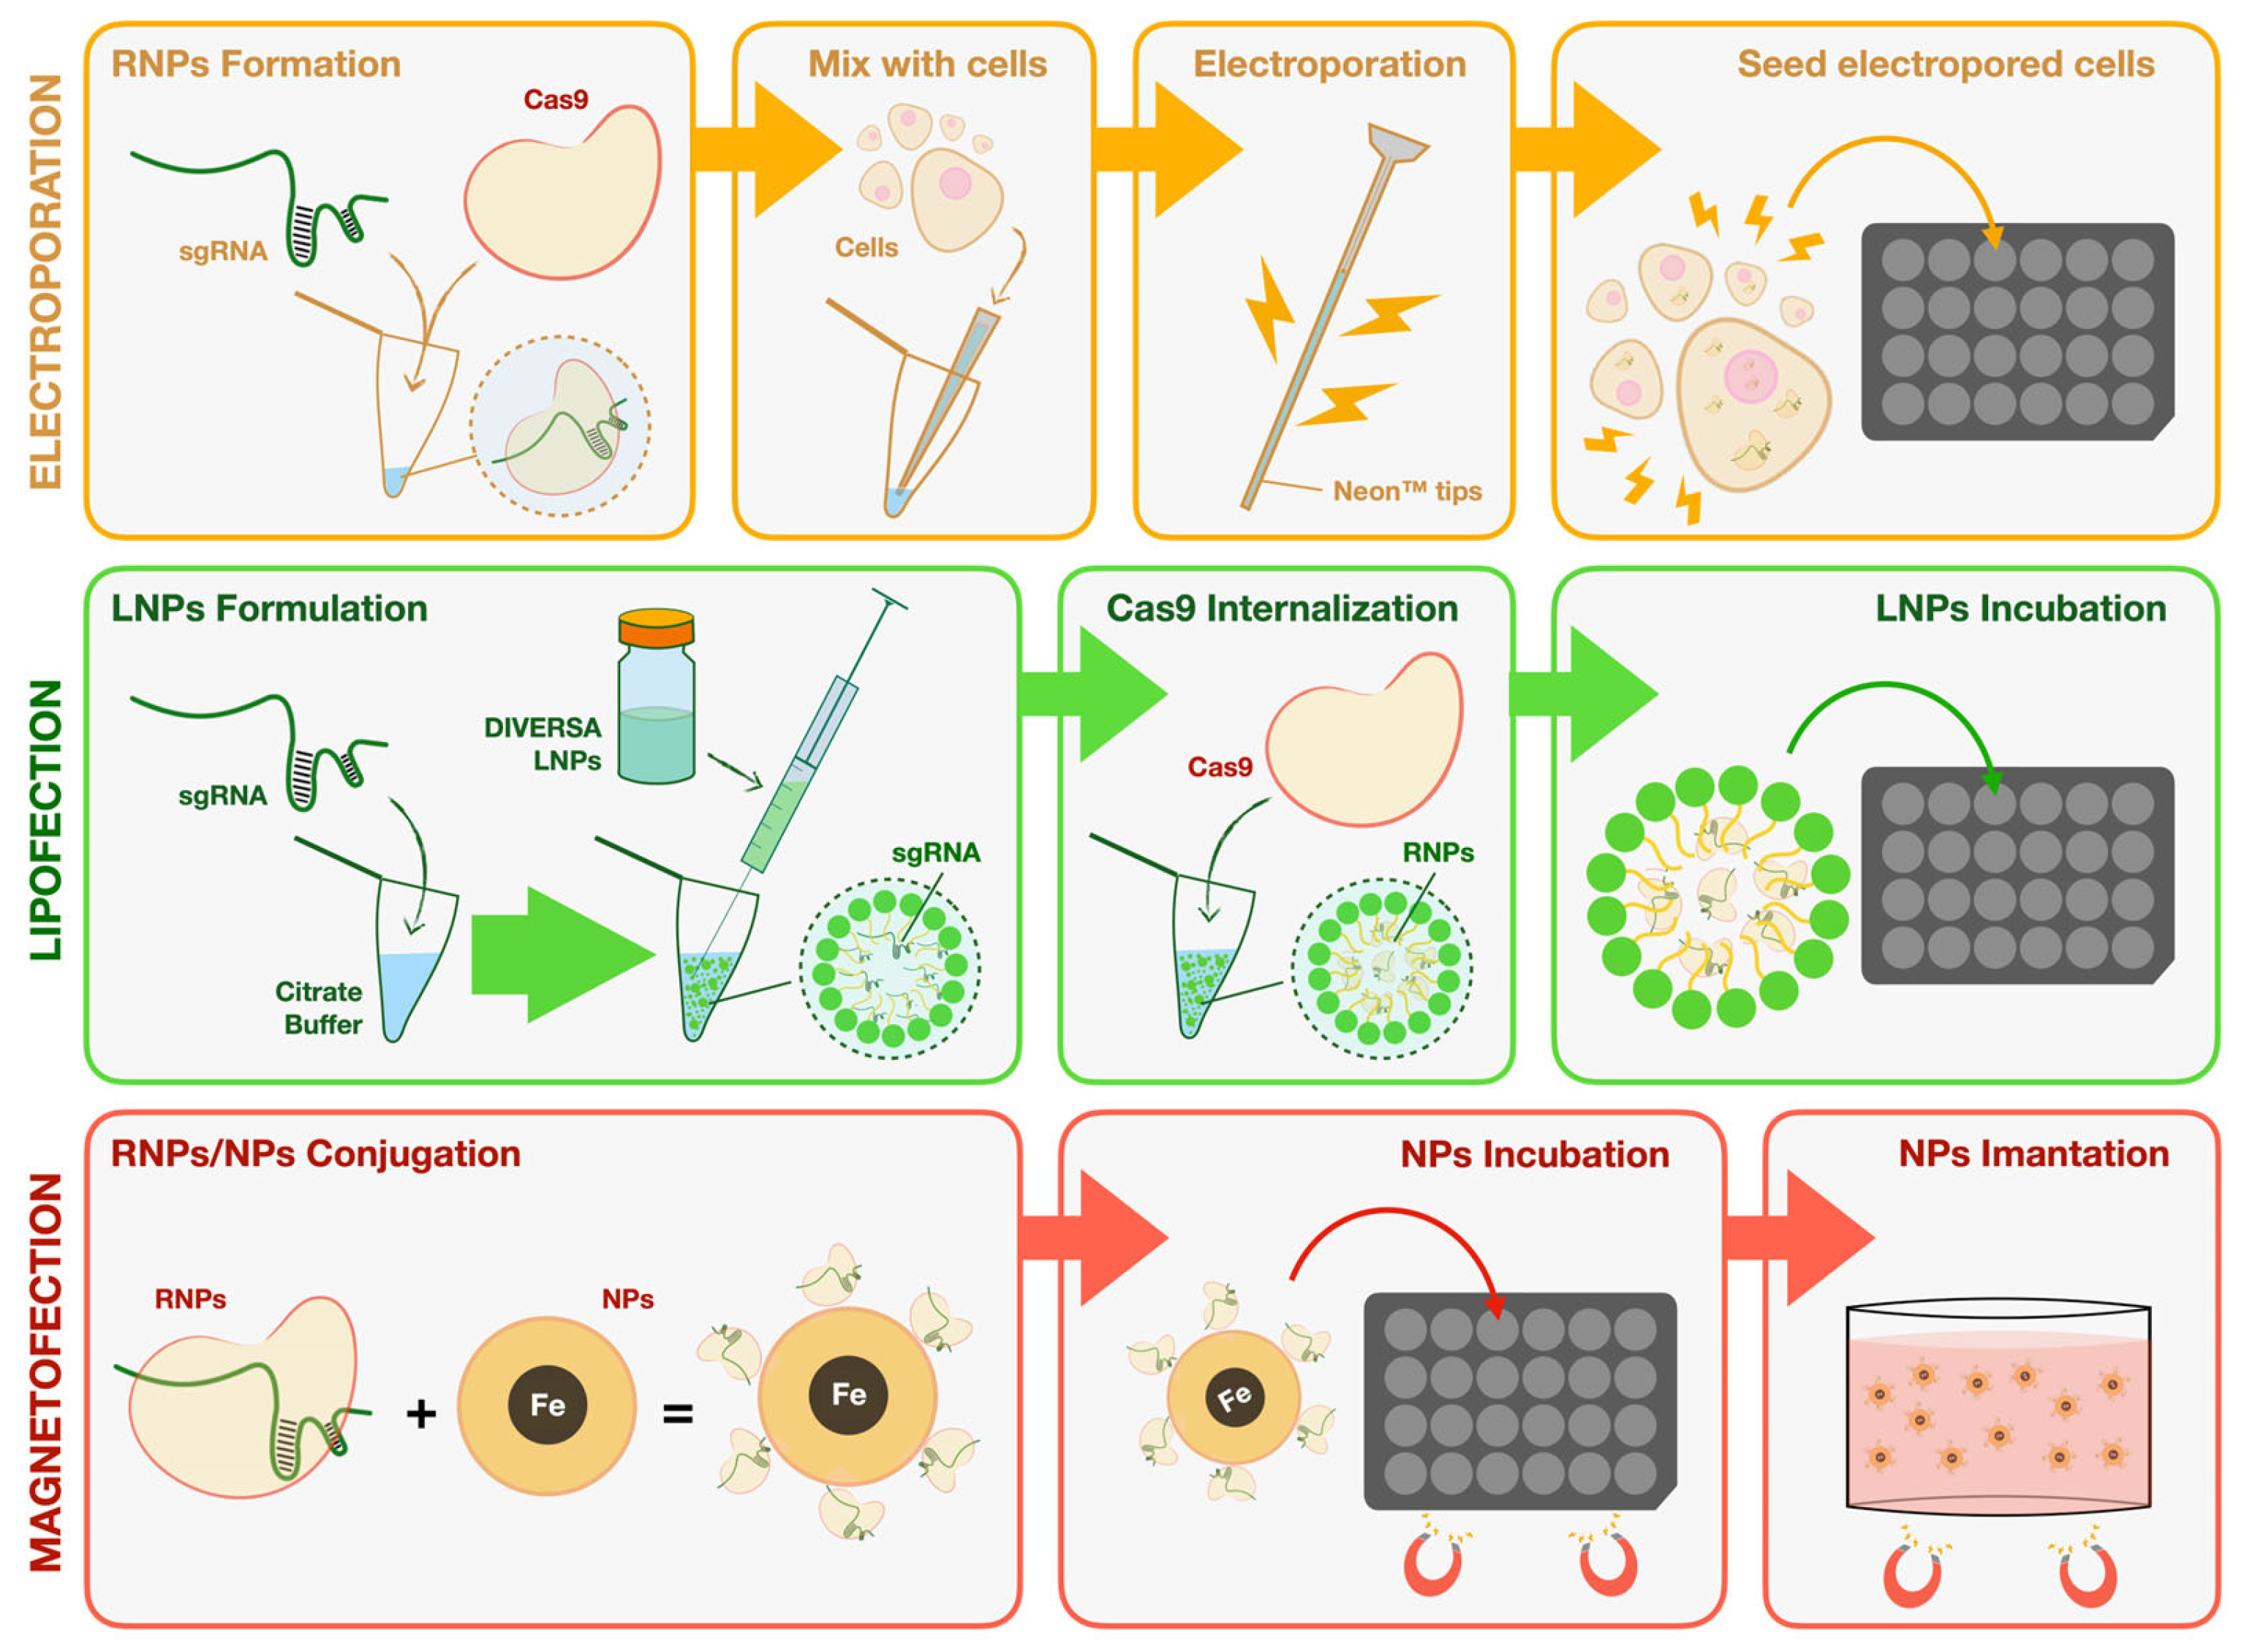
Figure 2.
Electroporation-mediated genome editing in marine fish cell lines. A. Fluorescence microscopy images of DLB-1 and SaB-1 cells electroporated with Cy3-labeled Cas9. Red fluorescence indicates intracellular Cas9-Cy3 uptake, with SaB-1 cells showing higher internalization. B. Editing efficiency in SaB-1 and DLB-1 cells using three different RNP concentrations (2, 3, and 5 µM). SaB-1 cells show consistently higher editing rates, especially when using synthetic sgRNAs. C. Confocal microscopy images of electroporated DLB-1 (top) and SaB-1 (bottom) cells transfected with Cy3-labeled Cas9. Merged images show red fluorescence indicating successful transfection, with SaB-1 cells displaying more widespread uptake. D. Transfection, survival, and editing percentages in DLB-1 cells after electroporation with 3 µM sgRNA/Cas9-Cy3 RNP under different voltage and pulse conditions. E. Transfection, survival, and editing percentages in SaB-1 cells after electroporation with 3 µM sgRNA/Cas9-Cy3 RNP under different voltage and pulse conditions.
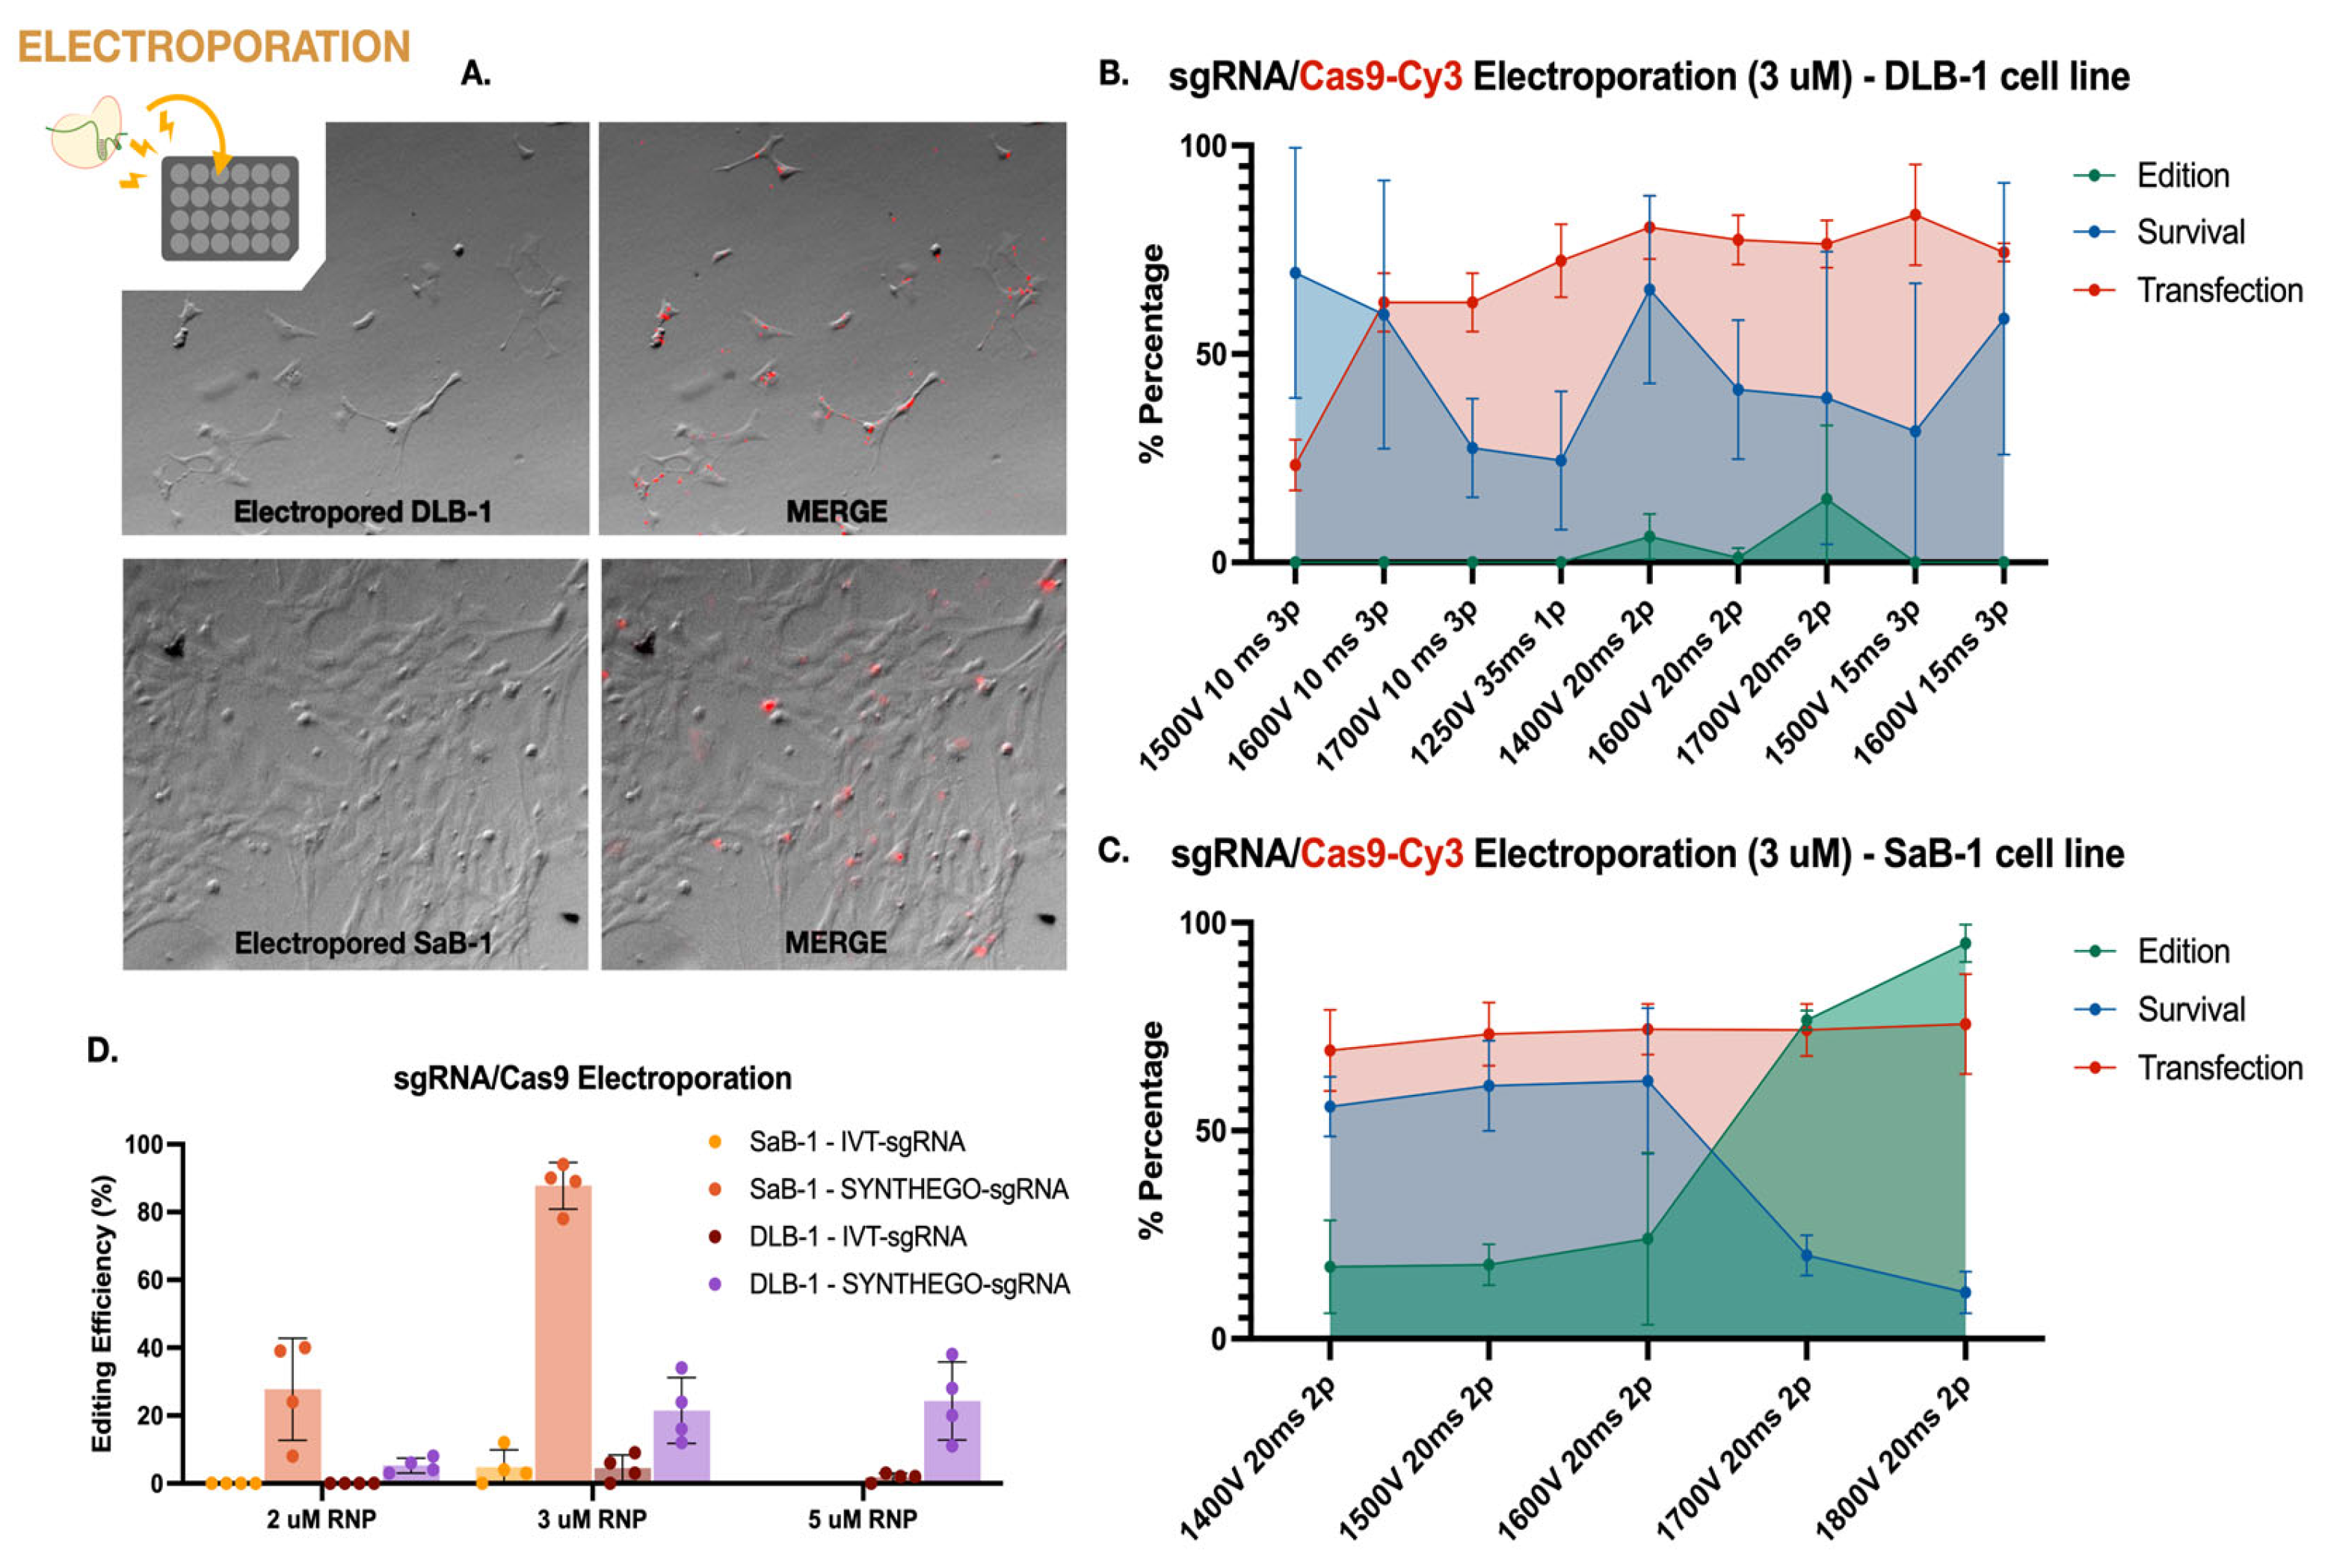
Figure 3.
Lipid nanoparticle-mediated delivery of Cas9–sgRNA complexes in DLB-1 cells. A. Widefield fluorescence microscopy showing colocalization of FLUOGREEN-labeled DIVERSA LNPs (green) and Cas9-Cy3 (red) in DLB-1 cells. Merged images confirm efficient co-delivery. B. Confocal microscopy image of DLB-1 cells showing spatial distribution of FLUOGREEN-labeled DIVERSA LNPs 24–48 h post-transfection. The LNP signal is predominantly observed near the apical surface, indicating intracellular localization. C. Confocal z-stack images showing differential localization of DIVERSA LNPs (green) and Cas9-Cy5 (red) in DLB-1 cells. LNPs accumulate near the apical region (z = 6 µm), while Cas9-Cy5 appears in deeper focal planes (z = 5.9 µm), suggesting cytosolic release after dissociation from LNPs. D. Genome editing efficiency in DLB-1 cells using DIVERSA LNPs under different delivery conditions. Editing correlates with the estimated RNP complex dose per cell, calculated from fixed sgRNA concentration, reagent volume, and well format (96- vs 24-well).
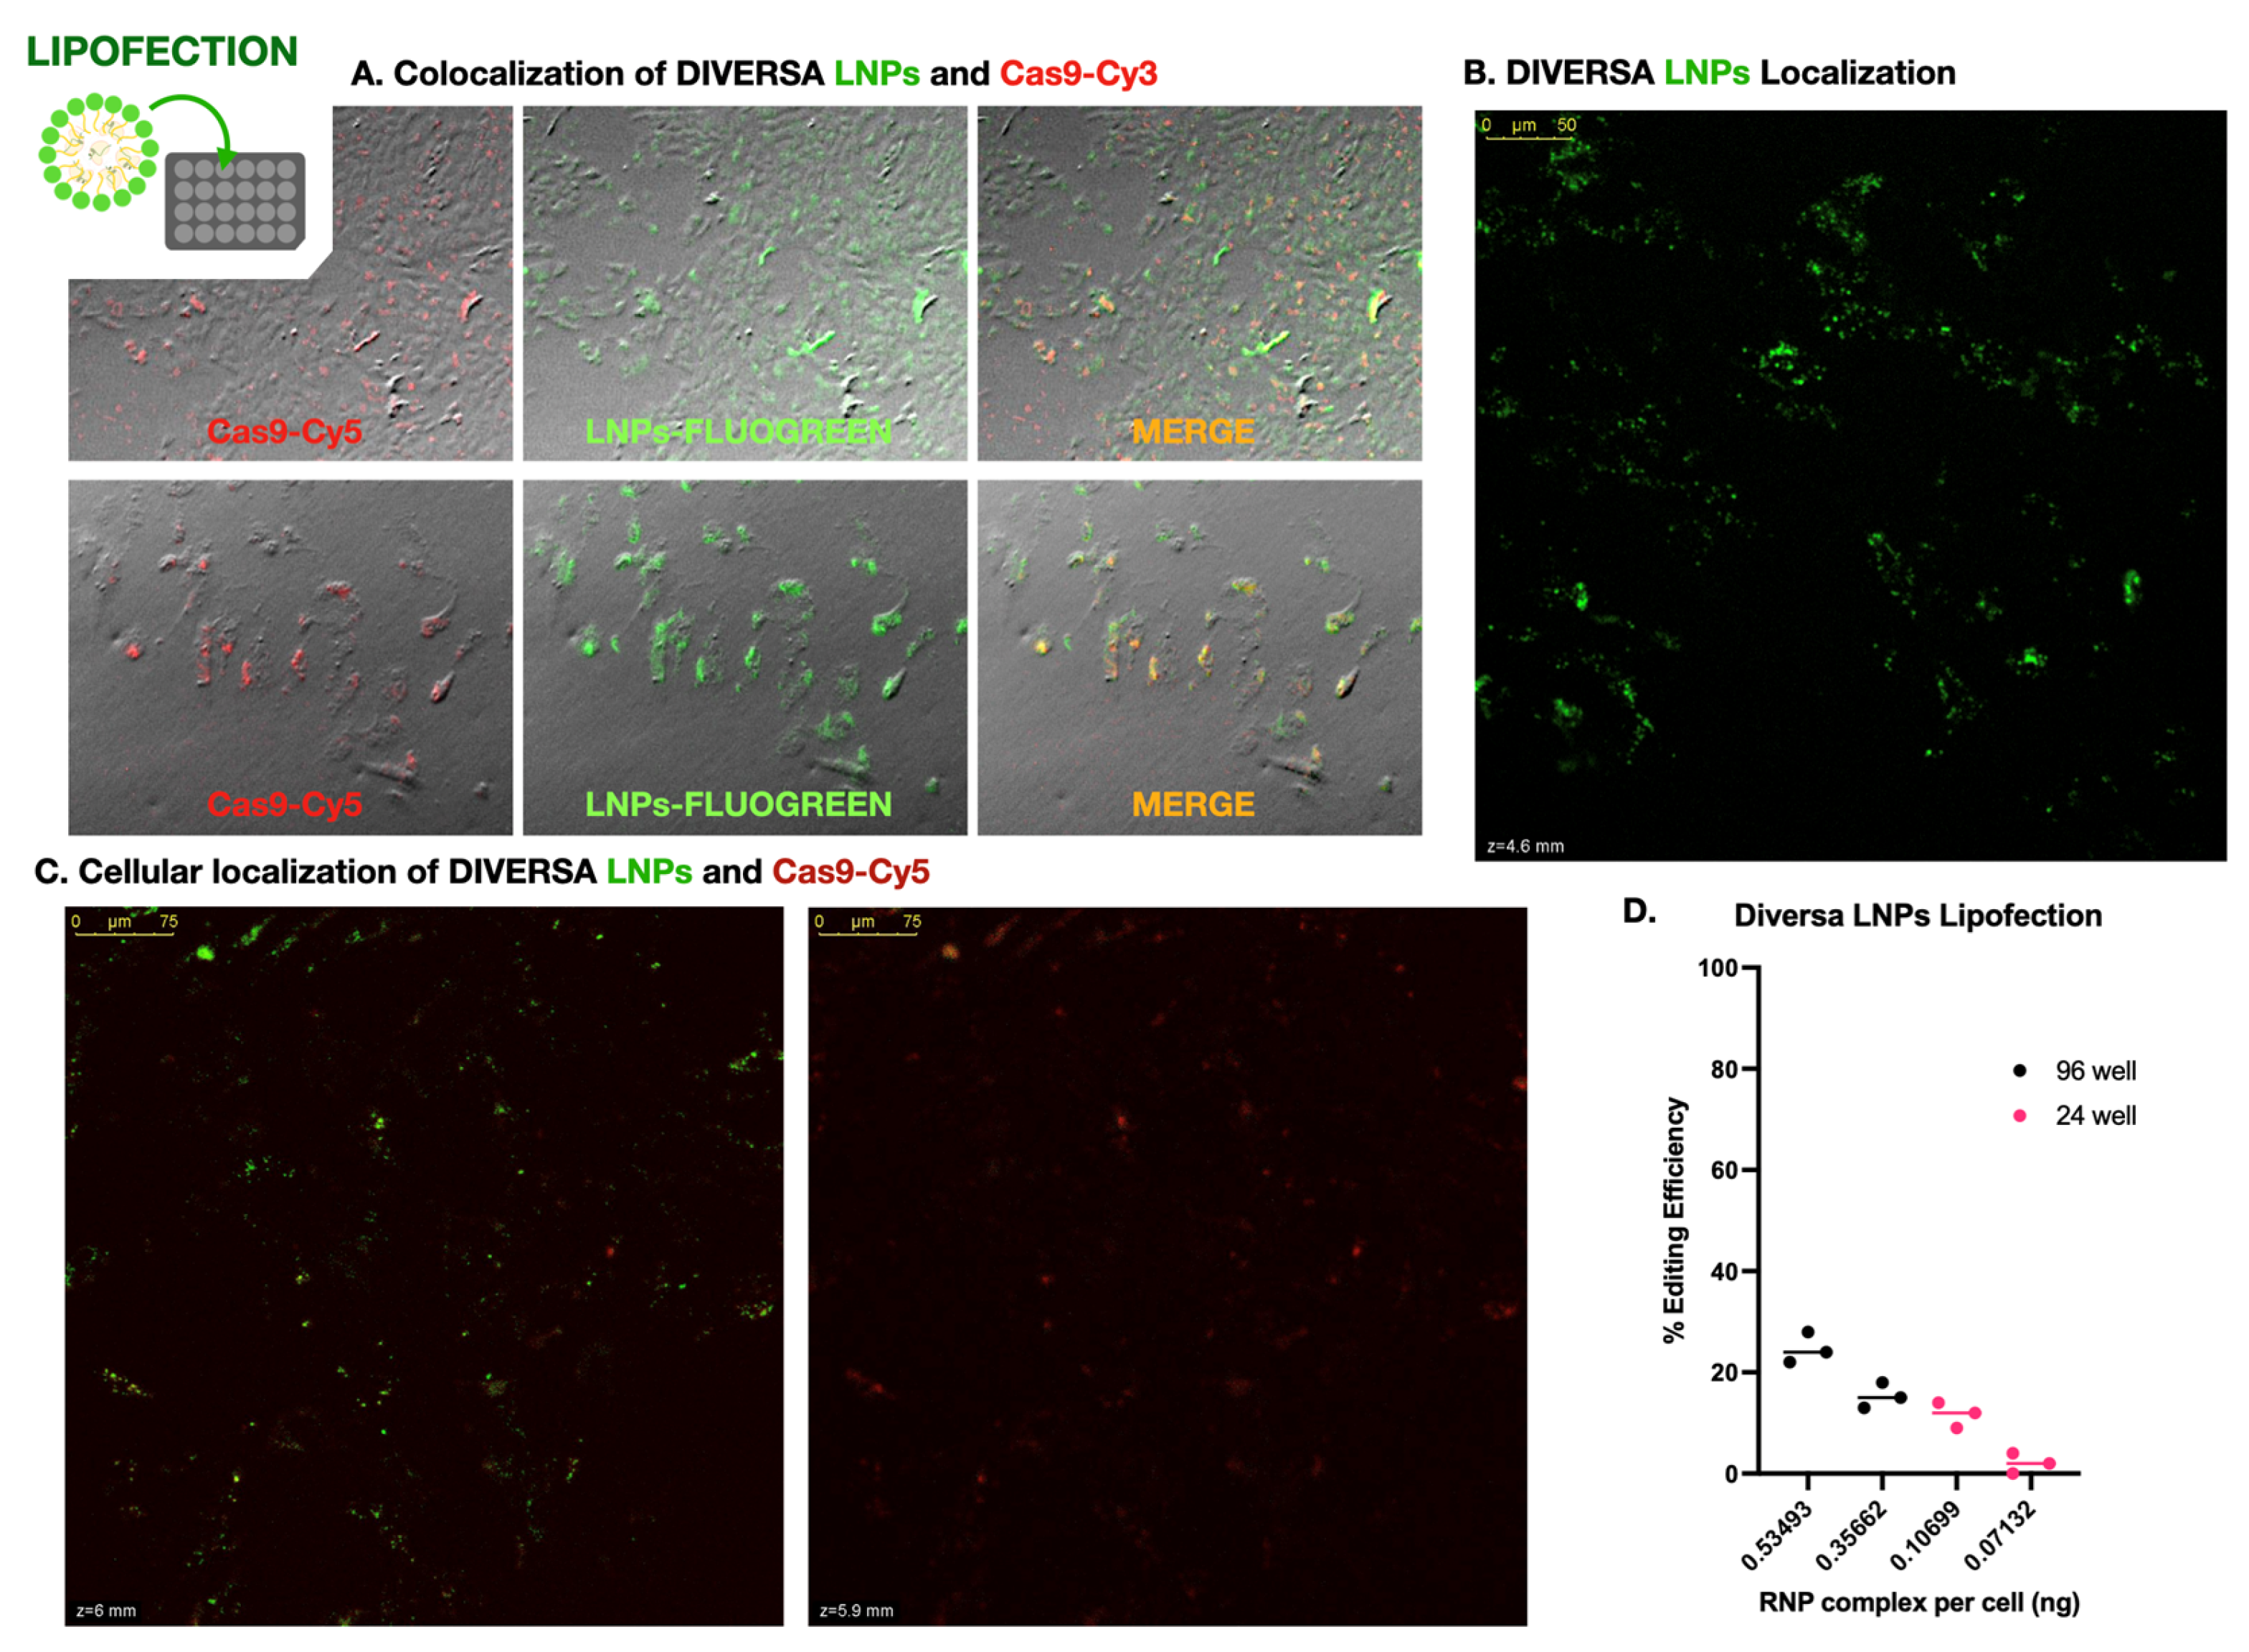
Figure 4.
Magnetofection-mediated delivery of Cas9 using SPIONs@Gelatine nanoparticles. A. Fluorescence microscopy images showing co-delivery of SPIONs@Gelatine nanoparticles (green) and Cas9-Cy3 (red) in cells treated with 100, 200, or 300 µL of nanoparticle suspension. Merged yellow/orange signal indicates intracellular colocalization. B. Quantification of iron content in cells following passive incubation (Uptake) or magnet-assisted delivery (Imanted) for 30 min or 1 h, using SPIONs at 100, 200, or 500 µL. A statistically significant increase in iron internalization was observed under magnetic conditions, especially at 200 µL after 30 minutes, as determined by two-way ANOVA followed by Tukey’s multiple comparisons test (*p < 0.05, **p < 0.01; n = 3). C. Confocal microscopy images showing (a) FITC-labeled SPIONs@Gelatin, (b) Cy3-labeled Cas9–sgRNA RNPs alone, and their respective bioconjugation complexes prepared for genome editing of the ifi27l2a gene in marine fish cell lines. Panels (c) and (d) correspond to the RNPs specific for DLB-1 and SaB-1 cells, respectively, conjugated to SPIONs@Gelatin prior to delivery. The sgRNAs used were designed based on the ifi27l2a sequence of each species.
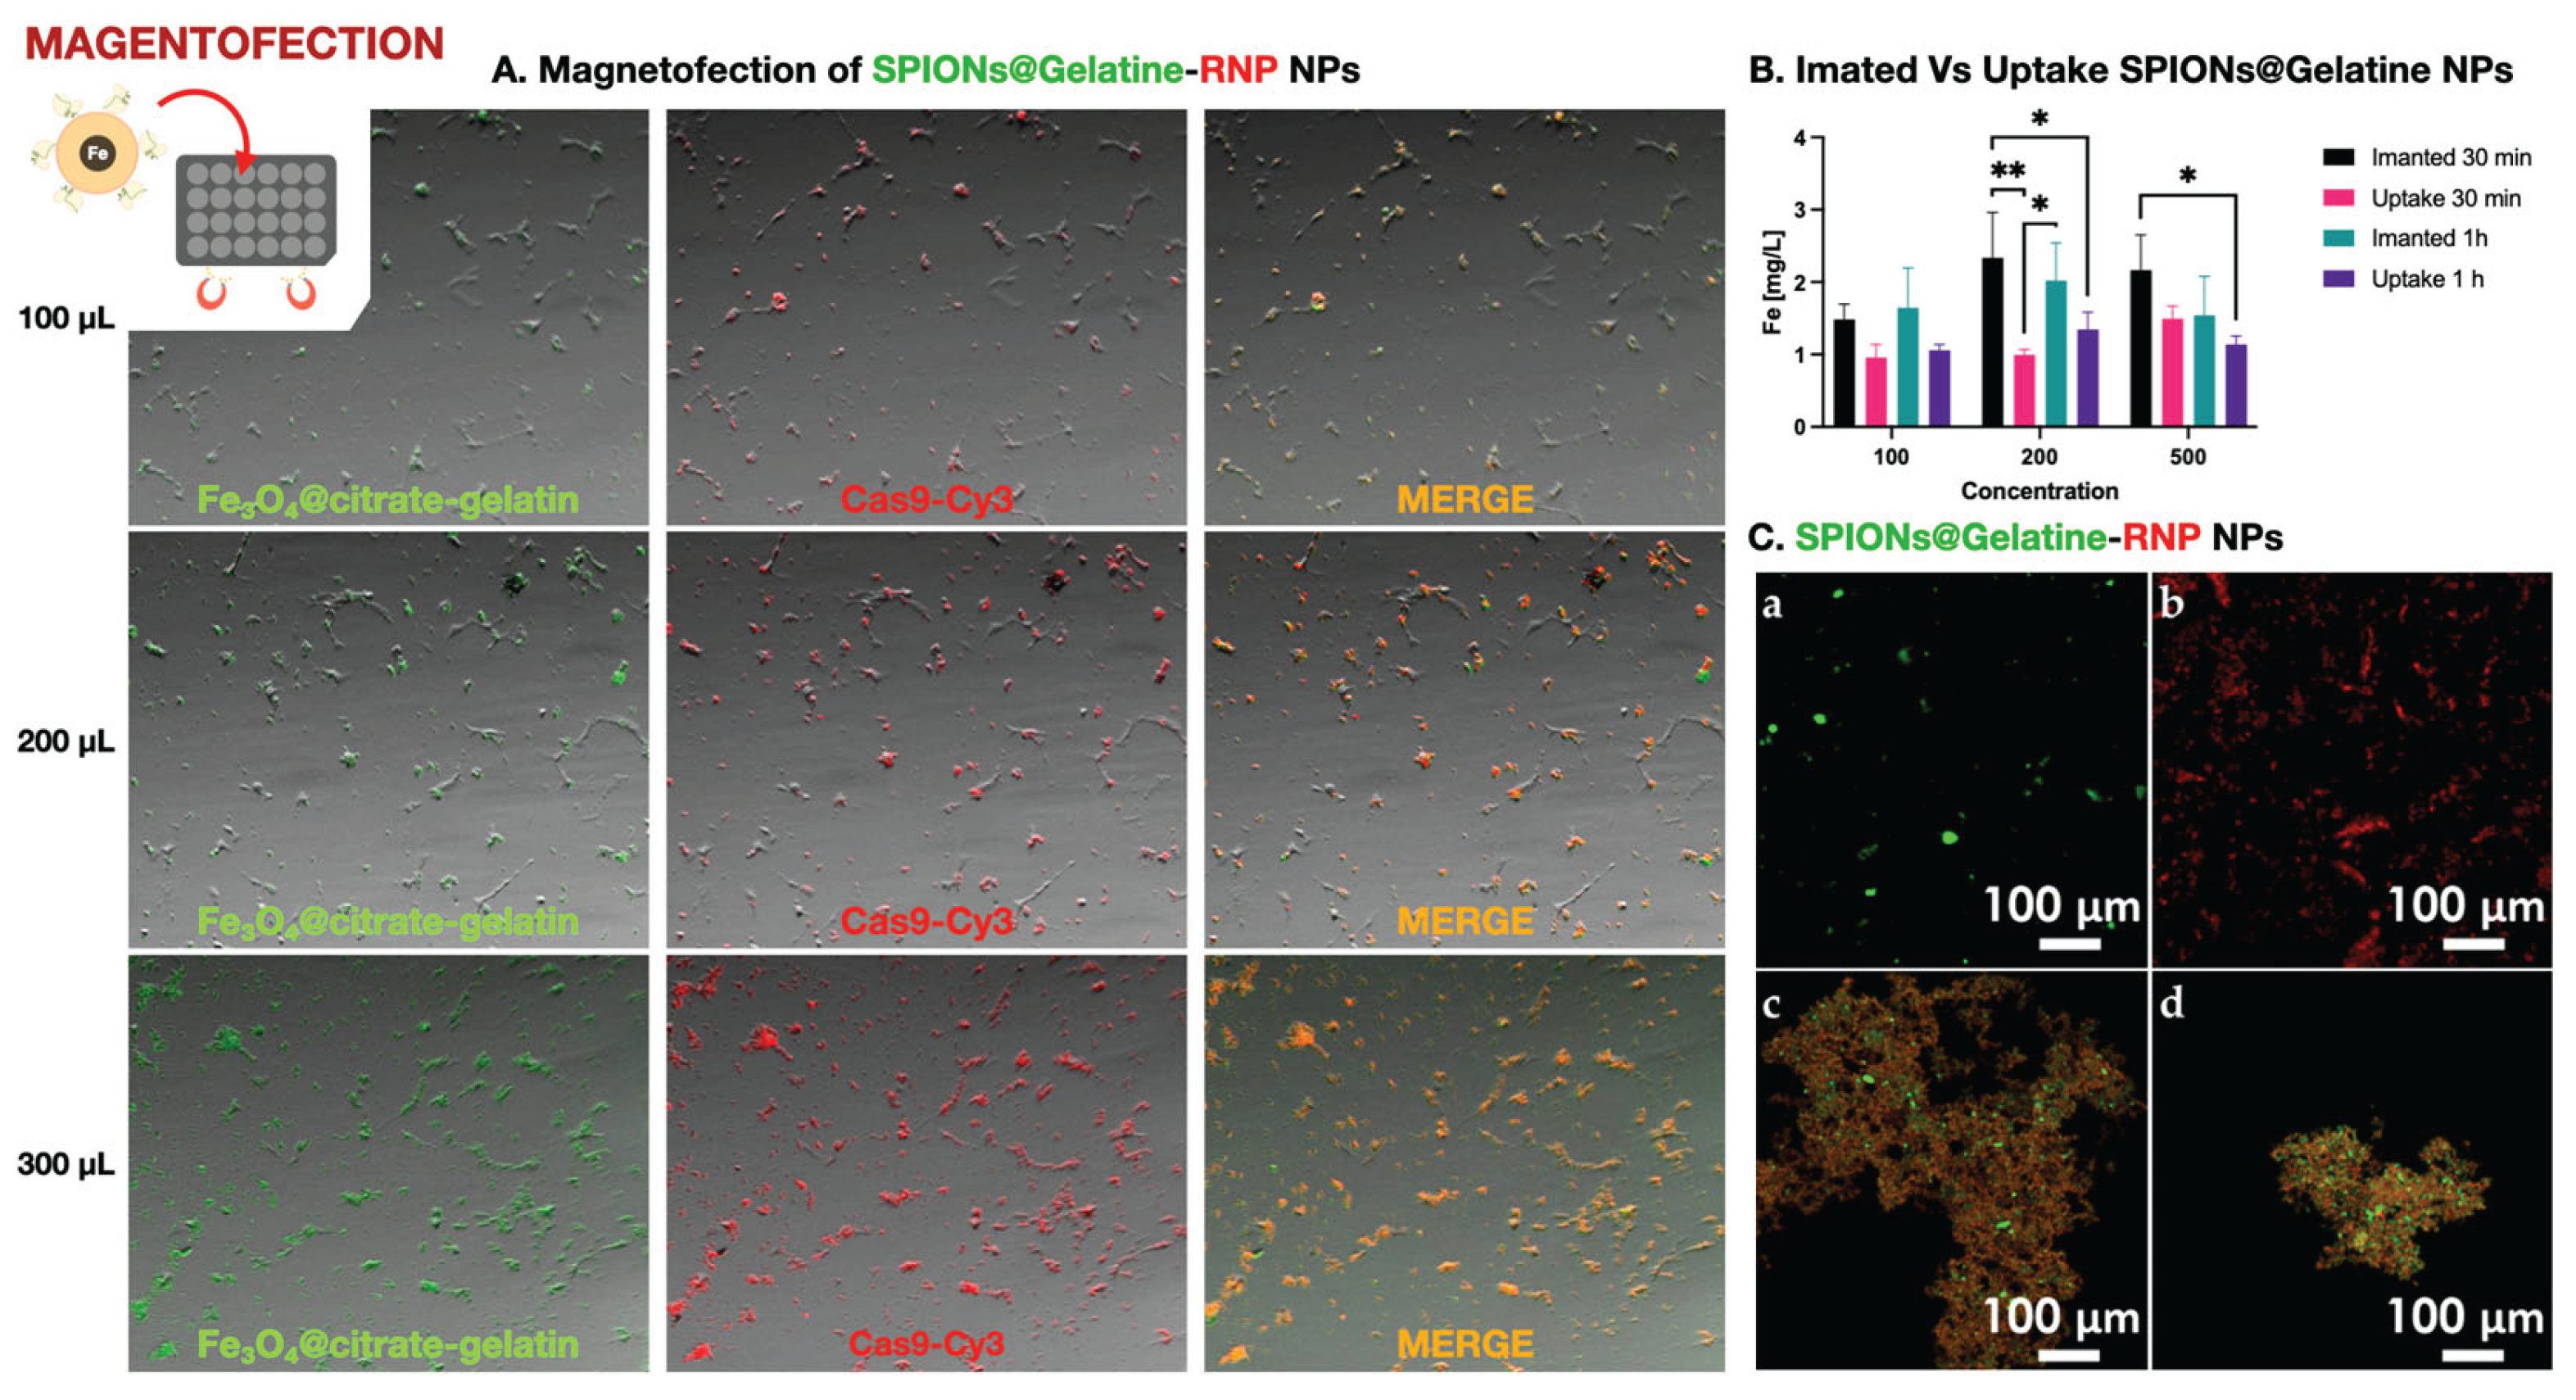

Table 1.
Diffusional properties of the Cas9 at 25 °C under the experimental conditions of two of the delivery strategies: electroporation and lipofection with Diversa LNPs.
Table 1.
Diffusional properties of the Cas9 at 25 °C under the experimental conditions of two of the delivery strategies: electroporation and lipofection with Diversa LNPs.
| Conditions | / 10-10 m2 s-1 | / nm |
|---|---|---|
| Electroporation (cell medium) | 0.207 ± 0.007 | 11.9 ± 0.4 |
| Diversa LNPs (HEPES) | 0.111 ± 0.008 | 22 ± 2 |
Table 2.
Hydrodynamic diameter (DH), polydispersity index (PDI), and ζ-potential of SPIONs@Gelatin and SPIONs@Gelatin-RNPs measured by dynamic light scattering (DLS) in water at pH 6.5. Values are expressed as mean ± standard deviation.
Table 2.
Hydrodynamic diameter (DH), polydispersity index (PDI), and ζ-potential of SPIONs@Gelatin and SPIONs@Gelatin-RNPs measured by dynamic light scattering (DLS) in water at pH 6.5. Values are expressed as mean ± standard deviation.
| Sample | DH (nm) | PDI | ζ-Potential (mV) |
|---|---|---|---|
| SPIONs@Gelatin | 112.4 ± 44.0 | 0.11 | -13.3 ± 3.6 |
| Bioconjugated SPIONs@Gelatin | 629.5 ± 180.7 | 0.17 | -25.0 ± 6.1 |
Disclaimer/Publisher’s Note: The statements, opinions and data contained in all publications are solely those of the individual author(s) and contributor(s) and not of MDPI and/or the editor(s). MDPI and/or the editor(s) disclaim responsibility for any injury to people or property resulting from any ideas, methods, instructions or products referred to in the content. |
© 2025 by the authors. Licensee MDPI, Basel, Switzerland. This article is an open access article distributed under the terms and conditions of the Creative Commons Attribution (CC BY) license (http://creativecommons.org/licenses/by/4.0/).
Copyright: This open access article is published under a Creative Commons CC BY 4.0 license, which permit the free download, distribution, and reuse, provided that the author and preprint are cited in any reuse.


