

Submitted:
06 June 2025
Posted:
09 June 2025
You are already at the latest version
Abstract
Anthropogenic drivers of biodiversity loss are causing global declines in biodiversity, yet some species remain overlooked in conservation efforts. In this study, we address the gaps between current discussions and pressing issues on these species conservation. For that, we focused on West Africa and used desiccation-tolerant vascular plants to conduct a systematic review on conservation discussions and to conduct a study case to assess their protection and exposure to quarrying and climate change. Our systematic review revealed for the first time that, despite their diversity, these plants are largely neglected in conservation discussions. Most species lack formal evaluations, and only four studies mentioned their conservation need although without providing enough evidence to justify it. In our case study, we found a biased protection among species, with varying effectiveness of protection areas against different anthropogenic threats. The two most exposed species had no occurrences in protected areas, which were more effective at mitigating quarrying impacts than climate change. We highlight the need for conservation-explicit assessments and a mechanistic understanding of species’ conservation needs to support efficient conservation strategies. Additionally, we call for conservation initiatives with specific objectives to include overlooked species in protected areas, adjusted to address specific anthropogenic threats.
Keywords:
climate change
; conservation
; desiccation tolerance
; diversity
; land use change
; protection areas
; quarrying
; resurrection plants
; rock outcrops
1. Introduction
The world is experiencing high rates of biodiversity loss promoted by human activities [1,2,3]. However, drawing global strategies for biodiversity conservation has been a challenging task because anthropogenic drivers of biodiversity loss operate in different ways and species can be subjected to strong intensities of multiple drivers [1,4]. For example, land use change is mostly promoted by direct and local intervention on natural systems. On the other hand, climate change is indirectly triggered by global human activities, with some locations more exposed to changes regardless of its origin [5]. The intensity of both land use change and climate change is rising in some regions of the world, such as West Africa [6,7], which includes areas recognized as global biodiversity hotspots[8]. The combination of multiple drivers increase the human pressures on species and their habitats and make effective conservation strategies for biodiversity very much needed.
Yet, some fraction of biodiversity has been neglected for conservation. The desiccation-tolerant vascular plants (DT plant) are a good example of that. Also referred to as “resurrection plants” or “poikilohydrous”, DT plants have the remarkable ability to survive water loss up to 95% relative water content (equivalent to 0.1 g H2O/g dry weight) and resume their metabolism after rehydration with little or no biomass loss [9,10]. The desiccation tolerance ability is expected to provide an ecological advantage to thrive in environments with repetitive drought events throughout the year [9]. Due to this response, they can offer valuable genetic insights for breeding drought-resistant crops [11,12]. Also because of this response, they are often seen as resistant species to environmental changes and consequently neglected for conservation. However, this assumption is not justified by the current literature. Firstly, DT plants have been reported by earlier studies as sensitive to changes in the environmental conditions (e.g., changes in the length and intensity of drought might exceed the species capacity to tolerate desiccation) [9,13]. It means that anthropogenic drivers such as climate change can lead DT plants to not be able to tolerate desiccation in new climatic settings. Besides, DT plants are associated with inselbergs, which are rock outcrops that abruptly rise from the landscape and act as island-like ecosystems to the species that inhabit them [9,10]. Those ecosystems are often overlooked for conservation initiatives and are particularly exposed to land use change (e.g. quarrying) [14] and their insular characteristics [15] can reduce species capacity to migrate to new suitable areas in case of habitat loss. Those aspects reinforce the need for studies that seek the conservation of DT plants to human-driven threats.
In this study, we aimed to provide a basis for constructive discussion about the conservation of species often neglected for conservation. For that, we focus on West Africa and DT plants as our model system and divide the study in two sections. In the first section, we conducted a systematic review to provide the first comprehensive list of DT plants for West Africa (including information about their distribution and conservation status) and to identify discussions about DT plant conservation in the region. In the second section, we conducted a study case in which we assess the protection and exposure of DT plants to two anthropogenic drivers of biodiversity loss: land use change and climate change. Here, we compiled a list of DT plants reported in a database on West African inselbergs compiled by S. Porembski and compared their exposure to land use and climate change across non-protected and protected areas. We used quarrying activities and departures from current climate conditions as proxies for land use and climate change, respectively. Despite being focused in DT plants from West Africa, we believe our study contributes with valuable insights for building up a more critical thinking about worldwide species that are found neglected for conservation.
2. Results
2.1. Diversity, Distribution, and Conservation of DT Plants in West Africa
All together, we found 49 desiccation-tolerant plant species in West Africa, from 30 genera and 11 families across lycophytes, ferns and angiosperms (Table 1). Asplenium stood out as the most species-rich genus, with 6 species reported, followed by Hymenophyllum, and Sporobolus with 4 with 3 species respectively. Poaceae emerged as the most species-rich, with 10 species, followed by Pteridaceae and Hymenophyllaceae, respectively with 9 and 8 species. Ferns represented 61.22%, angiosperms 36.73% and lycophytes 2.04% of the species listed.
Regarding the distribution of species in West Africa, Cameroon stood out as the country most rich in species (36), followed by Nigeria (28) and Côte d’Ivoire (22; Figure 1). The Gambia and Guinea-Bissau were the countries with the lowest number of species, counting 2 species each. While some species were widespread in West Africa, others were restricted to one or a few countries. Sporobolus festivus (Poaceae) was the species most widespread in West Africa, being recorded in 15 countries. On the other hand, 7 species were found occurring in only one country in West Africa, including 3 nationally endemic species: Afrotrilepis jaegeri (Cyperaceae), endemic to Sierra Leone, and Coleochloa domensis (Cyperaceae) and Craterostigma yaundense (Linderniaceae), both endemic to Cameroon. In total, 6 species are endemic to West Africa. Besides A. jaegeri, A. pilosa, C. domensis and C. yaundense, Microdracoides squamosa (Cyperaceae) and Oropetium aristatum (Poaceae) also have their distribution restricted to West Africa. Concerning the conservation status of DT plants in West Africa, the majority of DT plants from West Africa, 42 species (86%), have not been evaluated for conservation by IUCN. Only 7 species (14%) have been evaluated, among which, 4 species were classified as Least Concern (Asplenium monanthes, Elaphoglossum acrostichoides, Cosentinia vellea, and Sporobolus stapfianus; Aspleniaceae, Dryopteridaceae, Pteridaceae, and Poaceae, respectively), 2 species as vulnerable (Asplenium aethiopicum and C. yaundense; Aspleniaceae and Linderniaceae, respectively), and 1 species as Critically endangered (C. domensis; Cyperaceae). A complete lack of assessment of DT plants for conservation was registered in 8 countries in West Africa (40%). While 12 countries (60%) have at least one species assessed by IUCN, most species in those countries have not yet been assessed concerning their conservation.
From our literature pool, only 27 studies were focused on West Africa. Among those studies, only 4 mentioned the conservation needs of DT plants [14,15,16,17], although no studies either produced enough evidence to justify conservation needs of DT plants or proposed effective conservation strategies for DT plants (Figure 2; Table A4). Most studies were focused on the entire community in which DT plants are embedded (16 studies, 59%). Eight studies focused on specific community components (30%), while only three studies focused on ecological processes and functioning (11%). Among the 4 studies that mentioned the conservation needs about DT plants, 2 focused on the entire community [15,17] and 2 focused on ecological processes and functioning [14,16] of the ecological context DT plants are found.
2.2. The Exposure of DT Plants to Anthropogenic Drivers of Biodiversity Loss and Their Protection on West African Inselbergs
We compiled a list of 123 inselbergs (spanning from Guinea to Equatorial Guinea) and selected 10 DT plants with an uneven and overlapping distribution across West African inselbergs: Asplenium stuhlmannii (Aspleniaceae), Phymathosorus scolopendria (Polypodiaceae), Pellaea doniana (Pteridaceae), Afrotrilepis pilosa and Microdracoides squamosa (Cyperaceae), Microchloa indica, Oropetium aristatum, Tripogonella minimus, and Sporobolus festivus (Poaceae), and Craterostigma yaundense (Linderniaceae; Figure 3, Table A5). These species form a diverse set of DT plants from a taxonomic and geographical perspective. For instance, while A. stuhlmannii, P. doniana, S. festivus, and A. pilosa had a broad-range distribution, P. scolopendria, O. aristatum, M. squamosa, and C. yaundense were registered on fewer inselbergs.
While a significant difference between non-protected and protected areas was registered in relation to species exposure to quarrying, species exposure to climate change was similar across protected and non-protected inselbergs in all future scenarios (Table 2; the Mann-Whitney U test was conducted for species exposure to quarrying and t-test for species exposure to climate change). Yet, we could observe marked patterns among species protection and exposure to quarrying and climate change. Firstly, it is important to highlight that C. yaundense and M. squamosa had no occurrence within protected areas. Regarding the species exposure to quarrying, we found that all species had at least one occurrence on an inselberg in which quarrying was registered (Figure 4; Table A6). While T. minimus had the lowest relative exposure to quarrying (7% of inselbergs, i.e., 5 out of 71), C. yaundense showed the highest relative exposure to quarrying (60% of inselbergs, i.e., 3 out of 5). The exposure of all species to quarrying was reduced in absolute and relative values when the inselbergs were included in protected areas. While T. minimus had the lowest relative reduction in exposure to quarrying in protected areas (1.1 times less exposed to quarrying), O. aristatum and P. scolopendria had their exposure to quarrying reduced from 18% and 17%, respectively, to 0% (Table A7).
Concerning the species exposure to climate change, all species were more exposed to climate change in the most pessimistic scenario (SSP5) when compared to the most optimistic scenario (SSP1), especially in the farthest future (i.e., time-series 2071-2100; Figure 5, Table A8). M. indica was the species with lowest exposure to climate change, although its exposure scores increased 2.5-fold over time in the most optimistic scenario (i.e., increasing from 0.06 to 0.15 in the 2011-2040 and 2070-2100 time-series, respectively) and 18.3-fold in the most pessimistic scenario (i.e., increasing from 0.06 to 1.1 in the 2011-2040 and 2070-2100 time-series, respectively). On the other hand, C. yaundense was the species with the highest exposure to climate change, reaching an exposure score 25.6 times higher than M. indica in the most pessimistic scenario of the farthest future. C. yaundense also showed greater rises in its exposure to climate change over time, increasing 3.2-fold in the most optimistic scenario (i.e., increasing from 1.2 to 3.86 in 2011-2040 and 2071-2100, respectively) and 19.7-fold in the most pessimistic scenario (i.e., increasing from 1.48 in 2011-2040 to 28.18 in 2071-2100).
3. Discussion
Our literature review reveals that DT plants form a diverse group in West Africa, but are a largely neglected group of species for conservation as are their habitats. Only 7 species (14%) have been evaluated for conservation by IUCN and conservation issues with DT plants were only mentioned by 4 studies, although in an indirect way and without producing enough evidence to justify their need for conservation. We argue that conservation-explicit assessments are ultimately necessary to ensure the conservation of DT plants. Besides, we recommend that, instead of relying on general conservation narratives, future studies focus on a mechanistic understanding of species conservation needs in order to support efficient conservation strategies for DT plants.
Our case study revealed an important bias of protected areas towards certain species, besides its differential capacity to minimize the impact of different anthropogenic drivers of biodiversity loss. Among the 10 selected DT plants, 2 species (i.e., M. squamosa and C. yaundense) did not have any occurrence within protected areas. This is especially critical when considering that they are the species with the highest exposure rates to quarrying and climate change, and are the two rarest species in our species pool. Conservation efforts must reduce such protection bias by explicitly including overlooked species in their conservation objectives. Yet, the conservation objectives must take into account the specific anthropogenic threats in each case. We found that protected areas were more effective in mitigating the direct effects of human activities, such as quarrying. However, they showed little effect on species exposure to climate change. We suggest, for example, using protected areas to ensure the connectivity among inselbergs as a more efficient strategy to cope with climate change.
3.1. The Need of Studies Specifically Designed to Assess the Conservation of DT Plants
Only four studies mentioned the need for conservation of DT plants or their habitats. Two of them focused on the entire plant community (i.e., [15,17]), and two others focused on ecological processes and functioning (i.e., [14,16]). Even though not explicitly targeting DT plants, these studies either highlighted the ecological singularity of species in the ecosystem DT plants occur (i.e., inselbergs) or acknowledged threats to its biodiversity in order to claim their need for conservation. However, those studies did not produce enough evidence to justify their claims. We acknowledge that it was not the aim of any of the mentioned studies to measure species conservation needs to support conservation efforts. Yet, we need studies explicitly designed to assess and discuss the conservation of DT plants. We believe conservation initiatives on DT plants would benefit from going beyond general conservation narratives towards a mechanistic understanding of species conservation needs.
The vulnerability framework suggested by Dawson et al. [18] is a good starting point to understand the mechanisms that lead DT plants to need conservation actions, if they do. Dawson et al. [18] describe the species vulnerability to environmental changes as a result of their exposure (i.e., the magnitude to changes a species undergoes), sensitivity (i.e., how much a species is affected by changes), and adaptive capacity (i.e., how much a species can mitigate the negative effects of environmental changes). According to this framework, species conservation needs increase under high exposure, high sensitivity, and low adaptive capacity. By identifying the importance of each component in the species vulnerability equation (i.e., exposure, sensitivity, and adaptive capacity), conservation initiatives can be more effective by strategically intervening in the critical component for the species in question. For example, we could assume that DT plants in a community are similarly exposed to a given threat, but their sensitivity and adaptive capacity to this threat is likely to vary among species. Especially if we consider that DT plants are found in 11 plant families in West Africa and the desiccation tolerance has independently re-evolved across vascular plants phylogeny [19] (please also see Dollo’s Law [20]). If attempts to reduce species exposure to threats fail, conservation strategies for species with higher sensitivity but high dispersal capacities (i.e., high adaptive capacity) might focus on ensuring the species migration to new suitable locations, such as increasing the connectivity between protected areas. However, if the species have higher sensitivity and low dispersal capacity (i.e., low adaptive capacity), more intensive conservation interventions might be taken to ensure the species will not go extinct in the wild, such as assisted migration.
Understanding those three components is not always an easy task. Scientists and conservationists might encounter challenges in assessing some components (e.g., species can mitigate the negative effect of changes in many ways, from showing high genetic diversity to dispersing to new suitable areas) [18] and available resources are insufficient to evaluate every species in a proper time [21]. Studies with focus on the communities or its components could attempt to identify species to be prioritized for a posterior mechanistic conservation assessment. For DT plants, we have incomplete information about which species require more attention for conservation. We found that 86% of the species recorded have not yet been assessed for conservation under the IUCN Red List framework, as eight countries have no DT species evaluated; aligning with a general underrepresentation of West African plant species in global conservation assessments [22]. Although providing systematic and conservation-explicit guidelines for species conservation, IUCN Red List framework might also be costly and time-consuming. For instance, monitoring population size reduction (Criteria A from IUCN Red List framework) recommends measures over 10 years or 3 generations [23]. Alternatively, quicker (yet robust) assessments could also be used to inform about priority species for conservation (e.g., [24,25,26]) and which species the vulnerability framework from Dawson et al. [18] can be applied for more effective conservation initiatives.
The studies we analyzed had a different approach. For example, some studies highlighted threats to inselberg species, including DT plants, to justify species conservation needs. Porembski [16] discussed that stress-tolerant native inselberg species can be outcompeted by invasive species with higher competitive ability. Invasive species would only establish themselves in a new community if they either have plant responses that confer a greater fitness under local environmental constraints (i.e., “trying harder” strategy) or similar fitness when compared to local species (i.e. “joining the locals” strategy) [27], but see also [28]. That means that, ecosystems in which environmental stress is supposed to be the strongest ecological constraint, such as inselbergs, invasive species must either be more fit to environmental stress than local species or at least similarly fit in order to avoid being excluded by local species. Otherwise, we would be simply overestimating the impact of an alien species with neutral (or even positive) effects on the existing community [29,30]. We argue that invasive species with higher competitive ability would only be a threat in inselbergs if human pressures led to a shift in the importance of different ecological constraints. For example, over-visitation by humans or introduction of grazing animals in inselbergs might intensify disturbance events (i.e., any external constraint that cause partial or total biomass loss; sensu Grime [31]) and reduce the relative importance of environmental stress (i.e., any external constraint that reduce plants productivity; sensu Grime [31]) in shaping inselberg plant communities. This shift would lead ruderal invasive species to exclude native species using the “trying harder” strategy because they would have higher fitness under such new conditions (e.g., [32]). Thus, we support new studies focused on ecological processes that either monitor trends in species populations or habitat shifts over time with the presence of a potentially invasive species (e.g., [33]) or assess the changes in functional traits among native species due to the presence of newcomers (e.g., [34]). For DT plants, we believe that such studies could advance discussions about invasiveness of inselbergs and its impact on DT plants.
Another common reasoning to justify conservation needs of inselberg species, including DT plants, is that many plants exhibit particular responses to environmental challenges (e.g., “specializations” or “adaptations”) and that they have a restricted distribution (e.g., sometimes endemic to inselbergs). These two factors might reinforce the need for monitoring such species or ecosystems. However, there is not enough justification to prioritize a species for conservation. Concerning the particular responses to environmental challenges, we must keep in mind that such responses might also be beneficial to cope with some anthropogenic drivers of biodiversity loss. Desiccation tolerance allows plants to overcome droughts with little or no biomass loss. If drought events become more frequent, intensive, and extensive owing to climate change and lead plants to experience high dehydration or desiccation rates, one might logically argue that DT plants are not as sensitive to climate change as desiccation-sensitive plants. Regarding species restricted distribution, the expectancy of higher extinctions risks for these species is often related to their narrow niche breadths unfolding a lower tolerance to changes and small population sizes pushing species close to viable population thresholds (i.e., minimum number of individuals required for the species to not go locally extinct)[35,36]. However, niche is not the only constraint to species distribution patterns (e.g., dispersal is also an important cause of the species restricted distribution). That means that species with restricted distribution are not necessarily sensitive to changes. Besides, the species might be rare on a regional scale but dominant on a local scale [37], so they are not close to viable population thresholds. For instance, despite A. pilosa being endemic to West Africa and restricted to inselbergs, it can occur in very distinct environmental settings (e.g., locations where annual precipitation varies from less than 1000 to more than 3000 mm [38]) and achieve high abundances within local communities [39]. A species might indeed require conservation attention, but not necessarily because they have particular responses to the environment or because they have a restricted distribution. We need more lines of evidence to evaluate species' conservation needs rather than simply rely on clues that, despite their usefulness, may not appropriately describe species vulnerability to anthropogenic drivers of biodiversity loss.
Yet, particular responses to environmental challenges (i.e., desiccation tolerance in our context) and restricted distribution are appealing features from DT plants and can be possibly used to encourage conservation awareness about DT plants. For example, the three redlisted species A. aethiopicum, C. domensis, and C. yaundense could play an important role as Cinderella species in the context of DT plants in West Africa. C. yaundense is an inselberg-endemic species found only within the urban area of Yaoundé (the capital of Cameroon).Cinderella species are a type of surrogate species (i.e., species that are strategically used by conservation initiatives to promote the conservation of other species [40]) that are endangered and, despite not being as famous as flagship species, have enough charisma or public appeal to improve support on conservation initiatives [40,41,42]. Those three species could be used in coordination to better capture the phylogenetic and ecological diversity specific to each area (e.g., as flagship fleets; see [43,44]). However, raising public empathy on plant species is trickier than on animals, but not an impossible task [45]. Alternative solutions should not be neglected, such as using umbrella species (i.e., another type of surrogate species but which are more common features in the landscape, thus more likely to have stronger connections with local communities [46,47]) or other plant or animal species that occur on rock outcrops and would help conserving DT plants (since many DT plants are associated with these ecosystems). Besides, we must keep in mind that the use of surrogate species in conservation initiatives risks failing to solve complex problems through simplistic solutions [48]. Further studies are still necessary to select appropriate surrogate species and evaluate if such strategies satisfy local ecological realities.
3.2. Protected Areas Are Not Similarly Effective in Face of Different Conservation Challenges
The species with the higher exposure to anthropogenic threats to biodiversity (i.e., C. yaundense and M. squamosa; Figure 6) are the ones not included in existing protected area networks. This pattern can be especially more worrying if we consider that they are the two most rare species in our study, as this feature is linked with greater extinction risks [49,50]. Besides, while C. yaundense is classified as vulnerable by IUCN, M. squamosa is currently unevaluated by IUCN, hindering our understanding about the conservation needs of one of the species that might most require our attention. Aichi Target 11 of the Convention on Biological Diversity [50] aimed to protect at least 17% of terrestrial areas by 2020 in a equable and ecologically representative way (and 30% for 2030 according to Target 3 of the Kunming-Montreal Global Biodiversity Framework) [51]. However, despite the 17% threshold reached in 2024 [52], our results show that ecological representativeness has not been yet met. It is estimated that nearly 60% of vascular plant diversity hotspots still remain outside protected areas, leaving many endemic and vulnerable species unprotected despite international conservation targets [53]. We believe that reducing the protection bias towards certain ecosystems and species, requires the adjustment of conservation objectives to explicitly include overlooked species, such as C. yaundense and M. squamosa.
Yet, simply assigning protection areas might not be sufficient to ensure species protection against anthropogenic drivers of biodiversity loss. In our study, protected areas may have provided effective buffering against direct effects of human activities, such as quarrying (Table A7). However, they were less effective in mitigating indirect effects of human activities, such as climate change (Table A8). For instance, species like O. aristatum and P. scolopendria had their exposure to quarrying reduced to zero in protected areas, but roughly the same exposure to climate change when comparing protected and non-protected inselbergs (in some futures scenarios, their exposure to climate change was higher in protected areas). Thus, the reasoning for using protected areas to reduce quarrying rates is more straightforward. By establishing protected areas we can avoid quarrying activities in quarrying-prone areas, which are often neglected by conservation initiatives [14] and which species often have small geographic ranges [54]. Mitigating the impacts of quarrying may demand stricter land-use regulation and site-level protection. For example, some species were found on inselbergs included in a protected area, but with evidence of quarrying. Expanding protection areas that include inselbergs and satisfy conservation objectives (e.g., 30% under protection by 2030) requires enough resources to ensure the protection of established protected areas. We do not think it is the responsibility of researchers to find solutions for resource mobilization. But future studies on conservation of DT plants could provide more evidence on the effectiveness of different conservation approaches to support resource mobilization campaigns, as recommended by the Analysis of the Strategic Plan 2011–2020 of the Convention on Biological Biodiversity [55].
Alternatively, protected areas should be planned more strategically when considering climate change. For example, we should not expect stopping climate change by demarking a protected area, although using protected areas to establish dispersal corridors for species possible migration can be a more realistic strategy. There is a non-linear negative relationship between habitat loss and the persistence of species, which requires a minimum amount and structure of habitat to maintain viable populations [56,57]. That is, species probability of persistence gradually decreases with habitat loss until the connectivity among remaining habitat patches for a species to occur reaches a point of no return for species persistence [57]. Here, the habitat connectivity depends on factors such as patch size and their spatial arrangement, besides how species interact with the landscape [57,58]. We believe that conservation planning that can cope with climate change can benefit for a better understanding of how habitat loss owing to climate change threatens the species persistence. Future studies could evaluate the impact of inselbergs size and isolation in species metapopulations, as to assess the capacity of species to keep gene flow across different inselbergs. Ensuring the connectivity among habitat patches where DT plants occur effectively is certainly against other anthropogenic threats, but we argue it should be more explicitly established as one of protection areas objectives against climate change.
Our study considered only exposure to anthropogenic threats, offering a partial picture of species vulnerability. The fact that the two most exposed species are the most rare and unprotected ones should raise our awareness, but it is noteworthy to mention that high exposure does not necessarily translate into higher extinction risks. For example, although highly exposed to climate change, O. aristatum, an annual species, might be able to complete its life cycle before extreme climatic conditions and escape, to some extent, the negative effects of climate change. On the other hand, species might face high extinction risks even under modest exposure for exhibiting narrower ecological tolerances [59]. For instance, most Hymenophyllaceae species occur as epiphytes in moist forest and are often sensitive to changes in desiccation rate due to the lack mechanisms to reduce water loss (e.g., lack of cuticles)[60]. Besides, we only used two anthropogenic threats as proxies for different drivers of biodiversity loss. For instance, M. indica showed the lowest exposure to climate change, but its broader occurrence across different ecosystems might expose this species to threats that inselberg endemic species are not subjected. We advocate for future studies that not only use multiple lines of evidence to assess species vulnerability, but that also encompass a greater array of threats to support efficient conservation initiatives.
4. Materials and Methods
4.1. Study Area
For the purposes of this study, we considered West Africa as a biogeographic region extending from Senegal to Equatorial Guinea, following a broad ecological definition that includes approximately 20 countries and encompasses humid and transitional vegetation zones, as described by the Encyclopædia Britannica [61]. This includes countries such as Cameroon, Chad and Equatorial Guinea, which are politically classified as part of Central Africa but share strong ecological and floristic continuity with the West African forest zone. This area spans a strong climatic gradient, with annual rainfall ranging from 250 mm in the arid north to 3,000 mm in humid forest regions. As a result, there are four major vegetation zones in West Africa: Guineo-Congolian Zone (regional centre of endemism), Guineo-Congolian/Sudanian Zone (transitional zone), Sudanian Zone (regional centre of endemism), and Sahel Zone (transitional zone). One of the most important ecosystems in this region is the Guinean Coastal forest, which served as a refuge for many species during historical climate fluctuations in the Pleistocene. Today, it remains one of Africa’s eight biodiversity hotspots, characterized by high species endemicity. However, only 15% of its original forest cover remains [62], motivating conservation efforts in which 90% of national protected areas are focused on forests [63]. Inselbergs are usually overlooked, unless embedded in protected areas.
4.2. Desiccation-Tolerant Vascular Plants in West Africa
First, we conducted a systematic literature review in order to obtain a list of DT vascular plants and to evaluate their conservation concerns in West Africa. For that we applied the key-words combination “desiccation tolerant” OR “resurrection” AND angiosperm* OR pteridophyte* OR lycophyte* OR vascular OR plant*” for the search engines (1) Scopus, (2) Web of Science, (3) Academia, and (4) Google Scholar, from 1950 to 2024. We initially retrieved a total of 1,770 publications (243 articles from Scopus, 567 from Web of Science, 36 from Academia, and 811 from Google Scholar). An additional of 113 studies not found by the abovementioned key-words, including grey literature, was included in our literature pool. First, we manually removed duplicate 549 publications from our literature pool. Then, we eliminated articles that did not encompass West Africa or which were considered as not appropriate based on the PRISMA guidelines [64]. For instance, as not appropriate literature we considered papers without abstract, review papers, books, and incomplete book chapters. After this step, 339 publications were retained to compose our final literature pool (Figure S1).
From this literature pool, we compiled a comprehensive list of desiccation-tolerant plant species in West Africa. Additionally, we provided information about their geographical distribution in West Africa and conservation status. Information on the distribution of these species in West Africa was compiled from The Flora of West Africa [65], Flora of savannas and rock outcrops of Côte d’Ivoire [66], and Plants of the World Online [67]. Here we used their occurrence at the country level to discuss their distribution patterns. The following countries were considered in our study: Benin, Burkina Faso, Côte d'Ivoire, Cameroon, Cabo Verde, Chad, Gambia, Ghana, Guinea, Guinea-Bissau, Equatorial Guinea, Liberia, Mali, Mauritania, Niger, Nigeria, Senegal, Sierra Leone, and Togo. In this study, we followed the classification of Plants of the World Online [67] and grouped as Gulf of Guinea Is. the islands Bioko, Príncipe, São Tomé, and Annobón.
About their conservation status, we examined the species inclusion in the IUCN Red List of Threatened Species version 2025-1 [68]. We used the IUCN Red List 9 categories. The categories (i) extinct and (ii) extinct in the wild indicate that species are either found extinct or only have individuals living outside their natural habitat. Species threatened with extinction are found in the categories (iii) critically endangered, (iv) endangered, and (v) vulnerable, in which their extinction risk decreases in the order given. Those categorized as (vi) near threatened and (vii) least concerned are not considered with extinction risks. At last, lack of assessment exists for species in the categories (viii) data deficient and (ix) not evaluated, which have insufficient information for assessment or simply have not yet been assessed for conservation.
To evaluate the current state of research and discussion about conservation of DT plants in West Africa, we filtered from our literature pool only studies that focused on West Africa and raised three questions: (i) Did the study discuss conservation needs of DT plants? (ii) Did the study produce enough evidence to justify conservation needs of DT plants? (iii) Did the study propose effective conservation strategies for DT plants? For instance, we considered that the study discussed conservation needs for DT plants if it identified DT plants as vulnerable or as strategic components for biological conservation. Using this example, we considered that the study produced enough evidence to justify conservation needs of DT plants if it quantitatively measured the vulnerability of species or its relevance to any facet of diversity in the ecological contexts they occur (i.e., either taxonomic, phylogenetic, or functional diversity). For the third question, we considered that the study proposed effective conservation strategies for DT plants if it suggested, for example, priority species or locations for conservation. To improve our understanding about patterns among those studies, we grouped them in three categories: (1) studies focusing on the entire community, (2) studies focusing on specific community components, or (3) studies focusing on ecological processes and functioning. While we included in the first group studies that focus on diversity and ecological patterns of the whole community, in the second group, we included studies in which such patterns are discussed from the perspective of particular habitat types or taxonomic/functional groups. By last, we included in the third group studies whose main objective was to discuss ecological phenomena that explain how community patterns come about, either focusing on the whole community or specific community components.
4.3. Study Case to Evaluated the Exposure of DT Plants to Land Use Change and Climate Change
We compile a list of DT plants reported by S. Porembski in a database on West African inselbergs, as a result of extensive fieldworks in the region from 1986 to 2024. Only the inselbergs from this database were included in all our analyses. First, as a rough descriptor of conservation efforts on each species, we counted the number of inselbergs in which each species occur that are included in protected areas and other effective area-based conservation measures using the World Database on Protected Areas [52]. Here, inselbergs in which species occur were categorized into two groups, protected and non-protected.
We focused on species exposure to two anthropogenic drivers of biodiversity loss: land use change and climate change. First, we use the optical evidence of quarrying activities on the inselbergs the selected DT plants occur to estimate species exposure to land use change. For this, we used Google Earth Engine, a cloud-based geospatial analysis platform [69]. Sentinel-2 imagery (QA60 band) was retrieved, and a 2 km-radius buffer was applied around each focal location and the surrounding area, based on the geographical coordinates of inselbergs from the database of S. Porembski. Then, we produced a composite image for the months between October and December of the two consecutive years of 2022 and 2023, applying a cloud mask (cloud cover of less than 5%) to ensure data quality. The selection of the same months across consecutive years (2022 and 2023) minimizes seasonal variability, allowing to better compose the obtained images. The period from October to December was chosen because cloud cover was reduced, which allowed us to use more images with a cloud cover < 5%, improving image clarity and quality of our composite images.
Then, we used the departures in climatic variables for the inselbergs the selected DT plants occur to estimate their exposure to climate change. For that, we conducted the climate niche factorial analysis [70] to obtain information about shifts in climatic variables within the inselbergs. We first modeled the species distribution for each species, using the distribution records of species available in the database Global Biodiversity Information Facility [71] (see Table A1). The species occurrence data were harmonized, eliminating duplicates, errors, and uncertain geographic entries. We used information provided by the database Plants of the World Online [68] as reference for the natural occurrence of species. We also retained records that, despite lack of geographic coordinates, included detailed location information. Here, we employed the centroid of the municipality. To model the species distribution, we used the modelling technique MaxEnt [72] and bioclimatic variables available by CHELSA dataset (Table A2) [73] at a spatial resolution of 2°30’. We excluded bioclimatic variables 6, 9, 10, and 11, representing temperature extremes and seasonal means, due to their high collinearity with other variables. Removing them reduces redundancy and helps avoid overfitting in climate-based models, ensuring more robust and interpretable results. The MaxEnt technique was chosen because of its high predictability to identify suitable areas of occurrence for species from a niche-based perspective, even for taxa with only a few occurrence data [74]. We used only one observation within a 1 km radius and selected the most important environmental variables for each modelled species with a low correlation. Those steps were considered in order to mitigate sampling bias effects (assuming that species populations are found within isolated rock outcrops and more than one sampling point can be registered for the same inselberg) and to avoid issues with multicollinearity and model overfitting. As the final distribution area, we used the consensus of binary maps (i.e., presence-absence) between at least 50% of 5 ensemble MaxEnt models in which accuracy was higher than 0.8 and 0.6 according to receiver operator characteristic curve and true skill statistic tests, respectively. To produce the binary maps, we used the individual model thresholds given by MaxEnt in order to maximize true positive and true negative rates. The evaluation of models accuracy was performed in a cross-validation using the k-means method (k = 5), in which we used 100, 1000, or 10000 random background points if the species have less than 30, less than 300, or at least 300 occurrence points, respectively [75].
We conducted the climate niche factorial analysis using the same most important bioclimatic variables that explain each species distribution. In this analysis, present conditions were compared to future conditions. For the future, two Representative Concentration Pathway scenarios had been used, with SSP1 being the less severe (sustainable path, with environmental boundaries, low greenhouse gas emission) and SSP5 the worst (very high greenhouse gas, with fossil-fueled development). Also, three intervals of time series had been considered: 2011-2040, 2041-2070, and 2071-2100. The climate niche factorial analysis was chosen for its ability to calculate departures from prevailing climatic conditions across grid cells and provide a single exposure value to each species to climate change. At last, we extracted the exposure values for the inselbergs each species occurs in.
To compare DT plants exposure to quarrying and climate change across non-protected and protected areas, we performed a t-test when our data was normally distributed and homoscedastic or a Mann–Whitney U test when our data did not satisfy the assumptions of parametric statistics. Since hypotheses tests were repeated to different climate change scenarios, we adjusted the p-values using the Bonferroni correction. For the graphic representation purpose, we produced a phylogenetic tree using the phylogenetic hypothesis provided by Jin and Qian (as Scenario 3) [76]. All analyses and graphical representations were done using the software R, version R.4.2.2 (please see Table A3 for the used R packages) [77].
Supplementary Materials
The following supporting information can be downloaded at: Preprints.org, Table A1: Reference of occurrence datasets retrieved from GBIF database; Table A2: Bioclimatic variables retrieved from CHELSA database and used in this study; Table A3: List of R packages used in this study; Table A4: Studies about desiccation-tolerant vascular plants in West Africa; Table A5: Species presence and absence across 123 inselbergs in West Africa; Table A6: Species exposure to two anthropogenic drivers of biodiversity loss: quarrying and climate change; Table A7: Species exposure to quarrying when comparing non-protected and protected inselbergs; Table A8: Species exposure to climate change when comparing non-protected and protected inselbergs; Figure A1: PRISMA (Systematic Reviews and Meta-Analysis) flowchart describing the exclusion and selection procedure used in this meta-analysis, with the different publication registration engines and information processing steps.
Author Contributions
W.I.S. and L.B. contributed with conceptualization, methodology, formal analysis, data curation, writing original draft preparation, and visualization. S.P. and E.L.B. contribute with supervision and made data available. All authors contribute with writing—review and editing the final draft, and have read and agreed to the published version of the manuscript.
Funding
This research was funded by the German Federal Ministry of Education and Research (BMBF) through the Graduate Research Program Climate Change and Biodiversity of the West African Science Service Centre on Climate Change and Adapted Land Use (WASCAL).
Data Availability Statement
The original contributions presented in this study are included in the article/supplementary material. Further inquiries can be directed to the corresponding author(s).
Acknowledgments
We extend our sincere thanks to Dr. Miguel Inácio, whose expertise in remote sensing and Google Earth Engine played a crucial role in identifying the status of inselbergs, whether intact or impacted by quarrying activities. His technical support significantly enhanced the reliability and rigor of our spatial analyses. We are also grateful to Julius Köhler, Tabea Giese, and Elisabeth Zokov for their kind support, their constructive and critical discussions, which substantially improved the quality of the work. Finally, we express our sincere appreciation to the Graduate Research Program Climate Change and Biodiversity, under the West African Science Service Centre on Climate Change and Adapted Land Use (WASCAL) and the German Federal Ministry of Education and Research (BMBF) for their financial and academic.
Conflicts of Interest
The authors declare no conflicts of interest
Abbreviations
The following abbreviations are used in this manuscript:
| DT | Desiccation-tolerant |
| IUCN | International Union for Conservation of Nature |
| SSP | shared socioeconomic pathways |
Appendix A

Table A1.
Reference of occurrence datasets retrieved from GBIF database.
| Species | GBIF (references) |
| Actiniopteris radiata | GBIF.org (22 March 2023) GBIF Occurrence Download https://doi.org/10.15468/dl.w7xj3c |
| Actiniopteris semiflabellata | GBIF.org (22 March 2023) GBIF Occurrence Download https://doi.org/10.15468/dl.u46p8v |
| Adiantum incisum | GBIF.org (22 March 2023) GBIF Occurrence Download https://doi.org/10.15468/dl.m4pmmc |
| Afrotrilepis jaegeri | GBIF.org (28 May 2025) GBIF Occurrence Download https://doi.org/10.15468/dl.7nukjh |
| Afrotrilepis pilosa | GBIF.org (18 February 2024) GBIF Occurrence Download https://doi.org/10.15468/dl.vmqcx8 |
| Allosorus coriacea | GBIF.org (22 March 2023) GBIF Occurrence Download https://doi.org/10.15468/dl.5sremd |
| Arthropteris orientalis | GBIF.org (22 March 2023) GBIF Occurrence Download https://doi.org/10.15468/dl.yfu9nx |
| Asplenium aethiopicum | GBIF.org (22 March 2023) GBIF Occurrence Download https://doi.org/10.15468/dl.hjqzcy |
| Asplenium friesiorum | GBIF.org (22 March 2023) GBIF Occurrence Download https://doi.org/10.15468/dl.gen6n3 |
| Asplenium megalura | GBIF.org (22 March 2023) GBIF Occurrence Download https://doi.org/10.15468/dl.uweaw5 |
| Asplenium monanthes | GBIF.org (22 March 2023) GBIF Occurrence Download https://doi.org/10.15468/dl.6c9ztx |
| Asplenium sandersonii | GBIF.org (22 March 2023) GBIF Occurrence Download https://doi.org/10.15468/dl.k5hxv2 |
| Asplenium stuhlmannii | GBIF.org (18 February 2024) GBIF Occurrence Download https://doi.org/10.15468/dl.2bncdt |
| Cheilanthes inaequalis | GBIF.org (22 March 2023) GBIF Occurrence Download https://doi.org/10.15468/dl.xba4pw |
| Coleochloa abyssinica | GBIF.org (28 May 2025) GBIF Occurrence Download https://doi.org/10.15468/dl.j3xsse |
| Coleochloa domensis | GBIF.org (28 May 2025) GBIF Occurrence Download https://doi.org/10.15468/dl.32hthf |
| Cosentinia vellea | GBIF.org (22 March 2023) GBIF Occurrence Download https://doi.org/10.15468/dl.dafh4z |
| Craterostigma plantagineum | GBIF.org (22 March 2023) GBIF Occurrence Download https://doi.org/10.15468/dl.pnxv3a |
| Craterostigma yaundense | GBIF.org (18 February 2024) GBIF Occurrence Download https://doi.org/10.15468/dl.huy7m8 |
| Crepidomanes chevalieri | GBIF.org (22 March 2023) GBIF Occurrence Download https://doi.org/10.15468/dl.we3am5 |
| Crepidomanes melanotrichum | GBIF.org (22 March 2023) GBIF Occurrence Download https://doi.org/10.15468/dl.r2sdq5 |
| Didymoglossum erosum | GBIF.org (22 March 2023) GBIF Occurrence Download https://doi.org/10.15468/dl.9avcdb |
| Elaphoglossum acrostichoides | GBIF.org (22 March 2023) GBIF Occurrence Download https://doi.org/10.15468/dl.698qkw |
| Heminiotis farinosa | GBIF.org (22 March 2023) GBIF Occurrence Download https://doi.org/10.15468/dl.vzzhtk |
| Hymenophyllum capillare | GBIF.org (22 March 2023) GBIF Occurrence Download https://doi.org/10.15468/dl.wqpewp |
| Hymenophyllum hirsutum | GBIF.org (22 March 2023) GBIF Occurrence Download https://doi.org/10.15468/dl.rr3cxv |
| Hymenophyllum kuhnii | GBIF.org (22 March 2023) GBIF Occurrence Download https://doi.org/10.15468/dl.f529nm |
| Hymenophyllum splendidum | GBIF.org (22 March 2023) GBIF Occurrence Download https://doi.org/10.15468/dl.7j4fhq |
| Loxogramme abyssinica | GBIF.org (22 March 2023) GBIF Occurrence Download https://doi.org/10.15468/dl.tdve7b |
| Melpomene flabelliformis | GBIF.org (22 March 2023) GBIF Occurrence Download https://doi.org/10.15468/dl.82wkxt |
| Microchloa indica | GBIF.org (22 March 2023) GBIF Occurrence Download https://doi.org/10.15468/dl.4pek7h |
| Microchloa kunthii | GBIF.org (22 March 2023) GBIF Occurrence Download https://doi.org/10.15468/dl.sym7kq |
| Microdracoides squamosa | GBIF.org (22 March 2023) GBIF Occurrence Download https://doi.org/10.15468/dl.6pwvgd |
| Oropetium aristatum | GBIF.org (22 March 2023) GBIF Occurrence Download https://doi.org/10.15468/dl.uuvqb7 |
| Oropetium capense | GBIF.org (22 March 2023) GBIF Occurrence Download https://doi.org/10.15468/dl.r6247a |
| Pellaea dura | GBIF.org (22 March 2023) GBIF Occurrence Download https://doi.org/10.15468/dl.zsgpw2 |
| Phymatosorus scolopendria | GBIF.org (18 February 2024) GBIF Occurrence Download https://doi.org/10.15468/dl.vk237u |
| Platycerium stemaria | GBIF.org (22 March 2023) GBIF Occurrence Download https://doi.org/10.15468/dl.ffzdam |
| Pleopeltis macrocarpa | GBIF.org (22 March 2023) GBIF Occurrence Download https://doi.org/10.15468/dl.ekk9fu |
| Polyphlebium borbonicum | GBIF.org (22 March 2023) GBIF Occurrence Download https://doi.org/10.15468/dl.zvdfg9 |
| Selaginella njamnjamensis | GBIF.org (22 March 2023) GBIF Occurrence Download https://doi.org/10.15468/dl.5uud4g |
| Sporobolus festivus | GBIF.org (18 February 2024) GBIF Occurrence Download https://doi.org/10.15468/dl.m8h3dp |
| Sporobolus pellucidus | GBIF.org (22 March 2023) GBIF Occurrence Download https://doi.org/10.15468/dl.7khsy2 |
| Sporobolus stapfianus | GBIF.org (22 March 2023) GBIF Occurrence Download https://doi.org/10.15468/dl.nx4pse |
| Tripogon major | GBIF.org (22 March 2023) GBIF Occurrence Download https://doi.org/10.15468/dl.pmnuqm |
| Tripogon multiflorus | GBIF.org (28 May 2025) GBIF Occurrence Download https://doi.org/10.15468/dl.9m6dnc |
| Tripogonella minima | GBIF.org (22 March 2023) GBIF Occurrence Download https://doi.org/10.15468/dl.gzfvm3 |
| Vittaria guineensis | GBIF.org (22 March 2023) GBIF Occurrence Download https://doi.org/10.15468/dl.8ng3dd |
| Xerophyta schnizleinia | GBIF.org (22 March 2023) GBIF Occurrence Download https://doi.org/10.15468/dl.suyyuq |
Table A2.
Bioclimatic variables retrieved from CHELSA database and used in this study.
| Bioclimatic variables |
| BIO1 – Annual Mean Temperature |
| BIO2 – Mean Diurnal Range (Mean of monthly (max temp - min temp)) |
| BIO3 – Isothermality (BIO2/BIO7) (×100) |
| BIO4 – Temperature Seasonality (standard deviation ×100) |
| BIO5 – Max Temperature of Warmest Month |
| BIO7 – Temperature Annual Range (BIO5-BIO6) |
| BIO8 – Mean Temperature of Wettest Quarter |
| BIO12 – Annual Precipitation |
| BIO13 – Precipitation of Wettest Month |
| BIO14 – Precipitation of Driest Month |
| BIO15 – Precipitation Seasonality (Coefficient of Variation) |
| BIO16 – Precipitation of Wettest Quarter |
| BIO17 – Precipitation of Driest Quarter |
| BIO18 – Precipitation of Warmest Quarter |
| BIO19 – Precipitation of Coldest Quarter |
Table A3.
List of R packages used in this study.
| Packages | References |
| dplyr | Wickham H, François R, Henry L, Müller K, Vaughan D (2023). dplyr: A Grammar of Data Manipulation. R package version 1.1.4, https://CRAN.R-project.org/package=dplyr |
| forcats | Wickham H (2023). forcats: Tools for Working with Categorical Variables (Factors).R package version 1.0.0, https://CRAN.R-project.org/package=forcats |
| ggplot2 | Wickham H (2016). ggplot2: Elegant Graphics for Data Analysis. Springer-Verlag New York. R package version 3.5.0, https://CRAN.R-project.org/package=ggplot2 |
| ggpubr | Kassambara A (2023). ggpubr: 'ggplot2' Based Publication Ready Plots. R package version 0.6.0, https://CRAN.R-project.org/package=ggpubr |
| mapdata | Brownrigg R, Minka TP, Deckmyn A (2023). mapdata: Extra Map Databases. R package version 2.3.1, https://CRAN.R-project.org/package=mapdata |
| maps | Becker RA, Wilks AR, Brownrigg R, Minka TP, Deckmyn A (2023). maps: Draw Geographical Maps. R package version 3.4.1, https://CRAN.R-project.org/package=maps |
| phytools | Revell LJ (2012). phytools: An R package for phylogenetic comparative biology (and other things). Methods in Ecology and Evolution, 3(2), 217–223. https://CRAN.R-project.org/package=phytools |
| rnaturalearth | South A (2017). rnaturalearth: World Map Data from Natural Earth. R package version 0.1.0, https://CRAN.R-project.org/package=rnaturalearth |
| sf | Pebesma E (2018). Simple Features for R: Standardized Support for Spatial Vector Data. R Journal, 10(1), 439–446. https://CRAN.R-project.org/package=sf |
| terra | Hijmans R (2023). terra: Spatial Data Analysis. R package version 1.7-65, <https://CRAN.R-project.org/package=terra> |
| V.PhyloMaker | Jin, Y & Qian, H. 2019. V.PhyloMaker: an R package that can generate very large phylogenies for vascular plants. Ecography. 42(8):1353–1359. doi.org/10.1111/ecog.04434 |
| viridis | Garnier S (2021). viridis: Default Color Maps from 'matplotlib'. R package version 0.6.4, https://CRAN.R-project.org/package=viridis |
Table A4.
Studies about desiccation-tolerant vascular plants in West Africa. Q1 - Did the study discuss conservation needs of DT plants?; Q2 - Did the study provide enough evidence that justifies the conservation needs of DT plants?; Q3 - Did the study propose effective conservation strategies for DT plants?; Categories: I - Studies focusing on the entire community; II - studies focusing on specific community components; III - studies focusing on ecological processes and functioning.
Table A4.
Studies about desiccation-tolerant vascular plants in West Africa. Q1 - Did the study discuss conservation needs of DT plants?; Q2 - Did the study provide enough evidence that justifies the conservation needs of DT plants?; Q3 - Did the study propose effective conservation strategies for DT plants?; Categories: I - Studies focusing on the entire community; II - studies focusing on specific community components; III - studies focusing on ecological processes and functioning.
| References | Q1 | Q2 | Q3 | Categories |
| Gaff, D. F. (1986). Desiccation tolerant ‘resurrection’grasses from Kenya and West Africa. Oecologia, 70, 118-120. | No | No | No | II |
| Krieger, A., Porembski, S., & Barthlott, W. (2000). Vegetation of seasonal rock pools on inselbergs situated in the savanna zone of the Ivory Coast (West Africa). Flora, 195(3), 257-266. | No | No | No | II |
| Müller, J. V. (2007). Herbaceous vegetation of seasonally wet habitats on inselbergs and lateritic crusts in West and Central Africa. Folia Geobotanica, 42, 29-61. | No | No | No | II |
| Oumorou, M., & Lejoly, J. (2003). Écologie, flore et végétation de l'inselberg Sobakperou (Nord-Bénin). Acta botanica gallica, 150(1), 65-84. | No | No | No | I |
| Owoseye, J. A., & Sanford, W. W. (1972). An ecological study of Vellozia schnitzleinia, a drought-enduring plant of northern Nigeria. The Journal of Ecology, 807-817. | No | No | No | II |
| Parmentier, I. (2001). Premières études sur la diversité végétale des inselbergs de Guinée Équatoriale continentale. Systematics and Geography of Plants, 911-922. | No | No | No | I |
| Parmentier, I., & Hardy, O. J. (2009). The impact of ecological differentiation and dispersal limitation on species turnover and phylogenetic structure of inselberg's plant communities. Ecography, 32(4), 613-622. | No | No | No | I |
| Parmentier, I., Oumorou, M., Pauwels, L., & Lejoly, J. (2006). Comparison of the ecology and distribution of the Poaceae flora on inselbergs embedded in savannah (Benin) or in rain forest (Western Central Africa). Belgian Journal of Botany, 65-77. | No | No | No | II |
| Porembski, S. (2000). The invasibility of tropical granite outcrops ('inselbergs') by exotic weeds. Journal of the Royal society of Western Australia, 83, 131. | Yes | No | No | III |
| Porembski, S. (2007). Tropical inselbergs: habitat types, adaptive strategies and diversity patterns. Brazilian Journal of Botany, 30, 579-586. | Yes | No | No | I |
| Porembski, S., & Barthlott, W. (1996). Plant species diversity of West African inselbergs. In The Biodiversity of African Plants: Proceedings XIVth AETFAT Congress 22–27 August 1994, Wageningen, The Netherlands (pp. 180-187). Springer Netherlands. | No | No | No | I |
| Porembski, S., & Barthlott, W. (1997). Seasonal Dynamics of Plant Diversity on lnselbergs in the Ivory Coast (West Africa). Botanica Acta, 110(6), 466-472. | No | No | No | I |
| Porembski, S., & Watve, A. (2005). Remarks on the species composition of ephemeral flush communities on paleotropical rock outcrops. Phytocoenologia, 389-402. | No | No | No | II |
| Porembski, S., Barthlott, W., Dörrstock, S., & Biedinger, N. (1994). Vegetation of rock outcrops in Guinea: granite inselbergs, sandstone table mountains and ferricretes—remarks on species numbers and endemism. Flora, 189(4), 315-326. | Yes | No | No | I |
| Porembski, S., Becker, U., & Seine, R. (2000). Islands on islands: habitats on inselbergs. In Inselbergs: biotic diversity of isolated rock outcrops in tropical and temperate regions (pp. 49-67). Berlin, Heidelberg: Springer Berlin Heidelberg. | No | No | No | II |
| Porembski, S., Brown, G., & Barthlott, W. (1996). A species-poor tropical sedge community: Afrotrilepis pilosa mats on inselbergs in West Africa. Nordic Journal of Botany, 16(3), 239-245. | No | No | No | II |
| Porembski, S., Seine, R., & Barthlott, W. (1997). Inselberg vegetation and the biodiversity of granite outcrops. Journal of the Royal Society of Western Australia, 80, 193. | No | No | No | I |
| Porembski, S., Silveira, F. A., Fiedler, P. L., Watve, A., Rabarimanarivo, M., Kouame, F., & Hopper, S. D. (2016). Worldwide destruction of inselbergs and related rock outcrops threatens a unique ecosystem. Biodiversity and Conservation, 25, 2827-2830. | Yes | No | No | III |
| Porembski, S., Szarzynski, J., Mund, J. P., & Barthlott, W. (1996). Biodiversity and vegetation of small-sized inselbergs in a West African rain forest (Taı, Ivory Coast). Journal of Biogeography, 23(1), 47-55. | No | No | No | I |
| Richards, P. W. (1957). Ecological notes on West African vegetation: I. The plant communities of the Idanre hills, Nigeria. The Journal of Ecology, 563-577. | No | No | No | I |
| Seine, R., Porembski, S., & Barthlott, W. (1996). A neglected habitat of carnivorous plants: inselbergs. Feddes Repertorium, 106(5-8), 555-562. | No | No | No | II |
| Szarzynski, J. (2000). Xeric islands: environmental conditions on inselbergs. In Inselbergs: biotic diversity of isolated rock outcrops in tropical and temperate regions (pp. 37-48). Berlin, Heidelberg: Springer Berlin Heidelberg. | No | No | No | I |
| Tindano, E., Ganaba, S., Sambare, O., & Thiombiano, A. (2015). Sahelian inselberg vegetation in Burkina Faso. Bois & Forêts des Tropiques, 325(3), 21–33. | No | No | No | I |
| Tindano, E., Kaboré, G. E., Porembski, S., & Thiombiano, A. (2024). Plant communities on inselbergs in Burkina Faso. Heliyon, 10(1). | No | No | No | I |
| Tindano, E., Kadéba, A., Traoré, I. C. E., & Thiombiano, A. (2023). Effects of abiotic factors on the flora and vegetation of inselbergs in Burkina Faso. Environmental Advances, 12, 100378. | No | No | No | I |
| Tindano, E., Lankoandé, B., Porembski, S., & Thiombiano, A. (2023). Inselbergs: potential conservation areas for plant diversity in the face of anthropization. J. Phytol, 15, 70-79. | No | No | No | I |
| Tindano, E., Poremski, S., Koehler, J., & Thiombiano, A. (2021). Ecological and floristic characterization of inselberg habitats in Burkina Faso. Geo-Eco-Trop, 45(4), 573-588. | No | No | No | I |
Table A5.
Species presence (1) and absence (0) across 123 inselbergs in West Africa. Ap – A. pilosa, As - A. stuhlmannii, Cy - C. yaundense, Mi - M. indica, Ms - M. squamosa, Oa - O. aristatum, Pd - P. doniana, Ps - P. scolopendria, Sf - S. festivus, Tm - T. minimus.
Table A5.
Species presence (1) and absence (0) across 123 inselbergs in West Africa. Ap – A. pilosa, As - A. stuhlmannii, Cy - C. yaundense, Mi - M. indica, Ms - M. squamosa, Oa - O. aristatum, Pd - P. doniana, Ps - P. scolopendria, Sf - S. festivus, Tm - T. minimus.
| Inselbergs | Longitude | Latitude | Ap | As | Cy | Mi | Ms | Oa | Pd | Ps | Sf | Tm |
| Mt. Niangbo | -5.1775 | 8.8275 | 1 | 1 | 0 | 1 | 0 | 0 | 1 | 0 | 1 | 1 |
| Mt. Korhogo | -5.650833 | 9.4525 | 1 | 1 | 0 | 1 | 0 | 0 | 1 | 0 | 1 | 1 |
| Nambelegue | -5.675833 | 9.473889 | 1 | 1 | 0 | 1 | 0 | 0 | 1 | 0 | 1 | 1 |
| Near Korhogo | -5.615556 | 9.501111 | 1 | 1 | 0 | 1 | 0 | 0 | 1 | 0 | 1 | 1 |
| Boundiali 1 | -6.494444 | 9.534167 | 1 | 1 | 0 | 1 | 0 | 0 | 1 | 0 | 1 | 1 |
| Boundiali 2 | -6.626111 | 9.596667 | 1 | 1 | 0 | 1 | 0 | 0 | 1 | 0 | 1 | 1 |
| Boundiali 3 | -6.488056 | 9.493889 | 1 | 1 | 0 | 1 | 0 | 0 | 1 | 0 | 1 | 1 |
| Séguéla 1 | -6.544722 | 7.900278 | 1 | 1 | 0 | 1 | 0 | 0 | 1 | 0 | 1 | 1 |
| Séguéla 2 | -6.533333 | 7.9075 | 1 | 1 | 0 | 1 | 0 | 0 | 1 | 0 | 1 | 1 |
| Séguéla (road to Mankono) 1 | -6.638056 | 8.037222 | 1 | 1 | 0 | 1 | 0 | 0 | 1 | 0 | 1 | 1 |
| Séguéla (road to Mankono) 2 | -6.640556 | 8.029444 | 1 | 1 | 0 | 1 | 0 | 0 | 1 | 0 | 1 | 0 |
| Man (Cascade) | -7.628056 | 7.494722 | 1 | 1 | 0 | 0 | 0 | 0 | 1 | 1 | 1 | 0 |
| Danané | -8.131667 | 7.269444 | 1 | 1 | 0 | 0 | 0 | 0 | 1 | 1 | 1 | 0 |
| Duékoué 1 | -7.365556 | 6.756389 | 1 | 1 | 0 | 1 | 0 | 0 | 1 | 1 | 1 | 0 |
| Duékoué 2 | -7.376111 | 6.751111 | 1 | 1 | 0 | 1 | 0 | 0 | 1 | 1 | 1 | 0 |
| Man (Dent de Man) | -7.541667 | 7.452222 | 1 | 1 | 0 | 1 | 0 | 0 | 1 | 1 | 1 | 0 |
| Mt. Niénokoué | -7.17 | 5.434444 | 0 | 0 | 0 | 0 | 0 | 0 | 0 | 1 | 0 | 0 |
| Rocher d’Issia | -6.581111 | 6.483333 | 1 | 1 | 0 | 0 | 0 | 0 | 1 | 1 | 0 | 0 |
| Dabakala (Kadjeoule-Sourdi) | -4.546667 | 8.419444 | 1 | 1 | 0 | 1 | 0 | 0 | 1 | 0 | 1 | 1 |
| Nassian (Gbonkonou) | -3.500278 | 8.45 | 1 | 1 | 0 | 1 | 0 | 0 | 1 | 0 | 1 | 1 |
| Man (Cissus) | -7.575833 | 7.424167 | 1 | 1 | 0 | 1 | 0 | 0 | 1 | 1 | 1 | 0 |
| Tai-National Park | -7.209722 | 5.4625 | 0 | 0 | 0 | 0 | 0 | 0 | 0 | 1 | 0 | 0 |
| Duékoué (quarry) | -7.354167 | 6.754444 | 1 | 1 | 0 | 1 | 0 | 0 | 1 | 1 | 1 | 0 |
| Sénéma (south of Séguéla) | -6.58 | 7.7175 | 1 | 1 | 0 | 1 | 0 | 0 | 1 | 0 | 1 | 1 |
| near Mankono | -6.271667 | 8.098333 | 1 | 1 | 0 | 1 | 0 | 0 | 1 | 0 | 1 | 1 |
| near Bouaké | -5.112778 | 7.762222 | 1 | 1 | 0 | 1 | 0 | 0 | 1 | 0 | 1 | 1 |
| north of Boundiali | -6.466389 | 9.7275 | 1 | 1 | 0 | 1 | 0 | 0 | 1 | 0 | 1 | 1 |
| region of Abengourou (near Aniassué) | -3.717778 | 6.655 | 1 | 1 | 0 | 1 | 0 | 0 | 1 | 0 | 1 | 0 |
| region of Abengourou (near Atakro) | -3.810556 | 6.667778 | 1 | 1 | 0 | 1 | 0 | 0 | 1 | 0 | 1 | 0 |
| Mt. Mafa | -4.043611 | 5.8525 | 1 | 1 | 0 | 0 | 0 | 0 | 1 | 1 | 0 | 0 |
| near Foumbolo | -4.670833 | 8.586111 | 1 | 1 | 0 | 1 | 0 | 0 | 1 | 0 | 1 | 1 |
| Mt. Tonkoui | -7.643889 | 7.4425 | 1 | 1 | 0 | 0 | 0 | 0 | 1 | 1 | 1 | 0 |
| Comoé National Park, P 1 | -3.775 | 8.772222 | 1 | 1 | 0 | 1 | 0 | 0 | 1 | 0 | 1 | 1 |
| P 13, south of Kakpin | -3.777222 | 8.611389 | 1 | 1 | 0 | 1 | 0 | 0 | 1 | 0 | 1 | 1 |
| near Lolobo | -5.306667 | 6.969444 | 1 | 1 | 0 | 1 | 0 | 0 | 1 | 0 | 0 | 0 |
| west of Nassian | -3.4875 | 8.453611 | 1 | 1 | 0 | 1 | 0 | 0 | 1 | 0 | 1 | 1 |
| near Brobo | -4.828611 | 7.662222 | 1 | 1 | 0 | 1 | 0 | 0 | 1 | 0 | 0 | 1 |
| near Bouna (ferricrete) | -3.038611 | 9.354167 | 1 | 1 | 0 | 1 | 0 | 0 | 1 | 0 | 0 | 1 |
| near Odienné | -7.625556 | 9.679167 | 1 | 1 | 0 | 1 | 0 | 0 | 1 | 0 | 0 | 1 |
| near Tiémé 1 | -7.281667 | 9.554444 | 1 | 1 | 0 | 1 | 0 | 0 | 1 | 0 | 0 | 1 |
| near Tiémé 2 | -7.253889 | 9.559444 | 1 | 1 | 0 | 1 | 0 | 0 | 1 | 0 | 0 | 1 |
| near Badandougou | -7.156944 | 9.570278 | 1 | 1 | 0 | 1 | 0 | 0 | 1 | 0 | 0 | 1 |
| near Madinani 1 | -7.013333 | 9.629167 | 1 | 1 | 0 | 1 | 0 | 0 | 1 | 0 | 0 | 1 |
| near Madinani 2 | -6.813333 | 9.594444 | 1 | 1 | 0 | 1 | 0 | 0 | 1 | 0 | 0 | 1 |
| near Madinani 3 | -6.737778 | 9.595556 | 1 | 1 | 0 | 1 | 0 | 0 | 1 | 0 | 0 | 1 |
| near Gbando 1 | -6.668333 | 9.556389 | 1 | 1 | 0 | 1 | 0 | 0 | 1 | 0 | 0 | 1 |
| near Gbando 2 | -6.659722 | 9.544167 | 1 | 1 | 0 | 1 | 0 | 0 | 1 | 0 | 0 | 1 |
| near Touba (sandstone outcrop) | -7.631111 | 8.228056 | 1 | 1 | 0 | 1 | 0 | 0 | 1 | 0 | 1 | 1 |
| Daloa 1 | -6.434722 | 6.829444 | 1 | 1 | 0 | 0 | 0 | 0 | 1 | 0 | 0 | 0 |
| Daloa 2 | -6.434167 | 6.849722 | 1 | 1 | 0 | 0 | 0 | 0 | 1 | 0 | 1 | 0 |
| Sikensi 1 | -4.561667 | 5.645 | 1 | 1 | 0 | 0 | 0 | 0 | 1 | 1 | 0 | 0 |
| Sikensi 3 | -4.5575 | 5.653611 | 1 | 1 | 0 | 0 | 0 | 0 | 1 | 1 | 0 | 0 |
| near Tehini | -3.608056 | 9.595278 | 1 | 1 | 0 | 1 | 0 | 0 | 1 | 0 | 1 | 1 |
| near Tehini (ferricrete) | -3.58 | 9.607778 | 1 | 1 | 0 | 1 | 0 | 0 | 1 | 0 | 1 | 1 |
| near Tondoura (BF) | -4.773611 | 10.173889 | 0 | 0 | 0 | 1 | 0 | 0 | 1 | 0 | 1 | 1 |
| near Mangodara (BF) | -4.441667 | 9.857222 | 1 | 1 | 0 | 1 | 0 | 0 | 1 | 0 | 1 | 1 |
| near Wayen (BF) | -0.983333 | 12.323611 | 0 | 0 | 0 | 1 | 0 | 1 | 0 | 0 | 1 | 1 |
| near Zorgho (BF) | -0.632222 | 12.211111 | 0 | 0 | 0 | 1 | 0 | 1 | 0 | 0 | 1 | 1 |
| near Léo (BF) | -2.193611 | 11.115833 | 0 | 0 | 0 | 1 | 0 | 1 | 1 | 0 | 1 | 1 |
| Nazinga (BF) | -1.6075 | 11.178611 | 0 | 0 | 0 | 1 | 0 | 1 | 1 | 0 | 1 | 1 |
| near Bobo-Dioulasso | -4.135278 | 11.303611 | 0 | 0 | 0 | 1 | 0 | 1 | 1 | 0 | 1 | 1 |
| near Banfora (BF) sandstone | -4.595833 | 10.848889 | 1 | 1 | 0 | 1 | 0 | 0 | 1 | 0 | 1 | 1 |
| Reserve de Bontioli (BF) ferricrete | -2.955556 | 10.944167 | 0 | 0 | 0 | 1 | 0 | 1 | 0 | 0 | 1 | 1 |
| near Po 1 | -1.123056 | 11.124722 | 0 | 0 | 0 | 1 | 0 | 1 | 1 | 0 | 1 | 1 |
| near Po 2 | -1.084167 | 11.073611 | 0 | 0 | 0 | 1 | 0 | 1 | 0 | 0 | 1 | 1 |
| Soubakpérou (Benin) | 2.160278 | 9.144444 | 1 | 1 | 0 | 1 | 0 | 0 | 1 | 0 | 1 | 1 |
| near Savé (Benin) | 2.163056 | 9.144444 | 1 | 1 | 0 | 1 | 0 | 0 | 1 | 0 | 1 | 1 |
| near Kandi 1 | 2.895556 | 11.130833 | 0 | 0 | 0 | 1 | 0 | 1 | 0 | 0 | 1 | 1 |
| near Kandi 2 | 2.900278 | 11.108333 | 0 | 0 | 0 | 1 | 0 | 1 | 0 | 0 | 1 | 1 |
| near Goungoun (ferricrete) 1 | 3.154444 | 11.574167 | 0 | 0 | 0 | 1 | 0 | 1 | 0 | 0 | 1 | 1 |
| near Goungoun (ferricrete) 2 | 3.150556 | 11.565 | 0 | 0 | 0 | 1 | 0 | 1 | 0 | 0 | 1 | 1 |
| near Goungoun (ferricrete) 3 | 3.160278 | 11.543333 | 0 | 0 | 0 | 1 | 0 | 1 | 1 | 0 | 1 | 1 |
| Dassa 1 | 2.190833 | 7.782222 | 1 | 1 | 0 | 1 | 0 | 0 | 1 | 0 | 1 | 1 |
| Dassa 2 | 2.195278 | 7.753333 | 1 | 1 | 0 | 1 | 0 | 0 | 1 | 0 | 1 | 1 |
| Dassa 3 | 2.202222 | 7.709722 | 1 | 1 | 0 | 1 | 0 | 0 | 1 | 0 | 1 | 1 |
| Savalou | 1.978333 | 7.965833 | 1 | 1 | 0 | 1 | 0 | 0 | 1 | 0 | 1 | 1 |
| Natitingou (sandstone) 1 | 1.369167 | 10.306389 | 1 | 1 | 0 | 1 | 0 | 0 | 1 | 0 | 1 | 1 |
| Natitingou (sandstone) 2 | 1.395 | 10.301111 | 1 | 1 | 0 | 1 | 0 | 0 | 1 | 0 | 1 | 1 |
| near Natitingou (sandstone) | 1.444167 | 10.210833 | 1 | 1 | 0 | 1 | 0 | 0 | 1 | 0 | 1 | 1 |
| near Biguina | 1.696667 | 8.764722 | 1 | 1 | 0 | 1 | 0 | 0 | 1 | 0 | 1 | 1 |
| Savè | 2.508056 | 8.036389 | 1 | 1 | 0 | 1 | 0 | 0 | 1 | 0 | 1 | 1 |
| near Savè 1 | 2.581944 | 8.04 | 1 | 1 | 0 | 1 | 0 | 0 | 1 | 0 | 1 | 1 |
| near Savè 2 | 2.61 | 8.044722 | 1 | 1 | 0 | 1 | 0 | 0 | 1 | 0 | 1 | 1 |
| near Gorobani: | 2.026389 | 9.4775 | 1 | 1 | 0 | 1 | 0 | 0 | 1 | 0 | 1 | 1 |
| near Yebessi | 2.105278 | 9.346667 | 1 | 1 | 0 | 1 | 0 | 0 | 1 | 0 | 1 | 1 |
| Yebessi | 2.133056 | 9.326111 | 1 | 1 | 0 | 1 | 0 | 0 | 1 | 0 | 1 | 1 |
| near Kpéssou | 2.196111 | 9.296111 | 1 | 1 | 0 | 1 | 0 | 0 | 1 | 0 | 1 | 1 |
| Kpéssou | 2.188611 | 9.285556 | 1 | 1 | 0 | 1 | 0 | 0 | 1 | 0 | 1 | 1 |
| Yaounde 1 | 11.393333 | 3.828056 | 0 | 0 | 1 | 0 | 1 | 0 | 1 | 1 | 0 | 0 |
| Yaounde 2 | 11.425556 | 3.830278 | 0 | 0 | 1 | 0 | 1 | 0 | 1 | 1 | 0 | 0 |
| Yaounde 3 | 11.434167 | 3.887778 | 0 | 0 | 1 | 0 | 1 | 0 | 1 | 1 | 0 | 0 |
| Yaounde 4 | 11.443056 | 3.827222 | 0 | 0 | 1 | 0 | 1 | 0 | 1 | 1 | 0 | 0 |
| Yaounde 5 | 11.466389 | 3.853056 | 0 | 0 | 1 | 0 | 1 | 0 | 1 | 1 | 0 | 0 |
| Mamfe 1 | 9.322778 | 5.766111 | 1 | 1 | 0 | 0 | 1 | 0 | 1 | 1 | 1 | 0 |
| Mamfe 2 | 9.336944 | 5.758333 | 1 | 1 | 0 | 0 | 1 | 0 | 1 | 1 | 1 | 0 |
| Takamanda 1 | 9.513889 | 6.175833 | 0 | 0 | 0 | 0 | 1 | 0 | 1 | 1 | 1 | 0 |
| Takamanda 2 | 9.525833 | 6.111944 | 0 | 0 | 0 | 0 | 1 | 0 | 1 | 1 | 1 | 0 |
| Friguiagabe (sandstone outcrop) | -12.912778 | 9.976389 | 1 | 1 | 0 | 1 | 1 | 0 | 1 | 0 | 1 | 0 |
| Mt. Gangan (sandstone outcrop) 1 | -12.893056 | 10.055 | 1 | 1 | 0 | 1 | 0 | 0 | 1 | 0 | 1 | 0 |
| Mt. Gangan (sandstone outcrop) 2 | -12.878611 | 10.078056 | 1 | 1 | 0 | 1 | 0 | 0 | 1 | 0 | 1 | 0 |
| Macenta | -9.460556 | 8.522222 | 1 | 1 | 0 | 0 | 0 | 0 | 1 | 0 | 1 | 0 |
| near Macenta | -9.491667 | 8.599167 | 1 | 1 | 0 | 0 | 0 | 0 | 1 | 0 | 1 | 0 |
| near Balizia | -9.605 | 8.601111 | 1 | 1 | 0 | 0 | 0 | 0 | 1 | 0 | 1 | 0 |
| Guéckédou | -10.098611 | 8.557222 | 1 | 1 | 0 | 1 | 0 | 0 | 1 | 1 | 1 | 0 |
| near Kolobingo | -10.017222 | 8.553611 | 1 | 1 | 0 | 0 | 0 | 0 | 1 | 1 | 1 | 0 |
| near Técoulo | -9.984444 | 8.534167 | 1 | 1 | 0 | 0 | 0 | 0 | 1 | 1 | 1 | 0 |
| Tongo Hills 1 | -0.812778 | 10.67 | 0 | 0 | 0 | 1 | 0 | 1 | 0 | 0 | 1 | 1 |
| Tongo Hills 2 | -0.803611 | 10.688889 | 0 | 0 | 0 | 1 | 0 | 1 | 0 | 0 | 1 | 1 |
| Akure | 5.181944 | 7.216389 | 1 | 1 | 0 | 1 | 0 | 0 | 1 | 1 | 1 | 0 |
| Near Akure 1 | 5.161389 | 7.343333 | 1 | 1 | 0 | 1 | 0 | 0 | 1 | 1 | 1 | 0 |
| Near Akure 2 | 5.171389 | 7.348611 | 1 | 1 | 0 | 1 | 0 | 0 | 1 | 1 | 1 | 0 |
| Near Akure 3 | 5.226389 | 7.374167 | 1 | 1 | 0 | 1 | 0 | 0 | 1 | 1 | 1 | 0 |
| Idanre 1 | 5.15 | 7.108889 | 1 | 1 | 0 | 0 | 0 | 0 | 1 | 1 | 1 | 0 |
| Idanre 2 | 5.144722 | 7.111389 | 1 | 1 | 0 | 0 | 0 | 0 | 1 | 1 | 1 | 0 |
| Idanre 3 | 5.133056 | 7.110833 | 1 | 1 | 0 | 0 | 0 | 0 | 1 | 1 | 1 | 0 |
| Idanre 4 | 5.105556 | 7.126667 | 1 | 1 | 0 | 1 | 0 | 0 | 1 | 1 | 1 | 0 |
| near Idanre 1 | 5.034167 | 7.175278 | 1 | 1 | 0 | 1 | 0 | 0 | 1 | 1 | 1 | 0 |
| near Idanre 2 | 5.0425 | 7.190278 | 1 | 1 | 0 | 1 | 0 | 0 | 1 | 1 | 1 | 0 |
| Bicurga | 10.471111 | 1.583611 | 0 | 0 | 0 | 0 | 0 | 0 | 1 | 1 | 0 | 0 |
| Piedras Nzas 1 | 11.031944 | 1.456389 | 0 | 0 | 0 | 0 | 0 | 0 | 1 | 1 | 1 | 0 |
| Piedras Nzas 2 | 11.021667 | 1.463889 | 0 | 0 | 0 | 0 | 0 | 0 | 1 | 1 | 1 | 0 |
| Dumu | 11.323611 | 1.368056 | 0 | 0 | 0 | 0 | 0 | 0 | 1 | 1 | 1 | 0 |
| near Asoc | 11.276944 | 1.451111 | 0 | 0 | 0 | 0 | 0 | 0 | 1 | 1 | 1 | 0 |
Table A6.
Species exposure to two anthropogenic drivers of biodiversity loss: quarrying and climate change.
Table A6.
Species exposure to two anthropogenic drivers of biodiversity loss: quarrying and climate change.
| Species | Exposure | |||
| Quarrying | ||||
| A. pilosa | 10.75% (10 out of 93) | |||
| A. stuhlmannii | 10.75% (10 out of 93) | |||
| C. yaundense | 60% (3 out of 5) | |||
| M. indica | 8.89% (8 out of 90) | |||
| M. squamosa | 40% (4 out of 10) | |||
| O. aristatum | 13.33% (2 out of 15) | |||
| P. doniana | 13.64% (15 out of 110) | |||
| P. scolopendria | 14.63% (6 out of 41) | |||
| S. festivus | 8.26% (9 out of 109) | |||
| T. minimus | 7.04% (5 out of 71) | |||
| Climate change | 2011-2040 | 2041-2070 | 2071_2100 | |
| SSP1 | ||||
| A. pilosa | 0.51 (0.38 - 0.63) | 1.39 (1.25 - 1.59) | 1.38 (1.21 - 1.51) | |
| A. stuhlmannii | 0.65 (0.48 - 0.79) | 1.75 (1.58 - 2) | 1.81 (1.58 - 2.04) | |
| C. yaundense | 1.2 (1.17 - 1.22) | 3.48 (3.46 - 3.5) | 3.86 (3.76 - 3.91) | |
| M. indica | 0.06 (0.04 - 0.08) | 0.14 (0.12 - 0.15) | 0.15 (0.12 - 0.18) | |
| M. squamosa | 0.87 (0.77 - 0.91) | 2.22 (2.07 - 2.3) | 2.39 (2.22 - 2.48) | |
| O. aristatum | 0.47 (0.44 - 0.58) | 0.64 (0.59 - 0.8) | 1.41 (1.3 - 1.63) | |
| P. doniana | 0.2 (0.14 - 0.27) | 0.25 (0.19 - 0.3) | 0.52 (0.36 - 0.62) | |
| P. scolopendria | 0.43 (0.31 - 0.53) | 1.12 (1 - 1.25) | 1.21 (1.02 - 1.37) | |
| S. festivus | 0.15 (0.11 - 0.2) | 0.38 (0.35 - 0.43) | 0.41 (0.33 - 0.48) | |
| T. minimus | 0.16 (0.13 - 0.21) | 0.42 (0.39 - 0.48) | 0.44 (0.35 - 0.53) | |
| SSP5 | ||||
| A. pilosa | 0.62 (0.47 - 0.71) | 3.95 (3.47 - 4.27) | 13.19 (11.24 - 14.57) | |
| A. stuhlmannii | 0.78 (0.59 - 0.9) | 4.98 (4.34 - 5.37) | 16.62 (14.16 - 18.37) | |
| C. yaundense | 1.43 (1.42 - 1.43) | 9.39 (9.35 - 9.42) | 28.18 (28.07 - 28.41) | |
| M. indica | 0.06 (0.05 - 0.09) | 0.36 (0.28 - 0.42) | 1.1 (0.94 - 1.26) | |
| M. squamosa | 1.02 (0.95 - 1.08) | 6.52 (6.14 - 6.76) | 21.42 (20.15 - 21.84) | |
| O. aristatum | 0.74 (0.69 - 0.88) | 4.11 (3.87 - 4.84) | 14.9 (14.19 - 17.08) | |
| P. doniana | 0.23 (0.16 - 0.29) | 1.33 (0.94 - 1.52) | 4.35 (3.67 - 4.77) | |
| P. scolopendria | 0.49 (0.36 - 0.59) | 2.92 (2.55 - 3.22) | 9.11 (7.9 - 9.74) | |
| S. festivus | 0.44 (0.35 - 0.51) | 1.05 (0.83 - 1.18) | 3.46 (3.04 - 4.04) | |
| T. minimus | 0.2 (0.16 - 0.23) | 1.17 (0.93 - 1.33) | 3.96 (3.46 - 4.6) | |
Table A7.
Species exposure to quarrying when comparing non-protected and protected inselbergs.
| Species | Number of non-protected inselbergs | Number of protected inselbergs | |||||
| Without quarrying | With quarrying | Without quarrying | With quarrying | ||||
| A. pilosa | 69 (88%) | 9 (12%) | 14 (93%) | 1 (7%) | |||
| A. stuhlmannii | 69 (88%) | 9 (12%) | 14 (93%) | 1 (7%) | |||
| C. yaundense | 2 (40%) | 3 (60%) | - | - | |||
| M. indica | 65 (90%) | 7 (10%) | 17 (94%) | 1 (6%) | |||
| M. squamosa | 6 (60%) | 4 (40%) | - | - | |||
| O. aristatum | 9 (82%) | 2 (18%) | 4 (100%) | 0 (0%) | |||
| P. doniana | 78 (85%) | 14 (15%) | 17 (94%) | 1 (6%) | |||
| P. scolopendria | 30 (83%) | 6 (17%) | 5 (100%) | 0 (0%) | |||
| S. festivus | 80 (91%) | 8 (9%) | 20 (95%) | 1 (5%) | |||
| T. minimus | 51 (93%) | 4 (7%) | 15 (94%) | 1 (6%) | |||
Table A8.
Species exposure to climate change when comparing non-protected and protected inselbergs.
| Species | Non-protected inselbergs | Protected inselbergs | ||||
| 2011-2040 | 2041-2070 | 2071_2100 | 2011-2041 | 2041-2071 | 2071_2101 | |
| SSP1 | ||||||
| A. pilosa | 0.52 (0.38 - 0.63) | 1.4 (1.27 - 1.59) | 1.39 (1.21 - 1.51) | 0.48 (0.44 - 0.55) | 1.34 (1.25 - 1.43) | 1.36 (1.25 - 1.42) |
| A. stuhlmannii | 0.66 (0.48 - 0.79) | 1.76 (1.61 - 2) | 1.83 (1.61 - 2.04) | 0.61 (0.56 - 0.69) | 1.69 (1.58 - 1.8) | 1.73 (1.58 - 1.88) |
| C. yaundense | 1.2 (1.17 - 1.22) | 3.48 (3.46 - 3.5) | 3.86 (3.76 - 3.91) | - | - | - |
| M. indica | 0.06 (0.04 - 0.08) | 0.14 (0.12 - 0.15) | 0.15 (0.12 - 0.18) | 0.05 (0.04 - 0.06) | 0.14 (0.13 - 0.14) | 0.15 (0.15 - 0.16) |
| M. squamosa | 0.87 (0.77 - 0.91) | 2.22 (2.07 - 2.3) | 2.39 (2.22 - 2.48) | - | - | - |
| O. aristatum | 0.48 (0.44 - 0.58) | 0.64 (0.59 - 0.8) | 1.41 (1.3 - 1.63) | 0.44 (0.44 - 0.44) | 0.63 (0.59 - 0.65) | 1.42 (1.31 - 1.45) |
| P. doniana | 0.2 (0.14 - 0.27) | 0.25 (0.19 - 0.3) | 0.52 (0.36 - 0.62) | 0.18 (0.16 - 0.2) | 0.23 (0.21 - 0.25) | 0.5 (0.47 - 0.56) |
| P. scolopendria | 0.44 (0.31 - 0.53) | 1.12 (1 - 1.25) | 1.21 (1.02 - 1.37) | 0.4 (0.39 - 0.41) | 1.13 (1.09 - 1.16) | 1.18 (1.06 - 1.22) |
| S. festivus | 0.15 (0.11 - 0.2) | 0.39 (0.35 - 0.43) | 0.41 (0.33 - 0.48) | 0.14 (0.12 - 0.16) | 0.38 (0.36 - 0.41) | 0.4 (0.38 - 0.44) |
| T. minimus | 0.17 (0.14 - 0.21) | 0.42 (0.39 - 0.48) | 0.44 (0.35 - 0.53) | 0.15 (0.13 - 0.17) | 0.42 (0.39 - 0.45) | 0.43 (0.41 - 0.46) |
| SSP5 | ||||||
| A. pilosa | 0.63 (0.47 - 0.71) | 3.97 (3.47 - 4.27) | 13.18 (11.24 - 14.57) | 0.59 (0.49 - 0.67) | 3.88 (3.59 - 4.1) | 13.25 (12.74 - 13.63) |
| A. stuhlmannii | 0.79 (0.59 - 0.9) | 5 (4.34 - 5.37) | 16.6 (14.16 - 18.37) | 0.74 (0.61 - 0.84) | 4.89 (4.52 - 5.16) | 16.7 (16.05 - 17.17) |
| C. yaundense | 1.43 (1.42 - 1.43) | 9.39 (9.35 - 9.42) | 28.18 (28.07 - 28.41) | - | - | - |
| M. indica | 0.07 (0.05 - 0.09) | 0.36 (0.28 - 0.42) | 1.11 (0.94 - 1.26) | 0.06 (0.06 - 0.07) | 0.35 (0.32 - 0.38) | 1.09 (1.03 - 1.15) |
| M. squamosa | 1.02 (0.95 - 1.08) | 6.52 (6.14 - 6.76) | 21.42 (20.15 - 21.84) | - | - | - |
| O. aristatum | 0.75 (0.69 - 0.88) | 4.15 (3.89 - 4.84) | 15.06 (14.19 - 17.08) | 0.71 (0.7 - 0.71) | 3.99 (3.87 - 4.02) | 14.48 (14.3 - 14.54) |
| P. doniana | 0.23 (0.16 - 0.29) | 1.34 (0.94 - 1.52) | 4.36 (3.67 - 4.77) | 0.22 (0.19 - 0.24) | 1.29 (1.18 - 1.36) | 4.34 (4.14 - 4.52) |
| P. scolopendria | 0.5 (0.36 - 0.59) | 2.95 (2.56 - 3.22) | 9.16 (7.9 - 9.74) | 0.45 (0.42 - 0.47) | 2.74 (2.55 - 2.88) | 8.75 (8.32 - 9.07) |
| S. festivus | 0.44 (0.35 - 0.51) | 1.06 (0.83 - 1.18) | 3.47 (3.04 - 4.04) | 0.42 (0.38 - 0.47) | 1.02 (0.94 - 1.08) | 3.43 (3.27 - 3.57) |
| T. minimus | 0.2 (0.16 - 0.23) | 1.18 (0.93 - 1.33) | 3.97 (3.46 - 4.6) | 0.19 (0.16 - 0.21) | 1.14 (1.06 - 1.22) | 3.92 (3.75 - 4.05) |
Figure A1.
PRISMA (Systematic Reviews and Meta-Analysis) flowchart describing the exclusion and selection procedure used in this meta-analysis, with the different publication registration engines and information processing steps. The process consisted of several steps, including an initial database search, duplicate removal, title and abstract screening, eligibility assessment to know whether the papers met the criteria predefined and final inclusion based on those criteria. The numbers indicate the number of publications (included or excluded) at each stage of the selection process.
Figure A1.
PRISMA (Systematic Reviews and Meta-Analysis) flowchart describing the exclusion and selection procedure used in this meta-analysis, with the different publication registration engines and information processing steps. The process consisted of several steps, including an initial database search, duplicate removal, title and abstract screening, eligibility assessment to know whether the papers met the criteria predefined and final inclusion based on those criteria. The numbers indicate the number of publications (included or excluded) at each stage of the selection process.
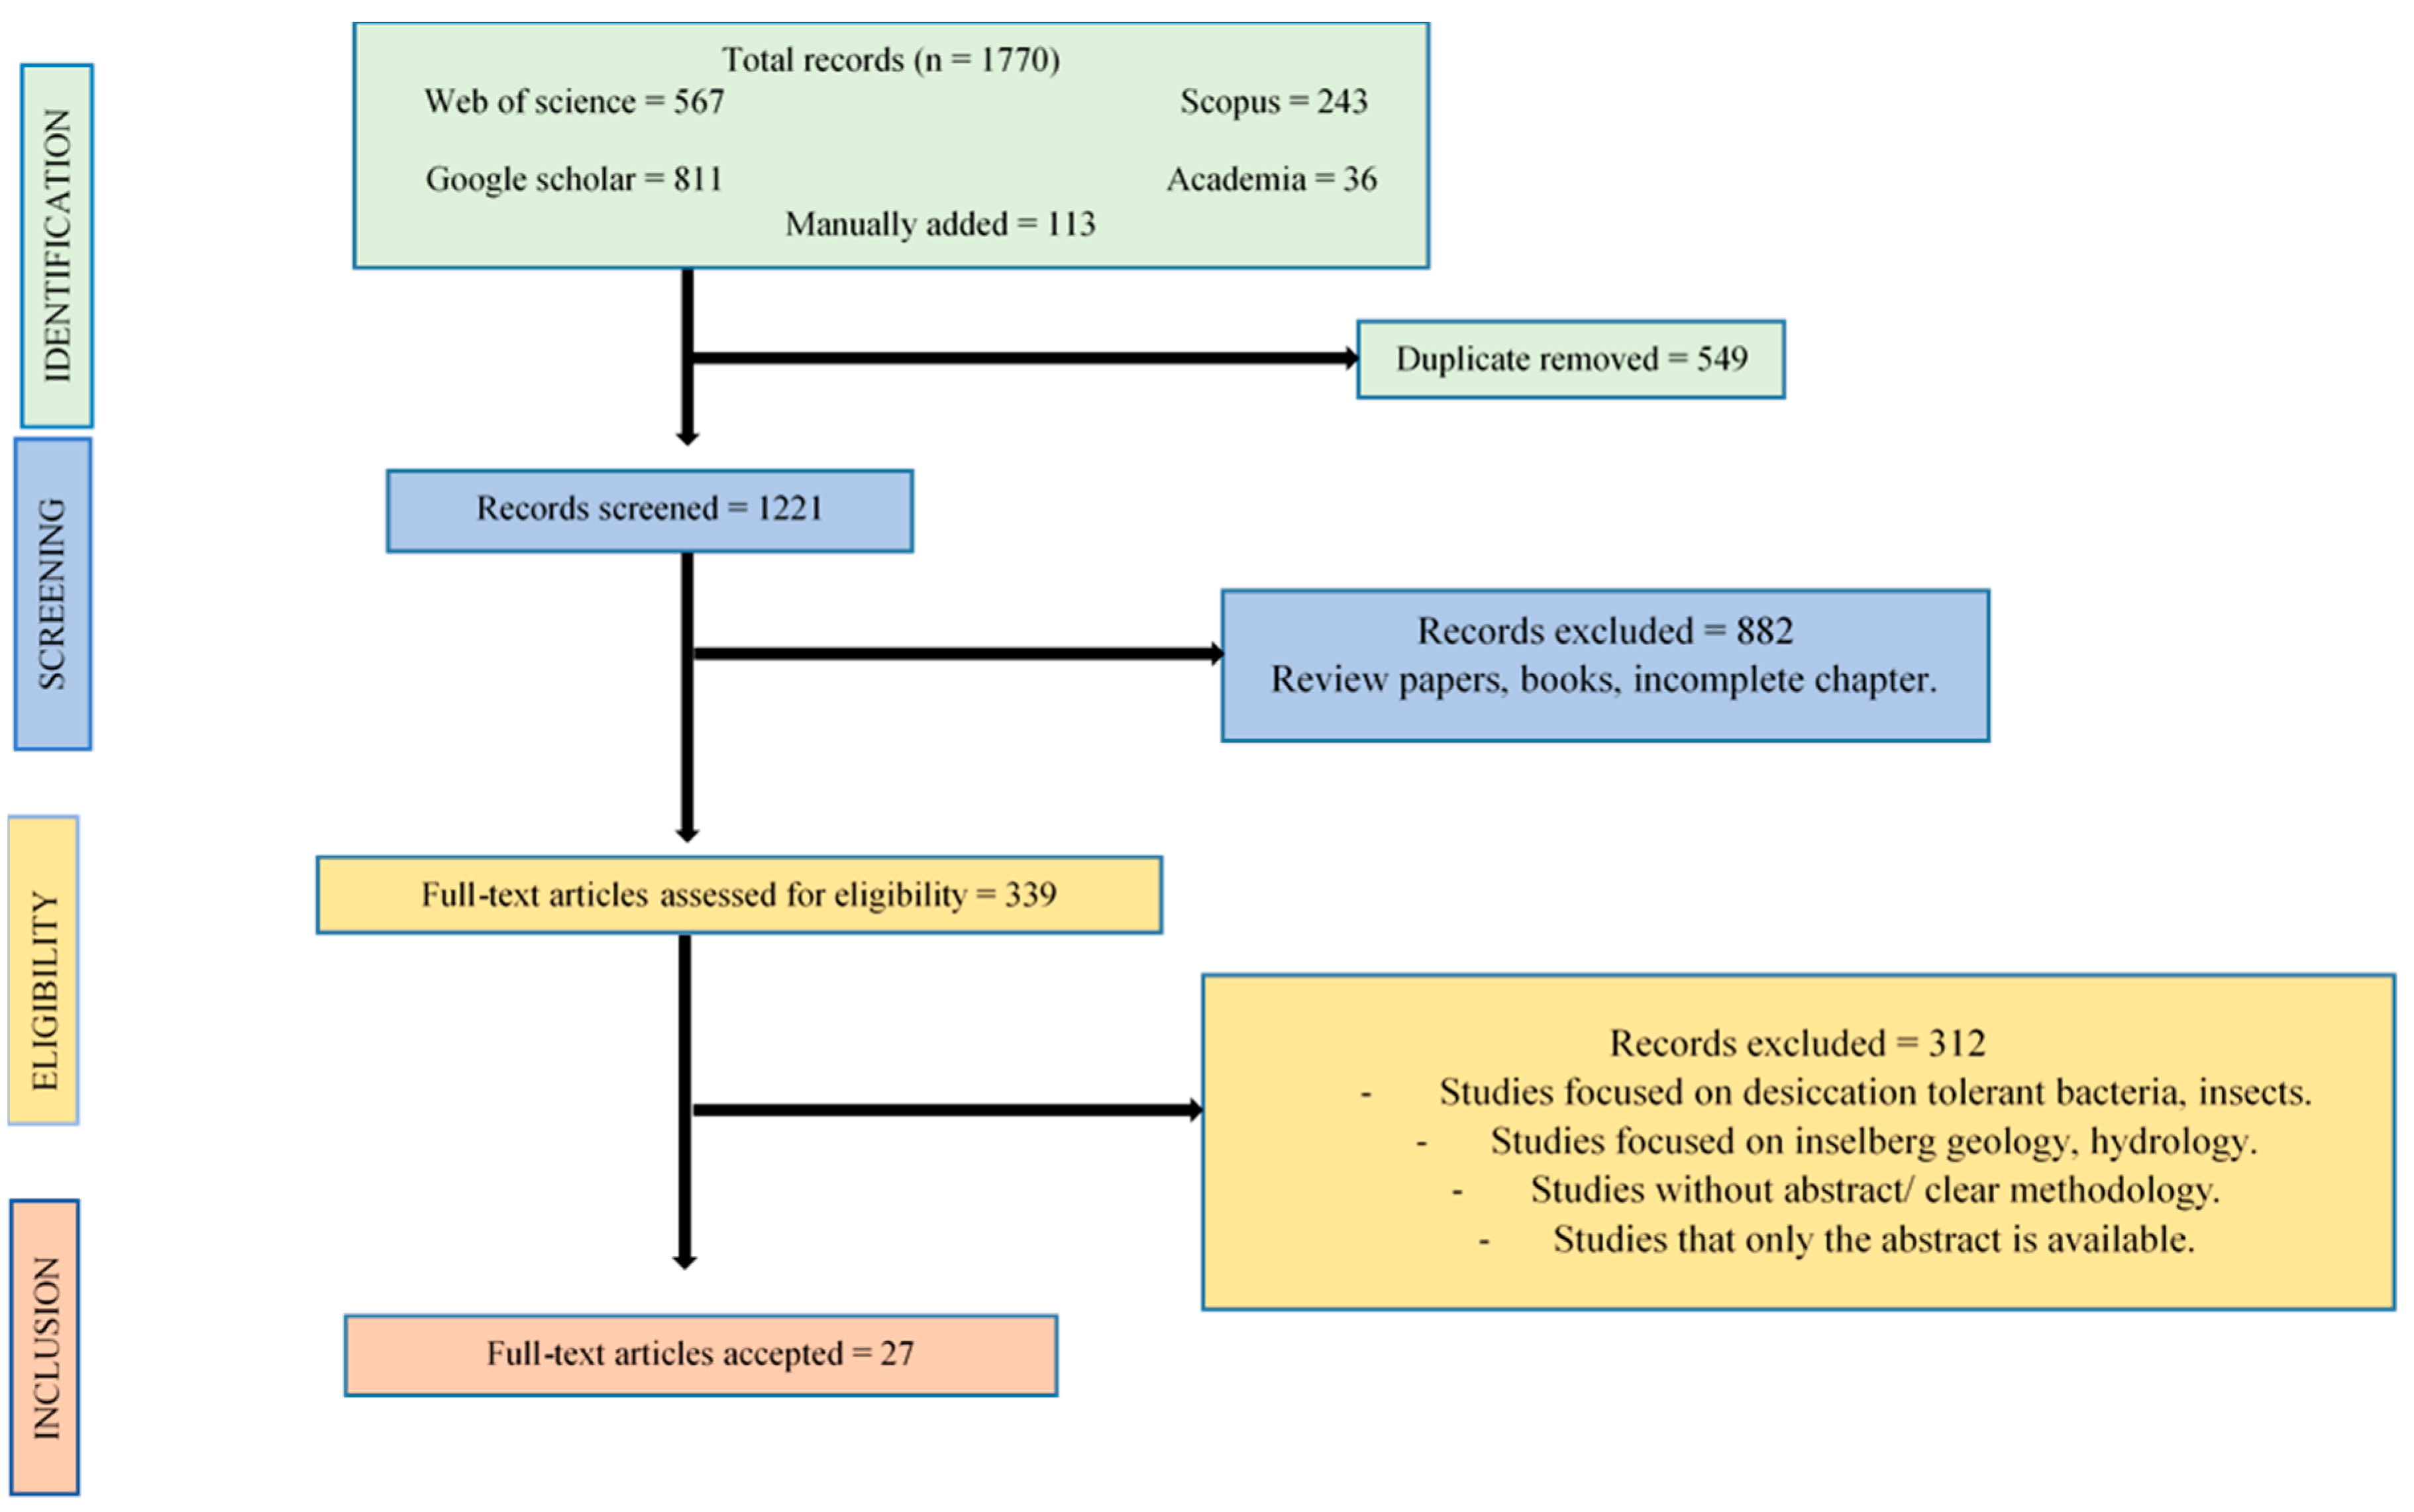
References
- Sinclair, A.R.E. The loss of biodiversity: The sixth great extinction. In Conserving Nature’s Diversity; Ashgate: Vermont, 2000; pp. 9–15.
- Bergès, L.; Roche, P.; Avon, C. Corridors écologiques et conservation de la biodiversité. Sci. Eaux Territ. 2010, 3, 34–39.
- Jaureguiberry, P.; Titeux, N.; Wiemers, M.; Bowler, D.E.; Coscieme, L.; Golden, A.S.; Guerra, C.A.; Jacob, U.; Takahashi, Y.; Settele, J.; et al. The direct drivers of recent global anthropogenic biodiversity loss. Sci. Adv. 2022, 8, eabm9982. [CrossRef]
- Bellard, C.; Marino, C.; Courchamp, F. Ranking threats to biodiversity and why it doesn’t matter. Nat. Commun. 2022, 13, 1–4. [CrossRef]
- Chaplin-Kramer, R.; Sharp, R.P.; Weil, C.; Bennett, E.M.; Pascual, U.; Arkema, K.K.; Brauman, K.A.; Bryant, B.P.; Guerry, A.D.; Haddad, N.M.; et al. Global modeling of nature’s contributions to people. Science 2019, 366, 255–258. [CrossRef]
- Venter, O.; Sanderson, E.W.; Magrach, A.; Allan, J.R.; Beher, J.; Jones, K.R.; Possingham, H.P.; Laurance, W.F.; Wood, P.; Fekete, B.M.; et al. Sixteen years of change in the global terrestrial human footprint and implications for biodiversity conser-vation. Nat. Commun. 2016, 7, 12558. [CrossRef]
- World Meteorological Organization. State of the Climate in Africa 2024; WMO: Geneva, Switzerland, 2025.
- Myers, N.; Mittermeier, R.A.; Mittermeier, C.G.; da Fonseca, G.A.B.; Kent, J. Biodiversity hotspots for conservation priorities. Nature 2000, 403, 853–858. [CrossRef]
- Marks, R.A.; Farrant, J.M.; McLetchie, D.N.; VanBuren, R. Unexplored dimensions of variability in vegetative desiccation tolerance. Am. J. Bot. 2021, 108, 346–358, . [CrossRef]
- Porembski, S.; Barthlott, W. Granitic and gneissic outcrops (inselbergs) as centers of diversity for desiccation-tolerant vascular plants. Plant Ecol. 2000, 151, 19–28. [CrossRef]
- Costa, M.C.D.; Farrant, J.M.; Oliver, M.J.; Ligterink, W.; Buitink, J.; Hilhorst, H.M. Key genes involved in desiccation tolerance and dormancy across life forms. Plant Sci. 2016, 251, 162–168. [CrossRef]
- Hilhorst, H.W.; Farrant, J.M. Plant desiccation tolerance: A survival strategy with exceptional prospects for climate-smart agriculture. Annu. Plant Rev. Online 2018, 327–354.
- Gaff, D.F. Protoplasmic tolerance of extreme water stress. In Encyclopedia of Plant Physiology; Springer: Berlin, 1981.
- Porembski, S.; Silveira, F.A.O.; Fiedler, P.L.; Watve, A.; Rabarimanarivo, M.; Kouame, F.; Hopper, S.D. Worldwide destruction of inselbergs and related rock outcrops threatens a unique ecosystem. Biodivers. Conserv. 2016, 25, 2827–2830. [CrossRef]
- Porembski, S. Tropical inselbergs: habitat types, adaptive strategies and diversity patterns. Braz. J. Bot. 2007, 30, 579–586. [CrossRef]
- Porembski, S. The invasibility of tropical granite outcrops (‘inselbergs’) by exotic weeds. J. R. Soc. West. Aust. 2000, 83, 131.
- Porembski, S.; Barthlott, W.; Dörrstock, S.; Biedinger, N. Vegetation of rock outcrops in Guinea: granite inselbergs, sandstone table mountains and ferricretes — remarks on species numbers and endemism. Flora 1994, 189, 315–326. [CrossRef]
- Dawson, T.P.; Jackson, S.T.; House, J.I.; Prentice, I.C.; Mace, G.M. Beyond Predictions: Biodiversity Conservation in a Changing Climate. Science 2011, 332, 53–58. [CrossRef]
- Oliver, M.J.; Tuba, Z.; Mishler, B.D. The evolution of vegetative desiccation tolerance in land plants. Plant Ecol. 2000, 151, 85–100. [CrossRef]
- Gould, S.J. Dollo on Dollo's law: Irreversibility and the status of evolutionary laws. J. Hist. Biol. 1970, 3, 189–212. [CrossRef]
- Cullen, R. Biodiversity protection prioritisation: a 25-year review. Wildl. Res. 2013, 40, 108–116. [CrossRef]
- IUCN Species Survival Commission (SSC) West Africa Plant Red List Authority. Advancing Plant Conservation in West Africa through Red List Assessments. 2025. Available online: https://www.iucn.org (accessed April 2025).
- IUCN. IUCN Red List Categories and Criteria: Version 3.1, 2nd ed.; IUCN: Gland, Switzerland, 2012.
- Zizka, A.; Andermann, T.; Silvestro, D. IUCNN – Deep learning approaches to approximate species’ extinction risk. Divers. Distrib. 2022, 28, 227–241.
- Bachman, S.P.; Brown, M.J.M.; Leão, T.C.C.; Nic Lughadha, E.; Walker, B.E. Extinction risk predictions for the world's flowering plants to support their conservation. New Phytol. 2024, 242, 797–808. [CrossRef]
- Cazalis, V.; Di Marco, M.; Zizka, A.; Butchart, S.H.; González-Suárez, M.; Böhm, M.; Bachman, S.P.; Hoffmann, M.; Rosati, I.; De Leo, F.; et al. Accelerating and standardising IUCN Red List assessments with sRedList. Biol. Conserv. 2024, 298. [CrossRef]
- Tecco, P.A.; Díaz, S.; Cabido, M.; Urcelay, C. Functional traits of alien plants across contrasting climatic and land-use regimes. J. Ecol. 2010, 98, 17–27.
- Chesson, P. Mechanisms of Maintenance of Species Diversity. Annu. Rev. Ecol. Syst. 2000, 31, 343–366. [CrossRef]
- Davis, M.A.; Chew, M.K.; Hobbs, R.J.; Lugo, A.E.; Ewel, J.J.; Vermeij, G.J.; Brown, J.H.; Rosenzweig, M.L.; Gardener, M.R.; Carroll, S.P.; et al. Don’t judge species on their origins. Nature 2011, 474, 153–154. [CrossRef]
- Moro, M.F.; Souza, V.C.; Oliveira-Filho, A.T.; Queiroz, L.P.; Fraga, C.N.; Rodal, M.J.N.; Araújo, F.S.; Martins, F.R. Alienígenas na sala: O que fazer com espécies exóticas em trabalhos de taxonomia, florística e fitossociologia? Acta Bot. Bras. 2012, 26, 991–999.
- Grime, J.P. Evidence for the Existence of Three Primary Strategies in Plants and Its Relevance to Ecological and Evolutionary Theory. Am. Nat. 1977, 111, 1169–1194. [CrossRef]
- de Paula, L.F.A.; Negreiros, D.; Azevedo, L.O.; Fernandes, R.L.; Stehmann, J.R.; Silveira, F.A.O. Functional ecology as a missing link for conservation of a resource-limited flora in the Atlantic forest. Biodivers. Conserv. 2015, 24, 2239–2253. [CrossRef]
- Kumschick, S.; Gaertner, M.; Vilà, M.; Essl, F.; Jeschke, J.M.; Pyšek, P.; Ricciardi, A.; Bacher, S.; Blackburn, T.M.; Dick, J.T.A.; et al. Ecological Impacts of Alien Species: Quantification, Scope, Caveats, and Recommendations. BioScience 2015, 65, 55–63. [CrossRef]
- Dehling, D.M.; Stouffer, D.B. Bringing the Eltonian niche into functional diversity. Oikos 2018, 127, 1711–1723. [CrossRef]
- Brown, J.H. On the Relationship between Abundance and Distribution of Species. Am. Nat. 1984, 124, 255–279. [CrossRef]
- Johnson, C.N. Species extinction and the relationship between distribution and abundance. Nature 1998, 394, 272–274. [CrossRef]
- Violle, C.; Thuiller, W.; Mouquet, N.; Munoz, F.; Kraft, N.J.; Cadotte, M.W.; Livingstone, S.W.; Mouillot, D. Functional Rarity: The Ecology of Outliers. Trends Ecol. Evol. 2017, 32, 356–367. [CrossRef]
- Zokov, E. First Insights into Alternative Functional Designs of Desiccation-Tolerant Plants’ Desiccation. Master’s Thesis, University of Rostock, Rostock, Germany, 2024.
- Porembski, S.; Barthlott, W. Plant species diversity of West African inselbergs. In The Biodiversity of African Plants; Springer: Dordrecht, 1996; pp. 180–187.
- Smith, R.J.; Veríssimo, D.; Isaac, N.J.; Jones, K.E. Identifying Cinderella species: uncovering mammals with conservation flagship appeal. Conserv. Lett. 2012, 5, 205–212. [CrossRef]
- Simberloff, D. Flagships, umbrellas, and keystones: Is single-species management passé in the landscape era? Biol. Conserv. 1998, 83, 247–257.
- Moynes, E.; Bhathe, V.P.; Brennan, C.; Ellis, S.; Bennett, J.R.; Landsman, S.J. Flagship Species: Do They Help or Hurt Conservation?. Front. Young- Minds 2021, 9. [CrossRef]
- Williams, P.H.; Burgess, N.D.; Rahbek, C. Flagship species, ecological complementarity and conserving the diversity of mammals and birds in sub-Saharan Africa. Anim. Conserv. 2000, 3, 249–260. [CrossRef]
- Mazel, F.; Pennell, M.W.; Cadotte, M.W.; Diaz, S.; Riva, G.V.D.; Grenyer, R.; Leprieur, F.; Mooers, A.O.; Mouillot, D.; Tucker, C.M.; et al. Prioritizing phylogenetic diversity captures functional diversity unreliably. Nat. Commun. 2018, 9, 1–9. [CrossRef]
- Balding, M.; Williams, K.J. Plant blindness and the implications for plant conservation. Conserv. Biol. 2016, 30, 1192–1199. [CrossRef]
- Caro, T.M.; O'DOherty, G. On the Use of Surrogate Species in Conservation Biology. Conserv. Biol. 1999, 13, 805–814. [CrossRef]
- Lambeck, R.J. Focal Species: A Multi-Species Umbrella for Nature Conservation. Conserv. Biol. 1997, 11, 849–856. [CrossRef]
- Murphy, D.D.; Weiland, P.S. The use of surrogates in implementation of the federal Endangered Species Act—proposed fixes to a proposed rule. J. Environ. Stud. Sci. 2014, 4, 156–162. [CrossRef]
- Lawton, J.H. Range, population abundance and conservation. Trends Ecol. Evol. 1993, 8, 409–413.
- Flather, C.H.; Sieg, C.H. Species rarity: Definition, causes and classification. In Conservation of Rare or Little-Known Species; Island Press: Washington, DC, 2007; pp. 40–66.
- CBD. COP 10 Decisions: Strategic Plan for Biodiversity 2011–2020. 2025. Available online: https://www.cbd.int/decision/cop?id=12268 (accessed April 2025).
- UNEP-WCMC; IUCN. Protected Planet Report 2024; UNEP-WCMC: Cambridge, UK, 2024.
- Daru, B.H. Predicting undetected native vascular plant diversity at a global scale. Proc. Natl. Acad. Sci. 2024, 121. [CrossRef]
- Torres, A.; zu Ermgassen, S.O.; Ferri-Yanez, F.; Navarro, L.M.; Rosa, I.M.; Teixeira, F.Z.; Liu, J. Unearthing the global impact of mining construction minerals on biodiversity. bioRxiv 2022, 2022.03.
- Timpte, M.; Marquard, E.; Paulsch, C. Analysis of the Strategic Plan 2011–2020 of the Convention on Biological Diversity (CBD). IBN: Regensburg, Germany, 2018.
- McIntyre, N.E.; Wiens, J.A. Interactions between Habitat Abundance and Configuration: Experimental Validation of Some Predictions from Percolation Theory. Oikos 1999, 86, 129. [CrossRef]
- Desmet, P.G. Using landscape fragmentation thresholds to determine ecological process targets in systematic conservation plans. Biol. Conserv. 2018, 221, 257–260. [CrossRef]
- Keitt, T.; Urban, D.L.; Milne, B.T. Detecting Critical Scales in Fragmented Landscapes. Conserv. Ecol. 1997, 1. [CrossRef]
- Dickinson, M.G.; Orme, C.D.L.; Suttle, K.B.; Mace, G.M. Separating sensitivity from exposure in assessing extinction risk from climate change. Sci. Rep. 2014, 4, 6898. [CrossRef]
- Carriquí, M.; Fortesa, J.; Brodribb, T.J. A loss of stomata exposes a critical vulnerability to variable atmospheric humidity in ferns. Curr. Biol. 2025. [CrossRef]
- Fage, J.D.; McCaskie, T. Western Africa. In Encyclopedia Britannica; 2025. Available online: https://www.britannica.com/place/western-Africa (accessed 10 April 2025).
- Sinsin, B.; Kampmann, D.; Thiombiano, A.; Konaté, S. Atlas de la Biodiversité de l’Afrique de l’Ouest. Tome I: Benin; Cotonou & Frankfurt/Main, 2010.
- Mallon, D.P.; Hoffmann, M.; Grainger, M.J.; Hibert, F.; van Vliet, N.; McGowan, P.J.K. An IUCN situation analysis of terrestrial and freshwater fauna in West and Central Africa. IUCN Occas. Pap. 2015, 54.
- Page, M.J.; McKenzie, J.E.; Bossuyt, P.M.; Boutron, I.; Hoffmann, T.C.; Mulrow, C.D.; et al. he PRISMA 2020 statement : an updated guideline for reporting systematic reviews. BMJ 2021, 372, 71. [CrossRef]
- Hutchinson, J.; Dalziel, J.M. Flora of West Tropical Africa; Crown Agents: London, UK, 1958; Volume 1.
- Adjanohoun, E. Végétation des savanes et des rochers découverts en Côte d’Ivoire Centrale. Mém. ORSTOM 1964, 7, 1–178.
- POWO. Plants of the World Online. 2025. Available online: https://powo.science.kew.org/ (accessed 12 April 2025).
- IUCN. The International Union for Conservation of Nature’s Red List of Threatened Species (IUCN) Red List of Threatened Species, version 2022. https://www.iucnredlist.org/. (accessed on 6 November 2022).
- Gorelick, N.; Hancher, M.; Dixon, M.; Ilyushchenko, S.; Thau, D.; Moore, R. Google Earth Engine: Planetary-scale geospatial analysis for everyone. Remote Sens. Environ. 2017, 202, 18–27. [CrossRef]
- Rinnan, D.S.; Lawler, J. Climate-niche factor analysis: a spatial approach to quantifying species vulnerability to climate change. Ecography 2019, 42, 1494–1503. [CrossRef]
- Global Biodiversity Information Facility. Available online: https://www.gbif.org/ (accessed on 28 March 2019).
- Phillips, N.; Lawrence, T.B.; Hardy, C. Discourse and institutions. Acad. Manag. Rev. 2004, 29, 635–652.
- Karger, D.N.; Lange, S.; Hari, C.; Reyer, C.P.O.; Conrad, O.; Zimmermann, N.E.; Frieler, K. CHELSA-W5E5: daily 1 km meteorological forcing data for climate impact studies. Earth Syst. Sci. Data 2023, 15, 2445–2464. [CrossRef]
- Wisz, M.S.; Hijmans, R.J.; Li, J.; Peterson, A.T.; Graham, C.H.; Guisan, A.; NCEAS Predicting Species Distributions Working Group. Effects of sample size on the performance of species distribution models. Divers. Distrib. 2008, 14, 763–773. [CrossRef]
- Barbet-Massin, M.; Jiguet, F.; Albert, C.H.; Thuiller, W. Selecting pseudo-absences for species distribution models: How, where and how many? Methods Ecol. Evol. 2012, 3, 327–338.
- Jin, Y.; Qian, H. V.PhyloMaker: an R package that can generate very large phylogenies for vascular plants. Ecography 2019, 42, 1353–1359. [CrossRef]
- R Core Team. R: A Language and Environment for Statistical Computing; R Foundation: Vienna, Austria, 2025.
Figure 1.
Species richness patterns of desiccation-tolerant vascular plants in West Africa and conservation status of species according to IUCN Red List categories, both from a country perspective.
Figure 1.
Species richness patterns of desiccation-tolerant vascular plants in West Africa and conservation status of species according to IUCN Red List categories, both from a country perspective.
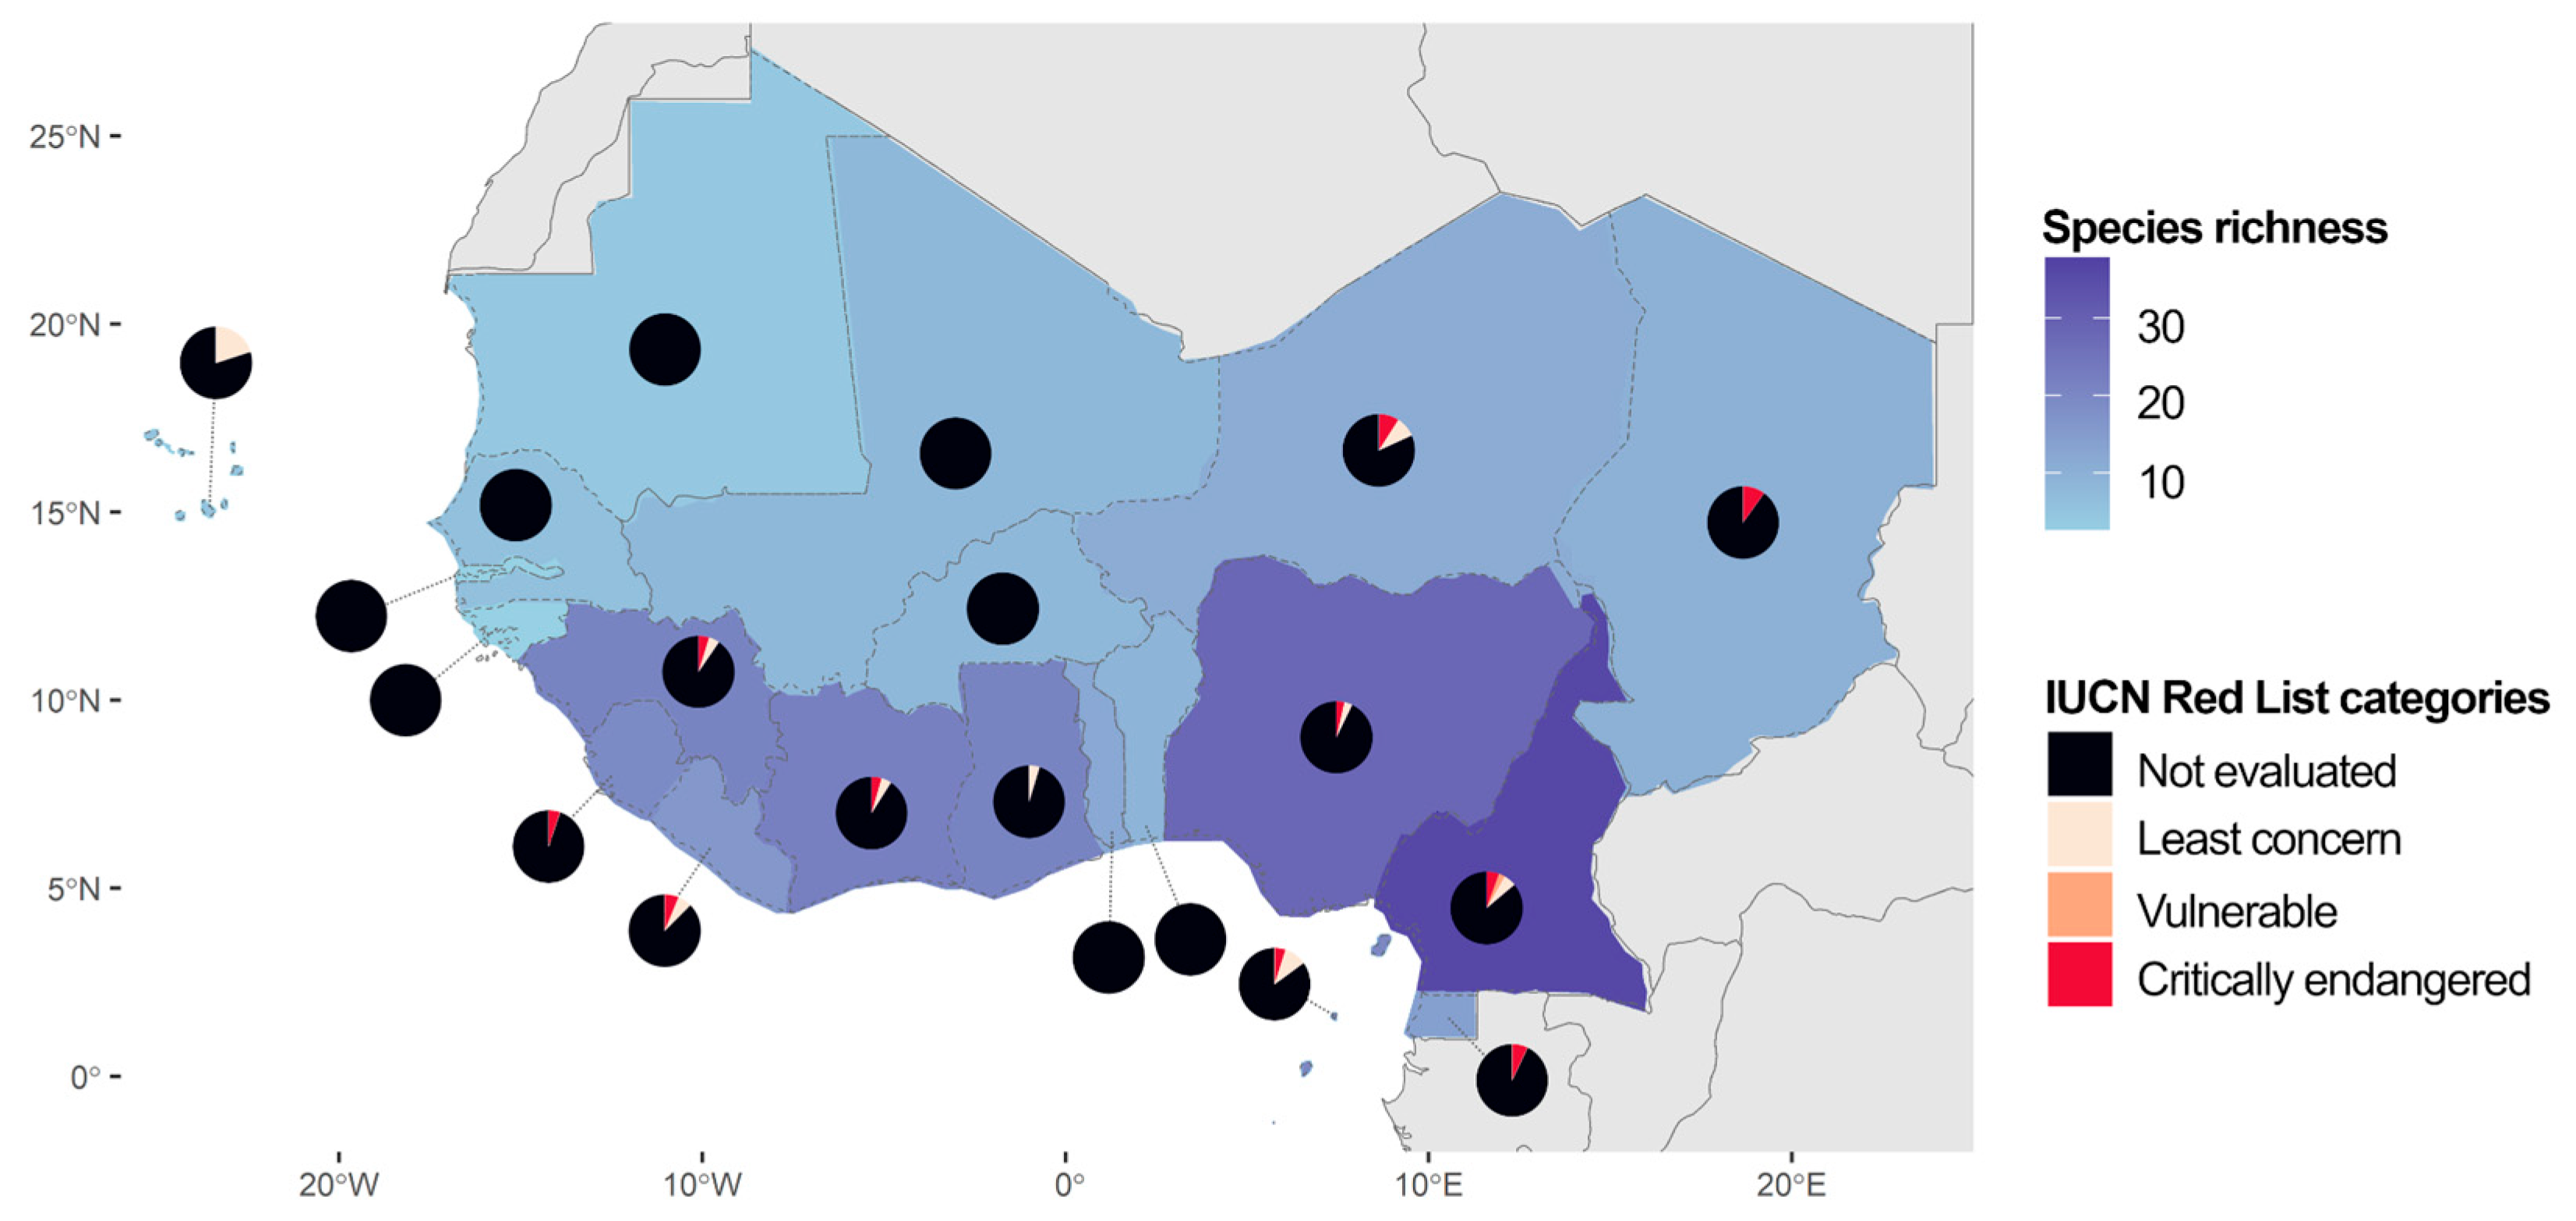
Figure 2.
Number of studies addressing conservation aspects related to desiccation-tolerant plants in West Africa see above. Each bar represents the compilation of the categories and number of studies that met each of the 3 questions serving as evaluation criteria.
Figure 2.
Number of studies addressing conservation aspects related to desiccation-tolerant plants in West Africa see above. Each bar represents the compilation of the categories and number of studies that met each of the 3 questions serving as evaluation criteria.
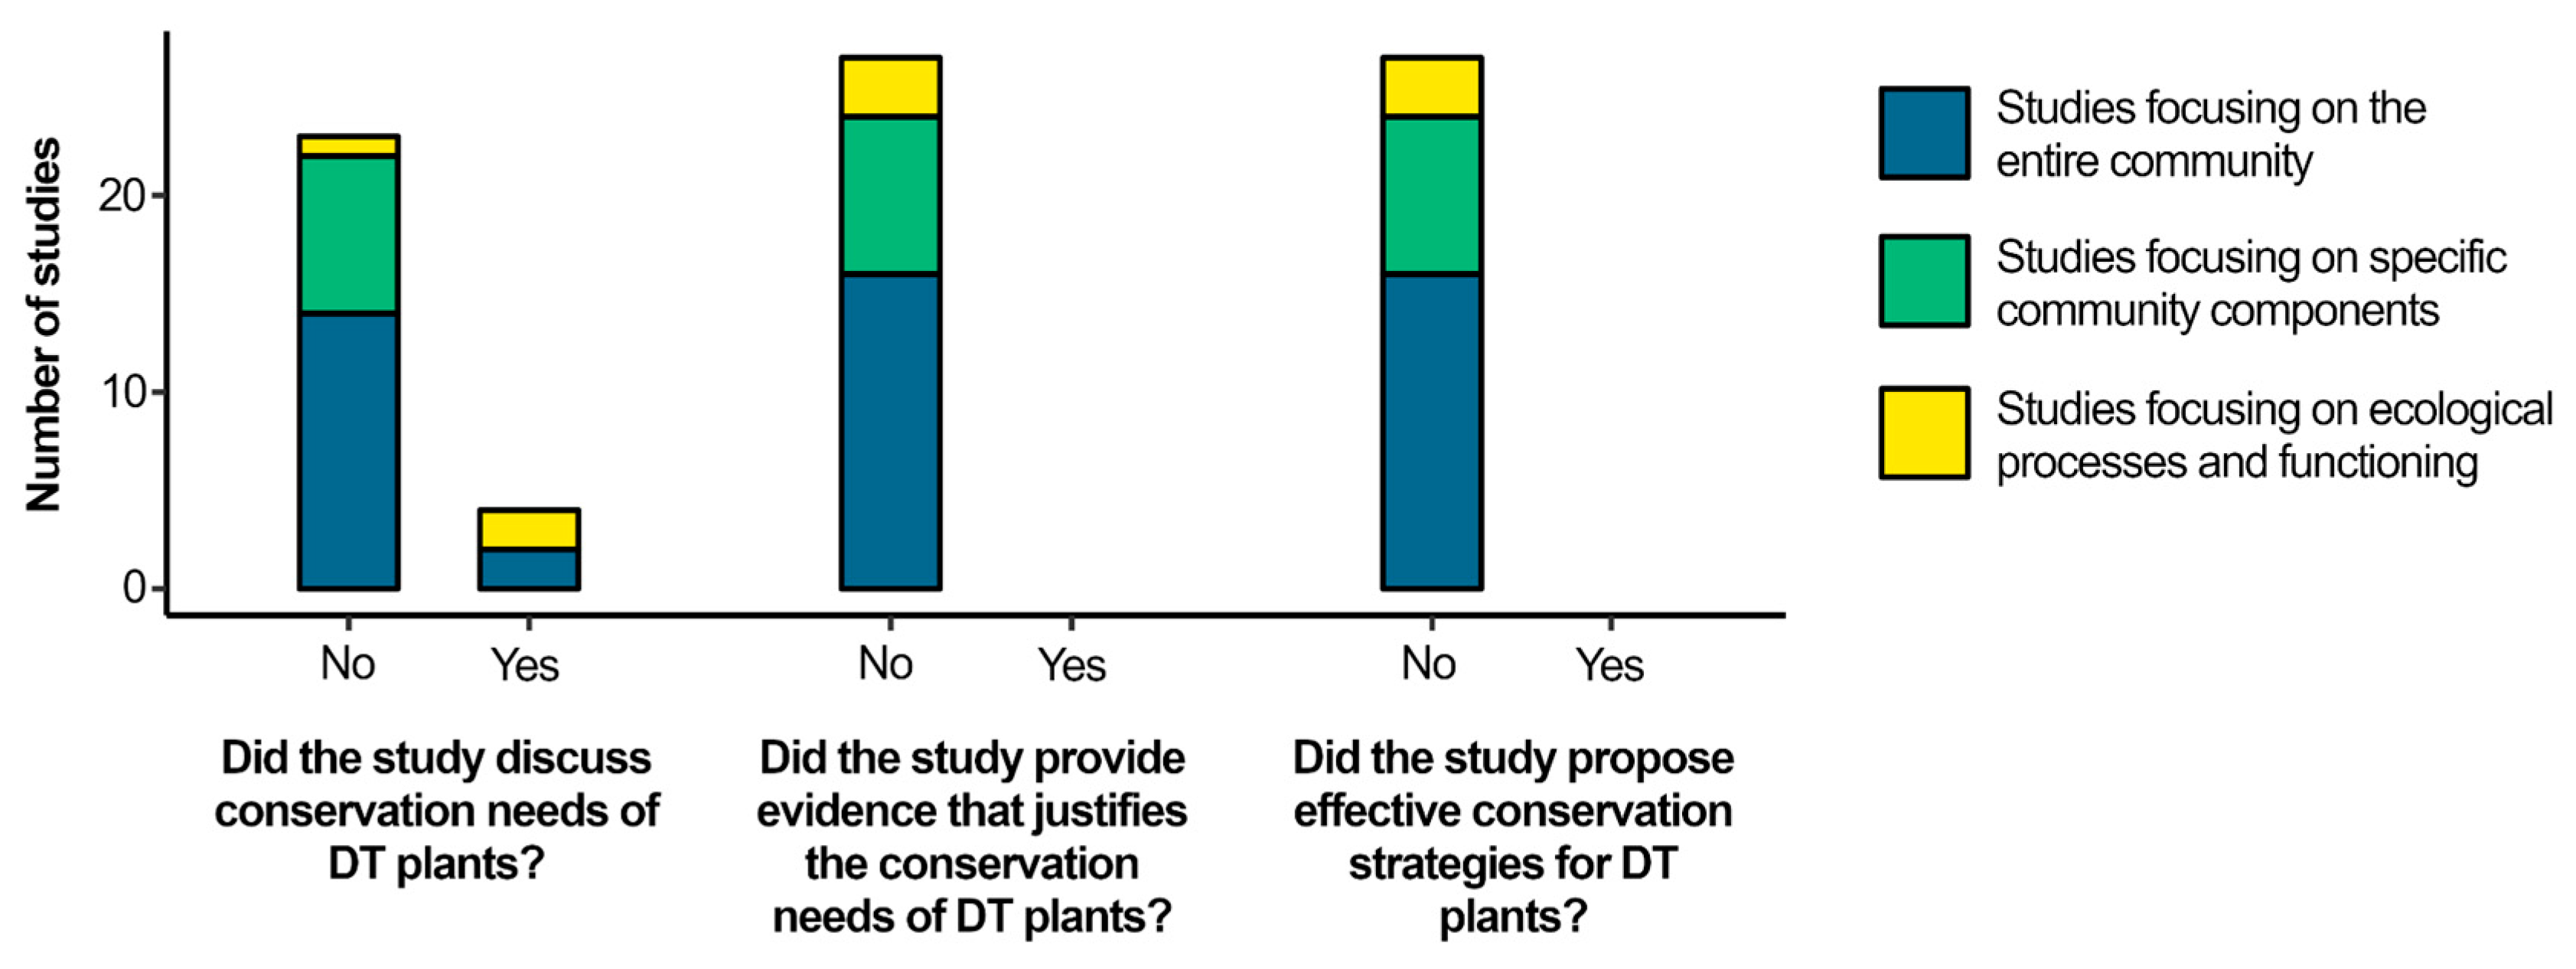
Figure 3.
The geographical distribution of 10 desiccation-tolerant vascular species across 123 inselbergs in West Africa.
Figure 3.
The geographical distribution of 10 desiccation-tolerant vascular species across 123 inselbergs in West Africa.
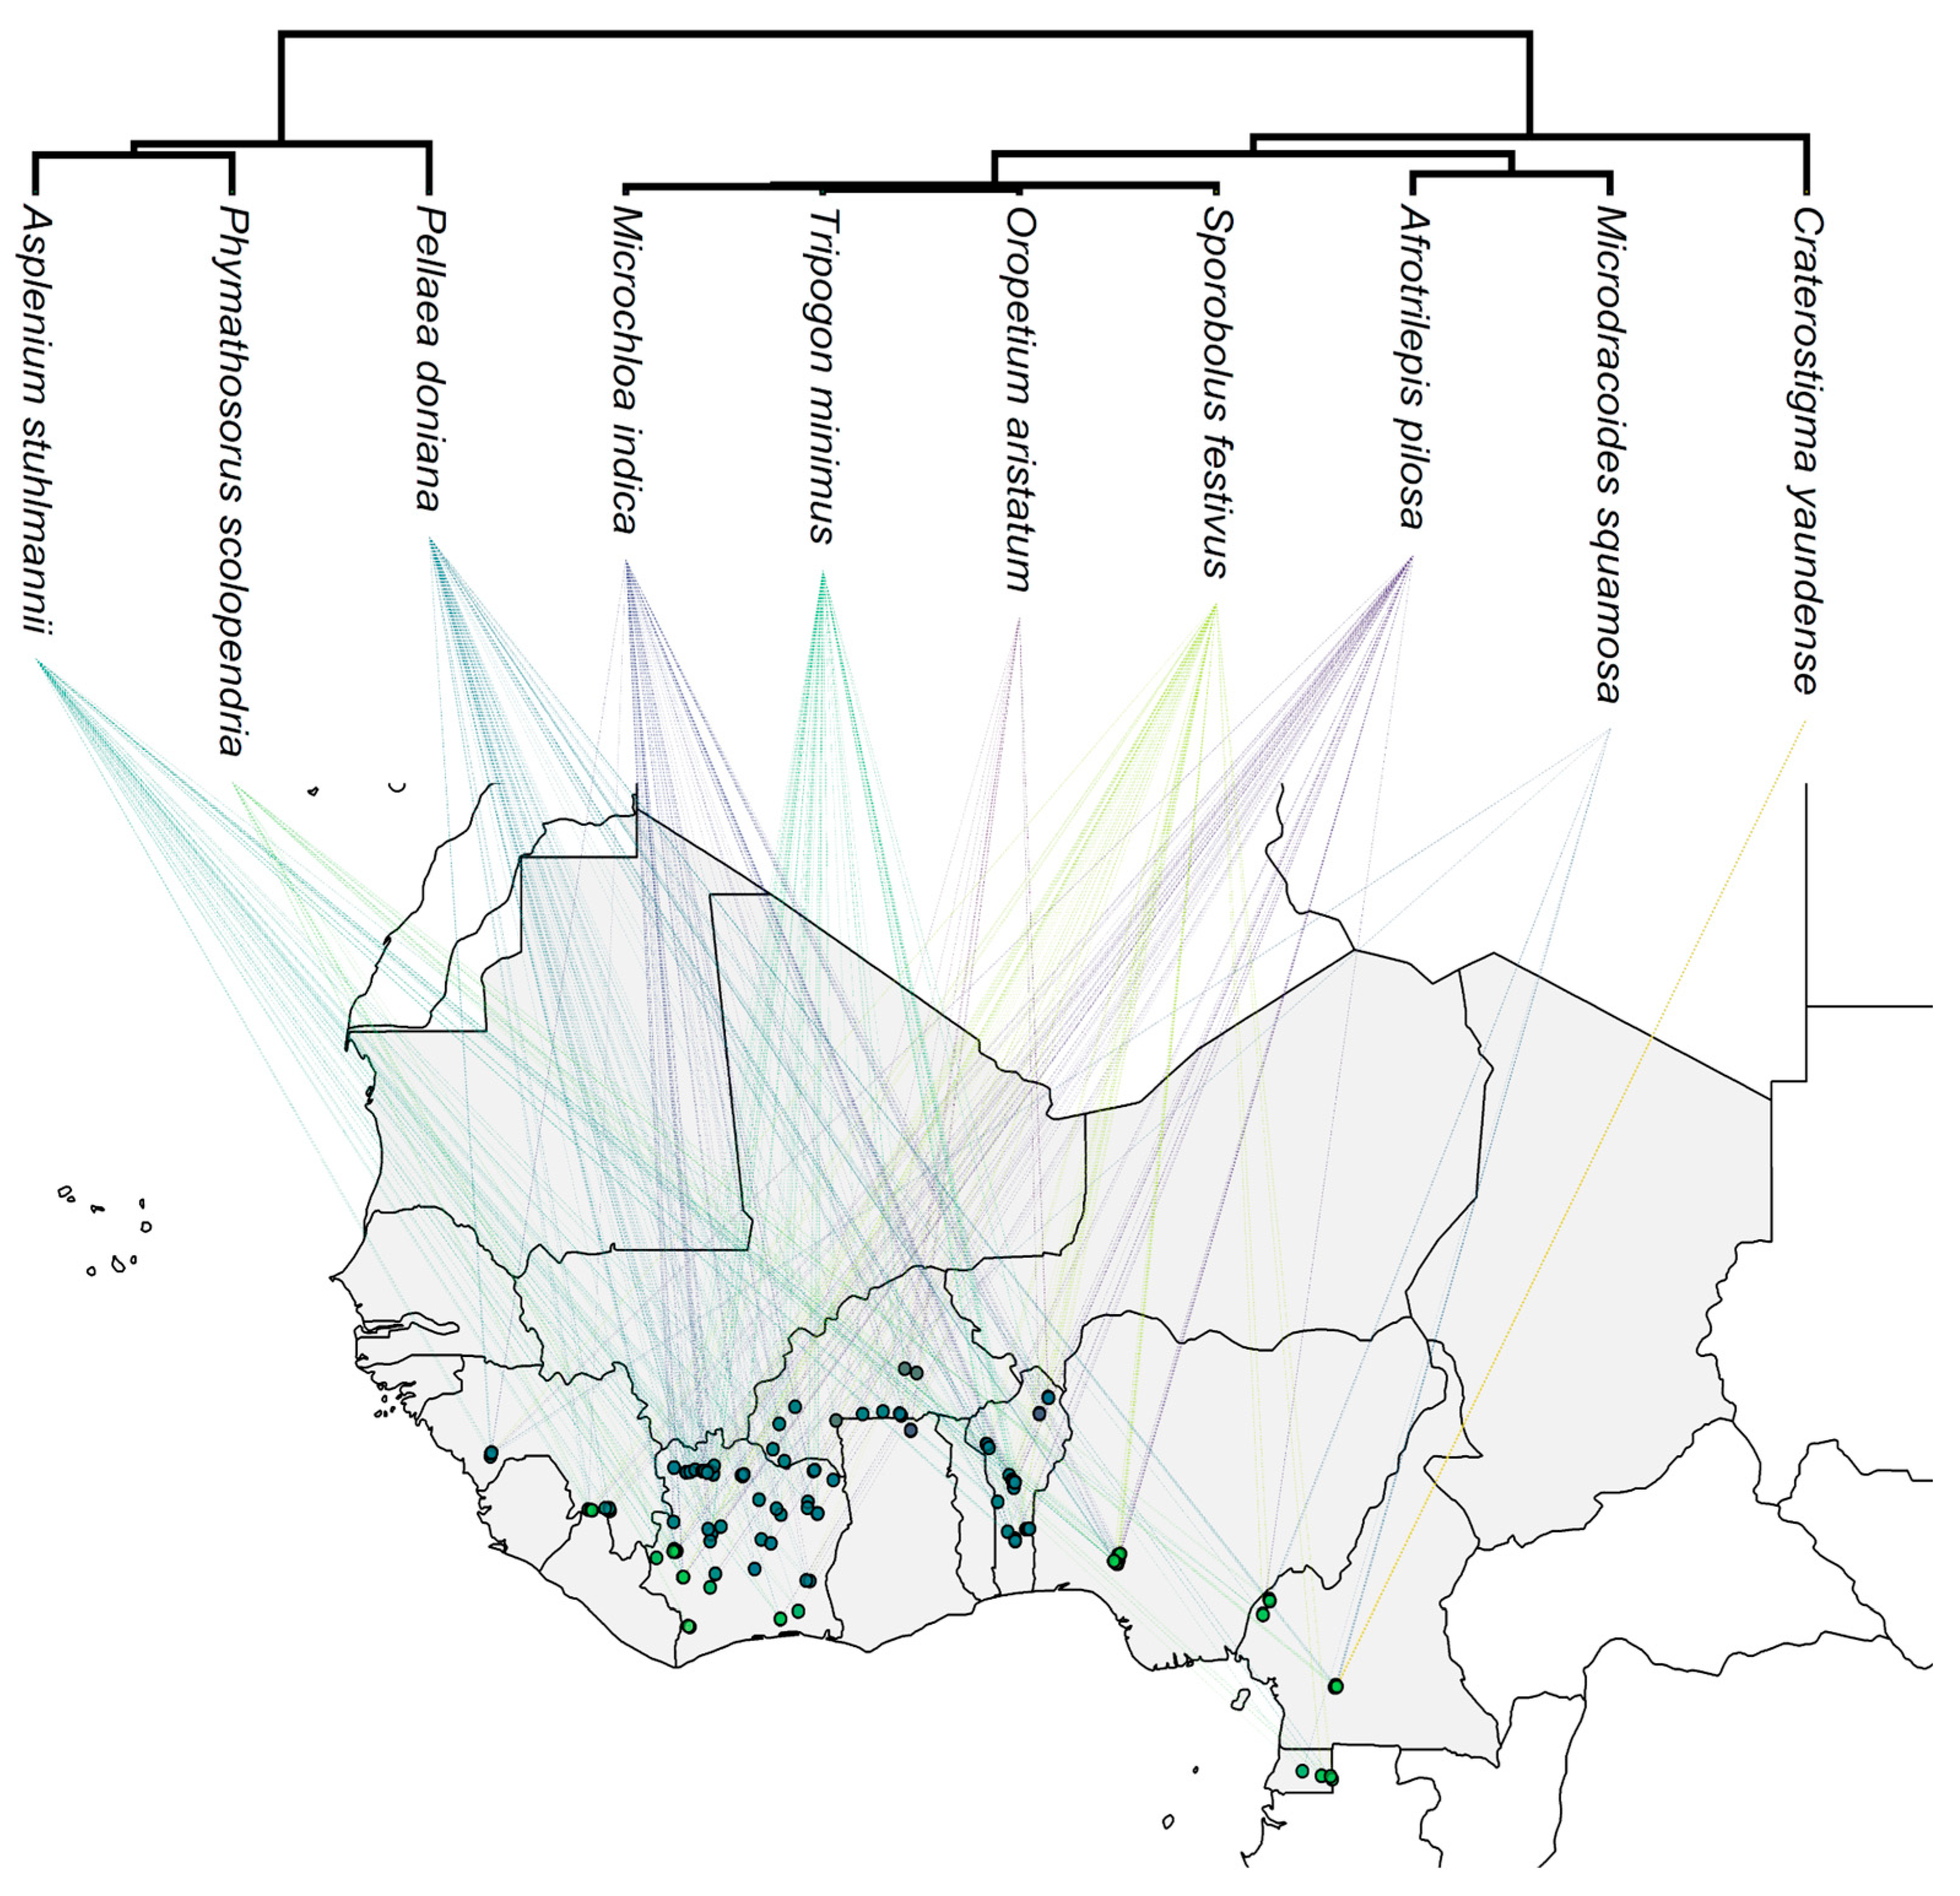
Figure 4.
Impact of quarrying on the habitats of the 10 evaluated plant species. This figure illustrates the extent of exposure to quarrying for each species, highlighting variability in susceptibility. The results show that species experience this threat at different levels, emphasizing the uneven impact of habitat destruction across taxa. Red indicates areas affected by quarrying, while brown represents areas without quarrying. For each species, the first bar (indicated with a cross on the top) represents occurrences in unprotected areas exposed to quarrying, while the second bar (indicated with 'leaves on the top') shows how many of these occurrences fall within protected areas.
Figure 4.
Impact of quarrying on the habitats of the 10 evaluated plant species. This figure illustrates the extent of exposure to quarrying for each species, highlighting variability in susceptibility. The results show that species experience this threat at different levels, emphasizing the uneven impact of habitat destruction across taxa. Red indicates areas affected by quarrying, while brown represents areas without quarrying. For each species, the first bar (indicated with a cross on the top) represents occurrences in unprotected areas exposed to quarrying, while the second bar (indicated with 'leaves on the top') shows how many of these occurrences fall within protected areas.
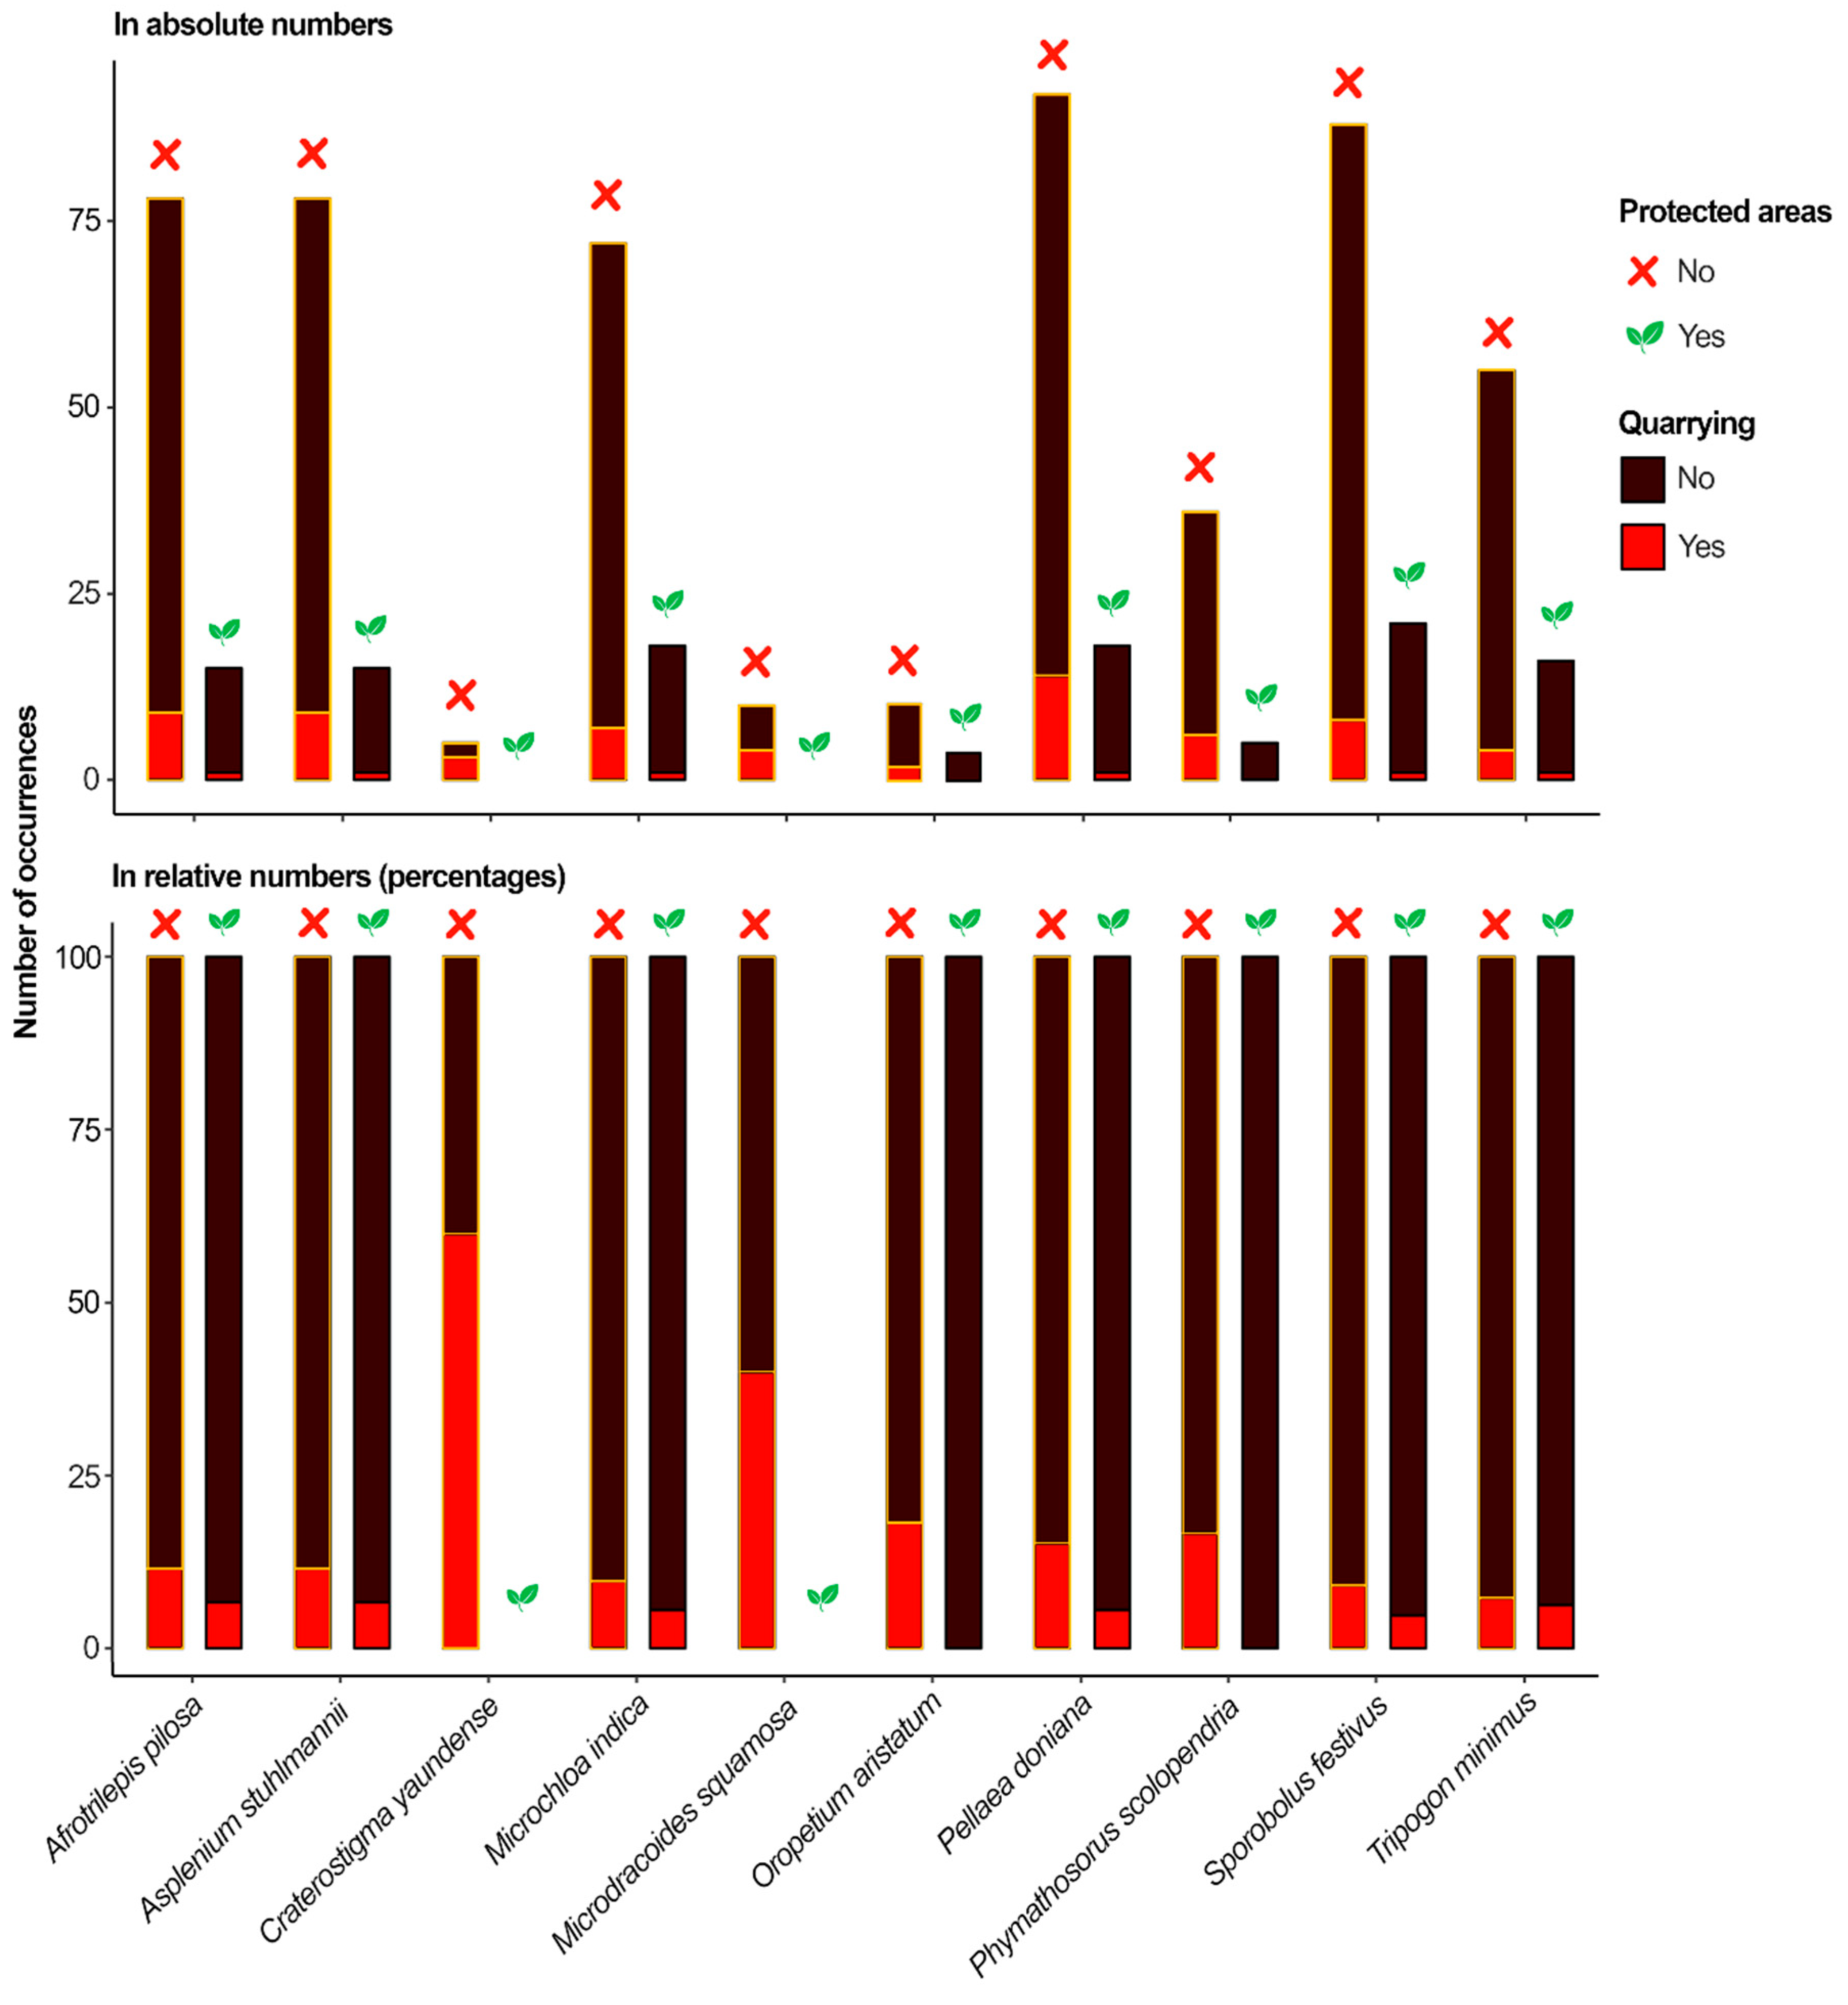
Figure 5.
Projected climate change exposure of 10 Desiccation-Tolerant plants in West Africa under Low (SSP1) and High (SSP5) Emission Scenarios (2011-2100). This figure illustrates the projected mean exposure of 10 desiccation-tolerant plant species to climate change under two different climate scenarios: SSP1, representing a low-emission, sustainable pathway, and SSP5, a high-emission, fossil-fuel-intensive pathway. The projections are shown across time series: 2011-2040, 2041-2070, and 2071-2100.
Figure 5.
Projected climate change exposure of 10 Desiccation-Tolerant plants in West Africa under Low (SSP1) and High (SSP5) Emission Scenarios (2011-2100). This figure illustrates the projected mean exposure of 10 desiccation-tolerant plant species to climate change under two different climate scenarios: SSP1, representing a low-emission, sustainable pathway, and SSP5, a high-emission, fossil-fuel-intensive pathway. The projections are shown across time series: 2011-2040, 2041-2070, and 2071-2100.
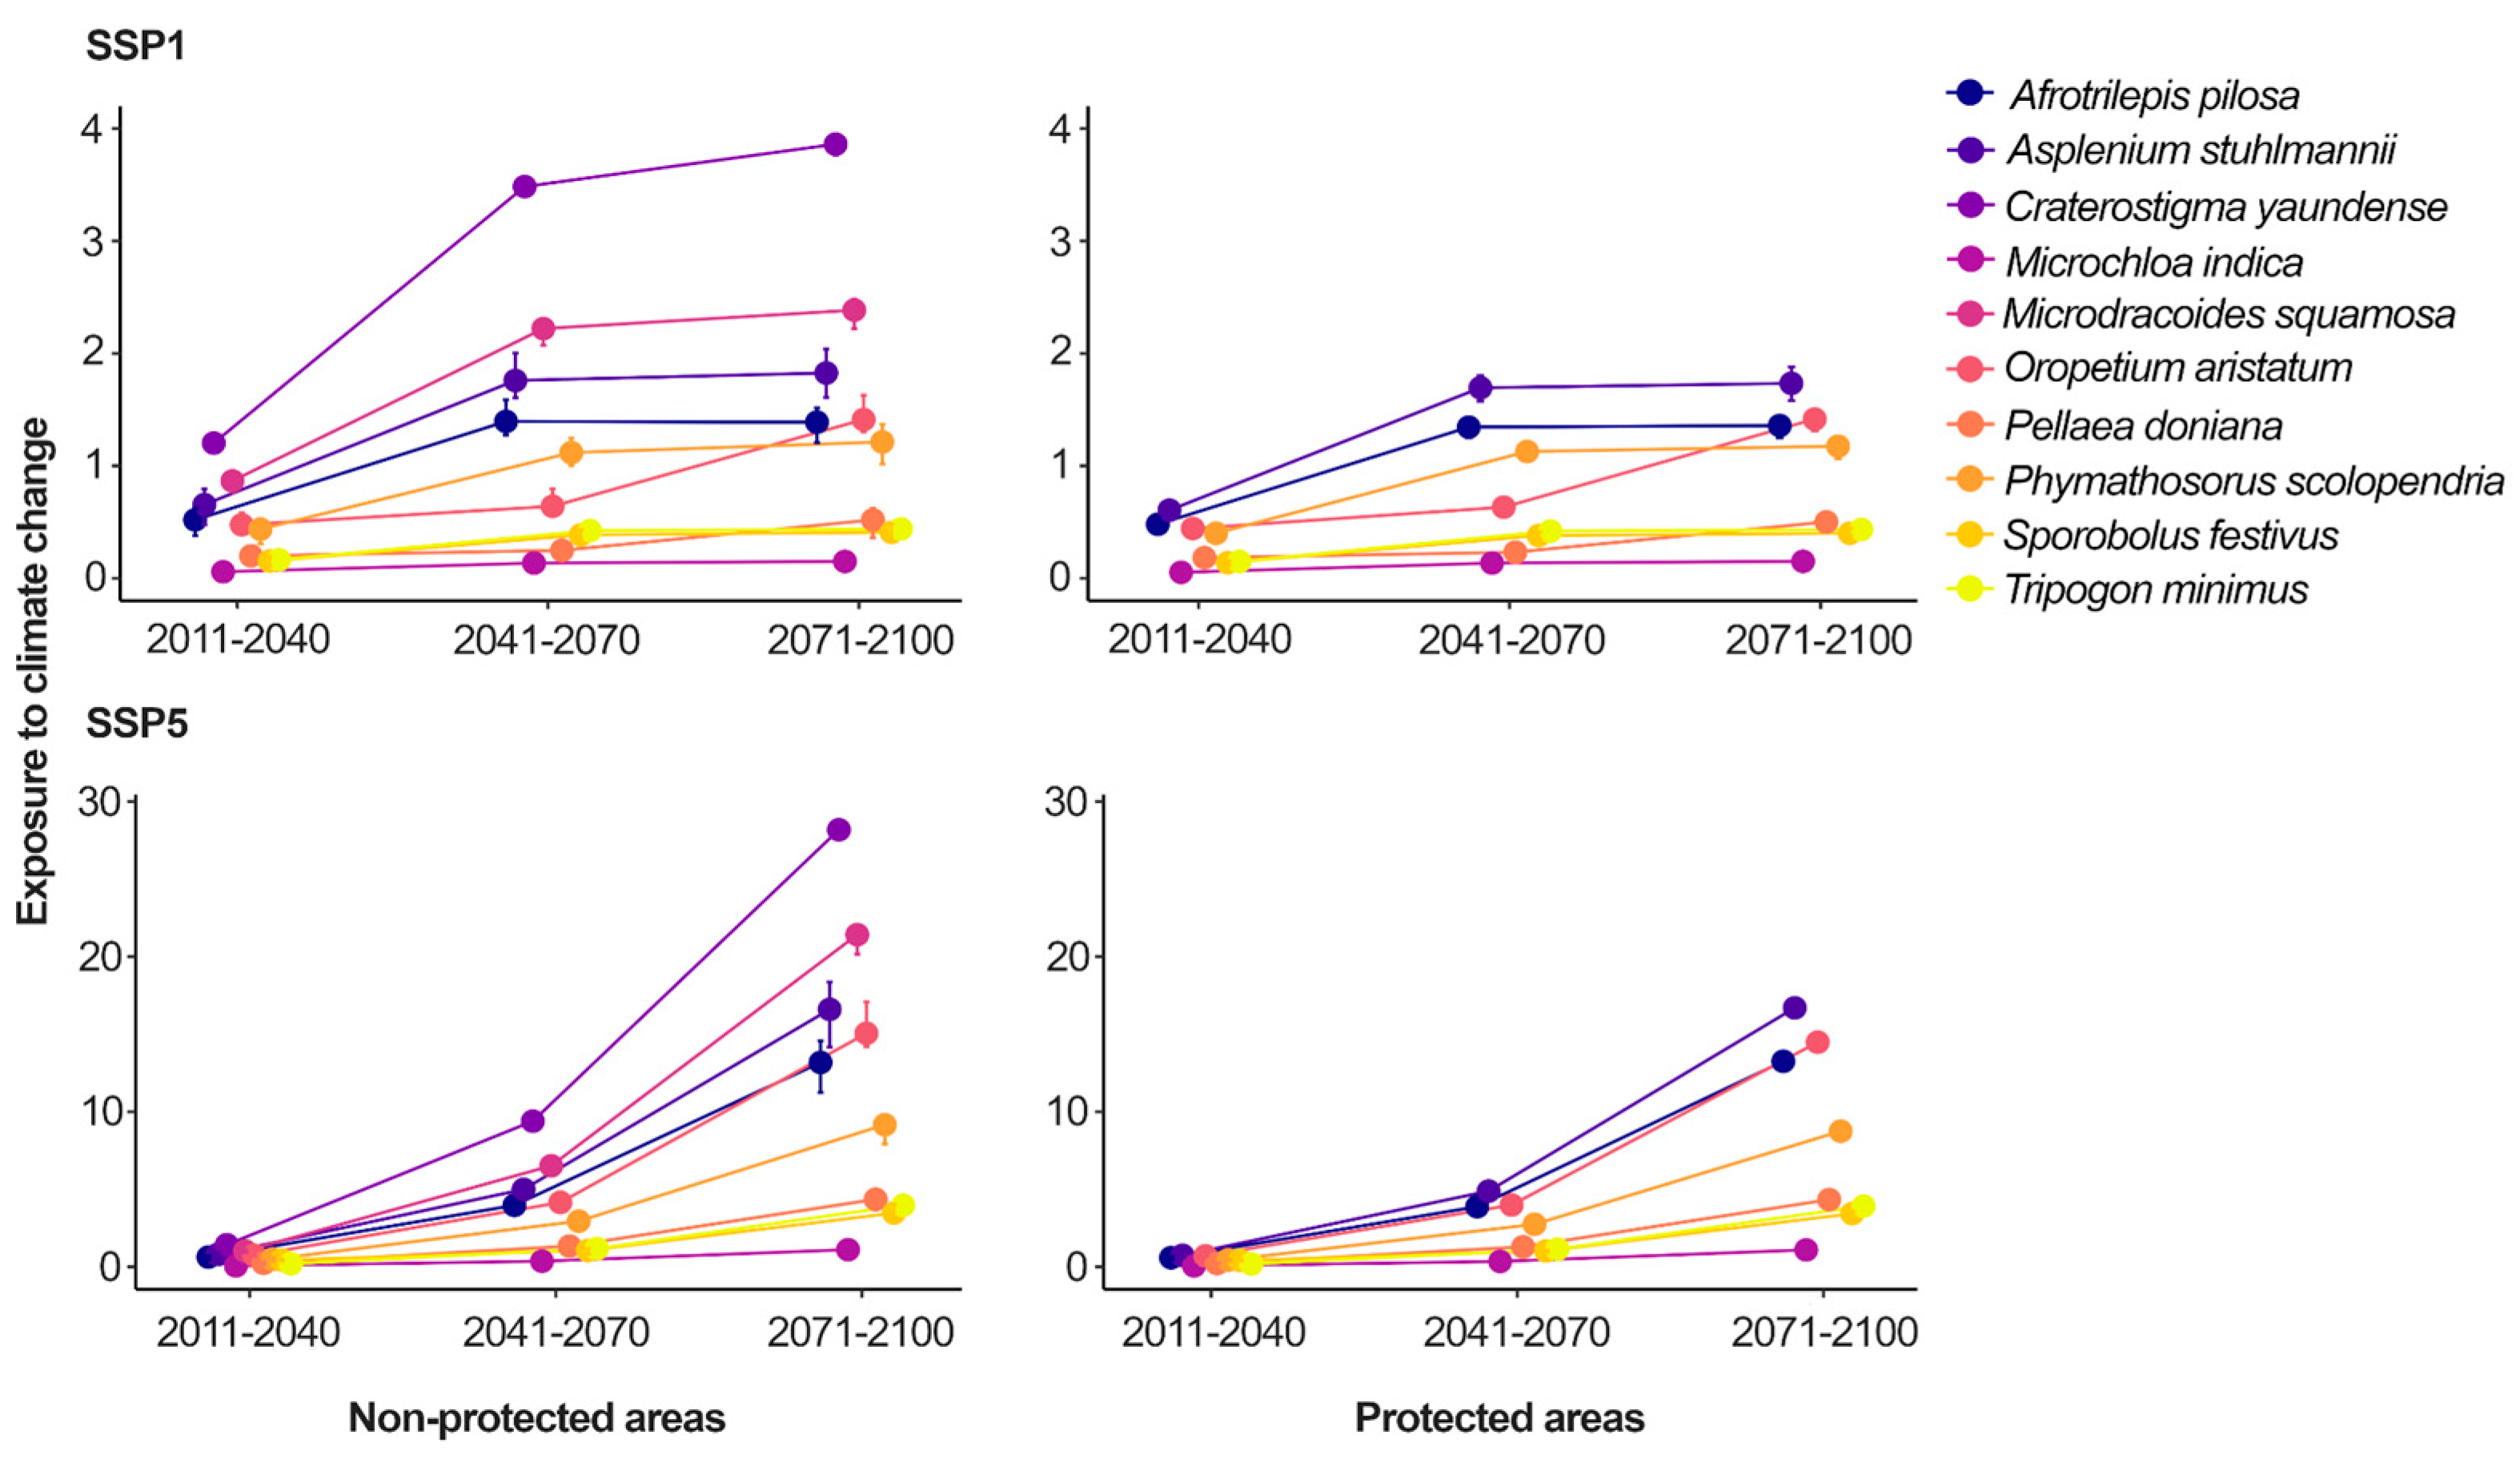
Figure 6.
Species with that most require conservation attention and anthropogenic threats to their diversity. are the ones least favored by current protection areas A – Microdracoides squamosa (Cyperaceae); B – Craterostigma yaundense (Linderniaceae); C – Quarrying activities causing the removal of desiccation-tolerant vascular plants; D – Possible effects of climate change on the desiccation tolerance ability of desiccation-desiccation vascular plants. Red arrows point out to branches of M. squamosa that did not tolerate desiccation and rehydration cycles.
Figure 6.
Species with that most require conservation attention and anthropogenic threats to their diversity. are the ones least favored by current protection areas A – Microdracoides squamosa (Cyperaceae); B – Craterostigma yaundense (Linderniaceae); C – Quarrying activities causing the removal of desiccation-tolerant vascular plants; D – Possible effects of climate change on the desiccation tolerance ability of desiccation-desiccation vascular plants. Red arrows point out to branches of M. squamosa that did not tolerate desiccation and rehydration cycles.
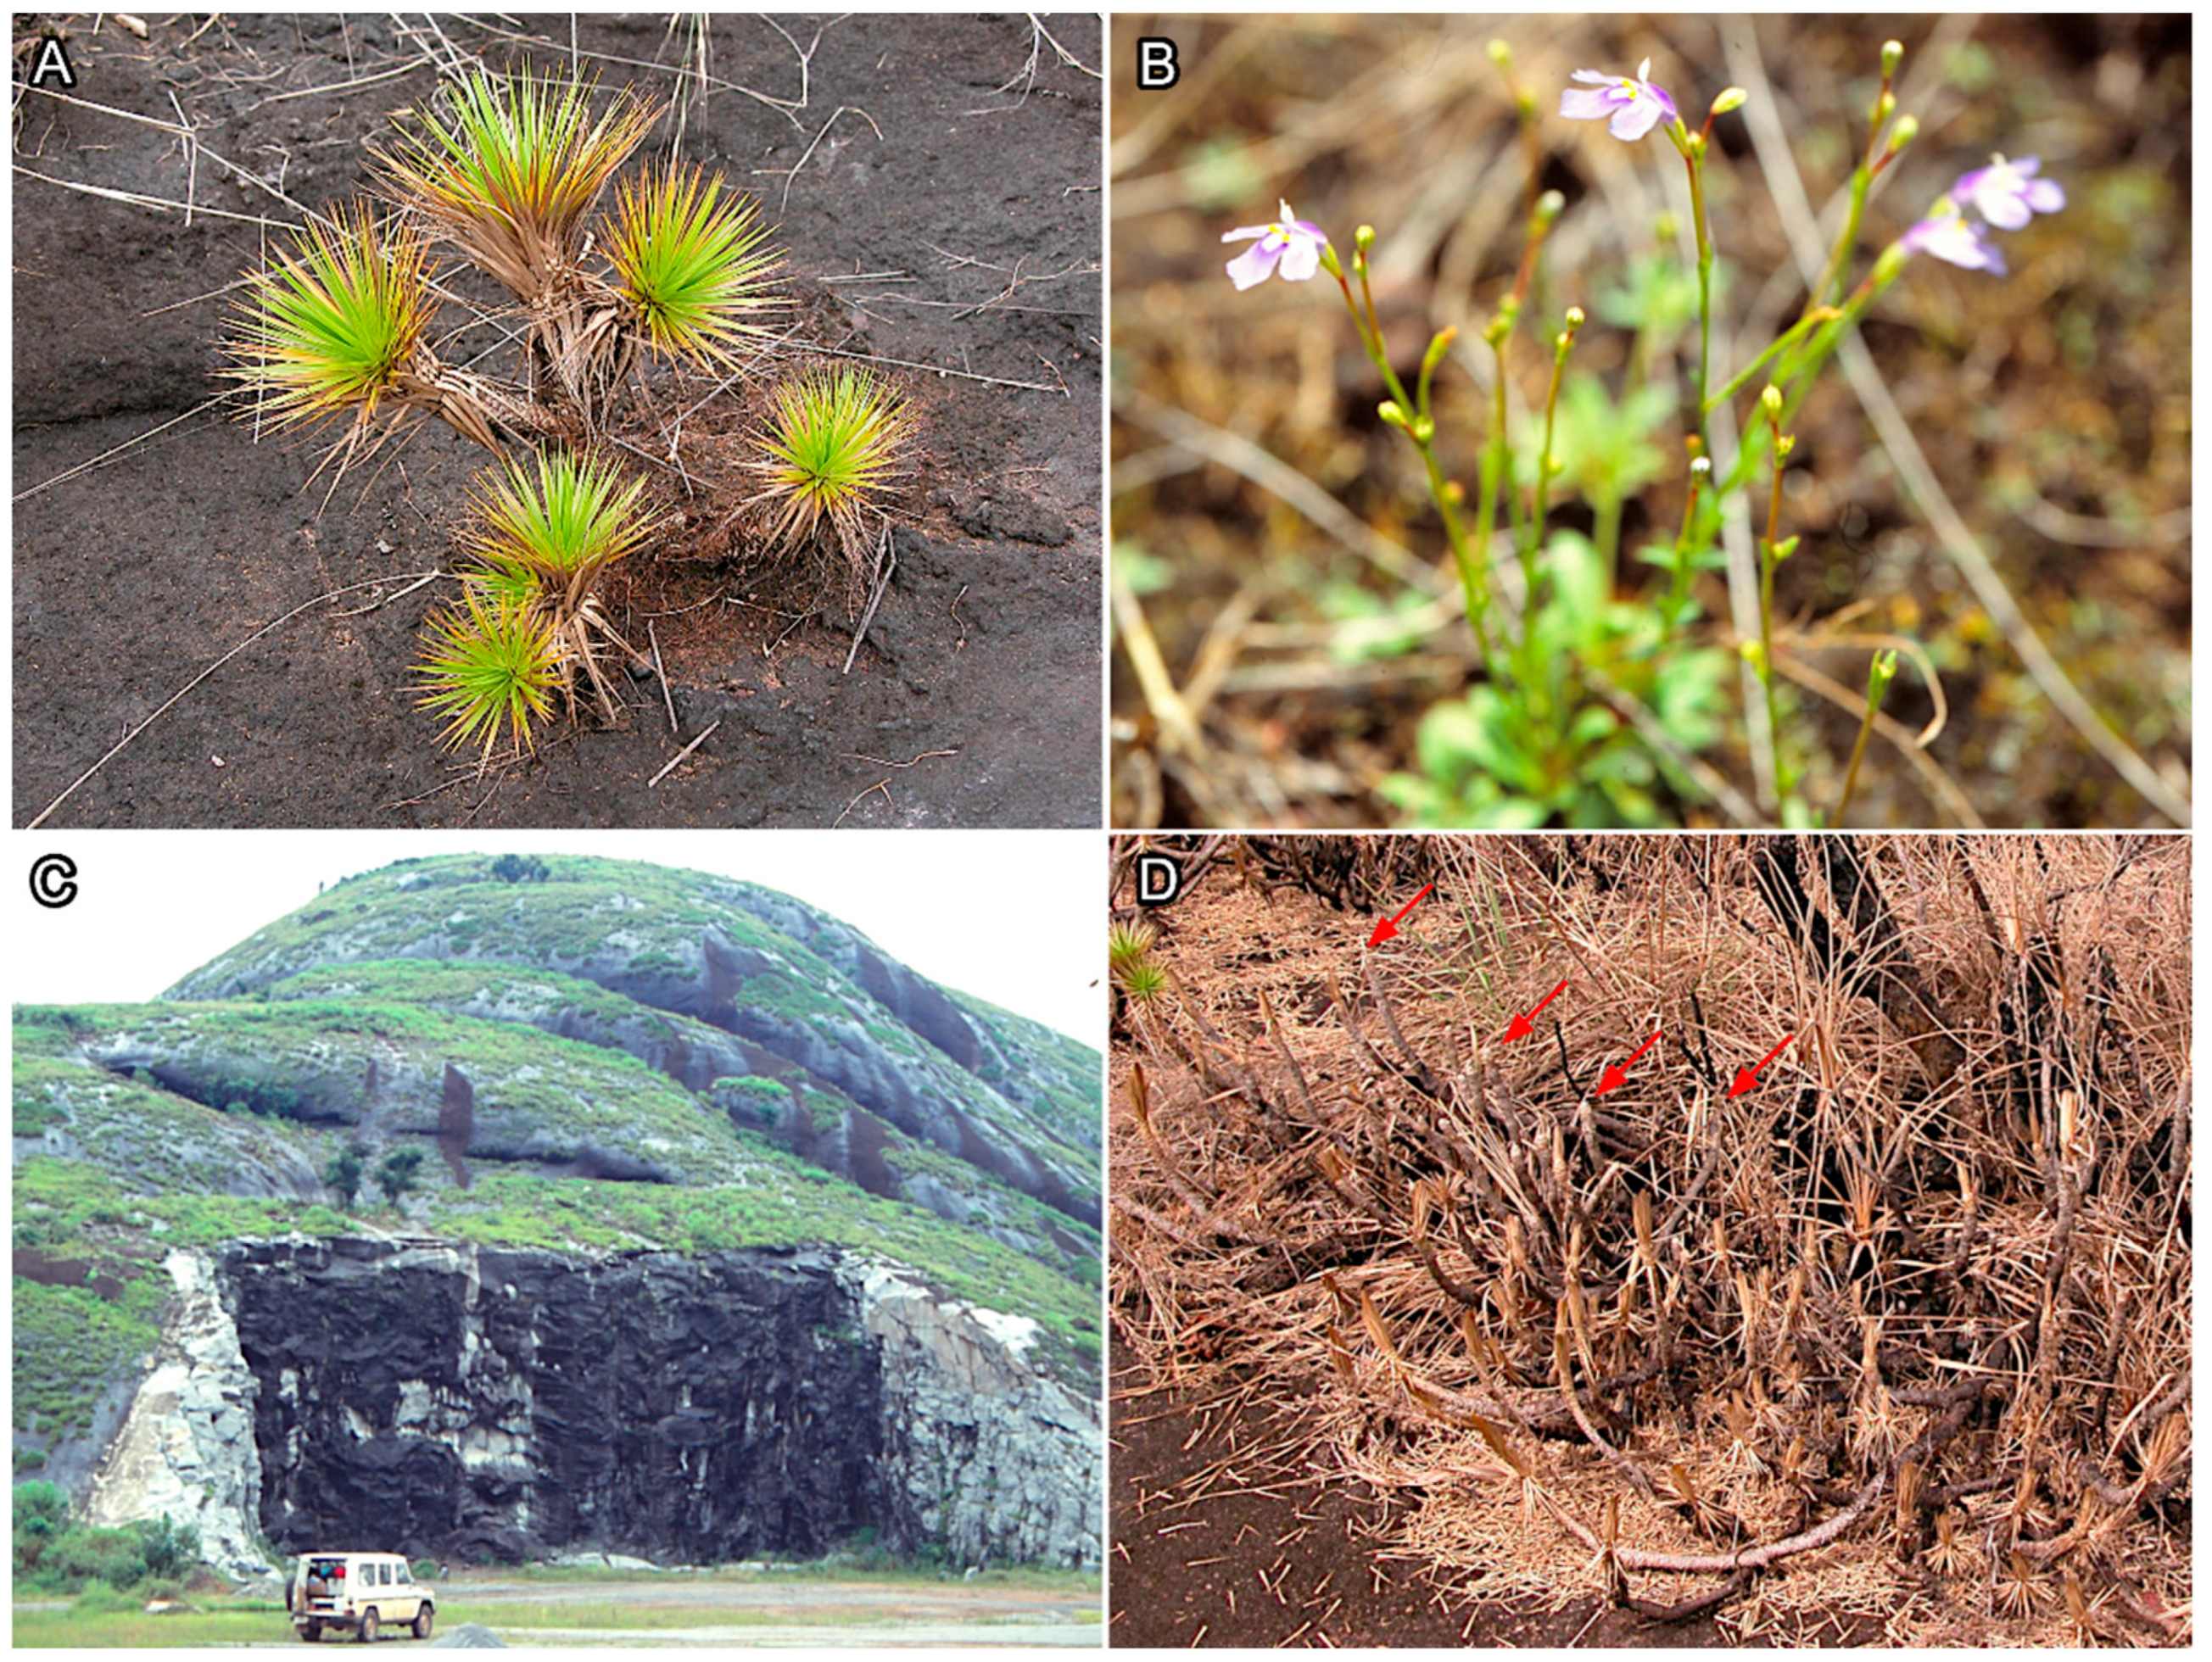
Table 1.
Checklist of desiccation-tolerant vascular plants occurring in West Africa, their distribution in West Africa, and conservation status according to IUCN Red List. BEN – Benin, BFA – Burkina Faso, CIV – Côte d'Ivoire, CMR – Cameroon, CPV – Cabo Verde, GGN – Gulf of Guinea Is., GHA – Ghana, GIN – Guinea, GMB – Gambia, GNB – Guinea-Bissau, GNQ – Equatorial Guinea, LBR – Liberia, MLI – Mali, MRT – Mauritania, NER – Niger, NGA – Nigeria, SEN – Senegal, SLE – Sierra Leone, TCD – Chad, TGO – Togo.
Table 1.
Checklist of desiccation-tolerant vascular plants occurring in West Africa, their distribution in West Africa, and conservation status according to IUCN Red List. BEN – Benin, BFA – Burkina Faso, CIV – Côte d'Ivoire, CMR – Cameroon, CPV – Cabo Verde, GGN – Gulf of Guinea Is., GHA – Ghana, GIN – Guinea, GMB – Gambia, GNB – Guinea-Bissau, GNQ – Equatorial Guinea, LBR – Liberia, MLI – Mali, MRT – Mauritania, NER – Niger, NGA – Nigeria, SEN – Senegal, SLE – Sierra Leone, TCD – Chad, TGO – Togo.
| Distribution in West Africa | IUCN Red List categories | |||
| LYCOPHYTES | ||||
| SELAGINELLACEAE | ||||
| Selaginella njamnjamensis Hieron. | BEN, CMR, MLI, NGA | Not evaluated | ||
| PTERIDOPHYTES | ||||
| ASPLENIACEAE | ||||
| Asplenium aethiopicum (Burm.f.) Becherer | CIV, CMR, GGN, GIN, GNQ, LBR, NER, NGA, SLE, TCD | Vulnerable | ||
| Asplenium friesiorum C.Chr. | CMR, GGN, NGA | Not evaluated | ||
| Asplenium megalura Hieron. | CIV, CMR, GHA, GGN, GIN, LBR, SLE, TGO | Not evaluated | ||
| Asplenium monanthes L. | CMR, GGN | Least Concern | ||
| Asplenium sandersonii Hook. | CMR, GGN, GNQ, NGA | Not evaluated | ||
| Asplenium stuhlmannii Hieron. | CIV, CMR, GIN, NGA, SLE | Not evaluated | ||
| DRYOPTERIDACEAE | ||||
| Elaphoglossum acrostichoides (Hook. & Grev.) Schelpe | CIV, CMR, GGN, GHA, GIN, LBR | Least Concern | ||
| HYMENOPHYLLACEAE | ||||
| Crepidomanes chevalieri (Christ) Ebihara & Dubuisson | CIV, CMR, GGN, GHA, GIN, LBR, NGA, SLE | Not evaluated | ||
| Crepidomanes melanotrichum (Schltdl.) J.P.Roux | CIV, CMR, GGN, GHA, GIN, LBR, NGA, SLE | Not evaluated | ||
| Didymoglossum erosum (Willd.) Beentje | CIV, CMR, GHA, GIN, LBR, NGA, SLE | Not evaluated | ||
| Hymenophyllum capillare Desv. | CMR, GGN, GHA | Not evaluated | ||
| Hymenophyllum hirsutum (L.) Sw. | CMR, GGN, GHA, GIN, GNQ, CIV, LBR | Not evaluated | ||
| Hymenophyllum kuhnii C.Chr. | CMR, GGN, GHA, GIN, GNQ, LBR, NGA, SLE | Not evaluated | ||
| Hymenophyllum splendidum Bosch | CMR, GNQ | Not evaluated | ||
| Polyphlebium borbonicum (Bosch) Ebihara & Dubuisson | CIV, CMR, GGN, GNQ, GHA, GIN, LBR | Not evaluated | ||
| POLYPODIACEAE | ||||
| Loxogramme abyssinica (Baker) M.G.Price | CIV, CMR, GGN, GHA, GIN, GNQ, LBR, NGA, SLE, TGO | Not evaluated | ||
| Melpomene flabelliformis (Poir.) A.R.Sm. & R.C.Moran | CMR, GGN | Not evaluated | ||
| Phymatosorus scolopendria (Burm.f.) Pic.Serm. | BEN, CIV, CMR, GGN, GNQ, GHA, GIN, LBR, NGA, SLE, TGO | Not evaluated | ||
| Platycerium stemaria (P.Beauv.) Desv. | BEN, CIV, CMR, GGN, GNQ, GHA, GIN, LBR, NGA, SEN, SLE | Not evaluated | ||
| Pleopeltis macrocarpa (Willd.) Kaulf. | CIV, CMR, GGN, GIN, LBR, NGA, SLE | Not evaluated | ||
| PTERIDACEAE | ||||
| Actiniopteris radiata (Sw.) Link | CMR, CPV, MLI, NGA, TCD, TGO | Not evaluated | ||
| Actiniopteris semiflabellata Pic.Serm. | MRT | Not evaluated | ||
| Adiantum incisum Forssk. | CIV, CMR, CPV, GHA, NGA, TGO | Not evaluated | ||
| Cheilanthes coriacea Decne. | NER, TCD | Not evaluated | ||
| Cheilanthes inaequalis Mett. | CMR, GIN, NGA | Not evaluated | ||
| Cosentinia vellea (Aiton) Tod. | CPV | Least Concern | ||
| Hemionitis farinosa (Forssk.) Christenh. | CMR, GGN, NGA, SLE | Not evaluated | ||
| Pellaea doniana Hook. | GNQ | Not evaluated | ||
| Vittaria guineensis Desv. | CIV, CMR, GGN, GHA, GIN, GNQ, LBR, NGA, SLE, TGO | Not evaluated | ||
| TECTARIACEAE | ||||
| Arthropteris orientalis (J.F.Gmel.) Posth. | CIV, CMR, GGN, GHA, GIN, LBR, NGA, SLE | Not evaluated | ||
| ANGIOSPERMS | ||||
| CYPERACEAE | ||||
| Afrotrilepis jaegeri J.Raynal | SLE * | Not evaluated | ||
| Afrotrilepis pilosa (Boeckeler) J.Raynal | BEN, BFA, CIV, CMR, GHA, GIN, GNQ, LBR, MLI, NGA, SEN, SLE, TGO | Not evaluated | ||
| Coleochloa abyssinica (Hochst. ex A.Rich.) Gilly | CMR, NGA | Not evaluated | ||
| Coleochloa domensis Muasya & D.A.Simpson | CMR * | Critically endangered | ||
| Microdracoides squamosa Hua | CMR, GIN, NGA, SLE * | Not evaluated | ||
| LINDERNIACEAE | ||||
| Craterostigma plantagineum Hochst. | BFA, NER, TCD | Not evaluated | ||
| Craterostigma yaundense (S.Moore) Eb.Fisch., Schäferh. & Kai Müll. | CMR * | Vulnerable | ||
| POACEAE | ||||
| Microchloa indica (L.f.) P.Beauv. | BEN, BFA, CIV, CMR, GHA, GIN, GNB, MLI, NER, NGA, SEN, SLE, TCD, TGO | Not evaluated | ||
| Microchloa kunthii Desv. | BEN, BFA, CIV, CMR, GHA, NGA, TGO | Not evaluated | ||
| Oropetium aristatum (Stapf) Pilg. | BEN, BFA, CIV, GHA, GMB, GNB, MLI, NER, SEN, TGO * | Not evaluated | ||
| Oropetium capense Stapf | MLI, MRT, NER, TCD | Not evaluated | ||
| Sporobolus festivus Hochst. ex A.Rich. | BEN, BFA, CIV, CMR, GHA, GIN, GMB, GNQ, MLI, MRT, NER, NGA, SEN, TCD, TGO | Not evaluated | ||
| Sporobolus pellucidus Hochst. | BFA, NER, TCD | Not evaluated | ||
| Sporobolus stapfianus Gand. | NER, NGA | Least Concern | ||
| Tripogon major Hook.f. | SLE | Not evaluated | ||
| Tripogon multiflorus Miré & H.Gillet | CPV, NER, TCD | Not evaluated | ||
| Tripogonella minima (A.Rich.) P.M.Peterson & Romasch. | BEN, BFA, CIV, CMR, CPV, GHA, MLI, MRT, NER, NGA, SEN, TCD, TGO | Not evaluated | ||
| VELLOZIACEAE | ||||
| Xerophyta schnitzleinia (Hochst.) Baker | NGA, GNQ | Not evaluated | ||
* endemic to West Africa
Table 2.
Comparison between non-protected and protected areas in relation to species exposure to quarrying and climate change. We conducted the Mann-Whitney U test to analyze the species exposure to quarrying and t-test to analyze species exposure to climate change. p-values for species exposure to climate change were adjusted by Bonferroni correction.
Table 2.
Comparison between non-protected and protected areas in relation to species exposure to quarrying and climate change. We conducted the Mann-Whitney U test to analyze the species exposure to quarrying and t-test to analyze species exposure to climate change. p-values for species exposure to climate change were adjusted by Bonferroni correction.
| W-value/ t-value | p-value | |||
| Quarrying | 80 | 0.0004 | ||
| Climate change | ||||
| SSP1 | ||||
| 2011-2040 | 1.17 | 0.7809 | ||
| 2041-2070 | 1.04 | 0.9456 | ||
| 2071-2100 | 1.05 | 0.9297 | ||
| SSP5 | ||||
| 2011-2040 | 1.1 | 0.8592 | ||
| 2041-2070 | 1.03 | 0.9519 | ||
| 2071-2100 | 0.93 | 1 | ||
Disclaimer/Publisher’s Note: The statements, opinions and data contained in all publications are solely those of the individual author(s) and contributor(s) and not of MDPI and/or the editor(s). MDPI and/or the editor(s) disclaim responsibility for any injury to people or property resulting from any ideas, methods, instructions or products referred to in the content. |
© 2025 by the authors. Licensee MDPI, Basel, Switzerland. This article is an open access article distributed under the terms and conditions of the Creative Commons Attribution (CC BY) license (http://creativecommons.org/licenses/by/4.0/).
Copyright: This open access article is published under a Creative Commons CC BY 4.0 license, which permit the free download, distribution, and reuse, provided that the author and preprint are cited in any reuse.